State of Green Infrastructure in the Gauteng City-Region · The Report overview on page 2 specifies...
204
State of Green Infrastructure in the Gauteng City-Region Alexis Schäffler with Natasha Christopher, Kerry Bobbins, Emmarie Otto, Mduduzi W. Nhlozi, Martin de Wit, Hugo van Zyl, Douglas Crookes, Graeme Gotz, Guy Trangoš, Chris Wray, Potsiso Phasha
Transcript of State of Green Infrastructure in the Gauteng City-Region · The Report overview on page 2 specifies...
State of Green Infrastructure in the Gauteng City-Region
Alexis Schäffler with Natasha Christopher, Kerry Bobbins, Emmarie Otto, Mduduzi W. Nhlozi, Martin de Wit, Hugo van Zyl, Douglas Crookes,
Graeme Gotz, Guy Trangoš, Chris Wray, Potsiso Phasha
July 2013
ISBN 978-0-620-57619-2
Published by the Gauteng City-Region Observatory (GCRO),
a partnership of the University of Johannesburg, the
University of the Witwatersrand, Johannesburg, and the
Gauteng Provincial Government.
Lead author: Alexis Schäffler GCRO
Artwork: Natasha Christopher Wits School of Arts
The Report overview on page 2 specifies the chapter breakdown and authorship of the following contributors:
Kerry Bobbins, GCRO
Mduduzi W. Nhlozi
Emmarie Otto
Martin de Wit, Hugo van Zyl, and Douglas J. Crookes (De Wit Sustainable Options (Pty, Ltd)
The following also contributed with assistance on editing, design and mapping:
Graeme Gotz, GCRO
Guy Trangoš, GCRO
Chris Wray, GCRO
Potsiso Phasha, GCRO
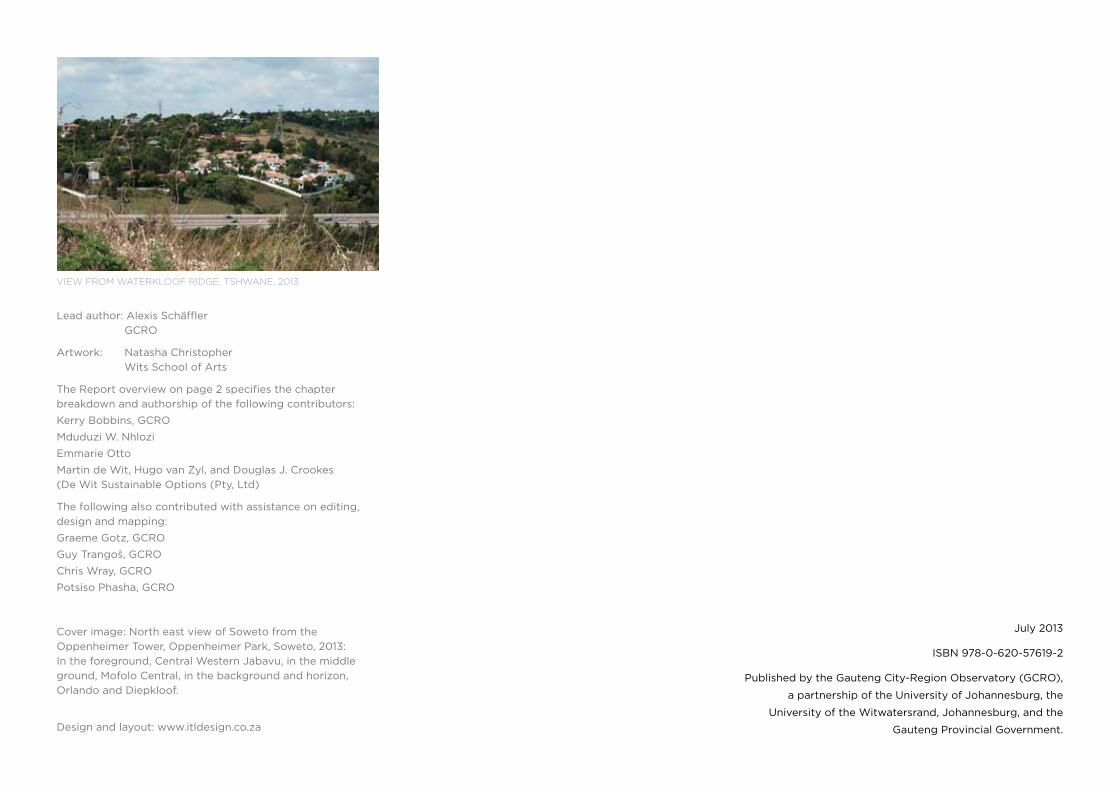
Cover image: North east view of Soweto from the Oppenheimer Tower, Oppenheimer Park, Soweto, 2013: In the foreground, Central Western Jabavu, in the middle ground, Mofolo Central, in the background and horizon, Orlando and Diepkloof.
Design and layout: www.itldesign.co.za
View from waterkloof ridge, tshwane, 2013

i
ContentsForeword 1
Report overview 2
Terminology 3
Section 1: Introduction 4
Section 2: State of green infrastructure in the gcR 20
Section 3: government plans and initiatives 56
Section 4: Valuing ecosystems services 122
Section 5: constructed landscapes 150
Section 6: conclusion: research pathways ahead 172
Annexures 184
References 191
AgAve PlAnt, emPire roAd, JohAnnesburg, 2013

ii
TablesTable 1. Resource pressures facing the gcR 8
Table 2. Number of square kilometres of each land cover class in each municipality in gauteng 27
Table 3. Relevant green space provisions and guidelines in EMM strategic processes 71
Table 4. A comparison between market, non-market and proxy market values 125
Table 5. Ecosystem goods and services and monetary valuation techniques 127
Table 6. Relationship between categories and case study values 127
Table 7. Open space values (R/ha) from cV and hedonic pricing, 2011 128
Table 8. Urban and peri-urban wetland values (R/ha/yr), South Afrca (2011 prices) 129
Table 9. Hectares per open space types in the city of Johannesburg 133
Table 10. Indicative values per hectare per year for open space types in the city of Johannesburg 136
Table 11. Indicative values per year for individual open space types in the city of Johannesburg – Medium Estimate Scenario 137
Table 12. Indicative values per year for all open space types in the city of Johannesburg across Estimate Scenarios 138
Table 13. Indicative present values for all open space types in the city of Johannesburg across Estimate Scenarios 139
Table 14. Types of accuracy and descriptions of inaccuracy type 185
CAble, JohAnnesburg, 2013.

The STaTe of Green InfraSTrucTure In The Gcr
iii
FiguresFigure 1. Location of the gcR and its municipalities 7
Figure 2. Built-up land in gauteng 9
Figure 3. Overview of green asset data errors 22
Figure 4. Landscape transformation status in gauteng 25
Figure 5. Percentage of selected land cover classes in each municipality in gauteng (source: gTI 2,5m Urban Land cover, 2012) 28
Figure 6. Natural vegetation: thicket, bush land, bush clumps, indigenous forests, shrub land, planted and natural vegetation, degraded natural vegetation 29
Figure 7. Non-natural trees in gauteng 30
Figure 8. Indigenous and non-natural trees in gauteng 30
Figure 9. Tree coverage in Bryanston, Johannesburg 31
Figure 10. Tree coverage in Alexandra, Johannesburg 31
Figure 11. Tree coverage in Atlasville, Ekurhuleni 31
Figure 12. Tree coverage in Daveyton, Ekurhuleni 31
Figure 13. Tree coverage in Waterkloof, Tshwane 31
Figure 14. Tree coverage in Mamelodi, Tshwane 31
Figure 15. Mature tree coverage captured by gTI 2,5m Urban Land cover (2012) 33
Figure 16. Mature tree coverage (gTI 2,5m Urban Land cover, 2012) with Johannesburg city Parks tree point data (JcP, 2012) 33
Figure 17. Tree planting projects versus mature trees and Johannesburg city Parks tree point data (gTI, 2,5m, 2012, and JcP, 2012) 33
Figure 18. commercial agriculture in gauteng 34
Figure 19. Overview of agricultural gardens, agricultural hubs, agricultural land and land used for livestock 34
Figure 20. green space per building including agriculture 34
Figure 21. Recreational green space across gauteng 35
Figure 22. golf course, Ekurhuleni (cSIR Spot 5 Imagery, 2010) 36
Figure 23. School grounds, Westonaria (cSIR Spot 5 Imagery, 2010) 36
Figure 24. School grounds and sports facilities, Soweto (cSIR Spot 5 imagery, 2010) 36
Figure 25. Protected areas in gauteng 37
Figure 26. Hydrological networks in gauteng 38
Figure 27. Wards above or below 2ha parks per 1000 individuals 40
Figure 28. Wards above or below 4ha parks per 1000 individuals 41
Figure 29. Population in all SALs within a 750m buffer of parks 41
Figure 30. Population in all SALs within and outside 750m buffer of parks 41
Figure 31. Aerial image of Houghton (cSIR Spot 5 Imagery, 2010) 42
Figure 32. Aerial image of Soweto (cSIR Spot 5 Imagery, 2010) 42
Figure 33. Private green space in gated communities 43
Figure 34. green passages including the Braamfontein Spruit, Johannesburg 45
Figure 35. Orange Farm, Johannesburg 45
Figure 36. Hammanskraal, Tshwane 45
Figure 37. Natural and planted vegetation 46
Figure 38. Agricultural land 46
Figure 39. Recreational green spaces 46
Figure 40. Protected areas 47
Figure 41. Hydrological networks 47
Figure 42. The gcR as a multi-layered green infrastructure network 47
Figure 43. Overview of land cover classes in Johannesburg 60
Figure 44. Administrative regions in the city of Johannesburg 132
Figure 45. Differences in municipal park classification 184
iv
SECTION 1 Green infrastructure: introduction and conceptual underpinnings
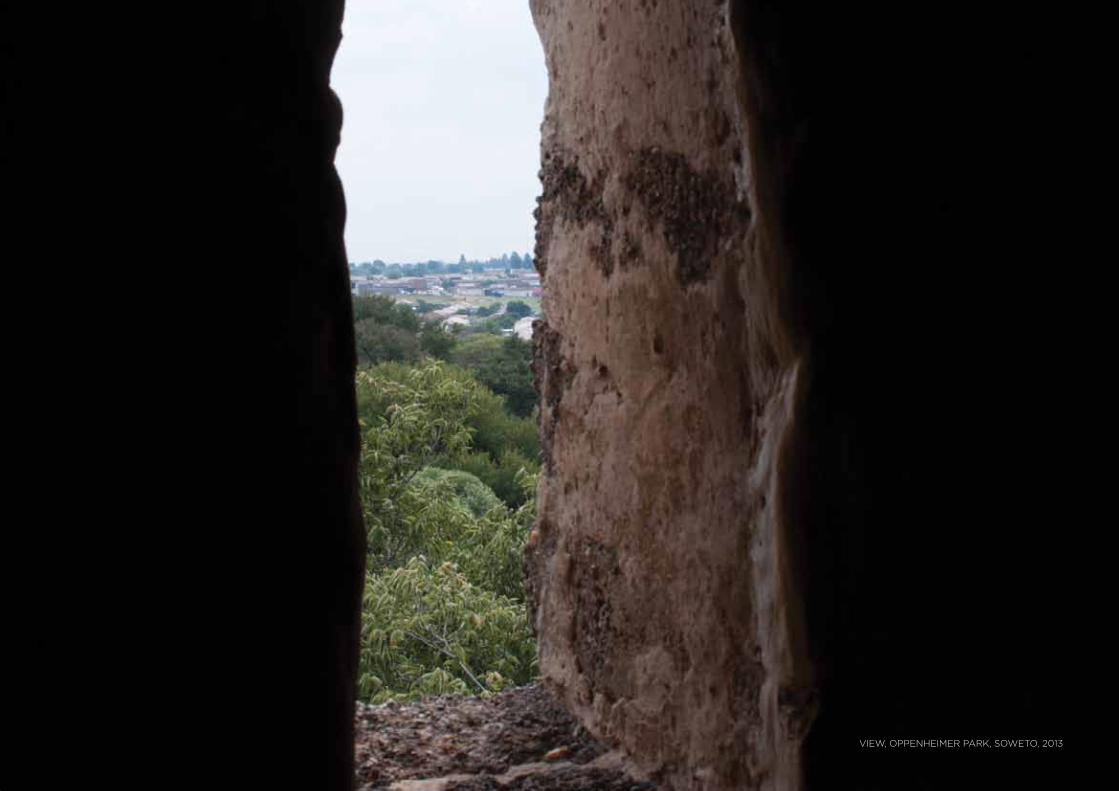
view, oPPenheimer PArk, soweto, 2013

The STaTe of Green InfraSTrucTure In The Gcr
1
The State of green Infrastructure in the gauteng city-Region
(gcR) is a rich, visually powerful output that offers a unique
insight into how our city-region is served by various layers of
green infrastructure. This is the first study into how various
green assets come together to form a network that provides
crucial ecosystem services, in the same way as our roads,
water pipes, electricity cables and storm water drainage lines
provide us with ‘basic’ services.
The capacity of our infrastructure to cater for a rapidly
growing population and economy is a critical challenge for
the gauteng city-Region. Meeting the expanding demand for
urban services in a context of resource constraints will prove
difficult, especially in the context of historically inequitable,
dysfunctional and sprawling urban settlement patterns. Ever
larger volumes of domestic and industrial waste, and growing
air, water and land pollution, exacerbate the challenge.
Facing up to these pressures, the gauteng Provincial
government (gPg) has embarked on a number of strategic
processes, notably the gauteng 2055 process – a long-term
development vision and plan – as well as a gauteng Integrated
Infrastructure Master Plan and various further policy
developments to implement the gauteng Spatial Development
Framework. In this planning the gPg is engaging closely with
new ideas for how to build and maintain infrastructure in a way
that satisfies the multiple objectives of meeting the needs of
our people, especially those without access to services and
urban amenities, managing natural resources more efficiently,
and reshaping settlements, all within a context of ever present
financial constraints.
Within this context, The State of green Infrastructure in
the gauteng city-Region is both timeous and illuminating,
helping to open up a field of new ideas that can be considered
in both our long-range strategies, and the short to medium
plans that will flow from this in the near future. When we think
about infrastructure we are used to thinking about ‘big pipes,
big culverts, big roads’. This report decisively challenges this
common perception of what infrastructure is and should be.
It carves out a new conceptual and policy space, helping to
show exactly how green assets such as urban trees, parks,
wetlands, natural grasslands, and the like, can be – indeed
must be! – thought about and planned for as infrastructure. It
does this in a number of creative ways.
First, it provides a methodologically rigorous presentation
and analysis of available spatial data on various dimensions
of gauteng’s diverse green infrastructure networks. Second,
through detailed primary research in each of gauteng’s
municipalities it interrogates how green infrastructure is
being understood, planned for, developed and managed, in
the process showing how we have made significant progress
as a province, but also where there are areas for improvement
in policy and practice. Third, it gives us a glimpse into how
green infrastructure can be better appreciated in government
finance and management systems through a review of
available green infrastructure valuation techniques, as well as
an indicative valuation exercise taking one municipality’s parks
as a case study. Fourth, it presents an intriguing analysis of
how citizen’s private investments have been a very significant
force behind the extension of green infrastructure in the
province, and how the kind of green landscapes we have,
and might have in future, are very much shaped by cultural
preferences and trends. Lastly, its photographic elements
provide a visually powerful narrative of the many different
kinds of green infrastructure we have in the gcR. The images
eloquently capture how our local landscapes and vegetation,
which we so often take for granted in our everyday comings
and goings around the city-region, are an integral part of our
urban form and fabric.
Our shared goal of developing an equitable, efficient
and sustainable city-region is greatly advanced by the
conceptual and analytical benchmark set by this State of
green Infrastructure in the gauteng city-Region. The report
certainly helps meet our need in government for high quality
and policy-relevant data and analysis, and we trust that it
will prove to be a resource equally useful and stimulating to
business, civil society, communities and the ordinary citizens
who ultimately benefit from the services provided by green
infrastructure.
ForewordRashid SeedatheAd, gAuteng PlAnning Commission
offiCe of the Premier, gAuteng ProvinCiAl government

2
Report overviewThis report contains a number of sections written by various
authors, outlined below.
Green infrastructure: introduction and conceptual underpinnings (Alexis schäffler)The section provides an introduction to the core arguments of the report, and an overview of the concept of green infrastructure as a framework for rethinking infrastructure from an ecosystem services perspective. Through this framework ecological assets can be conceived as an augmentation, or even alternative, to built infrastructure systems. The section highlights the defining features of green infrastructure in terms of the opportunities provided by naturally occurring and manmade ecological systems, that are at once under threat from urban expansion and also undervalued in conventional infrastructure planning. An overview of previous greening paradigms indicates that while ecological investments in urban contexts are not a new phenomenon, there is something unique about viewing and valuing green infrastructure – the interconnected set of natural and constructed ecological systems, green spaces and landscape features – as a network providing services and strategic functions in the same way as traditional ‘hard’ infrastructure.
Assessing the state of green infrastructure in the Gauteng City-Region (Alexis schäffler and kerry bobbins)The ‘current state of green infrastructure’ identifies the green assets and networks that exist in the gauteng city-Region (gcR) and assesses the state of digital spatial data publicly available to analyse them. The chapter then provides baseline spatial information on the various components of green infrastructure found in the gcR, examining their extent and coverage, access and connectivity.
Current government plans, visions and capabilities for green infrastructure (mduduzi w. nhlozi, emmarie otto, Alexis schäffler)This section provides a systematic review of how green infrastructure is being thought about, planned for and implemented in municipalities across the gcR. Mduduzi W. Nhlozi investigates initiatives in various departments and municipal entities in the city of Johannesburg Metropolitan Municipality. Emmarie Otto analyses the Ekurhuleni Metropolitan Municipality (EMM), the city of Tshwane Metropolitan Municipality (coT), and the Sedibeng District Municipality (SDM), as well as its three local municipalities, Emfuleni, Lesedi and Midvaal. Alexis Schäffler focuses on the West Rand District Municipality and its four locals, Mogale city, Randfontein, Westonaria and Merafong. Each case study assesses how green infrastructure is perceived and valued within the institutional arrangements responsible for it in various ways, and interrogates the policies, programmes and initiatives that are being designed and implemented. The focus is on how government structures and individual officials are interacting with green assets in their planning and management processes, and the resulting opportunities for and blockage points to prioritizing these assets in an infrastructural sense.
Techniques for valuing green infrastructure(martin de wit, hugo van Zyl, and douglas J. Crookes)This is a methodological investigation into ecosystem service valuation techniques that could be applied in the gcR context. A range of potential valuation methods for urban ecosystems and green infrastructure features are profiled. After classifying and comparing the options for valuing relevant ecosystem services, the chapter indicatively demonstrates one methodology for valuing public green spaces in the city of Johannesburg (coJ). The chapter also considers options for, and limitations to, incorporating green infrastructure valuations into the financial architectures of local government, highlighting the importance of a fine grained understanding of public revenue, expenditure and accounting systems.
Constructed landscapes: community and private sector green infrastructure initiatives(Alexis schäffler)This section presents a more academic reflection on how society invests in landscapes in different parts of the gauteng city-Region (gcR). Whereas previous chapters focus on government’s plans and activities, this section analyses the role of non-government actors, such as local communities and the private sector, in creating green assets. Through a political-ecology lens, it provides an historical overview of the city-region’s colonial landscapes, and then reflects on the various economies and cultures currently at work to sustain or transform features of this landscape. In tracing the circuits of investment in green infrastructure, and the cultures behind them, its shows how private garden space emerges as an object of value and importance, but also a highly ambivalent ecological form, with a mixture of introduced and indigenous vegetation, simultaneously existing as natural and unnatural.
Research pathways ahead (Alexis schäffler)This concluding chapter briefly summarises some of the key findings and implications of this report, and looks ahead to map out broad areas of future research that will be pursued by gcRO in the years to come.
Visualizing green landscapes (natasha Christopher)This report is interwoven with six photographic essays by Natasha christopher, documenting various facets of the green landscapes of the city-region.

The STaTe of Green InfraSTrucTure In The Gcr
3
TerminologyInfrastructure is the network of systems that conveys resources
to communities, households and businesses, connecting them
across the city, and allowing for everyday life to function.
Green infrastructure in this report refers to the interconnected
set of natural and man-made ecological systems, green spaces
and other landscape features. It includes planted and indigenous
trees, wetlands, parks, green open spaces and original grassland
and woodlands, as well as possible building and street-level
design interventions that incorporate vegetation, such as green
roofs. Together these assets form an infrastructure network
providing services and strategic functions in the same way as
traditional ‘hard’ infrastructure.
Green space and open space are often used interchangeably.
This report is primarily concerned with green space as an
ecological asset. However a confusion emerges because open
spaces can be ‘grey’ landscapes sealed with impermeable ‘hard’
surfaces, such as concrete or tarmac, while green space evokes
ideas of permeable ‘soft’ surfaces such as soil, grass, shrubs,
trees and water (James et al, 2009). At issue are the various
references in official policies and databases to open space in
a way that includes developed and undeveloped green space.
The ambiguity creates a number of difficulties in deciphering
the component parts of green infrastructure networks.
Ecosystem services are the benefits to society provided by
ecosystems or ecological assets.
Hubs are green assets of varying size that overlap to anchor
green infrastructure linkages in the landscape.
Corridors or linkages tie green assets together, allowing for
connectivity between hubs and other features of the landscape.
This affords pathways for species movement and lays a basis
for cumulative effects in the ecosystem services provided by
otherwise isolated or segmented green assets.
Multi-functionality refers to the various functions performed by
ecological assets, in contrast to traditional ‘grey’ infrastructure,
component parts of which are traditionally geared for one purpose.
CAble, CAble, JohAnnesburg, 2013

4
SECTION 1 Green infrastructure: introduction and conceptual underpinnings
SECTION ONEThe section provides an introduction to the core arguments of the report, and an overview of the concept of green infrastructure as a framework for rethinking infrastructure from an ecosystem services perspective.

The STaTe of Green InfraSTrucTure In The Gcr
5
IntroductionThis State of green Infrastructure report is both an assessment of the set of natural and manmade landscape features in the
gauteng city-Region (gcR) and an interrogation into how the services provided by these assets are perceived, understood and
valued. Inspiration is drawn from the conceptual and planning framework of ‘green infrastructure’, through which ecological
systems, green spaces and other landscape features are regarded as providing services to society in the same way as those
offered by traditional ‘hard’ infrastructure.
The analysis of how green infrastructure serves our society, contained in this report, focuses on both naturally occurring and
deliberately planted vegetation within the gauteng provincial boundary and its surrounding urban nodes, which together
constitute the gcR. This city-region is a highly transformed landscape. Although it still contains original savannah grassland and
bushveld, it is also now patterned with many constructed green environments, most notably extensive non-indigenous urban
forests, large public parks and innumerable landscaped private gardens. This mix is controversial due to the location of the gcR
in a watershed context with no major water body. However, the combination of naturally occurring and manmade landscapes is
valuable in a region facing worryingly high levels of dirty air, heat island effects, intense storms, polluted and even toxic water
systems, and shortages of land for food production, and where people increasingly spend their lives in closed and artificially
regulated building environments.
This is not a state of the environment report focusing on the issues of ‘conservation’ of ‘nature’. Rather it is designed to
extend our understanding of what we define as ‘infrastructure’ and thereby open a critical engagement with the relationship
between conventional service networks and vegetated dimensions of the urban landscape. Our core argument is that we need
a fundamental shift in the way we understand ecological assets within our development paradigm. Trees, public parks, food
and community gardens, wetlands and ridges need to be viewed as equivalent to conventional ‘hard’ or ‘grey’ infrastructure
such as electricity lines, water pipes and drainage networks that allow for the everyday functioning of our settlements, society
and economy. The premise of this report is that by better understanding the patterns of green infrastructure imprinted on our
landscapes we can provide a starting point for conceptualising these assets as alternative infrastructures and lay a foundation
for further work to more effectively value the services they provide. This necessitates deepening what we know about the
spatial location, extent and variety of green infrastructure features, about how these are variously accessed and experienced,
view from linksfield ridge, 2013

6
SECTION 1 Green infrastructure: introduction and conceptual underpinnings
view south of brAAmfontein, 2012
and crucially about their role and functioning and how this
is currently being (and may potentially be) recognised in
service-delivery planning and investment.
To achieve the above, this State of green Infrastructure
report presents a unique visual overview of the form and
extent of green infrastructure in the gcR. A series of spatial
representations, drawing on all available digital spatial data,
identifies relevant green infrastructure features, their extent
and how they connect and interact with each other and the
wider urban environment. This is coupled with photographic
accounts of a landscape that is natural and unnatural at
the same time, a construction of human investments that,
over time, have created a unique crossbreed of original
and designed green assets and spaces. The photographic
interpretations in this report are not an aesthetic backdrop to
the institutional and technical analyses. They are an integral
part of the analytical process of deciphering the extent of
public, private and community-driven investment in green
infrastructure, and in turn making a case for more dedicated
efforts to value the functions provided by this infrastructure in
a context of natural resource pressures, service delivery deficits
and infrastructure finance and management challenges.

Situating the Gauteng City-Region (GCR)Accounting for 34% of South Africa’s gDP and 11% of Africa’s
gDP, the gcR makes the largest contribution of gross Value
Added (gVA) nationally and is estimated to be the largest
urban economy on the continent (OEcD, 2011). The region
is a magnet for those seeking better livelihoods. gauteng’s
population grew at an average annual rate of 2.7% between
2001 and 2011, outstripping the national average of 1.5%.
52% of this growth was attributable to in-migration with
the remainder due to natural births (StatsSA, 2013). The
allure of gauteng is due to its relative success in creating
work, in delivering basic services such as water, housing and
sanitation – with access levels being much higher than the rest
of the country – and in providing greater proximity to urban
amenities as well as generally better standards of living (gcRO
2011). The province’s average annual population change of
over 2% is likely to be sustained into the future. Projecting
forward at the current annual average growth rates, gauteng
may have 16 million people by 2025 and 20 million by 2050.
This means that current population density is likely to grow
from 672 persons per km2 to 859 per km2 by 2020, a density
on par with current Los Angeles and New York (gcRO, 2012).
This study is conducted in relation to a particular site, the
gauteng city-Region (gcR), the polycentric region of towns
and cities in and around South Africa’s gauteng province.
gauteng covers an area of 18 179km2 in central north-east
South Africa and, with some 12.3 million people, is the
country’s smallest and most densely populated province.
This is a sprawling region of geographically distinct cities
and towns, including the prominent cities of Johannesburg
and Pretoria, as well as other significant urban centres. Many
urban centres are contained within the provincial boundary;
whilst others are found outside the gauteng administrative
space, yet remain intimately connected to form a functional
city-region. The wider gauteng city-Region (gcR) is home
to some 13 million people, which is over a quarter of South
Africa’s population, housed within a 175km radius of central
Johannesburg.
The report moves from the premise that the gcR is not just a
set of urban settlements in and around a formal administrative
boundary. It also needs to be conceived as a spectrum of
flows and interactions that constitute the region both as a
multi-dimensional ‘territory’ and a ‘political project’.
Box 1This map shows the location of gauteng province, and
the municipalities into which it is divided. The gauteng
city-Region (gcR) as an administrative reality does
not formally exist. It is a conceptual interpretation of
the series of flows and interactions within the cluster of
cities, towns and urban nodes that together make up
the economic heartland of South Africa.
figure 1. location of the gCr and its municipalities
the stAte of green infrAstruCture in the gCr
7

8
SECTION 1 Green infrastructure: introduction and conceptual underpinnings
2001 2011 Average annual growth
2001-2011
Population (number) 9 388 855 12 272 263 2,71%
liquid fuels (tons) 15 922 862 21 196 280 2,90%
electricity provided by eskom (gwh) 52 007 61 256 1,65%
waste (tons) in tshwane 1 992 248 3 573 246 6,02%
water (ml/day) in Johannesburg 1 107 1 350 2,01%
table 1. resource pressures facing the gCr
While population growth of 2% is not unmanageable, it is the growth in households that gives a more accurate perspective
on the challenges facing gauteng, namely how to provide shelter and household infrastructure to those currently without, in
a context of mounting resource constraints (gcRO, 2012). In general, the number of households in large cities tends to grow
faster than the size of the population. According to the last census, gauteng had some 3,9 million households in 2011. It saw
a growth of almost 1,2 million households between 2001 and 2011 at an average annual growth rate of 3,6 %. In 2001, gauteng
had 24,4% of the total households nationally and by 2011 this had grown to 27,1%, more than the province’s share of the national
population. This means that at current growth rates, gauteng will have some 5,4 million households by 2020, representing a
doubling of household numbers over the two decades from 2001.

As government provides more formal shelter to those
currently living informally, extends water, power and waste
networks to cover households currently not connected,
and stretches the urban fabric to accommodate a larger
population and an expanding economy, there will inevitably
be upward pressure on the total quantity of resources used
in the city and region, as well as the total waste and pollution
generated (see Table 1).
A further and related challenge is the blanketing of natural
land with the impervious surfaces associated with housing,
roads and other built infrastructure. This has created a
situation where a significant portion of gauteng is in effect
‘constructed’. The urban extent of gauteng is reflected in
Figure 2, which shows urban land cover derived from 2009 10
meter resolution satellite imagery supplied by geoTerraImage
(gTI). The map depicts the built environment, which continues
to expand through sprawl on the edge of the established parts
of the city-region, and along transport corridors between
them. This peripheral and ribbon based sprawl raises the
question of whether government and private sector housing
provision is geared for the type of settlement development
needed to accommodate a growing population, especially
in light of the fact that economic, residential and transport
activity is already highly resource – and land – intensive. This
question is further complicated by the nature of the solutions
proposed to deal with a sprawling city-region. There has
been significant recent government advocacy for density.
The gauteng Spatial Development Framework (gSDF) (2011),
for example, takes a policy position for densifying townships
and suburbs through advancing compaction, residential
densification, in-fill development and the restriction of sprawl
(gPg, 2011).
The policy preference for density, through the ‘compact
city argument’, is motivated to achieve sustainability.
However, while there is also support for developing green
space systems (gPg, 2011), there is a tension between the
sustainability gains of increased density and the sustainability
imperative of maintaining green areas when it is these spaces
that are exploited to increase density, fragmenting currently
intact habitat (Uggla, 2012). Already the gcR has seen
some investment in high-density developments, which have
effectively made incisions into the green areas that previously
filtered through the urban fabric. As Uggla (2012) elaborates,
the utilisation of available open space is often depicted in urban
planning as a necessary precondition for achieving higher
density, and justified in terms of the promised compensation
of higher quality parks. While this negotiation may reimburse
a region the social value of recreating in a park, the danger is
the ecological compromise of appropriating the corridors and
hubs that hold together green networks. Byrne & Sipe (2010)
reflect on what they term the paradox of urban consolidation,
which is that it may actually stimulate leisure-based travel,
as urban dwellers seek to escape to the countryside or other
places for leisure and recreational experiences.
soweto PAnorAmA, looking north, JohAnnesburg, 2013
left: Zondi And ikweZi stAtion (obsCured)
Centre: mofolo And CentrAl western JAbAvu
right: CentrAl western JAbAvu And molAPo
the stAte of green infrAstruCture in the gCr
9
built-up areas in gauteng
figure 2. built-up land in gauteng

10
SECTION 1 Green infrastructure: introduction and conceptual underpinnings
The density paradox is made more difficult through the emergence of large residential housing estates around the city-
region, especially where green guidelines are incorporated into ‘eco-estates’ and other lifestyle developments. Many of these
developments include ecological buffer zones as well as in-built green infrastructure, which may otherwise have been blanketed
over. They also dedicate considerable funding to the upkeep and maintenance of green areas. Yet the issue is of course that
these private developments serve only a select group of individuals whose lifestyles are largely the antitheses of inclusive
development.
view from wAterkloof ridge, tshwAne, 2013

The STaTe of Green InfraSTrucTure In The Gcr
11
Green infrastructure: conceptual underpinningsgreen infrastructure has emerged as a way of understanding
natural and man-made ecological features as components
of the infrastructural fabric that supports and sustains
society. Yet the idea of establishing more strategic ecological
connections in planning is not entirely new. Frederick Law
Olmstead’s ‘parkways’ concept in the late 19th century
led to parkway plans that connected parks in major cities
of the United States, such as Boston and chicago, and the
Parisian boulevard-style developments (Hosgor & Yigiter,
2011). In early 20th century Britain, Ebenzer Howard’s garden
city movement initiated a global movement of ‘garden
cities’ – highly planned, self-contained and self-sufficient
communities – surrounded by greenbelts, in-turn connected
into a regional network (Asabere, 2012; Batchelor, 1969).
These early visions laid foundations for principles of green
space organization and planning, such as those widely
adopted in landscape architecture and planning (Jim & chen,
2003). For instance, the greenways movement of the 1990s
saw a surge of multifunctional greenway planning where
networks of land were planned, designed and managed for
multiple purposes including ecological, recreational, cultural,
aesthetic or educational (Kullman, 2012; Ahern in Hosgor et al,
2011). Such trends had a major influence on the orientation of
current green infrastructure ideas, particularly in terms of the
principle of connecting different ‘green’ assets, such as trees,
watercourses, parks, open spaces and agricultural features,
into a network (Lockhart, 2009).
While the idea of green infrastructure may seem conceptually
akin to earlier paradigms of green space planning and design,
the current strategic drive for green infrastructure enters
into a broader domain. This was the core message of the
seminal report by Benedict & McMahon, green Infrastructure:
Smart conservation for the 21st century, which calls for a
shift beyond conventional environmental protection and
conservation, to a redefinition of green assets and ecological
systems as part of the infrastructure that serves society. This
movement away from viewing green assets as luxury items
or ‘nice-to-haves’, represents a conceptual break from prior
green space frameworks and, crucially, bridges the historical
separation between ecological investments and mainline
infrastructure planning.
The concept green infrastructure therefore represents a
new perspective on how we attach values to green assets
as infrastructure. While lineages of conservation planning
laid important foundations in this regard, the progression to
viewing green landscape features and ecological systems as a
network of infrastructure utilities, on par with bulk water and
sanitation networks, electricity distribution lines and roads,
represents a break from purist notions of environmental
protectionism, from narrow aesthetic connotations to nature,
as well as from pure traditions of environmental justice.
As argued by Thomas & Littlewood (2010), the conscious
analogy with hard infrastructure implies something essential
for city development, more so than concepts of amenity,
and distinguishes green infrastructure from other and earlier
notions of green belts and green corridors. The specificity of
green infrastructure as a conceptual approach can be found in
a number of characteristics qualitatively different from green
space or conservation principles applied elsewhere. These
characteristics are described below.
Multi-functionalityThe defining contribution of planning for green infrastructure
is to achieve multi-functionality. In contrast to many grey
utilities, which are typically geared towards a single use or
purpose, natural systems perform a range of functions to
society, and with a remarkable degree of fluidity. The mono-
functional design of conventional infrastructure means that
utility networks also usually remain dormant unless their
specific service is required, in-turn implying that they draw on
vast resources to perform a single function (Egyedi & Spirco,
2011, Belanger, 2009). Ecological systems, on the other hand,
“Green infrastructure is defined as an interconnected network of green space that conserves natural ecosystem values and functions and provides associated benefits to human populations. In our view, green infrastructure is the ecological framework needed for environmental, social and economic sustainability — in short it is our nation’s natural life sustaining system. Green infrastructure differs from conventional approaches to open space planning because it looks at conservation values and actions in concert with land development, growth management and built infrastructure planning. Other conservation approaches typically are undertaken in isolation from — or even in opposition to — development.”
Benedict & McMahon (2002) in green Infrastructure: Smart conservation for the 21st century
view of sAndton, 2013

12
SECTION 1 Green infrastructure: introduction and conceptual underpinnings
are naturally multi-functional, simultaneously providing a suite
of services including flood alleviation, cooling of heat islands,
carbon capture, water filtration, local food production and
the provision of spaces for people and nature to reconnect
– functions otherwise known as ecosystem services (Mell
& Roe, 2010). By way of example a park can serve as both
recreational and storm water infrastructure if designed to
harness sustainable design principles (Sustainable cities
Institute, 2012).
From a strategic planning perspective, green infrastructure
can therefore meet multiple municipal goals. In contrast to
provision arrangements for water, waste, storm water and
energy, usually segregated into disparate departments, green
infrastructure invites a strategic approach between different
planning functions. This multi-jurisdictional approach calls for
connections between land use and ecosystem management
functions, and in-turn, the coordination of these functions
with the planning of roads, sewer, water and electricity lines
and other essential grey infrastructure (Benedict et al, 2002).
In essence, therefore, green infrastructure is a shift to making
investments that provide multiple functions and to valuing
these in terms of their ability to simultaneously achieve and
integrate ecological, infrastructural and broader development
goals. In turn, the multiple services provided by ecological
assets can assist government in rethinking how to address
critical infrastructure backlogs in development pressure
points, especially in tight fiscal circumstances where it simply
would not be feasible to build overlapping ‘hard’ infrastructure
networks for various services.
While this reconsideration first involves internalizing the
multifunctional services provided by one ecological asset –
such as a tree simultaneously functioning to sequester carbon,
intercept and regulate storm water and remediate toxic soil
and air – it is equally about the interactions between different
ecological assets, and how these in turn interact with grey
infrastructure. It is both the functioning of different ecological
features as part of a living network and the way this network
interfaces with the built environment that is important. A key
characteristic of green infrastructure is therefore that it starts
from the premise that ‘green’ and ‘grey’ should not be viewed
as separate and competing, even when their relative costs
and benefits are compared in planning processes. Rather, it
is far more useful to consider how grey infrastructure and
ecological systems interface to sustain our communities. This
involves recognising that the built and natural environments
do already co-exist in many settings, and then calculating
how networks of biophysical systems could be purposefully
placed to thread through our urban fabric.
Ecosystem servicesThe premise of green infrastructure planning is that
ecosystem services, if valued as equivalent to the services
of conventional infrastructure, and systematically planned
for as such, can assist society in its everyday functioning,
particularly in the face of intersecting climatic, ecological
and infrastructural challenges. Ecosystem services are
the benefits supplied to humans from nature. They are the
naturally occurring functions of ecological processes, ranging
from air purification, water flow regulation, reducing erosion
and disaster risks associated with environmental change,
the provision of green space for growing food and in which
people can relax, as well as the provision of habitats and
ecosystems that supporting biodiversity. Echoing Norgarrd
(2010: 121), the notion ‘ecosystem services’ is a metaphor
that helps elevate the importance of biophysical systems
in planning and decision-making priorities and awaken
society to think more strategically about nature. currently,
even where development challenges are considered vis-
à-vis environmental stresses, there is a tendency to think
about green assets only in terms of the aesthetics of human
settlements, or in terms of environmental justice concerns.
Ecosystems are not recognised as infrastructure systems in
their own right. As de Wit et al (2012) reflect:

The STaTe of Green InfraSTrucTure In The Gcr
13
The notion of ecosystem services has stimulated a series of experiments with ecosystem valuation techniques. Nuanced
quantification of the extent, form and quality of green assets, and the value of each in terms of their infrastructure functionality,
is critical if policy-makers are to conclude, with a reasonable degree of confidence, which vegetated forms should receive
targeted fiscal support. However, translating quantifications of ecosystem services value into government budgeting and
accounting systems confronts challenges in the fiscal architectures behind infrastructure planning. For instance, the delivery
of basic services, particularly in larger municipalities, is tied to fiscal architectures predisposed to the consumption of more
resources such as energy or water (which municipalities buy in bulk and resell), the sale of more motor fuel (on which a levy
is raised), and the continued growth of homes, offices and factories (on which property tax can be charged). coupled with a
structural inclination to spend large capital budgets, for example on extensive storm water systems, there is little fiscal incentive
for infrastructural innovations that explicitly link the functions of ecological assets to the provision of basic services. Hence,
in spite of an active and growing dialogue around the role of ecosystem services in urban lives and economies, and various
advances in measuring these functions (Pittock, cork & Maynard, 2010), the public sector has been slow to incorporate the
benefits of ecological assets into decision-making processes (chan et al, 2006).
Infrastructure that appreciates over timeValuing the infrastructural benefits of ecosystem services brings a new perspective on the standard set of exigencies that drive
public infrastructure valuation. In standard South African municipal accounting practice, time-based depreciation rates are
traditionally applied to fixed infrastructure assets (SPAID, 2010). However, by definition as living elements, biophysical systems
provide for value that appreciates as the stock, quality, overall health and service productivity of green assets grows over time.
There is no way of formally valuing this appreciation of ecological assets in financial systems based fundamentally on the idea of
depreciating infrastructure value. Bridging the disjuncture between valuing traditional ‘grey’ infrastructure, which depreciates
over time, and recognising and calculating how ecological assets that grow become innately more valuable over time, with
commensurate expansion in the opportunity costs of not investing in it, will require a profound transformation in municipal
budget and accounting paradigms.
“The key challenge is that information about the value of underlying urban natural assets is not generally included in the
financial decision-making processes, leading to weakly informed decisions regarding budget allocations to departments that
manage natural assets and the flow of ecosystem goods and services.” (de Wit et al, 2012)
brAAmfontein, north view, 2013

14
SECTION 1 Green infrastructure: introduction and conceptual underpinnings
Landscape-scale approachA last key characteristic of the green infrastructure paradigm
is that it involves an understanding of how landscapes serve
as the operational ground for infrastructure provision. This
landscape-scale focus is distinctive because it provides a
basis for understanding the connectivity between ecological
and built forms, as well as between ecological capacity and
infrastructural opportunity (Yeang, 2008; Benedict et al, 2002;
Mell, 2008). Incorporating an understanding of landscapes in
infrastructure provision is also a progression from conventional
conservation planning in that both natural and man-made or
constructed landscape features are recognised as valuable in
providing for biodiversity enhancement and serving human
needs such as air and water quality improvement (Mcconnell
et al, 2005). Through a landscape-planning lens, designed
green infrastructure is recognised as equally important as
naturally occurring vegetation.
Global green infrastructure plans and initiativesgreen infrastructure has therefore emerged as a way of
understanding green assets and ecological systems as part of
the infrastructural fabric that supports and sustains society.
This shift in thinking is evident in the development of various
green infrastructure plans and initiatives in other cities and
regions across the world. The following examples indicate the
growing impulse within statutory planning to invest in green
infrastructure. Further, they show that green infrastructure
has begun to demonstrate practical success as an alternative
service delivery system, bringing tangible local benefits.
The New York Green Infrastructure PlanIn 2009, The New York city government launched the
NYc green Infrastructure Plan. The city identified green
infrastructure as “an adaptive approach to a complicated
problem that will provide widespread, immediate benefits at
a lower cost”. Much of NYc is covered by a combined sewer
outflow system where rainwater and waste water from homes
and properties flow together. The city undertook a cost-benefit
analysis of different options for dealing with the need to treat
larger volumes of water, and more stringent effluent quality
regulations. The analysis found that traditional approaches
of constructing large new ‘grey’ infrastructure would be
very costly, relative to an alternative green infrastructure
strategy. In addition the conventional approach of expanding
tanks, tunnels and water works would have no sustainability
benefits beyond treating sewage and storm water, and the
extension of the existing system would only begin to deliver
water quality benefits at the end of a decade-long design and
construction period. The city’s preferred green Infrastructure
Plan sets out a number of objectives such as reducing
combined sewer outflow volumes by 3,9 billion gallons per
year, capturing rainfall from 10% of impervious surfaces, and
reaping recreational benefits through the bio-infiltration sites
and rain gardens that are core to the strategy. NYc calculated
that these solutions, together with some unavoidable grey
oPPenheimer PArk, soweto, 2013

The STaTe of Green InfraSTrucTure In The Gcr
15
“The vision for the ALGG is to create a well-designed green infrastructure network of interlinked,
multi-purpose open and green spaces with good connections to the places where people live and work,
public transport, the Green Belt and the Blue Ribbon Network, especially the Thames. This will provide a
richly varied landscape that will benefit both people and wildlife providing diverse uses to appeal to, and be
accessible by, all.” (The All London Green Grid, 2011)
infrastructure construction, would cost approximately
$5,3 billion over a twenty year period, but this would be a
saving to taxpayers of some $1,5 billion when compared to
the all grey infrastructure approach. The green infrastructure
options would also reduce combined sewer outflows to 17,9
billion gallons a year, compared to 19,9 billion achieved by an
all grey strategy. crucially, the city found that these benefits
would accrue immediately and build over time, in contrast to
the all grey strategy where benefits would only be seen after
long-term construction.
The All London Green GridIn 2011, the Mayor of London launched The All London
green grid (ALgg) to promote a shift from grey to green
infrastructure. The ALgg expresses green infrastructure as a
progression from perceiving London as a city punctuated by
parks and green spaces and surrounded by countryside, to an
appreciation of this network as part of the city’s fundamental
infrastructure, as integral to London’s metabolism as its roads,
rail lines or water pipes. It is significant that the ALgg takes
an integrated perspective of the two types of infrastructure,
via a multi-layered landscape-wide view that focuses on
the need to strategically plan and manage natural and built
environments together. In addition to this landscape-scale
focus, the ALgg also makes a critical contribution to the
global green infrastructure discourse by explicitly recognising
the value of man-made green infrastructure and the role of
well-designed spaces in urban infrastructure provision. To this
end, the ALgg vision is progressive, emphasising principles of
connectivity and diversity.
Life: building Europe’s green infrastructureLaunched by the European commission and coordinated by
its Environment Directorate-general, LIFE is an effort to build
a green infrastructure network across Europe. Its central aim is
to combat habitat fragmentation caused by grey infrastructure
and ‘migration passages’ in trans-border planning processes,
where the employment and economic opportunities accruing
from ecologically sustainable tourism are utilised as incentives
to envisage different ways to design and direct cross-border
infrastructure development (EU, 2010).
ConclusionThese and many similar plans show how planning for green
assets and ecological systems as an integral part of a city’s
form and fabric can bring significant economic, social,
financial and sustainability rewards. They encapsulate what is
possible if government is prepared to shift its consciousness
around the definition of infrastructure, encourage broad public
acceptance of alternative approaches to service delivery, and
innovate in the planning, fiscal and design architectures of
infrastructure provision and management.
development, such as roads cutting through natural areas,
urbanisation, and the externalities of delivering energy and
transport infrastructure, such as electrical overhead cables
that are a problem for migrating birds (EU, 2010). Significantly,
LIFE articulates its successes – such as the re-routing of
major roads to increase the area of favourable habitats for
particular species and the installation of natural green bridges
to facilitate species movement – as achievements dependent
on co-operation between neighbouring countries and multi-
stakeholder engagement between government and private
land owners (EU, 2010). The promotion of multi-purpose land
use, with the aim of harmonising wildlife interests with the
economic needs of local populations, has been the guiding
principle: “Indeed, financial prosperity was noted as being
an important long term factor to prevent further habitat loss
through land use abandonment” (EU, 2010). The initiative has
been activated by the introduction of ‘ecological highways’


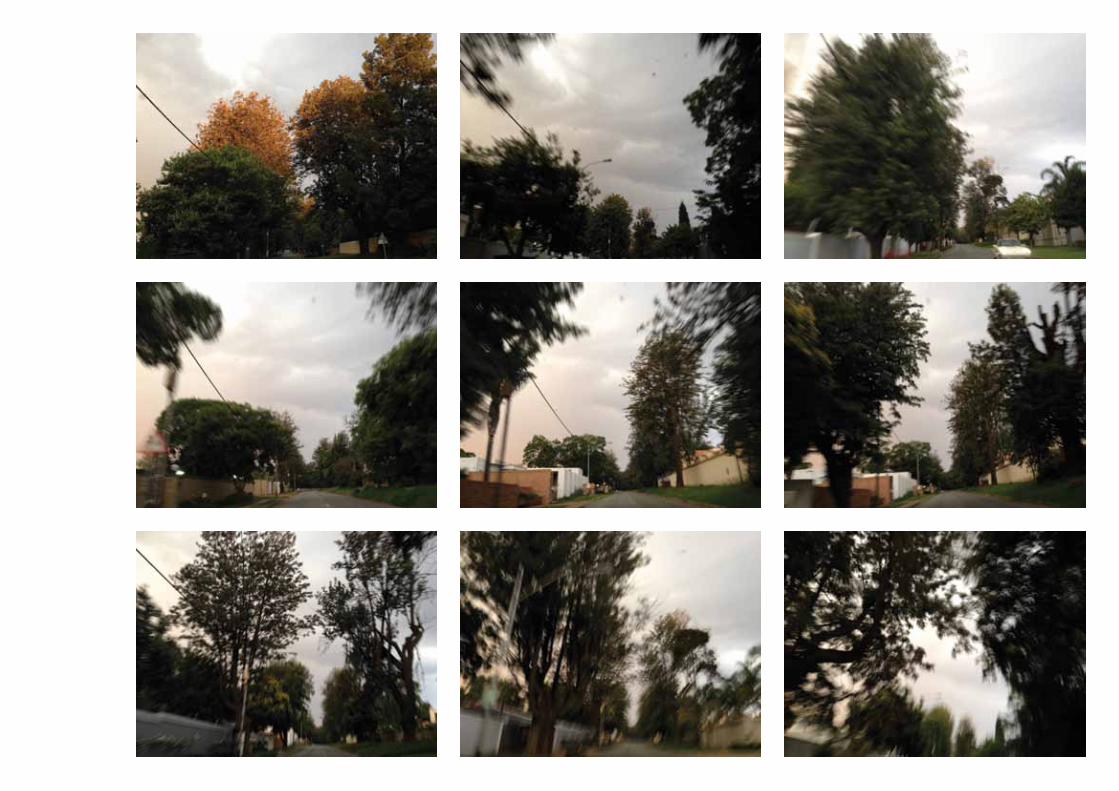
LANTANANatasha Christopher
Lantana Bush, Linksfield Ridge, 2013Drive, North of the City, 2012

20
SECTION 2 Assessing the state of green infrastructure in the GCR
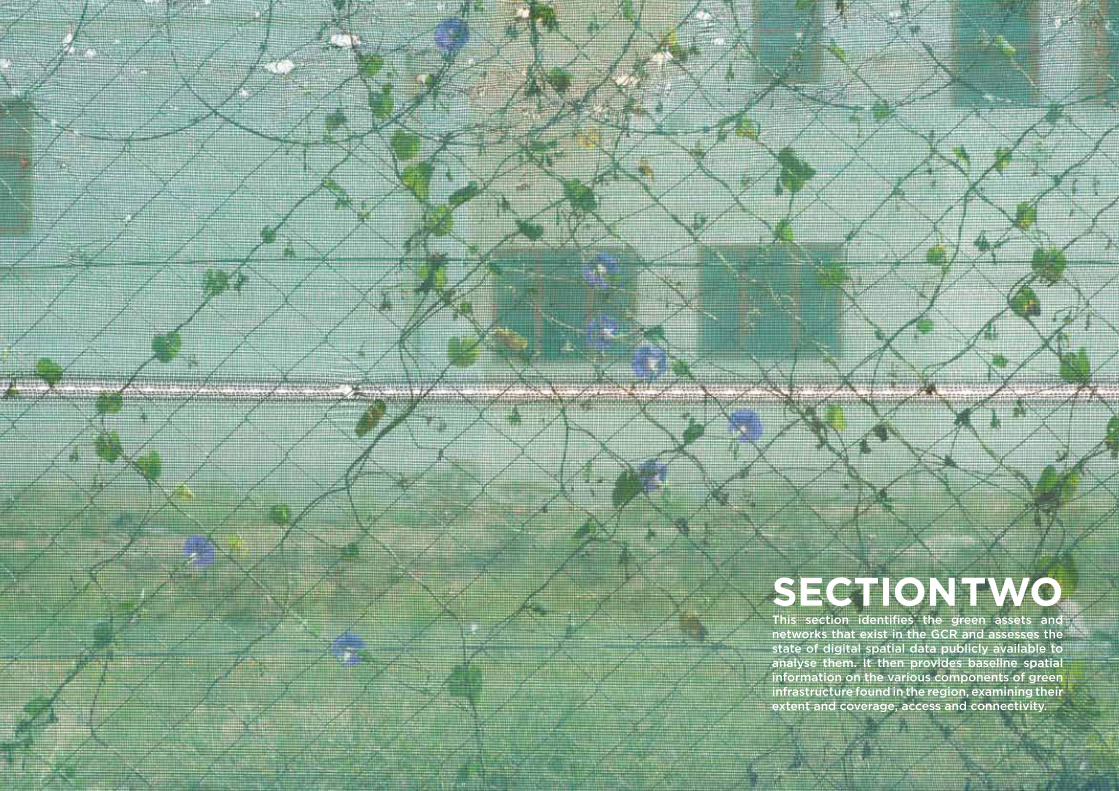
SECTION TWOThis section identifies the green assets and networks that exist in the GCR and assesses the state of digital spatial data publicly available to analyse them. It then provides baseline spatial information on the various components of green infrastructure found in the region, examining their extent and coverage, access and connectivity.
The STaTe of Green InfraSTrucTure In The Gcr
21
Assessing the state of green infrastructure in the Gauteng City-Region
This chapter describes the various green assets in the Gauteng
City-Region (GCR). This is done using a series of illustrative
maps that draw on publicly available spatial data to understand
what kind of green infrastructure exists in the city-region, and
how various components thereof are distributed, how they
are accessed, and how they connect. The datasets reveal a
mixed landscape where naturally occurring vegetation is
interspersed with planted vegetation, raising questions about
the ecological relationships between different green assets
and how the functioning thereof is affected by the nature of
urban development in the city-region.
This spatial depiction has hinged on the intersection of
various datasets to develop an overview of the GCR’s diverse
portfolio of green assets. Although baseline information on
the type, extent and location of green assets is provided,
there were significant data challenges, and much more
work is needed to collate local data across municipalities
and, if feasible, generate new and original data from within
government systems or using external sources such as satellite
images. This section therefore starts with an interrogation of
the available data, and then reviews what the available data
shows, following the scheme below:
2.1 data: the state of available digital spatial data for green
assets in Gauteng
2.2 landscape transformation: the multiple dimensions of
transformed land in Gauteng
2.3 coverage: the physical expanse and spatial extent of
natural and vegetated features in the GCR landscape
2.4 access: the proximity and ease of access to different
green infrastructure features
2.5 connectivity: the intersections between different
landscapes.
Mesh, Waterkloof, tshWane, 2013

22
SECTION 2 Assessing the state of green infrastructure in the GCR
Data: The state of available digital spatial data for green assets in GautengA starting point for this report was to assess existing
knowledge and data relating to green assets held in public
databases. This process involved a two year period of data
collection and collation to assemble the most recent publicly
available green asset data for Gauteng into an integrated
green infrastructure dataset. What follows is an interrogation
into the challenges encountered during this data collection
process and an overview of how issues, such as data weakness,
have been overcome.
A significant amount of digital spatial information is readily
available for Gauteng, but is located in various government
departments, where it is captured, collated, used and stored
according to different operational mandates. At present there is
no one repository that houses Geographic Information System
(GIS) data in Gauteng and this kind of data for green assets in
particular is currently spread between national, provincial and
local (district and municipal) government departments, as
well as in the offices of independent consultants. Consultants
are often contracted to collect GIS data by municipalities for
planning purposes. While these datasets often form a large
component of the accurate datasets used by municipalities
and other GIS users in Gauteng, data is most commonly in the
form of environment management frameworks, environmental
management plans, land cover and open space frameworks
for specific government units, and data has been collected
and created to align with their particular mandates.
figure 3. overview of green asset data errors

The STaTe of Green InfraSTrucTure In The Gcr
23
The fragmented nature of GIS departments in Gauteng makes the collation of digital green asset data a challenging task. First,
some of the municipal GIS departments in Gauteng are not well established. Their data is poorly stored and often of insufficient
quality to be used. Well-established departments such as those in the City of Johannesburg (CoJ) and the City of Tshwane
(CoT) provide good quality datasets, but this data often cannot be compared with offerings from other municipalities due
to incompatibility with poorer quality data. Some departments are also not always aware of the GIS data they house in their
departmental repositories.
Second, data is sometimes not stored in a format that can be used by a GIS, such as that in hard copy or CAD formats, limiting
its applicability.
Third, spatial datasets are often not compatible due to differences in the way features are defined and classified in different
municipalities as well as the way the features are captured and symbolised in a GIS. Issues of incompatibility are also exacerbated
by the change of administrative boundaries in municipalities over the last decade, which renders some of the data comparisons
invalid.
Fourth, the currency of datasets is an on-going challenge since the date of datasets is often not recorded and multiple data
entries with the same classification confuse the mapping process.
Fifth, the status of municipal park datasets in Gauteng highlights the challenges in mapping digital spatial data for green
assets such as data inaccuracies and conflicts. Parks data is not compatible at the Gauteng extent as public parks are largely
the responsibility of municipalities, which use different approaches to categorise parks. As a result, the definition of parks is
recorded differently in various park, open space and park & open space datasets. For example, data secured from the City of
Johannesburg (CoJ), categorizes parks as ‘developed parks’, ‘flagship parks’ and ‘undeveloped parks’ (JCP, 2012). The same
type of data from Ekurhuleni does not allow for a corresponding categorization because it aggregates all types of parks, which
are also defined as ‘passive recreational areas’, into one category. A visual overview of these categorisation differences is
provided in Figure 45 in Annexure A. Furthermore, these features are often symbolised by point (representing a single location
in space) and / or polygon (representing area shapes) feature classes and do not align around administrative boundaries (ESRI,
2009). Insufficient supporting metadata also often renders these datasets invalid.
Last, inherent weaknesses exist in the parks datasets, including positional and attribute inaccuracies that result from poor data
lineage, logical consistency and completeness (Annexure A, Box 1). An overview of GIS data quality issues at a municipal level
is presented in Figure 3 A – F:
• Parks in Figures 3 A – C illustrate one of two possible
errors that are a result of either a) classification errors
inherent in the definition and delineation of parks or b)
are an issue of data currency where datasets have not
been updated. In both Figures B and C, for example,
although parks have been identified, the corresponding
land use appears to be residential.
• Park polygons in Figure 3 – D demonstrate positional
inaccuracies incorporated in the data digitization
process. Data has not been snapped to the boundaries
of features that it intends to delineate and may be a
result of insufficient cadastre data or inaccuracies in
the recording and digitizing of park boundaries in a
GIS. Parks therefore do not accurately represent parks
on the ground and area values derived for these parks
will not be correct.
• Park polygons shown in Figure 3 – E exhibit both
positional and attribute inaccuracies through the
delineation of multiple park features that together
comprise one park on the ground. This may limit
the quantification and management of parks in
municipalities.
• Topological errors represented in Figure 3 – F illustrate
human or GIS errors incorporated in the digitization
of green assets that may skew area and measurement
calculations based on parks data. This illustrates
an error of positional accuracy, which may have
arisen during manual digitizing of data during data
processing.
It should be noted that these quality issues were not only
encountered in the parks dataset, but also in other layers
collected during the digital spatial data collation process.
It is suspected that compatibility and data quality issues
encountered in the parks datasets are illustrative of a broader
set of concerns that face GIS departments, such as insufficient
funds for the collection of good quality GIS data.

24
SECTION 2 Assessing the state of green infrastructure in the GCR
Overcoming concerns – data compilationA critical step in the production of this report has been the
collation of different data to deliver a homogenous information
resource from which to grasp the coverage, access, variance
and connectivity of green infrastructure in the city-region. To
overcome the data quality concerns outlined here, this report
draws on a range of data sources to establish a baseline
integrated green asset dataset for Gauteng. This GIS output,
which in addition to photographic and satellite imagery also
profiled in this report, is an important foundation for developing
a spatial perspective of the different components of green
infrastructure in the GCR. In confronting the challenges in the
state and quality of digital spatial data, and by developing
novel ways to merge layers from various sources, this report
is able to offer a number of insights into how data gaps and
weaknesses can be overcome.
The process involved merging layers from a digital spatial data
collation exercise according to data type, scale, attributes and
extent of different green assets:
a. GIS data needs to be interrogated for each mapping
application as the currency and content of datasets varies
between final shapefile categories. In particular, layers
in the protected and agricultural categories layers often
overlap due to expansion or shrinkage of these assets over
time. The report has addressed this by extracted layers
from a Gauteng land cover dataset (GTI Land Cover 2,5m,
2012) to provide a current and homogeneous dataset
from which maps and spatial analyses could be made.
b. While there are many different datasets detailing municipal
trees and tree planting in Gauteng, none of these layers
are complete or up to date. It was thus necessary for this
report to extract trees from a land cover dataset to create
a homogenous and accurate tree layer.
c. To order to overcome attribute inaccuracies apparent in
the definition and categorization of parks, open spaces and
green spaces in Gauteng these categories were merged
into a general ‘open space’ layer during a preliminary
data collation process. It was found that different open
space data sources classify these features differently and
may include or exclude roadside verges, open lots and
open areas on the urban periphery that may serve very
different functions to a similarly classified public park in
the inner city of Johannesburg. Merging all categories
into one generic green layer – that may include parks,
open green areas in urban areas, roadside verges and any
other identifiable green space – results in some loss of
specificity, and grey landscape features may exist within
this data. But it is more informative than using no green
space data at all as a result of these data constraints.
d. It is noted that the categories in the collated datasets
do not provide a detailed overview of all green assets
in Gauteng. The final green layers provide only a partial
reflection of reality in that they do not represent private
gardens, trees and peri-urban gardening. In such cases,
aerial photography and other visual representations are
profiled throughout the report. These vignettes of the city-
region’s landscape are equally important interpretations
of the state of green infrastructure than what can be
rendered through the digital spatial data.

Landscape transformation: the multiple dimensions of transformed land in Gauteng
In attempting to understand the extent and nature of green
infrastructure in the GCR, this report undertook various
attempts at a landscape change analysis. However, this was
challenged by the unavailability of time-series data on change
in green assets. For instance, GTI Open Space data, based
on official cadastre data, was sourced for Johannesburg for
both 2001 and 2010. However, the two years of data could
not be compared due to ambiguities between the years in
the definition of classes such as ‘undefined open spaces’.
For 2001 this category included various grey infrastructures,
such as road networks, and some clearly visible parks
which ought to have been categorised under ‘parks’. It was
impossible to find or generate consistently categorised
time-series data for green assets at the Gauteng extent.
While strict change data could not be found, Figure 4 provides
some insight into the complexities of land transformation in
the GCR. The Figure represents GTI 10m Land Cover data
(2009), which is coded into the following three classes,
‘urban’, ‘transformed’ and ‘untransformed’. This coding
approach reveals that both built-up ‘urban’ land and a series
of ecological classes, such as ‘urban trees’, ‘urban grass’,
and ‘cultivated’ areas’ are categorised as ‘transformed’
land, while features such as ‘dense trees’, ‘woodland’ and
‘grassland’ are ‘untransformed’ (GTI Land Cover, 2009).
Using this approach, it can be determined that ‘urban’ land
cover constitutes 15% of land cover, transformed land 42%,
and features collectively coded as ‘untransformed’, 43%
of Gauteng. However, this does not fully reflect the extent
to which urban activities have encroached on or modified
native vegetation and whether the large share of green
space, increasingly on the periphery, has been degraded.
Note that the resolution of the data presented in Figure 4
is such that only land cover features greater than 10m2 are
identified.
the state of Green Infrastructure In the Gcr
transformed (42%)
untransformed (43%)
urban (15%)
figure 4. landscape transformation status in Gauteng
25

26
SECTION 2 Assessing the state of green infrastructure in the GCR
A municipal green asset typology indicates how green
infrastructure components further break down per
municipality in the GCR. This overview is provided in Table 2
which dissects GTI 2,5m Urban Land Cover for 2012 classes
per municipality to represent the distribution of green assets
across Gauteng. The graph (Figure 5) indicates that ‘Planted
and natural grassland’ is a dominant feature across Gauteng’s
ten municipal areas, with larger shares of grassland land cover
classes in outlying, less urbanised municipalities, such as
Mogale City and Merafong. These municipalities are 59% and
57% grassland respectively.
The data illustrates that while some municipalities are more
urbanised than others, the ‘urban’ land cover classes are not
exclusively transformed vis-à-vis the rest of the landscape.
There are significant vegetative features ‘within’ the urban
expanse. Furthermore, other land cover classes that are
not traditionally viewed as ‘transformed’ may represent a
changeover from one land cover class to another. For example
in Lesedi, 41% of the landscape is categorised as planted and
natural grassland, but cultivated commercial agriculture also
holds a considerable share, constituting 38% of the landscape
of this agricultural-based economy.
In understanding the status of landscape transformation in
Gauteng, a distinction is therefore required between definitions
of ‘urban’ land that is ‘built-up’ and land that has been
transformed into new green assets, which while suggestive
of a natural environment, are landscapes constructed as
people have made investments in green assets. An overview
of how these investments are driven by communities and
the private sector is provided in Section 5. The tendency to
view landscape transformation exclusively in terms of built-
up or grey urban form is problematized in the inter-municipal
green asset typology shown in Table 2 and Figure 5, which
highlights the importance of a more nuanced picture rather
than conflating vegetation as ‘green’, ‘open’, or ‘non-urban’
land cover. This is particularly the case where the changeover
to another land cover type is felt through the construction of
new vegetation, such as non-natural and planted trees, which
in Ekurhuleni and Johannesburg, for instance, represent 8%
and 14% of the respective landscapes according to GTI 2,5m
Urban Land Cover data (2012). From this vantage point, ‘non-
urban’ also includes more than ‘open’ space and calls for a
deeper interrogation into the typology of green assets in the
GCR.

The STaTe of Green InfraSTrucTure In The Gcr
27
square kIloMetres
ek
ur
hu
le
nI
eM
fu
le
nI
MID
Va
al
le
se
DI
Mo
Ga
le
cIt
Y
ra
nD
fo
nt
eIn
We
sto
na
rIa
Me
ra
fo
nG
cIt
Y
Joh
an
ne
sB
ur
G
ts
hW
an
e
Ga
ut
en
G
Buildings 12 3 1 0 1 1 1 1 23 17 60Building (school) 3 1 0 0 0 0 0 0 3 2 10Building (campuses) 0 0 0 0 0 0 0 0 0 0 1sport stadiums (Buildings) 0 0 0 0 0 0 0 0 0 0 0school grounds 16 5 1 1 3 1 0 2 18 17 64sports and recreation 7 1 0 0 1 0 0 0 7 5 22Golf courses 8 1 2 0 0 1 1 1 9 9 33Industrial 31 3 2 1 6 1 1 1 21 17 84heavy industrial 4 3 0 0 0 0 0 1 1 2 11residential (cluster) 11 1 0 0 1 0 0 0 30 17 62residential (residential and planned) 81 21 5 3 8 2 3 4 113 115 356township (formal) 67 21 1 3 7 3 1 1 66 38 209township (Informal) 20 1 0 0 1 1 1 1 12 56 94small holdings 87 82 112 21 81 42 19 7 89 362 902roads 117 32 20 13 19 8 8 17 132 149 516rail 3 1 0 1 0 0 0 1 1 3 11thicket, Bushland and Bush clumps 6 4 91 27 28 3 8 59 2 842 1 071forest (Indigenous) 7 13 18 5 66 2 2 9 43 206 370trees (non-natural and planted) 161 30 41 24 39 14 14 42 226 188 779Grassland (natural and planted) 557 350 821 606 795 200 354 928 508 2 693 7 811Wetlands 149 36 40 124 17 11 28 56 51 202 716Degraded natural vegetation 7 6 11 14 3 1 2 3 5 38 91cultivated commercial (Irrigated) 30 11 32 20 21 26 9 15 9 64 236cultivated commercial (Dryland/rainfed) 297 249 440 566 179 130 145 394 50 865 3 314Mines & quarries 75 13 9 9 13 10 19 34 34 46 261open (little or no vegetation, parking lots, bare sand) 178 60 24 14 26 13 12 25 173 196 720Water 25 11 44 13 2 1 1 8 7 37 150Bare rock & soil (natural surfaces) 17 5 7 17 22 3 9 21 11 105 217new development 2 0 1 0 0 0 0 0 1 4 10total 1 976 966 1 723 1 484 1 343 475 640 1 632 1 645 6 298 18 182
table 2. number of square kilometres of each land cover class in each municipality in Gauteng (source: GtI 2,5m urban land cover, 2012)

28
SECTION 2 Assessing the state of green infrastructure in the GCR
figure 5. Percentage of selected land cover classes in each municipality in Gauteng (source: GtI 2,5m urban land cover, 2012)
EK
HU
RH
UL
EN
I
EM
FU
LE
NI
MID
VA
AL
LE
SE
DI
MO
GA
LE
CIT
Y
RA
ND
FO
NT
EIN
WE
ST
ON
AR
IA
ME
RA
FO
NG
CIT
Y
JOH
AN
NE
SB
UR
G
TS
HW
AN
E
GA
UT
EN
G
100%
90%
80%
70%
60%
50%
40%
30%
20%
10%
0%
Bare rock & soil
Open
Cultivated commercial agriculture (Dryland / rainfed)
Cultivated commercial agriculture (Irrigated)
Degraded natural vegetation
Wetlands
Planted & natural grassland
Trees (Non-natural / planted)
Forets (Indigenous)
Thicket, bushland, bush clumps
Golf courses
Sports & recreation
School grounds

Coverage: The physical expanse and spatial extent of natural and vegetated features in the GCR landscape
The GCR hosts a variety of naturally occurring vegetation
types, including indigenous grassland and forest areas, as
well as an array of ‘planted’ vegetation. The latter includes
agricultural land largely on the outer urban edges of the
region, through to planted trees, public and private gardens
and golf courses. Layers of this natural and planted green
infrastructure connect across administrative boundaries and
thread through the built form. An in-depth analysis into the
distribution of green assets, supported by a comprehensive
inventory of different vegetation types, is a complex
undertaking in light of these assets’ diversity.
Natural vegetationNatural vegetation in Gauteng corresponds to the grassland
biome, the second largest biome in South Africa that spans the
central interior of the country. Within this biome, temperate
inland grasslands, and Highveld grassland in particular, are
naturally occurring. In addition to grasslands, Gauteng hosts
various other indigenous vegetation types, in the form of
thicket, bush land, bush clumps, indigenous forests and shrub
land. These features are shown in combination in Figure 6,
which draws on GTI 2,5m Urban Land Cover 2012 data to
show natural vegetation in Gauteng. Within this coverage,
planted and natural grasslands are taken as components of
the grassland biome and degraded natural vegetation is also
seen as a relevant facet of the canopy of natural vegetation,
albeit being degraded (GTI 2,5m Urban Land Cover, 2012).figure 6. natural vegetation: thicket, bush land, bush clumps, indigenous forests, shrub land, planted and natural vegetation, degraded natural vegetation
the state of Green Infrastructure In the Gcr
thicket, bushland, bushclumps, indigenous forest, shrubland, planted and natural grassland, degraded natural vegetation
29

30
SECTION 2 Assessing the state of green infrastructure in the GCR
Planted vegetation: non-natural treesA prominent ecological feature within the GCR is the large
forested expanse that extends across the urban core. There is
no verifiable statistic on the exact number of trees in Gauteng,
though there are various public claims that the forest in
Johannesburg stands at approximately ten million trees (CoJ,
2008; CoJ, 2004). While this may be true, perhaps even an
underestimate, the challenge is that tree records are municipal
functions, so information resources of municipalities need to
be pooled for an integrated assessment of tree coverage. This
situation is further complicated because of the substantial
numbers of trees that exist in private gardens across the
city-region, a complex and fascinating landscape feature
explored in more detail in section 5 of this report. Outside
of municipal jurisdiction, trees remain invisible to public
data inventories. Therefore, aside from aerial imagery that
generically represents an overview of trees, information on
species, genus, age and quality of planted trees is yet to be
captured in empirical datasets harmonized across the GCR.
non-indigenous trees
figure 7. non-natural trees in Gauteng
Indigenous trees
non-indigenous trees
figure 8. Indigenous and non-natural trees in Gauteng
Figure 7 and 8 is an attempt to address this tree data vacuum
by utilizing aerial imagery converted into a 2,5m Urban Land
Cover dataset (GTI 2,5m Urban Land Cover, 2012). In this
mapping, each pixel on the image represents 2,5m2 on the
ground, so individual trees with a canopy of less than this
will not be represented, although dense clusters of trees with
individual canopies less than this area may be classified through
their joint area of 2,5m2 or larger. Figure 7 shows non-natural
trees and Figure 8 indigenous and non-natural trees together.

Depicted is an urban core where tree coverage is more
concentrated than on the outer edges of the province, and
where in overall terms non-indigenous trees are dominant.
These trends may be related to urban forms that have
encroached on natural vegetation, but at the same time, new
forms of vegetation have been planted in the urban fabric.
The maps illustrate a greater density of trees in Johannesburg
than in other parts of the province, although Ekurhuleni in the
east and Tshwane in the north also show concentrations. A
substantial portion of Johannesburg’s trees are mature trees –
many between 50 and 100 years old – which as a result of their
maturity and consequent size are visible to aerial imagery. A
biography of the urban forest explains the age of many of
Johannesburg’s trees. The existence of trees in Johannesburg
is tied to tree-planting schemes that accompanied the mining
boom beginning in the late 19th century, and the subsequent
tree growing culture that developed. To supplement
indigenous supply, and to settle the dust, large plantations of
exotic trees, such as Eucalyptus, Black Wattle and Jacaranda,
which tended to be quick-growing and suitable for mine props
and excavation, were set up in Johannesburg and surrounding
areas (Turton et al. 2006). The species types associated with
en-masse tree planting also partially explains the occurrence
of an almost non-indigenous urban forest in Johannesburg.
However, Johannesburg’s urban forest is also not uniformly
distributed and there are distinct differences in coverage
between the north and south of the city. Based on the GTI
2012 Urban Land Cover dataset, trees cover approximately
24,2 % of the total area of Johannesburg’s historically wealthy
northern suburbs while tree coverage in the poorer southern
quadrant is approximately 6,7% (GTI 2,5m Urban Land Cover,
2012) (See Figure 15).
The striking socio-spatial differences of tree-coverage across
Gauteng are depicted in Figures 9 to 14. These figures
represent GTI 2,5m Urban Land Cover data (2012) to show that
in contrast to the high concentrations of trees in historically
wealthy areas, tree coverage is sparse, almost non-existent,
in the informal settlements of Daveyton, Mamelodi and
Alexandra.
the state of Green Infrastructure In the Gcr
figure 9. tree coverage in Bryanston, Johannesburg
figure 11. tree coverage in atlasville, ekurhuleni
Indigenous trees
non-indigenous trees
figure 13. tree coverage in Waterkloof, tshwane
figure 10. tree coverage in alexandra, Johannesburg
figure 12. tree coverage in Daveyton, ekurhuleni
Indigenous trees
non-indigenous trees
figure 14. tree coverage in Mamelodi, tshwane
31

32
SECTION 2 Assessing the state of green infrastructure in the GCR
Tree planting projectsAn uneven share of green space in Gauteng has galvanised
an active justice-packaged drive to redress ecological
disparities inherited from apartheid. Figure 17 provides an
overview of Johannesburg City Parks (JCP) data on tree-
planting projects, initiated in Johannesburg as part of city
greening drives. The figure is shown next to two other maps:
Figure 15, which is a zoomed in version of the GTI 2,5m Urban
Land Cover capturing indigenous and non-natural trees; and
Figure 16, which merges this data with tree points captured
by Johannesburg’s parks management entity City Parks.
Comparing figure 15 and 16 reveals that there may have been
earlier tree planting programmes, especially in the south of
the city, where the size of the young trees means they are
not yet large enough to be picked up in aerial imagery, even
at a 2,5m resolution. Figure 17 shows recent tree planting
programmes with new trees marked in purple (JCP, 2012).
Figure 16 is based on tree point data, which means it does
not show actual tree coverage. This detail is visible in Figure
15, which reflects GTI’s 2,5m Urban Land Cover data (2012),
based on aerial imagery that shows a skewed distribution
of mature trees in Johannesburg, i.e. those visible to the
imagery. The tree points data captured by City Parks (Figure
16) may imply that a substantial portion of tree planting was
undertaken in Soweto during 2006-2010, and this data has
been aggregated into a generic ‘tree points’ dataset, although
this is not visible to the aerial imagery presented in Figure 15.
This results in tree coverage in Soweto depicted in a similar
way as that of the northern suburbs, a reality very different to
mature-tree imagery in Figure 15.
Of the various greening programmes geared to equalize
the distribution of public green space, intensive tree-
planting schemes are both prominent municipal capital
projects and public media campaigns. In Johannesburg, for
instance, capital projects geared towards greening include
2010 Greening Legacy, Soweto Greening 2006-2009, and
Braamfischerville Tree Planting, in addition to more general
public tree campaigns such as Arbour Month Tree Planting
and 67 Minute Contribution to Madiba. To balance out the
concentration of mature trees in Johannesburg’s historically
wealthy northern suburbs, tree planting schemes are primarily
located in previously disadvantaged areas, such as Soweto
and Orange Farm in the southern quadrant of the city.
Tree planting projects also alert us to the nature of public
investments in landscapes previously excluded from public
greening. It is clear that there has been an extremely
positive roll out of equity-based greening programmes, with
heightened momentum particularly in the build-up to the 2010
Soccer World Cup. However, many of these greening projects
received attention as short-term, high-pressure commitments
to reduce ‘ecological disparity’ (CoJ JCP, 2008), raising
questions about the commitment to sustain these assets over

The STaTe of Green InfraSTrucTure In The Gcr
33
the long term. For instance, the bulk of Greening Soweto, declared a 2010 World Cup legacy project, took place in winter, when
the Highveld frosts hit the hardest, and particularly in Soweto, resulting in many of the trees not surviving the cold (CoJ JCP,
2010). A future version of Figure 15, once the full effect of tree planting is evident, may therefore represent a greater tree extent
across Johannesburg, but it is also likely that low tree survival rates in certain areas may mean a scenario not as different as
one would expect.
forest (indigenous)
trees (non-natural)
figure 15. Mature tree coverage captured by GtI 2,5m urban land cover (2012)
all trees
figure 16: Mature tree coverage (GtI 2,5m urban land cover, 2012) with Johannesburg city Parks tree point data (JcP, 2012)
tree planting projects
all trees
figure 17. tree planting projects versus mature trees and Johannesburg city Parks tree point data (GtI 2,5m, 2012, and JcP, 2012)

34
SECTION 2 Assessing the state of green infrastructure in the GCR
Food infrastructureAlthough Gauteng is a net importer of food, relying mostly
on external supply chains to sustain food consumption, the
province does have extensive agricultural assets. Utilising GTI
2,5m Urban Land Cover (2012) data, Figure 18 indicates that
these assets are generally located on Gauteng’s periphery,
surrounding the urban core. This particular dataset also
indicates most of Gauteng’s ‘food infrastructure’ is in the
form of commercial agriculture, including irrigated cropland
and dry land or rain fed cropland. Additional data sources,
GDARD’s Agricultural Census (2009) and GTI’s Land use per
building (2009), provide further insights into the different
types of land uses associated with agricultural activity in
Gauteng. For instance, in addition to large-scale commercial
agriculture, agricultural gardens, agricultural hubs, agricultural
lands and land used for livestock are also located on the outer
edges of the province. An overview of these agricultural areas
in relation to commercial agriculture is provided in Figure 19,
which reaffirms a regional food infrastructure that surrounds
Gauteng’s urban core. Figure 20, on the other hand, presents
GTI Land use per building (GTI, 2009) to map agricultural
green space associated with buildings in Gauteng, revealing
a situation where many of the open spaces associated with
buildings on the peri-urban edge of the province are used for
agricultural production. Some detail on cultivated agricultural
land in Gauteng is provided in the Gauteng Agricultural
Potential Atlas (GAPA) (2013), which estimates that the total
area of cultivated land in the province is 386 244 hectares.
According to the GAPA (2013), the majority of this land is used
as pastures (53,8%), followed by maize (31,4%), in addition
to a number of less prominent produce, such as vegetables
(3,4%) and soya beans (4,5%), while 1,9% in 2012/2013 lay
fallow.
commercial agriculture
figure 18. commercial agriculture in Gauteng
agricultural land and land used for livestock
agricultural hubs
figure 19. overview of agricultural gardens, agricultural hubs, agricultural lands and lands used for livestock
agricultural areas associated with agricultural buildings
urban
figure 20. Green space per building including agriculture
SECTION 2 assessing the state of green infrastructure in the Gcr

The STaTe of Green InfraSTrucTure In The Gcr
35
School grounds, golf courses and sports and recreations spacesFor many people in Gauteng, green assets are green
spaces, designed not for ecological reasons but as sites for
recreational activity. A substantial portion of these green
assets planned as social spaces are school grounds, such as
sports fields and other associated open spaces within school
boundaries (GTI 2,5m Urban Land Cover, 2012). Spaces used
by society for sports and recreational activities, such as public
sports facilities and private golf courses, are also prominent
features in Gauteng’s green asset matrix. At a Gauteng scale,
these social green spaces can be aggregated into a group of
similar green assets, bound by a common characteristic of
recreational use. An aggregated picture of schools grounds,
sports and recreational areas, and golf courses is presented
in Figure 21, which draws on GTI 2,5 Urban Land Cover (2012)
data to plot ‘recreational’ green space across Gauteng. recreational green spaces
figure 21. recreational green space across Gauteng

36
SECTION 2 Assessing the state of green infrastructure in the GCR
Upon closer interrogation, Gauteng’s recreational green spaces
are associated with particular users and specific functions
within more localized, micro-landscapes. For instance, golf
courses generally feature as prominent irrigated areas (see
Figure 22). They also project particular socio-economic
dynamics in light of them being not readily accessible to all
citizens due to membership fees and playing costs. These
factors, coupled with often high water requirements in a water
stressed context such as Gauteng, have subjected golf courses
to various critiques. Yet, in light of land being cleared to
accommodate development, the large areas that exist outside
of formal protected areas may provide important reprieve in an
increasingly built-up landscape. Indeed, various international
studies indicate that golf courses have significant ecological
value by creating habitats for urban wildlife and otherwise
threatened species, as well as providing opportunities for
collaborative ecosystem management between public and
private stakeholders (Colding & Folke, 2008).
School grounds and sites used for sports and recreation
are similar to golf courses in terms of being ‘constructed’ or
‘developed’ green spaces. The share of school grounds in
relation to settlement and population densities varies across
Gauteng. For instance, in contrast to a Westonaria settlement
(Figure 23), Soweto in Johannesburg (Figure 24) is relatively
well-served by school grounds, which also constitute a large
share of ‘managed’ green space in immediate proximity to
surrounding residential settlements. While both examples
also include large tracts of land surrounding the respective
settlements, there is ambiguity in terms of the exact use of
these ‘open spaces’ by local users and the functions provided
by these spaces. In both these examples, the safety and
attractiveness of unmanaged open spaces may be cause for
concern, and in relation to Westonaria, open space is often
deemed dangerous due to the occurrence of dolomitic land
in the West Rand, as further explained in the Section 3 case
study. A possible corollary, however, is that vegetated open
areas left untouched by human influence may house important
populations of plants and animals while also purifying the air
and regulating water flows (Bolund & Hunhammar, 1999).
figure 22. Golf course, ekurhuleni (csIr spot 5 Imagery, 2010)
figure 23. school grounds, Westonaria (csIr spot 5 Imagery, 2010)
figure 24. school grounds and sports facilities, soweto (csIr spot 5 imagery, 2010)

The STaTe of Green InfraSTrucTure In The Gcr
Protected areasThe share of the GCR designated as formally protected areas
is represented in Figure 25. This overview of protected areas
integrates a number of green asset layers, including botanical
gardens, provincial nature reserves and conservancies and
various municipal reserves. At a city-regional scale, these
formally protected areas come together as a system that has
important ecological value as well as being significant heritage
sites. The Tswaing Crater, for instance, is an area of 1 981
hectares housing one of the only examples of a lake occupying
a meteorite impact crater in South Africa (Swanepoel et al,
2004). This has garnered significant scientific interest, and a
number of educational and eco-tourism opportunities
While many of the administrative requirements for protected
areas are already in place across Gauteng, the quality and
functioning of these assets at their local scales reveals a more
complicated reality. The Abe Bailey Provincial Nature Reserve
in the West\ Rand, for example, faces a number of challenges
due to its location within a human-dominated landscape of
urban development, agriculture and mining activities (Taylor
& Atkinson, 2012). The reserve is also cited by the Merafong
IDP (2011) as “an impediment to the northwards expansion
of urban Khutsong and Wielverdiend” (Ibid, 2012). In contrast
to this, Suikerbosrand Nature Reserve was extended between
2008 and 2009, with the goal of acquiring new reserve lands
that currently constitute one complete unit instead of the
separate units of two individual parts (GDARD, 2011).
An aggregated overview of Gauteng’s protected green spaces
is therefore useful to plot the spatial distribution of these
assets within the province and beyond. Yet a closer inspection
into whether the conservation status of these protected areas
is in fact being upheld exposes a series of localized challenges,
often omitted from a physical overview, and which need to
be incorporated into a more nuanced understanding of the
functionality of protected areas.
37
figure 25. Protected areas in Gauteng
Protected areas

Hydrological networksHydrological networks play a critical role in the functioning of
broader ecological processes that benefit both humans and
the environment. The GCR supports a number of hydrological
features that together make up the integrated hydrological
network of Gauteng. These features are represented in
Figure 26, which shows regional rivers, including perennial
and non-perennial rivers, manmade water infrastructure
such as reservoirs, various other water bodies such as dams,
and a RAMSAR site, namely the Blekbospruit in the eastern
quadrant of the province.
While South African water policies are said to be some of
the most progressive in the world, the GCR’s hydrological
network is beset by various challenges brought about by the
poor management of natural and man-made hydrological
systems and poor implementation and enforcement of
water legislation. Of these challenges, supply and quality are
some of the most acute since the city-region and its main
development nodes are located far from a large, sustainable
water source, a challenge compounded by the blanketing
of hydrological networks with built form, which significantly
alters natural flow regimes. The degradation of water
bodies, wetlands and various aquatic ecosystems through
short-sighted development activities and cynical abuse of
water legislation also compromises the water quality and
availability. Examples of these problems in the GCR include
acid mine drainage (AMD), pollution of feeder stream and
water bodies by mine residue areas (MRAs), and waste water
contamination as a result of poorly managed man-made
water infrastructure. To the extent that these environmental
problems affect downstream water users and inhibit the
functions of hydrological systems, green assets in the GCR play
an interesting role in the provision of ecosystem services. For
instance, certain plant and tree species are phytoremediating,
which means they naturally help to cleanse the soil by
removing toxic substances, while wetlands naturally filter and
regulate water flows, services that can be better grasped if
valued more explicitly in infrastructural planning.
SECTION 2 the state of available digital spatial data for green assets in Gauteng
38
Water source pointsrIVers
——— Perennial
----- non-perennial
raMsar site
Wetlands
Manmade water infrastructure
other natural water bodies (pools and lakes)
figure 26. hydrological networks in Gauteng

The STaTe of Green InfraSTrucTure In The Gcr
39
The functions of green assets assume an infrastructural role
through the idea of ecosystem services, and the promotion
of these as the equivalent of traditional services such as
electricity, potable water and sanitation. Green assets
therefore enter into the debate about the rights to services
and the asymmetries in infrastructure coverage. The obligation
to improve access to green space has activated strategic
dialogues about relative shares of green space for a particular
population group as well as various standards for maximising
the access thereto. For instance, the Guidelines for Human
Settlement Planning and Design, known as the ‘Red Book’
(CSIR, 2000), includes an assortment of recommendations
about how public open spaces should be planned according
to users’ frequency and access needs:
• Larger parks should be located in areas with no or limited
access to natural amenities (in the form of mountains
or coastlines). They should be fairly evenly distributed
throughout a settlement, and where possible, connected
by parkways.
• Smaller parks can be located within easy walking distance
(i.e. ± 300m) of workers situated within busy commercial
and industrial centres in order to create contrasting
spaces of relief within predominantly residential areas,
so as to create easily surveilled child-play spaces, and
within school clusters, which create safe, shared playtime
spaces.
Access: The proximity and ease of access to green assets• As larger parks serve sub-metropolitan as well as local
users, maximum distances will sometimes be greater
than maximum walking distances (i.e. ± 500m or 10 min).
The implication of this is that parks will often need to be
accessed by bicycles or public transport
• As smaller parks are likely to be used on a daily basis by
children, elderly people and workers, and are accessed
by foot, they should be located within 300m to 700m of
users. The maximum time spent walking to a smaller park
should therefore be approximately 10 min.
• The area and dimensions of a park vary according to
the functions the park is intended to perform, and to
proximity to the natural environment. Larger parks should
be able to accommodate a variety of collective events
like carnivals, fairs and concerts. Parks that are between
6 ha and 10 ha in size, with widths of between 200m and
300m, and lengths of between 300m and 500m, are
generally flexible enough to accommodate these events.
• The area and dimensions of smaller parks also vary
according to the functions they are intended to perform.
Smaller parks should, however, be small enough to
maintain a sense of intimacy, and enable easy visibility
and recognition (i.e. ± 25m maximum). Such parks should
therefore be between 450m2 and 1 000m2 in size, with
widths of between 15m and 25m, and lengths of between
30m and 40m. (CSIR, 2000)
While these guidelines are valuable benchmarks, the reality
is that the comparative basis for measuring success against
generic standards differs in every context and also over time.
In the case of Gauteng, the influx of people into urban areas
is changing demographic profiles, and hence access needs,
while shifting population densities and urban forms affect the
way public green spaces are located within different areas. In
light of these trends, it is interesting to see how municipalities
frame access to public green spaces. In general, municipalities
frame dimensions of access according to generic international
standards. For instance, the City of Johannesburg (CoJ)
highlights an international benchmark of 2 hectares of quality
public open space per 1000 residents in dense urban settings
as a relevant measure of the City’s ability to cater for green
space (City of Johannesburg, 2012), while the City’s greening
agent has also publicized providing 4 hectares of open space
for every 1000 people (JCP, 2012). The City of Tshwane’s (CoT)
Environmental Management Department, on the other hand,
uses 1 hectare of open space per 1000 residents to determine
the need for public open spaces in relation to population
density (CoT, 2007).
The different points of emphasis in target definitions of
accessible public green space raise questions about the
varied outcomes that may emerge over time as a result of
how physical measures are interpreted in planning processes.
The complexities of utilising standard measures to determine

40
SECTION 2 Assessing the state of green infrastructure in the GCR
and guide access are evident in an analysis of how CoJ’s 2 hectares of quality public open space per 1000 people, versus 4
hectares of open space, plays out in reality. Firstly, the term ‘quality public open space’ can variously be applied to a range
of green features falling under the management of Johannesburg City Parks (JCP), the assets of which range from nature
reserves and bird sanctuaries to various types of parks. For the purposes of this report, a selection from JCP 2013 asset data
indicates that parks in Johannesburg are broken down into three broad categories, namely developed parks, flagship parks,
and undeveloped parks. If we accept that these assets are of a generally acceptable quality – possibly high quality in the case
of developed or flagship parks, or, in the case of undeveloped parks, of a quality fit for future development or to be improved
– we can engage in an indicative analysis of how the Johannesburg target for quality public open space plays out in practice,
acknowledging that there is a substantial amount of public green space that exists in addition to assets defined as parks. In
addition to the fundamental conceptual questions about which green assets are defined as high quality on the one hand,
and public open spaces on the other, the debate is further about how access is measured in relation to the City using two
simultaneous benchmarks of 2 and 4 hectares for public open space.
While green asset data from Johannesburg City Parks (JCP, 2013) is organised into both regions and municipal wards, wards
are commonly used as the smallest administrative area for community-based planning and according to which green assets are
also categorized in JCP datasets. Figure 27 represents wards in Johannesburg that are above and below the 2 hectare target
of quality parks per 1000, while Figure 28 shows how the City is faring in relation to the more ambitious 4 hectare target. What
emerges from this analysis is a scenario where the majority of wards in Johannesburg are below the lower 2 hectare target and
those wards that are either meeting or exceeding the target are concentrated in historically wealthy parts of Johannesburg.
However, what this situation fails to reveal is that those wards under the 2 hectare quota are not necessarily underserved in
terms of public parks, since there are wards in Johannesburg where there are 1.6 hectares or 1.9 hectares of public parks per
1000 people, but which, by implication of the 2 hectare target, remain excluded from those wards deemed as having sufficient
access. While a more detailed analysis may seem viable, using StatSA’s Small Area Layer (SAL) (2013) for instance, the challenge
is that CoJ uses a ward-based planning approach, which does not necessarily represent the way people see their access being
determined. By way of example, a park on the edge of a ward boundary in a large-sized ward X, where most of the population
may concentrate on the far side away from the park, may be more accessible to the population in the adjacent small-ward Y,
while ward Y itself has no park in its boundaries.
no parks
Below 2ha per 1 000 people
above 2ha per 1 000 people
figure 27. Wards above or below 2ha parks per 1000 individuals
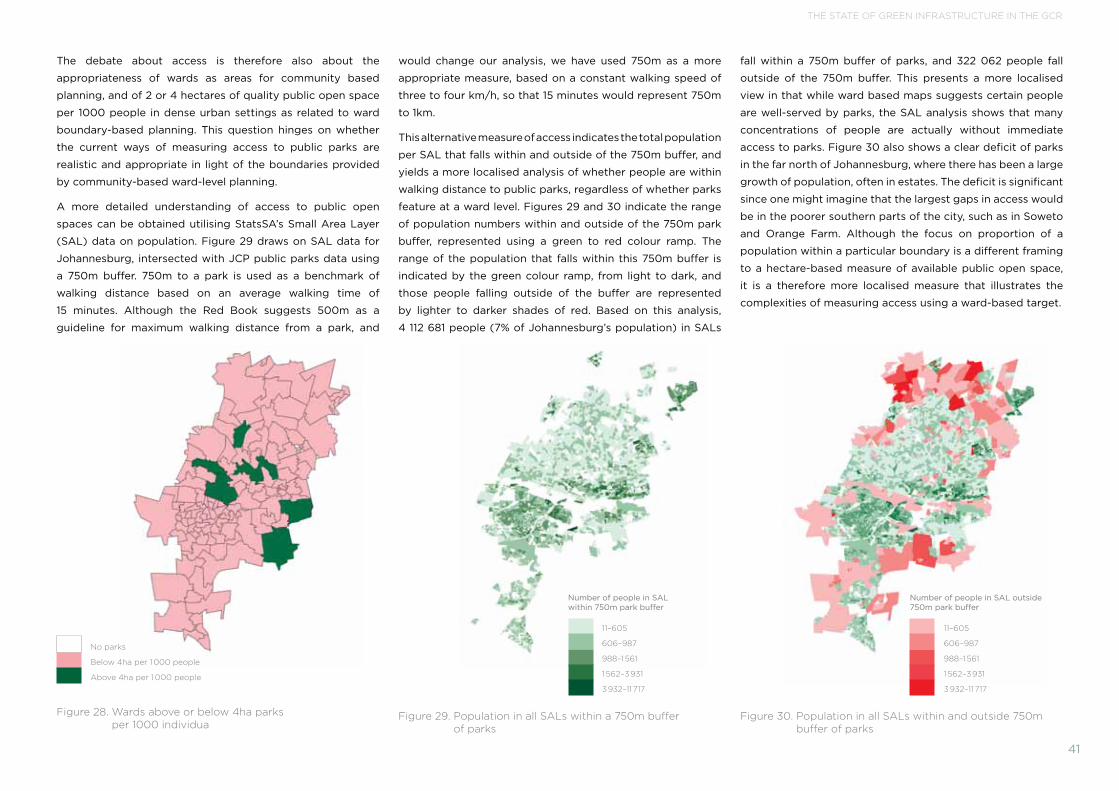
The STaTe of Green InfraSTrucTure In The Gcr
41
The debate about access is therefore also about the
appropriateness of wards as areas for community based
planning, and of 2 or 4 hectares of quality public open space
per 1000 people in dense urban settings as related to ward
boundary-based planning. This question hinges on whether
the current ways of measuring access to public parks are
realistic and appropriate in light of the boundaries provided
by community-based ward-level planning.
A more detailed understanding of access to public open
spaces can be obtained utilising StatsSA’s Small Area Layer
(SAL) data on population. Figure 29 draws on SAL data for
Johannesburg, intersected with JCP public parks data using
a 750m buffer. 750m to a park is used as a benchmark of
walking distance based on an average walking time of
15 minutes. Although the Red Book suggests 500m as a
guideline for maximum walking distance from a park, and
would change our analysis, we have used 750m as a more
appropriate measure, based on a constant walking speed of
three to four km/h, so that 15 minutes would represent 750m
to 1km.
This alternative measure of access indicates the total population
per SAL that falls within and outside of the 750m buffer, and
yields a more localised analysis of whether people are within
walking distance to public parks, regardless of whether parks
feature at a ward level. Figures 29 and 30 indicate the range
of population numbers within and outside of the 750m park
buffer, represented using a green to red colour ramp. The
range of the population that falls within this 750m buffer is
indicated by the green colour ramp, from light to dark, and
those people falling outside of the buffer are represented
by lighter to darker shades of red. Based on this analysis,
4 112 681 people (7% of Johannesburg’s population) in SALs
no parks
Below 4ha per 1 000 people
above 4ha per 1 000 people
figure 28. Wards above or below 4ha parks per 1000 individua
Number of people in SAL within 750m park buffer
11–605
606–987
988–1 561
1 562–3 931
3 932–11 717
figure 29. Population in all sals within a 750m buffer of parks
Number of people in SAL outside 750m park buffer
11–605
606–987
988–1 561
1 562–3 931
3 932–11 717
figure 30. Population in all sals within and outside 750m buffer of parks
fall within a 750m buffer of parks, and 322 062 people fall
outside of the 750m buffer. This presents a more localised
view in that while ward based maps suggests certain people
are well-served by parks, the SAL analysis shows that many
concentrations of people are actually without immediate
access to parks. Figure 30 also shows a clear deficit of parks
in the far north of Johannesburg, where there has been a large
growth of population, often in estates. The deficit is significant
since one might imagine that the largest gaps in access would
be in the poorer southern parts of the city, such as in Soweto
and Orange Farm. Although the focus on proportion of a
population within a particular boundary is a different framing
to a hectare-based measure of available public open space,
it is a therefore more localised measure that illustrates the
complexities of measuring access using a ward-based target.

42
SECTION 2 Assessing the state of green infrastructure in the GCR
Private greenIn Gauteng, older, wealthier suburbs tend to have significant
concentrations of green space in private gardens. Regardless
of the share of public green space available in difference parts
of Gauteng, there is a noticeable disparity in the amount of
green space behind the walls of private space in different parts
of the city-region. These variances are strikingly captured by
CSIR Spot 5 aerial imagery (CSIR, 2010) in Figures 31 and 32,
showing Houghton and Soweto in Johannesburg respectively.
In addition to the fact that the large green spaces visible in
each figure differ substantially – golf courses in Houghton
versus large tracts of land dividing parts of Soweto –
vegetation in Houghton is also far denser inside and outside
of private properties, such as on tree-lined streets adjoining
these properties.
Privately zoned green areas play a provocative role in patterns
of access to green infrastructure. A substantial portion of
residential and corporate properties in the GCR houses large
shares of vegetation, yet the fragmented nature thereof,
which is commonly the product of exclusive estates or private
residences, affects access for different socio-economic groups.
Using data from AfriGIS Gated Communities (2012) and GTI
2,5m Land Cover (2012), Figure 33 represents the share of
green space in gated communities, drawing out Waterfall
in Tshwane and Aspen Hills in the south of Johannesburg
as examples. At the same time as these gated communities
fragment land – giving the landscape a parcel-like character -
they also incorporate vegetation within their zoning structures,
which may have otherwise been blanketed with built-up land.
This raises a debate about the allegedly damaging spatial
forms of estate – and gated – communities, particularly since
a number of ‘eco’ estates, such as Waterfall Estate in northern
Johannesburg, are also designed as developments that both
shelter natural assets and include landscaping provisions in
development guidelines.
figure 32. aerial image of soweto (csIr spot 5 Imagery, 2010)figure 31. aerial image of houghton (csIr spot 5 Imagery, 2010)

43
figure 33. Private green space in gated communities
Gated communities
all natural vegetation
forest
recreational areas: school grounds, sports recreation and golf courses
Water and wetlands
the state of Green Infrastructure In the Gcr

44
SECTION 2 Assessing the state of green infrastructure in the GCR
Connectivity: The intersections between different landscapes“There is a corridor of open land cutting across the north-south growth of Johannesburg; it runs from beyond Gillooly’s Farm to the east, through golf courses, parks and public gardens, to the Zoo Lake, and on to Emmarentia and the west rand. Parts of the corridor have different formal uses: some public, some private. Together they make up a green belt providing a natural reservoir of plant and bird life, a buffer against urban sprawl, and a breathing space for the city…” (Smith, 1988).
This excerpt from The Brenthurst Gardens implies a context
where a prominent green corridor threads together a series of
green assets, converging as a green network in an expanding
Johannesburg. Although green passages exist within the
current landscape of the GCR, these are to be discerned
amongst extensive built form, as more grey infrastructure
has been added to the landscape. This transformation is
evident in the highly urbanised central spine of Gauteng,
expanding outward to encroach on natural vegetation, large
portions of which have either been intersected or surrounded
by built form. The results are a striking set of green fingers
engulfed by rapidly spreading residential development and
accompanying transport networks. In light of the effects on
ecological integrity, discerning green passageways within the
GCR underscores the importance of a fine-grained analysis
of where portions of the landscape remain connected amidst
a mass of grey infrastructure. A series of these analyses
are presented in Figures 34 to 36, which utilise ESRI World
Imagery (2010) to uncover the extent of green corridors
across parts of the city-region. In Figure 34, for example,
there are a number of a green extensions that stretch from
the northern quadrant of Johannesburg south, such as via the
Braamfontein spruit, yet largely exist as thin spines of green in
an otherwise grey landscape.
While the landscapes of Orange Farm (Figure 35) and
Hammanskraal (Figure 36) may seem to present a more
favourable scenario, one where vegetation is less pressured
by encroaching urban form, the configuration of these
expanding informal settlements may change in years to come.
These examples show that In spite of urban form, there are
ribbons of green that have been kept intact. The implication
is, however, whether these corridors and other current green
assets can be retained in the same way as densification in the
Figure 34 example has allowed.

The STaTe of Green InfraSTrucTure In The Gcr
45
figure 36. hammanskraal, tshwanefigure 35. orange farm, Johannesburgfigure 34. Green passages including the Braamfontein spruit, Johannesburg

46
SECTION 2 Assessing the state of green infrastructure in the GCR
However, micro-scale linkages in the landscape are not always
clear at a city-region scale where different green assets are
aggregated into similar features typologies. Figures 37 to
42 assist in deciphering these landscape connections and
identifying where green corridors are still intact or where
these have been interrupted or fragmented by the layering
on of more grey infrastructure, buildings and utility networks
to the landscape. Relating this to a wider regional picture of
green infrastructure therefore involves conceptual extractions
of the different green asset networks that cover the city-
region. These different networks have been identified as
different forms of natural and planted vegetation, agricultural
land, constructed recreational spaces, protected areas and
hydrological networks, and are summarized below in Figures
37 to 41. Viewed together, these green assets present a view
of the GCR constituted as a multi-layered green infrastructure
network (Figure 42).
Figure 42 also presents a scenario of the maximum degree
of spatial overlap between Gauteng’s different green
assets. This representation of green infrastructure differs
from conventional protection approaches as it focuses on
interlacing concepts from conservation, land development
and crucially, man-made infrastructure planning (Benedict
& McMahon, 2006). This moves beyond strict conservation
applications by identifying how natural and constructed
green assets in an area work together, and allow for a more
sophisticated understanding of how this green infrastructure
works in relation to built-form. This scenario is akin to a
connectivity analysis, which refers to “the degree to which a
landscape facilitates or impedes the flow of energy, materials,
nutrients, species, and people across a landscape” (Ahern,
2007). While connecting different green assets using aerial
imagery and digitised land use or land cover data provides an
indication of the degree of green asset overlap, the reality is
that this connectivity has been affected by a range of factors.
These include landscape transformation, including both
the expansion of built-form and the creation of new types
of constructed landscapes, and a number of externalities
Multi-layered open space, trees, ridges, bare natural landscapes and vegetation
figure 37. natural and planted vegetation
Multi-layered agricultural lands, commercial agriculture and agricultural hubs
figure 38. agricultural land
Multi-layered recreational areas
figure 39. recreational green spaces

The STaTe of Green InfraSTrucTure In The Gcr
47
arising from the way development has proceeded in different
parts of the province. This affects both the physical linkages
between landscapes, i.e. their spatial configuration, as well as
the degree of functional connectivity in terms of the ability
of a landscape to continue to provide services to society. For
instance, while the inner city of Johannesburg is more densely
grey than green, it is connected to near inner city suburbs
by networks of street trees, which interestingly follow the
grey corridors of roads. In contrast, large green segments
of land between Johannesburg and Ekurhuleni may seem to
represent an uninterrupted green asset, but are intersected
by a major transport route.
Multi-layered protected areas
figure 40. Protected areas
Multi-layered water and wetlands
figure 41. hydrological networks
Multi-layered green corridors
Multi-layered green assets
figure 42. the Gcr as a multi-layered green infrastructure network


WATERNatasha Christopher
Acid, West Rand, 2012Water, Springbok Park, Tshwane, 2013


56
SECTION 3 Current government plans, visions and capabilities for green infrastructure
SECTION THREEThis section provides a systematic review of how green infrastructure is being thought about, planned for and implemented in municipalities across the GCR. Each case study assesses how government structures and individual officials are interacting with green assets in their planning and management processes, and the resulting opportunities for and blockage points to prioritizing these assets as infrastructure

57
The STaTe of Green InfraSTrucTure In The Gcr
Current government plans, visions and capabilities for green infrastructure
In the Gauteng City-Region (GCR), a number of foundations
have been laid for investment in the region’s ecological assets.
There is a strong promotion of natural resource protection,
with various policies focusing on conservation targets to
preserve indigenous or naturally occurring vegetation. Many
of these targets are motivated in light of the eco-tourism
benefits of conservation programmes, through which there
is a connection into economic development. Strategic
dialogues are also recognising that investments in ecological
assets, specifically trees and certain plants and shrubs, can
assist in mitigating the adverse consequences of inter alia,
heavy winds, airborne dust and various forms of pollution.
Where planning processes are incorporating ecosystems
services into mainstream planning, there is an explicit focus
on community benefits of greening investments which are
often articulated as initiatives that both reduce peoples’
vulnerability to environmental stress and redress ecological
disparities inherited from apartheid. Despite an institutional
openness to such investments, new strategic commitments
in trees, community gardens and landscaping to accompany
new developments are challenged by fiscal priorities which
often favour short-term economic multipliers such as large
residential developments from which municipalities can
accrue tax benefits.
It is encouraging, however, that municipalities are seeing
development pressures as opportunities to incorporate
landscaping and greening and it is significant to observe
collaborative efforts between private developers and
government, which reflect a broader political space to think
differently about how investments in ecological assets can
be financed and sustained through creative service delivery
arrangements.
This chapter reflects upon the production and recreation
of landscapes in local municipalities of the GCR through
interrogating the processes by which government plans,
invests and values ecological and green assets as part of the
operations and objects of municipal service delivery.
A series of case studies provide an overview of relevant
institutional structures, frameworks and programme in
Gauteng’s three metropolitan municipalities, two district
municipalities and their respective local municipalities. This
review of institutional and policy processes focuses on how
public entities interact with green assets and examines
whether a conscious effort is being made to value these
assets as infrastructure. In doing so, the case studies highlight
where in the institutional architecture of local government
green assets are supported and discuss some of the blockage
points within municipal operations to mainstreaming a green
infrastructure mind set.
Flower Box, Bentley Street, roBertSham, JohanneSBurg, 2013

58
SECTION 3 Current government plans, visions and capabilities for green infrastructure
City of JohannesburgThis case study discusses the institutional and policy landscape
through which ecological assets are planned and budgeted
for in the City of Johannesburg, focusing on whether such
assets are understood and planned for as infrastructure. The
following analysis provides an account of how ecological
assets feature in Johannesburg’s planning consciousness, the
nature of recent green investments by the City as alternatives
to grey infrastructure and the implications for municipal
innovation in green infrastructure. Johannesburg appears
to be making some headway in terms of more integrated
landscape planning, but there is still a room to expand the
City’s definitions of ‘green space’ and to develop the skills
and resources devoted to valuing ecological assets in an
infrastructural sense.
Johannesburg’s urban landscapeJohannesburg has an interesting, yet controversial ecological
profile. Prior to the gold-mining boom of the 1880s, the
Witwatersrand had no trees, no gardens, no parks, and the
natural landscape was characterized by savannah grassland,
scattered bushveld, and some native woodland areas (CoJ,
2012; CoJ JCP, 2012). Today however, Johannesburg is home
to an extraordinary ecological asset, what is claimed to be
the world’s largest urban forest, which according to the City
is said to have grown to 10 million trees (CoJ, 2008). Now
interspersed with public and private green spaces, the urban
forest is a significant ecological feature that needs to be
understood as a product of the city’s intersecting industrial
and ecological histories.
In the late 19th century, a tree-planting boom began as an
attempt to both settle the dust, and cleanse the air, as a result
of intense mining activity during the Gold Rush, and to supply
poles to support mine shafts and excavations (Turton et al.,
2006). Quick-growing species such as Eucalyptus, Black
Wattle and Jacaranda, and varieties with which the colonials
were familiar such as London Planes, Oaks and Pepper trees,
were introduced during a massive tree-planting scheme
that paralleled the expansion of mining activities (Turton et
al., 2006; CoJ, 2003; CoJ JCP, 2012; Mawson 2004). While
indigenous trees initially met the demand for mining timber,
these became denuded with the expansion of mining and led
to both private landowners and mining companies investing
in large scale non-indigenous timber plantations. These
fundamentally transformed the landscape in and surrounding
Johannesburg (Christopher, 1982). It is important to note
that mining companies imported a substantial number of
trees preferred for supporting mining activity, such as the
quick-growing Eucalyptus, familiarly known as Blum Gum
from Australia, which with a tall, branchless appearance and
growing period of 8-12 years, was seen as bringing the quickest
commercial return; ideal for use in mine shafts (Christopher,
1982; Mawson, 2004).
The establishment of nurseries and the current Horticultural
Training Centre at Zoo Lake (CoJ, 2012) were some of the
social structures that helped coordinate the transformation
of Johannesburg’s natural landscape. Experiments conducted
to test the suitability of various tree species for mine props
were further drivers of en-masse tree planting in present day
Saxonwold, Parktown, Langlaagte, Craighall and Fairland.
Residents were also given trees to plant in their gardens and
trees for domestic horticultural use (CoJ, 2012; Christopher,
1982; Mawson, 2004).
The result was that coupled with mining-driven tree planting
processes, a mosaic of green spaces began to emerge in
Johannesburg, consisting of features indigenous to the
Highveld landscape, such as savannah grassland, interspersed
with suburban-style green spaces that were sustained through
household level tree-planting and garden beautification
(Turton et al., 2006; Mawson, 2004). The naming of
Johannesburg’s early suburbs, such as Forest Town, Parkview
and Parktown (Turton et al., 2006) is reflective of the wider
ecological constructions that took place through individual
investments in ornamental greening and horticulture. Over
time, there has also been a significant increase of private
green spaces in Johannesburg and the pervasive presence
of suburban gardens embodies interesting socio-spatial
dynamics where enclosed, private grounds are outcomes
of unequal social realities, but also representations of the
substantial investments of citizens in formulating a sense of
belonging and spatial identity (Wylie, 2011). That is, while the
uneven distribution of tree coverage and private green spaces
is a physical manifestation of unequal access to services
across the city (Schaffler and Swilling, 2013), there are citizen
greening investments that play a fundamental role in the form
of Johannesburg’s landscape.
The mix of different land cover classes in Johannesburg
is illustrated in Figure 43, a map based on GTI 2,5m Land
Cover from 2010, which represents the share of urban
areas (buildings, industrial, residential, small holdings, new
developments, streets and roads) relative to both manmade
and natural green space. The data shows that the significant
share of manmade or planted green space (gardens, golf
courses, non-natural trees) in Johannesburg versus natural
green space (thicket, bush veld, bush clumps, indigenous
forest, shrub lands, degraded natural vegetation and natural
land surface), so that although there is a high overall share of
green space, a large portion of this is not necessarily naturally
occurring.
garden Court, milpark, JohanneSBurg, 2013

59
The STaTe of Green InfraSTrucTure In The Gcr
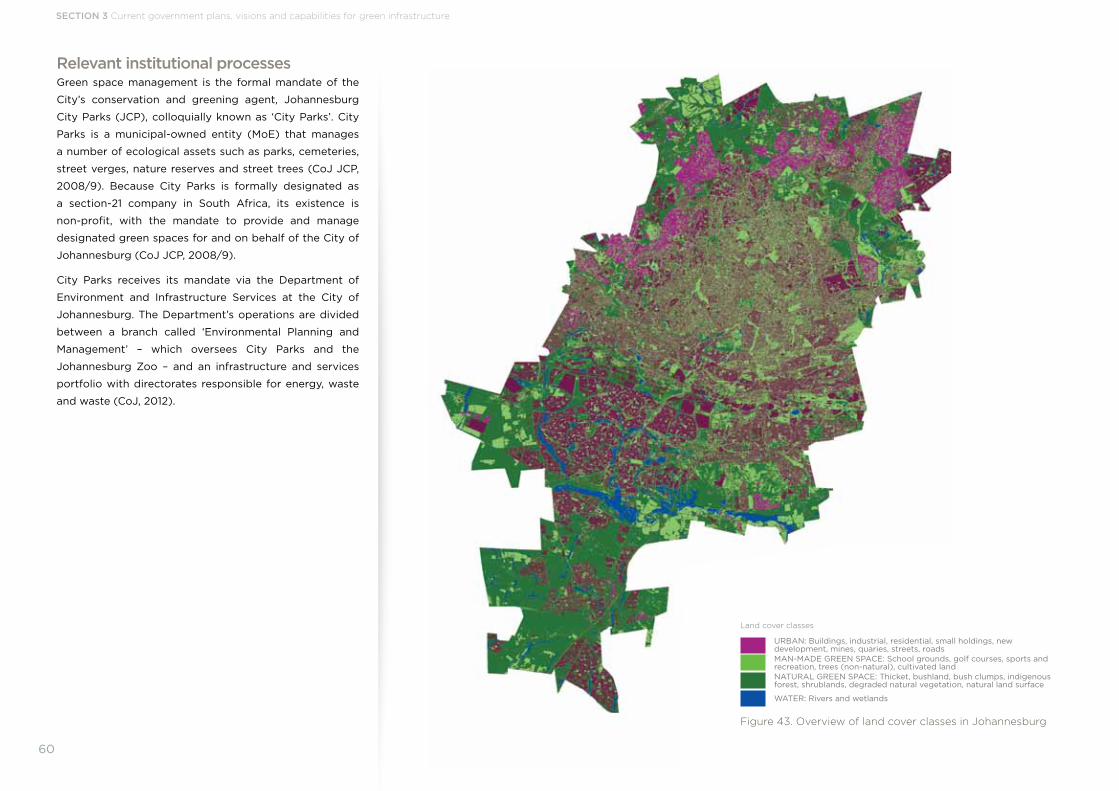
60
Relevant institutional processesGreen space management is the formal mandate of the
City’s conservation and greening agent, Johannesburg
City Parks (JCP), colloquially known as ‘City Parks’. City
Parks is a municipal-owned entity (MoE) that manages
a number of ecological assets such as parks, cemeteries,
street verges, nature reserves and street trees (CoJ JCP,
2008/9). Because City Parks is formally designated as
a section-21 company in South Africa, its existence is
non-profit, with the mandate to provide and manage
designated green spaces for and on behalf of the City of
Johannesburg (CoJ JCP, 2008/9).
City Parks receives its mandate via the Department of
Environment and Infrastructure Services at the City of
Johannesburg. The Department’s operations are divided
between a branch called ‘Environmental Planning and
Management’ – which oversees City Parks and the
Johannesburg Zoo – and an infrastructure and services
portfolio with directorates responsible for energy, waste
and waste (CoJ, 2012).
60
land cover classes
URBAN: Buildings, industrial, residential, small holdings, new development, mines, quaries, streets, roadsMAN-MADE GREEN SPACE: School grounds, golf courses, sports and recreation, trees (non-natural), cultivated landNATURAL GREEN SPACE: Thicket, bushland, bush clumps, indigenous forest, shrublands, degraded natural vegetation, natural land surface
WATER: Rivers and wetlands
Figure 43. overview of land cover classes in Johannesburg
SECTION 3 Current government plans, visions and capabilities for green infrastructure
61
The STaTe of Green InfraSTrucTure In The Gcr
As a MoE, City Parks has a certain degree of independence in its
daily operations which focus more specifically on the
following:
• Planning, design and landscaping
• Park utilisation management
• Environmental conservation, including biodiversity
management and awareness
• Park, open space and cemetery maintenance
• Horticultural and arboriculture projects
• Bio-aquatic management
• Botanic research, monitoring and information sharing
• Conservation, rehabilitation and enhancement of
ecosystems
• Invader species control
• Infrastructural maintenance.
In parallel to this basket of activities, Johannesburg undertakes
a number of environmental education and community
participation programmes, such as Arbour Week, 200 000
Tree Planting Campaign, Extreme Park Makeover, Greening
Soweto and Outdoor Gyms. City Parks has a vision to be
Africa’s leading green environment and cemetery management
company. This vision is further informed by targets to reduce
ecological disparity and ideas of environmental justice, with
an explicit emphasis on ‘bridging the green divide’ and a
‘legacy of inequality separating the wealthy north from the
dusty south west’:
“… City Parks is committed to bridging the green divide between disadvantaged townships and the suburbs. It is responsible for providing inclusive open spaces and serves all the people of Joburg.”
“CITY Parks and Zoo receives an operational budget of R693 million. The R373.9 million capital budget of City Parks and the Zoo will go towards projects such
as new parks in Leratong, Poortjie, Orange Farm, Northern Farms – Diepsloot, Chiawelo and Road Islands;
the development of the Olifantsvlei cemetery, and R10 million for the establishment of new parking
facilities at the Zoo.” (JCP, 2013)
To the extent that City Parks is strongly inclined to the
creation, protection, maintenance and development of green
open spaces in previously disadvantages areas, it appears
that public investments in Johannesburg’s landscape are
largely driven as rights-based green space interventions.
Indeed, the provision of green space within Johannesburg’s
broader umbrella of ‘environmental management’ is very
much a matter of ‘redressing ecological deficiencies’ and
‘improving access to recreational space’. The provision of
green space for these particular purposes is largely linked to
whether communities were previously disadvantaged and the
trend towards ‘Eco-recreation’ within City Parks’ public parks-
style investments. These are manifesting in projects such
as the development of a park at Cosmo City (a multi-racial,
multi-income housing development) and park development
at Ivory Park and Zola Eco Park, two communities identified
in terms of their previous disadvantaged status. The following
2013 press release is also suggestive of an enlarged budget
for parks development in marginal areas.

62
SECTION 3 Current government plans, visions and capabilities for green infrastructure
While principally coordinated by City Parks, greening
initiatives in Johannesburg have also incorporated a number
of other agencies, brought on board to contribute both
financially and from an operational perspective:
“JCP works closely with various other agencies in ensuring the greening mandate is carried forward. Due to JCP’s reputation for innovative parks and beautification development, over the passt year JCP has been contracted to work with other government departments to aid and assist in developments outside of the CoJ. This includes the National Department of Water, Agriculture and Environment for the park development in Mthatha and the Provincial Department of Transport for the beautification of the R24 Albertina Sisulu Road from OR Tambo airport.” (CoJ JPC, 2009/10)
Such alliances also extend to private – and non-governmental
partnerships, which play a strong role in City Parks’ active tree
planting campaigns. For instance, despite internal budgets
for tree planting, a substantial number of City Parks projects
rely on conjoined efforts between the MoE and external
partners, such as the tree planting initiative with Citi Bank at
Orlando West Park, where 100 trees were planted to “address
disparities and for beautification purposes, and improving the
state of the environment” (CoJ JCP, 2009/10). Such projects
gained momentum in the run up to the 2010 Soccer World Cup,
which initiated a major drive to redress ecological disparity in
historically treeless areas through tree-planting schemes, but
with a definite intention of preparing Johannesburg to host
the international sporting event (CoJ JCP, 2009/10). In these
cases, a number of partnerships were formed between City
Parks, as a municipal agency, and private nurseries or growers
who contribute in kind by donating trees and seedlings, with
civil society or non-governmental organisations (NGOs)
also taking up ‘brokering’ role in these arrangements. It is
encouraging that these tree planting programmes also aim
to increase both the size and quality of indigenous habitats,
coupled with the conscious prioritisation for indigenous
planting in previously disadvantaged areas such as Mofolo
South, Orlando West, Orange Farm, Mapetla, Diepkloof,
Dlamini, Zola and Dobsonville (CoJ JCP, 2012).
Johannesburg’s efforts to conserve green spaces and
biodiversity are therefore underpinned by an explicit equity
rationale, with access appearing to be a key precondition and
determinant for green space planning generally. While goals
for the ‘protection of river eco-systems, water conservation
and protection of ecological reserves’ indicate a positive
ecological consciousness, there is a perhaps a stronger
campaign to improve access and beautify green spaces in
communities historically excluded from such investments. For
example, City Park’s suggested goal of “four hectares of open
space for every 1 000 people” (CoJ JCP, 2012) and to meet
international benchmarks of 2 hectares of quality public open
space per 1000 residents in dense urban settings is an explicit
social and aesthetic commitment in light of the somewhat
ambiguous reference to ‘open space’, which could be any
form of open, partly vegetated land.
The underlying orientation towards community-driven
planning is also supported through the City’s Capital
Investment Management System (CIMS), which prioritises
investment decisions and tracks the progress of projects
that have been approved for implementation. The variables
embedded in CIMs are based on the requirements of a given
population, particularly new developments to accommodate
for population growth, and the services and infrastructure
these developments require (CoJ JCP Official, pers. comm,
2013). Officials at City Parks reflect that CIMS is used to
determine priority greening projects for capital expenditure
with high priority projects being in previously disadvantages
communities (CoJ JCP Official, pers. comm, 2013). Officials
also reflect that this inclination is supported by mayoral
priorities and the City’s long-term development paradigm
through visions such as the Growth and Development Strategy
(GDS) and the Spatial Development Framework (SDF).
SoCCer City, naSreC, Soweto, 2013

63
The STaTe of Green InfraSTrucTure In The Gcr

64
SECTION 3 Current government plans, visions and capabilities for green infrastructure
Relevant strategic processesThe City of Johannesburg has interpreted a greening mandate through a number of ecologically progressive policies and
frameworks. Some of these are required in terms of national legislation, such as the Biodiversity Act, 2004 (Act 10 of 2004),
which stipulates that local and district municipalities are mandatory users of Bioregional Plans, which much align to Integrated
Development Plans (IDP)s and SDFs. In addition to these mandatory obligations, Johannesburg has developed some specific
policies and frameworks that encapsulate the framing of its greening mandate. The Joburg Metropolitan Open Space System
(JMOSS) was developed in 2002 with the view to address loss of green spaces, in response to the lack of a policy framework
to guide green space planning and management in the City (CoJ, 2002; CoJ Eagle, pers. comm, 2012). JMOSS is articulated
as providing a comprehensive policy framework and / or guidelines for the protection, management and optimisation of open
space areas within the City (CoJ, 2002). Significantly, JMOSS calls for the following:
“planning, development and management of green spaces can no longer be regarded as secondary to other local council functions.” (CoJ, 2002)
“[green space] requires recognition as an asset that requires careful management, and needs to be afforded a status by all citizens of Joburg that will lead to continued and productive use.” (CoJ, 2002)
JMOSS specifies three categories for green spaces in the city, namely primary, secondary and tertiary open spaces. Within these
categories sub-categories detail the features of different green spaces such as botanical gardens, water-bodies, nature reserves
and other related spaces (CoJ, 2002). However, a number of city officials have raised concerns about the accuracy and details
of this information, primarily due to deficient or irregular ground-truthing that took place during the development of JMOSS,
which was essentially a desktop study (CoJ JCP Official, pers comm, 2012; CoJ Eagle, pers. comm, 2012). Similar concerns
emerge in terms of the JMOSS policy objectives, which give overarching guidelines and principles but not the “specific criteria
to be applied to primary open space in order to determine the most appropriate management strategy and policy to give effect
to MOSS and its management” (CoJ JCP Official, pers. comm, 2013). This has resulted in numerous challenges where areas were
determined via the three-tiered categorisation process, yet with no specific criteria about how these should be developed,
supported or maintained (CoJ Eagle, pers. comm, 2012; CoJ JCP Letsoko, pers. comm, 2012).
Following these concerns, the City of Johannesburg convened
a second JMOSS policy in 2004, questioning the process and
methodologies followed for the initial JMOSS. The second
JMOSS policy sought to provide “more robust criteria and
principles for the identification of high value primary open
space, in line with broader legislative and policy frameworks,
and creating further proactive and reactive mechanisms
for the protection and management of open space” (CoJ,
2004b). The focus of the policy was the management of the
existing and desired primary open spaces through setting out
guidelines for how these spaces should be managed both in
terms of biodiversity conservation and ecological sensitivity
(CoJ, 2004b). However, the application of JMOSS II needs
to be treated with caution, since its policy proposals were
based on the same data – which lacked ground-truthing – that
informed JMOSS I (CoJ, 2004; CoJ Eagle, pers. comm, 2012;
CoJ JCP Letsoko, pers. comm, 2012; CoJ JCP Njingolo, pers.
comm, 2012).

65
The STaTe of Green InfraSTrucTure In The Gcr
The troubled JMOSS processes saw the City of Johannesburg
develop a Bioregional Plan (BRP) in 2011 with an expectation
that the plan will feed into broader planning and development
frameworks, and be streamlined with other planning tools
such as the Environmental Management Framework (EMF)
and Spatial Development Framework (CoJ, 2011). The
plan is seen as critical for informing “land-use planning,
environmental assessment and authorisations, and natural
resource management, by a range of sectors whose policies
and decisions impact on biodiversity” (CoJ, 2011). In theory,
the plan should provide guidelines for the conservation of
biodiversity and support for ecological areas in Johannesburg
given the high demand for “mining activity, industry,
commercial enterprise activities” in the City. Reporting
that approximately 36% of the City is in a natural or near
natural state and 48% of the city is reported to be built-up
or transformed for various urban functions (CoJ, 2011), the
Bioregional Plan set a mandate of mitigating further depletion
of natural environment and urbanisation pressures through
prioritising Critical Biodiversity Areas (CBAs) and Support
Ecological Areas (SEAs).
Current initiativesWhile not explicitly articulated as green infrastructure initiatives, various greening projects driven or facilitated by City Parks
are seeing investments in ecological assets. In terms of City Park’s key performance areas, for instance, the following targets
were cited for 2009/10 regarding protection of river eco-systems, water conservation and protections of ecological reserves:
1) The actual of 8 wetlands rehabilitated and improved exceeded the target of 5
2) The actual of 7 clean ups in terms of maintenance and control of reeds exceeded the target of 4
3) The actual of 383 ha of river trails cleaned / rehabilitated / maintained exceeded the target of 216 ha
4) The actual of 1 912 ha cleaned from alien vegetation exceeded the target of 1 402 ha
5) The actual of 96% of compliance with Environmental Management Standards (EMS) exceeded the target of 95% for the
2009/10 financial year.
Within these areas, the reference to the EMS indicates that City Parks takes cognizance of benchmarking, in addition to
Johannesburg-specific targets relating to wetlands and rivers. The EMS is the set of processes and practices developed by the
International Standard Organization (ISO) to guide control and improvement of an organization’s environment performance, the
current form of which is the ISO 14001 EMS (EMS, 2013).
While such targets represent a clear goal to address ecological degradation, a major thrust within City Parks is a set of
aesthetic greening initiatives prioritised for communities without access to ‘green space’. Current initiatives ranging from ‘park
beautification, maintenance and upgrades and tree planting’ have clear socio-spatial patterns, which is understandable in light of
the uneven spatial distribution of service delivery inherited from apartheid. For instance, many trees planted as part of greening
programmes are generally concentrated in Orange Farm, Soweto, Diepsloot, Vlakfontein and Jabavu as areas excluded during
historical en-masse tree-planting. For similar reasons, City Parks is undertaking a substantial number of new park developments
with the aim of offering public space opportunities in communities where these have been historically absent.
There are also beautification projects that are part of greening spaces adjacent to highways and main roads as well as the areas
surrounding large infrastructure projects such as Orlando Stadium. In effect, these projects work to beautify existing or newly

66
SECTION 3 Current government plans, visions and capabilities for green infrastructure
66 eleCtriC, red, eleCtriC – norwood, JaBavu, JaBavu, 2013

67
The STaTe of Green InfraSTrucTure In The Gcr
laid grey infrastructure through landscape design and installation. They are very much determined by the requirements for new
roads, stadia or utility networks rather than an explicit mandate to invest in a green infrastructure network for its own inherent
value. While the inclusion of landscaping plans and designs within City Park’s project specifications is valuable, these will not
necessarily amount to infrastructural connections if they occur in isolated cases, without clear plans to connect initiatives
through planned ecological corridors and linkages.
Outside of the greening activities undertaken by City Parks under the environmental portfolio of the Department of Environment
and Infrastructure Services, there has been some receptiveness to green infrastructure as an alternative strategy for storm water
management. For instance, the Johannesburg Roads Agency (JRA), which is responsible for roads and storm water management
in the City, received pilot training from SWITCH, an action-research programme, implemented and co-funded by the European
Union with a cross-disciplinary team of 33 partners from around the world, to instigate a shift from the logic of “getting rid of
storm water as quickly as possible” to “maintaining natural water balance” (SWITCH, 2010). This is through innovations relating
to Sustainable Urban Drainage Systems (SUDS), which embrace integrated water cycle management through harvesting and or
treatment of storm water and wastewater to supplement potable water supplies. Green infrastructure technologies that utilize,
enhance and/or mimic the natural hydrological cycle are key in this approach (Beecham & Fallahzadeh, 2011; Environment
Protection Agency (EPA), 2008). In this context, green infrastructure approaches are generally decentralized, small to medium-
scale infrastructures, including green roofs, trees and tree boxes, rain gardens, vegetated swales, pocket wetlands, infiltration
planters, porous and permeable pavements, vegetated median strips and reforestation/re-vegetation, as well as the protection
and enhancement of riparian buffers and floodplains (Younos, 2011).
However, it is yet to be seen whether the interventions facilitated through the SWITCH training have taken hold in Johannesburg
since most current projects, such as storm water infrastructure plans for Orange Farm, are premised on an engineering logic
of large, once-off investments in concrete conduits and channels that only have seasonal use (Schaffler, forthcoming). As a
JRA official reflects, “…although we know SUDs is the preferred approach, these still need to be verified in terms of budget
and if it incurs additional costs, we will continue to convert open channels and use underground pipes” (CoJ JRA Official,
pers. comm, 2012). So while alternative ways of managing storm water are being considered, and in fact are the only explicit
conceptualisations of green infrastructure, there are various challenges regarding the effective take-up of decentralised green
infrastructure practices. This is clear in further reflections from City officials:
“…on the other hand, the problem is that you have engineers who, in most cases, do not want to change and adapt to new ways of thinking about the engineering and design of for example, pavements.” (CoJ Official, pers. comm, 2012)
“Most traditional engineers think that if you use, for example, street swales or buffer strips for drainage, you then have a situation where you constantly have to maintain these and as a result incur more cost you would have avoided if you provided concrete paving.” (CoJ Official, pers. comm, 2012)
“…even the notion of implementing green roofs or gardens raises a lot of concerns. For those trees to grow, tons of soil will have to be loaded on the building roofs that were not initially designed for such mass. With rainfall, this mass will be even doubled. Now you can imagine the effect this will have on the building. So, to have such initiatives will require that more money is spent to ensure that we do not have buildings collapsing in the next few years.” (CoJ JRA Official, pers. comm, 2012)
“…our role is to ensure that the surface of the road gets dry as quickly as possible after rainfall. Now, I am not sure if having green servitudes will appropriately serve this purpose.” (CoJ JRA Official, pers. comm, 2012)

68
SECTION 3 Current government plans, visions and capabilities for green infrastructure
Perceptions of ecological assetsJust like any other rapidly growing city, Johannesburg is
faced with numerous development pressures, ranging from
housing, road infrastructure, employment, and the provision
of other basic services. A key challenge for Johannesburg
appears to be the processes and decision-making structures
that underpin development priorities. The redevelopment of
Huddle Park golf courses into a mixed-use facility captures
some of the challenge in land use decisions. Huddle Park
was originally envisaged as a housing development, and the
2002/03 proposal for development of low cost housing in the
eastern quadrant of the City sparked substantial frustration
by local communities. Critique came from communities who
used the area for recreational purposes and because of the
location of wetlands in the park:
“I still do not understand how they came to this decision. We personally had to fight them, the City, for this proposed development. It just seems as if they do not care about the environment, but collecting rates.” (Ward 73 Committee Member, pers. comm, 2012)
In 2007, the housing plans for Huddle Park were cancelled and
the area was reconceived as a mixed-use facility, incorporating
the existing golf course and an upmarket retail centre (CoJ,
2007). The current development, promoted as the “much
anticipated revival of Huddle Park” is called “New Huddle
Park Golf & Recreation” (Huddle Park, 2013) and is promoted
in terms of the various outdoor facilities offered, including
three golf course types, walking running and cycling, amongst
others. The morphing of Huddle Park into an upmarket
development highlights the tensions experienced in the initial
development application processes, and the extent to which
public interests are truly incorporated in developments that
may, in reality, not be readily accessible to a broader public.
Another key challenge relates to the mixing and/or
overlapping of responsibilities for the drafting of policies.
In the development of the Johannesburg Open Space
Framework (JOSF), City Parks assumed a leading role rather
than a supporting one. Interestingly, it is the department of
Environmental Planning and Management that assumed
a supportive role. As noted by one of the JCP officials “we
are the ones who developed the Johannesburg Open Space
Framework that guides planning and management of our
green assets today” (CoJ JCP Official, pers. comm, 2012). In
this instance, it is unclear how the responsibilities and functions
are shared between the city departments and MoEs. It is also
difficult to understand how City departments have evolved to
exercise their oversight functions. The JMOSS, for example,
was initially developed within an Environmental Planning
directorate that was part of a much larger department that
also included strategic planning and transport directorates.
This institutional organisation has undergone various
modifications, namely, a separate Environmental Planning and
Management unit, which has subsequently been merged with
an infrastructure directorate.
Concluding remarksIn Johannesburg, greening initiatives are often seen as means
to facilitate recreational opportunities and assist in redressing
historical ecological disparities. While these initiatives come
in a variety of forms, investments in tree planting, park
developments, maintenance and upgrades, and beautification
initiatives such as road islands, appear to be the most common.
In this respect, ‘greening’ seems to serve social development
objectives and it is not clear whether Johannesburg is making
a conscious synthesis of these ecological functions of greening
projects within the broader landscape. There are, however,
investments that embrace the role of indigenous vegetation
and the maintenance of natural ecological processes, but are
largely approached as conservation strategies rather than
broader infrastructure planning.
While there are progressive officials who promote green
infrastructure as an alternative strategy, these officials are
often challenged by a set of perceptions, planning cultures and
standard daily operations that stunt innovation. Obstacles exist
for officials and managers to articulate the benefits of green
infrastructure solutions when everyday operations continue
to provide for traditional concrete canals, gabions and steel
reinforcing to “deal with urban flooding”. At a daily operational
level, these practices, coupled with a cognitive and cultural
reluctance to abandon business as usual, is creating a situation
where officials are either sceptical or reluctant to entertain
alternative infrastructure options, with various officials
reflecting, without detailed evidence, that “green infrastructure
methods are expensive” (CoJ JRA Official, pers. comm, 2012).
The possibility of transforming current infrastructure practice,
in the case of storm water management, through a green
infrastructure philosophy is therefore met with a number of
difficulties when decision-makers are faced with shifting out of
a particular infrastructural trajectory.
In terms of what has already been done from a strategic
perspective, there are a number of policies and frameworks
that suggest substantial work has been undertaken under the
ambit of ‘green space planning’. There is a strong theoretical
foundation for green space planning, but it appears that
the City understands green assets in various ways as a
conservation mandate, as a means to address spatial disparity
and as beautification to accompany grey infrastructure. While
there are some indications that green infrastructure in the
true sense is understood, there has been limited realisation of
the concept in plans and practice.

69
The STaTe of Green InfraSTrucTure In The Gcr
Ekurhuleni Metropolitan Municipality
Ekurhuleni Metropolitan Municipality (EMM) represents the
fourth most populous of South Africa’s eight metropolitan
municipalities. The metro was established following the
amalgamation of nine cities and two other councils in 2000,
from what was historically known as the “East Rand”. EMM is
now home to 25,9% of Gauteng’s total population in an area
of 1 976 km2, and with 1 609 people per km2 is one of the
most densely populated areas in the country. Ekurhuleni is
a centre of heavy industry and manufacturing, and is often
referred to as “Africa’s workshop”, encompassing the largest
concentration of industrial activity in South Africa and sub-
Saharan Africa (Machaka and Roberts, 2004). It is also
regarded as the national transport hub, housing OR Tambo
International airport and links to extensive national and cross-
border roads and rail networks, converging with factories
and production facilities to fuel a strong manufacturing
and industrial sector that accounts for just less than 26% of
provincial GDP (National Treasury, 2009).
Ekurhuleni’s industrial base was created on the back of South
Africa’s mining industry, the legacy of which is now being felt
through a number of externalities. Degradation of natural
vegetation and vulnerable hydrological systems are posing
challenges in light of development pressures and an urge to
upscale industrial activities, such as future plans to become
an Aerotropolis (‘a new urban form placing airports in the
centre with cities growing around them, connecting workers,
suppliers, executives, and goods to the global marketplace’).
In light of these trends, it is encouraging to see various
progressive policies and frameworks supporting green assets
as well as a number of greening projects, although questions
remain regarding the coherence and integration thereof. Many
initiatives seem distinct in that they are isolated from critical
ecological and hydrological networks. What follows is a review
of how the value of ecological assets is being internalised
within EMM’s strategic processes and how these have come
to matter politically.
The landscapeWhile EMM is situated within a naturally occurring Grassland
Biome, transformation of the landscape has meant that only a
few areas of high quality grassland remain (EMM, 2009). In EMM,
there are 10 threatened ecosystems and at least 16 threatened
plant species while a large portion of the metro’s wetlands
and freshwater ecosystems are also critically endangered
(EMM, 2011a). According to the EMM Environmental Policy
(EMM, 2012a), development pressures have meant that just
over 36% of EMM remains in natural or near natural state while
64% of the metro has been transformed for agricultural, urban
and mining activities. In terms of future land uses, EMM is
viewed as an important agricultural resource with 41% of the
metro identified by the Gauteng Agricultural Potential Atlas
as important for protection of agricultural resources (EMM,
2012a).
EMM is also situated on a continental divide and local
watershed, which serves as the origin for various rivers and
hydrological systems. The EMM Environmental Policy of 2012
views the intricate network of rivers, wetlands and pans as the
single most important natural feature of the EMM, providing
the overall backbone for an open space system and the system
of biodiversity resources (EMM, 2012a). These resources
include a number of untransformed grasslands, such as the
Moist Cool Highveld and the Rocky Highveld; the proposed
Meyersdal Nature Area; and hydrological resources such as
the Natalspruit and wetlands, Swartspruit and Blesbokspruit
Ramsar Wetland, one of seventeen internationally significant
wetlands in South Africa, as well as various dams and pans
(EMM, 2012a, EMM, 2004).

70
SECTION 3 Current government plans, visions and capabilities for green infrastructure
Relevant strategic and policy processesEMM has a number of policies, frameworks and plans which
reflect the importance of ecological assets in development
outcomes. These commitments range from conservation-
style support, such as alien-clearing and protection of
wetland, to objectives of linking natural elements within open
space frameworks and the promotion of ecosystem services
for their potential socio-economic value. This signals progress
with regard to integrating the services of ecosystems into
development outcomes and it is significant that Ekurhuleni
is also undertaking a number of ‘greening’ processes in local
communities that are sometimes not publicised in high-level
development and spatial planning frameworks.
At a generic level, the 2055 Draft Growth and Development
Strategy (GDS) describes the future vision for Ekurhuleni, to
Grow and Sustain a Sustainable City. This vision is underpinned
by a number of sound ideas such as “sustainable natural
resource use; continuous improvement in air, water and soil
quality; decreased consumption of limited natural resources;
integrated sustainable agriculture; stable and protected
ecosystems; and; biodiversity and ecosystem protection in
light of current ecosystems degradation” (EMM 2012b). These
are supported by a number of strategic processes and policy
documents within EMM (Table 3), through which appeals are
made to:
• Avoid fragmentation of natural systems
• Protect the integrity of the primary open space network
• Enhance access to open spaces
• Endorse densification within the urban fabric
• Recognise ecological function when assessing
environmental impacts
• Quantify environmental goods and services in terms of
their economic value
• Integrate the open space system and conserve
biodiversity as an integral land use
• Use the open space network as a planning tool to contain
development, and in doing so, protecting the natural
environment and agricultural potential.

71
The STaTe of Green InfraSTrucTure In The Gcr
Ekurhuleni Biodiversity and Open Space
Strategy (EBOSS) (2009)
Meet open space needs of the population of Ekurhuleni in a way that will
ensure adequate access to a variety of types of open spaces in Ekurhuleni that
will fulfil the physical and psychological needs of the community;
Meet the national biodiversity targets for vegetation types in the area in an
appropriate manner that focuses on attainable on attainable priorities;
Consider and integrate the conservation plan needs of the province in a
practical way
Consider and take land needed for development into account in an objective
and equitable manner
Contribute as an integrated elements in the proper functioning of Ekurhuleni as
a city
EMM Environmental Policy (2012) Key natural resources are protected and conserved
EMM employees are aware of environmental matters and environmental
education initiatives are implemented
Environmental principles are embedded in Infrastructure and development
activities in EMM
Land, water and air pollution is prevented and reduced
Catchments are managed in an integrated manner
EMM is energy efficient and has adapted to climate change impacts
Sound environmental governance
Ekurhuleni Environmental Management
Framework (EMF) (2011)
The protection and conservation of areas that are sensitive from an ecological
and hydrological perspective
Protection and conservation of areas that have a high potential or value for
agriculture
Management of urban sprawl
Management of urban open space
Ekurhuleni Bioregional Plan (2011) Inform land-use planning, environmental assessment and authorisations,
and natural resource management, by a range of sectors whose policies and
decisions impact on biodiversity. This through providing a map of biodiversity
priority areas, referred to as Critical Biodiversity Areas and Ecological Support
Areas, with accompanying land use planning and decision-making guidelines.
table 3. relevant green space provisions and guidelines in emm strategic processes

72
SECTION 3 Current government plans, visions and capabilities for green infrastructure
Ekurhuleni’s articulation of ecological priorities is in relation
to matters such as ‘natural resources and system’, ‘open
space networks’, ‘biodiversity’ and ‘environmental goods
and services’. These priorities represent positive ambitions
for landscape-scale approaches to spatial planning. Indeed,
references within various documents to corridors and
connectivity (Box 2) show a conceptual recognition of the
need to create linkages between ecological features through
“linking primary and secondary open space networks” (EMM,
2012a) and “maintaining ecological support areas in functional
states” (EMM, 2011a). The main channel through which practical
provisions are made for these ideas to be implemented is the
Ekurhuleni Metropolitan Spatial Development Framework
(MSDF) (2011), the primary spatial planning tool through
which land use guidelines are applied. Significantly, the MSDF
(2011) stipulates the following terms for natural open space to
be integrated into the urban context:
“Protection of Open Space: The primary open space network, as identified and classified in EBOSS represents the minimum open space areas that needs to be retained from a biodiversity and ecological services perspective. The primary open space system must be included in the Ekurhuleni Spatial Development Framework as well as the detailed Local Spatial Development Frameworks. The primary open space network can in certain areas provide a natural barrier to contain urban development and can be used as a planning tool in determining the Urban Edge, especially in the Northern and Southern areas of Ekurhuleni. Further, the primary open space network further assists urban development in providing areas which are able to protect developed areas, by offering natural buffer zones for problems associated with natural disasters e.g. flooding.” (EMM, 2011b)
BOx 2
Corridors and connectivity: The high levels of development
in Gauteng have created very limited connectivity of
ecosystems. Gauteng is a key bottleneck to west-east
connectivity of ecosystems, which can impact on the
long-term survival of a range of species and ecosystems
in the context of on-going climate change. Maintaining
connectivity is critical for long-term persistence of
biodiversity in the face of on-going climate change, and
represents the major contribution to facilitating climate
change adaptation within the Gauteng Province and South
Africa as a whole. (EMM, 2011a)
Ecological Corridors: Ecological Corridors are passages of
natural habitats providing connectivity of different spaces
of habitats along or through which species may travel
without any impediments. (EMM, 2012a)
Encouragingly, these MSDF land use guidelines, which are
based on the principles endorsed by the metro’s Bioregional
Plan (2011) and the “fine scale planning” undertaken prior to
this for the Ekurhuleni Biodiversity and Open Space Strategy
(EBOSS) in 2009, are associated with targets in the metro’s
Integrated Development Plan (IDP) for 2011-2014. According
to the Ekurhuleni IDP, Budget & SDBIP for 2011/12 – 2013/14,
there is a 49 607 backlog of hectares to be protected and
conserved in the metro, with a 5 year target of 13 588 hectares
to be conserved. However, in the revised 2013-2106 IDP, the
total hectares of land with ecological value to be formally
protected has been revised down to 1000 hectares of land
with actual performance for the year 2012 reported as 100
hectares (EMM, 2013). The focus here is understandably
municipal protected and conserved land, the closest
association to which is the notion of ‘natural open space’,
prioritised and defined by the EBOSS in 2009 as “open
areas that still have a natural vegetation cover where there
is little human intervention and which is currently not utilised
intensively by humans” (EMM, 2009). It is important to note
that the connection of this idea into IDP processes does not
represent the total ambit of work the metro undertakes to
both conceptualise and invest in relevant ecological assets.
Those who work within EMM, such as Environmental Resource
Management officials, are also involved in more specific
activities that might not be captured in the high-level IDP
planning processes, but are still part of public investments
in the metro’s green landscape. By way of example, through
the Trees for Homes programme, the Greening of Ekurhuleni
project (2009) was initiated as an environmental programme
through a growing political conversation about the role of
greening for social outcomes:

73
The STaTe of Green InfraSTrucTure In The Gcr
“The Greening of Ekurhuleni Project 2009 aimed to deliver 7 860 trees to low cost housing units in Ekurhuleni. These trees will result in 2954 tons of carbon dioxide being sequestrated over the next 15 years. This also contributed to urban greening. The average low cost house is sited on 250m2. One hectare is equal to 10 000m. There are therefore 40 houses per hectare with one tree per household. 7 860 households x 250m2 = 1 965 000m2. It can therefore be said that through this project 196,5 hectares of urban forest have been planted. The delivery of trees and increased environmental awareness for beneficiaries is the primary output of the project.” (FTFA, 2009)
In many respects then, the EMM institutional landscape is
animated with progressive ideas about sustainable investment
in ‘land’, ‘open space’ and ‘natural systems’, and a number of
principles and guidelines are identified in planning documents
in support thereof. From a traditional ‘conservationist’ or
‘protectionist’ stance, it is encouraging that these guidelines
have found purchase within key development planning
targets.
Current initiativesTrees and tree-plantingIn EMM, there is a growing commitment to tree-planting,
with various initiatives signalling strong municipal investment
in trees as key activities for greening outputs. To an extent,
the emerging tree-planting movement has been steered by
a cognizance of the function and value of trees, and of their
value in providing services in light of Ekurhuleni’s industrial
and environmental context:
“Trees absorb the carbon dioxide released by industries and release oxygen, which is vital for human beings to breathe…Trees also prevent soil erosion by holding water during heavy rainstorms, thus keeping the land arable. Trees are regarded as windbreaks and rows were planted along the streets in an effort to guard against damage in the event of strong winds. We are not just pushing to be a city with the largest forest;
in the interest of generations to come we want to save the environment from the effects of climate change by promoting the preservation of trees and better understanding of the value of trees, especially indigenous trees,” she explained, adding that trees serve as a source of food, medicine, scenic beauty, building material and also play a vital role in the well-being of our communities.” (EMM, 2012d)
emmarentia, JohanneSBurg, 2013

74
SECTION 3 Current government plans, visions and capabilities for green infrastructure
A local newspaper, the Bedfordview Edenvale News (6 September 2012) reflected on this change in thinking, reporting that
“The Ekurhuleni Metropolitan Municipalities (EMM) area’s status as the manufacturing hub of the country is one of the reasons
that residents should take tree planting seriously’’. For instance, after the 2011 tornado in Duduza informal settlement, which
devastated over 150 homes and fatally injured a child, EMM collaborated with two other agencies, the Gauteng Department of
Agriculture and Rural Development (GDARD) and Rand Water, in planting 733 trees (both fruit and ornamental) and donating
a further 477 trees to schools and clinics in the area (GLGH, 2012). Although Ekurhuleni does not have data available on how
many trees there are in the municipal area, it is estimated that between 2008/09 – 2012/13 (1st Quarter) 71 851 trees were planted
which is an average of 14 000 trees a year. It is also telling of a growing public tree-planting culture that the EMM developed a
2007 by-law for the Planting, Pruning, Removal and Treatment of Street Trees within the municipal area, on council owned land
such as sidewalks (EMM, 2007).
Within EMM’s greening activities, a number of tree planting schemes seem to depend on collaborative efforts between the
metro itself, local communities, interest groups and in some cases, supported by funding from donor organisations. For
instance, the Greening of Ekurhuleni project is organized and facilitated through Food & Trees for Africa’s (FTFA), Trees for
Homes programme, a public greening initiative in low-income communities. FTFA is a non-profit civil society organisation and
conducted the greening initiative in Ekurhuleni through sponsorship from EMM which funded 21 569 trees since 2006. A further
7860 trees (both fruit and ornamental) were planted since 2009 as part of a fruit tree project called Carbon Offset Intervention,
funded by the Royal Danish Embassy and the South African national Urban Environmental Management Program (UEMP). FTFA
estimated that the planting of 7 860 trees will result in 2 966 tons of carbon dioxide sequestered over a 15 year period. It is also
significant that Community Based Educators (CBE) feature strongly in the collaboration efforts of such programmes, through
assisting with tree distribution to community homeowners, planting and education campaigns.

75
The STaTe of Green InfraSTrucTure In The Gcr
According to the ‘’Greening of Ekurhuleni, Trees for Homes,
Final report’’ (2009), the EMM is the first municipality in South
Africa to set aside a significant budget for a greening strategy
through Food & Trees for Africa’s (FTFA) Trees for Homes
programme. The Trees for Homes Programme’s focus is on
low cost housing developments with the following objectives:
• To contribute to greening, sustainable natural resource
management and food security
• To create an awareness of the benefits of environmental
upliftment activities amongst all communities of Southern
Africa
• To work in partnership with government, the private
sector and civil society
• To contribute to the design, implementation and
management of sustainable greening projects
• To alleviate poverty, develop skills and contribute food
security for the numerous communities that apply for
assistance.
Coupled recreation and rehabilitation?There are a number of activities relating to EMM’s Open Space Planning, Provisioning and Maintenance mandate that channel
investments into the metro’s ecological assets. Under this mandate, R 60,3 million was allocated to develop new and upgrade
existing recreational parks in Ekurhuleni for the 2012/13 financial year (EMM, 2012d). It is significant however, that park
development is also regarded as an opportunity for land rehabilitation. In 2012, EMM launched the Cleaner and Green Ekurhuleni
campaign which encourages communities to refrain from illegal dumping in open spaces through the promotion of these as
playgrounds or parks, and spaces to plant trees, and supported by up-scaling waste removal initiatives in informal settlements.
As part of what appears to be a rehabilitation initiative, an EMM-Mayoral flagship project titled the Rehabilitation and
beautification of lakes and dams has been launched to “elevate dams and lakes to a flagship status … and expedite the
development of such water resources for eco-recreational purposes” (EMM, 2012d). In this regard, EMM has entered into a
Memorandum of Understanding (MOU) with the South African Maritime Safety Authority (SMSA) with the view to encourage
and facilitate the development of inland waterways in the metro and to provide leadership and strategic direction to the boating
and tourism industries. According to SMSA (2012), Marine Tourism includes boating and cruising clusters (such as yachting,
cruising, ferrying and hospitality and entertainment) and encompasses recreation that includes marine activities such as diving,
swimming and sailing, leisure activities such as eco-marine tourism, real estate, adventure and viewing. SMSA also views inland
regions as having a high potential for marine-based tourism with inland dams and major rivers providing ecosystem services of
considerable economic benefit to communities.
The articulation of ‘hydrological rehabilitation and beautification’ through a marine tourism agenda is provocative given that the
Ekurhuleni State of Environment Report (2004) highlights widespread degradation of water resources as a key priority for the
metro (EMM, 2004). For instance, following a ground truthing exercise of data generated in 2005 through the Environmental
Management Framework (EMF), the EMM Wetlands Inventory Report (2007) reports that 13% of the wetlands captured on
this baseline data were destroyed or no longer exist. The EMM wetlands form part of an interconnected hydrological system
which includes lakes and the dams, with wetlands providing regulating ecosystem services such as flood attenuation, trapping
of sediments, and filtering of nutrients and toxins from the water. The health of the wetlands will affect the lakes and the dams
and the activities and developments of the lakes and the dams will also have an effect on the wetlands’ regulatory function. The
investment in ecosystem services as economic contributors may incentivise investment in protecting the urban hydrological
system, although this will also depend on whether marine tourism is managed effectively and sustainably. It is telling that
Ekurhuleni’s Environmental Policy (2012) expresses concern about the water resources (rivers, lakes and wetlands) which have
been severely affected by development. The increase in built-up and hard surfaces is causing pollution into water courses and
acute stormwater issues, aggravated by an inadequate storm water control system (such as retention ponds and pollution
control litter traps) to deal with these challenges.
In contrast to the marine tourism scheme, EMM undertakes various activities to ‘manage and protect valuable water resources’
(Ekurhuleni Environmental Policy, 2012). Priority wetlands have been selected as part of the national Working for Wetlands
programme, which is active in several quaternary catchments in EMM (SANBI, 2004). According to the EMM’s Department:
Environmental Resource Management, wetlands are the largest natural asset in the metro and form part of the hydrological
and open space system. Priority wetlands have been selected as part of the Wetland Rehabilitation Plan completed in June
2011, which prioritises wetlands for rehabilitation purposes. This plan is based on the Wetland Inventory Report Identification,

76
SECTION 3 Current government plans, visions and capabilities for green infrastructure
Classification, Assessment and Delineation of Wetlands within the Ekurhuleni Metropolitan Municipality (EMM) compiled in
2007 which mapped the extent, distribution and diversity of wetlands within the area and assessed their functions and values.
According to the South African State of Cities Report (SoCR) 2011: ‘’The two-year project cost just over R2.3 million, and
employed 45 previously unskilled workers in the construction of gabions and concrete structures to stabilise banks, block
erosion channels and retain sediment.’’ These projects, as stipulated by the SOCR (2011), were done to restore the wetlands so
as to purify the water for the municipality and encourage better flood protection. According to the council there is also a threat
of acid mine drainage which will have long term effects on the natural systems of the metro. This is addressed with ad hoc
interventions from the Department of Water Affairs, with special concern for the areas of Grootvlei and Germiston.
EMM identified several biodiversity projects as part of the EBOSS (2009) under the International Council for Local Environmental
Initiative (ICLEI)‘s Local Action for Biodiversity (LAB) initiative. These projects are regarded as catalyst projects that promote
a variety of issues with regards to biodiversity, which can be implemented in the EMM. Due to a lack of capacity (human
and financial), these projects cannot all be implemented
at the same time. The current focus, according to the
Department of Environmental Resource Management, is on
the implementation of the Leeupan Regional Park Project.
This involves rehabilitation of a wetland back to a functional
ecosystem, and the establishment of an environmental centre
that will provide environmental and recreation activities for
the surrounding communities including a cultural heritage
precinct commemorating the life of OR Tambo.
According to the State of the City Address (EMM, 2012e),
nine parks were upgraded as part of the clean and green
campaign and 8 387 trees planted across Ekurhuleni. Through
the planning of the Directorate of Parks and Cemeteries, most
of the major parks in the EMM are projected on master plans,
designed to accommodate implementation in phases over
several years, drawing from their annual capital budget which
could be in the region of R 50 – R 70 million. Parks development
focuses on new parks and the upgrading of existing parks
into more creative spaces, as well as encouraging physical
activity, such as in Trim Parks, which are parks that include
outdoor exercise apparatus. More provision is also made
to accommodate disabled people. Constraints in terms of
parks are that there is lack of proactive planning and many
departments still operate in silos. Parks are often allocated on
the left over land in town planning developments, and where
priority is given to parks, it is often through other flagship
initiavies, such as the ‘Rehabiliation and beautification of lakes
and dams’, a Mayoral flagship project.
Cut graSS, Southern SuBurBS, JohanneSBurg, 2013

77
The STaTe of Green InfraSTrucTure In The Gcr
Perceptions of ecological assets within EMMAlthough there is no overarching green infrastructure
strategy in place, there are various initiatives that promote
investment in Ekurhuleni’s ecological assets and indicate
a supportive conceptual environment for the role of these
in municipal planning and operations. From a biodiversity
and conservation perspective, there is a robust body of
conceptual work that outlines guidelines and principles
for the management of natural spaces and systems. This
work has been transmitted into the metro’s spatial planning
frameworks, such as the MSDF (2011), which seem to be
founded on thorough ecological principles, such as notions
of ‘corridors’ and ‘connectivity’. These concepts indicate a
progressive conversation within EMM’s planning circles about
the importance of linked-up natural system and emphasis is
placed on the importance of not fragmenting open space, but
rather promoting it as a continuous functional extent.
While there is a well-articulated conceptual architecture
relating to ecological issues, there is a more select focus
within integrated development planning. The reporting
indicator in the IDP relates specifically to protecting open
space under municipal jurisdiction. Yet once we are aware of
the full basket of activities under EMM’s operations, we see
that investments extend to a range of ecosystem services
such as air and microclimate regulation. Importantly, a range
of actors, including public officials, volunteers and interest
groups, jointly owns the visions underlying these investments.
This does not dilute the political importance of many greening initiatives – indeed various media briefings publicise this work –
but there is limited follow-through of localised projects, such as tree-planting initiatives, into mainstream performance reporting.
An emerging trend within EMM is also the allocation of value to natural systems in light of their potential for eco-tourism and
investment spin-offs. A view to capitalise on this ‘economic value-add’ may present a contrary perspective to the principles
endorsed by the planning documents of increasing conservation areas and using natural assets as buffers to guard development
against natural disasters. Although the policy and strategy arena within EMM appears to be progressive and drive an admirable
agenda, the strategic integration across different institutional mandates is not entirely clear. The main repository of support
appears to be spatial planning frameworks but these are somewhat disconnected from the articulation of wetlands and trees as
contributing to broader socio-economic values.
Cut graSS, Southern SuBurBS, JohanneSBurg, 2013

78
SECTION 3 Current government plans, visions and capabilities for green infrastructure
City of TshwaneIn terms of landmass, the City of Tshwane (CoT) is the single largest metropolitan municipality in the country and the third
largest city in the world, after New York and Tokyo. Following the merger of Tshwane with district municipality Metsweding
(which included Nokeng tsa Temane Local Municipality and Kungwini Local Municipality), Tshwane covers an area of 629 844
hectares or 6 298.4 km2, approximately 39% of the Gauteng province (CoT, 2012a). As boundary extensions present Tshwane
with choices regarding type of future development to facilitate, the recognition given to “open”and “green” spaces and various
conservation priorities as city mandates in multiple strategic processes signals a degree of commitment to protecting land in
light of development pressures and to investing in new green assets.
Our review of green infrastructure planning in Tshwane indicates that green asset priorities in the City extend from traditional
‘environmental’ protection initiatives, focusing on open space planning and nature conservation-style activities, to an active
interest in ornamental landscapes and horticultural projects. These different strategic aspirations are reflected in a diverse
institutional architecture, where a complex, multiform basket of functions is managed by various structures. To the extent
that this makes for a holistic view of green assets, Tshwane’s institutional schema may be reflective of the diversity of green
infrastructure, yet the critical question is whether sufficient connections are being made between green assets as components
of an integrated network across the City.
The landscapeTshwane is located between bushveld to the north of the City and Highveld grassland to the south, with the Magalies mountain
range forming a natural boundary between the two biomes (CoT, 2012a). According to the City’s Bioregional Plan (2011), Tshwane
has 15 ecosystems listed as threatened and 83% of wetlands and 58% of rivers also categorized as threatened (CoT, 2011).
In the 2005 Tshwane Open Space Framework (TOSF), land degradation is articulated as something related to the nature of
urban development in the metro, including sprawling low-density built form, fragmentation of land uses and encroachment of
informal settlements onto ‘sensitive open space resources’ (CoT, 2005a). The TOSF (2005) also describes Tshwane’s landscape
as one that is facing increasing pressure from urban development, but one that also contains substantial ‘open space’ in relation
to built-up municipal area and “exceptional natural features” such as ridges, wetlands, water source systems, a meteoritic
crater and ecological areas” (CoT, 2005a). These features have come under pressure from Tshwane’s growth as a metropolitan
municipality, often fragmenting natural assets. In the metro, land used for commercial, residential and infrastructural purposes
often intersects large segments of open space, although there have also been new investments in land that makes provision for
parks, golf courses, eco-estates and conservation areas.euCalypt, waterklooF ridge, tShwane, 2013 nurSery, die wilgerS, tShwane, 2013

79
The STaTe of Green InfraSTrucTure In The Gcr

80
SECTION 3 Current government plans, visions and capabilities for green infrastructure
According to the TOSF (2005), Tshwane’s landscape has
been greatly transformed by middle-income, sprawl-like
suburban development which in some parts of the metro,
such as the south-eastern periphery, has blanketed natural
ridges, canalised rivers and streams and carpeted expanses
of natural open grassland. The nature of this suburban
development is such that walled and ‘lifestyle’ estates have
privatised and fragmented many green spaces (TOSF, 2055),
with implications for how accessible these are to the broader
public. At the same, time, however, many private developments
are adjoined to large open spaces, some branding themselves
as green developments, while various residential settlements
are positioned in large open areas that intersect roads and
buildings.
Relevant institutional arrangementsOversight of natural and open space resources in Tshwane falls under the Environmental Management Division, which is grouped
together with Agriculture and Waste Management divisions as part of the metro’s Environmental Management Department. The
responsibility of the Environmental Management Division is to promote ecological integrity through the protection, utilization
and enhancement of natural and open space resources by integrating environmental considerations into the sustained
management and development of the City. The Environmental Management Division comprises four strategic branches:
i. Open Space Planning which includes the following subsections: Strategic Open Space Planning; Open Space Design and
Management; and Open Space Development Impact Management
ii. Environmental Policy and Resource Management of which the subsections are Environmental Policy, Programme and
Information Management; Environmental Audit, Risk and Management Systems Development Facilitation; Environmental
Education and Awareness Management; Air Quality; Climate Change and Sustainable Energy
iii. Parks, Horticulture and Cemetery Provision including Parks and Horticulture Services Provision Management; Cemetery
Services Provision Management; Urban Forestry, Nursery and Training Provision Management; and Parks, Horticulture
and Cemetery Services Technical Support
iv. Nature Conservation and Resorts Management which is broken down into Nature Conservation Management; Resorts
Operations Management; Swimming Pools Operations Management; and Nature Conservation, Resorts and Swimming
Pool Technical Support.
These four operational divisions reflect different departmental aspirations regarding how green assets are managed in Tshwane,
ranging from spatial planning directives to recreational and cosmetic investments in green spaces. While the convergence of
different objectives is via the overarching Environmental Management vision of promoting ecological integrity, the components
that constitute ‘natural and open space’ infrastructure are the direct responsibility of individual divisions and the officials
working therein. This unbundling of duties means that the status of green assets is determined by departmental interactions
since funding and implementation capacity spans a number of decision-making processes geared, in one way or another, to
oversee natural assets, ecological systems and greening initiatives.
view From waterklooF ridge looking north, tShwane, 2013

81
The STaTe of Green InfraSTrucTure In The Gcr
In what seems a proactive move, Tshwane’s Strategy for
Environmental Education and Training for Employees (2005)
identifies “green infrastructure” as part of the metro’s employee
training content and something that is also articulated as an
environmental management tool for Environmental Resource
Management. Yet there is no standard definition of what
green infrastructure means for Tshwane in available policy
documents, creating some ambiguity regarding how green
infrastructure is actually conceived at an operational level. The
most prominent framing appears to be within the Tshwane
Integrated Environmental Plan (2005), which regards open
spaces as areas with “ecological, infrastructural (servitude)
and recreational value” (CoT, 2005a). It is telling, however, that
an official within the Environmental Management Department
reflects that:
“Conservation in Tshwane is largely seen as biodiversity management, retaining natural areas in the City to be used as sustainably as possible and to avoid the degradation and fragmentation of nature areas.” (CoT Official, pers. comm, 2012)
Indeed, the proclamation of nature reserves in Tshwane, for
purposes of nature protection, restoration and conservation,
is a major thrust within the City’s ‘services’ profile. At the time
of writing, Tshwane has a total of thirteen nature reserves,
ten bird sanctuaries and thirteen nature-worthy conservation
areas, which include the Magaliesberg ridge and the rivers
within open space. Of this mix of nature areas, there are five
proclaimed nature reserved and a further three, Fairy Glen
Nature Reserve, Colbyn Valley Wetland and the Klapperkop
Nature Reserve are in the process of being proclaimed under
the National Environmental Management: Protected areas
Act 57 of 2003. Perhaps as a result of the priority given to
conservation, there appears to be a substantial amount
of media attention branding natural reserves as tourism
opportunities and in terms of their recreational benefits,
such as trail running and various outdoor activities. Further,
in terms of the Conservation of Agricultural Resources Act
(CARA), 1983 (Act No 43 of 1983), Tshwane received funding
via the Department of Water Affairs (DWA) to remove alien
vegetation.
It seems that a critical challenge for Tshwane is the fiscal
capacity to sustain investments in green assets. For
instance, although there is an increase in the area under
conservation management, due to the inclusion of Cullinan
and the Bronkhorstspruit in the Tshwane area, additional
responsibilities have not been accommodated through an
increase in the available budget (Tshwane Nature Conservation
and Resorts Management Official, pers. comm, 2013). This
flat budget presents an incredibly tight fiscal environment
to expand facilities in green and landscaped spaces, deliver
public education programmes and sustain maintenance of
tourism facilities in conservation areas. The repercussions for
Tshwane include massive skill deficits to mainstream natural
and green space investment since the City‘s conservation
department is operating on skeleton staff with an insufficient
operational budget (Tshwane Nature Conservation and
Resorts Management Official, pers. comm, 2013). Within this
environment, it is significant that nature reserves are seen
as key financial contributions to the City – R 6,5 million in
revenue for the 2011/12 financial year, through providing for
tourism and recreational activities. According to the Nature
Conservation and Resorts Management Division, Groenkloof
nature reserve generated the single largest income in this
regard during 2011/2012 with the most popular use being
daily hiking and mountain biking.
SpringBok park, tShwane, 2013 waterklooF ridge, tShwane, 2013

82
SECTION 3 Current government plans, visions and capabilities for green infrastructure
Relevant strategic processesThe most cogent recognition within Tshwane of the need to
plan for green assets appears to be the Proposed Tshwane
Open Space Framework (TOSF) (CoT, 2005a). The framework
takes its cue from the externalities associated with the City’s
development thus far, focusing on the fact that because open
spaces are undervalued, they often become the target for
development and are sold off at low prices. The TOSF (2005)
recommends that:
“…Open Space value should rather be based on the cost of restoring such space back to its natural state once it has been developed and/or based on cost-benefit analysis studies that consider and quantify not only Open Space’s development value, but also its social and ecological (environmental goods and services) functioning value…” (CoT, 2005a)
While there is no explicit articulation or definition of green
infrastructure within the TOSF, there are a number of
interesting proposals for how open spaces can be rethought
in terms of the functions they provide to society:
“Trees and other plants also play a critical role in improving air quality and ameliorating the increased heat created by urban development. They not only absorb ozone, carbon dioxide, sulphur dioxide, nitrogen dioxide and other noxious air pollutants, but remove dust and particles from the air and release oxygen. The transpiration of water by plants helps control and regulate humidity and temperature. A single tree can remove as much heat from the air as five average-sized air conditioners. Trees and vegetation also break the wind, moderating temperature in winter. The result is a decrease in energy consumption, along with its costs and associated pollution.
Parks in stream valleys or urban wetlands absorb storm water much more cheaply than in artificial systems. Large
Open Spaces allow rainwater to be absorbed slowly and to percolate into underground aquifers – reducing the danger of flash flooding or erosion due to rapid runoff.” (CoT, 2005)
The link between ecological benefits to social and economic
functions is a further theme within the proposed TOSF
(2005), which regards certain features, such as “healthy
aquatic food chains” as “indispensable for economies such as
the recreation, fishing and tourist industries” (CoT, 2005). It is
significant then that the proposed TOSF (2005), a conceptual
framing document, has as a key policy statement the
recommendation that open space must be viewed as a land
use and service of equal importance to any other land use
and service, and that the value of open space should not only
reflect market value, but should ultimately be an expression of
the benefit to present and future communities and not just to
those who buy property.
While the proposed TOSF (2005) reflects an alignment
between ecological and socio-economic issues in Tshwane’s
strategic discourse, the operational contribution is the
spatially-explicit Bioregional Plan for the City of Tshwane
(2011). Here a landscape-scale approach is related to strategic
planning. This plan sets out to:
‘’.... inform land-use planning, environmental assessment and authorisations and natural resource management, by a range of sectors whose policies and decisions impact on biodiversity. This is done by providing a map of biodiversity priority areas, referred to as Critical Biodiversity Areas and Ecological Support Areas, with accompanying land-use planning and decision-making guidelines.’’ (CoT, 2011)
The Bioregional Plan provides valuable spatial data on
ecosystems such as critical biodiversity hotspots, irreplaceable
areas and ecological support areas to accompany urban
development as well as options for biodiversity offsets
waterklooF ridge, tShwane, 2013
BOx 3
“A single tree can remove as much heat from the air as five
average-sized air conditioners. Trees and vegetation also
break the wind, moderating temperature in the winter.”
(CoT, 2005a)
‘’Due to the ecological (environmental goods and service)
and place making value of trees, trees and engineering
services must be regarded as service delivery imperatives.’’
(CoT, 2005a)

83
The STaTe of Green InfraSTrucTure In The Gcr
where development takes place. It is also encouraging that
the Bioregional Plan has been buttressed by data collection
studies such as the Report on Flooding in Tshwane (2006),
which captures wetlands in Tshwane, including those that
existed prior to boundary extensions and the exact position
of wetlands to establish conditions for current development
(CoT, 2011).
Tshwane has also begun strategizing for alternative
approaches to infrastructure provision and service delivery
through utilising various ecological principles and systems.
For instance, the Green Building Development Policy
(November, 2012) includes “mandatory” (must be complied
with) and “promoted” (may be complied with) green
building development standards and green infrastructure
techniques such as swales are framed as recommendations
for on-site storm water retention through sustainable urban
drainage systems (SUDS). However, other strategic initiatives
investigating ecological assets within Tshwane’s operations
have been less successful. The 2008 Strategy for Sustainable
Management of Plants for Traditional Medicinal Purposes in
Tshwane failed to receive management approval and, as a
result, is yet to be implemented, while the Integrated Water
Resource Protection Framework, dated 2006, has been halted
due to a lack of funds (CoT Van den Berg, pers. comm, 2012).
Such challenges reflect a broader challenge confronting
municipal decision-making and budgeting processes where
despite institutional enthusiasm for progressive ideas, the
financial and procedural demands of implementation may
complicate take-up.
Reading across Tshwane’s strategic processes, a common theme in various frameworks and policies is the role of trees in providing a number of functions to the City. The Proposed Tshwane Open Space Framework (TOSF) (2005), views trees
BOx 4
JaCaRaNDa POLICY:Until further notice no new Jacarandas will be planted to
comply with the Conservation of Agricultural Resources
Act (Act No. 43 of 1983)
If permission is granted by the National Department of
Agriculture, Jacarandas that have been lost due to natural
death, accidents, road widening etc. will be replaced with
Jacarandas to maintain the Jacaranda character of the
City. Preference will be given to the inner city and main
arterials leading into the city.
as important carbon sinks which absorb ozone, sulphur dioxide, nitrogen dioxide and other toxic air pollutants, and remove dust and particles from the air, in turn releasing oxygen, which improves air quality. Similar sentiments are expressed through the City’s approach to challenges such as climate change and air pollution, in relation to which the planting of trees is suggested as a means to reduce greenhouse gas emissions (CoT, 2012c). While such views provide a sound conceptual base regarding the multifunctional role of the City’s trees, the most tangible articulation thereof is through Tshwane’s Urban Forestry Policy (2003) which aims to encourage the planting of more trees in Tshwane and provides guidelines for the planting, maintenance and protection of trees (CoT, 2003). The policy’s focus on tree planting on road reserves and within the whole Metropolitan areas is motivated through the following:
• Trees are planted for the beautification of the city and
environmental upgrading of suburbia
• Trees are an asset in that they break and soften the hard
city landscape environment
• Trees play a very important role in giving life to the city
be revitalizing the air and reducing city noise levels
• Trees on road reserves influence both our biological and
physical urban environments and contribute to more
liveable urban spaces
• Trees reduce annual heating, supply city environments
with oxygen, reduce smog levels, absorb small particles
and gases of air pollution, absorb rain and thereby
reducing the amount of water to be removed by storm-
water drainage and increase property values.
Tshwane’s Urban Forestry Policy also includes detailed
guidelines that inform tree planting and maintenance in the
JaCaranda, tShwane, 2013
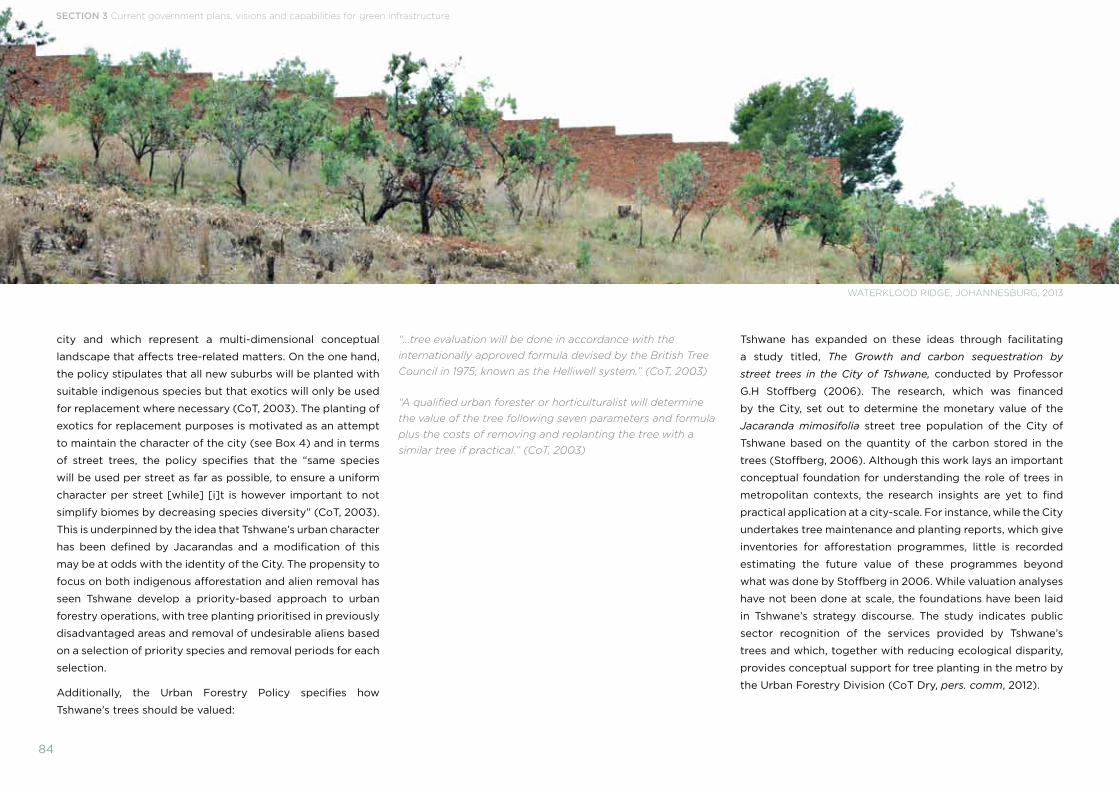
84
city and which represent a multi-dimensional conceptual
landscape that affects tree-related matters. On the one hand,
the policy stipulates that all new suburbs will be planted with
suitable indigenous species but that exotics will only be used
for replacement where necessary (CoT, 2003). The planting of
exotics for replacement purposes is motivated as an attempt
to maintain the character of the city (see Box 4) and in terms
of street trees, the policy specifies that the “same species
will be used per street as far as possible, to ensure a uniform
character per street [while] [i]t is however important to not
simplify biomes by decreasing species diversity” (CoT, 2003).
This is underpinned by the idea that Tshwane’s urban character
has been defined by Jacarandas and a modification of this
may be at odds with the identity of the City. The propensity to
focus on both indigenous afforestation and alien removal has
seen Tshwane develop a priority-based approach to urban
forestry operations, with tree planting prioritised in previously
disadvantaged areas and removal of undesirable aliens based
on a selection of priority species and removal periods for each
selection.
Additionally, the Urban Forestry Policy specifies how
Tshwane’s trees should be valued:
“…tree evaluation will be done in accordance with the internationally approved formula devised by the British Tree Council in 1975, known as the Helliwell system.” (CoT, 2003)
“A qualified urban forester or horticulturalist will determine the value of the tree following seven parameters and formula plus the costs of removing and replanting the tree with a similar tree if practical.” (CoT, 2003)
Tshwane has expanded on these ideas through facilitating
a study titled, The Growth and carbon sequestration by
street trees in the City of Tshwane, conducted by Professor
G.H Stoffberg (2006). The research, which was financed
by the City, set out to determine the monetary value of the
Jacaranda mimosifolia street tree population of the City of
Tshwane based on the quantity of the carbon stored in the
trees (Stoffberg, 2006). Although this work lays an important
conceptual foundation for understanding the role of trees in
metropolitan contexts, the research insights are yet to find
practical application at a city-scale. For instance, while the City
undertakes tree maintenance and planting reports, which give
inventories for afforestation programmes, little is recorded
estimating the future value of these programmes beyond
what was done by Stoffberg in 2006. While valuation analyses
have not been done at scale, the foundations have been laid
in Tshwane’s strategy discourse. The study indicates public
sector recognition of the services provided by Tshwane’s
trees and which, together with reducing ecological disparity,
provides conceptual support for tree planting in the metro by
the Urban Forestry Division (CoT Dry, pers. comm, 2012).
SECTION 3 Current government plans, visions and capabilities for green infrastructure
waterklood ridge, JohanneSBurg, 2013

85
The STaTe of Green InfraSTrucTure In The Gcr
Current initiativesIn Tshwane, there are various initiatives that may not be
explicitly articulated as “green infrastructure”, but are
nevertheless investments in the urban landscape. These range
from investigation into the workings of natural systems with a
view to informing later programmatic work through to active
tree planting and park development initiatives. This range
reflects the four different parts of Tshwane’s Environmental
Management Division.
The development and conservation of greenbelts and natural
assets in new and existing residential settlements is an initiative
of Tshwane’s Parks, Horticulture and Cemetery branch. The
initiative generally focuses on previously disadvantaged areas,
including Atteridgeville, Soshanguve and Ga Rankuwa and
includes the development of nurseries for seedling production,
forested nature areas, conservation areas and bird sanctuaries
and the rehabilitation of wetlands and bushveld. Many of these
projects are focused on school greening with the goals of
environmental education and to create environments within
schools that are conducive for learners, staff and residents
around the area (CoT, 2012c). Similar motivations drive
Tshwane’s Two Parks per Ward Programme which, in addition
to ensuring sufficient park infrastructure in all communities
to address backlogs thereof, is framed as an initiative with
environmental and social spin-offs such as reducing illegal
waste dumping on unmanaged land and improving human
health conditions (CoT, 2012c). This reflects that the social
benefits of trees, parks and conservation areas are filtering
into strategic processes within the City. It is also positive to
see conscious efforts to align greening programmes with
community needs through awareness-raising initiatives and
environmental education in schools.
Expansion of the urban forest is another major thrust within
the operations of Cemeteries, Parks and Horticultural Services and the City has a goal of 11 000 trees to be planted every year,
which includes 5000 fruit trees donated to needy communities
and 80% of trees to be planted in previously disadvantaged
areas (CoT Cemeteries, Parks and Horticultural Services
Official, pers. comm, 2012). In addition to the contribution of
tree planting programmes to previously disadvantaged areas,
the expansion of the urban forest is also developing Tshwane’s
information and knowledge bases about trees across the City.
According to an official within Urban Forestry, Nursery and
Training Services, there are currently 100 000 trees growing
in the City Nursery, which Tshwane utilises to propagate its
own trees (CoT Dry, pers. comm, 2012). Tree propagation also
happens according to a seven year cycle, which is based on
the experience of officials within Urban Forestry, Nursery and
Training Services that it takes seven years for an indigenous
tree to be mature enough to be planted on a road reserve
(CoT Dry, pers. comm, 2012). Therefore, while tree planting
activities in Tshwane are incentivised through broader goals
and motivations, such as the United Nation’s Environment
Program (UNEP)’s global Billion Tree Campaign, there is
important, more localised knowledge that informs the actual
process of urban forestry expansion, such as the suitability
of indigenous thorn trees for road islands and parks but not
for road reserves (CoT Cemeteries, Parks and Horticultural
Services Official, pers. comm, 2012).
In Tshwane, there are a range of activities articulated within
the format of Open Space Plans that exhibit a growing
awareness of different types of open spaces and the status
of these in terms of accessibility, connectivity, character,
development / ecological status and public perception of
different spaces (CoT, 2007). These plans are completed for
a specific area or suburb, such as the Local Open Space Plan
for Soshanguve, and represent engagement with open space
typologies at a very local level. The Local Open Space Plan for
Soshanguve (CoT, 2007) makes an important contribution by
identifying five typologies in Soshanguve including a green
network (such as ecological nodes as green nodes and ridge
systems as green-ways); a blue network (including wetlands
as blue nodes and natural watercourses as blue-ways); a grey
network (which include cemeteries and reservoirs as grey

86
SECTION 3 Current government plans, visions and capabilities for green infrastructure
nodes and railway lines as grey-ways); a brown network (including local parks as brown nodes and urban core streets as brown-
ways); and red networks (including recreational space as red nodes and local boulevards as red-ways). This categorisation is a
schema that Tshwane has developed to classify typologies of open space networks in local areas, or ‘zones’, in different areas of
the city (CoT, 2007). While the Soshanguve plan provides thorough scoping work to understand the nature of each open space
typology as well as details on implementing the local open space plan, it is essentially a planning document, undertaken by an
external contractor, to assist future implementation through guidelines and priority activities. It still requires official approval.
Furthermore, at general planning level, the Tshwane Growth and Development Strategy (GDS) 2055 (CoT, 2012b) articulates
sustainable agricultural development as an opportunity to unlock the full potential of land available in the City. A similar focus
came through the 2012 State of the City Address, which reported that:
“... the City has deployed four tractors and equipment in the two regions to cultivate maize on 150 hectares. Seeds and fertilisers were provided to the farmers through the Comprehensive Agricultural Support Programme. By the end of the second quarter of the 2011/12 financial year the City provided 1 454 agricultural starter packs to indigent households.”
Urban agriculture investments are principally taking the form of food gardens on council owned land and, according to the
Director of Agricultural Development Programmes, also on land around power lines and road reserves in order to preserve land
against encroachment and to turn them into productive open spaces (CoT Maine, pers. comm, 2012). There are also investments
by the City in rural agriculture development, through the sustainable agricultural village (SAV) programme, which are framed as
“a participatory approach to a sustainable rural development by providing an anchoring agricultural platform through provision
and transfer of infrastructure, technology and skills” (CoT, 2007). It is significant that the articulation of these programmes
is through the value-added benefits of agricultural investments and that, in addition to infrastructural investments, the SAV
methodology has a major focus on the incubation of new entrepreneurs and commercialization of enterprises for interface with
the agro-processing markets (CoT, 2007).
Finally, Tshwane is investing in sustainable urban drainage systems (SUDS) in specific areas around the City such as the Menlyn
Maine Precinct that has been modelled on the principles of water sensitive urban design (WSUD). Infrastructural solutions
include a bioswale on the median island in Aramist Road, which collects storm water runoff from the carriage way for infiltration
back into the soil to recharge groundwater; a stormwater attenuation point; rainwater harvesting tanks; and a green roof that
reduces the impact of stormwater runoff.
Perceptions of green infrastructureA number of positive foundations have been laid within
Tshwane’s strategic thinking about the role of natural
systems for broader economic and social development.
There is a particularly strong spatial planning foundation
in this regard, through the City’s Bioregional Plan which in
turn feeds information into the Environmental Management
Framework (EMF) and the Metropolitan Spatial Development
Framework (MSDF). There is however, room for improvement
since the EMF currently excludes region 5 and the newly
incorporated region 7, while some strategic documents,
such as the State of Environment Report (SOER) that was
completed in 2001/2002, may be due for revision. According
to officials, the key determinant affecting policy formulation
and development is the availability of budget. A number of
officials feel that the prioritisation of conservation policies
and strategies is hindered by limited budgets, which affects
the pace at which existing processes can be updated, in turn
congesting the operational activities across the City. One
official also noted that where funds are generated by certain
projects, such as nature reserves and other tourist-related
initiatives, these funds are not necessarily re-invested in the
development of reserves or other nature areas and are often
rather redirected to the coffers of City administration (CoT
Dry, pers. comm, 2012).
Yet there are also a number of strategic processes that have
been part of Tshwane’s institutional system for at least a
decade that remain relevant insofar as programmatic details on
greening activities may still be applicable for the foreseeable
future. The Tshwane Urban Forestry Policy (2003), for
instance, specifies details on tree afforestation, maintenance
and evaluation, a mechanism which also importantly draws
in Between waterklooF and waterklooF ridge 2013
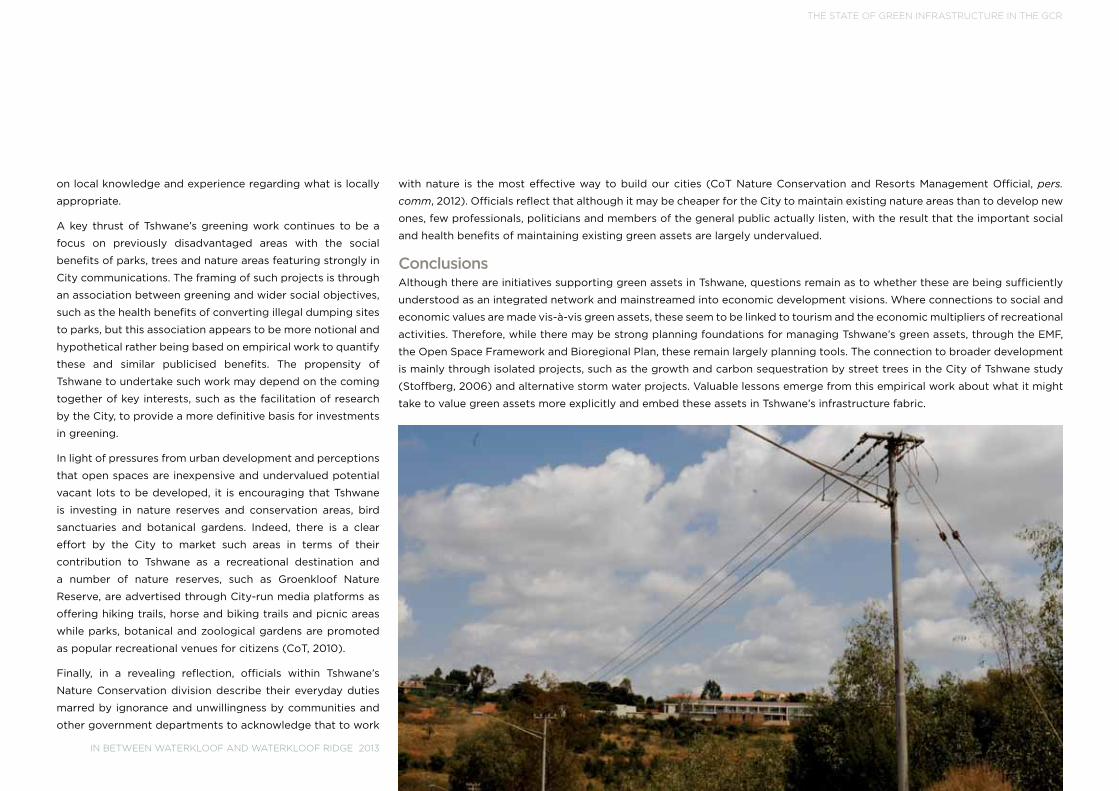
The STaTe of Green InfraSTrucTure In The Gcr
on local knowledge and experience regarding what is locally
appropriate.
A key thrust of Tshwane’s greening work continues to be a
focus on previously disadvantaged areas with the social
benefits of parks, trees and nature areas featuring strongly in
City communications. The framing of such projects is through
an association between greening and wider social objectives,
such as the health benefits of converting illegal dumping sites
to parks, but this association appears to be more notional and
hypothetical rather being based on empirical work to quantify
these and similar publicised benefits. The propensity of
Tshwane to undertake such work may depend on the coming
together of key interests, such as the facilitation of research
by the City, to provide a more definitive basis for investments
in greening.
In light of pressures from urban development and perceptions
that open spaces are inexpensive and undervalued potential
vacant lots to be developed, it is encouraging that Tshwane
is investing in nature reserves and conservation areas, bird
sanctuaries and botanical gardens. Indeed, there is a clear
effort by the City to market such areas in terms of their
contribution to Tshwane as a recreational destination and
a number of nature reserves, such as Groenkloof Nature
Reserve, are advertised through City-run media platforms as
offering hiking trails, horse and biking trails and picnic areas
while parks, botanical and zoological gardens are promoted
as popular recreational venues for citizens (CoT, 2010).
Finally, in a revealing reflection, officials within Tshwane’s
Nature Conservation division describe their everyday duties
marred by ignorance and unwillingness by communities and
other government departments to acknowledge that to work
with nature is the most effective way to build our cities (CoT Nature Conservation and Resorts Management Official, pers.
comm, 2012). Officials reflect that although it may be cheaper for the City to maintain existing nature areas than to develop new
ones, few professionals, politicians and members of the general public actually listen, with the result that the important social
and health benefits of maintaining existing green assets are largely undervalued.
ConclusionsAlthough there are initiatives supporting green assets in Tshwane, questions remain as to whether these are being sufficiently
understood as an integrated network and mainstreamed into economic development visions. Where connections to social and
economic values are made vis-à-vis green assets, these seem to be linked to tourism and the economic multipliers of recreational
activities. Therefore, while there may be strong planning foundations for managing Tshwane’s green assets, through the EMF,
the Open Space Framework and Bioregional Plan, these remain largely planning tools. The connection to broader development
is mainly through isolated projects, such as the growth and carbon sequestration by street trees in the City of Tshwane study
(Stoffberg, 2006) and alternative storm water projects. Valuable lessons emerge from this empirical work about what it might
take to value green assets more explicitly and embed these assets in Tshwane’s infrastructure fabric.
in Between waterklooF and waterklooF ridge 2013

88
SECTION 3 Current government plans, visions and capabilities for green infrastructure
Sedibeng District MunicipalitySedibeng District Municipality (SDM) is located on the
southern edge of Gauteng (Sedibeng 2012a) and includes the
local municipalities of Emfuleni, Lesedi and Midvaal. While the
following evaluation focuses on the ecological investments
by each local municipality, the individual green strategies
and operations undertaken by Emfuleni, Lesedi and Midvaal
need to be seen within the overall Sedibeng context, for
two reasons. First, the three municipalities together make
up a largely continuous and uniform ecological extent, with
transversal common features and challenges. Second, while
each local municipality’s plans and investments are unique,
and need to be examined separately, planning for District level
functions does bind local processes together to some degree.
The Sedibeng Department of Transport, Infrastructure and
Environment carries a set of functions broadly associated
with what could be understood to be an environmental
management remit. Its responsibilities range from sustainable
energy to air quality under the broad umbrella objective
of “A Clean and Green Sedibeng”. This framing provides
district-wide guidance for municipalities to invest in green
assets, albeit along lines that assume greening to be a largely
aesthetic or cosmetic investment. Within this, local municipal
plans provide a more focused articulation of the types of
green assets to be invested in such as urban agriculture, veld,
community gardens, street trees, and landscape design in
commercial developments, amongst others. In addition an
array of district-wide collaborative arrangements, organised
through a dynamic institutional architecture specific to
the Sedibeng context, support various cross-municipality
greening programmes.
Sedibeng: overall landscapeSedibeng covers an area of 4 185 km2 that extends along
a 120km axis on the entire southern area of the Gauteng
Province, (Sedibeng, 2009). The Spatial Devellopment
Framework states that:
“The area can be described as mostly agricultural/rural, especially in the eastern parts. The main urban areas are concentrated in the western part of the district, consisting of Vereeniging and Vanderbijlpark as well as the Evaton/Sebokeng residential complex to the north of it in Emfuleni. Lesser urban concentrations are found in Meyerton in Midvaal, and in Heidelberg/Ratanda in Lesedi.”
The largely rural character of Sedibeng is associated with low
population densities and a landscape characterised by towns
that are “far apart”. According to the municipality, this increases
the costs of delivering infrastructure to rural areas and is why
the bulk of municipal service provision is concentrated in the
urban parts of the district (Sedibeng, 2012a). The structure
of the landscape has been fundamentally shaped by the
district’s economy, with economic activity concentrated in
urban nodes, such as Vanderbijlpark and Vereengening, and
which are generally heavy / noxious industries associated
with steel and petro-chemicals (Sedibeng, 2012a). This has
created a landscape of rural areas connected into urban nodes
via highways and long transport routes and interspersed by
vast expanses of agricultural areas. Despite a largely rural
nature, 48% of the District has been identified as transformed,
categorised as agriculture (37%), urban (8%) and mining
(3%) (Sedibeng, 2012b), and indicates the extent to which
agricultural development has altered natural habitats. While
BOx 5
“Sedibeng is facing serious water pollution challenges
in river systems and water bodies, notably the Kliprivier
and Blesbokspruit which are polluted from runoffs from
industrial areas, townships and waste water treatment
works. The Kliprivier is one of the most polluted rivers in
the Sedibeng District as a result of mining and industrial
activities in the upper catchments, outside the borders of
Sedibeng.” (Sedibeng, 2009)

89
The STaTe of Green InfraSTrucTure In The Gcr
mining only represents 3% of Sedibeng as a whole, mining
and related industrial activity have had serious effects on
the landscape, particularly on the district’s hydrological
systems. The Draft Sedibeng Bioregional Plan (2012) states
that the district is seeing changes in water quality, through
inter alia, acid mine drainage and mining effluents, waste
water from treatment plants, fertilizer and pesticide runoff,
while catchment hardening and increased storm water flows
are affecting natural water flow regimes. This is a particularly
concerning in light of the 36 unique wetlands and 8 rivers
identified in Sedibeng by the National Freshwater Ecosystem
Priority Areas (NFEPA) (Nel, 2011). 94% of wetlands and 25%
of rivers in the District are listed as threatened (Sedibeng,
2012b). In addition to pressures on aquatic systems:
“There are at least 10 threatened plant species and 14 threatened animal species in the Sedibeng District, and 10 vegetation types are listed as threatened under the provisions of National Environmental Management Biodiversity Act (NEMBA), 2008.” (Sedibeng, 2012b)
Therefore, although Sedibeng contains significant green
spaces, such as rural and agricultural land, the quality of the
overall landscape is increasingly affected by agricultural,
industrial and mining-related activities. The critical challenges
of poor air quality and acute air pollution, particularly within
the Emfuleni and Midvaal Municipalities are illustrated by
the fact that the Vaal Triangle Airshed was declared as as
a first national priority area in terms section 18(1) of the Air
Quality Act (Act No. 39 of 2004) (Sedibeng, 2012a) indicates
the severity of the externalities associated with mining
and industry. While there are indirect links to the role of
Sedibeng’s ecological assets in mitigating this crisis – such as
references within the Gauteng Air Quality Management plan
to indigenous hedges and trees as pollutant absorbents –
many pollutants eventually return to ecosystems, entering soil
and water bodies, reducing plants’ ability to perform critical
functions, such as air purification, with serious implications for
the quality of the District’s landscape.
In light of the above, Sedibeng’s nature reserves and
conservation-related areas represent critical spaces of
untransformed land. For instance, the Suikerbosrand
Nature Reserve, on the north-eastern edge of Midvaal
Local Municipality, in the Suikerbosrand hills, is seen by the
municipality as a critical ecosystem but one that is under
threat from uncontrolled low cost informal housing (Sedibeng,
2012a).

90
SECTION 3 Current government plans, visions and capabilities for green infrastructure
Relevant institutional arrangements and strategic processesAs a District Municipality, Sedibeng provides an overarching
foundation for service delivery in local municipalities. District
municipalities coordinate district development strategies,
partially supply services to end users, and support local
municipalities in providing services. The municipality is
structured so that the Transport, Infrastructure and Environment
department facilitates general ‘environmental’ mandates,
such as air quality, green energy, climate change, and waste
exchanges, and on-the-ground activities and implementation
generally happening through the local municipalities.
Within this double-tiered system, the overarching strategic
processes administered by the District are the key procedural
channels through which Sedibeng coordinates district-wide
planning. As such, while implementation of services, such as
the provision of parks, may not necessarily happen as a direct
action of Sedibeng as a District Municipality, the District plans
and visioning strategies are crucial institutional corridors for
implementation, requiring coordination and a reflection of
local priorities.
Within Sedibeng, foundations have been laid within various
district level strategic processes to invest in the region’s
ecological assets. At a general level, the District’s Integrated
Development Plan (IDP) (2012/13 – 2016/17), promotes
sustainable environmental management in various ways.
These include restoration of degraded ecosystems; ensuring
sustainable land use management through the rehabilitation
of land to contribute to ecosystem resilience; improving
management to prevent deforestation; and protection of
indigenous forests to transfer these assets to appropriate
conservation agencies. Within the 2012/13 – 2016/17 IDP,
progressive calls are also made to promote the protection
of biodiversity through “valuing ecosystem services” and
for the “quantification of the value of ecosystems” as well
as “mechanism to reflect the value of biodiversity in national
resource accounts and facilitate the identification and
protection of high potential agricultural land” (Sedibeng,
BOx 6
For A Clean and Green Sedibeng, the following targets exist:
• A co-ordinated approach towards cleaniness and
greening related initiatives exists in the Sedibeng region
by end 2009
• Trees planted for every citizen living in Sedibeng by
2012
• All alien vegetation to be cleared from riverine and
protected areas in the Sedibeng Region by 2012
• Three projects in the Sedibeng Region to be used as
best practice examples for the “A Clean and Green
Sedibeng” focus area
2012a). Similar sentiments are expressed in the District’s
Growth and Development Strategy (GDS) (Sedibeng, 2011)
which sets out visions of:
“Reviving a sustainable environment from waste dumps to a green region, by increasing the focus on improving air, water, and soil quality and moving from being a producer and receiver of waste to a green city.”
“A region which makes the most of, and extends its wealth of open and green spaces, natural environments and waterways, realising their potential for improving the health, welfare and development of the people of Sedibeng.”
Within the overarching visions provided by the GDS and
IDPs, there are more specific green programme commitments
such as the Environmental Programme of Action (EPoA).
This makes explicit reference to the environmental services
provided by Sedibeng’s ecosystems and proposes a number
of objectives, targets and projects within following key focus
areas:
• Air quality
• Protection and Maintenance of the Region’s Natural
Assets and Ecosystems
• A Clean and Green Sedibeng
• Environmental Management in the Private Sector
• Waste Management
• Water Resource Management.
Through the above focus areas, the EPoA laid the foundation
for the Sedibeng’s GDS to take form and be implemented,
via “focus areas that can have large-scale impacts at district
level” (Sedibeng, 2007). Yet, in spite of positive propositions
within the EPoA (2007) (see Box 6), the extent to which these
are translated into action is unclear since there is little by way
of reporting and monitoring to assess the success of the
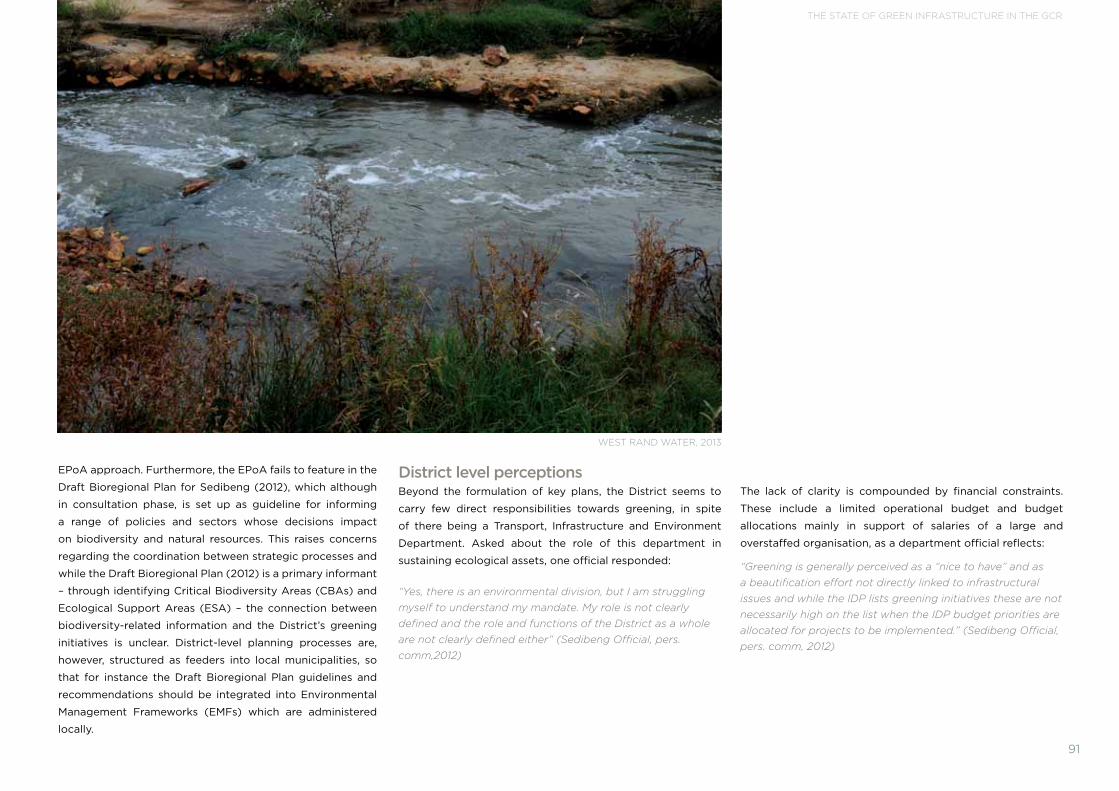
The STaTe of Green InfraSTrucTure In The Gcr
EPoA approach. Furthermore, the EPoA fails to feature in the
Draft Bioregional Plan for Sedibeng (2012), which although
in consultation phase, is set up as guideline for informing
a range of policies and sectors whose decisions impact
on biodiversity and natural resources. This raises concerns
regarding the coordination between strategic processes and
while the Draft Bioregional Plan (2012) is a primary informant
– through identifying Critical Biodiversity Areas (CBAs) and
Ecological Support Areas (ESA) – the connection between
biodiversity-related information and the District’s greening
initiatives is unclear. District-level planning processes are,
however, structured as feeders into local municipalities, so
that for instance the Draft Bioregional Plan guidelines and
recommendations should be integrated into Environmental
Management Frameworks (EMFs) which are administered
locally.
91
The lack of clarity is compounded by financial constraints.
These include a limited operational budget and budget
allocations mainly in support of salaries of a large and
overstaffed organisation, as a department official reflects:
“Greening is generally perceived as a “nice to have” and as a beautification effort not directly linked to infrastructural issues and while the IDP lists greening initiatives these are not necessarily high on the list when the IDP budget priorities are allocated for projects to be implemented.” (Sedibeng Official, pers. comm, 2012)
District level perceptionsBeyond the formulation of key plans, the District seems to
carry few direct responsibilities towards greening, in spite
of there being a Transport, Infrastructure and Environment
Department. Asked about the role of this department in
sustaining ecological assets, one official responded:
“Yes, there is an environmental division, but I am struggling myself to understand my mandate. My role is not clearly defined and the role and functions of the District as a whole are not clearly defined either” (Sedibeng Official, pers. comm,2012)
weSt rand water, 2013

92
SECTION 3 Current government plans, visions and capabilities for green infrastructure
Emfuleni Local Municipality (ELM)Of the three local municipalities in Sedibeng, Emfuleni has the largest population but covers the smallest area, approximately
987km2. Although Emfuleni also has a significant urban component, which concentrates residential, business and industrial
land uses, the municipality retains a largely rural character of which agricultural holdings and farmland represent the dominant
share (Emfuleni, 2012a). While the Vaal River is a defining feature within the municipality – Emfuleni in Sesotho, means “by the
water” and the Vaal forms the southern boundary of the municipality as well as the boundary between the Gauteng Province
and the Free State Province – Emfuleni has another dominant feature which has shaped the form of the landscape. This is the N1
freeway which divides Emfuleni into mostly rural, agricultural land to the west and mostly urban areas to the east of the freeway,
including areas such as Vanderbijlpark, Sebokeng and Sharpeville (Emfuleni, 2012a).
The landscapeEmfuleni’s relatively flat topography forms a number of
watersheds which in turn feed into the Klip River, the Rietspruit
and the Leeuspruit as well as the Vaal River (Emfuleni, 2012a),
which is the largest river running through Gauteng. Emfuleni
also features a number of “important sites”, such as the
Falcon Ridge, which contains a tributary of the Vaal River and
a mountain, and “irreplaceable sites” such as the Sharpeville
and Sedibeng Dams that provide habitats for animals and
serve as important recreational areas (Emfuleni, 2012a). Yet, in
the same way as water is an emblematic feature of Emfuleni’s
history, hydrological challenges are some of the most acute
ecological dilemmas facing the municipality. Challenges
include the pollution of water bodies by nearby sewer works,
development encroachment onto wetlands and flood lines,
and illegal excavations for storm water management that
result in wetland degradation (Emfuleni, 2012b). Hydrological
challenges are summarised in the SDF as follows:
‘’The conservation of the Emfuleni river system is also necessary for hazard avoidance. To this end, it is imperative that the natural drainage channels and banks of all the rivers within Emfuleni, as well as their tributaries, be protected up to the 100-year flood line. This will protect Emfuleni communities from flooding; while at the same time ensure the protection of the ecological status of the river embankments, which is necessary for flood management.’’ (Emfuleni, 2012a)
The clusters of wetlands and tributaries that run through
Emfuleni intersect various other naturally-occurring assets,
such as ridges and grasslands, which are in turn defined by
river courses and affected by any hydrological degradation.
The de-proclamation of certain sites, such as the Leeukuil
dam, raises concerns regarding the success of Emfuleni’s
administrative apparatus to manage issues such as illegal
dumping and ecological degradation. Indeed, according to the
Emfuleni’s Department of Environmental Management, Health
and Social Development (Emfuleni Official, pers comm, 2012),
pedeStrian CroSSing, telephone CaBle, JohanneSBurg, 2013

93
The STaTe of Green InfraSTrucTure In The Gcr
there are no existing conservation areas in the municipality,
except for a section of land at the North West University
Vaal Triangle Campus and the Mount Ridge Conservancy, a
privately owned farming area, which is in the process of being
proclaimed as a conversancy. Therefore, since water appears
to occupy a central position in Emfuleni’s municipal identity
and because negative environmental externalities from
industrial or economic activities are impacting on various
ecological networks, whether institutional and strategic
processes have been able to chart a coherent vision for
ecological investments is a critical question for making sense
of the municipality’s future outlook.
Relevant institutional arrangementsEmfuleni’s Environmental Management Department started
as an ad hoc section of the Department of Health and
consists of an Environmental Management section with
five environmental inspectors and a section dealing with
Environmental Health that employs twenty officers. Only one
person in this department is responsible for strategic planning
of the environment in the municipality. The department’s
current focus is on industrial impact management and the
regulation of pollution by industries. The Environmental
Programme of Action (EPoA) of the ELM, “Reviving Our
Environment” (2007), stipulates a key focus area as the
’’Protection and Maintenance of the Region’s Natural Assets
and Ecosystems’’. This is a large responsibility facing this fairly
young Environment Management Department.
Environmental management in Emfuleni is divided into the
Department of Waste and the Department of Parks and
Cemeteries, the latter occupying itself with tree planting and
the planning and maintenance of open spaces. The most
direct investment in ecological assets appears to be through
Parks and Cemeteries, via the Parks, Open Spaces and Grass
Cutting division, the mandate of which is:
• Provision of public open space
• Development and maintenance of the landscape
• Urban renewal of the Central Business District (CBD)
• Control of alien vegetation
• Conservation of environmentally sensitive areas
• Veld management
• Urban agriculture
• Environmental awareness raising
• Provision of outdoor adventure facilities and urban
greening (Emfuleni, 2012c).
The delivery of these mandates is faced with some pressing
fiscal difficulties. The operational budget for Parks, Open
Spaces and Grass Cutting, for instance, showed a decline of
24% between 2011/2 and 2012/3 (Emfuleni, 2012c), posing
both implementation and maintenance constraints in the
municipality. However, this does not appear to be a “parks-
specific” problem and a recent publication by the Parliamentary
Monitoring Group (2012) reported the following:
“Emfuleni said that the major challenge for the municipality was cash flow problems. Its budget had been exponentially increasing to four times the budget of ten years ago, due to increased service delivery demands. The budget for 2011/12 was R3.7bn and for 2012/13 was R4.5bn … There were challenges around the functionality of the billing of services … The deficit of 2010/11 was a result of the unbundling of fixed assets, depreciation, and interest payments on debt impairments. 76.29% of capital expenditure for 2011/12 had been spent, and council funded projects had been under-spent by R37.7m because funding had been impacted by the low revenue income. National grant expenditure stood at 96%, but an R18m restructuring grant had been withheld by Treasury. The municipality did not have a robust enough tariff model and therefore some services had been delivered at below cost. There were vacancies in critical areas because of the precarious cash flow problems…” (PMG, 2012)
It is telling of municipal budget pressures that a number
of private organisations, willing to fund the development
of parks and sidewalks, have entered into Pubic Private
Partnerships (PPP) with Emfuleni to achieve these ends. In
2011, a shopping complex entered into a voluntary partnership
with the Department of Parks and Cemeteries to undertake
horticultural development and maintenance of street islands
along Louis Trichardt Boulevard and in 2012 a local church in
the municipality offered assistance to Emfuleni to maintain
various parks in Vanderbijlpark, at no cost to the municipality.
While these agreements signal a degree of boldness on the
part of private institutions to address service delivery, there
remain institutional challenges that underlie Emfuleni’s
‘environmental politics’. As two municipal officials reflect:

94
SECTION 3 Current government plans, visions and capabilities for green infrastructure
‘’There is no political commitment towards the environment, priorities are bulk infrastructure such as road, storm water, waste water, electricity and water and the environment is not yet integrated with these.‘’ (Emfuleni Official, pers. comm, 2012)
“There are institutional coordination problems mainly due to the failure of a “green” committee to provide a platform for coordination between departments to lessen the impact on, and improve the management of, natural assets and secondly, because the Environmental Department is not seen as one with authority and thirdly, there is no integrated Environmental Management Strategy to incorporate all departments such as Waste and Air Quality Management.” (Emfuleni Official, pers. comm, 2012)
Grappling with institutional coordination and the priority of
social and economic concerns, seen as the core business of
the municipality, Emfuleni is faced with a situation where
the “environment” often struggles to be mainstreamed into
strategic decisions, which in turn often lack the necessary
environmental considerations and context. For instance, while
the termination by the Gauteng Department of Agriculture
and Rural Development (GDARD) of a municipal proposal to
build 54 RDP houses in a wetland is a positive intervention,
the initial proposal disregarded national environmental
legislation and has been a costly and time-consuming process
for the municipality (Emfuleni Official, pers. comm, 2012). This
is exacerbated by a lack of human resources and capacity
to stimulate proactive environmental planning and, critically,
the collection of up to date environmental data for decision-
making. It appears these factors result in disincentives to
mainstream environmental planning into strategic decisions,
which often lack the necessary environmental considerations
to protect the natural assets in the area.
Relevant strategic processesEmfuleni has various policies and strategic documents, which
provide support for the municipality’s ecosystems. These
include the District-level Sedibeng Bioregional Plan (2012),
the Sebokeng and Evaton Open Space Plan (2012) and the
Environmental Management Framework (EMF) (2002). At a
local level, the EMF does exist for the Local Vaal area but not
for the entire ELM. At the time of writing, the municipality was
in a process to approve the development of an EMF for the
entire municipal area, which will be funded from the Municipal
Infrastructure Grant (MIG).
According to the municipality, the open space network needs
to be incorporated into the EMF, which will eventually form
part of the Spatial Development Framework of the council.
Emfuleni does not have a State of Environment Report (SOER)
and therefore relies on the provincial SOER. The Sebokeng
and Evaton Open Space Plan (2012), which is set up to be
incorporated into the Integrated Development Planning (IDP)
and the local Spatial Development Framework (SDF), aims
to ensure that the resources that are contained in the open
spaces as well as the biodiversity and associated ecosystem
services, are protected and managed in a sustainable manner.
This plan is significant in that it is a localised proposal, i.e. in
the Sebokeng and Evaton areas, and contains a master plan
identifying different types of green, brown and grey networks,
as well as general management guidelines which address
issues such as requirements for wetlands rehabilitation,
food lots, and access to sensitive ecosystems, fencing, alien
vegetation, control access and tree lists.
The strategic commitment to ecological assets within Emfuleni
emerges in these and other planning and environmental
documents of the municipality such as the IDP and the SDF.
These documents describe the importance of ecosystem
goods and services as providers of life-giving functions
and the importance of maintaining, conserving, reviving
and rehabilitating these systems to protect their functions.
Furthermore, the Climate Change Toolkit for Emfuleni (SALGA
& GIZ, 2011) describes the value of the ecosystem functions to
the local community, such as recreational and social function,
and to the surrounding area in terms of attenuation, carbon
sequestration, reducing the heat island effect, purification of
water and air, provision of water and providing a connection
with nature. The Climate Change Toolkit offers a number of

95
The STaTe of Green InfraSTrucTure In The Gcr
normative proposals in light of these ecosystem functions
including inter alia:
• The rehabilitation of wetlands to preserve their function
of trapping sediments, controlling of floods and filtering
out toxins and excess nutrients and acting as carbon
stores, reducing greenhouse gases in the atmosphere
• The planting of more trees in the municipality to increase
the carbon sink capacity of the area, reduce a wide
range of pollutants in the air and provide an improved
microclimate through convection and evaporation
• Conservation and management of the natural drainage
channels and ecological system on the river banks for
managing flooding and storm water.
Additionally, there are offers to develop an inventory of all
wetlands in Emfuleni in collaboration with GDARD and
to specify how environmentally sensitive areas should be
conserved and incorporated into planning. In particular,
the SDF states that ecologically ‘Irreplaceable Sites’ and
‘Important Sites’ as stipulated by the GDARD C-Plan2 need
to be incorporated into the proposed open space network
of Emfuleni, through rivers and tributaries as corridors that
assist species migration within Emfuleni (Emfuleni, 2012a).
The IDP (2011/12) also proposes measures for addressing
environmentally sensitive areas through inter alia:
• conserving natural areas and to avoid developments near
riverfronts and floodplains
• combating dam and river pollution
• correcting conflicting land use by not allowing industries
in rural areas
• protecting red data species
• implementing a connected network of Open Spaces
throughout the area
• linking the natural areas (such as the Vaal River, other
wetlands and hills) (Emfuleni, 2011).
The current SDF for Emfuleni, which is based on data
from GDARD, indicates that green areas form a strong
well connected continuous open space network with little
fragmentation, and also indicates the position of parks and
areas of dolomite as a guide for development. The biggest
threat to open spaces is development encroachment as
there is no municipal-wide environmental data for proactive
decision making to manage this effectively and to motivate
against development. The other threats to open spaces and
wetlands are dumping and old sewer infrastructure as well as
poor storm water management which pollute and degrade
ecological systems.
96
SECTION 3 Current government plans, visions and capabilities for green infrastructure
Current initiativesThere are a number of initiatives administered by Emfuleni to invest in local green assets, including the development of parks, tree
planting initiatives, urban agriculture, identification of parks based on an open space plan, eradication of alien vegetation, audit
and verification of the open spaces and wetland rehabilitation. Although Emfuleni currently has 95 developed parks covering
470 hectares, 460 hectares have been identified as requiring upgrading, which in addition to 1070 hectares of undeveloped
open space, indicates a large portion of municipal-owned land exists as open space but which is either not formally managed
as parks or requires further investment (Emfuleni, 2012c).
In terms of tree planting, Emfuleni has sets a benchmark of 10 000 to be planted, 5 000 of which have been planted in the
Sebokeng township (ELM, 2012). This is part of a municipal objective to plant trees in every township street and extends to
fruit trees in private gardens, initiatives that are supported by widespread alien tree eradication in the municipality. Of the
32 hectares of alien vegetation earmarked for clearing in Emfuleni, 24 hectares are already cleared near the Klipriver, an area
anticipated to be developed into a bird sanctuary in collaboration with GDARD.
Other initiatives coordinated by Emfuleni’s Parks, Open Space and Grass Cutting division include a feasibility study to develop
open space in an environmentally sensitive area around the Sharpeville Dam; an Open Space Master Plan for Sebokeng and
Evaton; development of eleven parks (Bophelong, Beverley Hills, Adams Road, Evaton, Sebokeng Zone 6, Sebokeng Zone 11,
Three Rivers, Roshnee, Vereeniging Extension 1 and Sharpville); the rehabilitation of wetlands and the establishment of various
food gardens. The Parks, Open Space and Grass Cutting division also contributes towards addressing unemployed matriculated
youth of the Vaal by converting general worker vacancies into Student / Intern Horticulturists positions. Furthermore, the
national Buyisela (Eco-town) initiative, articulated as a project investing in ecological infrastructure, is being implemented in
Emfuleni and is seeing municipal-wide street cleaning, the creation of landscaped gateways as well as tree planting around the
municipality. Buyisela means giving back or restoring, and is part of a Greening and Cleaning Pilot Project, launched in October
2009, as an initiative by the Department of Environmental Affairs, the Department of Water Affairs, and other programmes to
create ten eco-towns based on sustainability principles.
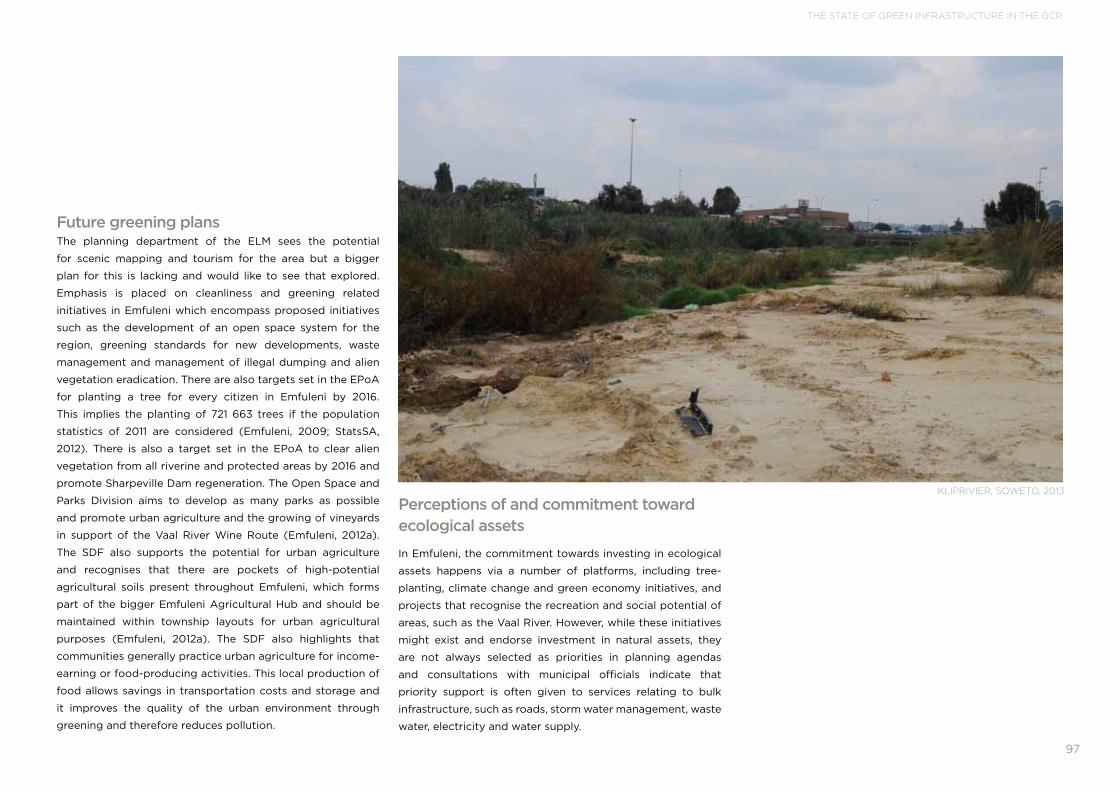
97
The STaTe of Green InfraSTrucTure In The Gcr
Future greening plansThe planning department of the ELM sees the potential
for scenic mapping and tourism for the area but a bigger
plan for this is lacking and would like to see that explored.
Emphasis is placed on cleanliness and greening related
initiatives in Emfuleni which encompass proposed initiatives
such as the development of an open space system for the
region, greening standards for new developments, waste
management and management of illegal dumping and alien
vegetation eradication. There are also targets set in the EPoA
for planting a tree for every citizen in Emfuleni by 2016.
This implies the planting of 721 663 trees if the population
statistics of 2011 are considered (Emfuleni, 2009; StatsSA,
2012). There is also a target set in the EPoA to clear alien
vegetation from all riverine and protected areas by 2016 and
promote Sharpeville Dam regeneration. The Open Space and
Parks Division aims to develop as many parks as possible
and promote urban agriculture and the growing of vineyards
in support of the Vaal River Wine Route (Emfuleni, 2012a).
The SDF also supports the potential for urban agriculture
and recognises that there are pockets of high-potential
agricultural soils present throughout Emfuleni, which forms
part of the bigger Emfuleni Agricultural Hub and should be
maintained within township layouts for urban agricultural
purposes (Emfuleni, 2012a). The SDF also highlights that
communities generally practice urban agriculture for income-
earning or food-producing activities. This local production of
food allows savings in transportation costs and storage and
it improves the quality of the urban environment through
greening and therefore reduces pollution.
Perceptions of and commitment toward ecological assets
In Emfuleni, the commitment towards investing in ecological
assets happens via a number of platforms, including tree-
planting, climate change and green economy initiatives, and
projects that recognise the recreation and social potential of
areas, such as the Vaal River. However, while these initiatives
might exist and endorse investment in natural assets, they
are not always selected as priorities in planning agendas
and consultations with municipal officials indicate that
priority support is often given to services relating to bulk
infrastructure, such as roads, storm water management, waste
water, electricity and water supply.
kliprivier, Soweto, 2013
98
SECTION 3 Current government plans, visions and capabilities for green infrastructure
According to an Emfuleni Town Planning official, there is also a
lack of understanding and appreciation of how natural assets
function. The official gives examples of wetlands stripped of
reeds for development purposes, undermining their natural
water purification and flood attenuation functions, and open
spaces used as illegal dumping sites. A major challenge
appears to be the fiscal capacity to maintain these assets,
which in turn creates incentives for the municipality to “sell
off” land for development. In this respect, while ecological
assets appear to be valued, they are valued according to
the development they facilitate, instead of the ecosystem
functions they provide:
“Due to a lack of education and awareness, undeveloped
open spaces are not valued according to the services that
they provide to the community and the entire ecosystem and
are often seen as potential for development” (ELM official,
pers. comm, 2012)
The same official also explains that because unemployment
is so high in Emfuleni, there is often conflict between
conservation and development and particularly in terms of
relatively short term social priorities and long term ecological
functions the outcomes of which sometimes only materialise
over the long term. These challenges signal that education
and awareness about ecosystem functions is critical, but
also more practical matters of reconciling budget priorities
within a limited political term of five years and the possible
replacement of councillors. Green infrastructure is often
understood as renewable energy, public transport and green
buildings (ELM official, pers. comm, 2012), and not necessarily
as assets of the natural system in and around the city.
Lesedi Local Municipality (LLM)According to its 2006 Environmental Management Framework
(2006), Lesedi Local Municipality (LLM) spans an area of
±1430km2 with open grassland plains, hills and outcrops
(Lesedi, 2010). The natural character of the area has mainly
been transformed by human settlement and agricultural
activities (Lesedi, 2006). Lesedi is mainly rural, dominated
by agricultural land of which 94% comprises large-scale
commercial farms (Lesedi, 2006).
The landscapeLesedi’s natural environment is characterised by a flat
topography causing poor drainage and results in various pans,
vleis and wetlands (Lesedi, 2006). This natural character of
the area contains valuable biodiversity-rich features including
natural primary grasslands, koppies, ridge and wooded
savannah areas, that contribute to a rich combination of
ecosystems and are valuable as potential outdoor recreation
and tourism opportunities (Lesedi, 2006). Other significant
environmental features in Lesedi include the Blesbokspruit
wetland, a RAMSAR site, the Alice Glöckner Reserve and
the Suikerbosrand natural reserve (Lesedi, 2006). The
Suikerbosrand Nature Reserve has been classified as a
biodiversity hotspot and the Alice Glöckner Nature Reserve,
a smaller nature reserve, has recently been rehabilitated
(Lesedi, 2006). The Alice Glöckner Nature Reserve contains
red data species, and various other noteworthy flora and
geological features. Both the Suikerbosrand Nature Reserve
and the Alice Glöckner Nature are managed by the province
through GDARD and are promoted in light of their eco-
tourism potential.

99
The STaTe of Green InfraSTrucTure In The Gcr
The integrity of this landscape is challenged by various urban,
industrial and mining-related activities. In particular, the
Blesbokspruit catchment’s hydrological functions are being
undermined by industrial and mining developments upstream
as well as riparian irrigation that affects the catchment’s base
flow and with implications downstream, in the Suikerbosrand
River and the Vaal River (Lesedi, 2006). Various strategic
documents also indicate that pressures on biodiversity and
ecosystem services are related to population pressures and
challenges arising from urban expansion challenges such
as increased sewage, water pollution, dumping of building
materials in natural areas and the externalities associated with
mining activities. Development has also taken place in many
grassland plains, reducing species diversity in the area, while
the extraction of sand along rivers and spruits is destroying
river and wetland habitats.
Relevant institutional arrangementsIn Lesedi Environmental Management is a unit within the
Department of Planning and Development that operates
alongside the Department of Service Delivery, which manages
waste and sanitation, and the Department of Community
Services through which Environmental Health operations
take place. Community Services also houses Lesedi’s “Parks
Section” that is responsible for the maintenance of parks and
open spaces, sidewalks, street trees, playgrounds, cemeteries
and municipal gardens, as well the eradication of alien
vegetation, weed control and locating and protecting ‘’Red
Data Species’’ in collaboration with GDARD. At the time of
writing, Lesedi was without a strategic environmental manager
and there were various operational and budgetary challenges
that appeared to affect environmental management.
Relevant strategic policy processesSeveral strategic documents integrate ecological assets into
Lesedi’s strategic vision as a municipality. Reading across the
Lesedi Local Municipality (LLM) IDP 2012/2016, the Lesedi
Environmental Management Framework (EMF) 2006, and the
Lesedi Local Municipality Spatial Development Framework
(SDF) 2010, the following emerge as positive visions for the
municipality:
• The importance of protecting the natural resource in
future planning to promote recreation and tourism
development
• Addressing the development of ecological corridors
connecting both natural (rivers, pans, dams, ridges) and
recreation activities with each other, forming a municipal
“…due to budget constraints, the Parks Section is not able to effectively maintain all parks and green
open spaces, and with the mushrooming of low cost housing developments, green open spaces, except
for those under power lines, are under pressure. So in order to save costs, we are making an effort to phase out intensive high maintenance gardens and develop
more low maintenance gardening…” (LLM Parks Section Official, 2012)
wide connected open space network) also linking up with
urban open spaces within the urban nodes) to enhance
specie protection
• The importance of providing open space throughout
urban areas to provide ‘’green lungs’’
• There should be no development taking place in
ecologically sensitive areas
• Self-sustaining development promoted in communities
• Raising awareness to inform farmers of the high value of
biodiversity habitats.
Of the strategic documents administered by Lesedi, the
Environmental Management Framework (Lesedi, 2006) is the

100
SECTION 3 Current government plans, visions and capabilities for green infrastructure
primary tool guiding the management of ecological assets as
it informs the management of environmentally sensitive areas
and provides information on environmental analyses (LLM
Official, pers. comm, 2012). Lesedi does not have a Bioregional
Plan and the municipality takes its cue from the overarching
vision provided in the district-level Sedibeng Bioregional Plan
of 2012. Although this approach allows for structure within
district level operations, there may be room for ecological
planning that is more nuanced and localised, and revisions of
information contained within the 2006 EMF. According to a
council official, for instance, “the council would value a more
locally specific bioregional plan drafted through consultation
and interaction with the various municipalities and which
should include ground truthing and not just be a desktop
study” (LLM Official, pers. comm, 2012).
Current and future initiativesRoll-out of “green” initiatives in Lesedi is closely aligned to local
economic support and a large portion of these are articulated
as “green economy projects”. Green economy projects are
however diverse, ranging from energy interventions and
sustainable manufacturing, to actual investments in ecological
assets such as food security and sustainable agriculture
projects (Lesedi, 2012). It is significant that many of Lesedi’s
green economy initiatives are collaborative projects between
the local municipality and provincial and national government,
which either provide fiscal support or assist in the operational
processes of project development. For instance, Lesedi’s
wetland rehabilitation project is a joint Expanded Public
Works Program (EPWP), SANBI and LLM initiative that aims
to create 35 jobs (LLM Official, pers. comm, 2012). While
projects removing alien vegetation are collaborations between
GDARD, LLM, Department of Environmental Affairs (DEA),
Department of Water Affairs (DWA) and the Department of
Public Works (DoPW), setting out to create 112 jobs (LLM
Official, pers. comm, 2012).
Various greening initiatives exist outside of Lesedi’s green
economy framing, such as the investments by LLM’s Parks
Division in tree planting projects and in the development of
parks and open spaces for beautification purposes. According
to Lesedi’s Parks Department, there are approximately 12 000
public trees in the municipality and Lesedi’s Parks Section
has planted 7 500 trees, including 6 000 in Heidelberg and
1500 in Ratanda, Impumelelo and Kwazenzele. In the 2011/12
financial year, the municipality also planted approximately
300 trees in Impumelelo & Kwazenzele, initiatives which were
supported through Lesedi’s municipal nursery where trees are
propagated, maintained and then distributed to schools and
other institutions.
The impressions of Lesedi officials is that the LLM Parks Section
operates within a limited budget and is largely dependent
on GDARD for most projects that have taken place thus far
(LLM Official, pers. comm, 2012). Lesedi relies on funds from
GDARD’s Bontle ke Botho or Clean and Green Campaign to
unlock potential new park developments in the municipality,
while most tree planting initiatives in the municipality rely on
donations from both provincial and district governments. In
2011/12, for instance, GDARD donated 250 indigenous trees
to Lesedi, and Sedibeng District Municipality supplied 300
indigenous and 50 fruit trees, which, together with other
external funding from provincial government to develop
community parks, provides the majority of support for
Lesedi’s greening initiatives.
101
The STaTe of Green InfraSTrucTure In The Gcr
Furthermore, various actions listed in LLM’s strategic
documents indicate a willingness to improve the management
of ecological assets in the municipality. For instance, the
IDP 2012/2016 states that a comprehensive Environmental
Management Plan (EMP) will be drawn up, with guidelines
and procedures for implementation, and the district-level SDF
indicates that Lesedi would have to upgrade infrastructure
such as waterborne sewerage systems to avoid raw sewerage
being released into natural watercourses and wetlands, which
is currently causing environmental and health challenges.
There are also initiatives planned within Lesedi’s green
economy projects, such as Beautification of Entrances for
Lesedi through planting trees and grass with an project
budget of R9 350 00, but which is yet to secure funding and
will depend on the lobbying efforts of the municipality to raise
funds (LLM Official, pers. comm, 2012).
Perceptions of ecological assets‘’Trees have also always been planted for aesthetical value as well as for shade and windbreak. Next to streams trees form greenbelts connecting various networks.” (LLM Official, pers. comm, 2012)
In Lesedi, while assets such as the Blesbokspruit Wetlands are
seen as “important environmental resources”, the outcomes
of ecological investments are generally articulated in terms of
broader social and economic objectives such as the cosmetic,
tourism and local economic development spin-offs that
result from investing in “the environment” (LLM Official, pers.
comm, 2012). However, according to the Lesedi Parks officials,
greening initiatives are significantly challenged by community
perceptions of the value of ecological investments. There have
been many cases of tree vandalism in communities and many
trees have been obstructed and destroyed, prohibiting trees
from maturing. In their experience, Lesedi officials also note
that young trees also get eaten by sheep, cows and goats that
roam freely and unattended, while some homeowners believe
that trees create concealed areas for criminals and that tree
leaves create untidy spaces that attracts insects (LLM Official,
pers. comm, 2012). As a result, Lesedi no longer plants trees
in front of households without residents’ approval and careful
consultation is now undertaken to determine the suitability of
each tree and to establish residents’ willingness to contribute
to tree maintenance (LLM Official, pers. comm, 2012).
In addition, there are institutional challenges that undermine
a progressive ecological mandate within Lesedi, with limited
funds and human resources being the major obstacles:
“It would require leadership to provide administrative and political direction in terms of a sustainable environment, which will enable human and budget resources to be allocated accordingly. In order to ensure successful investment in ecosystems services, knowledge and data on green infrastructure is required for officials and decision makers, and awareness is crucial for the general public. Green infrastructure would have to be valued in the same manner as other important services provided by the Council such as roads, water and electricity.’’ (LLM official, pers. comm, 2013)

102
SECTION 3 Current government plans, visions and capabilities for green infrastructure
Midvaal Local Municipality (MLM)Midvaal is the southernmost municipality in Gauteng and is predominantly rural in character comprising largely agricultural land
(Midvaal, 2007). Midvaal constitutes 10,3% of the total Sedibeng population and 0,8% of the Gauteng population (Midvaal, 2007).
In addition to extensive farming, representing approximately 50% of Midvaal’s land use, the municipality includes significant
natural features, notably the Suikerbosrand Nature Reserve and the Vaal River, as well as the Suikerbosrand River and the Klip
River (Midvaal, 2011: Midvaal, May 2012). Being largely rural, urban land use in Midvaal is concentrated in agricultural and farming
areas such as Meyerton, Walkerville, De Deur and Henley-on-Klip, and aside from industrial and commercial industries clustered
along main transport routes, agricultural holdings occupy large parts of the Midvaal area (Midvaal, 2007).
Midvaal’s landscape is confronted by a number of development pressures, particularly along the R59 freeway and along main
river areas, where uncontrolled sprawl of low cost informal housing is endangering grasslands and is fast approaching protected
areas such as the Suikerbosrand Nature Reserve (Midvaal, 2012). In addition, the absence of formal waste disposal and the
occurrence of illegal dumping in informal settlements are resulting in ground and surface water pollution, which together with
pollutants from agricultural production, is impacting on the quality of land available in Midvaal (Midvaal, 2012).
Relevant institutional arrangements and strategic processesWhile many of Midvaal’s planning processes take their cue from various district and provincial processes, such as the Sedibeng
State of Environment Report (SoER) and the GDARD C-Plan, environmental management in Midvaal is a unique assembly of
officials in the Department of Development and Planning and the Department of Social Services, the latter of which is primarily
responsible for ecological investments. The Department of Social Services undertakes the following activities:
• implement pollution control strategies
• conservation of natural resources
• environmental awareness
• contribute towards sustainable urban and rural development
• grass and tree cutting
103
The STaTe of Green InfraSTrucTure In The Gcr
Supporting these functions, there are a number of strategic
documents that govern environmental management in
Midvaal. These documents include the Environmental
Management Framework (Midvaal, 2007), the Midvaal
Integrated Development Plan (IDP) (2012-2016) for 2012-
2013, Midvaal Density Policy (2011), Midvaal Local Municipality
Public Open Spaces By-Laws and Strategic Environmental
Plan (SEMP) included in the IDP (Midvaal, 2012). While these
frameworks, plans and policies guide land use management
and planning and provide a legislative context for public
open spaces and conservation mandates, there are also
contradictory articulations of the role of ecological assets in
relation to broader development, with natural features seen
as both development constraints and part of the Municipal
Open Space System to be protected. According to Midvaal’s
2012/13 IDP:
“The most significant constraints for development identified in the Midvaal area in terms of the Midvaal SEMP (Strategic Environmental Management Plan) include the following:
• The occurrence of Nature Reserves, specifically the Suikerbosrand Nature Reserve;
• Significant natural open space connectors;
• Several established conservancies in the area;
• The occurrence of Category I and Category II Ridges;
• Occurrence of large areas of medium and high potential agricultural land;
• Potential pollution sources from local and regional industrial activities, waste facilities, mining
• Activities and irrigation agriculture;
• Constraints to development due to the position of the urban edge; and
• Development activities in the Vaal Dam Area.
There are clear indications from all sectors in the study area that there is a significant demand for development land, especially along the R59 freeway and the southern part of the study area, at the Vaal Dam, lying in an area bound by the R54 and R549.” (Midvaal, 2012)
To an extent, this ambiguity is addressed in Midvaal’s
Environmental Management Framework (Midvaal, 2008),
which was developed to provide information on
environmental features and natural resources and guidelines
on the Municipal Open Space System in relation to proposed
developments. The framing of natural resources as constraints
to development pressures may therefore indicate a deeper
set of issues faced by Midvaal where residential development
may address short term housing needs but at the expense
of existing natural resources so that a critical consideration
is the nature of future development paths. Indeed, the focus
on higher density urban land use, as articulated in Midvaal’s
SDF may curb sprawling settlements and retain the “lungs of
the city” identified in the IDP as elements that improve the
quality of life of residents (Midvaal, 2012). Generally, the IDP
lays a sound foundation for strategic ecological investments,
through calls for the establishment of a Midvaal Biosphere
to protect and enhance natural assets, and to promote
landscaping in new developments to combat soil erosion
and airborne dust (Midvaal, 2012). Such calls intimate the
beginnings of a strategic vision that speaks to both natural
asset conservation and the functional benefits of greening
investments, a key motivation of which is to ensure that poor
communities are less vulnerable to ecological disturbances.

104
SECTION 3 Current government plans, visions and capabilities for green infrastructure
Current InitiativesIn Midvaal, investments in ecological assets straddle
a continuum of greening ranging from cosmetic or
beautification initiatives to projects that address community
services and safety. For instance, Midvaal undertook major
tree planting initiatives in line with national greening efforts
that accompanied the FIFA Soccer World Cup and in response
to various national projects such as The Adopt a Tree
Campaign. According to media reports, this campaign saw
500 trees planted during 2012 and 300 trees were planted
for Arbour day 2012 in Sicelo Primary School, Lakeside
park, Meyerton sports grounds and Verwoerd Street. The
Midvaal Parks Departments also made 1000 indigenous trees
available for collection by residents for planting during 2012.
While these investments have a definite aesthetic character,
tree planting schemes are also motivated to “promote a
greener environment”, as investments in cleaning the air and
environment:
‘’When we look at the sky here it is brown and dirty, so we need to plant trees that can suck in the dirt and make oxygen so that you and I can breathe in cleaner air’.’
‘’There are four trees required per person to combat their or his/her impact on the environment.’’ (Executive Mayor, Timothy Nast, Triangle Courier, 2012)
sports (Midvaal, 2012). The Midvaal EMF (2007) also proposes
protecting the Suikerbosrand Nature Reserve from negative
external drivers of change via a one kilometre wide buffer
zone of low intensity and compatible land use.
Midvaal is also the base of the Gauteng Conservancy
Association (GCA) formed in 2003 to promote conservation
on private property in Gauteng and to give “teeth” to efforts
to protect Gauteng’s fast-disappearing greenbelt areas
(Midvaal, 2012). The GCA is another example of independent
organizations assisting government to manage illegal mining
activities, dumping of refuse, overgrazing, veldfires, game
poaching, ill-planned golfing estates, theft of plants and
rocks, tree-cutting, alien vegetation, amongst others (Midvaal,
2012). It is significant that this community-driven initiative
received the Mail and Guardian Greening the Future Merit
Award for Environmental Best Practice in the Not-for-Profit
Organization Category in 2005 and received the NACSA
Aardvark Gold Award for best environmental practice in a
province in South Africa in 2006.
Finally, according to the Midvaal Town Planning Department
(Midvaal Official, pers. comm, 2012), the municipality’s large
expanse of land is viewed as an opportunity for attracting
large scale investments to the area such as Savanna City. This
is a development of 18 000 houses, which although designed
Recipients of Midvaal’s tree planting schemes are generally
previously disadvantaged schools and communities, to whom
the Department of Safety, Heath and Environment and the
Midvaal Mayoral Office donate trees, with a particular focus
on indigenous and fruit-bearing trees, the latter used in
supporting community vegetable gardens (Triangle Courier,
2012). To garner financial support for community greening,
Midvaal is also experimenting with innovative institutional
arrangements such as those created via the Adopt a Park
initiative whereby large firms can fund parks in return for
tax deductions (Midvaal official, pers. comm, 2012). This kind
of collaboration is an indication of institutional openness to
overcome obstacles to community greening.
In addition to greening initiatives through tree planting and
park developments, Midvaal promotes natural asset protection
as a foundation for tourism and related economic spin-offs.
Municipal support for the tourism opportunities offered by
the topography and vegetation of Midvaal focus on the area’s
four major tourism features: the Vaal Marina precinct located
around the Vaal Dam, the Suikerbosrand Nature Reserve, Klip
River and specifically the Henley-on-Klip area and it’s extensive
ridges. These assets are viewed as potential opportunities to
expand the range of tourism facilities to include the mountain
biking routes, hiking trails, game farming, and other adventure

105
The STaTe of Green InfraSTrucTure In The Gcr
according to green building or sustainable housing principles,
and to facilitate developers to obtain carbon credits, may
undermine policy talk to conserve natural assets and retain
‘natural open space connectors’. The Sicelo RDP housing
project, for example, is based on green building principles,
which includes rainwater harvesting and landscaping design
sponsored by GDARD. Also proposed is a pre-proclamation
Urban Management Framework (UMF) for the management
of open space management and wetlands and 1000 trees to
be donated by the Social Services Department and various
fruit tree donations from the Mayor.
Perceptions of ecological assetsMidvaal’s ecological assets benefit from strong political commitment through the Mayor who personally takes an interest
in greening. This is coupled with a supportive policy landscape, which provides incentives to align development with
ecological investments, and institutional receptiveness to overcome budget difficulties through collaborative partnerships.
Positive examples of these include developments in the north-west of Midvaal such as Walkerville and Henley-on-Klip where
developments are not in favour of any tourism-related activities and exhibit strong sentiments to retain pristine natural assets
(Midvaal Official, pers. comm, 2012).
Midvaal’s strategic discussions are also beginning to emphasise the important of ecological assets in providing services such
as carbon sequestration values and noise and airborne dust buffering. However, according to Midvaal’s Department of Health,
there remain challenges in terms of sustaining trees:
“Trees are distributed as part of the upliftment of the environment and communities are excited about getting a tree for free. Fruit trees is more practical, but also more expensive and complex to maintain.” (Midvaal Official, pers. comm, 2012)
With municipal initiatives supporting ecological assets, it is important not to lose sight of the social and cultural dynamics
that have an important role to play in the productivity of a landscape. To the extent that Midvaal is seeking assistance
from private firms for greening initiatives, the municipality is beginning to internalise the social practicalities of ecological
investments, which may actually benefit from development application of the inclusion of landscaping guidelines and green
building principles. Midvaal is still beset by development pressures but there are signs that the perception of what constitutes
traditional development is beginning to change, with various strategic documents catering for landscaping, trees, gardens and
ecological open space. There are also various articulations of the benefits of certain green assets, such as the claim by the
Midvaal Department of Health officials that ‘’1 ton of carbon is being sequestrated by a tree over its lifetime” (Midvaal Official,
pers. comm, 2012), but it is unclear as to whether this assertion is promoted outside of media platforms and connected into
mainstream development planning.

106
SECTION 3 Current government plans, visions and capabilities for green infrastructure
Sedibeng: overall conclusionsAmongst the local municipalities within Sedibeng there are a
number of commonalities in terms of how ecological assets
are managed and perceived. In general, deficits in operational
budgets and human resources compromise the capacity
to coordinate and manage assets that are not key social or
economic priorities. While there is an appreciation of the
value of “the environment” within the departments directly
responsible for inter alia trees, open spaces or parks, this
understanding does not always filter down to the community
level and is not necessarily a priority at top management
level. The drive to “green” municipal operations often occurs
through green economy or climate change-related mandates,
which although inherently diverse are still opportunities for
furthering investments in ecological assets. There is also a
strong association between natural assets in the district and
the economic benefits that accrue through eco-tourism.
The local municipalities depend on the coordination function
of the Sedibeng District, but there are a number of concerns
regarding local applicability of district-level planning. The
District’s Bioregional Plan is often perceived as merely a
desktop study and according to some officials, does not
represent the local municipal contexts effectively. Provincial
support from GDARD plays an important role in supporting
District initiatives, particularly the funding of alien vegetation
removal as well as local municipal tree planting and park
development projects, which may not have been possible
without provincial support.
It is concerning that some of the local municipalities are
without environmental managers, barring Emfuleni, and
it is often not clear which departments or officials in each
municipality are responsible for different streams of greening
operations. Out-dated data and gaps in policies are also
starting to show across the local municipalities. Midvaal is the
only municipality that has a municipal-wide EMF. While Lesedi
has an EMF, it is yet to be endorsed by DEA and Emfuleni’s
EMF covers only a section of the municipality, although
there are plans to expand this. Various officials interviewed
expressed concern that environmental management sections
are often seen as not being a priority in the council with no
authority and often have to revert to provincial or national
departments to manage environmentally related issues. It is
interesting, however, that while both Lesedi and Midvaal do
not have an environmental management department, strictly
speaking, their Departments of Social Services undertake
trees and parks operations, which may be an indication of the
conceptual coupling of greening projects and social services.

107
The STaTe of Green InfraSTrucTure In The Gcr
West Rand District Municipality (WRDM)As a district municipality, West Rand District Municipality
(WRDM) encompasses the four local municipalities of Mogale
City, Merafong, Westonaria and Randfontein. It carries some
district municipality functions of its own and also works to
align strategies across the four locals. Visions to merge the
four municipalities into a single metropolitan municipality are
proposed in WRDM’s Vision 2016 (WRDM, 2012a). This merger
is, in part, articulated as a holistic approach to environmental
concerns and one which will develop economies from climate
change mitigation strategies and the growth of green and
sustainable industries (WRDM, 2012). This single metro vision
hinges on approval by the Demarcation Board of South Africa,
a decision scheduled for July or August 2013.
Regardless of whether the West Rand municipalities will
be merged into a metro, the co-ordination of the greening
operations of each local municipality is a key concern. The
WRDM has developed a Green IQ Strategy through which it
commits to becoming the greenest district in South Africa
(WRDM, 2013). Alongside this district level strategic focus,
the four local municipalities are making explicit investments
in the greening of existing and new developments, infused
with explicit mandates to green disadvantaged communities,
in the process embedding ecological assets in the realm of
community services. Subject to possible institutional shifts,
ecological assets in the West Rand enter squarely into the
sphere of municipal competencies and operational purview.
Their active investments in greening initiatives play a critical
role in creating and sustaining green landscapes.
The landscapeThe West Rand is located on the South Western edge of
Gauteng and covers approximately 4,095 km2, of which a
majority consists of natural open spaces and agricultural lands
(WRDM, 2011). The district contains a world heritage site, the
Cradle of Humankind, that forms part of the ecologically
sensitive Magaliesberg range of ridges (WRDM, 2011).
According to the WRDM Bioregional Plan, the West Rand has
a high percentage of rare and threatened species and ecosystems as a result of the region’s unique topographic and geological
diversity and high levels of habitat transformation (WRDM, 2012b). Therefore, although overall land transformation levels in
Gauteng are higher than in the West Rand, which is 6% urbanised and predominately rural, the municipality has been greatly
impacted by agricultural, mining and industrial activities the effects of which include acid mine drainage, waste water treatment
plants, fertilizer and pesticide runoff, overgrazing and catchment hardening, amongst others (WRDM, 2012b, WRDM, 2009).
These pressures have created a landscape in which 55% of ecosystems are identified as threatened while 83% of wetlands and
33% of river types are also threatened (WRDM, 2012b).
weSt rand route, 2013

108
SECTION 3 Current government plans, visions and capabilities for green infrastructure
Relevant institutional arrangements and strategic processesThe structure of WRDM is such that the investment and
management of ecological assets does not happen via one
‘environmental’ unit per se, but through the interactions of
various district officials and planners in relation to local
municipal operations. The most important area of institutional
activism by the District are visioning frameworks, plans and
strategies that by themselves appear to hold together the
institutional space for managing and investing in green assets.
For instance, the WRDM Green IQ Strategy (2013) defines
seven key priorities that focus the District on operations such
as intensive tree planting schemes, removal of alien vegetation
and regenerating degraded lands. These represent an explicit
strategic process in which ecological priorities for the district
are strongly embedded.
To the extent that the WRDM Green IQ Strategy (2013) is a
vision for the future, additional support for future investments
in ecological assets is provided via the district’s IDP for
2011/12 to 2015/16. Under the strategic goal ‘Environmental
Management’, WRDM undertakes a district environmental
management framework, environmental management
programmes, district environmental management
project resource mobilisation and district environmental
management performance monitoring. While these strategic
goals are connected into broad sustainability objectives,
such as air quality and waste management, specific priorities
are also earmarked in the WRDM IDP (2012/13) to invest
in ecological assets including a biodiversity management
strategy and an open space and greening master plan. These
strategies are bolstered by other project ideas such as the
acknowledgement within the IDP of the need to “create a
district wide GIS based system that will operate in accordance
with the newly formulated Land Use Management Scheme
for the district… created on a regional level of all existing
and future developments, transportation data, subdivision
applications, geological / environmental sensitive areas etc.”
(WRDM, 2012a).
Alongside the IDP, the WRDM Bioregional Plan (BRP) (2012)
and the WRDM State of Environment Report (SOER) (2011)
serve as information tools informing land use planning and
reporting on the state of the environment in the district,
including pressures facing the district. Both the WRDM BRP
(2012) and the WRDM SOER (2011) relate provincial planning
information, predominately via GDARD and the Gauteng
Conservation C Plan, to West Rand specificities. Provincial data
is the primary feeder into these processes, which as reporting
and information tools are understandably generic so that
while they elucidate the West Rand situation, such as endemic
invertebrates occurring in the district, they are processes that
inevitably cover a broad spectrum of issues and themes. Such
information tools therefore need to be considered alongside
processes that are more programmatic and strategic, such as
the IDP, supported through the Vision 2016 and the Green IQ
strategy, as the primary channels for district-wide plans for
ecological assets and supporting projects. Together, these
processes signal a shift in the consciousness of the District
towards a green identity, but the capacity to implement this
vision remains a question. Many ‘2016’ projects are still to be
established and while projects are allocated budgets, these
allocations, at the time of writing, are yet to be approved
and officially paired to projects. The actualisation of strategic

109
The STaTe of Green InfraSTrucTure In The Gcr
objectives becomes clearer through tracking the programmes
and project implementation for local municipalities, a process
that also elucidates the institutional circuits through which
capital investments are directed.
A significant geological feature of the West Rand is the
occurrence of dolomite which while performing important
hydrological functions, through holding substantial ground
water and controlling the water table, also dissolves in
response to water table fluctuations, in turn increasing the
risk of sinkholes and restricting land use and settlement
patterns (DWA, 2009; WRDM, 2011b). The risk of developing
on dolomitic land has been a major determinant of the
nature of the West Rand landscape. Although there are large
expanses of land, much of this land is deemed unsuitable for
development due to the risk of sinkholes, which according
to municipal officials have created an excess of open spaces.
From a management perspective, much of this land is deemed
a burden so that both developments and greening work
by local municipalities have distinct spatial characteristics
that emerge from the location of dolomite. This also means
that new ecological assets, such as trees and community
gardens, funded by municipalities, are concentrated in areas
deemed safe. This creates a landscape of specifically located
ecological investments.
Local greening implementation – reflections from the localsThe four local municipalities within the West Rand are engaged
in various aspects of greening. There are projects that serve
cosmetic purposes, often aligned to ideas of ‘community
recreation’, while other initiatives focus on transforming
degraded land with an explicit coupling of service delivery
objectives and landscaping principles. There is a clear
municipal recognition of the functions of ecological assets,
yet it is unclear if this is work is informed by detailed scientific
studies on the functions of specific ecological processes.
These mandates are variously influenced by community
needs, settlement design guidelines and by space constraints
posed by dolomitic land amongst others, with the result being
a number of institutional engagements with the meaning of
‘ecological investment’.
Of the explicit landscape investments made by local
municipalities, Mogale City’s greening work appears to be
the most technical, specifying various requirements for
developments vis-à-vis ecological features such as open
spaces adjoining buildings, trees and gardens. For instance, the
Mogale City By-Law relating to Urban Greening and Biodiversity
(2005) stipulates a number of edicts, which together represent
a progressive vehicle for investment (Box 7):
BOx 72. SUBMISSION OF LANDSCAPE DEVELOPMENT
PLANS2.1 Targeted property developments
2.1.1 “The submission of Landscape Development Plans to the Directorate Integrated Environmental Management will be compulsory for any residential and business development whether developed as a single unit or sub-divided portions, except for individual residential 1 erven smaller than 2000m2 in extent”
3. PROVISION & PRESERVATION OF TREES ON PRIVATE PROPERTY DEVELOPMENTS3.1 Provision of trees on parking lots and pedestrian
walkways
i) Any property developer providing more than four parking bays per property, will plant trees at a
density of one tree for every four parking baysv) Property owners within private residential estates
will only plant suitable indigenous tree species on their sidewalks, which will be determined by the Sub-Directorate of Parks Management. The estate manager will distribute a list of such suitable trees species to every new property owner within such residential estate. The estate manager will instruct property owners to remove tree species other than those specified on the prescribed list and upon failure to do so remove such trees at the cost of the
property owner
4. ALLOCATION OF PRIVATE OPEN SPACE 4.1 All residential property developments or townships
in excess of 1Ha in extent, will allocate a minimum of 15% of the property towards zoned private open space. Such zoned private open spaces will individually not be less than 1500m2 in extent.
4.2 All business estates including office parks and industrial parks in excess of 1Ha in extent, will allocate a minimum of 10% of the property towards private open space. Such private open spaces will individually not be less than 1000m2 in extent.
4.3 A minimum of 75% of the allocated private open spaces will be interconnected, forming a functional network of green spaces. Such open space connectivity may only be intersected by road infrastructure

110
SECTION 3 Current government plans, visions and capabilities for green infrastructure
These by-laws guide Mogale’s Urban Greening, which is articulated as “a wide range of urban development actions that aim to
facilitate a sustainable relationship between urban dwellers and their environment” (Mogale City, 2005). Alluding to a policy
landscape in which notions of urban greening circulate and while backed by technical guidelines, are not necessarily rooted
in considerations of the effects of different species choices or arrangements in the landscape, a Mogale City official reflects:
“There is a focus on how open spaces can ameliorate climate change-related issues, but there is no supporting scientific detail for this, which comes more from an educational perspective.” (Mogale City Official, pers. comm, 2013)
In the West Rand, the state of ‘ecological’ or ‘green space’ knowledge is tied to the history of municipal planning, which before
the amalgamation of locals into the West Rand in early 2000s, existed without an overarching ‘open space framework’ of
the entire region. In part, this has been addressed by the development of the WRDM BRP (2012) but the place of scientific
expertise across planning circuitries is still wanting since much of the work following amalgamation has been about setting an
agenda for ecological investments. In doing so, a number of versions of ‘urban greening’ have focused strongly on the cosmetic
connotations of greening, with conscious attempts to create green spaces and ‘green’ existing and new developments. By way
of example, the Randfontein Local Municipality’s programme of Greening and Beautification (Randfontein, 2010), significantly
articulated through visual impressions of a beautification programme, focuses on main arterials, parks, and areas of illegal
dumping to achieve the following:
• To provide residents and visitors with flower gardens, streetscaping, cleanliness, and public art in order to promote the
aesthetic appeal of the area
• To maintain and continuously improve image route streetscaping to contribute to the beautification of our area
• To continue to enhance the general cleanliness of Randfontein and associated green initiatives
• To create employment, thus contribute to Randfontein’s economic growth
• Greening of RLM
• To provide dramatic colourful landscape enhancements.

111
The STaTe of Green InfraSTrucTure In The Gcr
This programme is not entirely different from what Mogale is
undertaking and signals the aesthetic approach embedded in
much of the West Rand’s greening work. Similar sentiments
are expressed in the other local municipalities’ programmes,
coupled with ideas of how greening can assist both
communities and the environment. Through its Greening and
Beautification project Westonaria Local Municipality frames
tree planting as an initiative that “comes with significant
benefits” such as mitigating climate change, beautifying the
area, serving medicinal functions, the provision of fruit and
contribution to economic opportunities (Westonaria, 2013).
Such logics are tantalising, but the corollary that planting trees,
gardens and investing in other greening initiatives is socially
and ecologically beneficial, is largely based on standard
explanations such as “improvement of aesthetic appeal” and
“greening to contribute to the environment”. These motives
have required little empirical valuation to find purchase within
municipal planning, which appears to draw on the perceived
value of and connection to social and environmental well-
being. While this may mean that government stakeholders
need little to be convinced of the need to invest in greening,
as this underpinning philosophy already appears to exist,
the suite of services provided by ecological assets varies
considerably, depending on relationships between ecological
processes and different landscape choices.
It is telling that in Merafong, ‘Parks’ are measured through
developed parks, opens spaces and sidewalks, with a key focus
on ‘Park development’ as a reporting tool (Merafong, 2011a,
Merafong, 2010). Municipal officials reflect that the persuasive
policy argument for this work is generally the number of parks
developed for communities, and previously disadvantaged
communities in particular. This mandate is largely incentivised
by the Guidelines for Human Settlements, Planning and Design
which stipulates a number of general guidelines in relation to
access to public green spaces (CSIR, 2000). These guidelines
are largely motivated as a community recreation opportunity,
and it is significant that various local municipalities in the West
Rand house the design of green spaces under an institutional
arm dealing with community services, motivated by “the
needs of people in informal settlements” and to achieve “the
correct ratio of parks to people” (Randfontein Official, pers.
comm, 2013).
A further trend is cemeteries as of key focus of the West
Rand’s greening investments, with a number of the locals
exhibiting an institutional coupling of parks and cemeteries,
usually under community services mandates. This is the
case in Westonaria, and in Mogale City, where cemeteries
are managed alongside parks, trees, urban greening and
environmental protection, operations collectively labelled
as ‘Parks Management’. The demand for cemeteries is a
major consideration across the West Rand where the rising
demand for cemeteries is complicated by the unavailability
of suitable land, due to dolomite. In Merafong for instance,
of the municipality’s 11 cemetries, 5 are full to capacity and
6 are in operation, while in Randfontein, municipal officials
have begun selling the idea of ‘second burials’, using the same
grave twice, to preserve space (Merafong, 2011b; Randfontein
Official, pers. comm, 2013).
Municipalities in the West Rand have also invested in
greening in interesting ways to overcome particular land use
challenges. Of the three parks established by WRDM, namely
Bekkersdal (Westonaria), Maglakeng (Randfontein) and
Fedela (Merafong), two were established to convert informal
dumping sites into managed park areas so to curb illegal
dumping. Parks are seen as instruments to change public
perceptions of open spaces, which in the absence of sufficient
waste collection services as well as community education
about the effects of pollution, become the subjects of illegal
dumping activities. However, WRDM officials, reflecting
on park projects, explain that despite park investments,
illegal dumping still takes place in areas adjacent to parks
(WRDM Officials, pers. comm, 2013). Officials also noted that
compared to Soweto in Johannesburg, where community buy-
in for parks is strong, there is a slow take-up by communities
of appreciating parks in the West Rand (WRDM Officials, pers.
comm, 2013).

112
Perceptions of ecological assetsIn the West Rand, a range of motives supports greening initiatives. On the one hand, there is a political decisiveness to
enhance community recreation opportunities, via developing parks for previously disadvantaged communities, while aesthetic
motives, tied to unique land use issues, drive strategic endorsements of landscaping and greening guidelines. The diverse
policy landscape in which these ideas are embedded reflects a planning perception that ecological investment is broader than
traditional conservation or preservation mandates. While the correlation between specific ecological processes and wider social
benefits is largely based on generic targets rather than empirical research, the strategic choice to include parks, trees and
landscaping guidelines in municipal operations is still a positive move, as reflected by a Mogale City official:
“Historically open spaces have been seen as ‘social spaces’ but there is now more of a focus on ecological services and how much open spaces can be used to sustain these.” (Mogale City Official, pers. comm, 2013)
SECTION 3 Current government plans, visions and capabilities for green infrastructure
weSt rand route, 2013
113
The STaTe of Green InfraSTrucTure In The Gcr
The sustainability of this shift is determined by financial
support to carry out greening but also, crucially, a working
relationship between municipalities and local communities.
Municipal experience with tree initiatives, for instance, has
demonstrated to officials the reasons behind unsuccessful
tree planting. Officials reflect that small trees are often broken
by school children or vandalised by community members, and
by implication, officials now ensure trees procured are at least
between 1,5 metres and 2 metres in height and avoid saplings
in planting schemes (WRDM Official, pers. comm, 2013).
Importantly, this speaks to the value of officials’ experience
in assessing the success of various ecological investments
and although not necessarily captured in detailed scientific
reports, also indicates that local government knowledge
retained over time is a critical source of ecological know-
how. In this respect, many officials engaged with parks, open
spaces and other forms of greening emphasise experience has
taught them that community awareness is critical, and there is
consequently a strong emphasis on “educating communities
to avoid vandalism once we establish a project” (Mogale City
Official pers. comm, 2013).
Although ‘community values’ feature as a primary motivation in most West Rand greening schemes, little detailed work has been
done to study the relationship between ecological investments and social value, and in particular, how the specific attitudes of
residents affect the success of projects such as vegetable gardens or tree planting. There is a general acceptance that these
initiatives are socially beneficial, but officials’ experience with greening schemes is that these schemes depend on “levels of
interaction between communities and trees and gardens, and whether people actually use green features ” (WRDM Official,
pers. comm, 2013).
Yet while local municipal parks departments are largely responsible for park maintenance, the actual design and establishment
of parks is often outsourced to landscape consultants and private sector partners. One municipal official reflects that “we just
don’t have the capacity here to develop a park, and more often than not, the private sector can do it better than we can” (West
Rand official, pers. comm, 2013). Furthermore:
“If we want to plant trees, we ask for donations from nurseries or NGOs. We mainly get support from nurseries. Our executive mayor set out to plant 10 000 trees with no budget and we rely mainly on donations from nurseries or mines.” (WRDM Official pers. comm, 2013)
114
SECTION 3 Current government plans, visions and capabilities for green infrastructure
The fact that the 10 000 tree planting target is one of the
strategies promoted in WRDM’s Vision 2016 to create a
holistic approach to environmental concerns (WRDM, 2012a)
underscores some notable trends in the way ecological
investments are made in the face of acute budget challenges.
At a district level, WRDM has established key partnerships
with industries to support greening initiatives through
donations from companies operating in and around the region.
While the horticultural industry is an obvious contributor to
greening initiatives, the role of mining companies is a more
complex one given the controversial ecological impact of
mines operating in the West Rand. A number of municipal
officials also comment on the “positive” and “incredibly
helpful” role of mining companies in greening settlements
through pro bono tree planting schemes (Westonaria
Official, pers. comm, 2013). While by no means uncommon,
the intention of the mining sector to incorporate social and
environmental priorities in their operations underscores
the institutional configurations that determine the ability of
government to manage and restore its assets. Whether these
subtleties will be affected in the long-term by vulnerabilities
felt by the mining sector may be an important consideration,
in terms of the fiscal and organizational capacities to invest
in landscapes, but perhaps more critical is whether mining
companies’ investments are backed by information on the
benefits of specific species and planting configurations. It
appears many mining-supported investments are also driven
Overall conclusionsA number of solid foundations exist in the public domain for
planning and future investment in the GCR’s green assets.
Some progressive institutional structures and ambitious
greening targets make for a productive and active policy
landscape. Much of this agenda takes place via tree-planting,
park upgrades and extensions, and various attempts to
address uneven shares of green space acorss the city-region.
While this work is positive, the connection into mainstream
infrastructure planning is still wanting. This signals a need
for activism from government to embrace alternative
infrastructure styles and research into the kinds of green
infrastructure appropriate for different municipal contexts.
The set of solutions that may fit a dolomitic context in the
West Rand, for example, may not be as relevant for more
forested areas such as Tshwane and Johannesburg, where
the services of green infrastructure already in place are to
be capitalized upon. This work presents a major opportunity
for municipalities in the GCR, which are situated in diverse
institutional and ecological settings. The integration of the
different knowledges that exist, about different green assets
and challenges faced in managing them, is a critical step in
developing a city-region approach to green infrastructure.
as ‘social’ or ‘community’ investment projects, with very little
data collection on the benefits of particular projects, making
it difficult to comprehensively assess the overall value project
actions.
ConclusionsIn the West Rand, it could be said that tree planting, park
development and landscaping projects are aligned with the
idea of green infrastructure through the various municipal
references to the broader social and environmental benefits
that flow from these projects. Yet the value of these projects
is generally unaccounted for, with projects largely being
motivated as simplified “community” or “environmental”
initiatives. It is telling that local officials’ experience indicates
the importance of public acceptance and active engagement
in greening projects, particularly in terms of maintenance and
keeping sites free of pollution and vandalism, and uncovering
the details behind the relationships between greening
projects and community value may indeed provide critical
information on the value of investing in such projects. More
detailed reflections on the investments in ecological assets,
whether this be through collaborative partnerships between
government and other sectors, and in turn through local
communities, is a critical consideration in terms of enhancing
joint responsibility for landscape investments and to decide
on the best fit of potential investments in a wider landscape
setting.
in the weSt rand, 2013

115
The STaTe of Green InfraSTrucTure In The Gcr


BOUGAINVILLIANatasha Christopher
Bougainvillia, Johannesburg, 2011 - 2013


122
SECTION 4 Techniques for valuing green infrastructure
SECTION FOURThis section explores ecosystem service valuation techniques that could be applied in the GCR context. After classifying and comparing the options for valuing relevant ecosystem services, the chapter indicatively demonstrates one method for valuing public green spaces in the City of Johannesburg.

The STaTe of Green InfraSTrucTure In The Gcr
123
Techniques for valuing green infrastructure
BackgroundPlanning for green infrastructure involves understanding
its functions and how these benefit society. This report has
already established the principle that the GCR’s green assets
ought to be appreciated as infrastructure, but more detail
is needed on how to value the multiple benefits of green
infrastructure and how to incorporate ecosystem services
valuations into public budgeting and planning processes.
This chapter provides a preliminary investigation into options
for valuing multi-dimensional and multi-functional green
assets. Its argument is strongly influenced by a study by the
City of Cape Town: Investing in Natural Assets. A Business
Case, where the case for investment in and maintenance of
ecological assets was made through applying economic
valuation techniques to the sustained flows of ecosystem
good and services (De Wit et al., 2009a; De Wit et al., 2009b;
De Wit et al., 2012). In line with this foundational work, this
chapter assesses ecosystem valuation work undertaken thus
far and lays the basis for future GCRO research pathways to
value ecosystem services more explicitly in the GCR.
The chapter is structured as follows:
• A desktop review of methodologies for valuing
ecosystems services in economic terms, illustrated via
examples of how this is currently conducted in urban
settings with a focus on, but not limited to, South African
case studies
• A case study demonstrating ecosystems valuation in the
GCR’s urban context, using data on parks from the City of
Johannesburg
• A summary discussion on the importance of, and
opportunities for, including ecosystem valuation in policy
frameworks and planning and budgeting processes in
the GCR.
WaTerfall eSTaTe, MIdrand, 2013
Background and introduction to ecosystem valuation

124
SECTION 4 Techniques for valuing green infrastructure
Introducing ecosystem valuationThe importance for ecosystem valuation has been emphasized
in the development of a business case to invest in green
infrastructure by the City of Cape Town (De Wit et al., 2009b).
In a subsequent unpublished report on ecosystem finance
mechanisms, De Wit and Van Zyl (2010) argue as follows:
“As everyone benefits from ecosystem goods and services, the relevant authorities who have the mandate of being custodians to the public good, have a role in investing and maintaining such services. Where such services do benefit private agents as well, it will only be fair for private agents to contribute to the maintenance of such services. This is not very different from the investment and maintenance of other utilities – municipalities invest in infrastructure and the provision of services and those who benefit (households, industries, tourists) pay through mechanisms such as tariffs, property rates and charges. Where social objectives, such as the rollout of services to the poor need to be achieved, national and/or provincial government also contributes. The logic therefore, from a municipalities’ perspective, would be to outsource investment and maintenance of natural capital only where clear, private benefits can be achieved, and work with an approach of either a full service provision model by the municipality in certain cases, or with shared arrangements with the private agents in other cases.”
Incorporating green infrastructure into public planning and
budgeting requires an understanding of the potential role
of monetary valuation of ecosystem goods and services
(EGS). Through monetary valuation, the economic multipliers
of investing in ecosystems become evident. The ecosystem
value-added relative to the return on public expenditure on
green infrastructure highlights the need to use public funds
for sustaining ecological assets (De Wit et al., 2012). Monetary
valuation contributes to public budgeting and planning of
green infrastructure in at least four areas:
1. Valuation tools offer a framework for providing a
common currency through which information may be
shared with relevant decision-makers across a range of
inter – and intra – departmental functions
2. Environmental valuation provides a framework for
valuing the benefits that accrue to future generations
3. Environmental resource economics (ERE) valuation
tools can address sectoral issues such as environmental
governance, biodiversity resources and cultural
heritage, thereby contributing towards a holistic
approach to environmental management
4. Valuation can be used to assess the benefits derived
from services of the natural resources and ecological
systems in the urban contexts, as well as how these
benefits are distributed.

The STaTe of Green InfraSTrucTure In The Gcr
125
Review of methodologies and examples of existing ecosystem valuation work in urban contextsTotal Economic Value approachThe Total Economic Value (TEV) approach is widely used as a framework for incorporating complex and interrelated interactions
between the physical attributes of the environment and the associated value flows. The framework is used to value both
market and non-market benefits, as well as future use, along with values totally unrelated to future consumption. A comparison
between market, non-market and proxy market values is given in Table 4.
MarkeT valueS non-MarkeT valueS Proxy MarkeT valueS
definition The value of environmental goods is directly inferred by looking at the value they are traded on markets. an example is the direct or shadow price of timber sold on the market
Most environmental goods, such as clean air and water, and healthy fish and wildlife populations, are not traded in markets. Their economic value – how much people would be willing to pay for them in rands or dollars – is not revealed in market prices. non-market valuation techniques are then employed.
The value of environmental goods is inferred indirectly through proxy (surrogate) markets. an example would be to infer the value of a wetland by comparing property prices in close proximity to the wetland compared with property prices further afield.
examples of valuation techniques
Market price
replacement cost
opportunity cost
contingent valuation
conjoint analysis
Travel cost
aversive behaviour
defensive expenditure
hedonic pricing
Table 4. a comparison between market, non-market and proxy market values (Source: own analysis)

126
SECTION 4 Techniques for valuing green infrastructure
There is no universally accepted framework for total economic
value. Usually a distinction is drawn between use and non-
use values, the former being those values that involve some
interaction with the environment, and the latter being those
values derived from the knowledge that a resource exists.
However, this categorisation creates a problem for the so-
called option values, which involve preservation of a resource
so that it may be used in the future. Some would classify these
as use values, while others classify these as non-use values. In
addition, there are so-called quasi option values that involve
delaying decisions until technology is developed to such an
extent that an optimal decision might be made concerning
the environmental resource.
Using the use value / non-use value categorisation, a
distinction can be drawn between direct use values and
indirect use values. Direct use values are those associated
either with the consumptive use of the resource (e.g. food,
fuel, water, timber) or non-consumptive use (e.g. tourism).
Indirect use values are associated with the benefit derived
from the ecosystem, without directly consuming it (e.g.
climate regulation, carbon sequestration and erosion control).
Non-use values are usually divided into existence and bequest
values, although altruistic values are sometimes also included
in this category. Existence values are those values associated
with knowing that a resource is available, irrespective of
whether the individual will ever benefit (directly or indirectly)
from it. This value is highest for charismatic species such as
the Big Five, or Asian Pandas. Bequest values measure the
willingness of current generations to pay to ensure that the
environment is preserved for future generations. Altruistic
values are similar to existence values, except that a value
is placed on contemporaries deriving a benefit from the
resource.
Ecosystem services and valuation techniquesThe Millennium Ecosystem Assessment (2005) distinguishes
four categories of goods and services:
• provisioning services that relate to the products derived
from an ecosystem, including food, fibre and fuel, genetic
resources, medicines and pharmaceuticals
• regulating services that involve the benefits derived from
the regulation of ecosystem processes, such as air quality
regulation, climate regulation, water regulation, erosion
regulation, disease regulation, pest regulation and natural
hazard regulation
• cultural services are the benefits people obtain from
ecosystems such as reflection, recreation, inspiration, and
aesthetic enjoyment, and include cultural diversity and
educational values, and
• supporting services are those necessary for the
production of all other ecosystem services, such as soil
formation, photosynthesis, primary production, nutrient
cycling and water cycling.
In terms of the total economic value framework, provisioning
services fall largely within the direct use category, regulating
services are largely indirect use values, cultural services
comprise both a direct use component for values such as
recreation, and an existence value component for most of
the remainder (Table 5). Supporting services on the whole do
not form part of TEV, but are valued indirectly through the
services they provide to other ecosystem goods and services.

The STaTe of Green InfraSTrucTure In The Gcr
127
caTeGory TyPe of GoodS and ServIceS TyPe of econoMIc value MoneTary valuaTIon TechnIque
Provisioning services
fresh water provision direct use value effects on production,cost of alternative sources, benefits transfer techniqueMaterials for crafts direct use value
fish resources (e.g. from dams) direct use value
Small scale urban farming direct use value
fuel wood direct use value
cultural services recreation and ecotourism direct use value Travel cost, property price/hedonics, contingent valuation & conjoint analysis, benefits transfer technique
educational values (e.g. school excursions and scientific research)
direct use value
aesthetic values and sense of place existence value
Provision of inspirational beauty existence value
regulating services
Water purification & waste treatment Indirect use value replacement cost, preventative costs, costs of disaster, system failure, benefits transfer technique
air quality regulation (local) Indirect use value
climate regulation (global) Indirect use value
erosion regulation Indirect use value
flood attenuation Indirect use value
Table 5. ecosystem goods and services and monetary valuation techniques (Source: adapted from de Wit et al. (2009b))
Case studiesThe value of green infrastructure can typically be conceptualised through five categories, namely natural areas, landscapes,
water, soil and air. This is based on a review of a number of local case studies, which apply monetary valuation techniques to
the five categories, with the exception of soil, for which no sufficiently representative set of local urban valuation studies was
available. The relationship between these categories and the case study values is discussed below and represented in Table 6.
caTeGory valuaTIon
natural areas recreational values from urban open spaces, recreational value of protected areas
landscapes Geological and cultural features
Water Wetland values
air air pollution, carbon sequestration
Table 6. relationship between categories and case study values (Source: own analysis)

128
SECTION 4 Techniques for valuing green infrastructure
Recreational values from green open spacesThere are a variety of green open spaces in the GCR, including
protected areas, ridges, recreation parks, sports facilities,
traffic islands, cemeteries and natural areas on privately
owned land (Bouwer, 2008). In addition to small pockets of
natural open spaces either owned privately or belonging to
government, there are other green open spaces including
nature reserves designated as protected areas in terms of
relevant municipal, provincial or national legislation. Green
open spaces play an important role in metropolitan and urban
areas through providing recreational benefits and potentially
increasing property values. A detailed study of green open
spaces in the Cape Metropolitan area (Turpie et al., 2001)
provides an indication of the value of undeveloped land.
Contingent valuation was used to estimate the value of use,
option and existence values of open spaces, while hedonic
pricing determined the impact of open spaces on property
values. Not all open spaces produce a positive value. Using
the hedonic pricing method, vacant lots are shown to provide
a dis-amenity of R7 840 per hectare in metro SE (2011 values).
Close proximity to parks, on the other hand, provides a
premium of R134 365 per hectare (annualised) in 2011 prices
(see Table 7).
conTInGenT valuaTIon
hedonIc PrIcInG
MeTro S MeTro Se MeTro Se
Parks 5 220 4 100 134 365
Sports fields 26 288 47 139 25 217
natural vegetation 9 128 1 501
vacant land 1 316 408 -7 840
agricultural fields 74 355 1 207
notes: all values are in 2011 rands. values are inflated to 2011 values using the cPI index for urban areas (South african reserve Bank). values are based on city of cape Town Metropolitan open Spaces Study (cMoSS). Source: Based on Turpie et al. (2001)
Table 7. open space values (r/ha) from cv and hedonic pricing, 2011
Geological and cultural valuesIn an ecosystem valuation study assessing the relationship
between ecological features and property values, Turpie
(1998) used the hedonic pricing method to assess whether
property prices were affected by proximity to Table Mountain,
in the City of Cape Town. The study concludes that proximity
to the City centre is a factor influencing property prices in
the City bowl, and this has confounded the influence of the
Table Mountain views. Gauteng has a number of geologically
and culturally significant areas, including the Tswaing Meteor
Crater and Cradle of Humankind World Heritage Site. No
known monetary valuation studies have been conducted on
these areas. Such studies are complex and require non-market
approaches to valuation using survey techniques.
Wetland valuesWetlands may have either a positive or negative impact on
the prices of properties in close proximity to the wetlands.
A number of hedonic pricing studies in the City of Cape
Town have indicated a premium associated with properties
situated close to wetlands. In Zandvlei in Cape Town, for
example, property price premiums were approximately R 92,2
million in 2001 (Van Zyl, 2007). In Zeekoevlei, also in Cape
Town, property values associated with houses on the vlei are
between 14 and 29 percent higher, and this diminishes rapidly
with increasing distance from the wetland (Van Zyl & Leiman,
2001).
Wetlands also provide a number of benefits, including
recreational opportunities and water regulation, amongst
others. Both Joubert and Turpie (2001) and Turpie and Joubert
(2001) used the expressed preference (Contingent Valuation
Method (CVM), specifically) and revealed preference methods
(the Travel Cost Method (TCM) specifically), to estimate the
recreational value of Zandvlei and Kuilsriver in the Western
Cape. In terms of water purification services, Harding (2001)
used the replacement cost method to estimate the costs of
constructing an artificial wetland, as well as water purification
and storage functions. The benefits provided by wetlands
for agricultural production, through irrigation and water for
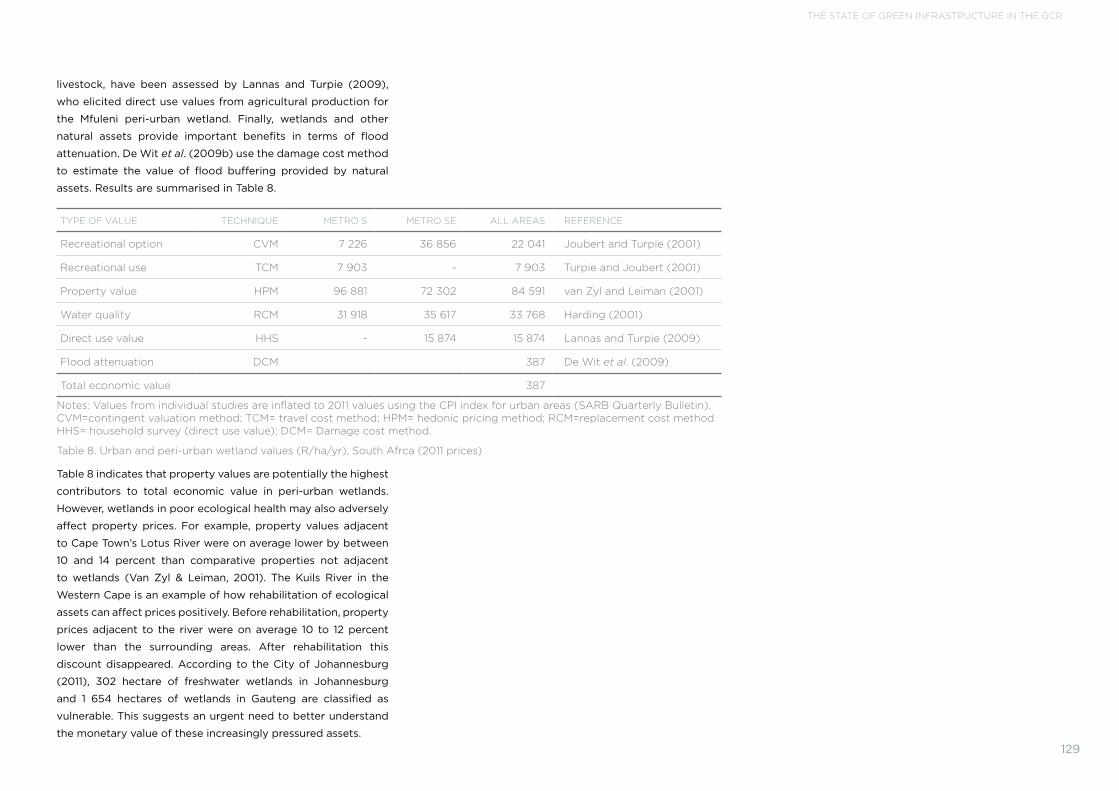
The STaTe of Green InfraSTrucTure In The Gcr
129
livestock, have been assessed by Lannas and Turpie (2009),
who elicited direct use values from agricultural production for
the Mfuleni peri-urban wetland. Finally, wetlands and other
natural assets provide important benefits in terms of flood
attenuation. De Wit et al. (2009b) use the damage cost method
to estimate the value of flood buffering provided by natural
assets. Results are summarised in Table 8.
TyPe of value TechnIque MeTro S MeTro Se all areaS reference
recreational option cvM 7 226 36 856 22 041 Joubert and Turpie (2001)
recreational use TcM 7 903 - 7 903 Turpie and Joubert (2001)
Property value hPM 96 881 72 302 84 591 van Zyl and leiman (2001)
Water quality rcM 31 918 35 617 33 768 harding (2001)
direct use value hhS - 15 874 15 874 lannas and Turpie (2009)
flood attenuation dcM 387 de Wit et al. (2009)
Total economic value 387
notes: values from individual studies are inflated to 2011 values using the cPI index for urban areas (SarB quarterly Bulletin). cvM=contingent valuation method; TcM= travel cost method; hPM= hedonic pricing method; rcM=replacement cost method hhS= household survey (direct use value); dcM= damage cost method.
Table 8. urban and peri-urban wetland values (r/ha/yr), South afrca (2011 prices)
Table 8 indicates that property values are potentially the highest
contributors to total economic value in peri-urban wetlands.
However, wetlands in poor ecological health may also adversely
affect property prices. For example, property values adjacent
to Cape Town’s Lotus River were on average lower by between
10 and 14 percent than comparative properties not adjacent
to wetlands (Van Zyl & Leiman, 2001). The Kuils River in the
Western Cape is an example of how rehabilitation of ecological
assets can affect prices positively. Before rehabilitation, property
prices adjacent to the river were on average 10 to 12 percent
lower than the surrounding areas. After rehabilitation this
discount disappeared. According to the City of Johannesburg
(2011), 302 hectare of freshwater wetlands in Johannesburg
and 1 654 hectares of wetlands in Gauteng are classified as
vulnerable. This suggests an urgent need to better understand
the monetary value of these increasingly pressured assets.

130
SECTION 4 Techniques for valuing green infrastructure
Air pollution and carbon sequestrationUrban trees perform an important role in carbon sequestration
and reduction in the effects of air pollution. Schäffler and
Swilling (2013) use the cost of carbon method to estimate
that the standing stock value of carbon sequestration in
Johannesburg’s urban forests is US$64,2 million, which
equates to an annual value of R49,04 million over a 20-
year period assuming an exchange rate of R7,5 = US$1, but
excluding growth of the standing stock. Relating this value
to the total City of Johannesburg (CoJ) area, i.e. 164 458
hectares (Schäffler & Swilling, 2013), the annual value of
carbon sequestration of City of Johannesburg’s urban trees is
estimated to be R298,20 per hectare per year.
De Wit and Blignaut (2006) report carbon sequestration
also benefits from grasslands at 0,19tC/ha, which at a carbon
price of US$12,10/tC (Schäffler & Swilling, 2013) or R90,75/tC,
assuming an exchange rate of R7,5/US$, equates to a carbon
sequestration value of grasslands of R17,24/ha/yr. Apart from
the air and climate regulation benefits, grasslands perform
a number of other important ecological functions such as
medicinal products and grazing services, particularly on the
Highveld in a grassland biome. However, the CoJ (2011) warns
that 34 percent of bush veld and grasslands within Gauteng
is either critically endangered or endangered due to urban
encroachment (CoJ, 2011). The situation is far worse in the
City of Johannesburg, where 67 percent of ecosystems is
either critically endangered or endangered (CoJ, 2011).
Demonstrating ecosystem valuation in practiceThere are a number of possible options available to practically
demonstrate the valuation of ecosystem services, including:
1. The value of well-maintained natural areas in flood
attenuation
2. The water purification and flood attenuation values
associated with wetlands
3. The recreational and aesthetic values associated with
green open spaces
4. The value of air quality improvements associated with
natural areas
5. The value of urban agriculture focused on communal
open spaces.
Data availability and related practicalities were considered
as factors in choosing which technique to use to illustrate
ecosystem valuation within the GCR. The assessment of these
factors indicated that it would be best to proceed with a case
study primarily focused on recreational and aesthetic values
associated with green open spaces, which is the subject of the
following section.

The STaTe of Green InfraSTrucTure In The Gcr
131
Valuation of green open spaces focusing on recreational and aesthetic benefitsRecreational and aesthetic benefits of green open spaces
tend to have relatively high magnitudes particularly in largely
urban settings with large populations. The following valuation
techniques are most commonly applied in order to estimate
the value of these benefits
• Contingent valuation or conjoint analysis using a survey
to illicit values from respondents
• Hedonic or property value technique which analyses
real estate values in order to isolate the portion of these
values that relate to the availability and proximity of
green open spaces
• Travel cost technique in which the costs associated with
travel to a green open space are estimated based on a
survey of users.
Unless verifiable and consistently updated data is readily
available, each of these techniques requires significant
primary data collection and analysis in order to produce
reliable results for the entire city-region. While data for the
GCR is available, there remain challenges in the way provincial
and municipal government collate data across administrative
boundaries, and a number of inconsistencies emerge when
looking across publicly available datasets. Consequently, the
benefits transfer technique was used to generate preliminary
indicative values. This relied on the findings of valuation
studies from elsewhere with values from those analyses
Box 8 ThE BEnEfITs TRAnsfER METhoD ExplAInED
The benefit transfer method is used to estimate economic
values for ecosystem services by transferring available
information from studies already completed in another
location and/or context. For example, values for recreational
fishing in a particular state may be estimated by applying
measures of recreational fishing values from a study
conducted in another state. Thus, the basic goal of benefit
transfer is to estimate benefits for one context by adapting
an estimate of benefits from some other context. Benefit
transfer is often used when it is too expensive and/or
there is too little time/data available to conduct an original
valuation study, yet some measure of benefits is needed.
– ecosystemvaluation.org.
appropriately adjusted (see Box 8 for an explanation of the
benefits transfer technique). The valuation exercise also
focused on a select area, the CoJ to pilot the benefits transfer
technique in Gauteng. The exercise comprised the following
steps:
1. Source maps of all green open spaces under the
control of City Parks within the City of Johannesburg
2. Estimate the total size of these areas per open
space land use type and for each of the City of
Johannesburg’s regions
3. Source data on the value of green open spaces
estimated elsewhere on a per hectare basis
4. Apply appropriate adjustment factors to per area
values from elsewhere in order to make them as locally
applicable as possible
5. Multiply green open space area sizes in the City
of Johannesburg by estimated per area values
appropriately adjusted.

132
SECTION 4 Techniques for valuing green infrastructure
Current open space types and land areas in JohannesburgFigure 44 provides a map of the City of Johannesburg with its
seven regions (Regions A to G). In order to ease presentation,
data focused on these seven regions separately and on the
City of Johannesburg area as a whole. Data was also available
at a ward level but was considered not appropriate for the
purposes of this coarse level study given the inconsistent
sizes and generally small land areas of wards, which hinders
comparisons. Data was sourced from Johannesburg City Parks
(JCP) to estimate green asset / green open space land areas
per open space land use type. Comparisons were also made
with total land area data in order to show relative abundance
of green assets per region.
As can be seen in Table 9, Johannesburg has a variety of land
use types that have been broadly classified as ‘green open
space’. This includes 23 open space types such as parks,
nature reserves, riverine areas, and road verges, summing
to a total land area of approximately 15 970 ha and equal to
roughly 9,7% of the total land area in the CoJ. Regions with
a greater proportion of Johannesburg’s open space include
Region G (21,3%), Region C (16,3%) and Region F (16%), while
those with lower portions include Region E (10,2%), Region A
(11,1%) and Region B (11,7%).
In terms of the overall availability of open space per region,
Region B has the greatest proportion of open space relative
to its own overall land area (12,5%) followed by Regions D and
F (both 11,6%). Region A has the lowest proportion of open
space relative to its own overall land area (5,5%) followed
by Region E (8,4%). Regions C and G both have average
proportions of open space relative to their overall land area
(10,2% and 10,6% respectively) when compared with the other
regions in the City.figure 44. administrative regions in the city of Johannesburg

The STaTe of Green InfraSTrucTure In The Gcr
133
reGIon a reGIon B reGIon c reGIon d reGIon e reGIon f reGIon G ToTal – all reGIonS
Total land area (in ha) 32 093.2 14 911.3 25 572.8 18 511.4 19 323.4 22 011.5 32 118.8 164 542.4
land area as a % of total land area in coJ 19.5% 9.1% 15.5% 11.3% 11.7% 13.4% 19.5% 100.0%
land area per green open space category (in ha)% of total
openSpace
BIrd SancTuary 16.2 55.8 17.0 – 31.7 – – 120.6 0.8%
ceMeTery 68.8 189.7 63.9 307.2 274.8 57.8 185.9 1 148.1 7.2%
dePoT 7.0 4.0 4.2 2.3 8.9 7.9 5.5 39.8 0.2%
flaGShIP road ISland 20.4 107.9 0.6 6.6 – – – 135.5 0.8%
envIronMenTal conServaTIon develoPMenT 7.2 1.1 20.6 344.9 – 3.5 112.9 490.0 3.1%
In eSTaTe 45.1 4.7 6.3 – – 1.3 – 57.3 0.4%
InforMal SeTTleMenT 290.3 14.5 127.8 91.4 – 17.1 324.4 865.4 5.4%
MaIn arTerIal 5.5 130.3 91.1 257.0 168.3 295.1 374.5 1 321.9 8.3%
MaIn road 195.7 25.6 314.3 – 55.5 27.5 18.3 636.8 4.0%
naTure reServe 17.0 117.3 547.9 14.3 83.2 770.5 – 1 550.2 9.7%
nurSery – – – 5.3 17.2 – – 22.5 0.1%
Park – develoPed SMaller ParkS 30.3 293.0 168.6 112.3 153.3 268.7 64.5 1 090.6 6.8%
Park – flaGShIP 15.8 210.9 169.7 127.9 89.4 57.5 61.3 732.4 4.6%
Park – aS yeT undeveloPed 118.6 45.4 159.4 29.1 39.6 92.9 82.8 567.8 3.6%
Park – aS yeT undeveloPed (not actively managed) 83.9 145.2 557.4 355.7 93.2 509.4 611.5 2 356.2 14.8%
rIver 443.2 39.0 34.3 80.7 196.8 25.8 1 215.1 2 035.0 12.7%
road ISland – 3.0 1.0 – 1.4 13.9 1.6 20.9 0.1%
SIdeWalk 136.4 15.5 – – 0.7 51.0 13.0 216.5 1.4%
SIdeWalk (not actively maintained) 267.5 374.8 287.0 260.3 383.6 291.4 321.9 2 186.4 13.7%
SPorT – 0.8 – 55.5 4.7 5.7 10.9 77.5 0.5%
ToWn enTrance – – – 6.6 – 0.5 1.6 8.8 0.1%
WaTer Body – 25.5 36.5 84.1 24.0 62.2 – 232.4 1.5%
Zoo – 57.4 – – – – – 57.4 0.4%
ToTal 1 768.9 1 861.0 2 607.4 2 141.2 1 626.1 2 559.7 3 405.8 15 970.1 100.0%
open space area as a % of total open space area in coJ 11.1% 11.7% 16.3% 13.4% 10.2% 16.0% 21.3% 100.0%
open space area as a % total land area in the region 5.5% 12.5% 10.2% 11.6% 8.4% 11.6% 10.6% 9.7%
Table 9. hectares per open space types in the city of Johannesburg

134
SECTION 4 Techniques for valuing green infrastructure
Having estimated hectares of open space type in
Johannesburg, broadly reasonable estimates were needed for
the per hectare value of these spaces. These estimates were
generated by applying the benefits transfer technique, which
is based on the use of existing value estimates for green open
spaces found elsewhere. These existing value estimates are to
be found in the literature on the value of green open spaces
reviewed in the next section.
Value estimates from other studies of green open spacesThe international environmental economics literature contains
a number of studies that have focused on attaching values
to green open spaces. The findings of this body of work on
recreational and aesthetic values have been collated and
reviewed by McConnell and Walls (2005), Brander and Koetse
(2007) and Kroeger (2008). While Kroeger focused exclusively
on hedonic analysis studies of property value premiums,
McConnell and Walls (2005) and Brander and Koetse
(2007) covered both hedonic studies and the application of
contingent valuation techniques1. For the purposes of this
valuation exercise, the results of contingent valuation studies
are most relevant. This is because such studies focus on the
overall values that a cross-section of society attribute to open
spaces. While useful in other settings, hedonic studies only
focus on the portion of open space values that are reflected
in nearby private property values. These studies also tend
to measure the relative increase in values as an individual
moves closer to open spaces, and not the overall value
enhancement associated with the presence of open spaces.
For example, the review of hedonic studies in Brander and
1 Note that the studies reviewed by McConnell & Walls in 2005 are included in Brander & Koetse’s later review in 2007.
Koetse (2007) indicates that house prices increase by an
average of approximately 1,9% for every 100 meters that one
moves closer to open spaces, but the study does not provide
an overall value for open space as such.
A general finding in reviews of ecosystem service values is
that these values are often highly situation specific, but that
general patterns are observable and that values attributed to
green spaces in particular feature prominently. With regard
to contingent valuation studies, the most recent review by
Brander and Koetse (2007) was based on 38 contingent
valuation studies, 20 of which provided sufficient information
for them to be included in a statistical meta-analysis of their
results. The majority of these studies estimated open space
values in terms of unit area (e.g. value per hectare) covering a
wider variety of open space types (i.e. forests, parks, general
green space, agricultural areas and undeveloped land). The
average value for green open space across all studies and
open space types was found to be US$13 210 per hectare per
year in 2003 terms while the median value was US$1 124/ha/
yr, which implies that half of the studies reviewed had values
below US$1 124/ha/yr).
In order to augment value estimates presented in their study,
Brander and Koetse (2007) also use meta-analysis to test
some of the common hypotheses regarding the nature of the
value of open spaces. With regard to the hypothesis that the
value of open space increases with population density, they
found that the population density variables in both of their
meta-analysis models of open space values were significant
and had positive relationships to open space values. This is
probably owing to higher demand for open space driven by its
relative scarcity and suggests that remaining open spaces in
densely populated urban areas are likely to be highly valued.

The STaTe of Green InfraSTrucTure In The Gcr
135
Somewhat against their expectations, Brander and Koetse
(2007) did not find a statistically insignificant link between
income levels and open space values. They hypothesise
that people might prefer to consume private open space
(e.g. private gardens) rather than public open space as their
incomes rise. If so, this is a preference that is likely to play
a significant role in determining the value of open space in
Johannesburg’s middle to higher income areas due to the
relative abundance of privately owned green space in these
areas (i.e. many homes is these areas have large gardens).
The high incidence of crime in Johannesburg relative to other
cities around the world may also push preferences towards
private open spaces.
Within South Africa, the only study to generate primary
values on green open spaces was the one done by Turpie et al.
(2001) in Cape Town as discussed above. Applying contingent
valuation, this study derived per hectare values for parks,
sports fields, natural areas, vacant land and wetlands. In the
case of parks, for example, Turpie et al. found that values for
open spaces averaged R2 663/ha/year in 2001 Rand values.
These per hectare value estimates were based on willingness-
to-pay estimates per household surveyed. Note that there was
a medium level of availability of green open space within the
areas where those responding to the contingent valuation
survey resided. From a policy and management implications
point of view, Turpie et al. found that increased management
effort by the municipality (and private citizens’ initiatives)
was a highly significant driver of higher values particularly for
recreational areas such as parks. The other prominent driver
was security perceptions with low or even negative values
attached to those open space areas perceived as unsafe or
providing hiding places for criminals.
Appropriate green open space values for the City of JohannesburgHaving reviewed the relevant literature above it was possible to generate appropriate values for application in the City of
Johannesburg. In this regard the following steps were followed:
1. Adjust all values in the literature to 2013 terms. For international estimates this required adjustments to reflect
exchange rate difference (at purchasing power parity rates) as well as differences in national income levels. For South
African estimates, only inflationary adjustments were needed.
2. Choose preferred values per hectare. The open space values generated in South Africa (i.e. those from Turpie et al.,
2001) were found to be preferable. Aside from the obvious reasons to strongly prefer locally relevant data over that
generated in other countries, the South African study also had the advantage of containing values for different types of
open spaces. In addition, the majority of the studies included in the international review focused on urban forests and
very few on urban parks. The higher values in the international literature did, however, provide a useful comparison or
‘reality check’ for the South African estimates. In broad terms, the international estimates were higher even after making
standard adjustments for relative purchasing power and incomes differences. This indicates that the South African
estimates may be artificially low, if anything. The adjusted South African values from Turpie et al. (2001) were therefore
assumed to be low estimates and were consequently used for the Low Estimate scenario in the overall valuation
exercise (see Table 10). Two other scenarios, the Medium and High Estimate scenarios, were also included in the
valuation exercise in order to present a range of likely estimates. The values applicable to these scenarios were assumed
to be 50% and 100% higher respectively relative to the Low Estimate scenario. These percentages were chosen based
on what seemed most reasonable.
3. Adjust preferred values as needed to reflect differences in open space types. This involved broadly matching the five
open space types used in Turpie et al. with the 23 type classifications found in the CoJ JCP data for 2013. In some cases,
matches were obvious for common land use types such as established parks. In others, it was more difficult to find
matches and reasonable averages had to be used. For example, values applied to road islands were derived based on an
average between parks and vacant land values to be found in Turpie et al. (2001)
Table 10 shows the results of the calculations described above used to derive indicative estimates of per hectare values for the
City of Johannesburg open spaces. It also provides notes on how values from the City of Cape Town in Turpie et al. (2001). were
adjusted in order to achieve the best possible match with open space types in Johannesburg.

136
SECTION 4 Techniques for valuing green infrastructure
2013 value In r/ha/yr
loW eSTIMaTe
MedIuM eSTIMaTe
hIGh eSTIMaTe
values from the cape Town open Space values Study
Parks r 3 926 r 4 462 r 4 999
Sportsfields r 25 173 r 35 156 r 45 139
natural vegetation r 1 438 r 5 089 r 8 741
vacant lands r 390 r 825 r 1 260
Wetlands r 3 127 r 5 166 r 7 206
values applied to Joburg city Parks land explanation of values used from cape Town open Space study to generate comparable low estimate for application to Johannesburg:
BIrd SancTuary r 4 776 r 7 164 r 9 552 ave between parks and natural vegetation medium value
ceMeTery r 914 r 1 371 r 1 828 ave between natural vegetation and vacant land low value
dePoT r 390 r 586 r 781 vacant land low value
flaGShIP road ISland r 914 r 1 371 r 1 828 ave between natural vegetation and vacant land low value
envIronMenTal conServaTIon deveoPMenT r 4 508 r 6 762 r 9 015 ave between parks low and natural vegetation medium value
In eSTaTe r 3 926 r 5 889 r 7 852 Parks low value
InforMal SeTTleMenT r 825 r 1 238 r 1 651 vacant land medium value
MaIn arTerIal r 914 r 1 371 r 1 828 ave between natural vegetation and vacant land low value
MaIn road r 914 r 1 371 r 1 828 ave between natural vegetation and vacant land low value
naTure reServe r 4 462 r 6 694 r 8 925 Parks medium value
nurSery r 2 957 r 4 436 r 5 914 ave between natural vegetation and vacant land medium value
Park – develoPed SMaller ParkS r 4 462 r 6 694 r 8 925 Parks medium value
Park – flaGShIP r 4 462 r 6 694 r 8 925 Parks medium value
Park – aS yeT undeveloPed r 2 957 r 4 436 r 5 914 ave between natural vegetation and vacant land medium value
Park – aS yeT undeveloPed (not actively managed) r 1 132 r 1 697 r 2 263 ave between natural vegetation low and vacant land medium value
rIver r 3 302 r 4 953 r 6 604 ave between medium wetlands and low natural veg value
road ISland r 2 957 r 4 436 r 5 914 ave between natural vegetation and vacant land value
SIdeWalk r 2 957 r 4 436 r 5 914 ave between natural vegetation and vacant land value
SIdeWalk (not actively maintained) r 390 r 586 r 781 vacant land low value
SPorT r 35 156 r 52 734 r 70 312 Sportsfields medium value
ToWn enTrance r 2 957 r 4 436 r 5 914 ave between natural vegetation and vacant land medium value
WaTer Body r 5 128 r 7 692 r 10 255 ave between wetlands and natural vegetation medium value
Zoo r 4 462 r 6 694 r 8 925 Parks medium value
exPlanaTory noTeS: low estimates for values applied to Joburg city Parks land are based on values from the cape Town open Space study, some of which are used directly and others adjusted. an explanation is provided for how each low estimate value for Joburg was derived in this way Medium estimates for Joburg city Parks land were derived by increasing low estimates by 50%. high estimates for Joburg city Parks land were derived by increasing low estimates by 100%
Table 10. Indicative values per hectare per year for open space types in the city of Johannesburg

The STaTe of Green InfraSTrucTure In The Gcr
137
Table 11 shows the results of detailed calculations of indicative values per open space type to estimate value per hectare for open spaces in Johannesburg. As can be seen from, total values for
this scenario were estimated at roughly R58 million/yr for all open spaces under City Parks’ management.
land uSe caTeGroy
eSTIMaTed value In randS / ha / yr – MedIuM ScenarIo % of ToTal
reGIon a reGIon B reGIon c reGIon d reGIon e reGIon f reGIon G ToTal
BIrd SancTuary r 115 779 r 399 431 r 121 922 r 0 r 227 044 r 0 r 0 r 864 176 1.5%
ceMeTery r 94 365 r 260 075 r 87 666 r 421 202 r 376 843 r 79 187 r 254 944 r 1 574 282 2.7%
dePoT r 4 092 r 2 356 r 2 436 r 1 360 r 5 185 r 4 630 r 3 240 r 23 298 0.0%
flaGShIP road ISland r 28 033 r 147 903 r 795 r 9 081 r 0 r 0 r 0 r 185 812 0.3%
envIronMenTal conServaTIon deveoPMenT r 48 567 r 7 144 r 139 023 r 2 331 946 r 0 r 23 536 r 763 079 r 3 313 295 5.7%
In eSTaTe r 265 897 r 27 465 r 36 857 r 0 r 0 r 7 400 r 0 r 337 619 0.6%
InforMal SeTTleMenT r 359 383 r 17 904 r 158 191 r 113 097 r 0 r 21 205 r 401 583 r 1 071 364 1.8%
MaIn arTerIal r 7 551 r 178 690 r 124 971 r 352 416 r 230 829 r 404 647 r 513 479 r 1 812 583 3.1%
MaIn road r 268 323 r 35 091 r 430 890 r 0 r 76 061 r 37 665 r 25 096 r 873 125 1.5%
naTure reServe r 113 721 r 785 260 r 3 667 480 r 95 640 r 556 776 r 5 157 460 r 0 r 10 376 336 17.9%
nurSery r 0 r 0 r 0 r 23 493 r 76 245 r 0 r 0 r 99 738 0.2%
Park – develoPed SMaller ParkS r 202 629 r 1 961 086 r 1 128 422 r 751 602 r 1 026 045 r 1 798 606 r 431 862 r 7 300 253 12.6%
Park – flaGShIP r 105 481 r 1 411 447 r 1 135 965 r 855 908 r 598 382 r 384 798 r 410 572 r 4 902 552 8.5%
Park – aS yeT undeveloPed r 526 300 r 201 304 r 706 928 r 129 205 r 175 568 r 412 205 r 367 074 r 2 518 583 4.3%
Park – aS yeT undeveloPed (not actively managed)
r 142 385 r 246 393 r 946 027 r 603 700 r 158 152 r 864 588 r 1 037 895 r 3 999 140 6.9%
rIver r 2 195 368 r 193 062 r 169 909 r 399 848 r 974 891 r 127 872 r 6 018 520 r 10 079 470 17.4%
road ISland r 0 r 13 149 r 4 348 r 0 r 6 101 r 61 841 r 7 281 r 92 720 0.2%
SIdeWalk r 604 906 r 68 743 r 0 r 0 r 2 955 r 226 306 r 57 567 r 960 476 1.7%
SIdeWalk (not actively maintained) r 156 666 r 219 506 r 168 076 r 152 453 r 224 652 r 170 643 r 188 528 r 1 280 524 2.2%
SPorT r 0 r 39 687 r 0 r 2 926 369 r 245 976 r 301 852 r 574 042 r 4 087 926 7.1%
ToWn enTrance r 0 r 0 r 0 r 29 382 r 0 r 2 161 r 7 295 r 38 838 0.1%
WaTer Body r 0 r 196 455 r 280 928 r 646 787 r 184 430 r 478 782 r 0 r 1 787 382 3.1%
Zoo r 0 r 383 909 r 0 r 0 r 0 r 0 r 0 r 383 909 0.7%
ToTal r 5 239 445 r 6 796 059 r 9 310 833 r 9 843 488 r 5 146 134 r 10 565 386 r 11 062 057 r 57 963 403 100%
% of total 9.0% 11.7% 16.1% 17.0% 8.9% 18.2% 19.1% 100.0%
Table 11. Indicative values per year for individual open space types in the city of Johannesburg – Medium estimate Scenario
At a more aggregated level, Table 12 provides a summary of values per year per region for all open space types, across values scenarios. It shows that the Low and High Estimate scenarios resulted
in values of R38 million/year and R77 million/year, respectively. It also shows the percentage of total values per region and compares these to open space as a percentage of total open space
area, as a percentage of the total land area per region, and as a percentage of total land area for the City (taken from Table 9). For example, these comparisons show that Region A’s relatively
low share of total open space values relates to the relatively low percentage of open space areas as a percentage of total land area (5,5%) even though total land area is large (19,5% of the

138
SECTION 4 Techniques for valuing green infrastructure
total land area of Johannesburg). On the whole, open space
value amounts are broadly commensurate with total open
space areas. There are some relatively minor exceptions such
as Region D where the percentage of value exceeds that of
total area (17% versus 13,4%) indicating a greater proportion
of higher value open space types in Region D when compared
with other regions. A closer inspection of Table 11 reveals
that the main reason for this higher value is the presence of
extensive municipal sports fields in Region D, which have very
high values per hectare.
reGIon eSTIMaTed value In randS / ha / yr% of ToTal value vS % of ToTal oPen
SPace area In coJloW MedIuM hIGh
region a r 3 492 964 r 5 239 445 r 6 985 927 9.0% 11.1%
region B r 4 530 706 r 6 796 059 r 9 061 412 11.7% 11.7%
region c r 6 207 222 r 9 310 833 r 12 414 444 16.1% 16.3%
region d r 6 562 326 r 9 843 488 r 13 124 651 17.0% 13.4%
region e r 3 430 756 r 5 146 134 r 6 861 513 8.9% 10.2%
region f r 7 043 591 r 10 565 386 r 14 087 181 18.2% 16.0%
region G r 7 374 704 r 11 062 057 r 14 749 409 19.1% 21.3%
Total r 38 642 269 r 57 963 403 r 77 284 538 100.0% 100.0%
Bark harveST, JohanneSBurG, 2013
Table 12. Indicative values per year for all open space types in the city of Johannesburg across estimate Scenarios

The STaTe of Green InfraSTrucTure In The Gcr
139
In order to convert per year values into total present value
totals it was necessary to apply discounting to these values.
Discounting is the process of reducing future benefits and
costs to their present time equivalent (Ecosystem Valuation,
2000). The discounting period chosen was effectively
perpetuity (i.e. discounting was applied until the point at
which discounting no longer made any difference to present
value results). A base rate of 4% was chosen as most suitable
in this regard and the sensitivity of results to a higher (6%)
and a lower (2%) rate were also tested. This base rate and
associated higher and lower rates were selected after a review
of the rates recommended in some of the more recent debates
surrounding discount rate choice particularly as they relate
to longer-term environmental issues such as climate change
(see for example, Stern (2007), Weitzman (2007) and Cole
(2008). The base rate chosen essentially reflects the middle
ground while the lower and higher rates reflect the lower and
higher estimates recommended in these debates.
The results of the discounting exercise are captured in
Table 13 and show that at a 4% discount rate, the total present
value of open spaces in the City of Johannesburg ranges
between R966 million and R1,9 billion. Under a lower discount
rate of 2% these values increase to between R1,9 billion and
R3,9 billion. Under a higher discount rate of 6% they decrease
to between R644 million and R1,3 billion.
reGIon dIScounT raTe
eSTIMaTed PreSenT value In randS
loW MedIuM hIGh
region a 2% r 174 648 182 r 261 972 273 r 349 296 365
4% r 87 324 091 r 130 986 137 r 174 648 183
6% r 58 216 061 r 87 324 091 r 116 432 122
region B 2% r 226 535 307 r 339 802 961 r 453 070 614
4% r 113 267 654 r 169 901 481 r 226 535 308
6% r 75 511 769 r 113 267 654 r 151 023 539
region c 2% r 310 361 107 r 465 541 660 r 620 722 213
4% r 155 180 554 r 232 770 831 r 310 361 107
6% r 103 453 702 r 155 180 554 r 206 907 405
region d 2% r 328 116 280 r 492 174 421 r 656 232 561
4% r 164 058 141 r 246 087 211 r 328 116 281
6% r 109 372 094 r 164 058 141 r 218 744 188
region e 2% r 171 537 813 r 257 306 720 r 343 075 626
4% r 85 768 907 r 128 653 360 r 171 537 814
6% r 57 179 271 r 85 768 907 r 114 358 542
region f 2% r 352 179 532 r 528 269 298 r 704 359 064
4% r 176 089 766 r 264 134 650 r 352 179 533
6% r 117 393 178 r 176 089 766 r 234 786 355
region G 2% r 368 735 217 r 553 102 826 r 737 470 434
4% r 184 367 609 r 276 551 413 r 368 735 218
6% r 122 911 739 r 184 367 609 r 245 823 479
Total for all regions 2% r 1 932 113 439 r 2 898 170 158 r 3 864 226 878
4% r 966 056 722 r 1 449 085 083 r 1 932 113 444
6% r 644 037 815 r 966 056 722 r 1 288 075 629
Table 13. Indicative present values for all open space types in the city of Johannesburg across estimate Scenarios
140
SECTION 4 Techniques for valuing green infrastructure
summary discussionInvestment in green infrastructure, like any other investment
in infrastructure, requires a proposition of value. The
economic valuation of such investments is one approach that
can be fruitfully utilised to make a case for investing in green
infrastructure. However, monetary valuation studies of green
infrastructure in South Africa are sparse and the paucity of
valuation work is particularly prevalent for urban ecosystem
services. There are various valuation applications, such as
Dodds’ (2010) hedonic pricing study of residential property
in the West Rand, but these largely exclude environmental
variables and very few studies undertake ecosystem valuation
as an explicit objective. The City of Tshwane’s Metropolitan
Open Spaces Framework sets out to investigate monetary
valuation techniques, but stops short of conducting a
monetary valuation study for the City’s open spaces. What
progress there is appears to be in the valuing of assets in
selected areas, such as the study by Stoffberg (2006) in
valuing carbon sequestration of street trees in the City of
Tshwane. This work found that the greatest monetary benefit
(US$2m) would be derived from planting 115 000 indigenous
street trees mainly in poorer, previously disadvantaged
communities, while the existing 33 630 Jacaranda mimosifolia
street trees in Tshwane were valued at US$419 786. It is clear
that the economic valuation of urban environmental goods
and services has started to attract some interesting case
studies, but as a discipline it is still in its infancy both in South
Africa and the GCR.
The valuation case study in this report shows how indicative
values can be generated for public parks as a component of
green infrastructure in the City of Johannesburg. These values
are admittedly approximations and are based on a benefits
transfer that relies primarily on adjusted values data originally
generated in Cape Town in the early 2000s. However, these
figures provide a useful demonstration of valuation while also
highlighting the significance of values for green assets in an
urban setting. At a 4% discount rate, the total present value
of public parks in the City of Johannesburg is estimated to
range between R966 million and R1,9 billion. This illustrative
exercise is one of many such studies that could be conducted
in the GCR in order to better understand the value of green
infrastructure for more informed decision-making and
management processes. Such research efforts should be
strongly encouraged, preferably as part of a longer-term
integrated programme of research with clear objectives that
moves beyond ad-hoc efforts.
Having demonstrated value, a further challenge is to
incorporate green infrastructure in government budgeting
and planning processes. The benefits of doing so are tied
to the value of investments in urban ecosystems to our
society such as saving on costs of engineering infrastructure,
enhancing quality of life and property values, and in
increasing the appreciation within our urban consciousness
about our connections to ecological processes. There is
increasing evidence that investment in green infrastructure
will predominantly save on costs to municipalities, and ‘green
infrastructure’ as a framework is gaining momentum worldwide
in various urban and regional strategies, plans, policies and
projects. Buttressed by innovative financing arrangements,
such as public-private partnerships, tax-increment financing,
development charges, value-capture taxes, and carbon
finance, the opportunities for investing in green infrastructure
– on the basis of a more accurate estimation of the value of
ecosystem services they provide – are ripe.
fIrePlace / SToraGe SPace, GreenSIde, 2013


SYMBIOSISNatasha Christopher
Sumbios, Johannesburg, 2012-2013

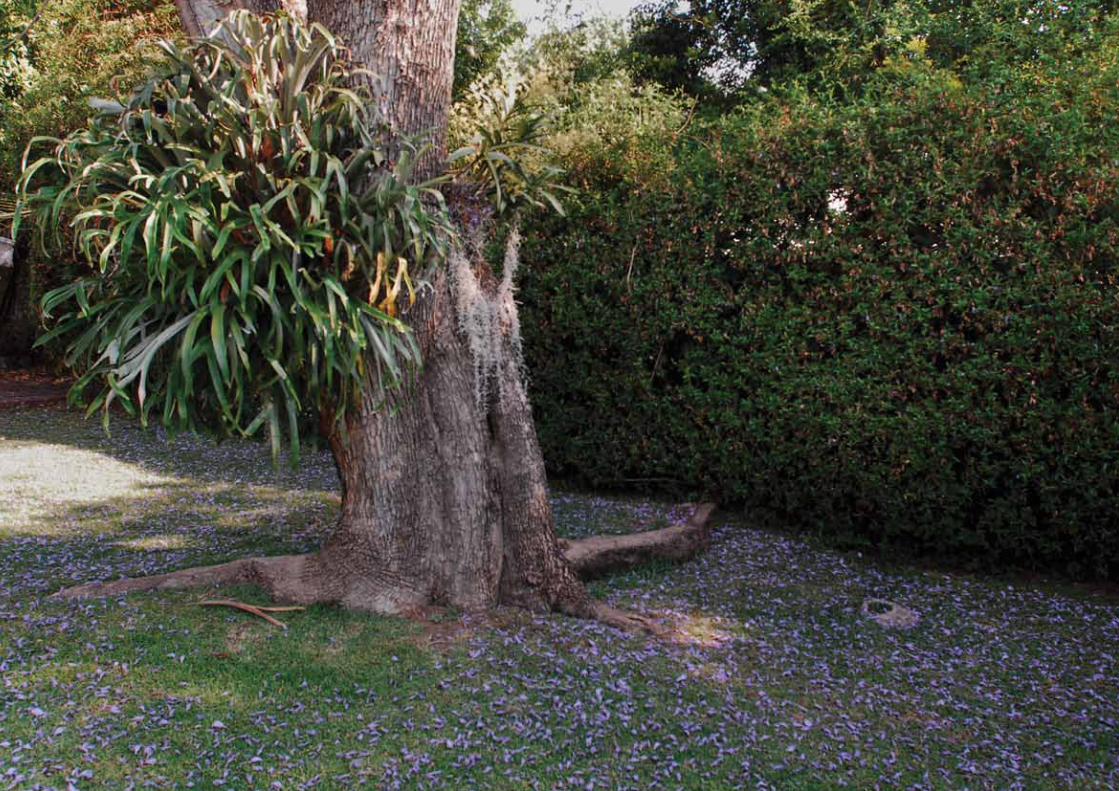
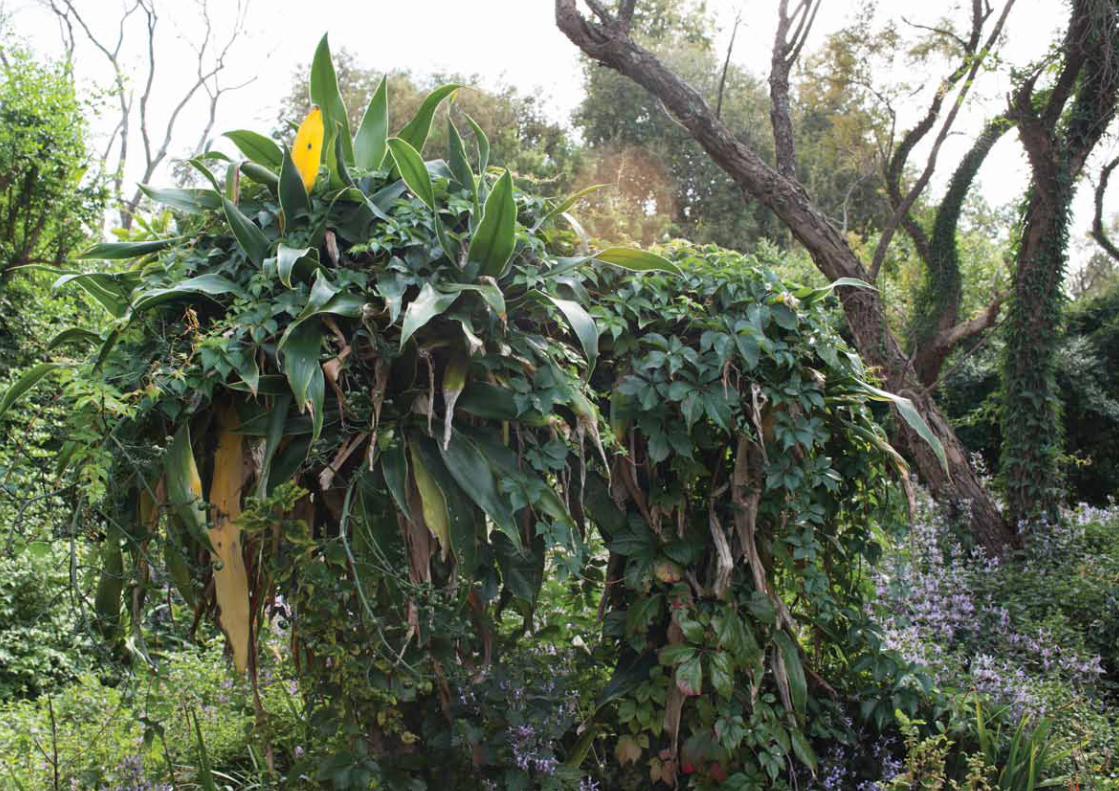


150
SECTION 5 Constructed landscapes: community and private sector green infrastructure initiatives
SECTION FIVEThis section analyses the role of non-government actors, such as local communities and the private sector, in creating green assets. Through a political-ecology lens, it provides an historical overview of the city-region’s colonial landscapes, and then reflects on the various economies and cultures currently at work to sustain or transform features of this landscape.
The STaTe of Green InfraSTrucTure In The Gcr
151Waterfall estate, Midrand, 2013
Constructed landscapes: community and private sector green infrastructure initiatives
Urbanization is often associated with the modification of
natural landscapes. The development of built-up areas
and laying down of infrastructure is a major threat to local
ecosystems in and around urban regions. However, as people
urbanize, they also partake in gardening and horticulture,
creating private landscapes that exist outside of the public
domain. These landscapes often expose processes of colonial
city-building that have produced striking divisions in spatial
form. The ‘home and garden’ archetype is often contested as
“the entitlement of white South Africans, while reproducing
generations of black people in relation to the land premised
on labour migrancy and domestic / garden work” (Murray,
2006). These local struggles related to space are some of the
condemned products of an unequal neoliberalism:
“…Johannesburg…is at once a city of monumental architecture and abysmal slums; a city of luxurious playgrounds for the rich and empty wastelands for the poor: a city of utopian fantasy and dystopian anxiety: and a city of collective memory and intentional forgetting…[where]…magnificent mansions and their luscious greenery contrasted with corrugated iron shacks forlornly sited on treeless, barren ground; spotlessly clean shopping malls in the northern suburbs contrasted with chicken feet grilled on open fires at taxi ranks in Soweto; expensive BMWs speeding past old black women trudging along the road after a hard day’s work; and homeless street kids begging handouts from insouciant middle-class urbanites in a hurry to get to a restaurant appointment in some trendy new hot spot. Johannesburg has always been, and remains so today, a city of spectacle and a city of ruin, where the jarring mismatch between extreme wealth and abject poverty has contributed to an enduring sense of unease and discomfort.” (Murray, 2008)

152
SECTION 5 Constructed landscapes: community and private sector green infrastructure initiatives
In these terms, the prejudices of an engineered aesthetic cater
for a wealthy elite, through the construction and partitioning
of landscapes (Murray, 2004; Chipkin, 2005). While useful,
this also presents an all too conventional account of the
archetypal colonial space, dichotomously expressed as
“nothing but the spatial embodiment of unequal economic
relations and coercive segregationist policies” (Mbembe &
Nuttal in Chipkin, 2005). However, there are questions to be
asked about how, within these divided landscapes, various
cultures and economies have emerged to create new forms
of green infrastructure. Notwithstanding their discontents, the
intriguing circuits of investments in private garden spaces, and
the gardening cultures that exist in much more varied ways
than we might think, provide an alternative lens than that
which focuses only on the nature of socio-economic divides.
A deeper understanding of private green space alerts us to a
political-ecology of the GCR’s landscapes, where indigenous
vegetation has been transformed but often replaced with new
vegetation and species, morphing into a strange ecological
form. This is not to dismiss the struggles associated with
private green space, but to provoke an interrogation into
the political-ecology of society’s investments in landscapes
and how this investment is not necessarily contained in the
wealthy ‘northern suburbs’ of the GCR, but activated across
cultures of place and consumption.
Colonial gardening cultures“From our sister country of Australia, sharing the same variety of climatic conditions as South Africa, has come a treasure-store of shade and flowering trees epitomized by the eucalypts which since they were first introduced by Sir Lowry Cole in 1828, have become ubiquitous in our land … The increasing popularity of the ornamental Chamaecy-paris, Cryptomeria, Cupressus, Juniperas, Taxodium, Taxus, and Thuya, lies in their effectiveness in creating an instant sense of grace, elegance and stateliness in a garden.” (Lighton, 1972)
The transformation of South Africa’s landscape is tied to
various political, socio-economic and ideological forces that
explain the widespread occurrence of exotic trees and forested
areas, garden landscapes, golf courses and large privately
managed green spaces. The establishment of tree plantations,
northWards house, ParktoWn, Johannesburg, 2013

153
The STaTe of Green InfraSTrucTure In The Gcr
to supplement timber supply, has roots in the country’s
colonial and apartheid history, where the exploitation of
indigenous forests for timber production saw the introduction
of exotic forests that have become such notorious features
of landscape of South Africa. Mirroring these trends, much
of the vegetation in Gauteng has to do with processes of
colonization and territorialisation, political manipulations of
space, coupled with state-driven tree planting schemes, and
attempts to beautify a seemingly ‘barren’ landscape. These
processes have manifested in an abundance of established
gardens, often designed around the periphery of a lawn,
and plantations of trees and shrubbery and flowerbeds,
accumulated over time into a suburban green space matrix,
of leafy, middle class neighbours. Implicated in a colonial and
bourgeois ecology, these landscapes represent an ecological
biography, predicated on movements of species for industrial
and commercial purposes and reproduced behind the walls of
private homes and properties:
Gardens of South Africa (Dorothea Fairbridge, 1924)“For Johannesburg has been blest in many ways: it has been built in an era in which the planning of the garden is reckoned only second in importance to the planning of the house…it is not easy to make a garden in that part of Johannesburg, for the natural structure of the land is rock and kopje, and the rock must be blasted out and the soil carted in if you want to plant trees, and to ensure them long life and prosperity. In planning the garden of Arcadia, Lady Phillips wisely left the kopjes as she found the, crowned with their native plants and queer edible berries, supplementing these in time with Aloes and other native plants and trees …”
Switzerland and Savoy advert (South African Gardening and Country Life, 1934)“In many lands it is increasingly difficult to find real country. There are endless dusty roads with hedges cut back in the interests of those who use motor cars. Flowers by the wayside have been destroyed and the hedges are no longer the resting place of song-birds. In many places low
fences have displaced the hedges, disfigured by horrible advertisements. Common land is trodden bare and littered with paper. Broken bottles and dirty paper markets mark the spot where picnic parties have gathered.”
sPringbok Park, tshWane, 2013

154
SECTION 5 Constructed landscapes: community and private sector green infrastructure initiatives
The Brenthurst Gardens (Alan Huw Smith, 1988)“’The site favoured the design of a beautiful garden with terraces, pergolas, water-pools, and a natural rock-garden in the lichened rocks on which the house stood’, Baker noted... It was a scheme of studied informality, typical of Baker, but one which did not survive for long. The ladies of Parktown vied with each other to recreate showcase gardens in an earlier and grander English tradition, and it was not long before the slopes of Marienhof were filled with row upon of geometrically clipped formal hedgework.”
Remarkable Gardens of South Africa (Nini Bairnsfather Cloete, 2012)“The Khatlampi Private Reserve lies in the heart of the vast area known as the Cradle of Humankind – a World Heritage site where the world’s most important human fossils have been found. Lying to the northwest of Johannesburg and covering 1 000 hectares, the reserve comprises five adjoining farms in the area. The landowners agreed to drop the fences between their properties, and the result was the creation of a unique environment of biodiversity that incorporates pristine grasslands, indigenous forests, caves and dolomite valleys, all of which have ben set aside to enable animals to roam free in their natural habitats ... The wonderful trees on the property were mostly already in situ and they are ‘unashamedly not indigenous’. Lofty English and pin oaks thrive here, along with combretums, various acacias and Cape willows, which are underplanted with grasses so as to blend into the veld.”
“Brenthurst – In an era of environmental awareness, dedicated plantswoman and passionate environmentalist Strilli Oppenheimer emphatically embraced the challenge of ‘blurring the boundaries between garden and nature’… One of South Africa’s premier residences, the famous Brenthurst estate also encapsulates the country’s gardening history. Once open veld, then planted to forestry in 1890 for building material for the town that was springing up across the treeless Highveld, today it’s the only estate of the Randlords of yesteryear that survives with its setting intact. A 16-hectare green lung in the centre of the City of Gold, it is being allowed to grow and breathe at will, secure from the ever-growing demands of expanding humanity.”
ParkWood, Johannesburg, 2013

The STaTe of Green InfraSTrucTure In The Gcr
155
These excerpts make for an intriguing enquiry into the
political-ecology of urbanized landscapes. In terms of
the transformation of a grassland and bushveld biome to
mixed-patch forested areas, gardens and managed parks,
Gauteng’s landscape invokes notions of spatial and ecological
engineering. Indeed, the dual occurrence of water challenges
in Gauteng and a largely introduced landscape, comprising
water-sapping exotics and equally problematic lawn-based
gardens, is an acute contradiction for naturally occurring
grassland. Socially punctuated critiques, on the other hand,
lambaste private green spaces as the products of apartheid,
the mark of white middle-class suburbia:
“A journey through Johannesburg traverses extreme models of housing and urban neighbourhoods. From enormous houses with vast landscaped gardens in tree lined avenues, to shacks sitting shoulder to shoulder separated by muddy paths.” (Poulsen, 2010)
“From the air, the pleasing bright green quilt of well-watered English-style gardens and thick alien trees that shade traditionally white – now slightly desegregated-suburbs, is pocked with ubiquitous sky-blue swimming pools.” (Bond, 2007)
“Seeking to escape what they perceive as the miasmal city, affluent residents have partitioned the urban landscape into a patchwork assemblage of bunkered enclaves that provide the fanciful illusion of sanitized, first-world cosmopolitanism in the midst of third-world impoverishment.” (Murray, 2008)
These descriptions conjure up images of men in green overalls
holding parts of a manicured scene together. Landscaping
and garden service ‘bakkies’, lawnmowers and leaf blowers
reinstate a landscape of leafy green suburbs, trees and private
gardens. Behind what may come across as a natural landscape
is a web of gardeners, private homeowners, landscapers,
garden services, plant growers and sellers that sustain vast
garden expanses. This is often viewed as a testimony to
an imperial aesthetic that has weaved “interior gardens,
landscape atriums, sequestered gathering places” (Murray,
2008) into the physique of Johannesburg’s northern suburbs
and other similar spaces in Gauteng. These connotations focus
on the struggles of the excluded versus the privileged, and
how this divide is reproduced in a neoliberal political-economy
and uneven urban form. However, this overlooks citizen
mobilization around different forms of green infrastructure,
the day-to-day operations of retail and wholesale nurseries
and the important knowledge base of gardeners and
homeowners, which are also not always different people.
Aside from mass media celebrating garden design and
some superficial accounts of the boom in garden services,
landscaping businesses and nurseries that accompanied the
construction of Johannesburg’s urban forest (Davie, 2002),
the gardening supply chain and its added value has been
studied in little empirical detail:
Jan sMuts avenue, 2013
Central avenue, houghton, 2013
Jabavu, soWeto, 2013

156
SECTION 5 Constructed landscapes: community and private sector green infrastructure initiatives
“How economically important (and ecologically influential), exactly, are the mini-industries of nurseries, seed distribution, garden tools, hedge-cutters and lawnmowers, paving stones, concrete gnomes, hosepipes, custom-made trellises, paid family-specific gardeners and garden-service teams, the advertising and the transportation expenditures required for all of these? I have found no studies which tell us; suffice it to speculate that it is substantial.” (Wylie, 2011)
The activities of the South African Green Industries Council
(SAGIC), the umbrella organization that represents the
consumer green industry in South Africa, does contribute
in both ‘jobs’ terms and in terms of the investment made by
citizens in landscapes. This happens through SAGIC’s subsidiary
organisations, such as the South African Nurserymen’s’
Association (SANA), the South African Landscaping Institute
(SALI), the Landscape Irrigation Association of South Africa
(LIA), the Lawnmower Association of South Africa (LMA),
the South African Arboricultural Association, the Interior
Plantscapers Association (IPSA), the South African Flower
Growers Association (SAFGA), the Institute of Environment
and Recreation Management (IERM) and the International
Plant Propagators Society (IPPS) (Life is a Garden, 2010). This
supply chain, together with more local networks, such as the
Johannesburg Garden Club (JSC) and Gardens of the Golden
City, maintain a significant portion of Johannesburg’s green
infrastructure that exists outside of public green space. While
these networks may be seen as extensions of an unequal
political economy, it is a misconception that the value chains
investing in private green infrastructure are only those colonial
cultures of greening. There are multiple dimensions of the
GCR’s horticultural scene, some of which have indeed spun
off colonial gardening, but are now activated in more varied
ways that deserve attention in terms of their ecological value.
Although these activities may not be as blatant or extravagant
as a northern suburbs bourgeois ecology, which some experts
have also argued is still intact, they represent the novelty and
complexity of private green infrastructure in the city-region.
orange grove, Johannesburg, 2013
hillbroW, Johannesburg, 2013
observatory, Johannesburg, 2013

The STaTe of Green InfraSTrucTure In The Gcr
157
‘Sustainable’ gardeningThe trend towards sustainable gardening has seen a
proliferation of trends variously packaged and promoted
as ‘eco-friendly gardening’, ‘gardening for climate change’,
‘water-wise gardening’, amongst others. Within these
movements, people seem to be increasingly patriotic about
indigenous vegetation (Geldenhuys, 2010). This is inspiring
landscapes purified of exotic and introduced species, largely
motivated as a shift towards holistic gardening, that works
in harmony with nature, and also to ease water stress by
‘becoming a water smart and water-wise gardener’ (Life is a
Garden, 2010; 2011). This changeover is apparent in large-scale
corporate and residential developments in Gauteng for which
the guidelines and specifications are increasingly inclined
towards ‘ecological restoration’, ‘indigenous’ ‘and ‘native’ land
use. Ballard & Jones (2008) see the relatively recent suburban
fad for indigenous as a break from the conventional suburban
gardening aesthetic of using global horticultural plants
through concerted efforts to bring nature appreciation into
the domestic sphere.
While these notions of sustainable gardening are admirable and
relevant, the context of indigenous plants is highly specific. A
number of professionals within the horticultural industry have
warned against the blanket application of indigenous planting
that ignores the specificity of a particular habitat. When asked
to comment on the growing interest in indigenous gardening,
an indigenous plant specialist in Gauteng is hesitant to
generalize about the nature of indigenous planting:
“As a specialist indigenous grower, I can reflect on the upward trend in indigenous gardening, and indeed there is a big trend, but the specificity of indigenous gardening in my nursery and in my local context is very different to what is broadly indigenous in South African terms. I can see the new species of butterflies and birds that have hitchhiked to my property on the outer edges of Gauteng from Kwa-Zulu Natal, but our weather conditions and landscape structure, being a more rural area, are different to what is found in more metropolitan landscapes. Because our landscape is more natural and non-urban, it makes sense to promote indigenous planning, since there have been fewer disturbances, but in the more urban landscapes, where things have been significantly disturbed, landscapes are constructed, re-developed, and when under pressure from environmental managers, destroyed and re-created to become indigenous again…” (Indigenous plant specialist, pers. comm, 2013)
An indigenous movement of growing popularity is marked
by practical complexities that may not feature on the face of
branding strategies geared to shift gardening preferences. A
Johannesburg-based landscape consultant, contemplating
the process of the design, installation and final utilisation of a
large-scale retirement garden, reflects on this retrospectively:

158
SECTION 5 Constructed landscapes: community and private sector green infrastructure initiatives
“The brief was for a strictly indigenous landscape, which was previously a blue gum plantation, where we even found Blue Vervet monkeys living in the trees, and this is in Joburg. We removed the Blue Gum, and planted over 3000 trees, and a dam with indigenous fish, which has drawn bird life and animals that were not there before, and all non-native gardening, such as rose gardening, was not permitted. But now, once our contract has ended, many of retired folk have started planted rose beds, because they were so used to growing up with roses in their gardens. So as much as the powers that be motivated an indigenously-strung landscape, people started planted on their own accord, surreptiously because it was what they wanted.” (Johannesburg landscape consultant, pers. comm, 2013)
Some of the negative kickbacks that ensued in this case of
a Blue Gum plantation remade into an indigenous landscape
may have been avoided through a more collaborative process
that assessed resident perceptions vis-a-vis landscaping
guidelines. A number of questions have also been raised
about whether the horticultural industry as a whole has
evolved from its colonial gardening history:
“Nurseries and landscapers aren’t doing enough to educate consumers about the role of particular indigenous plants in lieu of one of their most critical function, attracting pollinators. Although locally indigenous plants attract local pollinators, many exotics also do this, and have an ecological value in that regard.” (Environmental journalist, pers. comm, 2013)
“Although edible plant consumption comprises 80% of sales, the horticultural market as a whole has not really developed to cater for new demands, and is still catering for a 1960s Houghton lady. There are no wholesale, let alone, retail, nurseries in Soweto or Alexandra and but the market is there, although it may be different for different and more localized.” (Unnamed owner of a wholesale herb nursery in Gauteng, pers. comm, 2013)
Without diluting the significance of a sustainable transition
in gardening, it is important to recognise the variables that
influence an urban ecosystem. These include local conditions
such as the micro-climate, fertility of the land, and cultural and
economic variables, such as average income of the citizens,
which all need to be related to a set of conclusions about
what kind of landscape to invest in (Collins et al., 2000).
roCk, Maelola street, Jabavu, 2013

The STaTe of Green InfraSTrucTure In The Gcr
159
An organic servitude garden: a guerrilla gardening case studyCASe BRieF:
Client A approaches landscape consultant to reclaim a barren servitude between Client A and neighbour. The servitude measures
70 m x 3 m = 210 m2, and servitude was previously ridden with rats and a severe fire hazard, and prior to fencing off, used as
an illegal dumping site, now secured by means of a locked palisade fence at either end. Client A requested in project brief the
design and installation of an organic vegetable garden. The existing servitude area, although not barren, is overrun with weeds
of 2m in height, refuse, rubble and debris, which require cleaning and eradication. The site is on an extreme slope and erosion
will need to be controlled. Client A does not foresee that the produce from the organic servitude garden being for his own use,
(Client A has a family of five), but the produce is to be donated to a community school in Alexandra. The project brief also
stipulates that the area is to be demarcated into an accessible space, to include a pedestrian pathway or walkway, and that the
site is a working space or a ‘work in progress garden’. Within the limits of a Client A’s budget, the consultant requires initial
preparation where garden borders and beds are defined to plant a range of vegetables, herbs, citrus trees, and berry vines. The
methodology for installing the garden includes the terracing of an area, using CCA-treated / approved timber and retaining
blocks, organic compost and fertilizer. Borehole water from Client A’s premises will also be introduced and an irrigation system
installed. The consultant plans to use this project for raising awareness and to encourage fellow neighbours and the community
at large to adopt the principles encompassed by the garden.
The above case represents another distinctive trend
emerging in Gauteng and the world over towards edible
gardens, sometimes labelled as ‘urban agriculture’ or ‘food
gardens’ or ‘community gardens’. The motivation underlying
this movement is often for ‘self-sustaining gardening’, from
which people can produce and harvest food (Herb gardening
specialist in Gauteng, pers. comm, 2013). Additionally, non-
governmental organisations (NGOs), school-feeding
programmes and Corporate Social Investment (CSI) initiatives
are also driving a large part of the edible gardening trend.
In these instances, edible gardening is an interesting form
of change and social movement through urban agriculture
at more localized and often neighbourhood scales. Edible
garden initiatives are often identified for previously
disadvantaged communities and there is also a major focus
on addressing food insecurity in these contexts. For instance,
the Siyakhana Initiative for Ecological and Food Security
operates urban agriculture sites in Johannesburg to improve
food security, increase access to nutritious and sustainably
grown foods, and raise awareness of the impact of ecological
health promotion (Siyakhana, 2013). In light of these goals,
the case of municipal property appropriated by residents of a
neighbourhood represents similar activist notions to enhance
the productivity of landscapes for local food production.
While Client A sought municipal approval of the property, the
organic servitude project commenced without legal rights
gained. Client A also had the option of installing any kind
of garden, a monocultural lawn area or impermeable ‘hard-
scaping’ for example, and a significant choice was made at
a citizen level to develop an organic vegetable garden and
engage local communities.
sloPe With herb garden, 10th street killarney, Johannesburg, 2013
CoMPost and herbs at toP of sloPe, 10th street, killarney, Johannesburg, 2013

160
SECTION 5 Constructed landscapes: community and private sector green infrastructure initiatives
Medicinal gardeningSouth Africa’s annual local trade in medical plants amounts to
20 000t, representing 574 species (Water Wheel, 2013). However,
many medicinal plants are currently harvested at unsustainable
rates in the wild, and instead of being used for ‘muthi’, are fed into
export markets for big pharmaceutical companies (Indigenous
horticulturist in Gauteng, pers. comm, 2013):
“The true traditional healer understands ecology and will never over harvest. Unfortunately, many people now harvest plants indiscriminately as a source of income. While, legally many of these plants are protected and may not be removed from the wild, the spatial extent on which this activity is taking place makes it impossible to enforce legislation in this regard.” (Dr Wentzel, Water Research Commission, in Water Wheel, 2013)
The dispersal of medicinal plants through informal markets
increases the vulnerability of wild plant populations to
exploitation (Garden Africa, 2013). This trend has occurred as
medicinal plant collection has shifted from being almost solely
an activity of traditional specialists, to involve commercial
harvesters that supply plant material through formal sector
traders and, increasingly, through greater numbers of informal
sector businesses to supply large demand (Cunningham,
1993). In the GCR, an example of medicinal over-harvesting
is the trade of Drimia sanguinea, a “Near Threatened” (NT)
species according to SANBI’s threatened species or ‘Red List’
(SANBI, 2012). Drimia sanguinea is the most common species
sold in the Faraday market, central Johannesburg, and present
at more stalls and in bigger volumes than any other species
(Brueton in SANBI, 2012). According to Williams (in SANBI,
2012), the population of Drimia sanguinea has declined
by 20-25% in the last 60 years due to mass harvesting for
medicinal trade in Gauteng’s ‘muthi’ shops and via street
traders in Faraday market in particular. The Faraday Street
Market ‘hawkers of health’ are Gauteng’s largest vendors
of indigenous traditional medicine, described as a ‘hidden’
economy due to the difficulties in quantifying the subsistence
activities associated with medicinal plant trade that are
often extensions of household and domestic activities’
(Williams, 2003). Williams (2003) further notes that as with
other informal sector activities, there is a disproportionately
large number of females within the medicinal plant trade in
Gauteng with low education levels, and clustered in a poorly
paid, narrow income range.
For a market such as Faraday, primary customers are generally
self-employed traditional healers, who either cannot or do
not harvest their own medicine (Williams, 2003). Williams
(2003) captures these supply-related reasons from a survey
of customers at Faraday market:

The STaTe of Green InfraSTrucTure In The Gcr
161
• The market has a wide variety of plants
• The market sells muthi that works
• The plants are always available and fresh
• Faraday is closer to home
• Faraday is familiar to the respondents and some don’t
know other markets to buy plants from
• There are no places in Gauteng to ‘dig’ the plants known
to the respondents.
In light of these reasons, it is significant that Williams (2003)
found only 18,3% of traders at Faraday market harvest their
own plants; the remainder either buy plants from commercial
harvesters (36,6%) or gather small quantities and buy the
rest (45,2%). Therefore, despite a general shift from localized,
specialist medicinal plant harvesting towards commercial
activity, there are harvesting localities that are “difficult to
ascertain”, which, according to Williams, is because “some
traders do not know where plants are harvested or [are]
reluctant to offer this information” (Williams, 2003). These
invisible plant sources may not be easily accessed or viewed,
and in the event that harvesting does not take place in
large commercial plantations, are likely to be domestically
harvested on private properties. The image on the following
page depicts such a scene, a domestic medicinal garden in
Soweto, the owner of which describes her space as a “garden
used to grow plants and to help people with illnesses like
colds and flu or tummy problems” (Soweto medicinal garden
owner, pers. comm, 2013). The owner also mentioned she uses
the plants mostly for making teas (Soweto medicinal garden
owner, pers. comm, 2013). The planting and harvesting of
plants in such a localised manner highlights the varied nature
of domestic gardens which, although “private gardens”, are
clearly different from a typical English-style garden of the
‘northern suburbs’.
neProlePsis fern, Cussonia and rosMarinus offiCinalis, 2013

162
SECTION 5 Constructed landscapes: community and private sector green infrastructure initiatives
As Lubbe et al (2010) note, although domestic gardens are
part of a wider green infrastructure, the layout and species
of these gardens are often unique constructions of people
choosing to use “useful plants” and plant “vegetable gardens,
fruit trees and herb / medicinal gardens”. The authors reflect
that the functional nature of many domestic gardens is often
such that a much higher proportion of alien species is found
in these privately-managed spaces, as gardeners choose
hardier alien species for cultivation purposes (Lubbe et al.,
2010). These insights present domestic medicinal gardens
as a fascinating component of private green infrastructure.
These kinds of gardens expose untapped information on the
form and species composition of private green spaces to help
us understand the nature of green infrastructure currently
managed privately and the underlying ecological value. The
special skills and knowledge of traditional medicinal gardeners
also shed light on the fact that private gardens are associated
with a gradient of cultural and socio-economic preferences
and are not just objects of a wealthy, middle class manicured
landscape.
herb garden, Maelola street, Jabavu, 2013

The STaTe of Green InfraSTrucTure In The Gcr
163
The instant gardener“In the last 3 years, we have seen a changeover as the average person starts to get garden designers in to do ‘a new gardening’. People are much more open to indigenous gardening and as landscapers, we also know more about how to work with indigenous gardening. This is because people know how good indigenous looks and it, ‘indigenous’, was previously seen as messy. People are now internalizing this; through the value that indigenous is ‘low maintenance’ and because of various trends, such as both parents working, so gardens have to be low maintenance. It is very much the older generations for whom high maintenance makes sense. Unlike younger generations, however, many older generations have actually seen trees grow old, but younger people might not be able to experience this relation to nature. The result is that retailers, in meeting demands of customers, draw on instant trees grown in containers, transplanted into a garden as if it was always there… so while there is a definite decrease in annuals, there is still a perception that gardens suddenly happen.” (Gauteng-based landscaper, pers. comm, 2013)
The openness to indigenous gardening in Gauteng is a
positive gardening investment if more people are actually
investing and becoming involved in their own gardens.
However, according to an indigenous nursery owner on the
outskirts of Johannesburg, although there seems to be greater
appreciation and understanding of the value of gardening,
people are not generally making daily investments in their
gardens (Indigenous nursery owner, pers. comm, 2013).
Another nursery owner reflects:
“Daily gardening is not part of the lifestyle of younger generations, and in the case of townhouses or smaller developments, which are part of the “instant age”, people want a landscaper to make a garden look good and pretty. This is about clipped and trimmed vs. scruffy, wild and bushy. The problem is gardening is not a necessity, it’s last on our hierarchy of needs.” (Nursery owner, pers. comm, 2013)
This should not detract from a ‘changeover’ from the
“established gardener trend” where ornamentals and exotic
annual species have dominated for years (Herb Nursery owner,
pers. comm, 2013), but highlights the impacts of preconceived
ideas of what a garden should look like and how long it takes
to look a certain way. These social and psychological dynamics
situate gardening within aesthetic preferences and individual
choices that affect the nature of horticultural markets and
value chains. Reflecting on how this has happened in the
United States, for instance, Robbins has documented how the
aesthetic practices of consumer culture, coupled with various
trends in the agricultural sector, drive the use of lawn and lawn
chemicals that effectively cater for sprawl-based, low-density
suburban development (Robbins et al., 2001; Robbins et al.,
2003). While these “classed aesthetics” (Robbins et al., 2003)
may play out differently in Gauteng, particularly as younger
generations move into townhouse complexes or subdivided
plots, there is a definite interplay between ‘low maintenance’,
‘indigenous and ‘a pretty garden’ conceptions, all of which are
part of a consumption geography of affecting the construction
of landscapes. A final reflection on how social preference
continuously reproduces and transforms landscapes:
soWeto, Johannesburg, 2013
soWeto, Johannesburg, 2013
houghton, Johannesburg, 2013

164
SECTION 5 Constructed landscapes: community and private sector green infrastructure initiatives
Ambivalent landscapesWhile the landscapes of the GCR have altered naturally
occurring environments, they are also novel spaces of animals,
plants and microorganisms interacting with and sustained
by humans. The construction of novel landscapes has been
described as a process of “ecologies becoming urban
and cities becoming ecological” (Hinchliffe & Whatmore,
2006), creating ‘urban ecologies’, ‘urban nature’ or ‘urban
ecosystems. These entities have ignited global interest in the
convergence of human and ecological systems and stimulated
redefinitions of ‘traditional’ ecological values, construed as
the ‘pristine’ and ‘untouched’ (Rees, 2003).
Indeed, urban ecology as a concept, often embodying
introduced species, is far removed from what we find in national
parks, reserves and conservation areas (Braun, 2005). Urban
ecosystems, and various subsidiary ideas about horticulture
and designed landscapes, are often deemed anomalies from
a strict conservationist perspective (Cilliers et al., 2004). The
potency of the urban ecological controversy is such that
attention tends to be on ecosystems of the ‘wild’ or ‘rural’
pristine habitats (Pickett & Cadenasso, 2006). In this vein,
private urban green spaces are often viewed as an aberration
of what is natural, being constructed and planted version
of nature. The enigma of urban greenery in the city-region
becomes apparent through reflecting on the ordinary ways
in which people produce and utilize landscapes in a natural
grassland biome to create unique spaces and landscapes.
Further, what happens when landscapes are left unattended?
There is leftover vegetation that appears in the transects of
buildings and walls and the crevices of streets, remnants of
spaces once managed. Once discharged of human oversight,
vegetation is also often left to manoeuvre its own paths and
configuration, and represents a counter anecdote to what
is a manicured suburban garden. Understanding how these
landscapes are reinstated into the city-region, in ways that are
simultaneously intentional and incidental, reveals a network of
green infrastructure that is both natural and planted, ordinary
and introduced.
“in its ecological aspect (which is not securely divisible from its cultural aspect) the garden also lies in a troubled but creative interzone between “nature” and “culture”; between wilderness and the tamed; between agriculture and aesthetics,
utilising, blending, critiquing and redefining all these categories.” (Wylie, 2011)
“I’ve just completed a garden that was once a typical English garden, that floated into something that resembled a French Rivera garden, where the scope was to take everything out and create a new indigenous garden. The only exotic I left in was a Magnolia and Plectranthus. I’ve also just been asked to re-design a small townhouse complex, built in the 90s when palms were in fashion. Now we’ve taken all the big palms and made the pool smaller…” (Gauteng-based landscaper, pers. comm, 2013)
aloe sP. and PortulaCCa oleraCeae (Purslane), 2013
tWo sPeCies of bryoPhylluM and galansonga Parvifolia, 2013

The STaTe of Green InfraSTrucTure In The Gcr
165
ConclusionIn exploring the full ambit of green infrastructure, we need to
consider how landscapes come to be and are changed. Various
forms of horticulture, urban agriculture, medicinal gardening,
and iterations of ‘sustainable’ planting movements, by and
large exist because of a human choice to plant something.
Overcoming a preconceived idea of what a garden is in the
GCR uncovers landscapes that are constructed by citizens
and transcribed in local knowledge. This is about appreciating
the interaction between a gardener, who may or may not
be the owner of a garden, and a wider landscape, and how
this relationship is valuable, not only a product of society’s
divisions.
herb garden, Maelola street, Jabavu, 2013


XENIANatasha Christopher
Tradescantia pallida, Johannesburg, 2013


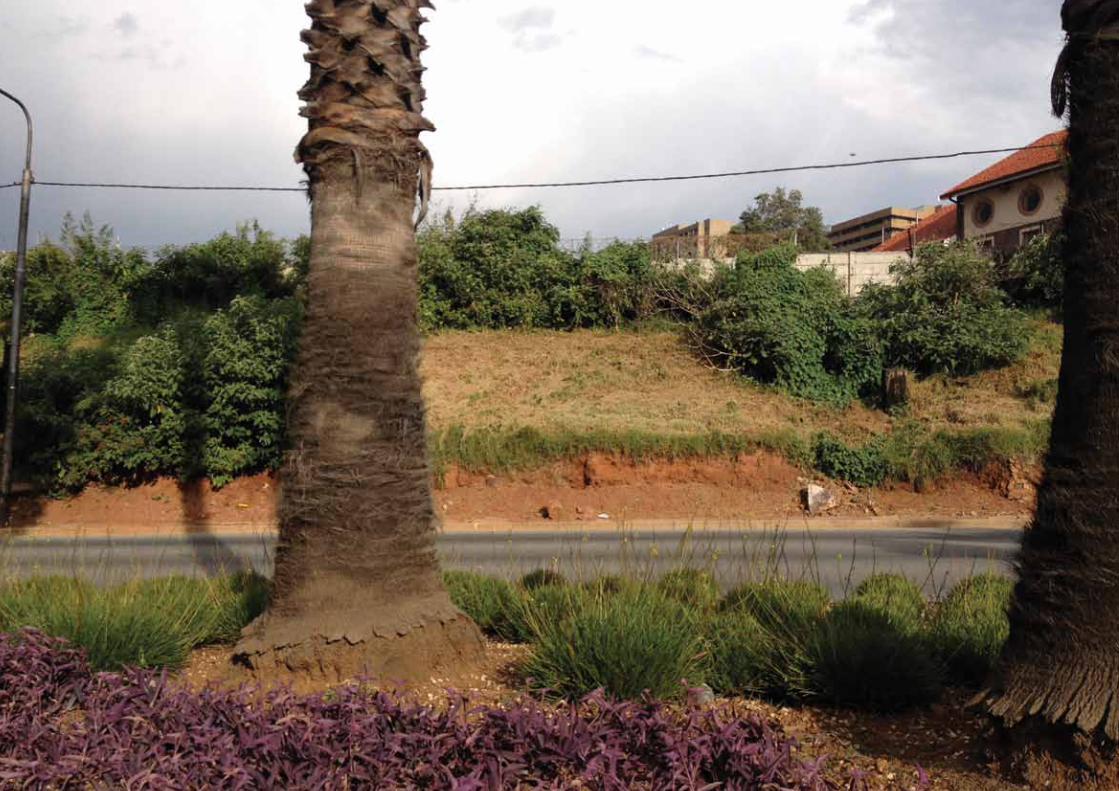


172
SECTION 6 Research pathways ahead
SECTION SIXThis concluding chapter briefly summarizes the report’s key findings and its implications for future research pathways to be pursued by GCRO.

The STaTe of Green InfraSTrucTure In The Gcr
173
Research pathways ahead
This report is a first step towards developing a Green
Infrastructure Plan for the GCR. A basis has been provided
for understanding the composition, extent, distribution and
connectivity of green infrastructure. This has shown how the
services of green infrastructure are valued and understood by
government and citizens, and the different ways that these
stakeholders invest in landscapes.
A number of key areas have emerged where further research
and engagement is necessary. These include robust and
integrated data in terms of how information about green
assets is recorded and collated. Without more sophisticated
understandings of the nature and diversity of green
infrastructure across the GCR, financial resources and political
mandates may struggle to relate to the services provided by
green assets. This is critical so that the currently undervalued
green infrastructure of the city-region can be connected into
the architectures of public and private decision-making. There
are interesting paths to be carved out in developing a future
research agenda on the GCR’s green infrastructure:
Integrated data inventoriesThe journey of this report was about how best to understand
the current nature and condition of green infrastructure in the
GCR. Visual and digital spatial data resources have proved
critical in this quest and it seems that more progressive
research and planning trajectories that value the services
of green infrastructure will need to look to green asset
information that is more accurate and consistent. This will
depend on the creation of synergies between government
departments and a more nuanced understanding of how
green infrastructure provides services to the city-region.
Critically, this depends on the way individual municipalities
record green asset data, since there is currently no standardized
method of doing so. Addressing a series of inconsistencies
in the way green infrastructure is understood, perceived and
represented across the city-region’s public custodians is also
critical. A future look into how municipalities can consolidate
knowledge may therefore benefit a research agenda looking
to public green asset data as an important vehicle for valuing
ecosystem services. This highlights the importance of a shared
Palm trees on Jan smuts, Johannesburg, 2013

172
SECTION 6 Research pathways ahead
facility for integrating data across municipalities since ecosystem valuation for the GCR requires data in a more robust and
consistent format than what is currently available at municipal level. Additionally, many green assets, such as trees on private
properties, fall outside of municipal jurisdiction. The possibility of improving the use of spatial data to grasp the full extent of
green infrastructure in the city-region is therefore an important strategic conversation with and between municipalities.
Prioritising ecosystem servicesQuestions remain about how best to use green asset data to identify and prioritise ecosystem services in the city-region. An
exercise that looks to the kind of ecosystem services provided by different green assets, and which functions are relevant in light
of current challenges facing the GCR, may assist in according green infrastructure an economic or financial ‘Rand value’. This is
based on the underlying principle that by effectively valuing ecosystem services, green assets can be understood in the same
way as engineered systems, and similarly accounted for in municipal budgeting, planning and infrastructure asset management.
A key issue here is how to link accurate spatial data to primary data on the services flowing from ecological systems.
Government expenditure, revenue and accounting systemsExtending our understanding of infrastructure requires a fine-grained understanding of public revenue, expenditure and
accounting procedures. In terms of expenditure, local government administrations are often driven by the imperative to spend
large capital budgets, on big pipes and culverts, so that even with fiscal pressures there is little incentive within the engineering
domain to innovate for green infrastructure. Government revenue and accounting procedures are also driven by a standard
set of exigencies, such as completeness of revenue, no under – or over – expenditure within the parameters of a budget, and
asset deprecation. Within these, there is little space for understanding a set of undervalued ecosystem services and how green
infrastructure, such as trees, parks, wetlands and food gardens, can appreciate over time. Our future research will look more
closely at this.
ConclusionA Green Infrastructure Plan for the GCR stands to benefit from an improved and deeper grasp on the city-region’s green assets.
How these can be understood as infrastructure will depend on strategic conversations between different stakeholders so we
can identify where in the infrastructure planning process there is room for alternatives. This involves paying close attention
to the need for urban services and how investments in green infrastructure can help us extend and maintain access to these
services in more sustainable ways than what is currently delivered.
Killarney, Johannesburg, 2013

The STaTe of Green InfraSTrucTure In The Gcr
173


BODYNatasha Christopher
Bag, Nest, Johannesburg, 2013Cicatrix, Johannesburg, 2013
Home, Johannesburg, 2013


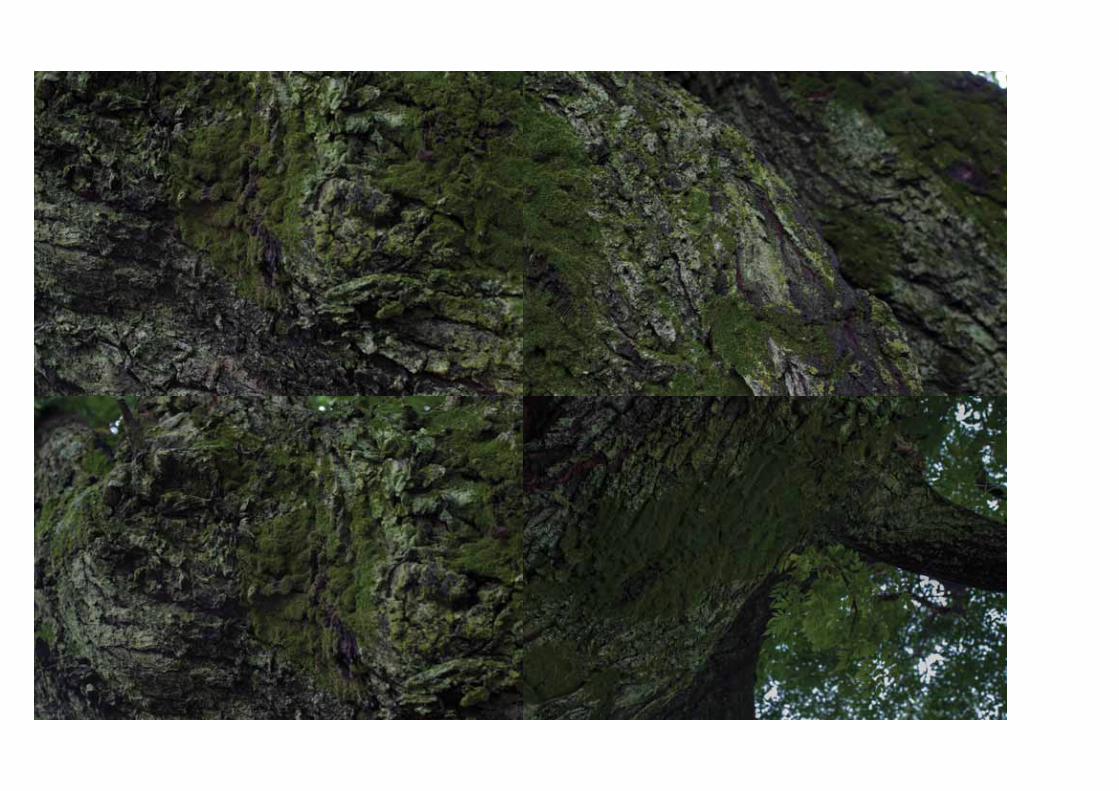

184
Annexure
Annexure A
Differences in municipal park classificationParks are differently categorised across municipalities. Figure
45 shows that parks are classified in the West Rand District
Municipality as ‘open space’ points, in Ekurhuleni as ‘parks and
open spaces’, and in Johannesburg as both ‘open spaces’ and
‘parks’. The inconsistencies may indicate differences in park
conceptualisation and definitions. The different features, i.e.
‘points’ used versus polygons, also indicate different formats
in the way spatial data is digitized.
Open space points
Parks and open spaces
Parks
Open spaces
Figure 45. Differences in municipal park classification
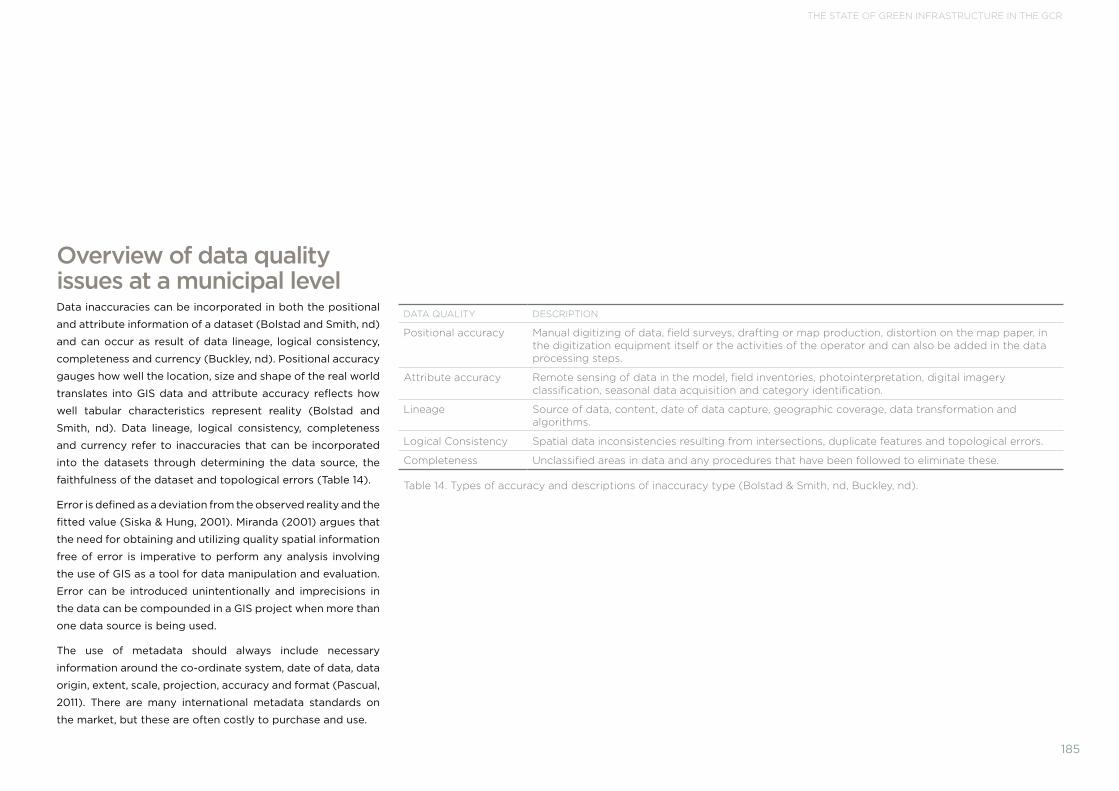
The STaTe OF Green InFraSTrucTure In The Gcr
185
Overview of data quality issues at a municipal levelData inaccuracies can be incorporated in both the positional
and attribute information of a dataset (Bolstad and Smith, nd)
and can occur as result of data lineage, logical consistency,
completeness and currency (Buckley, nd). Positional accuracy
gauges how well the location, size and shape of the real world
translates into GIS data and attribute accuracy reflects how
well tabular characteristics represent reality (Bolstad and
Smith, nd). Data lineage, logical consistency, completeness
and currency refer to inaccuracies that can be incorporated
into the datasets through determining the data source, the
faithfulness of the dataset and topological errors (Table 14).
Error is defined as a deviation from the observed reality and the
fitted value (Siska & Hung, 2001). Miranda (2001) argues that
the need for obtaining and utilizing quality spatial information
free of error is imperative to perform any analysis involving
the use of GIS as a tool for data manipulation and evaluation.
Error can be introduced unintentionally and imprecisions in
the data can be compounded in a GIS project when more than
one data source is being used.
The use of metadata should always include necessary
information around the co-ordinate system, date of data, data
origin, extent, scale, projection, accuracy and format (Pascual,
2011). There are many international metadata standards on
the market, but these are often costly to purchase and use.
DaTa QualITy DeScrIPTIOn
Positional accuracy Manual digitizing of data, field surveys, drafting or map production, distortion on the map paper, in the digitization equipment itself or the activities of the operator and can also be added in the data processing steps.
attribute accuracy remote sensing of data in the model, field inventories, photointerpretation, digital imagery classification, seasonal data acquisition and category identification.
lineage Source of data, content, date of data capture, geographic coverage, data transformation and algorithms.
logical consistency Spatial data inconsistencies resulting from intersections, duplicate features and topological errors.
completeness unclassified areas in data and any procedures that have been followed to eliminate these.
Table 14. Types of accuracy and descriptions of inaccuracy type (Bolstad & Smith, nd, Buckley, nd).


JACARANDANatasha Christopher
October, November, Johannesburg, 2007 - 2010


192
RefeRences
Ahern, J. 2007. Green infrastructure for cities: The Spatial Dimension, in Novotny ,V. and Brown, P., Cities of the Future Towards Integrated Sustainable Water and Landscape. London: IWA Publishing.
Allen II, W.L. 2012. Advancing Green Infrastructure at All Scales: From Landscape to Site, Environmental Practice, 14 (1): 17-25, March.
Asabere, P.K. 2012. The Value of Homes in Cluster Development Residential Districts: The Relative Significance of the Permanent Open Spaces Associated with Clusters, Journal of Real Estate Financial Economics.
Bairnsfather Cloete, N. 2012. Remarkable Gardens of South Africa. Quivertree Publications.
Baldinger, P. and Turner, J.L. No date. Report on the Status of Environmental Financing in China. Available at: http://www.wilsoncenter.org
Ballard, R. & Jones, G.A. 2008. Natural neighbours: indigenous landscapes and ‘eco-estates’ in Durban, South Africa, Annals of the Association of American Geographers, 101 (1): 131-148.
Batchelor, P. 1969. The Origin of the Garden City Concept of Urban Form, Journal of the Society of Architectural Historians, 28 (3): 184-200.
Bedforview & Edenvale News. 2012. Ekurhuleni plants trees to give life this Arbor Week. [Online]. Available: http://www.looklocal.co.za/looklocal/content/en/bedfordview-edenvale/bedfordview-edenvale-news municipal?oid=6150445&sn=Detail&pid=217416&Ekurhuleni-plants-trees-to-give-life-this-Arbor-Week – [6 September 2012].
Beecham, S. and Fallahzadeh, R. 2011. Innovative Approaches to Urban Water Management in Developing Countries, 5th International Conference on Sustainable Development and Planning, New Forest, UK.
Belanger, P. 2009. Landscape as Infrastructure, Landscape Journal, 28 (1).
Bedfordview Edenvale News. 2012. Ekurhuleni plants trees to give life this Arbor Week. [Online]. Available: http://www.looklocal.co.za/looklocal/content/en/bedfordview-edenvale/bedfordview-edenvale-news-municipal?oid=6150445&sn=Detail&pid=217416&Ekurhuleni-plants-trees-to-give-life-this-Arbor-Week – 6 September, 2012.
Benedict, M. & McMahon, E.T. 2002. Green infrastructure: smart conservation for the 21st century, Renewable Resources Journal, 20 (3): 12-17.
Benedict, Mark & McMahon, E. T. 2006. Green Infrastructure: Linking Landscapes and Communities. Washington, D.C.: Island Press.
Bennett, B.M. 2011. A Global History of Australian Trees, Journal of the History of Biology, 44: 125-145.
Bennet, B. M. 2010. The El Dorado of Forestry: The Ecalyptus in India, South Africa, and Thailand, 1850-2000 in Boomgaard, P., Hart, M., International Review of Social
History Special Issues, Globalization, Environmental Change and Social History.
Braat, L.C. & de Groot, R. 2010. The ecosystem services agenda: bridging the worlds of natural science and economics, conservation and development, and public and private policy, Ecosystem Services, 1, 4-15.
Bolund, P., & Hunhammar, S. 1999. Ecosystem services in urban areas, Ecological Economics, 29: 293-301.
Buckley, D. J. n.d. Data Accuracy and Quality. BGIS Introduction to GIS. [Online]. Available: http://bgis.sanbi.org/gis-primer/page_08.htm [28 June 2013].
Bolstad, P. V., and Smith, J.L .1992. Errors in GIS, Journal of Forestry, 90: 21-29.
Bond, P. 2007. The Heart of Global Apartheid: ‘Joburg’, Paper presented at the Centre de Cultura Contemporània de Barcelona. KwaZulul-Natal: Centre for Civil Society, 2-23, September
Bouwer R., 2008. A feasibility assessment of the application of environmental valuation methods to Rand Water open space, M.Sc dissertation, University of South Africa
Brander, L.M. & Koetse, M.J. 2007. The Value of Urban Open Space: Meta-Analyses of Contingent Valuation and Hedonic Pricing Results, Working Paper: I. 07/03. Amsterdam: Institute for Environmental Studies, Vrije Universiteit.
Braun, B. 2005. Environmental issues: writing a more-than-human urban geography, Progress in Human Geography, 29 (5): 635–650
Byrne, J. and Sipe, N. (2010) Green and open space planning for urban consolidation – a review of the literature, Urban Research Program, Issues Paper 11, URP Brisbane, 1-54
Cameron, R.W.F., Blanusa, T., Taylor, J. E., Salisbury, A., HALSTEAD, A.J., Henricot, B.& Thomspon, K. 2012. The domestic garden – its contribution to urban green infrastructure, Urban Forestry & Urban Greening, 11: 129-137.
Center for Neighbourhood Technology (CNT). 2010. The Value of Green Infrastructure: A Guide to Recognizing Its Economic, Environmental and Social Benefits.
Chan, K.M.A., Shaw. M.R., Cameron, D.R., Underwood, E.C. & Daily, G.C. 2006. Conservation Planning for Ecosystem Services, PLoS Biology, 4 (11).
Choumert, J. & Slanié, J. 2008. Provision of urban green spaces: Some insights from economics, Landscape Research, 33 (3): 331-345, June.
Chipkin, I. 2005. The Political Stakes of Academic Research: Perspectives on Johannesburg, African Studies Review, 48 (2): 87-109, September.
Cilliers, S.S, Müler, N, & Drewes, E. 2004. Overview on urban nature conservation: situation in the western-grassland biome of South Africa, Urban Forestry & Urban Greening, 3:49–62.
City of Cape Town. 2003. Biodiversity Strategy. Environmental Resource Management Department. Available at: http://www.capetown.gov.za/en/EnvironmentalResourceManagement/publications/Documents/Biodiversity_Strategy.pdf.
City of Johannesburg (CoJ). 2002. Johannesburg Metropolitan Open Space System. Pretoria: Strategic Environmental Focus, October
City of Johannesburg (COJ). 2004a. Jozi’s urban forest now at 10m trees, and growing. [Online]. Available: http://www.joburg.org.za/index.php?option=com_content&task=view&id=408&Itemid=52 [6 June 2010]
City of Johannesburg (CoJ). 2004b. Johannesburg Metropolitan Open Space Policy, May, Pretoria: Strategic Environmental Focus.
City of Johannesburg (CoJ). 2008. State of Environment Report. [Online]. Available: http://www.joburg-archive.co.za/2003/budget/idp/annex3.pdf [13 June 2010].
City of Johannesburg (CoJ): Johannesburg City Parks (JCP). 2008/9. Annual Report 2008/9 [Online]. Available: http://www.jhbcityparks.com/pdfs/annual_report089.pdf [6 June 2013].
City of Johannesburg (CoJ): Johannesburg City Parks (JCP). 2009/10. Annual Report 2000/10 [Online]. Available: http://www.jhbcityparks.com/images/stories/pdfs/annual_report0910.pdf [6 June 2013].
City of Johannesburg (Coj): Johannesburg City Parks (JCP). 2010. Diepkloof gets its extreme park. [Online]. http://www.joburg.org.za/index.php?option=com_content&task=view&id=2465&Itemid=207 [6 September 2010].
City of Johannesburg (CoJ): Johannesburg City Parks (JCP). 2010. GIS Department. [Personal Communication]. [31 August 2010].
City of Johannesburg (CoJ). 2011. Draft Bioregional plan for the City of Johannesburg – 14 October 2011, Report prepared for the grasslands programme, Pretoria: SANBI.
City of Johannesburg (CoJ). 2012. Public Spaces. [Online]. Available: http://www.joburg.org.za/index.php?option=com_content&task=view&id=1734&Itemid=49 [27 June 2013].
City of Johannesburg (CoJ): Johannesburg City Parks (JCP). 2012. Greening Soweto: Transforming dustbowls and landfill sites to award-winning parks and eco-services. [Online]. Available: http://www.jhbcityparks.com/pdfs/greening_soweto12.pdf [27 June 2013].
City of Johannesburg (CoJ): Johannesburg City Parks (JCP). 2013. City Parks and Zoo receives R693 million. [Online]. Available: http://www.jhbcityparks.com/index.php/media-room-mainmenu-90/news-mainmenu-56/933-city-parks-and-zoo-receives-r693-million [26 June 2013].
City of Johannesburg (CoJ): Johannesburg City Parks (JCP: Official. 2013. [Personal communication]. [3 February 2013].
ReferencesCity of Johannesburg (CoJ). 2012. Eagle, J. [Personal communication]. [28 November 2012]
City of Johannesburg: Johannesburg City Parks. 2012. Letsoko & Njingolo [Personal communication]. [28 November 2012]
City of Johannesburg. 2012. Ward 73 committee member [Personal communication]. [28 November 2012]
City of Johannesburg: Johannesburg Roads Agency (JRA). 2012. JRA official, 2012, [Personal Communication]. [21 November 2012]
City of Johannesburg: Johannesburg City Parks. 2012 [Personal communication]. [20 November 2012].
City of Tshwane (CoT). 2003. Tshwane Urban Forestry Policy.
City of Tshwane (CoT). 2005a. Proposed Tshwane Open Space Framework, Volume 1: Status quo, Pretoria: South Africa
City of Tshwane (CoT). 2005b. Tshwane Integrated Environmental Policy (TIEP), January 2005.
City of Tshwane (CoT). 2005c. Strategy for Environmental Education and Training for Employees. [Online]. Available: http://www.tshwane.gov.za/Services/EnvironmentalManagement/Internal%20Environmental%20Educational%20Strategy/InternalEducationStrategy.pdf [3 January 2012].
City of Tshwane (CoT). 2006. Flooding in Tshwane, January and February 2006. Service Delivery Department: Roads and Stormwater Division.
City of Tshwane (CoT). 2007. Local Open Space Plan for Soshanguve: Tshwane Agriculture and Environmental Management
City of Tshwane (CoT). 2010. Groenkloof Nature Reserve. [Online]. Available: http://www.tshwane.gov.za/Services/Nature%20Conservation/Pages/Groenkloof-Nature-Reserve.aspx [3 January 2012].
City of Tshwane (CoT). 2011, Draft (Final) Bioregional Plan for City of Tshwane, prepared by Holness, S and Skowno, A, South African National Biodiversity Institute Programme.
City of Tshwane (CoT). 2012a. Spatial Development Framework. [Online]. Available: http://www.tshwane.gov.za/AboutTshwane/CityManagement/CityDepartments/City%20Planning,%20Development%20and%20Regional%20Services/MSDF%202012/Chapter%204.pdf [8 December 2012].
City of Tshwane (CoT). 2012b. Draft Growth and Development Strategy 2055. [Online]. Available: http://www.tshwane2055.gov.za/ [3 January 2012].
City of Tshwane (CoT). 2012c. Urban Forestry Arbor Portfolio.
The STaTe of Green InfraSTrucTure In The Gcr
193
City of Tshwane (CoT). 2012. Tshwane Nature Conservation and Resorts Management official. [Personal Communication]. 7 December 2012.
City of Tshwane (CoT). 2012. Maine, N. [Personal Communication]. [20 September 2012].
City of Tshwane, (CoT). 2012. Van den Berg, J. [Personal Communication]. 7 December 2012.
City of Tshwane (CoT). 2012. Dry, B. [Personal Communication]. 7 December 2012.
City of Tshwane (CoT). 2012. Cemeteries, Parks and Horticultural Services Official. [Personal Communication]. 7 December 2012.
Colding, J. & Folke, C. 2008. The Role of Golf Courses in Biodiversity Conservation and Ecosystem Management, Ecosystems, 11 November.
Cole, D.H. 2008. The “Stern Review” and its Critics: Implications for the Theory and Practice of Benefit-Cost Analysis, Faculty Publications, Indiana State Law School, Paper 356. Available at: http://www.repository.law.indiana.edu/facpub/356
Collins, J.P., Kinzig, A., Grimm, N.B., Fagan, W.F., Hope, D., Wu, J. & Borer, E.T. 2000. A New Urban Ecology: Modelling human communities as integral parts of ecosystems poses special problems for the development and testing of ecological theory, American Scientist, 88: 416-425.
Commission for Architecture and the Built Environment. 2009. Grey to green: How we shift funding and skills to green our cities.
Council for Scientific and Industrial Research (CSIR). 2000. ‘Red Book’, Guidelines for Human Settlement, Planning and Design.
Cunningham, A.B. 1993. African Medicinal Plants: Setting Priorities at the interface between conservation and primary healthcare, People and Plants Working Paper, 1993.
Davie, L. 2002. Delta Park Proves that Exotics can be Useful. [Online]. Available: http://www.joburg.org.za/index.php?option=com_content&do_pdf=1&id=354 [4 July 2012].
Davis, A.Y., Belaire, J.A, Farfan, M.A., Milz, D., Sweeney, E.R, Loss, S.R & Minor, E.S. 2012. Green infrastructure and bird diversity across an urban socioeconomic gradient, Ecosphere, 3 (11), November.
Departmnet of Agriculture. 1983. Conservation of Agriculutral Resources act, 1983 (Act No. 43 of 1983).
Department of Environmental Affairs. 2009. Minister Sonjica launches Buyisela (Eco-Towns) Greening and Cleaning Pilot Project in Mthatha. [Online]. Available: http://www.info.gov.za/speech/DynamicAction?pageid=461&sid=5339&tid=5484 [9 October 2012].
Department of Water Affairs. 2009. Dolomite Guideline: A short guide to available documents on procedures for developing dolomitic land. [Online]. Available: http://www.dwa.gov.za/Groundwater/Documents/Dolomite/DWA%20
Dolomite%20Guideline%202009%20(Final)11.pdf [22 March 2013].
Del Tredici, P. 2007. The role of horticulture in a changing world, In Conand, M. & Kress, W.J. (eds), Botanical Progress, Horticultural Innovation, and Cultural Changes: 259-264, Washington D.C: Dumarton Oaks.
Del Tredici, P. 2010. A Primer on Urban Ecology in Arnold Arboretum and Harvard Graduate School of Design. [Online]. Available: http://www.asla.org/uploadedFiles/CMS/Meetings_and_Events/2010_Annual_Meeting_Handouts/Fri-D8_Wild%20Urban%20Plants_The%20Future%20is%20Now.pdf [10 April]
De Wit, M.P. & Blignaut, J.N. 2006. Using monetary valuation results with specific reference to grasslands in South Africa, De Wit Sustainable Options (Pty) Ltd Report No: SO 6002. Brackenfell: DWSO.
De Wit, M.P., Jayiya, T., Van Zyl, H., Crookes, D.C and Blignaut, J.N. 2009a. Methodology to value the natural and environmental resources of the City of Cape Town, Draft report prepared for Environmental Resource Management Department, City of Cape Town, 7 April.
De Wit, M.P., Van Zyl, H., Crookes, D.J., Blignaut, J.N., Jayiya, T., Goiset, V. & Mahumani, B.K. 2009b. Investing in Natural Assets: A Business Case for the Environment in the City of Cape Town, Report prepared for the City of Cape Town, 18 August.
De Wit, M.P. & Van Zyl, H. 2010 Identifying options for raising revenue and capital for the City of Cape Town to pay for environmental services, Draft report submitted to City of Cape Town, March.
De Wit, M.P., Van Zyl, H., Crookes, D.J., Blignaut, J.N., Jayiya, T., Goiset, V. & Mahumani, B.K. 2012. Including the economic value of well-functioning urban ecosystems in financial decisions: Evidence from a process in Cape Town, Ecosystem Services (http://dx.doi.org/10.1016/j.ecoser.2012.08.002)
Development Bank of Southern Africa. 2012. The State of South Africa’s Economic Infrastructure: Opportunities and challenges 2012.
Development Bank of South Africa (DBSA), 2011. Greening Infrastructure. Development Conversations, Roundtable held on 9 November 2011
Digital Humanities Initiative (DHi). 2012. Soweto: A Spatial History. [Online]. Available: http://dhinitiative.org/projects/shgis/?page_id=61 [17 April 2013].
Dodds R.S. 2010. An Investigation into the Hedonic Price Analysis of the Structural Characteristics of Residential Property in the West Rand, MSc dissertation, Faculty of Engineering and the Built Environment, University of the Witwatersrand, Johannesburg.
Egyedi, T., Spirco, J., 2011. Standards in transitions: Catalyzing infrastructure change, Futures, 1–14
Eliovson, S. 1979. Garden Beauty of South Africa. Johannesburg: Macmillan South Africa.
Environmental journalist. 2013. [Personal Communication]. 3 June 2013.
Ekurhuleni Metropolitan Municipality (EMM). 2004. Ekurhuleni State of the Environment Report 2004.
Ekurhuleni Metropolitan Municipality (EMM). 2007. By-Law: Planting, Pruning, Removal and Treatment of Street Trees, April 2007.
Ekurhuleni Metropolitan Municipality (EMM). 2007. Wetlands Inventory Report Identification, Classification, Assessment and Delineation of Wetlands within Ekurhuleni Metropolitan Municipality.
Ekurhuleni Metropolitan Municipality (EMM). 2009. Ekurhuleni Biodiversity and Open Space Strategy: EBOSS 2009.
Ekurhuleni Metropolitan Municipality (EMM). 2011a. Draft Bioregional Plan for Ekurhuleni Metropolitan Municipality, June 2011.
Ekurhuleni Metropolitan Municipality (EMM). 2011b. Final Metropolitan Spatial Development Framework (MSDF) 2011, 20 April 2011.
Ekurhuleni Metropolitan Municipality (EMM). 2012a. Ekurhuleni Environmental Policy.
Ekurhuleni Metropolitan Municipality (EMM). 2012b. Draft Growth and Development Strategy 2055, 9 July.
Ekurhuleni Metropolitan Municipality (EMM). 2012c. MMC for Environmental Development speaking at Arbor Week launch in Duduza. [Online]. Available: http://www.looklocal.co.za/looklocal/content/en/springs/springs-news-municipal?oid=6150800&sn=Detail&pid=490321&Metro-launches-arbor-week [22 December 2012].
Ekurhuleni Metropolitan Municipality (EMM). 2012d. Mayoral Speech – Ekurhuleni Metropolitan Municipality. [Online]. Available: http://www.ekurhuleni.gov.za/your-council/local-laws-and-policies/doc_download/596-mayoral-speech--20120927 [22 December 2012].
Ekurhuleni Metropolitan Municipality (EMM). 2012. The State of the City address by Councillor Mondli Gungubele, Executive Mayor of the City of Ekurhuleni, Germiston Council Chambers. [Online]. Available: http://www.info.gov.za/speech/DynamicAction?pageid=461&sid=26763&tid=65130, accessed [22 December 2012].
Ekurhuleni Metropolitan Municipality (EMM). 2013. IDP, Budget and SDBIP 2013/14-2015/2016. Emfuleni Local Municipality. 2007. IDP FOR 2007/2012: Environmental programme of Action (EPoA) 2007.
Emfuleni Local Municipality (ELM). 2009. Interim Annual Report 2008/9, Draft 31 October 2009.
Emfuleni Local Municipality (ELM). 2011. Integrated Development Plan (IDP) 2011/12, Chapter 2. [Online].
Available: http://www.sedibeng.gov.za/a_keydocs/idp_2011_12/chapter_2.pdf [4 July 2013].
Emfuleni Local Municipality (ELM). 2012a. Emfuleni Spatial Development Framework 2012/2017.
Emfuleni Local Municipality (ELM). 2012b. Sebokeng and Evaton Open Space Plan, 9 March 2012.
Emfuleni Local Municipality (ELM). 2012C. Multi-Year Operational Plan for the budget yeas 2012-2015, Parks, Open Spaces and Grass Cutting.
Emfuleni Local Municipality (ELM). 2012. Department of Environmental Management, Health and Social Development Official. [Personal Communication]. [5 October 2012].
Emfuleni Local Municipality (ELM). 2012. Environmental Management, Health and Social Development Official. [Personal Communication]. [5 October 2012].
Emfuleni Local Municipality (ELM). 2012. Environmental Management, Health and Social Development Official. [Personal Communication]. [5 October 2012].
Emqvist, T., et al. 2004. The Dynamics of Social-Ecological Systems in Urban Landscapes: Stockholm and the National Urban Park, Sweden, Annals of the New York Academy of Sciences, 1023 (1), 308-322
Environment Management Standards (EMS). 2013. Environmental Management Standards. [Online]. Available: http://www.iso.org/iso/home/standards/management-standards/iso14000.htm [28 June 2013].
Ecosystem Valuation. 2000. Ecosystem Valuation Glossary. [Online]. Available: http://ecosystemvaluation.org/glossary.htm [4 July 2013].
Environmental Protection Agency (EPA), 2008. Design principles for storm-water management on compacted, contaminated soils in dense urban areas. [Online]. Available: <http://nepis.epa.gov/Exe/ZyPDF.cgi?Dockey=P10096CO.PDF>. [16 October 2012].
Environmental Protection Agency (EPA). 2010. Green Infrastructure Case Studies: Municipal Policies for Managing Stormwater with Green Infrastructure, EPA-841-F-10-004, August.
Environmental Journalist. 2013. [Personal Communication]. [3 June 2013].
ESRI. 2013. Feature class basics. [Online]. Available: http://webhelp.esri.com/arcgisserver/9.3/java/index.htm#geodatabases/feature_class_basics.htm [4 July 2013].
European Commission. 2012. The Multi-Functionality of Green infrastructure, Science for Environment Policy, DG Environment News Alert Service, In-depth Reports, March.
European Union (EU). 2010. LIFE building up Europe’s green infrastructure: addressing connectivity and enhancing ecosystem functions, Belgium.

192
RefeRences
Food and Trees for Africa (FTFA). 2009. Greening of Ekurhuleni, Progress Report prepared for Ekurhuleni Metropolitan Municipality.
Gandy, M. 2012. Entropy by design: Giles Clément, Parc Henri Matisse and the Limits to avant-garde Urbanism, International Journal of Urban and Regional Research, 37 (1): 259-278, January.
Garden Africa, 2013. Garden Africa Charity South Africa. [Online]. Available: http://www.gardenafrica.org.uk/garden_africa_charity_south_africa.htm [3 July 2013].
Gauteng-based landscaper. 2013. [Personal Communication]. [July 2013].
Gauteng Provincial Government (GPG). 2011. Gauteng Spatial Development Framework (GSDF).
Gauteng City-Region Observatory (GCRO). 2011. GCRO Data Brief, Number 1 of 2011: Summary analysis from Statistics South Africa’s 2010 General Household Survey, October 2011.
Gauteng City Region Observatory (GCRO), 2011. Green Strategic Programme for Gauteng, Gauteng Department of Economic Development, Final Draft, June.
Gauteng City-Region Observatory (GCRO). 2012. GCRO Data Brief: No 1. Of 2012: Key findings from Statistics South Africa’s 2011 National Census for Gauteng, 31 October 2012.
GDARD (Gauteng Department of Agriculture and Rural Development). 2011. Gauteng Conservation plan version 3.3. Gauteng, Directorate of Nature Conservation.
GDARD (Gauteng Department of Agriculture and Rural Development). 2009. Gauteng Agricultural Census, October 2009.
GDARD (Gauteng Department of Agriculture and Rural Development). 2012. Gauteng Agricultural Potential Atlas, October 2012.
Gauteng Local Government and Housing (GLGH). 2012. Duduza disaster 1st annual Commemoration Day. [Online]. Available: http://www.info.gov.za/speech/DynamicAction?pageid=461&sid=31106&tid=85588 [11 July 2013].
Geldenhuys, C. 2010. Natural Forests: Selecting indigenous trees for your garden, SA Forestry Magazine, [online]. Available: http://www.saforestrymag.co.za/articles/detail/selecting_indigenous_trees_for_your_garden [13 June 2012].
Goldman, R.L., Thompson, B. H. & Daly, G, C. 2007. Institutional incentives for managing the landscape: Inducing cooperation for the production of ecosystem services, Ecological Economics, 64: 333-343.
Goodard, M.A., Dougill, A.J & Benton, T.G. 2009. Scaling up from garden: biodiversity conservation in urban environments, Trends in Ecology and Evolution, 25 (2): 90-98
Grose, M. 2013. Deepening the Thinking in Ecology for Design: The role of endemics and exotics is much debated in ecological science and design, there a blanket approach to biodiversity in landscape design cannot be applied, Landscape Architecture Australia. [Online]. Available: http://architectureau.com/articles/deepening-the-thinking-in-ecology-for-design/ [6 June 2013].
Fairbridge, D. 1924. Gardens of South Africa. London: A. & C. Black, Ltd.
Francis, R.A., Lorimer, J. & Raco, M. Urban ecosystems as ‘natural’ homes for biogregraphical boundary crossings, Transactions of the Institute of British Geographers, 37: 183-190.
Harding, B. 2001. Case Study using Market Price Methods: Estimating the Value of Ecosystem Functions using the Replacement Cost Method. In: Turpie et al. (Eds). Valuation of Open Space in the Cape Metropolitan Area. A valuation of open space in the Cape Metropolitan Area. Report to the City of Cape Town.
Herb gardening specialist in Gauteng. 2013. [Personal Communication]. [3 June 2013].
Hinchliffe, S. & Whatmore, S. (2006) “Living cities: towards a politics of conviviality,” in Science as Culture 15(2): 123-38.
Hoşgör, Z. & Yigiter, R. 2011. Greenway Planning Context in Istanbul-Haliç: A Compulsory Intervention into the Historical Green Corridors of Golden Horn, Landscape Research, 36, (3): 341-361, June
Huddle Park. 2013. New Huddle Park Golf and Recreation. [Online[. Available: http://www.huddlepark.com/ [11 July 2013].
Indigenous plant specialist. 2013. [Personal Communication]. [3 June 2013].
Indigenous nursery owner. 2013. [Personal Communication]. [3 June 2013].
Indigenous horticulturalist. 2013. [Personal Communication]. [2 June 2013].
Institute for Security Studies (ISS). 2003. Chapter 4: Public perceptions about crime and safety. [Online]. Available: http://www.issafrica.org/pubs/Monographs/No101/Chap4.pdf [17 April 2013].
James, P. et al. 2009. Towards an integrated understanding of green space in the European built environment, Urban Forestry and Urban Greening, 8: 65-75.
Jim, C.Y. & Chen, S.S. 2003. Comprehensive green space planning based on landscape ecology principles in compact Nanjing city, China, Landscape and Urban Planning, 65: 95-116.
Joubert, A. & Turpie, J. 2001. Case Studies using Stated Preference Methods: Valuing Open Space using Contingent & Conjoint Valuation Methods, in: Turpie et al. (Eds). Valuation of Open Space in the Cape Metropolitan Area. A valuation of open space in the Cape Metropolitan Area, Report to the City of Cape Town.
Johannesburg landscape consultant. 2013. [Personal Communication]. 3 June 2013.
Kaika, M. & Swyndedouw, E. 2011. The Urbanization of Nature: Great Promises, Impasse and New Beginnings in Bridge, G. & Watson, S., The New Blackwell Companion to the City, Chapter 9.
Kroeger, T. 2008. Open Space Property Value Premium Analysis, Product of the Conservation Economics Program, Defenders of Wildlife, Washington DC.
Kullman, K. 2012. Green-Networks: Integrating Alternative Circulation Systems into Post-industrial Cities, Journal of Urban Design, 18 (1): 36-58
Lannas, K.S.M. & Turpie, J. 2009. Valuing the provisioning services of wetlands: contrasting a rural wetland in Lesotho with a peri-urban wetland in South Africa, Ecology and Society, 14(2):18. Available at: http://www.ecologyandsociety.org/vol14/iss2/art18/
Lesedi Local Municipality (LLM). 2006. Environmental Management Framework (EMF).
Lesedi Local Municipality (LLM). 2010. Spatial Development Framework (SDF).
Lesedi Local Municipality (LLM). 2012a. Mawra, H.J. Presentation on the Green Economy. 10 March 2012.
Lesedi Local Municipality (LLM). 2012b. Integrated Development Plan (IDP) 2012-2016.
Lesedi Local Municipality (LLM). 2012. Parks Section Official.
Lighton, C. 1972. Cape Floral Kingdom: the Story of South Africa’s Wild Flowers, and the People Who Found, Named and Made Them Famous the World Over, Cape Town: Juta.
Life is a garden. 2010. SAGIC (South African Green Industries Council). [Online]. Available: http://lifeisagarden.co.za/website/index.php [7 August 2010].
Life is a Garden. 2011. Become a water smart gardener. [Online]. Available: http://lifeisagarden.co.za/blog/become-a-water-smart-gardener#.UbmigPmmhCA [13 June 2013].
Life is a Garden. 2011. Eco-scape your garden. [Online]. Available: http://lifeisagarden.co.za/blog/eco-scape-your-garden#.Ubmib_mmhCA [13 June 2013].
Lockhart, J. 2009. Green Infrastructure: The Strategic Role of Trees, Woodlands and Forestry, Arboricultural Journal, The International Journal of Urban Forestry, 32: 33-49.
Lubbe, C.S., Siebert, S.J. & Cilliers, S.S. 2010. Political legacy of South Africa affects the plant diversity patterns of urban domestic gardens along a socio-economic gradient, Scientific Research and Essays, 5 (19): 2900-2910, 4 October 2010.
Machaka, J. & Roberts, S. 2004. Addressing the apartheid industrial legacy: local economic development and industrial policy in South Africa – the case of Ekurhuleni, Paper presented at the Wits-Ekurhuleni Symposium on Sustainable Manufacturing, Brakpan, 10-12 June.
Mayor of London. 2012. All London Green Grid (ALGG). [Online]. Available: http://www.london.gov.uk/sites/default/files/ALGG_SPG_Mar2012.pdf [20 November 2012].
Merafong Local Municipality (MLM). 2010. Merafong City Annual Report 09/10. [Online]. Available: http://www.merafong.gov.za/DataFiles/file/0910/Website%20Chapter%201.pdf [27 March 2013].
Merafong Local Municipality (MLM). 2011. IDP 2011-2016. [Online]. Available: http://www.merafong.gov.za/DataFiles/file/IDP%202011%2012/SECTION%20G1.pdf [26 March 2013]
Merafong Local Municipality (MLM). 2011. Merafong City Annual Report 11/12. [Online]. Available: http://www.merafong.gov.za/DataFiles/file/Annual%201112/Chapter%203%20Annual%20Report%201112.pdf [26 March 2013].
Merafong Local Municipality (MLM). 2011. Budget 2010/11, Chapter 5. [Online]. Available: http://www.merafong.gov.za/DataFiles/file/budget201011final/CHAPTER%205.pdf [27 March 2013].
Mell, I.C. 2013. Can you tell a green field from a cold steel rail? Examining the “green” of Green Infrastructure development, Local Environment, The International Journal of Justice and Sustainability, 18: 2, 152-166.
Mell, I, C. 2008. Green Infrastructure: concepts and planning, Forum, 8: 69-80, June, Newcastle University.
Mell, I.C. & Roe, M. 2010. Evaluating the demands of Green Infrastructure development: People, the landscape and the economy. [Online]. Available: http://academia.edu/958908/Evaluating_the_demands_of_green_infrastructure_development_People_the_landscape_and_the_economy [10 July 2013]
Merk, O., Saussier, S., Staropoli, C., Slack, E., Kim, J-H. 2012. Financing Green Urban Infrastructure, OECD Regional Development Working Papers 2012/10, OECD Publishing. Available at: http://dc.doi.org/10.1787/5k92p0c6j6r0-en
Midvaal Local Municipality (MLM). 2007. Environmental Management Framework (EMF) 2007/08, Draft Status Quo Report, May 2007.
Midvaal Local Municipality (MLM). 2011. Spatial Development Framework (SDF). [Online]. Available: http://www.midvaal.gov.za/files/yourcouncil/Departments/developmentplanning/Midvaal_slides/Western%20RSDF%20final.pdf [12 July 2013].
Midvaal Local Municipality (MLM). 2011. Midvaal Density Policy, January.
Midvaal Local Municipality (MLM). 2012. Midvaal Town Planning Department Official. [Personal Communication]. 28 November 2012.
Midvaal Local Municipality (MLM). 2012. Integrated Development Plan (IDP) 2012-2016 for 2012/13, May 2012. [Online]. Available: http://www.midvaal.gov.za/images/downloads/IDP/2011-12/Final%20May%202011/Midvaal%20IDP%202011-2012.pdf [21 June 2013].
Millenium Ecosystem Assessment. 2005. Ecosystems and human wellbeing: synthesis, Washington D.C.: Island Press.
Miranda, R. 2001. Characterization and Quality Evaluation of GIS data sets featuring Watershed: A Baltic Sea Region Case, Stockholm: Royal Institute of Technology (MSc thesis) [pdf]. [28 June 2013]
McKay, G. 2011. Radical Gardening: Politics, idealism and rebellion in the Garden, London: Frances Lincoln Ltd.
McConnell, V. & Walls, M. 2005. The Value of Open Space: Evidence from Studies of Nonmarket Benefits, Resources for the Future (RFF) Working Paper, RFF, Washington DC.
Mogale City Local Municipality (MCLM). 2005. By-law relating to Urban Greening and Bio-diversity Preservation. 2005, 2 December. [Online]. Available: http://www.mogalecity.gov.za/content/pdfs/key_docs/bylaws/urban_greening.pdf [26 March 2005].
Mogale City Local Municipality (MCLM). 2012. Official. [Personal Communication]. 5 September 2012.
Mogale City Local Municipality (MCLM). 2013. Official. [Personal Communication]. 31 January 2013.
Murray, M.J. 2004. The Spatial Dynamics of Postmodern Urbanism: Social Polarisation and Fragmentation in Săo Paulo and Johannesburg, Journal of Contemporary African Studies, 22 (2): 139-164, May.
The STaTe of Green InfraSTrucTure In The Gcr
195
Murray, M. J. 2008. Taming the Disorderly City: The Spatial Landscape of Johannesburg After Apartheid: UCT Press: Cape Town.
Murray, S.A. 2006. The Idea of Gardening: Plants, Bewilderment, and Indigenous Identity in South Africa. English in Africa, 33 (2): 45-66, October.
National Treasury. 2009. Draft reviewed 2009-2013 Ekurhuleni Metropolitan Municipality Integrated Development Plan. [Online]. Available: http://mfma.treasury.gov.za/Documents/01.%20Integrated%20Development%20Plans/2010-11/01.%20Metros/GT000%20Ekurhuleni%20Metro/EKU%20Ekhuruleni%20-%20IDP%20-%200910.pdf [11 July 2013].
Nel et al. 2011. Technical Report for the National Freshwater Ecosystem Priority Areas project. [Online]. Available: http://bgis.sanbi.org/nfepa/NFEPA_Technical_Report.pdf [11 July 2013].
New York City (NYC). 2009. Green Infrastructure Plan (GIP): A Sustainable Strategy for Clean Waterways.
Niemelä, J. 1999. Is there a need for a theory of urban ecology?, Urban Ecosystems, (3): 57-65.
Norgarrd, R.B. 2010. Ecosystem services: From eye-opening metaphor to complexity blinder, Ecological Economics, 69: 1219-1227.
Norton, B.G. & Noonan, D. 2007. Ecology and valuation: Big changes needed, Ecological Economics, 63: 664-675.
Nursery owner. 2013 [Personal Communication]. [2 June 2013].
Odefey, J., Detwiler, S., Rousseau, K., Trice, A., Blackwell, R., O’Hara, K., Buckley, M., Souhas, T., Brown, S. & Raviprakash, P. 2012. Banking on Green: A Look at How Green Infrastructure Can Save Municipalities Money and Provide Economic Benefits Community-wide, A Joint Report by American Rivers, the Water Environment Federation, the American Society of Landscape Architects and ECO Northwest, April.
OECD. 2011. OECD Territorial Review: The Gauteng City-Region, South Africa 2011, OECD Publishing, http://dx.doi.org/10.1787/9789264122840-en
Owner of Wholesale Nursery. 2013. [Personal Communication]. [2 June 2013].
Parliamentary Monitoring Group (PMG). 2012. Hearings on Gauteng Municipalities (City of Johannesburg, Emfuleni, City of Tshwane). [Online]. Available: http://www.pmg.org.za/report/20121016-hearing-gauteng-municipalities [16 October 2010].
Pataki, D.E. Alig, R. j., Fung, A.S., Golubiewski, E., Kennedy, C.A., McPherson, E.G., Nowak, D.J., Pouyat, R.V. & Romero Lanko, P. 2006. Urban ecosystems and the North America carbon cycle, Global Change Biology, 12: 2096-2102.
Pascual, M. S. 2011. GIS Data: A look at Accuracy, Precision and Types of Errors. [Online]. Available: http://www.gislounge.com/gis-data-a-look-at-accuracy-precision-and-types-of-errors/ [28 June 2013].
Pickett, S.T.A. & Cadenasso, M.L. 2006. Advancing urban ecological studies: Frameworks, concepts and results from the Baltimore Ecosystem Study, Austrial Ecology, 31: 114-125.
Pittock, J., Cork, S. & Maynard. S. 2010. The State of application of ecosystem services in Australia, Ecosystem Services, 1 (1): 11-120.
Polishchuk, Y. & Rauschmayer, F. 2012. Beyond “benefits”? Looking at ecosystem services through the capability approach, Ecological Economics, (81): 103-111.
Poulsen, L. 2010. A Room in the City: Strategies for Accessing Affordable Accommodation, Urban Forum, 21: 21-36, February 9.
Randfontein Local Municipality (RLM). 2010. Randfontein is Going Green. [Online]. Available: http://www.randfontein.gov.za/wp-content/themes/randfontein/docs/green.pdf [26 March 2013].
Randfontein Local Municipality. 2013. Official. [Personal Communication]. 25 March 2103.
Rees, W. 2003. Understanding Urban Ecosystems: An Ecological Economics Perspective, in Berkowitz, A. R., Nilon, C.H. & Hollweg, K.S. (eds). Understanding Urban Ecosystems: A New Frontier for Science and Education, New York: Springer-Verlag
Robbins, P., Poldermand, A. & Birkenholtz, T. 2001. Lawns and Toxins: An Ecology of the City, Cities, 18 (6): 369-380.
Robbins, P. & Sharp, J. 2003. Turfgrass subjects: The political economy of urban monoculture in Heynen, N., Kaika, M. & Swyngedouw, E., in the Nature of cities: urban political ecology and the politics of urban metabolism, Chapter 7.
Roe, M. & Mell, I. 2012. Negotiating value and priorities: evaluating the demands of green infrastructure development, Journal of Environmental Planning and Management, 1-12.
SANBI. 2012. Drimia sanguinea (Schinz) Jessop. [Online]. http://redlist.sanbi.org/species.php?species=3812-53 [3 July 2013].
SANBI. 2004. Working for Wetlands. [Online]. Available: http://wetlands.sanbi.org/project_details.php?id=211 [26 June 2013].
Savage, D. 2009a. Evaluating the performance of Development Charges in financing municipal infrastructure investment, Discussion paper prepared for the World Bank, 23 March.
Savage, D. 2009b. Financing municipal infrastructure with development charges: Role and performance, PowerPoint presentation, 2 June.
Sedibeng District Municipality. 2007. Environmental Programme of Action (EPoA).
Sedibeng District Municipality. 2009. Sedibeng Integrated Development Plan 2009/10. [Online]. Available: http://www.sedibeng.gov.za/a_keydocs/idp_2009_10/idp2010_full.pdf [4 July 2013].
Sedibeng District Municipality. 2009. Spatial Development Framework (SDF) 2009/10. [Online]. Available: http://www.sedibeng.gov.za/a_keydocs/sdf_2009_10/sdf_intro.pdf [4 July 2013].
Sedibeng District Municipality. 2011. Growth and Development Strategy (GDS). [Online]. Available: http://www.sedibeng.gov.za/gds2/gds2_12.html [4 July 2013].
Sedibeng District Municipality. 2012a. 2012/13 – 2016/17 Integrated Development Plan (IDP). [Online]. Available:http://www.sedibeng.gov.za/a_keydocs/idp_2012_16/chapter_1.pdf [4 July 2013].
Sedibeng District Municipality. 2012b. Draft Bioregional Plan, 2 July.
Sedibeng District Municipality. 2012. Transport, Infrastructure and Environment Department Official. [Personal Communication].
Schäffler, A . Forthcoming. Sustainably managing storm water in Johannesburg?
Schäffler, A. & Swilling, M. 2013. Valuing green infrastructure in an urban environment under pressure – The Johannesburg Case, Ecological Economics, 86: 246-257, February.
Schäfflers Landscaping. 2013. [Personal communication]. [4 June, 2013].
Schensul, D. 2009. Remaking an Apartheid City: State-led Spatial Transformation in Post-Apartheid Durban, South Africa. Doctor of Philosophy Dissertation, Brown University. [Online]. Available: http://www.s4.brown.edu/southafrica/Schensul%20Dissertation.pdf [17 April 2013].
Sikhitha, K.M. 2010. Determining the Value of Open Space in South Africa: A Spatial Hedonic Analysis, PhD dissertation, Environmental and Natural Resource Economics, University Of Rhode Island, Kingston.
Siska, P. P., and Hung, I. K. 2001. Propagation of Errors in Spatial Analyses, Papers and Proceedings of the Applied Geography Conferences, 24: 284–290. [Online]. Available: http://www.faculty.sfasu.edu/hungikua/pdf/research/agc24.pdf [28 June 2013]
Siyakhana. 2013. The Siyakhana Initiative for Ecological and Food Security. [Online]. Available: http://www.siyakhana.org/ [3 July 2013].
South African Gardening and Country Life, 1934, Switzerland and Savoy Advert.
South African Local Government Association (SALGA). 2011. Let’s Respond: Integrating climate change response into our Municipal IDP. [Online]. Available: http://www.imfo.co.za/conf2012/tue/krish/Tool_2_Climate_Change_and_Munics_presentation.pdf [28 September].
South African Cities Network. No date. Sustainable Municipal Finance in Southern Africa, PowerPoint presentation, sponsored by PPIAF and World Bank.
South African Cites Network. 2011. State of the Cities Report (SoCR): Cities as life-supporting systems, Chapter 4.
SPAID. 2010. The State of Municipal Infrastructure. [Online]. Available: http://www.cidb.org.za/Documents/KC/cidb_Publications/Ind_Reps_Other/ind_reps_state_of_municipal_infrastructure.pdf [20 November 201].
Spencer, F., Swilling, M., Everatt, D., Muler, M., Schulschenk, J., du Toit, J., Meyer, R. & Warrick, P. 2010. A strategy for a developmental green economy for Gauteng, Report prepared for the Gauteng Province Department of Economic Development, January 2010.
South Africa Maritime Industry Conference. 2012. [Online]. Marine Tourism and Leisure. Available: http://samsa.org.
za/samic2012/objectives-readmore4-marinetourism.html [27 November 2012]
Soweto medicinal garden owner. 2013. [Personal communication]. [23 May 2013].
Smith, A.H. 1998. The Brenthurst Gardens, Brenthurst Press.
Statistics South Africa (StatsSA). 2013. Mid-year population estimates, 2013, Statistical release P0302, Pretoria: Statistics South Africa.
Stern, N. 2007. The Economics of Climate Change: The Stern Review. Available at http://www.hmtreasury.gov.uk/independenLreviews/sternreview_economnics_climate.change/sternreviewjreport.cfm.
Stoffberg, G.H. 2006. Growth and Carbon Sequestration by Street Trees in the City of Tshwane, Unpublished PhD Thesis, University of Pretoria.
Sustainable Cities Institute. 2012. Green infrastructure: Overview. [Online]. http://www.sustainablecitiesinstitute.org/view/page.basic/class/tag.topic/community_support [6 June 2013].
Swanepoel, C.H., C.P. Loubser and E.M.J.C. Schaller. 2004. Community involvement in the development of an environmental education programme: the Tswaing meteorite crater conservation area as a case study, Koedoe , 47(1): 115–123
Swilling, M. & De Wit, M.P. 2010. Municipal Finances, Service Delivery and Prospects for Sustainable Resource Use in Cape Town, in: Swilling, M. (Ed.). Sustaining Cape Town. Imagining a Liveable City, Sustainability Institute: SUNMedia and Lynedoch.
SWITCH. 2010. The concept of Sustainable Urban Drainage Systems (SUDS): Quantity, Quality, Amenity, May, 2010.
Taylor, S.J. & Atkinson, D. 2012. Delivering community benefits acts as insurance for the survival of small protected areas such as the Abe Bailey Nature Reserve, South Africa, African Protected Area Conservation and Science; 54 (1) .
TEEB Foundations. 2010. In Kumar, P. (Ed), TEEB – The Economics of Ecosystems and Biodiversity (TEEB): Ecological and Economic Foundations, Earthscan, London.
The Civic Federation (TCF). 2007. Managing Urban Stormwater with Green Infrastructure: Case Studies of Five U.S. Local Governments. Prepared by The Civic Federation for The Center for Neighbourhood Technology. Chicago, Illinois: TCF.
Thomas, K. & Littlewood, S. 2010. From Green Belts to Green Infrastructure? The Evolution of a New Concept in the Emerging Soft Governance of Spatial Strategies, Planning, Practice & Research, 25 (2): 203-222, April.
Tompkins, P. & Bird, C. 1973. The Secret Life of Plants, New York: Harper Row.
Triangle Courier. 2012. Midvaal creating a greener world, 25-28 September, 2012.
Turpie, J. 1998. A Preliminary economic assessment of the Cape Peninsula National Park: Use, values, public preferences & financing, Cape Town: FitzPatrick Institute, University of Cape Town.
Turpie, J. & Joubert, A. 2001. Case Studies using Revealed Preference Methods I: Estimating the Recreational use value of Zandvlei using the Travel Cost Method, in: Turpie et al.

192
RefeRences
(Eds). Valuation of Open Space in the Cape Metropolitan Area. A valuation of open space in the Cape Metropolitan Area, Report to the City of Cape Town.
Turpie, J., Joubert, A., Van Zyl, H., Harding, B. & Leiman, A. 2001. Valuation of Open Space in the Cape Metropolitan Area. A valuation of open space in the Cape Metropolitan Area, Report to the City of Cape Town.
Turton, A., Schultz, C., Buckle, H., Kgomongoe, M., Malungani, T. & Drackner, M. 2006. Gold Scorched Earth and Water: The Hydropolitics of Johannesburg, Water Resources Development, 22 (2): 213-335, June.
United Nations Human Settlements Programme (UN-HABITAT). 2012. Urban Planning for City Leaders, Nairobi.
Unnamed owner of a whole sale herb nursery in Gauteng. 2013. [Personal Communication]. June 3 2013.
Uggla, Y. 2012. Construction of ‘nature’ in urban planning: a case study of Stockholm, TPR, 83 (1): 69-84.
Vandermeulun, V., Verpecht, A., Vermeire, B., Van Huylenvroeck, G. & Gellynck, X. 2011. The use of economic valuation to create public support for green infrastructure investments in urban areas, Landscape and Urban Planning, 103 (2): 198-206.
Van den Berg, J. 2012. [Personal Communication], CoT, Environmental Resource Management [13 November 2012].
Van Zyl, H. & Leiman, A. 2001. Case Studies using Revealed Preference Methods II: Estimating the Property Value of Open Space using the Hedonic Valuation Method. In: Turpie et al. (Eds). Valuation of Open Space in the Cape Metropolitan Area. A valuation of open space in the Cape Metropolitan Area, Report to the City of Cape Town.
Van Zyl, H. 2007. Property Price Approaches to the Valuation of Urban Wetlands: Theoretical Considerations and Policy Implications, PhD Thesis, School of Economics, University of Cape Town, Cape Town.
Weitzman, M. 2007. A Review of the Stem Review on the Economics of Climate Change. Journal of Economic Literature, 45:703–717.
Wickham, J.D., Riiters, H., Wade, T.G. & Vogt. 2010. A national assessment of green infrastructure and change for the conterminous United States using morphological image processing, Landscape and Urban Planning, 94: 186-195.
Williams. V.L. 2003. Hawkers of Health: An Investigation of the Faraday Street Traditional Medicine Market in Johannesburg, Gauteng: Final Report to the Gauteng Directorate of Nature Conservation, DACEL, May 2003.
West Rand District Municipality (WRDM). 2009. Spatial Development Framework (SDF).
West Rand District Municipality (WRDM). 2011a. WRDM State of Environment Report [Online]. Available: http://www.wrdm.gov.za/docs/Documents/Environmental/WRDM%20SOER%202011/WRDM/WRDM%20SoER%202011.pdf [26 March 2013].
West Rand District Municipality (WRDM). 2011b. WRDM IDP 2011/12. [Online]. Available: http://www.wrdm.gov.za/docs/Documents/WRDM%20IDP/2.%20IDP%202011-16%20WRDM.pdf [2 February 2013].
West Rand District Municipality (WRDM). 2012a. WRDM IDP 2012/13. [Online]. Available: http://www.wrdm.gov.za/docs/
Documents/WRDM%20IDP/IDP%202012%20-%202013%20Draft%20Document.pdf [2 February 2013]
West Rand District Municipality (WRDM). 2012b. Draft Bioregional Plan for the West Rand District Municipality, 2nd Draft 1st July 2012.
West Rand District Municipality (WRDM). 2012c. Annexure B: Business Investment Guide, April 2012.
West Rand District Municipality (WRDM). 2013. WRDM Green IQ Strategy, [hard copy].
West Rand District Municipality (WRDM). 2013. Environment Official. [Personal Communication]. 20 February 2013.
Westonaria Local Municipality. 2013. Westonaria Newsletter, Issue 2 2012/13. [Online]. Available: http://www.westonaria.gov.za/wp-content/uploads/2013/02/Westonaria-Municipality-mag-3F.pdf [27 March 2013].
Westonaria Local Municipality. 2013. Westonaria Official. [Personal Communication]. 20 February 2013.
Water Wheel. 2013. Where have all the flowers gone? [Online]. Available: http://www.wrc.org.za/Knowledge%20Hub%20Documents/Water%20Wheel/Magazine/WaterWheel_2013_3_May.pdf [3 July 2013]
World Economic Forum (WEF). 2012. Financing Green Growth in a Resource-constrained World. Partnerships for Triggering Private Finance at Scale, World Economic Forum.
Wylie, D. 2011. Playing God in Small Spaces?: The Ecology of the Suburban Garden in South Africa and the Poetry of Mariss Everitt, Journal of Literary Studies, 27(4): 71-90.
Yeang, K. 2008. Ecomasterplanning, Yeang’s Eco-Files: 128-131, John Wiley & Sons Ltd.
Younos, T. 2011. Paradigm shift: Holistic approach for water management in urban environments, Frontiers of Earth Science, 5 (4): 421-427.
Young, R. F. & McPherson, E.G. 2013. Governing metropolitan green infrastructure in the United States, Landscape & Urban Planning, 109: 67-75.
Map referencesThe maps in Section 2 were drawn from various data sources. These were:
• Data generously provided by the GIS departments in various municipalities. The municipalities and the corresponding data provided included:
o City of Johannesburg (CoJ): Municipal Reserves; Conservancies; Hydrology; Regional Rivers; River Areas; Municipal Wetlands; Water Bodies; Agricultural Areas; Open Spaces; Johannesburg City Parks (JCP) Parks; Open Spaces; Reserves; Protected Areas; Bird Sanctuaries; Botanical Gardens; Municipal Reserves; Nature Reserves; Conservancies; Community Points; Urban Trees; Cemeteries
o City of Tshwane (CoT): Birding points; Municipal Wetlands; Agricultural Areas; Cemeteries; Properties greater than 2 ha; Community Points; Cemeteries
o Ekurhuleni Metropolitan Municipality: Bird Sanctuaries; Municipal Wetlands; Hydrology; Water Bodies; Manmade Water Infrastructure; Agricultural Areas; Mining belt; Open Spaces; Parks; Natural Open Space; Cemeteries
o West Rand District Municipality (WRDM): Land Categories; Protected areas; Wetlands; Parks; Open Spaces; Community points; Cemeteries
o Mogale City Local Municipality (MCLM): Regional Rivers; Municipal Wetlands; Manmade Water Infrastructure; Agricultural Areas; Properties greater than 2 ha
o Randfontein Local Municipality (RLM): Bird Sanctuaries; Erven; Agricultural Areas; Properties greater than 2 ha; Golf Courses; Cemeteries
o Midvaal Local Municipality (MLM): Open Spaces; Vacant Land; Agricultural Gardens; Agricultural Holdings; Agricultural Areas; Golf courses; Cemeteries
o Merafong Local Municipality (MLM): Municipal Wetlands; Caves; Urban Trees; Properties greater than 2 ha
• Gauteng Department of Agricultural and Rural Development (GDARD) Cplan V3.3: Reserves; Other Reserves; South African National Defence Force (SANDF) land; State Land, National Parks; Protected Natural Environment; Conservancy; Municipal Reserves; Provincial Nature Reserve; Dinokeng; World Heritage Sites; Ridges; Transformed Ridges; Bird sanctuaries; River Areas; Agricultural Gardens; Agricultural Hubs
• Gauteng Department of Agriculture Conservation and Environment (GDACE): Conservancies
• Gauteng Department of Roads and Transport (GPRT): Regional rivers
• South African National Biodiversity Institute (SANBI): Nature Reserves; World Heritage Sites; Protected areas
• National Geo-spatial Information (NGI): Landuse 2006; Water Bodies; Water Source Points; River Lines; Regional Rivers; Inland water areas; Manmade Water Infrastructure; Caves; Golf courses; Urban trees; Cemeteries; Zoos; Properties greater than 2 ha; Open Spaces
• Department of Environmental Affairs: World Heritage Sites; RAMSAR sites (i.e. Wetlands of importance)
• Department of Water Affairs (Previously DWAF): Catchments
• Working for Water: Alien Plants
• Council for Scientific and Industrial Research (CSIR): National Freshwater Ecosystem Priority Area project (NFEPA) wetlands; Spot 5 Aerial imagery
• Statistics South Africa (StatsSA): Small Area Layer (SAL)
• ESRI: World Imagery
• AfriGIS: Gated Communities
• GeoTerraImage (GTI): 2,5m Urban Land Cover; 10m Urban Land Cover.


GCRO (Gauteng City-Region Observatory)
4th Floor University Corner 11 Jorissen St (Cnr Jorissen and Jan Smuts)
Braamfontein Johannesburg
Gauteng South Africa
Tel +27 11 717 7280 Email [email protected] +27 11 717 7281 Website www.gcro.ac.za