
State of College Admission 2008 Report David A. Hawkins Director of Public Policy and Research NACAC...
29
State of College Admission 2008 Report David A. Hawkins Director of Public Policy and Research NACAC Melissa E. Clinedinst Assistant Director for Research NACAC
-
Upload
keira-roope -
Category
Documents
-
view
223 -
download
0
Transcript of State of College Admission 2008 Report David A. Hawkins Director of Public Policy and Research NACAC...
State of College Admission2008 Report
David A. HawkinsDirector of Public Policy and Research
NACAC
Melissa E. ClinedinstAssistant Director for Research
NACAC
Components of Report
• Counseling Trends Survey
• Admission Trends Survey
• External Data– US Department of Education IPEDS Data
– US Census Bureau
– College Board Annual Survey
– Other Education Organizations
Chapter 1: The Flow of Students
• Number of HS Grads Will Peak at 3.33 Million for 2008–09– Wide Variations By State and Region– Racial/Ethnic Composition Changing
• Total College Enrollment Will Increase At Least Through 2016
• Racial/Ethnic Imbalance in College Enrollment
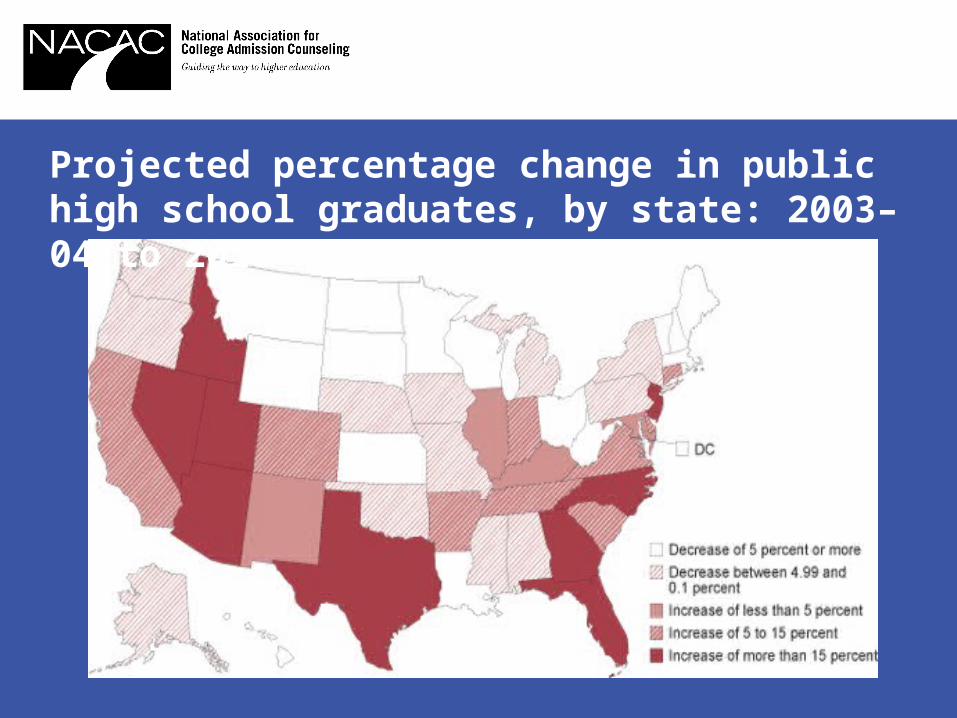
Projected percentage change in public high school graduates, by state: 2003–04 to 2016–07
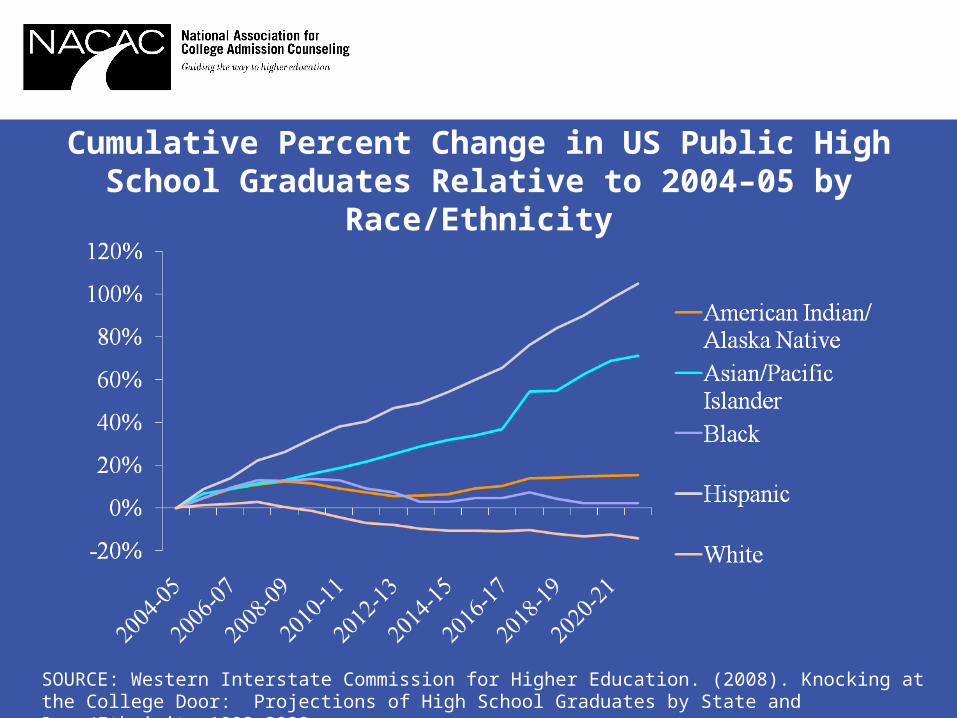
Cumulative Percent Change in US Public High School Graduates Relative to 2004–05 by Race/Ethnicity
SOURCE: Western Interstate Commission for Higher Education. (2008). Knocking at the College Door: Projections of High School Graduates by State and Race/Ethnicity 1992–2022.
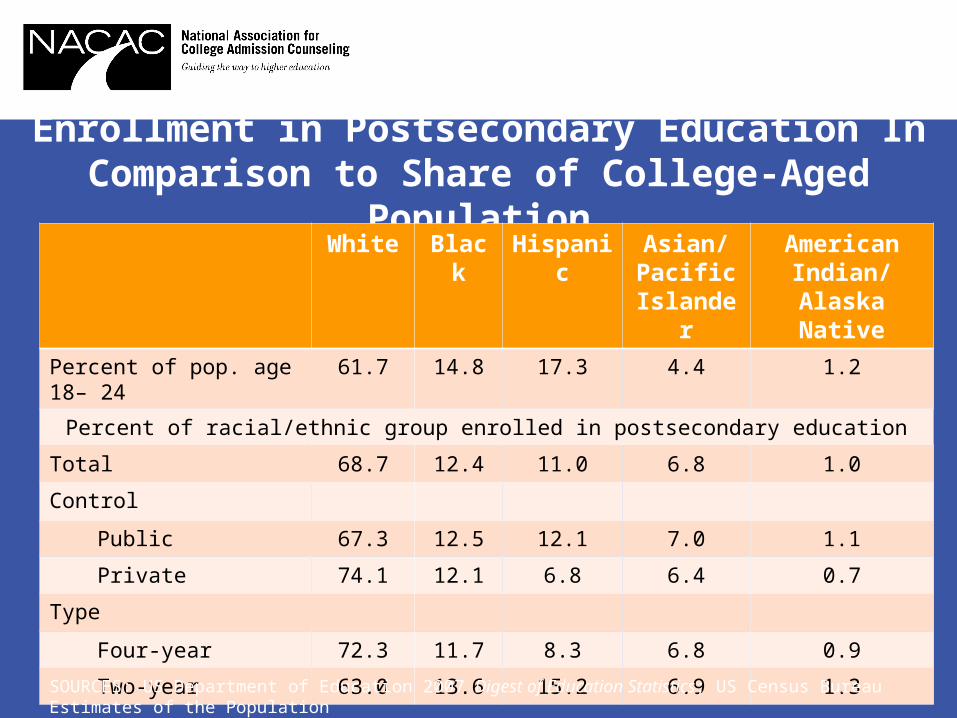
Enrollment in Postsecondary Education In Comparison to Share of College-Aged Population
White Black Hispanic Asian/Pacific
Islander
American Indian/ Alaska
Native
Percent of pop. age 18– 24 61.7 14.8 17.3 4.4 1.2
Percent of racial/ethnic group enrolled in postsecondary education
Total 68.7 12.4 11.0 6.8 1.0
Control
Public 67.3 12.5 12.1 7.0 1.1
Private 74.1 12.1 6.8 6.4 0.7
Type
Four-year 72.3 11.7 8.3 6.8 0.9
Two-year 63.0 13.6 15.2 6.9 1.3
SOURCES: US Department of Education 2007 Digest of Education Statistics; US Census Bureau Estimates of the Population
Chapter 2. Applications and Selectivity
• Application Volume Continues to Increase
• Overall Acceptance Rate Unchanged
• Share of Enrollment By Selectivity
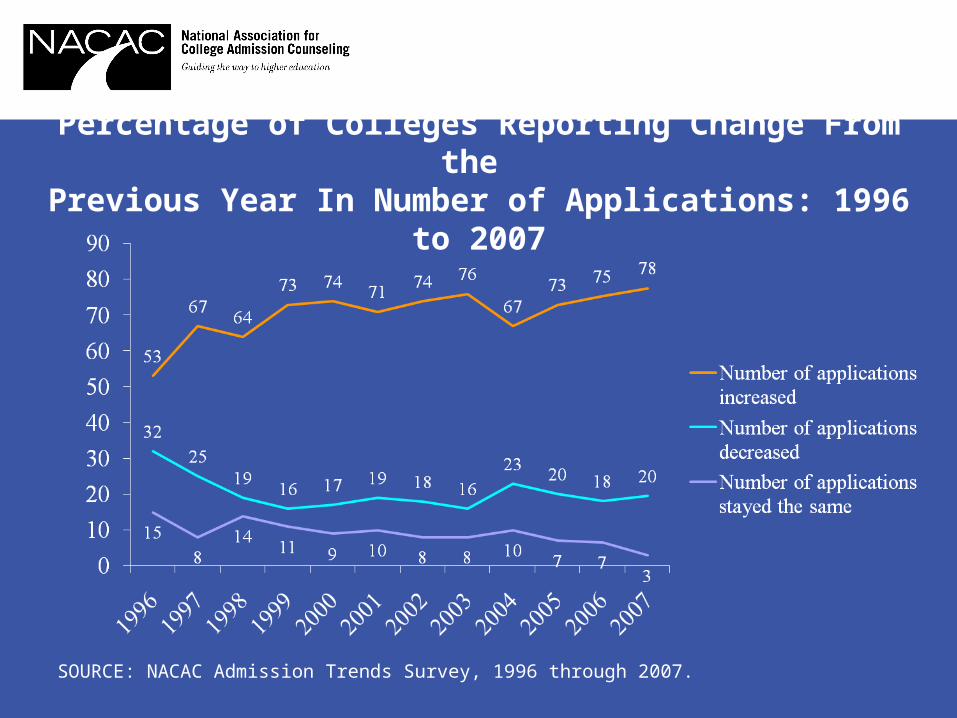
Percentage of Colleges Reporting Change From the Previous Year In Number of Applications: 1996 to 2007
SOURCE: NACAC Admission Trends Survey, 1996 through 2007.
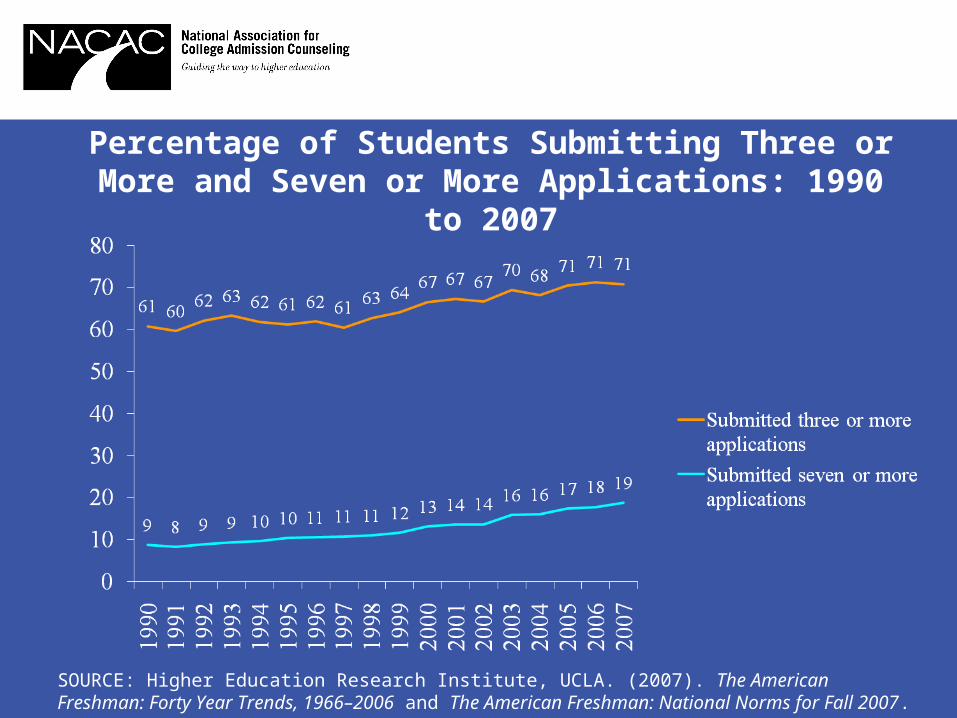
Percentage of Students Submitting Three or More and Seven or More Applications: 1990 to 2007
SOURCE: Higher Education Research Institute, UCLA. (2007). The American Freshman: Forty Year Trends, 1966–2006 and The American Freshman: National Norms for Fall 2007.
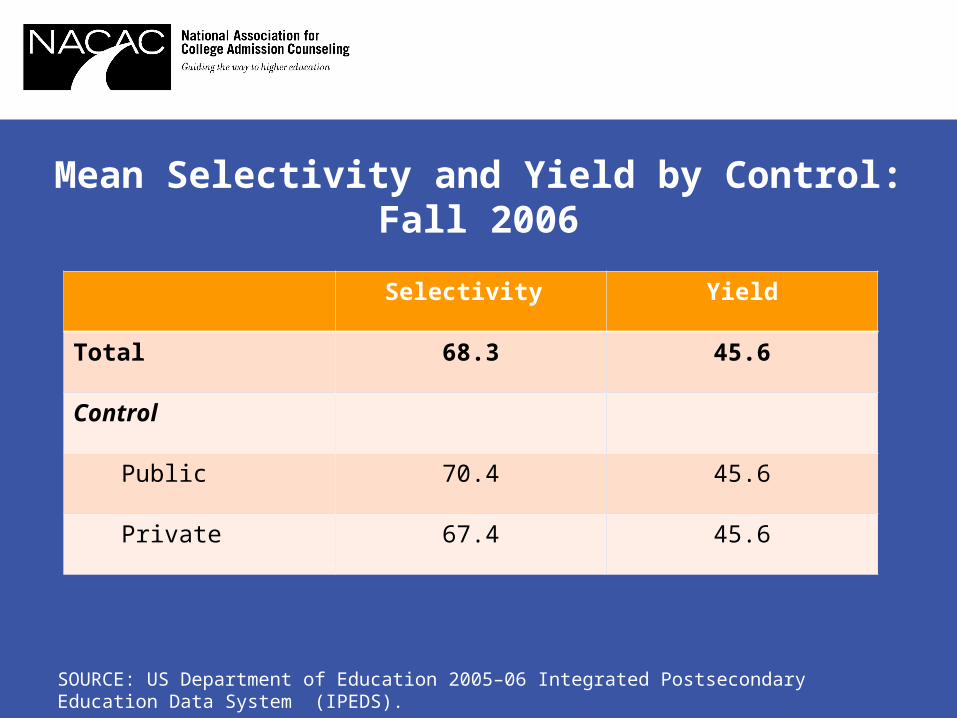
Mean Selectivity and Yield by Control: Fall 2006
Selectivity Yield
Total 68.3 45.6
Control
Public 70.4 45.6
Private 67.4 45.6
SOURCE: US Department of Education 2005–06 Integrated Postsecondary Education Data System (IPEDS).
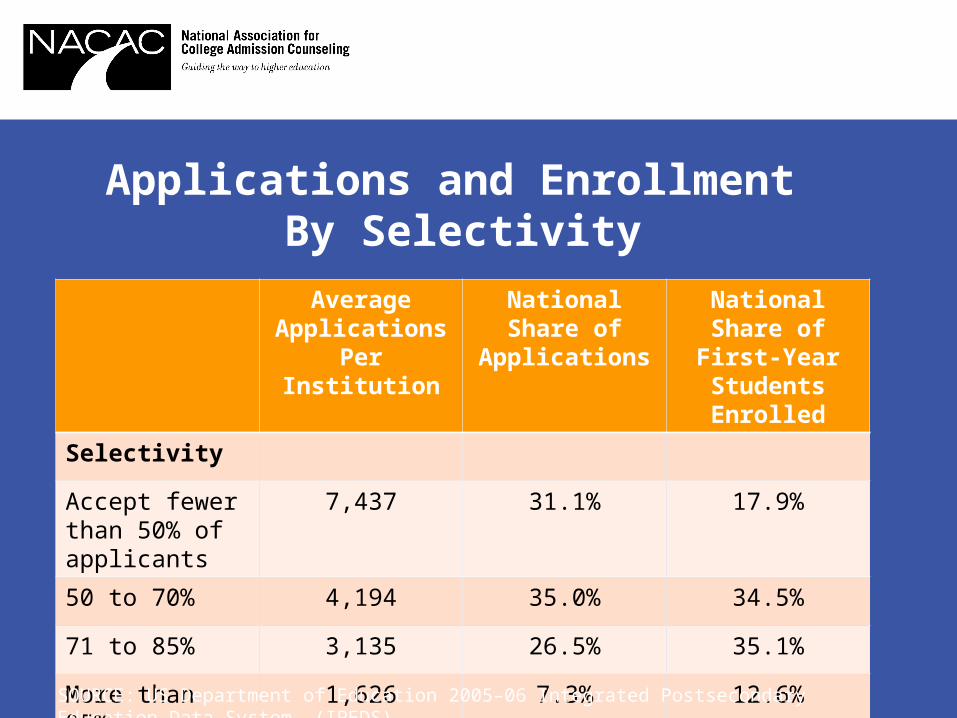
Applications and Enrollment By Selectivity
Average Applications Per
Institution
National Share of Applications
National Share of First-Year
Students Enrolled
Selectivity
Accept fewer than 50% of applicants
7,437 31.1% 17.9%
50 to 70% 4,194 35.0% 34.5%
71 to 85% 3,135 26.5% 35.1%
More than 85% 1,626 7.3% 12.6%
SOURCE: US Department of Education 2005–06 Integrated Postsecondary Education Data System (IPEDS).
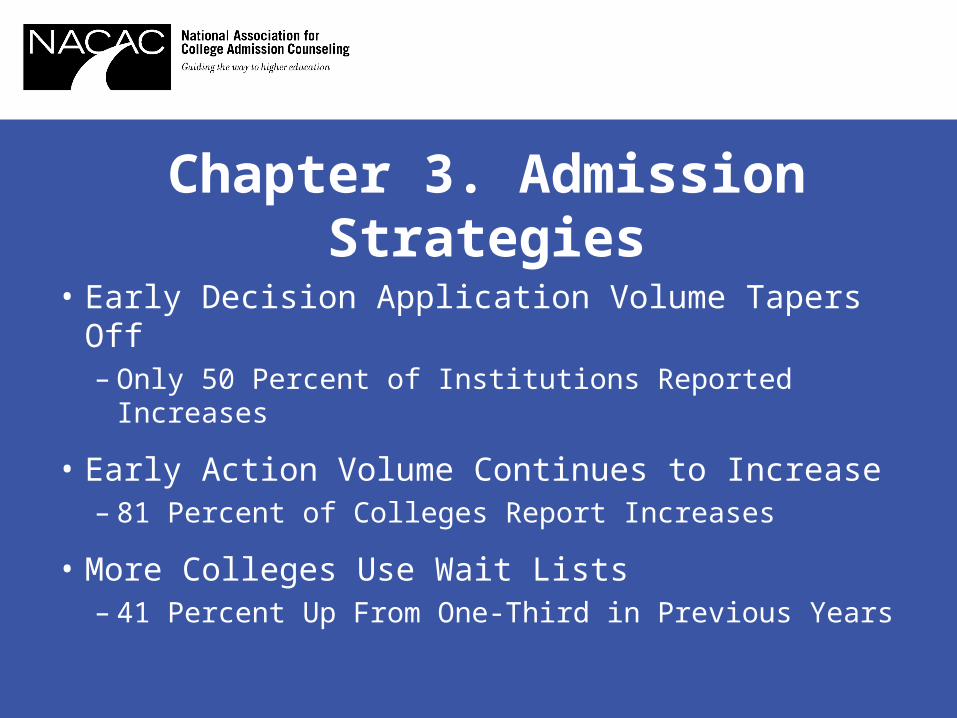
Chapter 3. Admission Strategies
• Early Decision Application Volume Tapers Off– Only 50 Percent of Institutions Reported Increases
• Early Action Volume Continues to Increase– 81 Percent of Colleges Report Increases
• More Colleges Use Wait Lists– 41 Percent Up From One-Third in Previous Years
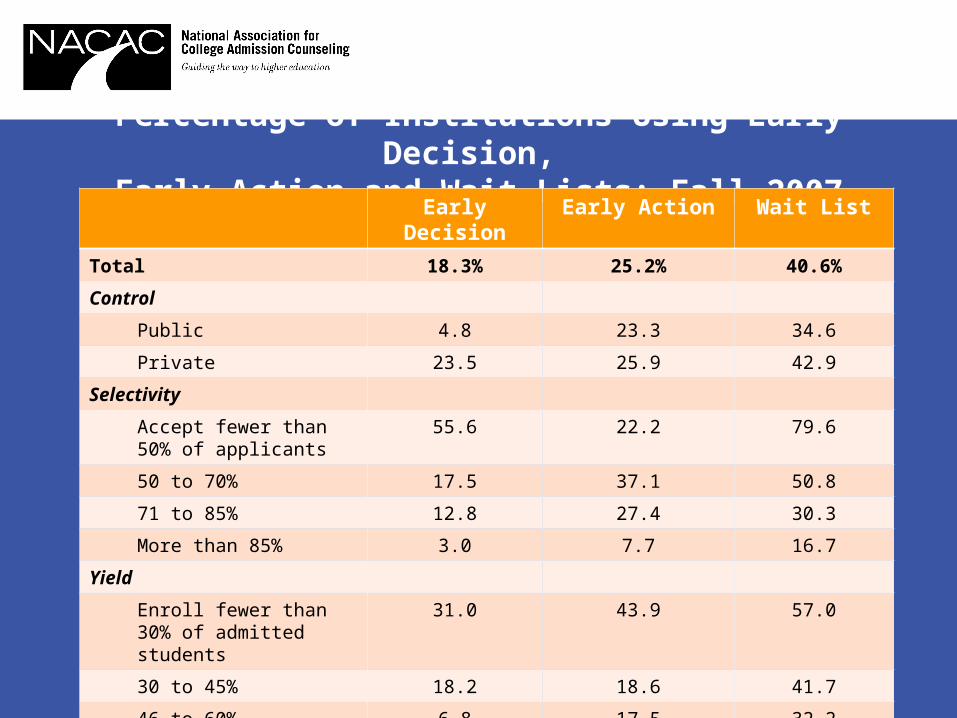
Percentage of Institutions Using Early Decision, Early Action and Wait Lists: Fall 2007
Early Decision Early Action Wait List
Total 18.3% 25.2% 40.6%
Control
Public 4.8 23.3 34.6
Private 23.5 25.9 42.9
Selectivity
Accept fewer than 50% of applicants
55.6 22.2 79.6
50 to 70% 17.5 37.1 50.8
71 to 85% 12.8 27.4 30.3
More than 85% 3.0 7.7 16.7
Yield
Enroll fewer than 30% of admitted students
31.0 43.9 57.0
30 to 45% 18.2 18.6 41.7
46 to 60% 6.8 17.5 32.2
More than 60% 10.8 20.5 20.5
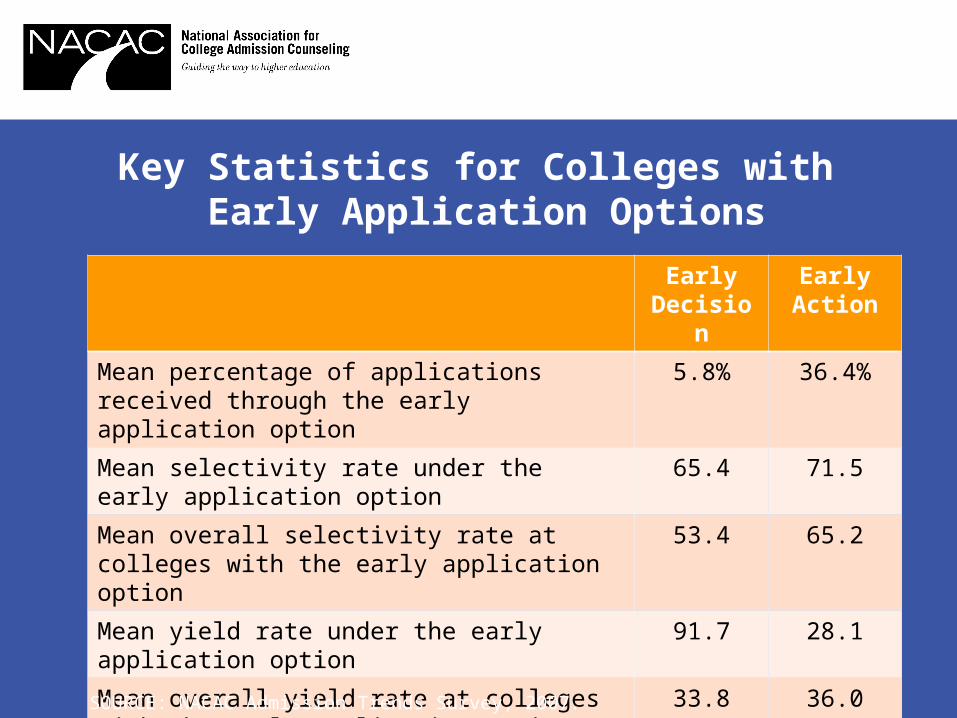
Key Statistics for Colleges with Early Application Options
Early Decision
Early Action
Mean percentage of applications received through the early application option
5.8% 36.4%
Mean selectivity rate under the early application option
65.4 71.5
Mean overall selectivity rate at colleges with the early application option
53.4 65.2
Mean yield rate under the early application option 91.7 28.1
Mean overall yield rate at colleges with the early application option
33.8 36.0
SOURCE: NACAC Admission Trends Survey, 2007.
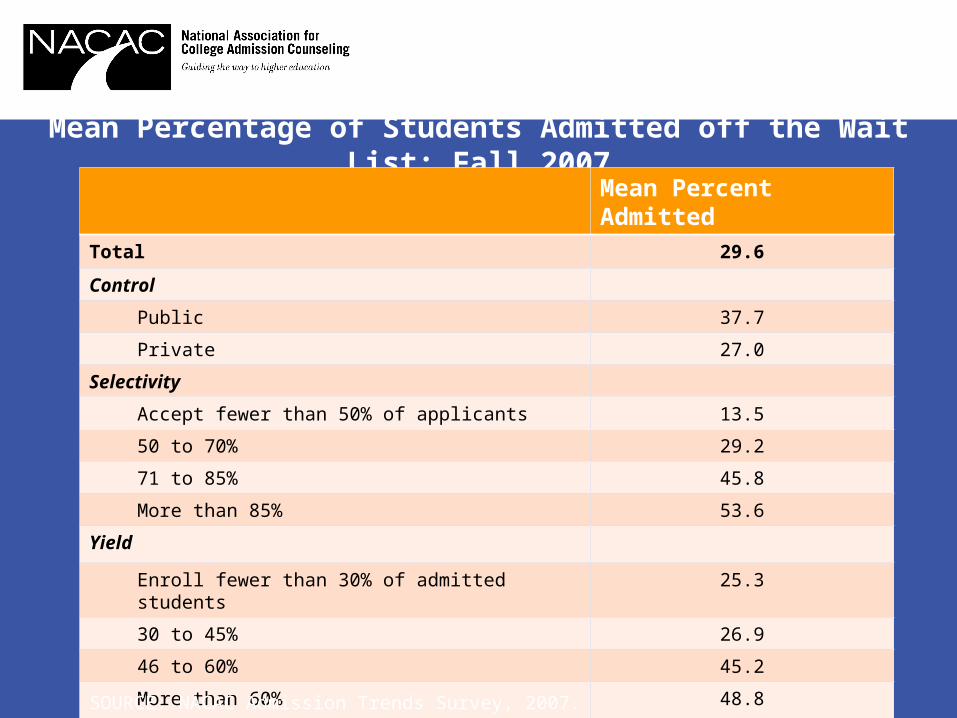
Mean Percentage of Students Admitted off the Wait List: Fall 2007
Mean Percent Admitted
Total 29.6
Control
Public 37.7
Private 27.0
Selectivity
Accept fewer than 50% of applicants 13.5
50 to 70% 29.2
71 to 85% 45.8
More than 85% 53.6
Yield
Enroll fewer than 30% of admitted students 25.3
30 to 45% 26.9
46 to 60% 45.2
More than 60% 48.8
SOURCE: NACAC Admission Trends Survey, 2007.

Chapter 4. Factors in the Admission Decision
• Top Factors Unchanged– Grades in College Prep Courses– Strength of Curriculum– Test Scores– Overall GPA
• New Question: Why Colleges Revoke Admission Offers
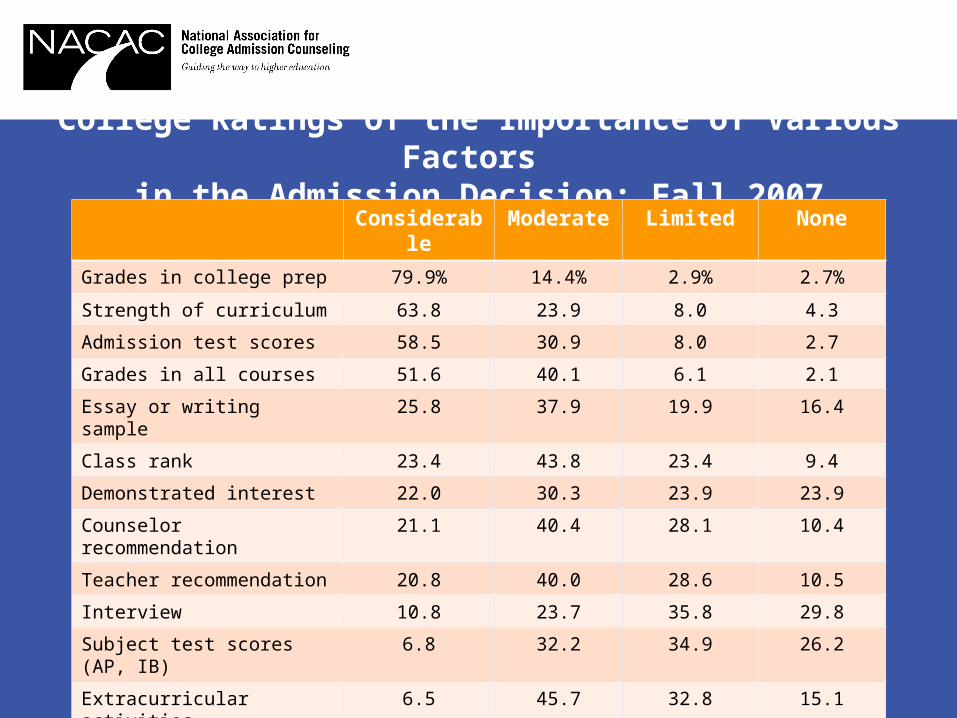
College Ratings of the Importance of Various Factors in the Admission Decision: Fall 2007
Considerable Moderate Limited None
Grades in college prep 79.9% 14.4% 2.9% 2.7%
Strength of curriculum 63.8 23.9 8.0 4.3
Admission test scores 58.5 30.9 8.0 2.7
Grades in all courses 51.6 40.1 6.1 2.1
Essay or writing sample 25.8 37.9 19.9 16.4
Class rank 23.4 43.8 23.4 9.4
Demonstrated interest 22.0 30.3 23.9 23.9
Counselor recommendation 21.1 40.4 28.1 10.4
Teacher recommendation 20.8 40.0 28.6 10.5
Interview 10.8 23.7 35.8 29.8
Subject test scores (AP, IB) 6.8 32.2 34.9 26.2
Extracurricular activities 6.5 45.7 32.8 15.1
SAT II scores 6.2 13.8 28.2 51.8
State graduation exam scores 4.4 13.7 28.7 53.3
Work 1.9 24.2 46.8 27.2
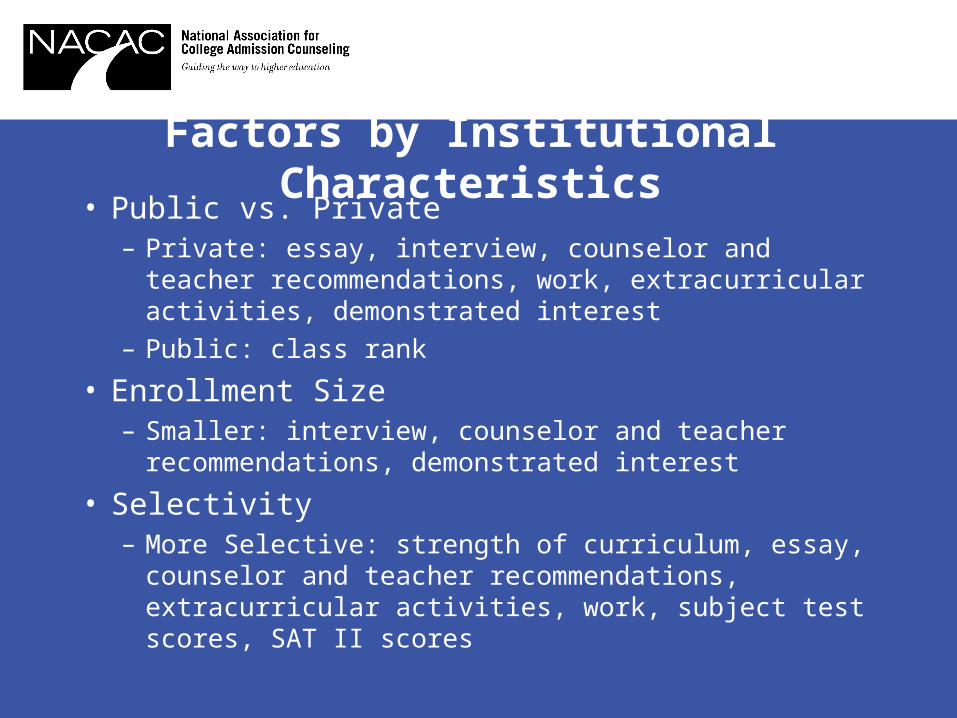
Factors by Institutional Characteristics• Public vs. Private
– Private: essay, interview, counselor and teacher recommendations, work, extracurricular activities, demonstrated interest
– Public: class rank
• Enrollment Size– Smaller: interview, counselor and teacher
recommendations, demonstrated interest
• Selectivity– More Selective: strength of curriculum, essay, counselor
and teacher recommendations, extracurricular activities, work, subject test scores, SAT II scores
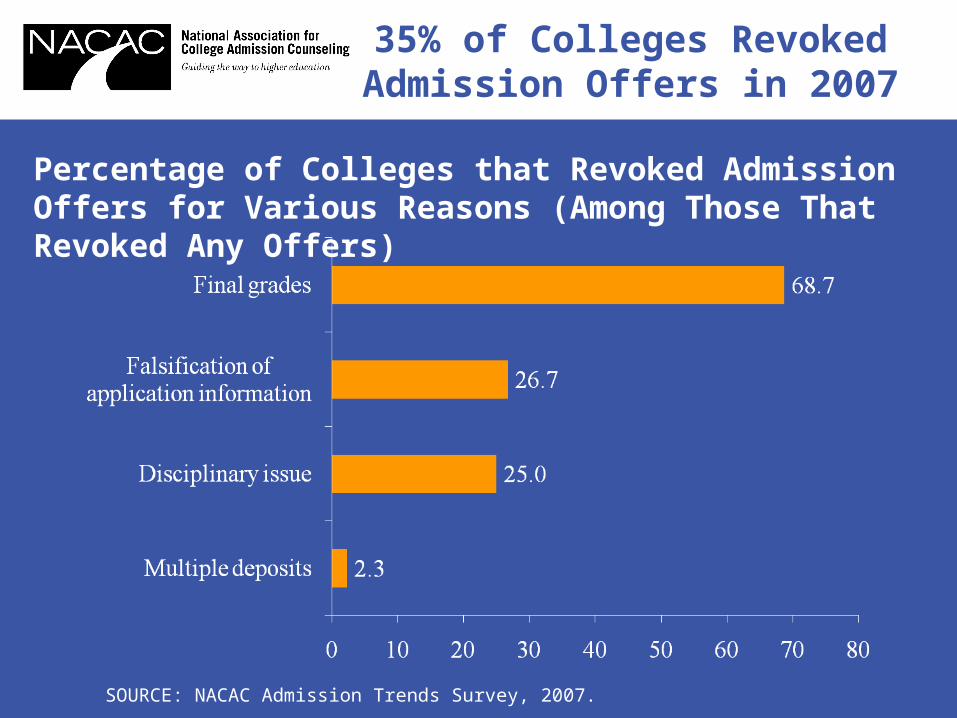
35% of Colleges Revoked Admission Offers in 2007
Percentage of Colleges that Revoked Admission Offers for Various Reasons (Among Those That Revoked Any Offers)
SOURCE: NACAC Admission Trends Survey, 2007.
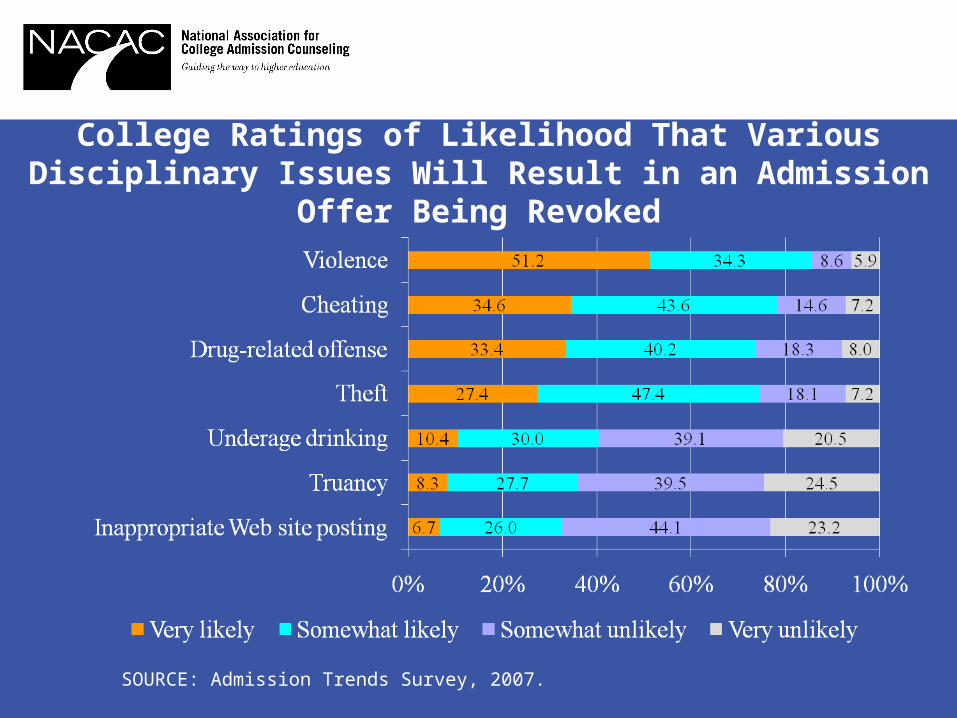
College Ratings of Likelihood That Various Disciplinary Issues Will Result in an Admission Offer Being Revoked
SOURCE: Admission Trends Survey, 2007.
Chapter 5. College Counseling In High Schools
• Student-to-Counselor Ratios
• Time Spent on College Counseling
• New Question: Release of Student Disciplinary Information to Colleges
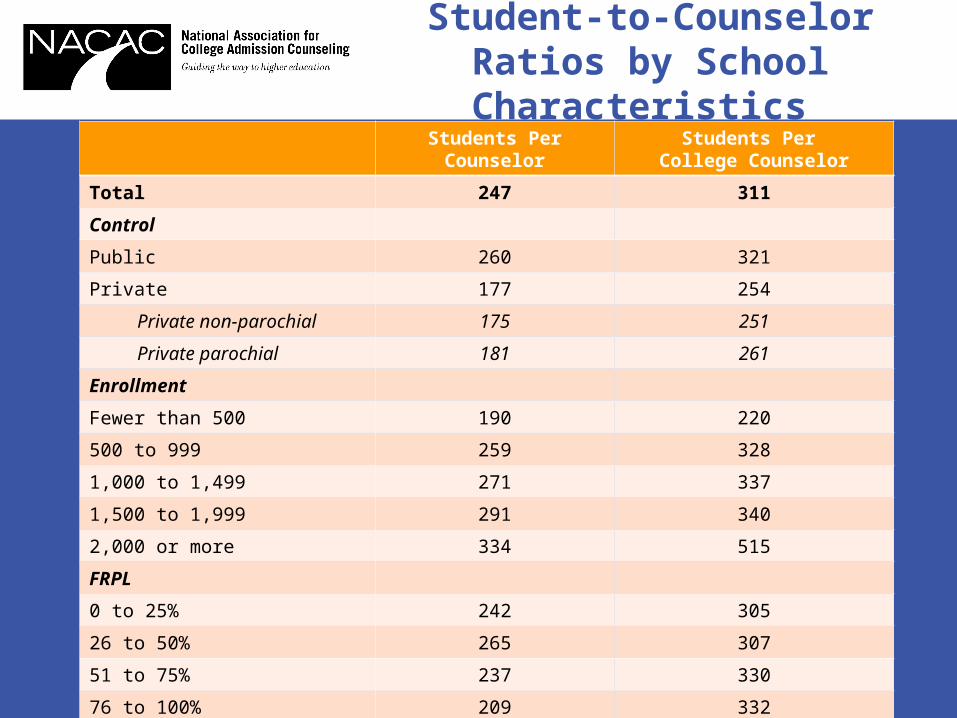
Student-to-Counselor Ratios by School Characteristics
Students Per Counselor Students Per College Counselor
Total 247 311
Control
Public 260 321
Private 177 254
Private non-parochial 175 251
Private parochial 181 261
Enrollment
Fewer than 500 190 220
500 to 999 259 328
1,000 to 1,499 271 337
1,500 to 1,999 291 340
2,000 or more 334 515
FRPL
0 to 25% 242 305
26 to 50% 265 307
51 to 75% 237 330
76 to 100% 209 332
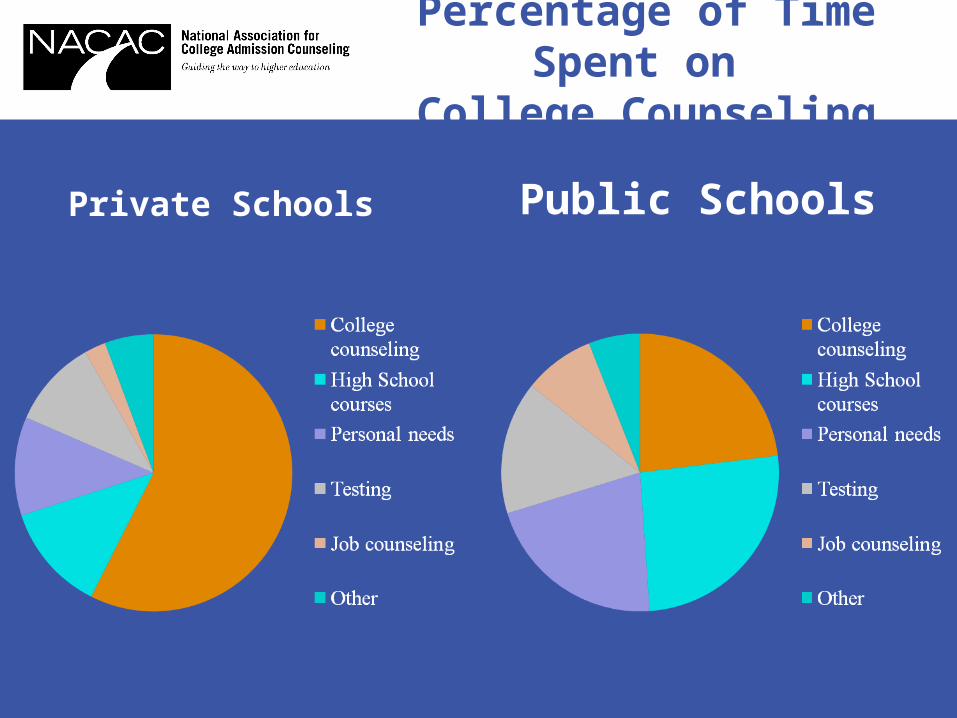
Percentage of Time Spent on
College Counseling
Private Schools Public Schools
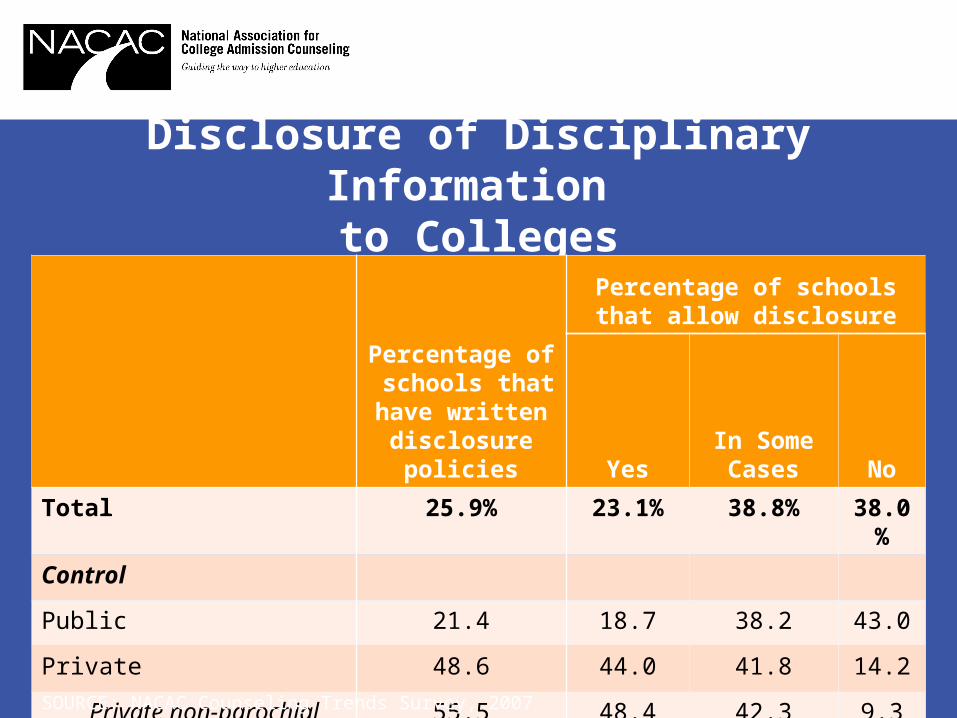
Disclosure of Disciplinary Information to Colleges
Percentage of schools that have written disclosure
policies
Percentage of schools that allow disclosure
YesIn Some
Cases No
Total 25.9% 23.1% 38.8% 38.0%
Control
Public 21.4 18.7 38.2 43.0
Private 48.6 44.0 41.8 14.2
Private non-parochial 55.5 48.4 42.3 9.3
Private parochial 32.7 34.0 40.6 25.5
SOURCE: NACAC Counseling Trends Survey, 2007
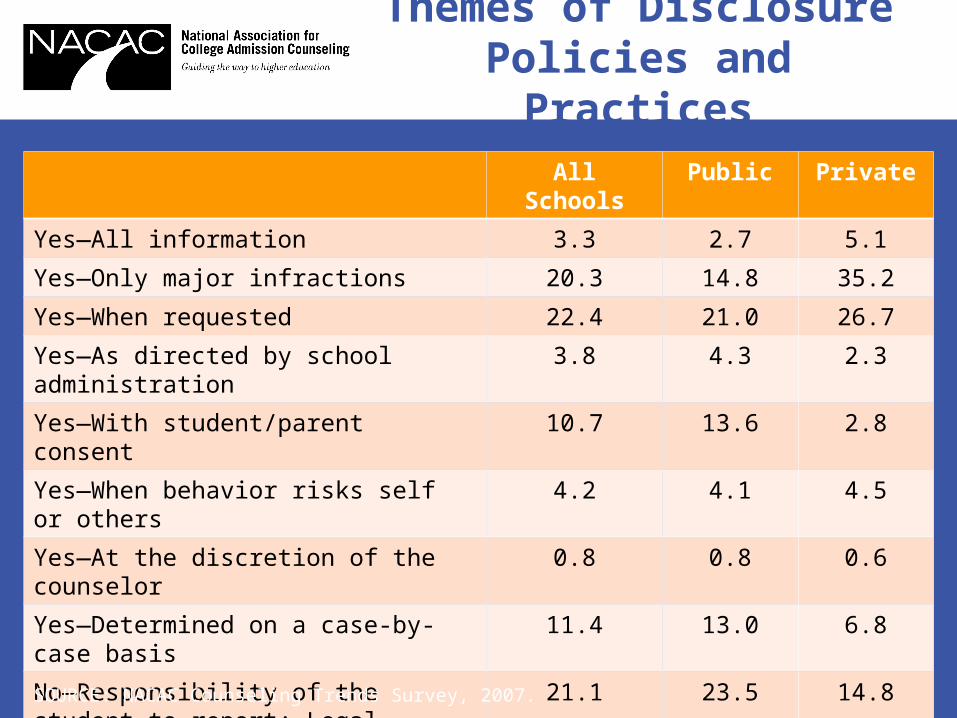
Themes of Disclosure Policies and Practices
All Schools Public Private
Yes—All information 3.3 2.7 5.1
Yes—Only major infractions 20.3 14.8 35.2
Yes—When requested 22.4 21.0 26.7
Yes—As directed by school administration 3.8 4.3 2.3
Yes—With student/parent consent 10.7 13.6 2.8
Yes—When behavior risks self or others 4.2 4.1 4.5
Yes—At the discretion of the counselor 0.8 0.8 0.6
Yes—Determined on a case-by-case basis 11.4 13.0 6.8
No—Responsibility of the student to report; Legal infractions available via public records; Only to comply with legal and court requests
21.1 23.5 14.8
No—Data are not maintained by or available to counselors
2.0 2.3 1.1
SOURCE: NACAC Counseling Trends Survey, 2007.
Chapter 6. The Admission Office
• Application-to-Admission Officer Ratios
• Cost to Recruit
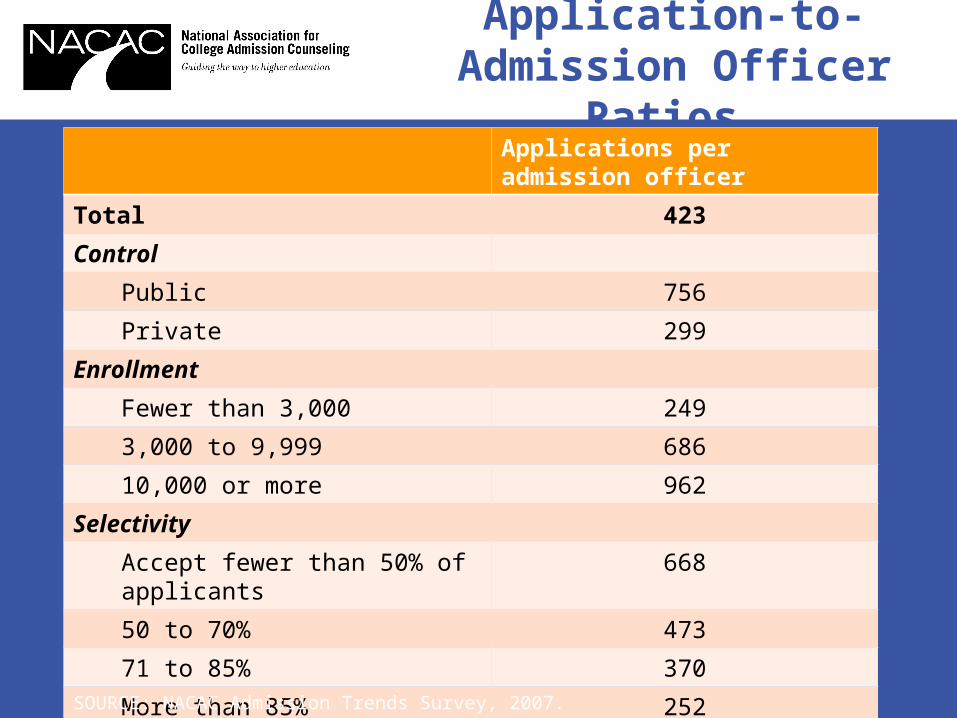
Application-to-Admission Officer
Ratios Applications per admission officer
Total 423
Control
Public 756
Private 299
Enrollment
Fewer than 3,000 249
3,000 to 9,999 686
10,000 or more 962
Selectivity
Accept fewer than 50% of applicants 668
50 to 70% 473
71 to 85% 370
More than 85% 252
SOURCE: NACAC Admission Trends Survey, 2007.
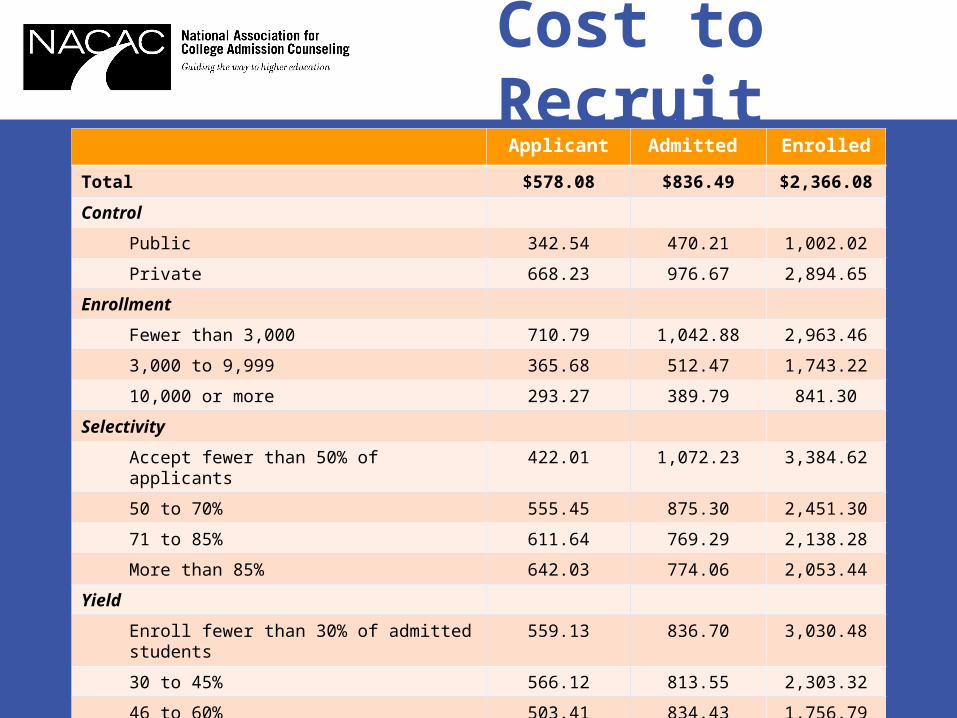
Cost to RecruitApplicant Admitted Enrolled
Total $578.08 $836.49 $2,366.08
Control
Public 342.54 470.21 1,002.02
Private 668.23 976.67 2,894.65
Enrollment
Fewer than 3,000 710.79 1,042.88 2,963.46
3,000 to 9,999 365.68 512.47 1,743.22
10,000 or more 293.27 389.79 841.30
Selectivity
Accept fewer than 50% of applicants 422.01 1,072.23 3,384.62
50 to 70% 555.45 875.30 2,451.30
71 to 85% 611.64 769.29 2,138.28
More than 85% 642.03 774.06 2,053.44
Yield
Enroll fewer than 30% of admitted students 559.13 836.70 3,030.48
30 to 45% 566.12 813.55 2,303.32
46 to 60% 503.41 834.43 1,756.79
More than 60% 830.31 955.80 1,535.16