Removal to Federal Courts from State Administrative Agencies

State Library Administrative Agencies SurveyFiscal Year 2014
August 2016

This page intentionally left blank

State Library Administrative Agencies Survey Fiscal Year 2014
August 2016

Institute of Museum and Library Services
Dr. Kathryn K. MatthewDirector
About the Institute of Museum and Library Services
The Institute of Museum and Library Services (IMLS) is the primary source of federal support for the nation’s 123,000 libraries and 35,000 museums and related organizations. Our mission is to inspire libraries and museums to advance innovation, lifelong learning, and cultural and civic engagement. Our grant making, policy development, and research help libraries and museums deliver valuable services that make it possible for communities and individuals to thrive. To learn more, visit www.imls.gov and follow us on Facebook and Twitter.
As part of its mission, IMLS conducts policy research, analysis, and data collection to extend and improve the nation’s museum, library, and information services. IMLS research activities are conducted in ongoing collaboration with state library administrative agencies; national, state, and regional library and museum organizations; and other relevant agencies and organizations. IMLS research activities are designed to provide consistent, reliable, complete, and accurate indicators of the status and trends in library and museum services and to report timely, useful, and high-quality data to Congress, the states, other policy makers, practitioners, data users, and the general public.
Contact InformationInstitute of Museum and Library Services955 L’Enfant Plaza North SW, Suite 4000Washington, DC 20024-2135202-653-IMLS (4657)https://www.imls.gov
August 2016
This publication is available only on the web, at https://www.imls.gov/publications.
IMLS will provide an audio recording of this publication upon request.
For questions or comments, contact [email protected].
Suggested Citation
The Institute of Museum and Library Services. 2016. State Library Administrative Agency Survey: Fiscal Year 2014 (IMLS-2016–SLAA-01). Washington, DC: The Institute.
Unless specifically noted, all information contained herein is in the public domain and may be used and reprinted without special permission. Citation of this source is required.
Cover Pictures
Top cover photo: Library of Virginia, Richmond
Bottom cover photo: Nebraska Library Commission, Lincoln

ContentsList of Figures and Tables . . . . . . . . . . . . . . . . . . . . . . . . . . . . . . . . . . . . . . . . . . . . . . . . . . vi
Acknowledgments . . . . . . . . . . . . . . . . . . . . . . . . . . . . . . . . . . . . . . . . . . . . . . . . . . . . . . . .vii
Executive Summary . . . . . . . . . . . . . . . . . . . . . . . . . . . . . . . . . . . . . . . . . . . . . . . . . . . . . . . 1
Revenues and Expenditures . . . . . . . . . . . . . . . . . . . . . . . . . . . . . . . . . . . . . . . . . . . . . . . 1
Workforce . . . . . . . . . . . . . . . . . . . . . . . . . . . . . . . . . . . . . . . . . . . . . . . . . . . . . . . . . . . . 2
Services . . . . . . . . . . . . . . . . . . . . . . . . . . . . . . . . . . . . . . . . . . . . . . . . . . . . . . . . . . . . . 2
I. Introduction. . . . . . . . . . . . . . . . . . . . . . . . . . . . . . . . . . . . . . . . . . . . . . . . . . . . . . . . . 3
Study Objective . . . . . . . . . . . . . . . . . . . . . . . . . . . . . . . . . . . . . . . . . . . . . . . . . . . . . . . . 3
Study Methodology . . . . . . . . . . . . . . . . . . . . . . . . . . . . . . . . . . . . . . . . . . . . . . . . . . . . . 4
II. Indicator 1: Revenues and Expenditures . . . . . . . . . . . . . . . . . . . . . . . . . . . . . . . . . . . . 7
2.1 FY 2014 Snapshot of Revenues and Expenditures . . . . . . . . . . . . . . . . . . . . . . . . . . . 7
2.2 Ten-Year National Trends in Revenues and Expenditures, FY 2004–14 . . . . . . . . . . . . 10
2.3 Patterns of Revenues and Expenditures, by Group, FY 2004–14 . . . . . . . . . . . . . . . . 11
III. Indicator 2: Workforce . . . . . . . . . . . . . . . . . . . . . . . . . . . . . . . . . . . . . . . . . . . . . . . . 23
3.1 FY 2014 Snapshot of Staffing. . . . . . . . . . . . . . . . . . . . . . . . . . . . . . . . . . . . . . . . . 23
3.2 Eight-Year National Trends in Workforce, FY 2006–14. . . . . . . . . . . . . . . . . . . . . . . . 24
3.4 Summary of Indicator 2: Workforce . . . . . . . . . . . . . . . . . . . . . . . . . . . . . . . . . . . . . 31
IV. Indicator 3: SLAA-Provided Services . . . . . . . . . . . . . . . . . . . . . . . . . . . . . . . . . . . . . . 32
4.1 FY 2014 Snapshot of Services . . . . . . . . . . . . . . . . . . . . . . . . . . . . . . . . . . . . . . . . 32
4.2 Patterns of Services Provided, by Group, FY 2014 . . . . . . . . . . . . . . . . . . . . . . . . . . 35
V. Discussion and Summary. . . . . . . . . . . . . . . . . . . . . . . . . . . . . . . . . . . . . . . . . . . . . . 39
Appendix A. Technical Notes. . . . . . . . . . . . . . . . . . . . . . . . . . . . . . . . . . . . . . . . . . . . . . . . A-1
Survey Background and Purpose . . . . . . . . . . . . . . . . . . . . . . . . . . . . . . . . . . . . . . . . . .A-1
Survey Methodology . . . . . . . . . . . . . . . . . . . . . . . . . . . . . . . . . . . . . . . . . . . . . . . . . . .A-2
Data and Analyses Limitations . . . . . . . . . . . . . . . . . . . . . . . . . . . . . . . . . . . . . . . . . . . .A-6
Appendix B. SLAA Applicants to Universal Service (E-Rate Discount) Program . . . . . . . . . . . . .B-1
Appendix C. SLAA Responses to “Other” Consulting Services Provided Open-Ended Question: FY 2014. . . . . . . . . . . . . . . . . . . . . . . . . . . . . . . . . . . C-1
Appendix D. States Involved in the Acquisition of Federal Program Funds and Other Funds, by Type of Federal Agency: FY 2014 . . . . . . . . . . . . . . . . . . . . . . . . . . . . . D-1
Appendix E. FY 14 SLAA Survey . . . . . . . . . . . . . . . . . . . . . . . . . . . . . . . . . . . . . . . . . . . . . E-1
Appendix F. FY 14 SLAA Survey Instructions for Completing Survey Items . . . . . . . . . . . . . . . F-1
Appendix G. Data Tables . . . . . . . . . . . . . . . . . . . . . . . . . . . . . . . . . . . . . . . . . . . . . . . . . . G-1

List of Figures and TablesFigures
8 Figure 1. Total Revenues by SLAA and Source of Revenue: FY 2014
9 Figure 2. Percentage of SLAA Expenditures by Category: FY 2014
11 Figure 3. Total Revenues and Expenditures for SLAAs: FY 2004–14
12 Figure 4. Total SLAA Revenues During the 10-Year Period: FY 2004–14
12 Figure 5. Total SLAA Expenditures During the 10-Year Period: FY 2004–14
15 Figure 6. Ten-Year Trend in Total Expenditures for States in the Small Recovery Group: FY 2004–2014
18 Figure 7. Ten-Year Trend in Total Expenditures for States in the Steady Increase Group: FY 2004–14
21 Figure 8. Ten-Year Trend in Total Expenditures for States in the Flat Recovery Group: FY 2004–14
24 Figure 9. Total FTE Positions in SLAAs, by Type of Service: FY 2006–14
25 Figure 10. Total FTE Positions, by Revenue and Expenditure Pattern: FY 2006–14
26 Figure 11. Change in the Number of FTE Positions for States in the Small Recovery Group: FY 2006–14
27 Figure 12. Change in the Number of FTE Positions for States in the Small Recovery Group, by Type of Service Provided: FY 2006–14
28 Figure 13. Change in the Number of FTE Positions for States in the Steady Increase Group: FY 2006–14
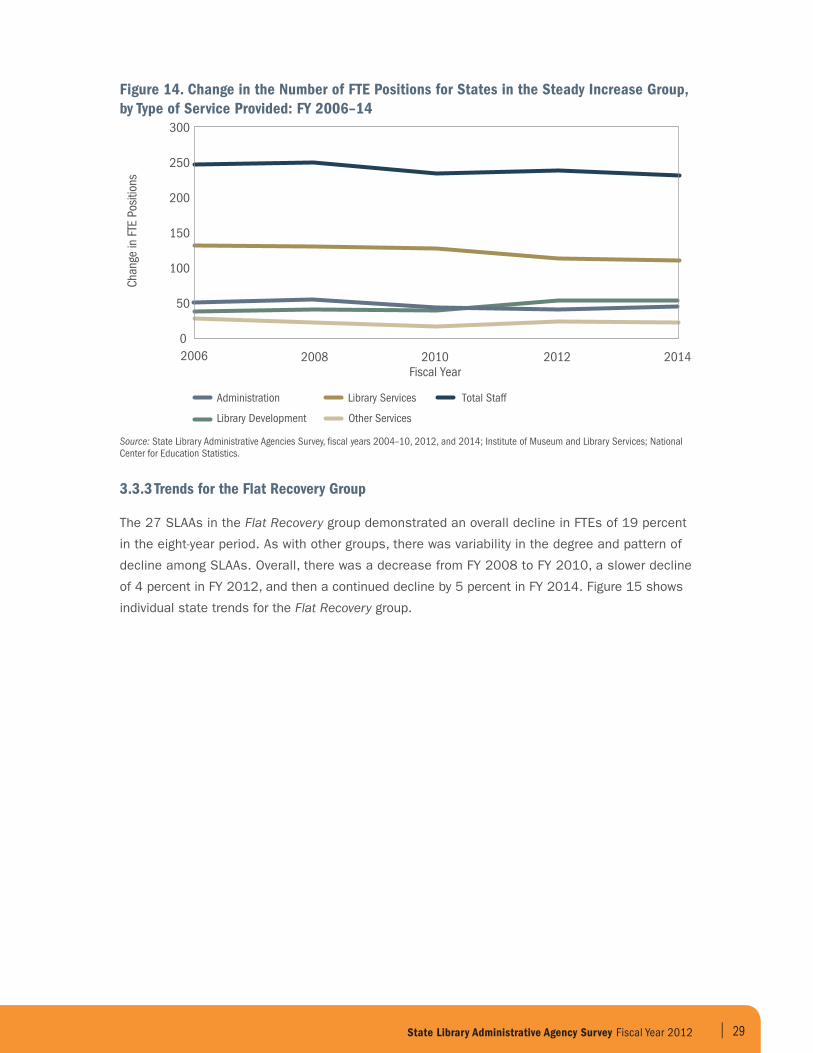
29 Figure 14. Change in the Number of FTE Positions for States in the Steady Increase Group, by Type of Service Provided: FY 2006–14
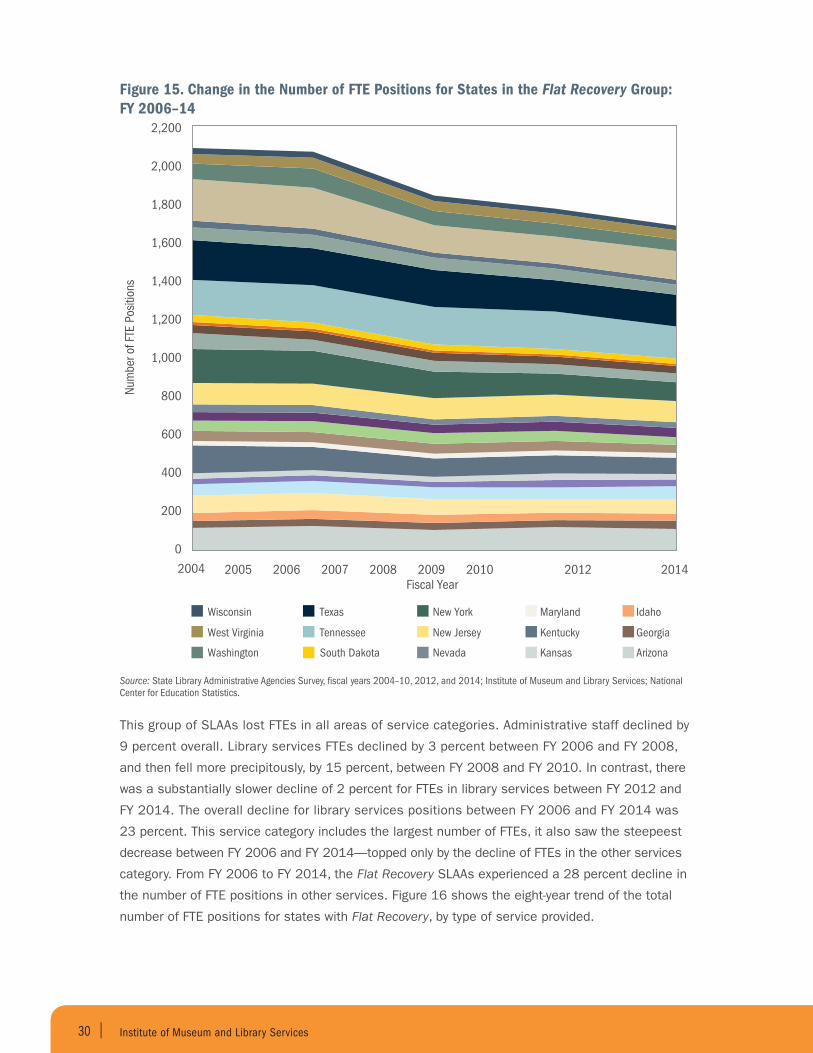
30 Figure 15. Change in the Number of FTE Positions for States in the Flat Recovery Group: FY 2006–14
31 Figure 16. Change in the Number of Total FTE Positions for States in the Flat Recovery Group, by Type of Service Provided: FY 2006–14
A-5 Figure A-1. Dispersion of States Within Each Cluster
Tables
5 Table 1. Timelines for the SLAA Survey and U.S. Recession
13 Table 2. Small Recovery Group: Key Financial Indicators Trend Analysis.
14 Table 3. Small Recovery Group: Key Financial Indicators Trend Analysis.
16 Table 4. Steady Increase Group: Key Financial Indicators Trend Analysis
17 Table 5. Steady Increase Group: Key Financial Indicators Trend Analysis
19 Table 6. Flat Recovery Group: Key Financial Indicators Trend Analysis
20 Table 7. Flat Recovery Group: Key Financial Indicators Trend Analysis
23 Table 8. Number and Percentage of FTE Positions, by Service Classification: FY 2014
32 Table 9. Percentage of SLAAs Providing Selected Services to Libraries and Library Cooperatives, by Type of Library: FY 2014
33 Table 10. Percentage of SLAAs Providing Selected Operational Assistance to Libraries and Library Cooperatives, by Type of Library: FY 2014
34 Table 11. Percentage of SLAAs Providing Selected Coordination or Integration Services to Libraries and Library Cooperatives, by Type of Library: FY 2014
35 Table 12. Percentage of SLAAs Providing Selected Program Assistance Services to Libraries and Library Cooperatives, by Type of Library: FY 2014
36 Table 13. Percentage of SLAAs Providing Selected Types of Support to Libraries and Library Cooperatives, by Group: FY 2014
37 Table 14. Percentage of SLAAs Providing Selected Types of Statewide Literacy Services, by Group: FY 2014
38 Table 15. Percentage of SLAAs Providing Statewide Reading Promotion Campaigns to Various Target Audiences, by Group: FY 2014
A-2 Table A-1. Organization of FY 2014 SLAA Survey: Parts A Through M
A-5 Table A-2. Year Pairings for Which Percentages Were Calculated
G-1 Table G-1. Number of FTE Staff Positions, by Group: FY 2006–14
G-1 Table G-2. Changes in Number of FTE Staff Positions, by Type of Service and Group: FY 2006–14
G-2 Table G-3. Percentage of SLAAs Providing Selected Services to Libraries and Library Cooperatives, by Group: FY 2014

AcknowledgmentsThe Institute of Museum and Library Services is grateful to the many staff members who
contributed to this report as well as the team from the American Institutes for Research.
IMLS also extends a special thank you to the members of the survey advisory board.
This page intentionally left blank

State Library Administrative Agency Survey Fiscal Year 2012 | 1
Executive SummaryThis report provides highlights of the 2014 State Library Administrative Agency (SLAA) Survey,
which collects financial, staffing, and service information from SLAAs as of fiscal year (FY) 2014.
The Institute of Museum and Library Services (IMLS) has been sponsoring the SLAA statistical
collection on an annual or biennial basis since 1994. This report presents the analyses of the
2014 data and data collected in previous SLAA surveys and outlines longitudinal trends in three
sets of indicators: revenues and expenditures, workforce, and services provided by SLAAs. In
addition, on the basis of reported revenues and expenditures over a 10-year period, three statistically
similar groups of SLAAs were created to characterize and examine the three sets of indicators within
the context of the national recession that occurred during an 18-month period from December 2007
through June 2009.
Revenues and Expenditures
¡ In FY 2014,
� SLAAs reported revenues totaling $1.1 billion across federal, state, and other revenue sources; 82 percent of this revenue was from states and 15 percent from federal sources.
� Expenditures totaled $1 billion with the bulk spent on financial assistance to libraries ($688 million) and operating costs ($345 million).
¡ In the preceding 10-year period,
� Reported SLAA revenues decreased by 17 percent overall. Available Library Services Technology Act (LSTA) funding to SLAAs also decreased by 17 percent during this 10-year time period.
� The contracting revenue was accompanied by contracting expenditures with an 18 percent decrease in expenditures by SLAAs from FY 2004 to FY 2014. SLAA spending of LSTA funds decreased by 17 percent in the same period.
¡ A closer review of SLAA revenues and expenditures for this period reveals a more nuanced
picture. Between FY 2004 and FY 2008, revenues for SLAAs fluctuated annually but increased
slightly overall. From FY 2008 to FY 2012—the period roughly corresponding to an economic
downturn for the country—SLAA revenues contracted sharply and continuously, falling by nearly
21 percent. FY 2014 showed a modest increase in both revenues and expenditures.
¡ Within the context of this 10-year pattern, three types or groups of SLAA recovery can
be distinguished:
Small Recovery: characterized by a large decrease in revenues and expenditures in the 10year
time frame but nascent evidence of a slowed rate of reduction beginning in FY 2014
Steady Increase: characterized by an overall increase in revenues and expenditures during the
10-year time frame
Flat Recovery: characterized by an overall decrease in revenues and expenditures during the
10-year time frame and a flat postrecession recovery

2 | Institute of Museum and Library Services
Workforce
¡ In FY 2014, there were 2,696 full-time equivalent (FTE) positions across all SLAAs. Thirteen
percent were reported in administration, 21 percent within library development, and—the bulk—
49 percent within library services.
¡ Declines in workforce coincided with the Great Recession of 2007–09.
¡ Overall, the number of FTEs declined by 22 percent from FY 2006 to FY 2014. As was the
case with the financial indicators, FY 2006 to FY 2008 was a period of stability in the number
of FTEs and was followed by a sharp decline in FTEs by FY 2010. From FY 2010 to FY 2014,
staffing levels continued to contract, but the rate of contraction slowed.
¡ Library services and library development FTE positions declined the most, although all categories
saw decreases in staffing.
¡ The declines over time differed across three statistical groups of SLAAs. The Small Recovery
group showed the largest decrease in administrative and library development classifications,
while the Steady Increase group showed the smallest decline in staffing.
Services
¡ The FY 2014 SLAA Survey data captured expanded detail on services provided by SLAAs.
Because of the reorganization of the survey instrument, no longitudinal comparisons are offered.
¡ Forty-nine of the 51 states (including the District of Columbia) provided consulting services,
most commonly for library management/organizational development, continuing education,
and youth services.
¡ Thirty-four states provided some form of literacy support.
¡ In total, 31 states reported having statewide reading programs.

State Library Administrative Agency Survey Fiscal Year 2012 | 3
I. IntroductionThis report presents selected findings from the State Library Administrative Agency (SLAA)
Survey for fiscal year (FY) 2014. The federal government has been collecting statistical data
from SLAAs since 1994. In FY 2010, the data collection effort transitioned from yearly to
biennial. This survey effort is the 19th in the series. The Institute of Museum and Library
Services (IMLS) collected these data under the mandate contained in the Museum and Library
Services Act of 2010 (Pub. L. No. 111-340), Section 210 (20 U.S.C. § 9108, Policy Research,
Analysis, Data Collection, and Dissemination).
Marking the seventh release of state library statistics from IMLS, this report, like previous SLAA
releases, summarizes both a FY 2014 snapshot and trends across a multiyear period for selected
topics. The data in this publication are reported under the provisions of the Library Services and
Technology Act (LSTA), Subchapter II, of the Museum and Library Services Act, 20 U.S.C. § 9121.
An SLAA is the official state agency charged with the extension and development of public library
services throughout the state. An SLAA has adequate authority under state law to administer state
plans in accordance with the provisions of the LSTA. Across states, SLAAs are located in various
departments of state governments and report to different authorities. SLAAs coordinate and
distribute federal funds from the IMLS’ Grants to States program. Although all SLAAs coordinate
and distribute federal funds authorized by the administration of the LSTA, not all share the same
function and role within their respective states. Most SLAAs provide important reference and
information services to the state government, administer the state library or serve as the state
archives, operate libraries for people who are blind and physically handicapped, and support the
State Center for the Book.1 In some states, the SLAA also may function as the public library at
large, providing library services to the general public.
Study Objective
The purpose of the SLAA Survey is to provide state and federal policymakers and other interested
users with information about SLAAs. The data collected are useful to Chief Officers of SLAAs;
policymakers in the executive and legislative branches of federal and state governments;
government and library administrators at the federal, state, and local levels; decision makers who
use this survey to obtain information about services and fiscal practices; library organizations, their
members, and customers; library and public policy researchers; and the public, journalists, and
others. The data collected on services provided by SLAAs to public, academic, school, and special
libraries, as well as library cooperatives—when combined with the data collected by the IMLS Public
Libraries Survey and the National Center for Education Statistics’ surveys of academic and school
libraries—provide a picture of library service that is comprehensive and nationwide in scope.
1 The State Center for the Book promotes books, reading, literacy, and libraries, as well as the scholarly study of books. Since its founding, the Center has established affiliate centers in the 50 states, the District of Columbia, and the U.S. Virgin Islands.

4 | Institute of Museum and Library Services
Study Methodology
The study collected data from the SLAA in every state and the District of Columbia. The data were
collected through the SLAA Survey, a product of a cooperative effort between the Chief Officers
of State Library Agencies (COSLA), IMLS, and American Institutes for Research (AIR). The SLAA
Survey was revised for the FY 2014 implementation to remove obsolete questions, expand and
refine questions included in the FY 2012 survey, and add questions on new topics of interest.2
Chief Officers of each SLAA designated an assigned respondent to report the requested data
through a Web-based reporting system. The Web application was designed to minimize burden;
improve data quality, accuracy, and timeliness; and limit data discrepancies. Data provided by
the SLAA-designated respondents were certified by the SLAA Chief Officers. SLAAs report detailed
information about governance, services, collections, transactions, staff, revenues, and expenditures
for the specified fiscal year. The FY 2014 SLAA Survey achieved a 100 percent response rate.
Item-level response rates ranged from 94 percent to 100 percent.
The SLAA questionnaire requested data corresponding to FY 2014 of each respondent SLAA. For
most states, the fiscal year was reported as July 1, 2013, to June 30, 2014. Six states reported
data under different fiscal year definitions. For governance and staffing, all respondents were
requested to report data as of October 1, 2014.
Monetary data were reported by SLAAs. For financial trend analyses, constant dollars were used.
Constant dollars adjusted the value of a currency report for inflation. For this report, constant
dollars for July 2013 to June 2014 were used.
In general, the analyses performed provide a FY 2014 snapshot for SLAAs for all three sets of
indicators—revenues and expenditures, workforce, and services. Longitudinal analyses are included
for a 10-year term for financial indicators but limited to an eight-year period for workforce statistics
due to changes in questionnaire design. No longitudinal analyses are provided for services because
of changes in the FY 2014 survey.
In addition, a cluster analysis approach, based on SLAA revenue and expenditure trends within a
10-year period, was used to investigate patterns for workforce and services across SLAAs. The
cluster analysis was performed to characterize the changes in SLAAs’ expenditures and revenues
within the context of broader changes occurring in the U.S. economy from 2004 to 2014. Within this
span of 10 years, the United States experienced what the National Bureau of Economic Research
(NBER) termed a “Great Recession” that began in December 2007 and ended in June 2009.3 In
general, a recession is a period of declining economic activity. The true determinants of a recession
include a multifaceted, multimeasure approach that “not only examines the measures of [gross
domestic product], but also gross domestic income (GDI), employment, real income, and aggregate
2 For details on the questionnaire changes, see Appendix A, “Changes to the 2014 Questionnaire” section.3 NBER. (2010). Business cycle dating committee announcement. Cambridge, MA: Author. Retrieved from http://www.nber.
org/cycles/sept2010.pdf Rampell, C. (2010, Sept. 20). The recession has (officially) ended. New York Times. Retrieved from http://economix.blogs.nytimes.com/2010/09/20/the-recession-has-officially-ended/?_r=0.

State Library Administrative Agency Survey Fiscal Year 2012 | 5
hours of work” to provide a comprehensive picture of the economic health of the United States.
The cluster analysis groups together SLAAs that have the most similar patterns in revenues and
expenditures over the 10-year period, making it easier to see how revenues and expenditures
changed as the country dipped into the recession and then began to recover. Where each of the
SLAA Survey collections fit within the timeline for the recession is presented in Table 1.
Table 1. Timelines for the SLAA Survey and U.S. Recession
SLAA Survey Fiscal Year (July 1–June 30) Recession Timeline
FY 2004–06 Prerecession: 2004 to November 2007
FY 2008–09 Recession: December 2007 to June 2009
FY 2010–14 Postrecession: July 2009 to today
We conducted a cluster analysis based on the percentage of change in total revenues and total
expenditures for each state from FY 2004 through FY 2014 (in two-year increments). Prior to
conducting the cluster analysis, we calculated the average percentage change in total revenues and
total expenditures for the six data points, or years, used in this analysis. Table A-2 in Appendix A
illustrates each of the year pairings where percentage differences were calculated. There were
15 pairs produced separately for total revenues and total expenditures, for a total of 30 pairs
for each state. All financial trends reported were adjusted for inflation using a GDP deflator.
We then calculated the average of these paired differences for each state and ran the cluster
analysis procedure based on the average change in expenditures and revenues. The algorithm
clustered states into three groups based on the average change in revenues and expenditures.
The algorithm identifies groups by placing states nearest to their cluster’s mean as possible and
minimizing the sum of the squared distances of each state to its cluster’s mean. For a more
detailed explanation of the cluster analysis methodology see Appendix A.
Data and Analyses Limitations
The SLAA Survey collects data for the most recent fiscal year from state respondents. However,
the ongoing nature of the SLAA survey program also supports analysis of trends over the history of
the SLAA Survey. Discontinuities in the survey effort over time—such as changes in the frequency
of the data collection in 2010 or changing questions asked in 2006 and 2014, which result in the
collection of different data—limit some trend analyses. State comparisons (including the District of
Columbia) should be made with caution because states vary in their fiscal year reporting periods and
may vary in their interpretation of the survey items. Caution should be used when comparing data for
a city with data for a state.
In addition, it should be noted that while states are grouped in a given cluster that most closely
matches the changes in expenditures and revenue experienced by those states, some states will
deviate more from the overall pattern than others. The groupings, or clusters, should be viewed as
a tool to better visualize changes over time for SLAAs as a whole. Although the authors have

6 | Institute of Museum and Library Services
drawn attention to the recession that occurred during the 10-year period of data included in this
report, causal relationships between the recession and changes in revenues and expenditures,
staffing, and services are not implied.
Organization of the Report
This report is organized into five sections. Section 1 contains the introduction and methodology of
the report. Section 2 contains information on the first indicator—revenues and expenditures—and
provides a snapshot view of FY 2014 as well as a 10-year trend analysis that includes the groupings
of states. In Section 3 the report provides a snapshot view of staffing in FY 2014 and an eight-year
trend analysis that includes the groupings of states. Section 4 provides data on the third indicator—
services provided by SLAAs. This section includes a snapshot and the patterns of services for
FY 2014 and patterns of services by state grouping. Section 5 provides a discussion and
summary of findings.
A complete set of supplemental data tables referred to in this report can be found at https://
www.imls.gov/research-evaluation/data-collection/state-library-administrative-agency-survey/
state-library-public.
Seven appendices to this report supply supporting information:
¡ Appendix A provides technical information about the survey, data processing, and response rates.
¡ Appendix B includes a list of SLAAs that participated in the Universal Service (E-Rate discount)
Program.
¡ Appendix C contains information on SLAAs that provided other consulting services in FY 2014.
¡ Appendix D contains the list of states involved in the acquisition of federal program funds and
other funds, by type of federal agency.
¡ Appendix E contains the survey instrument.
¡ Appendix F contains the survey instructions for completing the survey, including definitions of
terms used in the survey and this report.
¡ Appendix G contains data tables for this report.

State Library Administrative Agency Survey Fiscal Year 2012 | 7
II. Indicator 1: Revenues and ExpendituresIn this section, a snapshot of reported SLAA revenues and expenditures for FY 2014 at a
summary national level is presented and reviewed first. Next, a longitudinal view of changes in
SLAA revenues and expenditures reported between FY 2004 and FY 2014 is offered. Finally, a
more nuanced perspective of the patterns of SLAA revenues and expenditures is provided through
a cluster analysis focusing on FY 2004–14.
2.1 FY 2014 Snapshot of Revenues and Expenditures
Total reported revenues for the 51 SLAAs across all sources were almost $1.1 billion. Revenues
from the federal government totaled $156.4 million, while state revenues totaled $876.6 million,
and revenues from other sources4 totaled $38.1 million.
In FY 2014, 97 percent of SLAA revenues from the federal government came through the LSTA.
The remaining 3 percent of SLAAs’ total funding was made up of a number of grants and other
federal sources. Figure 1 displays revenue sources by state.
4 Other sources of revenue included any other revenue from public sources, such as local, regional, and multijurisdictional sources; revenues received from private sources, such as foundations, corporations, Friends groups, and individuals; and revenues generated by the SLAA, such as fines and fees for services.

8 | Institute of Museum and Library Services
Figure 1. Total Revenues by SLAA and Source of Revenue: FY 2014
Source: State Library Administrative Agencies Survey, FY 2014; Institute of Museum and Library Services.
$0 $10 $20 $30 $40 $50 $60 $70 $80 $90 $100 $110 $120 $130Total Revenue (in thousands)
Federal State Other
$117,28768,969
67,12754,662
54,00952,713
45,30339,539
37,37935,36435,258
25,97725,645
23,01222,35522,78221,15820,965
20,41719,704
19,40817,876
16,64815,92813,62813,530
13.48813,386
12,38911,22310,818
9,5179.,2468,965
7,8327,7487,6257,1447,0416,6776,5055,9415,8515,097
4,7374,4933,8863,7113,3132,8082,639South Dakota
New HampshireWyoming
VermontNorth Dakota
Maine
New MexicoIdaho
KansasIowa
NevadaOregon
Colorado
Montana
Alaska
Nebraska
Utah
WashingtonAlabama
Louisiana
OklahomaIndiana
Arizona
Arkansas
South Carolina
MissouriRhode Island
Mississippi
Connecticut
Michigan
West Virginia
Delaware
Kentucky
Tennessee
Minnesota
New Jersey
WisconsinNorth Carolina
Ohio
Texas
California
Hawaii
Virginia
Massachusetts
Georgia
District of Columbia
Florida
Illinois
Maryland
Pennsylvania
New York

State Library Administrative Agency Survey Fiscal Year 2012 | 9
SLAAs received 82 percent of their funding from the state. State revenues to SLAAs were
distributed as follows:
¡ $531.2 million for state aid to libraries
¡ $277.4 million to supported SLAA operations
¡ $68 million for any other purpose, such as interagency transfers
Total FY 2014 expenditures were $1.1 billion (Figure 2). Expenditure categories for SLAAs, in order
of size, are as follows:
¡ Financial assistance to libraries ($688.6 million)
¡ Operating expenditures ($345.1 million)
� Staffing ($181.7 million)
� Collections5 ($32.7 million)
� Other expenses6 ($130.8 million)
¡ Other services ($16.8 million)
¡ Capital outlay ($3.3 million)
Figure 2. Percentage of SLAA Expenditures by Category: FY 2014
Source: State Library Administrative Agencies Survey, FY 2014; Institute of Museum and Library Services.
A closer review of SLAAs’ operating expenditures reveals that 53 percent of these expenditures
were used to support staffing (salaries and wages and employee benefits), while 10 percent were
used for collections and 38 percent for other expenses.
5 Collections include all expenditures for materials purchased or leased for use by SLAA users, including print materials, microforms, machine-readable materials, and audiovisual materials.
6 Operating expenditures not reported under staff or collection expenditures.
Financial Assistance to Libraries
Operating Staffing
Operating Collections
Operating Other expenses
Other Services
Capital Outlay
65%
17%
13%
3%2%
0%

10 | Institute of Museum and Library Services
One indicator of interest is the amount of expenditures used for database licensing. These licensing
agreements are statewide contracted rights for access to and use of database(s) by libraries.
Forty-eight SLAAs spent $62.5 million on database licensing to provide access for a variety of users,
including public libraries, academic libraries, school library media centers, special libraries,7 library
cooperatives, other state agencies, and remote users.
2.2 Ten-Year National Trends in Revenues and Expenditures, FY 2004–14
To better understand the patterns of revenues and expenditures experienced by SLAAs from FY
2004 to FY 2014, it is important to take into consideration the broader changes occurring in the
U.S. economy. During this time period, the United States experienced what the NBER termed a
“Great Recession,” which began in December 2007 and ended in June 2009. This coincides with
the FY 2008 SLAA Survey, which spans from July 1, 2007, to June 30, 2008. The FY 2010 collection
begins after the official end of the recession and spans July 1, 2009, to June 30, 2010 (see Study
Methodology section).
SLAAs, much like other government institutions, were affected by the recession but not uniformly.
An examination of summary revenues and expenditures shows an overall decline in both indicators
from FY 2004 to FY 2014 by about 17 percent (Figure 3). This decline obscures a more complex
pattern in revenues and expenditures for SLAAs. From FY 2004 to FY 2008, or until early in the
recession, revenues for SLAAs fluctuated from year to year but had increased by 1.7 percent. After
FY 2008, when the recession had taken hold, revenues contracted continuously, falling nearly
21 percent by FY 2012. From FY 2012 to FY 2014, which was a period of slow economic recovery,
there was a modest increase in both revenues and expenditures nationally (5 percent and
2 percent, respectively).
7 A special library is a library in a business firm, professional association, government agency, or other organized group; a library that is maintained by a parent organization to serve a specialized clientele; or an independent library that may provide materials or services, or both, to the public, a segment of the public, or other libraries. The scope of collections and services is limited to the subject interests of the host or parent institution. Special libraries include those in state institutions.

State Library Administrative Agency Survey Fiscal Year 2012 | 11
Figure 3. Total Revenues and Expenditures for SLAAs: FY 2004–14
Source: State Library Administrative Agencies Survey, fiscal years 2004–10, 2012, and 2014; Institute of Museum and Library Services; National Center for Education Statistics.
2.3 Patterns of Revenues and Expenditures, by Group, FY 2004–14
This report examines changes in revenues and expenditures for states within the context of the
national recession. A cluster analysis provides a more complex picture of SLAAs’ income and
expenditures during this 10-year period and supports an exploration of patterns at the state level.
The average percentage change in total revenues and total expenditures for the six years of data
corresponding to FY 2004–14 SLAA Survey was calculated to support the cluster analysis. A cluster
analysis algorithm then divided states into three groupings on the basis of average changes in
revenues and expenditures during the 10-year period.8
The pattern of revenues and expenditures from FY 2004 to FY 2014 for each of the three groupings
is as follows:
¡ Group 1: A large decrease in revenues and expenditures from FY 2004 to FY 2012 with possibly
a small, nascent postrecession recovery beginning with the FY 2014 SLAA data. This group
includes 15 states and is described as the Small Recovery group.
¡ Group 2: An overall increase in revenues and expenditures since FY 2004. This group includes
nine states and is the Steady Increase group.
¡ Group 3: A decrease in revenues and expenditures relative to FY 2004 and flat postrecession
recovery. This group includes the largest number of states (27) and is described as the
Flat Recovery group.
Figures 4 and 5 illustrate the changes in total revenues and total expenditures during the 10-year
period for each of the three groups. Both figures show a similar pattern of changes in revenues
and expenditures for each group: SLAAs in the Small Recovery group experienced a large decrease
8 For a complete explanation of the methods used to generate the clusters, see Appendix A.
$1,400
$1,300
$1,200
$1,100
$1,000
$900
2004 2005 2006 2007 2008 2009 2010 2012 2014Fiscal Year
Revenue Expenditures
Tota
l Rev
enue
s an
d Ex
pend
iture
s Do
llars
(in
milli
ons)

12 | Institute of Museum and Library Services
in revenues and expenditures, comparing FY 2012 with FY 2004 data. The FY 2014 SLAA Survey
data show an overall modest increase in revenues and expenditures for this group.
SLAAs in the Steady Increase group showed an increase in revenues and expenditures, whereas
those in the Flat Recovery group experienced a decrease in revenues and expenditures and a flat
postrecession recovery. All financial trends reported are adjusted for inflation, using a gross
domestic product (GDP) deflator.9
Figure 4. Total SLAA Revenues During the 10-Year Period: FY 2004–14
Source: State Library Administrative Agencies Survey, fiscal years 2004–10, 2012, and 2014; Institute of Museum and Library Services; National Center for Education Statistics.
Figure 5. Total SLAA Expenditures During the 10-Year Period: FY 2004–14
Source: State Library Administrative Agencies Survey, fiscal years 2004–10, 2012, 2014; Institute of Museum and Library Services; National Center for Education Statistics.
9 For the methods used to create these adjustments, see Appendix A.
Small Recovery Steady Increase Flat Recovery National
$0
$200
$400
$600
$800
$1,000
$1,200
$1,400
2004 2005 2006 2007 2008 2009 2010 2012 2014Fiscal Year
Tota
l Rev
enue
s (in
mill
ions
)
Small Recovery Steady Increase Flat Recovery National
$0
$200
$400
$600
$800
$1,000
$1,200
$1,400
2004 2005 2006 2007 2008 2009 2010 2012 2014Fiscal Year
Tota
l Exp
endi
ture
s (in
mill
ions
)

State Library Administrative Agency Survey Fiscal Year 2012 | 13
2.3.1 Trends for the Small Recovery Group
Financial indicators for this group of 15 states demonstrate a sharp decrease of 35 percent
in revenues and expenditures between FY 2004 and FY 2014. The overall decline in revenues
accelerated to 33 percent between FY 2008 and FY 2012, with a small 2 percent rise in revenues
from FY 2012 to FY 2014. This pattern reflects the changes affecting the nation’s economy, with the
recession taking hold from FY 2008 to FY 2010. This group consists of the following 15 states:
Alabama Maine North Carolina
California Massachusetts Ohio
Connecticut Michigan Pennsylvania
Florida New Hampshire South Carolina
Louisiana New Mexico Wyoming
Table 2 presents the expenditures and revenues for all states within this group during the FY 2004 to
FY 2014 time frame, as well as the percentage change from the previous year and from FY 2004. The
four key financial indicators include total expenditures, total LSTA expenditures, total revenues, and
total LSTA revenues. For the previously listed states, a general decline is seen in all four indicators.
Table 2. Small Recovery Group: Key Financial Indicators Trend Analysis.
Fiscal year
Revenues
Total revenues Total LSTA revenues
Total revenues
Percentage change from previous FY
Percentage change from
FY 2004Total LSTA revenues
Percentage change from previous FY
Percentage change from
FY 2004
2004 $484,126,191 NA NA $77,984,177 NA NA
2005 $499,104,876 3% 3% $77,523,850 –1% –1%
2006 $482,821,198 –3% 0% $72,219,229 –7% –7%
2007 $490,419,805 2% 1% $69,275,350 –4% –11%
2008 $467,062,962 –5% –4% $68,335,864 –1% –12%
2009 $431,740,688 –8% –11% $68,212,203 0% –13%
2010 $373,516,729 –13% –23% $65,304,545 –4% –16%
2012 $308,787,364 –17% –36% $63,920,407 –2% –18%
2014 $316,218,897 2% –35% $56,535,572 –12% –28%
Source: State Library Administrative Agencies Survey, fiscal years 2004–10, 2012, and 2014; Institute of Museum and Library Services; National Center for Education Statistics.
Total revenues for SLAAs in this group in FY 2014 were $316.2 million, a 35 percent decline from
FY 2004. In comparison, SLAA revenues had declined nationally by 17 percent during this time
period. Prior to the recession, revenues rose and fell from FY 2004 through FY 2007 from year to
year. In FY 2008, total revenues had declined by 4 percent compared with those in FY 2004 and
continued to fall until FY 2012, when SLAA revenues reached their lowest point—36 percent lower
than in FY 2004. In FY 2014, the trend appeared to be reversing, with a slight recovery—35 percent
lower than in FY 2004 and 2 percent higher than in FY 2012.

14 | Institute of Museum and Library Services
LSTA revenues and expenditures for this group began to decline prior to the recession in FY 2006 and
continued to decline steadily. The lowest point since FY 2004 for LSTA revenues and expenditures
was in FY 2014, which marked a 28 percent decline.
Table 3. Small Recovery Group: Key Financial Indicators Trend Analysis.
Fiscal year
Expenditures
Total expenditures Total LSTA expenditures
Total expenditures
Percentage change from previous FY
Percentage change from
FY 2004Total LSTA
expenditures
Percentage change from previous FY
Percentage change from
FY 2004
2004 $481,944,990 NA NA $77,800,923 NA NA
2005 $496,623,818 3% 3% $75,590,065 –3% –3%
2006 $477,847,977 –4% –1% $71,770,705 –5% –8%
2007 $494,993,948 4% 3% $68,753,052 –4% –12%
2008 $463,690,640 –6% –4% $67,836,562 –1% –13%
2009 $432,127,933 –7% –10% $67,694,806 0% –13%
2010 $371,881,118 –14% –23% $67,864,247 0% –13%
2012 $302,768,738 –19% –37% $62,759,295 –8% –19%
2014 $312,421,908 3% –35% $56,274,234 –10% –28%
Source: State Library Administrative Agencies Survey, fiscal years 2004–10, 2012, and 2014; Institute of Museum and Library Services; National Center for Education Statistics.
Total expenditures for SLAAs in the Small Recovery group in FY 2014 were $312.4 million,
a 35 percent decline from FY 2004. As was seen with revenues, the total expenditures for these
states rose and fell somewhat from year to year prior to the recession (i.e., from FY 2004 through
FY 2007). In FY 2007, total expenditures had increased by 3 percent. This pattern shifted in
FY 2008 when total expenditures declined by 4 percent compared to FY 2004 and continued in this
direction until FY 2012, when expenditures reached the lowest recorded point—37 percent lower
than in FY 2004. In FY 2014, the trend appeared to be reversing—expenditures were 35 percent
lower than in FY 2004 but 3 percent higher than in FY 2012.
Figure 6 displays the pattern for each state based on changes in total expenditures over the period
between FY 2004 and FY 2014. The color-coded areas are the expenditure amounts reported by
each state during the 10-year period, so that the overall amount reflected by the top line of each
color zone of the graph is the sum total of each state’s expenditures. The thicker the line for a given
state, the larger that state’s expenditures were compared with those of other states in this group.
Although states within the group have similar patterns in revenues and expenditures over the 10-year
period, there is variation among states within this group with regard to how much of a decline was
experienced in expenditures.

State Library Administrative Agency Survey Fiscal Year 2012 | 15
Figure 6. Ten-Year Trend in Total Expenditures for States in the Small Recovery Group: FY 2004–2014
Source: State Library Administrative Agencies Survey, fiscal years 2004–10, 2012, and 2014; Institute of Museum and Library Services; National Center for Education Statistics.
The data for this group of states show that the large decrease in revenues and expenditures
may be related to the recession and that these states may be experiencing a small postrecession
recovery beginning in FY 2014. However, LSTA revenues have not yet recovered, having continued
to decline from FY 2012 to FY 2014. It is important to note that there are states that fit better
within this group’s pattern than others. For example, Alabama sits mathematically near the border
of two clusters—the Small Recovery group and the Steady Increase group. In such cases, the cluster
analysis model places the states in the group that is the closest to the state’s position in the model.
As a result, the state’s individual pattern of revenues and expenditures from FY 2004–14 is not a
perfect fit to the overall pattern created by this group of states.
$500
$300
$400
$200
$100
$350
$450
$250
$150
$50
$0
New HampshireWyoming Maine
New Mexico Alabama
LouisianaSouth Carolina
Connecticut
MichiganNorth Carolina
Ohio
California
Massachusetts FloridaPennsylvania
Tota
l Exp
endi
ture
s Do
llars
(in
mill
ions
)
2004 2005 2006 2007 2008 2009 2010 2012 2014Fiscal Year

16 | Institute of Museum and Library Services
2.3.2 Trends for the Steady Increase Group
Revenues and expenditures for SLAAs in this group are characterized by an increase during the
10-year period; these SLAAs received and spent more money in FY 2014 than they did in FY 2004,
accounting for inflation. Although increases in revenues and expenditures occurred during the 10-year
period, the rate of increase was not uniform across all SLAAs in the group, which includes eight
states and the District of Columbia:
Alaska Delaware Minnesota
Arkansas District of Columbia Montana
Colorado Hawaii North Dakota
Tables 4 and 5 presents the revenues and expenditures for all states within this group during the
FY 2004 to FY 2014 time frame as well as the percentage change relative to the FY 2004 data,
which was the prerecession baseline for this analysis. The four key financial indicators include
total expenditures, total LSTA expenditures, total revenues, and total LSTA revenues. For the listed
states, we observed a general increase in total revenues and expenditures between FY 2004 and
FY 2014. However, total LSTA revenues and expenditures fluctuated during this 10-year period.
Table 4. Steady Increase Group: Key Financial Indicators Trend Analysis
Fiscal year
Revenues
Total revenues Total LSTA revenues
Total revenues
Percentage change from previous FY
Percentage change from
FY 2004Total LSTA revenues
Percentage change from previous FY
Percentage change from
FY 2004
2004 $133,741,155 NA NA $12,580,759 NA NA
2005 $134,564,531 1% 1% $13,551,243 8% 8%
2006 $137,534,755 2% 3% $14,968,362 10% 19%
2007 $152,921,796 11% 14% $13,821,684 –8% 10%
2008 $151,316,840 –1% 13% $13,836,514 0% 10%
2009 $162,255,932 7% 21% $13,395,376 –3% 6%
2010 $146,149,847 –10% 9% $14,298,984 7% 14%
2012 $146,246,078 0% 9% $12,415,873 –13% –1%
2014 $190,454,268 30% 42% $14,340,410 16% 14%
Source: State Library Administrative Agencies Survey, fiscal years 2004–10, 2012, and 2014; Institute of Museum and Library Services; National Center for Education Statistics.
The total revenues for SLAAs in this group in FY 2014 were $190.4 million, a 42 percent increase
from FY 2004. Revenues increased steadily through the recession from FY 2004 to FY 2009.
Beginning in FY 2010, coinciding with the start of the nation’s recession recovery period, SLAAs
in this group experienced a 10 percent decline in total revenues from FY 2009, but this was still
9 percent higher than that in 2004. Revenues remained relatively flat from FY 2010 to FY 2012
and then rebounded strongly in FY 2014 with a 30 percent increase from FY 2012.

State Library Administrative Agency Survey Fiscal Year 2012 | 17
LSTA revenues and expenditures also increased during this 10-year period but fluctuated from year
to year. The largest contraction in growth occurred in FY 2012, during the postrecession period when
revenues decreased by 1 percent from FY 2004 and by 13 percent from the previous fiscal year.
Nevertheless, LSTA revenues increased by 14 percent from FY 2004 to FY 2014.
Table 5. Steady Increase Group: Key Financial Indicators Trend Analysis
Fiscal year
Expenditures
Total expenditures Total LSTA expenditures
Total expenditures
Percentage change from previous FY
Percentage change from
FY 2004Total LSTA
expenditures
Percentage change from previous FY
Percentage change from
FY 2004
2004 $126,674,811 NA NA $12,609,025 NA NA
2005 $126,244,873 0% 0% $14,190,036 13% 13%
2006 $136,866,906 8% 8% $15,781,863 11% 25%
2007 $146,896,523 7% 16% $14,959,861 –5% 19%
2008 $151,913,921 3% 20% $13,859,161 –7% 10%
2009 $162,754,988 7% 28% $14,470,740 4% 15%
2010 $146,654,731 –10% 16% $15,789,002 9% 25%
2012 $145,934,176 0% 15% $13,008,909 –18% 3%
2014 $174,478,019 20% 38% $13,628,344 5% 8%
Source: State Library Administrative Agencies Survey, fiscal years 2004–10, 2012, and 2014; Institute of Museum and Library Services; National Center for Education Statistics.
The total expenditures for SLAAs in this group in FY 2014 were $174.5 million, a 38 percent
increase from $126.7 million in FY 2004. From FY 2004 through FY 2009, total expenditures
increased steadily; then expenditures remained relatively unchanged between FY 2010 and FY
2012 when the nation had entered the postrecession period. The trend changed thereafter with
the SLAAs once again seeing an increase in total expenditures in FY 2014—20 percent higher
than in FY 2012.
Although states within the group had similar patterns in revenues and expenditures over the
10year period, they varied in how much expenditures increased (see Figure 7).

18 | Institute of Museum and Library Services
Figure 7. Ten-Year Trend in Total Expenditures for States in the Steady Increase Group: FY 2004–14
Source: State Library Administrative Agencies Survey, fiscal years 2004–10, 2012, and 2014; Institute of Museum and Library Services; National Center for Education Statistics.
The data indicate that the recession appeared to have little influence on this group of SLAAs, which
experienced a general pattern of increased expenditures and revenues. Although growth slowed from
FY 2010 through FY 2012, when SLAAs’ revenues and expenditures declined the most sharply at the
national level, growth rebounded in FY 2014. LSTA revenues remained relatively steady throughout
the recession with the exception of a notable decrease in FY 2012.
ColoradoNorth Dakota
Delaware
Montana ArkansasDistrict of Columbia
Hawaii
AlaskaMinnesota
$120
$160
$80
$40
$140
$180
$100
$60
$20
$0
Tota
l Exp
endi
ture
s Do
llars
(in
mill
ions
)
2004 2005 2006 2007 2008 2009 2010 2012 2014Fiscal Year

State Library Administrative Agency Survey Fiscal Year 2012 | 19
2.3.3 Trends for the Flat Recovery Group
This group is characterized by a decrease in revenues and expenditures and a flat postrecession
recovery during the 10-year period. These SLAAs have experienced reduced revenues and
expenditures, although not so severe as those in the first group. Nevertheless, these SLAAs
experienced more pronounced increases and decreases in revenues and expenditures from FY
2004 to FY 2008 than other SLAAs. The decline became more pronounced in 2010 and then
tapered off in 2014. Twenty-seven SLAAs are in this group:
Arizona Mississippi South Dakota
Georgia Missouri Tennessee
Idaho Nebraska Texas
Illinois Nevada Utah
Indiana New Jersey Vermont
Iowa New York Virginia
Kansas Oklahoma Washington
Kentucky Oregon West Virginia
Maryland Rhode Island Wisconsin
Tables 6 and 7 present total revenues and expenditures for all SLAAs within this group during the
FY 2004–14 time frame. They provide the percentage change compared with data from the
previous fiscal year and from FY 2004. For these 27 states, we observe a general decline in all
four indicators.
Table 6. Flat Recovery Group: Key Financial Indicators Trend Analysis
Fiscal year
Revenues
Total revenues Total LSTA revenues
Total revenues
Percentage change from previous FY
Percentage change from
FY 2004Total LSTA revenues
Percentage change from previous FY
Percentage change from
FY 2004
2004 $673,065,385 NA NA $92,861,522 NA NA
2005 $657,665,100 –2% –2% $91,423,223 –2% –2%
2006 $649,244,396 –1% –4% $91,199,268 0% –2%
2007 $683,695,994 5% 2% $94,090,616 3% 1%
2008 $694,209,139 2% 3% $89,245,598 –5% –4%
2009 $676,572,623 –3% 1% $87,130,800 –2% –6%
2010 $641,813,364 –5% –5% $95,668,721 10% 3%
2012 $565,213,854 –12% –16% $86,865,547 –9% –6%
2014 $564,441,130 0% –16% $80,631,200 –7% –13%
Source: State Library Administrative Agencies Survey, fiscal years 2004–10, 2012, and 2014; Institute of Museum and Library Services; National Center for Education Statistics.

20 | Institute of Museum and Library Services
The total revenues for these SLAAs in FY 2014 were $564.4 million, a decline of 16 percent since
FY 2004. Revenues, much like expenditures in this group, rose and fell from year to year prior to
the recession, with total revenues peaking at $694.2 million in FY 2008, which marked the start
of the recession. In FY 2009, revenues began to decline and continued in this direction through
FY 2014, with the largest contraction occurring from FY 2010 to FY 2012. In FY 2014, SLAAs saw
their revenues reach the lowest recorded point since FY 2004. However, total revenues from
FY 2012 to FY 2014 decreased relatively little, potentially indicating a reversal from what
coincided with the recession.
Total LSTA revenues have fluctuated considerably since the recession began in FY 2008. Overall,
LSTA revenues declined by 13 percent from FY 2004 to FY 2014. While total revenues remained
stable from FY 2012 to FY 2014, LSTA revenues continued to decline compared to FY 2004 levels.
Table 7. Flat Recovery Group: Key Financial Indicators Trend Analysis
Fiscal year
Expenditures
Total expenditures Total LSTA expenditures
Total expenditures
Percentage change from previous FY
Percentage change from
FY 2004Total LSTA
expenditures
Percentage change from previous FY
Percentage change from
FY 2004
2004 $671,441,406 NA NA $93,885,717 NA NA
2005 $649,650,540 –3% –3% $91,273,502 –3% –3%
2006 $650,008,806 0% –3% $93,943,841 3% 0%
2007 $687,107,919 6% 2% $96,440,377 3% 3%
2008 $692,761,468 1% 3% $90,336,252 –6% –4%
2009 $674,287,483 –3% 0% $85,759,267 –5% –9%
2010 $633,528,622 –6% –6% $89,769,722 5% –4%
2012 $580,829,291 –8% –13% $86,314,790 –4% –8%
2014 $566,989,029 –2% –16% $83,229,692 –4% –11%
Source: State Library Administrative Agencies Survey, fiscal years 2004–10, 2012, and 2014; Institute of Museum and Library Services; National Center for Education Statistics.
The total expenditures for these SLAAs in FY 2014 were $567 million, a 2 percent decrease from
FY 2004. From FY 2004 through FY 2008, total expenditures rose and fell from fiscal year to fiscal
year. In FY 2009, which was during the recession, total expenditures had declined 3 percent from
the previous fiscal year and have continued to decrease afterward. In FY 2014, SLAAs saw their
expenditures reach the lowest recorded point—16 percent lower than in FY 2004 and 18 percent
lower than in FY 2008, when the recession was just beginning and the highest expenditure total
was recorded.
Figure 8 displays the pattern for each state based on changes in total expenditures over the period
between FY 2004 and FY 2014. As noted previously, the color-coded areas are the expenditure
amounts reported by each state during the 10-year period, so that the overall amount reflected by

State Library Administrative Agency Survey Fiscal Year 2012 | 21
the top line of each color zone of the graph is the sum total of each state’s expenditures. Although
states within the group have similar patterns in revenues and expenditures during the 10-year period,
there is variation among states within this largest grouping of states with regard to how much of a
decline was experienced in expenditures and how flat the period of recovery has been.
Figure 8. Ten-Year Trend in Total Expenditures for States in the Flat Recovery Group: FY 2004–14
Source: State Library Administrative Agencies Survey, fiscal years 2004–10, 2012, and 2014; Institute of Museum and Library Services; National Center for Education Statistics.
The data for this group show a general rise and fall in revenues and expenditures until the recession
began during FY 2008. From FY 2009 through FY 2014, revenues declined for the group as a whole
with a leveling of revenues in FY 2012 to FY 2014, suggesting a flat postrecession recovery period.
It is important to note that there are states that fit better within this group’s pattern than others. For
example, Maryland sits mathematically near the border of two clusters—the Flat Recovery group and
the Small Recovery group. In such cases the cluster analysis model places the state in the group
New YorkWisconsin Maryland
South Dakota Arizona
KentuckyWest Virginia
Idaho
New JerseyTennessee
Texas
Georgia
Nevada KansasWashington
NebraskaVirginia Iowa
Oklahoma
IndianaVermont MissouriOregon
Rhode Island
Mississippi IllinoisUtah
$500
$550
$600
$650
$700
$300
$400
$200
$100
$350
$450
$250
$150
$50
$0
Tota
l Exp
endi
ture
s Do
llars
(in
mill
ions
)
2004 2005 2006 2007 2008 2009 2010 2012 2014Fiscal Year

22 | Institute of Museum and Library Services
that is the closest to the state’s position in the model. As a result, the state’s individual pattern
of revenues and expenditures from FY 2004–14 is not a perfect fit to the overall pattern created
by this group of states.
2.4 Summary of Indicator 1: Revenues and Expenditures
Throughout the nation, SLAAs’ total expenditures decreased a total of 18 percent from FY 2004 to
FY 2014, and LSTA expenditures decreased by 17 percent in the same period. In addition, SLAA
revenues decreased nationally by 17 percent from FY 2004 to FY 2014, and total LSTA revenues
also decreased by the same amount during this 10-year period.
Although there was a national decrease in revenue, states experienced the recession differently.
SLAAs were grouped into three different clusters with statistically similar trends in revenues and
expenditures from FY 2004 to FY 2014: those SLAAs that experienced a Small Recovery, those
that experienced a Flat Recovery, and those that demonstrated a Steady Increase in revenues
and expenditures.
The group analysis for this period revealed that most SLAAs experienced a Small Recovery or a Flat
Recovery from the recession; only nine showed a Steady Increase in revenues and expenditures.
Within each of these groups, states showed quite a bit of variation in change over time.

State Library Administrative Agency Survey Fiscal Year 2012 | 23
III. Indicator 2: WorkforceThis section presents reported workforce statistics for the FY 2014 SLAA Survey: full-time equivalents
(FTEs), by type of service. A snapshot of FY 2014 FTEs is presented first and is followed by a
historical perspective of the changes in workforce across SLAAs. Finally, patterns in workforce
data are examined relative to the groups defined by patterns in revenues and expenditures.
The trend analysis includes an eight-year period, from FY 2006 to FY 2014. Although workforce data
were collected prior to 2006, changes were made to the format and wording of questions for the
2006 collection. As a result, any changes in the workforce pattern that include data prior to 2006
could reflect changes in the questionnaire rather than actual changes in staffing. Since 2006, the
SLAA Survey has collected data on staffing in four types of mutually exclusive service classifications:
¡ Administration—the Chief Officer of the SLAA and immediate staff
¡ Library development—SLAA staff responsible for the development of public library services
¡ Library services—SLAA staff responsible for providing services to libraries, such as circulation,
interlibrary loan/document library, and reference transactions, as well for administering state
and LSTA grant programs, providing consulting and continuing education services, and promoting
resource sharing and other forms of interlibrary cooperation
¡ Other services—such as staff in allied operations
3.1 FY 2014 Snapshot of Staffing
The 51 SLAAs reported a total of 2,696 FTE10 staff positions for FY 2014. Library services, the
largest classification, includes 49 percent of FTEs.11 The details of the distribution of FTE positions
by service classification are displayed in Table 8.
Table 8. Number and Percentage of FTE Positions, by Service Classification: FY 2014
FTE positions AdministrationLibrary
development Library services Other services Total staff
Number 364.2 569.1 1,332.9 429.5 2,695.8
Percentage 14% 21% 49% 16% 100%
Source: State Library Administrative Agencies Survey, FY 2014; Institute of Museum and Library Services.
10 FTE is 40 hours per week and is the measure of full-time employment for this survey. FTE employees in any category were calculated by taking the number of hours worked per week by all employees in that category and dividing it by 40.
11 SLAAs’ roles vary greatly state by state. Although all SLAAs coordinate and distribute federal funds authorized by the LSTA, not all share the same function and role within their respective states. They are located in various departments of state government and report to different authorities. An SLAA may function as a state’s public library at large, providing library services to the general public.

24 | Institute of Museum and Library Services
3.2 Eight-Year National Trends in Workforce, FY 2006–14
To better understand the FY 2014 data for the SLAA workforce, we examined data reported in the
biennial surveys for FY 2006 through FY 2014. In this period, there was a decline of 22 percent in
the number of reported FTEs. Staffing remained relatively steady from FY 2006 to FY 2008, but
then declined sharply, by nearly 13 percent, from FY 2008 to FY 2010. Since FY 2010, staffing
has continued to contract, although the loss in positions from FY 2012 to FY 2014 has slowed to
4 percent, the smallest decrease since FY 2008.
Figure 9. Total FTE Positions in SLAAs, by Type of Service: FY 2006–14
Note: The SLAA Survey changed administration to a biennial administration starting in FY 2010. Data presented in the figure show the trend between fiscal years 2006–10, 2012, and 2014.
Source: The State Library Administrative Agencies Survey, fiscal years 2006–10, 2012, and 2014; Institute of Museum and Library Services; National Center for Education Statistics.
The decrease in FTEs has most affected staffing in library services, with a decline in FTEs of
26 percent across the eight-year span. SLAAs reported the smallest decrease in library development
FTEs, with a decline of 10 percent from FY 2006 to FY 2014.
3.3 Workforce Patterns, by Group, FY 2006–14
As discussed with the previous indicator, the three groups are used here to better visualize changes
in staffing within the context of the national recession and changes in revenues and expenditures
from FY 2004–14. These three groups demonstrate different patterns of workforce reductions:
¡ The Small Recovery group showed the sharpest decline in the number of FTE positions, with an
overall reduction in staff of 32 percent (from FY 2006 to FY 2014). A slowed rate of decrease
was reported in FY 2014.
3,469
571
1,809
634
456
3,468
567
1,805
646
450
3,401
538
1,756
671
436
3,174
508
1,620
627
419
2,967
464
1,487
611
406
2,696
429
1,333
570
364
2,814
477
1,354
623
360
2006 2007 2008 2009 2010 2012 2014Fiscal Year
Num
ber o
f FTE
Sta
ff
Administrative Library Development Library Service Other Service
0
2000
3000
4000

State Library Administrative Agency Survey Fiscal Year 2012 | 25
¡ The Steady Increase group experienced increases in revenues and expenditures from FY 2006
to FY 2014 and reported the smallest decline in FTE positions as of FY 2014, with a loss
of 5 percent.
¡ SLAAs in the Flat Recovery group experienced an overall 19 percent decline in FTE positions
between FY 2006 and FY 2014, with some recent evidence of a slowed rate of decline.
Figure 10 compares each group’s average number of FTE positions for the eight-year period against
the national total number of FTE positions. The national average across all 51 states shows an
overall decrease in workforce of 22 percent.
Figure 10. Total FTE Positions, by Revenue and Expenditure Pattern: FY 2006–14
Source: State Library Administrative Agencies Survey, fiscal years 2004–10, 2012, and 2014; Institute of Museum and Library Services; National Center for Education Statistics.
3.3.1 Trends for the Small Recovery Group
The pattern for the reported number of FTE positions for SLAAs in this group can be observed in
Figure 11. The color-coded areas correspond to the relative number of FTE positions reported by
each SLAA during the eight-year period. The width of the line for a given SLAA corresponds to the
size of the workforce relative to other SLAAs in this group. Similarly, the cumulative, stacked height
at a given time point represents the total FTE count for the group. Notice the variability of the rate
of decline in FTEs over time, by SLAA.
Small Recovery Steady Increase Flat Recovery
0
500
1,000
1,500
2,000
2,500
2006 2008 2010 2012 2014Fiscal Year
Tota
l FTE
Pos
ition
s

26 | Institute of Museum and Library Services
Figure 11. Change in the Number of FTE Positions for States in the Small Recovery Group: FY 2006–14
Source: State Library Administrative Agencies Survey, fiscal years 2004–10, 2012, and 2014; Institute of Museum and Library Services; National Center for Education Statistics.
Although staff positions in library services contracted most sharply at the national level, for SLAAs
in the Small Recovery group, the impact of the decline was felt most in administrative staff. During
eight years, these FTE positions declined by 38 percent with the largest contraction of 24 percent,
occurring between FY 2010 and FY 2012. The number of administrative staff positions remained
unchanged moving forward into FY 2014.
Library development also contracted nearly three times as sharply as the national average of FTEs
in this category, with 28 percent fewer positions in this category over eight years. In contrast,
staffing contracted the most between FY 2008 and FY 2010 with a 31 percent decline and was
followed by a 7 percent increase the following fiscal year. See Figure 12 for the eight-year trend for
FTE positions by type of service provided.
1,200
400
800
600
1,000
200
0
New HampshireWyoming Maine
New Mexico Alabama
LouisianaSouth Carolina
Connecticut
MichiganNorth Carolina
Ohio
California
Massachusetts FloridaPennsylvania
Num
ber o
f FTE
Pos
ition
s
2004 2005 2006 2007 2008 2009 2010 2012 2014Fiscal Year

State Library Administrative Agency Survey Fiscal Year 2012 | 27
Figure 12. Change in the Number of FTE Positions for States in the Small Recovery Group, by Type of Service Provided: FY 2006–14
Source: State Library Administrative Agencies Survey, fiscal years 2004–10, 2012, and 2014; Institute of Museum and Library Services; National Center for Education Statistics.
3.3.2 Trends for the Steady Increase Group
Between FY 2006 and FY 2014, the total number of FTE staff rose and fell from year to year, with
an overall decline of 5 percent for SLAAs in this group, compared with the FTE national average of
a 22 percent decline. These SLAAs exhibited some variability in the decline in staffing. For
example, the SLAA with the greatest decline lost 44 percent of its FTE positions in this eight-year
period, while the SLAA with the smallest drop lost only 2 percent.
2006 2008 2010 2012 2014Fiscal Year
Chan
ge in
FTE
Pos
ition
s
Administration
Library Development
Library Services
Other Services
Total Staff
0
200
400
600
800
1,000
1,200

28 | Institute of Museum and Library Services
Figure 13. Change in the Number of FTE Positions for States in the Steady Increase Group: FY 2006–14
Source: State Library Administrative Agencies Survey, fiscal years 2004–10, 2012, and 2014; Institute of Museum and Library Services; National Center for Education Statistics.
Reductions in FTEs for SLAAs in this group are seen in all staffing categories except library
development. Administrative FTEs decreased by 9 percent in the eight-year period. Staffing levels for
library services suffered a sharp decline of 11 percent between FY 2010 and FY 2012 and a more
modest decline of 4 percent from FY 2012 to FY 2014. FTE positions for other services rose and fell
somewhat from year to year but experienced a 12 percent decline between FY 2006 and FY 2014.
FTE positions in library development grew by 40 percent between FY 2006 and FY 2014.
Nevertheless, the pace of the growth was not constant throughout the years. Growth slowed
between FY 2008 and FY 2010 to 7 percent, but from FY 2010 to FY 2012, it accelerated and
expanded by 25 percent. See Figure 14 for details.
ColoradoNorth Dakota
Delaware
Montana ArkansasDistrict of Columbia
Hawaii
AlaskaMinnesota
Num
ber o
f FTE
Pos
ition
s
2004 2005 2006 2007 2008 2009 2010 2012 2014Fiscal Year
100
200
150
250
300
50
0
State Library Administrative Agency Survey Fiscal Year 2012 | 29
Figure 14. Change in the Number of FTE Positions for States in the Steady Increase Group, by Type of Service Provided: FY 2006–14
Source: State Library Administrative Agencies Survey, fiscal years 2004–10, 2012, and 2014; Institute of Museum and Library Services; National Center for Education Statistics.
3.3.3 Trends for the Flat Recovery Group
The 27 SLAAs in the Flat Recovery group demonstrated an overall decline in FTEs of 19 percent
in the eight-year period. As with other groups, there was variability in the degree and pattern of
decline among SLAAs. Overall, there was a decrease from FY 2008 to FY 2010, a slower decline
of 4 percent in FY 2012, and then a continued decline by 5 percent in FY 2014. Figure 15 shows
individual state trends for the Flat Recovery group.
2006 2008 2010 2012 2014Fiscal Year
Chan
ge in
FTE
Pos
ition
s
Administration
Library Development
Library Services
Other Services
Total Staff
0
50
100
150
200
250
300
30 | Institute of Museum and Library Services
Figure 15. Change in the Number of FTE Positions for States in the Flat Recovery Group: FY 2006–14
Source: State Library Administrative Agencies Survey, fiscal years 2004–10, 2012, and 2014; Institute of Museum and Library Services; National Center for Education Statistics.
This group of SLAAs lost FTEs in all areas of service categories. Administrative staff declined by
9 percent overall. Library services FTEs declined by 3 percent between FY 2006 and FY 2008,
and then fell more precipitously, by 15 percent, between FY 2008 and FY 2010. In contrast, there
was a substantially slower decline of 2 percent for FTEs in library services between FY 2012 and
FY 2014. The overall decline for library services positions between FY 2006 and FY 2014 was
23 percent. This service category includes the largest number of FTEs, it also saw the steepeest
decrease between FY 2006 and FY 2014—topped only by the decline of FTEs in the other services
category. From FY 2006 to FY 2014, the Flat Recovery SLAAs experienced a 28 percent decline in
the number of FTE positions in other services. Figure 16 shows the eight-year trend of the total
number of FTE positions for states with Flat Recovery, by type of service provided.
1,400
1,600
1,800
2,000
2,200
600
1,000
200
800
1,200
400
0
New YorkWisconsin Maryland
South Dakota Arizona
KentuckyWest Virginia
Idaho
New JerseyTennessee
Texas
Georgia
Nevada KansasWashington
NebraskaVirginia Iowa
Oklahoma
IndianaVermont MissouriOregon
Rhode Island
Mississippi IllinoisUtah
Num
ber o
f FTE
Pos
ition
s
2004 2005 2006 2007 2008 2009 2010 2012 2014Fiscal Year

State Library Administrative Agency Survey Fiscal Year 2012 | 31
Figure 16. Change in the Number of Total FTE Positions for States in the Flat Recovery Group, by Type of Service Provided: FY 2006–14
Source: State Library Administrative Agencies Survey, fiscal years 2004–10, 2012, and 2014; Institute of Museum and Library Services; National Center for Education Statistics.
3.4 Summary of Indicator 2: Workforce
SLAA reports across all states on the number of FTE positions in FY 2014 revealed a large decrease
of 22 percent, relative to FY 2006 counts. The decreased staffing was seen primarily in the library
services and library development classifications, although all categories saw decreases in staffing.
At a summary level, the downward trend in staffing appears to be slowing, with a reported drop of
just 4 percent between FY 2012 and FY 2014.
Reviewing workforce statistics at the group level, the largest decrease in staffing, of 32 percent,
is seen in the Small Recovery group, with the largest percentage of loss in the administrative and
library development classifications. The group designated Steady Increase showed the smallest—but
still a decided—decrease in FTEs, 5 percent from FY 2006 to FY 2014. The greatest proportion of
the FTE decrease for this group was seen in library development.
2006 2008 2010 2012 2014Fiscal Year
Chan
ge in
FTE
Pos
ition
s
Administration
Library Development
Library Services
Other Services
Total Staff
0
500
1,000
1,500
2,000
2,500

32 | Institute of Museum and Library Services
IV. Indicator 3: SLAA-Provided ServicesFor the FY 2014 SLAA Survey, substantial changes were made to the questionnaire series describing
the services that SLAAs provided to libraries and cooperatives. Most questions in this section have
been asked continuously since 1994, with relatively few changes, but the series was updated and
modernized to capture fully the services provided by SLAAs.12
The services data presented here are a snapshot view of FY 2014. As a result of the questionnaire
revisions, trend data are not available for the services provided by SLAAs. Instead, the report
provides more detailed information on a set of items at the national and group levels for FY 2014.
4.1 FY 2014 Snapshot of Services
For FY 2014, SLAAs reported providing services in four broad areas:
1. Services to libraries and library cooperatives
2. Operational assistance
3. Coordination and integration of library services
4. Program assistance
4.1.1 Services to Libraries and Library Cooperatives
This report focuses on four of the 10 types of services that SLAAs provide to libraries and library
cooperatives as reported in the FY 2014 data collection: consulting, administrative library system
support, LSTA statewide grant programs, and LSTA statewide services. These services were selected
because they are either new data elements or are considered a research priority by IMLS. Table 9
summarizes the percentage of all SLAAs providing these forms of support to any type of library and
to particular types of libraries.
Table 9. Percentage of SLAAs Providing Selected Services to Libraries and Library Cooperatives, by Type of Library: FY 2014
Services to libraries and library cooperatives
Any type of library
Type of library
Public library
Academic library
School library media center
Special library
Library cooperative
LSTA statewide services 100 100 75 69 65 51
Consulting services 96 96 57 63 61 61
LSTA statewide grant programs
84 84 57 53 47 51
Administrative library system support
61 49 12 12 10 43
Source: State Library Administrative Agencies Survey, FY 2014; Institute of Museum and Library Services.
12 For a complete list of changes, see Appendix A.

State Library Administrative Agency Survey Fiscal Year 2012 | 33
Forty-nine of the 51 SLAAs provided some form of consulting services (96 percent), and the same
percentage of all SLAAs provided consulting services to public libraries. The most common forms
of consulting services were for the following:
¡ Library management or organizational development, continuing education, and youth services13
¡ Technology and connectivity
¡ E-Rate consulting
In addition, approximately 70 percent of SLAAs provided consulting services for adult literacy and
63 percent provided consulting for construction projects.
In providing administrative library system support, 49 percent of SLAAs provided support to
public libraries and 43 percent to library cooperatives. Fewer SLAAs provided administrative
system support to special libraries (10 percent), academic libraries (12 percent), and school
library media centers (12 percent).
Nearly all SLAAs provided LSTA state program grants to public libraries, and roughly half of SLAAs
also provided grants to academic libraries (57 percent), school library media centers (53 percent),
library cooperatives (51 percent), and special libraries (47 percent).
4.1.2 Operational Assistance
Operational assistance describes services provided by SLAAs to assist and support the development
of libraries or to link libraries to external networks. Table 10 describes the operational assistance
provided, as well as the type of recipient libraries, in order of service most provided by SLAAs.
Table 10. Percentage of SLAAs Providing Selected Operational Assistance to Libraries and Library Cooperatives, by Type of Library: FY 2014
Type of operational assistance
Any type of library
Type of library
Public library
Academic library
School library media center
Special library
Library cooperative
Interlibrary loan referral services
86 84 73 67 71 45
Reference referral services
82 82 67 59 67 45
Cooperative purchasing of materials
49 49 29 25 27 20
Source: State Library Administrative Agencies Survey, FY 2014; Institute of Museum and Library Services.
Across all three types of operational assistance—interlibrary loan referral services, reference
referral services, and cooperative purchasing of materials—SLAAs were most likely to provide
support to public libraries. More than two thirds of SLAAs also provided interlibrary loan referral
services to academic libraries, schools, and special libraries.
13 For definitions of new data elements, see the SLAA 2014 data documentation in appendix E.

34 | Institute of Museum and Library Services
4.1.3 Coordination and Integration of Library Services
Coordination and integration of library services include working with the materials, services, and
programs designed to meet users’ needs. To better understand the new areas of services that
SLAAs provide, the FY 2014 data collection included questions about whether SLAAs applied to
federal agencies other than IMLS for funding as well as the extent of statewide resource sharing.
Table 11 summarizes the types of coordination and integration of library services provided as well
as the types of recipient libraries across all SLAAs in FY 2014.
Table 11. Percentage of SLAAs Providing Selected Coordination or Integration Services to Libraries and Library Cooperatives, by Type of Library: FY 2014
Type of coordination or integration service
Any type of library
Type of library
Public library
Academic library
School library media center
Special library
Library cooperative
Statewide resource sharing
94 96 67 71 61 55
Statewide coordinated digital program or service
53 53 33 35 29 31
Statewide virtual reference service
37 37 29 27 27 20
Acquisition of other federal program funds
33 33 6 8 8 10
Source: State Library Administrative Agencies Survey, fiscal years 2004–10, 2012, and 2014; Institute of Museum and Library Services; National Center for Education Statistics.
By far, SLAAs provided statewide resource-sharing services more than other coordination and
integration service. Statewide resource sharing describes organized efforts to support the
sharing of services and materials. Nearly all SLAAs provided services in this area for public
libraries, while substantial numbers of SLAAs provided these services to school (71 percent)
and academic libraries (67 percent).
Only a small share of SLAAs provided support for coordination on acquisitions using other federal
program funds (33 percent).
4.1.4 Program Assistance
Although SLAAs provide program assistance in six areas, this report focuses on three areas:
continuing education programs, literacy programs, and statewide reading programs.14 Table 12
describes these three types of program assistance as well as the types of recipient libraries.
14 Data on all elements can be found in the supplemental tables (Tables 10a–10e and Tables 32–35).

State Library Administrative Agency Survey Fiscal Year 2012 | 35
Table 12. Percentage of SLAAs Providing Selected Program Assistance Services to Libraries and Library Cooperatives, by Type of Library: FY 2014
Type of program assistance
Any type of library
Type of library
Public library
Academic library
School library media center
Special library
Library cooperative
Continuing education programs
96 96 73 75 73 53
Statewide reading programs
69 71 10 33 12 29
Literacy program support 67 67 10 24 8 20
Source: State Library Administrative Agencies Survey, fiscal years 2004–10, 2012, and 2014; Institute of Museum and Library Services; National Center for Education Statistics.
Ninety-six percent of SLAAs provided assistance for continuing education programs to at least one
type of library with the most frequently provided support going to public libraries. The majority of
SLAAs offered support for continuing education programs to other types of libraries as well.
SLAAs also offered statewide reading programs to targeted-age populations.15 In total, 31 SLAAs
(69 percent) reported having statewide reading programs. The most common target audience for
SLAA reading programs was the middle childhood group, followed by young adults. As with literacy
programs, SLAAs most commonly provided support for statewide reading programs to public libraries
(71 percent). Few SLAAs offered support to these programs in other types of libraries. Schools were
the second most common recipient of these program supports, with 16 SLAAs (33 percent) offering
statewide reading program supports.
In total, 34 SLAAs (67 percent) provided some form of literacy program support with all of these
SLAAs providing support to public libraries.16 The most commonly offered literacy program was in
digital literacy, offered by 31 SLAAs (61 percent). Schools were the second most common recipient
of this service; 12 SLAAs (24 percent) offered literacy program support to schools. Only four of the
51 SLAAs (8 percent) provided literacy support to special libraries.
4.2 Patterns of Services Provided, by Group, FY 2014
This section focuses on comparing the services offered by SLAAs by the three groups, as defined
by their revenue and expenditure patterns. Interpretation of SLAA service patterns and recipients
of those services, as well as a comparative evaluation across groups, is limited by the single year
of measurement, the differing universe of service recipients within each state, and state-defined
boundaries for their respective SLAAs in services and recipients of services.
15 Reading program-targeted populations include early childhood, middle childhood, young adult, adult, and older adult.16 SLAAs were asked if they provided support for the seven forms of literacy: language, numerical, information, digital, financial,
health, and family/intergenerational literacy. For detailed definitions on these forms of literacy, please see Appendix E.

36 | Institute of Museum and Library Services
As discussed in the prior section, SLAAs reported providing services in four broad areas:
¡ Services to library and library cooperatives
¡ Operational assistance
¡ Coordination and integration of library services
¡ Program assistance
Table 13 presents the percentage of SLAAs nationally as well as by group that provide selected
types of services within these four broad areas.
Table 13. Percentage of SLAAs Providing Selected Types of Support to Libraries and Library Cooperatives, by Group: FY 2014
Supports for libraries and library cooperatives
National (n = 51)Small Recovery group (n = 15)
Steady Increase group (n = 9)
Flat Recovery group (n = 27)
Percentage Percentage Percentage Percentage
Services
Consulting services 96 100 89 96
Administrative library support 61 60 78 56
LSTA state program grants 84 80 67 93
LSTA statewide services 100 100 100 100
Operational assistance
Cooperative purchasing of library materials
49 33 56 56
Interlibrary loan referral services
86 87 100 81
Reference referral services 82 93 78 78
Coordination or integration
Statewide coordinated digital program or service
53 53 67 48
Statewide virtual reference service
37 53 33 30
Acquisition of other federal program funds
35 40 33 32
Statewide resource sharing 98 100 100 96
Program assistance
Continuing education programs
96 100 89 96
Literacy program support 67 67 56 70
Statewide reading programs 71 73 67 72
Note: Two SLAAs in the Flat Recovery group did not respond to the items on acquisition of other federal program funds and statewide resource sharing. For these items, the total n is 25 for the Flat Recovery group and 49 overall.
Source: State Library Administrative Agencies Survey, FY 2014; Institute of Museum and Library Services.

State Library Administrative Agency Survey Fiscal Year 2012 | 37
As seen in Table 13, all groups of SLAAs provided high levels of services to libraries and
cooperatives. All SLAAs in the three groups reported providing statewide LSTA services. However,
a lower percentage of Steady Increase SLAAs reported providing LSTA state program grants
consulting services than did SLAAs in the other two groups. By contrast, a higher percentage of
the Steady Increase SLAAs provided administrative support than did SLAAs in the other two groups.
In the broad category of operational assistance, a higher proportion of the SLAAs in the Steady
Increase group provided interlibrary loan services than did those in the Flat Recovery and Small
Recovery groups.
Under coordination and integration, a higher percentage of SLAAs in the Steady Increase group
provided a statewide coordinated digital program. A greater percentage of those in the Small
Recovery group provided coordinating services through pursuit of other federal program funding.
For all three types of program assistance included in Table 13, a lower proportion of SLAAs in the
Steady Increase group provided this assistance than did those in the two groups demonstrating
more impact of the recession.
Two notable observations are found in a review of services, by group, in these single-year data,
with regard to literacy program support and statewide reading campaigns.
First, as seen in Table 14, literacy program support did not vary widely across groups for language
literacy and information literacy. However, four other types of literacy—numerical, financial, family/
intergenerational, and health—did show different patterns. These four types of literacy support not
only varied by group but were provided by a lower percentage of SLAAs in the Steady Increase group,
which had increased revenues and expenditures in the 10-year period.
In addition, compared with SLAAs in the Small Recovery and Steady Increase groupings, a lower
proportion—84 percent—of SLAAs in the Flat Recovery group provided digital literacy support.
Digital literacy was the most frequently offered literacy service by SLAAs in all three groups.
Language literacy also was offered by the vast majority of SLAAs in each group.
Table 14. Percentage of SLAAs Providing Selected Types of Statewide Literacy Services, by Group: FY 2014
Type of literacy service provided
National (n = 51)Small Recovery group (n = 15)
Steady Increase group (n = 9)
Flat Recovery group (n = 27)
Percentage Percentage Percentage Percentage
Language 79 80 80 79
Numerical 59 50 40 68
Information 74 70 80 74
Digital 91 100 100 84
Financial 62 60 40 68
Health 68 60 40 79
Family/intergenerational 71 80 60 68
Note: Numbers are summed across the various types of libraries (public, academic, and school; special; and library cooperatives).
Source: State Library Administrative Agencies Survey, FY 2014; Institute of Museum and Library Services.

38 | Institute of Museum and Library Services
Statewide reading promotion campaigns are coordinated programs that target different population
groups to support, maintain, or improve reading skills. Very similar degrees of support for reading
promotion programs were seen across groups of SLAAs (Table 15). However, SLAAs in the Small
Recovery group do appear to participate in these programs to a lesser extent than SLAAs in
other groups.
Table 15. Percentage of SLAAs Providing Statewide Reading Promotion Campaigns to Various Target Audiences, by Group: FY 2014
Target audience
National (n = 51)Small Recovery group (n = 15)
Steady Increase group (n = 9)
Flat Recovery group (n = 27)
Percentage Percentage Percentage Percentage
Early childhood 74 55 83 83
Middle childhood 86 73 83 94
Young adults 77 45 83 94
Adults 49 36 67 50
Older adults 43 27 67 44
Note: Numbers are summed across the various types of libraries (public, academic, and school; special; and library cooperatives).
Source: State Library Administrative Agencies Survey, FY 2014; Institute of Museum and Library Services.
4.3 Summary of Indicator 3: Services
In FY 2014, the SLAA questionnaire was revised to capture greater detail about the services that
SLAAs provided and the recipients of these services. This expanded reporting of the SLAA-provided
services will serve as a benchmark in coming years.
Although there was variation among SLAAs in the kinds of services provided, some services were
more commonly provided than others. Almost all SLAAs provided some kind of consulting services,
and more than half provided some form of literacy support or statewide reading programs.
Public libraries were most likely to receive any kind of support from SLAAs compared to other
types of libraries. For example, nearly all SLAAs provided LSTA program grants, interlibrary loan
referral services, statewide resource sharing, and continuing education programs to public
libraries.
A comparison of the SLAA-provided services by the three SLAA groups demonstrated some
variability. For example, a higher proportion of SLAAs in the Small Recovery group provided
statewide virtual reference services compared to the other two groups. And while all SLAAs in the
Steady Increase group provided interlibrary loan referral services, fewer SLAAs in the other two
groups provided this service.

State Library Administrative Agency Survey Fiscal Year 2012 | 39
V. Discussion and SummaryThe findings from this survey highlight the contributions that SLAAs make in the development of
library services across the country. They consequently provide a national view on the condition
and activities of SLAAs in FY 2014.
One of the most substantial findings of this report is the continued decline in total revenues to
SLAAs. This decline coincides with the Great Recession and has continued through FY 2014. In FY
2014, total SLAA revenues equaled $1.1 billion, coming from federal, state, and other revenue
sources; this total represents a 17 percent decrease in federal revenue, an 11 percent increase in
state revenue, and a 13 percent decrease in other revenues when compared with FY 2004. Yet, the
pattern may be changing, as total revenues increased by 5 percent from FY 2012 to FY 2014.
Total expenditures across the 50 states and the District of Columbia equaled approximately
$1 billion in FY 2014. These included $688 million for financial assistance to libraries and
$345 million for operating expenditures. Expenditures closely followed the trend of declining
total revenues between FY 2004 and FY 2014.
SLAAs experienced the recession differently, with three general groupings of patterns: (1) Small
Recovery, demonstrating a large decrease in revenues and expenditures with a small postrecession
recovery; (2) Steady Increase, despite the recession showing an overall increase in revenues and
expenditures; and (3) Flat Recovery, exhibiting a decrease in revenues and expenditures and a flat
postrecession recovery.
The decline in total revenues for SLAAs coincided with a reduction in staff. The number of FTE staff
positions declined by 22 percent from FY 2006 to FY 2014. This staffing contraction was greatest
for library services, which declined by 26 percent during this eight-year span. In contrast, staffing
declines in library development were the smallest, at 10 percent from FY 2006 to FY 2014. Within
the groupings of states, the reported relative loss of FTEs behaved as expected, according to the
patterns of revenues and expenditures. The Steady Increase group experienced the smallest loss of
FTEs; the Flat Recovery group experienced the greatest loss of FTEs.
The reorganization of the survey in FY 2014 can allow for greater insights into the types of
services offered across the SLAAs. Even with diminishing staff and revenues, SLAAs are
continuing to provide a wide array of services to libraries. These range from reading and literacy
programs to construction consulting services and E-Rate. In evaluating this snapshot of services
by the revenue and expenditures groups, we found that groups demonstrating a stronger financial
position did not necessarily offer more services to their members, but they did offer a slightly
different range of services.

This page intentionally left blank

Appendices

This page intentionally left blank

State Library Administrative Agency Survey Fiscal Year 2012 | A-1
Appendix A. Technical NotesThis report contains data on SLAAs in the 50 states and the District of Columbia for FY 2014
and previous fiscal years (2004–12). The data were collected through the SLAA Survey, which is
sponsored by IMLS. AIR is the data collection agent for IMLS. SLAAs are the reporting unit for
the survey.
Survey Background and Purpose
Legislative Authorization. IMLS collects these data under the mandate in the Museum and Library
Services Act of 2010 (P.L. 111-340) as stated in Section 210 (20 U.S.C. § 9108, Policy Research,
Analysis, Data Collection, and Dissemination).
Sec. 9108. Policy Research, Analysis, Data Collection, and Dissemination
(a) In general
¡ The Director shall annually conduct policy research, analysis, and data collection to
extend and improve the Nation’s museum, library, and information services.
(b) Requirements
¡ The policy research, analysis, and data collection shall be conducted in ongoing
collaboration (as determined appropriate by the Director), and in consultation, with
(1) SLAAs;
(2) National, State, and regional library and museum organizations; and
(3) Other relevant agencies and organizations.
(c) Objectives
¡ The policy research, analysis, and data collection shall be used to
(1) Identify national needs for and trends in museum, library, and information services;
(2) Measure and report on the impact and effectiveness of museum, library, and
information services throughout the United States, including the impact of federal
programs authorized under this Act;
(3) Identify best practices; and
(4) Develop plans to improve museum, library, and information services of the United
States and to strengthen national, State, local, regional, and international
communications and cooperative networks.
IMLS library research activities are conducted in ongoing collaboration with SLAAs and other
relevant agencies and organizations to extend and improve the nation’s library and information
services. The SLAA Survey is designed to provide consistent, reliable, complete, and accurate
indicators of the status and trends of state and public libraries; and to report timely, useful, and
high-quality data to the U.S. Congress, the states, other education policymakers, practitioners,
data users, and the general public.

A-2 | Institute of Museum and Library Services
Survey Methodology
Survey Universe
The survey universe comprises the SLAAs in the 50 states and the District of Columbia (51 total).
The respondents for the SLAA FY 2014 Survey were employed by states at each of the SLAAs.
Chief Officers of each of the SLAAs assigned respondents to provide data for the survey. Data
were entered by the respondents and certified by the Chief Officers.
Web-Based Data Collection Tool and Questionnaire
The SLAA FY 2014 Survey data were collected in English over the Internet using a Web-based
reporting system. The Web application included a user’s guide and tutorial that explained its features
and operation, the survey questionnaire, and a data edit check tool designed to alert respondents to
anomalies or inconsistencies in their data entries. The Web application was designed to minimize
response burden, improve data quality and timeliness, and ensure that minimal or no follow-up would
be required with state agencies to resolve data problems.
The FY 2014 survey collected data on 356 items.1 The survey is made up of 13 parts (Table A1).
Data items and definitions are provided in the survey questionnaire and the instructions for
completing survey items. Additional information on the questionnaire is in Appendix C.
Table A-1. Organization of FY 2014 SLAA Survey: Parts A Through M
Part Name
Part A State Library Administrative Agency Identification
Part B Governance
Part C Allied Operations, State Resource or Reference/Information Service Center, and State Center for the Book
Part D Services to Libraries and Library Cooperatives
Part E Public Service Hours, Outlets, and User Groups
Part F Collections
Part G Library Service Transactions
Part H Library Development Transactions
Part I Staff
Part J Revenue
Part K Expenditures
Part L LSTA State Program Expenditures
Part M Electronic Services and Information
1 All subtotals and totals in the survey were automatically generated from the detail and thus are not included in this number.

State Library Administrative Agency Survey Fiscal Year 2012 | A-3
Survey Response Rate
Unit Response. The SLAA FY 2014 Survey achieved a 100 percent unit response rate.2 A
response is considered complete if it includes responses for at least three of the following five
items: total staff, total revenues, total expenditures, total book and serial volumes, and total
circulation transactions.
Item Response. Item response rates were calculated by dividing the total number of SLAAs
reporting data for an item by the total number of SLAAs in the survey universe. Item-level response
rates ranged from 94 to 100 percent. The lowest item response rate in the SLAA FY 2014 Survey
was 94 percent.
Data Collection and Processing
Data Collection. The SLAA FY 2014 Survey was opened for data entry to SLAAs using the Web-
based tool beginning on January 12, 2015. The survey data collection was closed on March 27,
2015. AIR was the data processing agent for the survey and administered the Web application,
provided technical support to respondents, performed edit and nonresponse follow-up, and
produced the data files and tabulations.
Data Processing. To ensure accuracy, data were checked during data collection and
postprocessing. In addition, data were imputed for missing values.
Postedit Processing. After respondents locked their data, AIR performed additional edit checks or
posted processing on the data (e.g., a comparison of the sum of the reported detail to a reported
total). If an SLAA’s data failed any postedit tests, AIR delivered an edit report to the respondent for
further data editing and cleaning. Respondents were asked either to correct the data or verify the
data as correct, and then they were asked to return the report to AIR. AIR analysts incorporated
the edited data into each respondent’s data file and reran all postedit tests, working in an iterative
fashion until all postedit data checks were resolved.
For further details on data collection and data processing procedures, refer to the data
documentation in Appendix E.
State comparisons should be made with caution because states vary in their fiscal year reporting
periods and may vary in their interpretation of the survey items. Similarly, the District of Columbia,
although not a state, is included in the survey. Caution should be used in comparing data for a city
with data for a state.
2 The American Association for Public Opinion Research. (2016). Standard definitions: Final dispositions of case codes and outcome rates for surveys (9th ed.). Oakbrook Terrace, IL: AAPOR.

A-4 | Institute of Museum and Library Services
Adjusting for Inflation
For financial trends that report dollar amounts over time, such as 10-year revenues trends, metrics
are presented in constant dollars. Constant dollars are an adjusted value of currency that accounts
for inflation. We use this adjustment to compare monetary values from one period to another. For the
present analyses, inflation was accounted for using a gross domestic product (GDP) deflator as
shown in Equation 1.
Equation 1: GDP Deflator
In general, a real value is one in which the effects of inflation have been taken into account, and a
nominal value is one in which the effects have not. Thus, the real GDP is the value of all the goods
and services produced in the United States expressed relative to some base year, and the nominal
GDP is the value of the same goods and services expressed in current prices.
To calculate the value in constant dollars for a target year, multiply a value from a base year by a
ratio of the GDP deflators from the base year and the target year. For example, to calculate the
amount of revenues from the year 2004 in 2014 constant dollars, multiply the original value of
revenues in 2004 by the ratio of the deflators from year 2014 to 2004 (see Equation 2).
Equation 2: Adjustment for Inflation to Constant Dollars
For the purposes of calculating the adjustments for inflation, we used the constant dollars for July
2013–June 2014. These adjusted financial data are reported in the tables and graphs in this report.
Cluster Methodology
We conducted a cluster analysis based on the percentage of change in total revenues and total
expenditures for each state from FY 2004 through FY 2014 (in two-year increments). Prior to
conducting the cluster analysis, we calculated the average percentage change in total revenues
and total expenditures for the six data points, or years, used in this analysis. The following table
illustrates each of the year pairings where percentage differences were calculated. There were 15
pairs produced separately for total revenues and total expenditures, for a total of 30 pairs for each
state. All financial trends reported are adjusted for inflation using a GDP deflator.
2004Value Value(nominal 2004 dollars)
GDP De�ator 2014
GDP De�ator 2004X=Value(constant 2014 dollars) =

State Library Administrative Agency Survey Fiscal Year 2012 | A-5
Table A-2. Year Pairings for Which Percentages Were Calculated
Year pairs 2004 2006 2008 2010 2012
2006 2004/2006
2008 2004/2008 2006/2008
2010 2004/2010 2006/2010 2008/2010
2012 2004/2012 2006/2012 2008/2012 2010/2012
2014 2004/2014 2006/2014 2008/2014 2010/2014 2012/2014
We then calculated the average of these paired differences for each state and ran the cluster
analysis procedure based on the average change in expenditures and revenues. The algorithm
clustered states into three groups based on the average change in revenues and expenditures
(Figure A-1). The algorithm identifies groups by placing states nearest to their cluster’s mean as
possible and minimizing the sum of the squared distances of each state to its cluster’s mean.
Figure A-1. Dispersion of States Within Each Cluster
The graphs in the cluster analysis display the pattern for each state based on its changes in total
expenditures within the time frame. The color-coded areas are the expenditure amounts reported
by each state during the 10-year period, so that the overall amount reflected by the top line of the
graph is the sum total of each state’s expenditure.
Cluster 1 2 3
30%
(10%)
10%
(30%)
0%
0%(20%)(40%) 40%20%
20%
(20%)
% C
hang
e To
tal R
even
ue
% Change Total Expenditures

A-6 | Institute of Museum and Library Services
Data and Analyses Limitations
The data presented in this report are reported by a representative of the SLAA through the SLAA
Survey questionnaire. Chief Officers of each SLAA certified the data provided.
The SLAA Survey began in FY 1984 as an annual survey and was shifted to a biennial frequency in
2010. Necessary changes to survey questionnaire series in 2006 (workforce) and 2014 (services
provided) created discontinuities in the data that limit their use in trend analyses.
Reporting Period
The SLAA FY 2014 Survey requested that respondents report data for each state in FY 2014. For
the items in Part B (Governance) and Part I (Staff), respondents were requested to report data as
of October 1, 2014. The fiscal year for most states was July 1, 2013, to June 30, 2014. Six SLAAs
had fiscal years with different start and end dates. The exceptions were
¡ New York (April 1, 2013, to March 31, 2014)
¡ Texas (September 1, 2013, to August 31, 2014)
¡ Alabama, the District of Columbia, Maryland, and Michigan (October 1, 2013,
to September 30, 2014)
State comparisons should be made with caution because states vary in their fiscal year reporting
periods and may vary in their interpretation of the survey items. Similarly, the District of Columbia,
although not a state, is included in the survey. Caution should be used in comparing data for a city
with data for a state.
Changes to the 2014 Questionnaire
The following changes to the questionnaire were implemented between the FY 2012 and FY 2014
data collections. The numbers included in the brackets indicate the item line number in the SLAA
FY 2012 Survey questionnaire.
The following questions were removed:
LSTA state program expenditures by use [194, 195, 196, 197, 198]
Online Computer Library Center (OCLC) Group Access Capability (GAC) [60]
Retrospective conversion of bibliographic records [63]
Union list development [69]
The following questions were replaced or clarified:
Literacy program support [59]
Administration of LSTA grants [49] was replaced with two questions that specifically clarify the
two types of administration, which are LSTA state program grants [75] and LSTA statewide
services [76].

State Library Administrative Agency Survey Fiscal Year 2012 | A-7
The following questions were added:
Administration of library system support [71]
Involvement in the acquisition of other federal program funds [72]
If yes [72.1], which federal agencies other than IMLS do you apply for funding from?
Statewide reading programs [73]
If yes [73.1], do you support the following target populations for statewide reading promotion
campaigns?
Statewide resource sharing [74]
Follow-up questions were added to existing questions:
These questions appeared to the respondent only if the respondent answered affirmatively
to question 53 or 59:
53.1. Which of the following consulting services do you provide?
59.1. Which of the following types of literacy programs do you support?

B-1 | Institute of Museum and Library Services
Appendix B. SLAA Applicants to Universal Service
(E-Rate Discount) ProgramArizona State Library, Archives and Public
Records
Colorado State Library
Delaware Division of Libraries
Georgia Public Library Service
Hawaii State Public Library System
Illinois State Library
Indiana State Library
Iowa Library Services
State Library of Louisiana
Maine State Library
Mississippi Library Commission
Missouri State Library
Nebraska Library Commission
New Mexico State Library
State Library of Ohio
South Carolina State Library
Tennessee State Library and Archives
Vermont Department of Libraries
The Library of Virginia
Washington State Library
West Virginia Library Commission

State Library Administrative Agency Survey Fiscal Year 2012 | C-1
Appendix C. SLAA Responses to “Other” Consulting Services Provided Open-Ended Question: FY 2014SLAA Description of Other Consulting Services ProvidedAlabama Trustee Training, Advocacy
Arkansas Digital Services, Federal Documents Depository Consulting
California Early Learning, Preservation & Digitization
Colorado Library Board; K–12 School Libraries; Institution Libraries
Connecticut Library Statistics
Florida Library Data Analysis
Idaho Law
Indiana Budget, New Director, Trustee
Maine Early Childhood Literacy
Massachusetts Preservation & Disaster Recovery Planning
Minnesota Digital Literacy
Nebraska Library Laws, Nonprofit Corporations, Friends/Foundations, Regional and Statewide Cooperation/Collaboration, ILS Consortium, Statewide Databases
Nevada Workforce Development
New Jersey Response Too Long for Field. Please Send Email to Request Response.
New York Outreach to Special Populations; Disaster Response; Conservation/Preservation
Ohio Space Planning
South Carolina Workforce Development
South Dakota Joint Libraries; Common Core Crosswalk With Library Standards; Summer & Year-Round Reading Initiatives
Wisconsin Use of Library Data and Statistics
Wyoming As Needed Per Requests

D-1 | Institute of Museum and Library Services
Appendix D. States Involved in the Acquisition of Federal Program Funds and Other Funds, by Type of Federal Agency: FY 2014SLAA FCC/USAC Other Other: Federal Program AppliedAlaska Y N P
Arizona Y Y Library of Congress, National Endowment for the Humanities
Connecticut Y N P
Hawaii Y DK P
Idaho Y N P
Maine Y DK P
Nebraska Y Y U.S. Department of Commerce and U.S. Department of Transportation
New York Y N None
Ohio Y Y Corporation for National & Community Service
Oklahoma N Y TANF SNAP
South Carolina Y N P
Vermont Y Y U.S. Economic Development Administration (Grant Partner); National Telecommunications and Information Administration (BTOP Grant Partner); National Library of Medicine—New England Region
Virginia P P P
Washington Y N P
West Virginia P P P
Wisconsin N Y Wisconsin Department of Admin E-Rate Discounts for School and Public Library Broadband
Wyoming Y N P
Note: DK = Don’t Know; N = No; P = Skipped Item; Y = Yes.
Source: State Library Administrative Agencies Survey, FY 2014; Institute of Museum and Library Services. Data users who create their own estimates using data from this report should cite the Institute of Museum and Library Services as the source of the original data only. Although the data in this table come from a census of all governmental units and are not subject to sampling error, the census results do contain nonsampling error.

State Library Administrative Agency Survey Fiscal Year 2012 | E-1
Appendix E. FY 14 SLAA Survey

E-2 | Institute of Museum and Library Services
State Library Administrative Agency Survey: Fiscal Year 2014—E–58
Appendix E. FY 14 SLAA Survey
State Library Administrative Agency Survey, FY 2014 Survey Instrument
Part A: State Library Administrative Agency Identification 001 SLAA Name ___________________________________________________________ Physical location address: 002 Street _________________________________ 003 City _________________________________ 004 State _________________________________ 005 ZIP _________ 006 ZIP+4 __________ Mailing Address: 007 Street _________________________________ 008 City _________________________________ 009 State _________________________________ 010a ZIP ________ 010b ZIP+4 _________ 011 Web address http:// ___________________________________________________ Chief Officer of State Library Administrative Agency: 012 Name _________________________________ 013 Title _________________________________ 014 Telephone _________________________________ 015 Fax _________________________________ 016 Email address ______________________________________________________ Survey Respondent: 017 Name _________________________________ 018 Title _________________________________ 019 Telephone _________________________________ 020 Fax _________________________________ 021 Email address ______________________________________________________ Reporting Period, Report data for State fiscal year 2013-2014 (except parts B&I) 022 FY Starting date (mm/dd/yyyy) _________________________ 023 FY Ending date (mm/dd/yyyy) _________________________
Part B: Governance 1. What is the SLAA’s location in State government as of October 1, 2014? Specify either the legislative or executive
branch. If the SLAA is located in the Executive branch, specify whether the SLAA is an independent agency or part of a larger agency.
Branch of government:
025_ Legislative branch—Skip to question 2. Executive branch—Provide information in A or B, as appropriate:
A. Independent agency (i.e., not part of a cabinet-level agency) - Specify to whom the Agency reports: 026_ Governor—Skip to question 2. _ Board/commission—Specify selection method:
027 _ Appointed by Governor 028 _ Appointed by other official
B. Part of larger agency - Specify: 029_ Department of education
_ Department of cultural resources _ Department of state _ Other agency _ Specify: 030 __________________________
If you specified 029 above, does your SLAA have a board or commission?
031_ Yes—Specify the Board/commission selection method: 032 _ Appointed by Governor 033 _ Appointed by other official
No

State Library Administrative Agency Survey Fiscal Year 2012 | E-3
State Library Administrative Agency Survey: Fiscal Year 2014—E–59
Part C: Allied Operations, State Resource or Reference/Information Service Center, and State Center for the Book
2. Are any of the following allied operations combined with SLAA? Select applicable items. Specify Yes or No for each item. Do not report Library for the Blind and Physically Handicapped or State Center for the Book, or a contract with another library or other entity to provide a service on behalf of the SLAA.
040 _ Yes _ No State archives 041 _ Yes _ No Primary State legislative research organization 042 _ Yes _ No State history museum/art gallery 043 _ Yes _ No State records management service 044 _ Yes _ No Other allied operation
Specify 045_________________________________________
3. Does the SLAA contract with a local public library or academic library to serve as a state resource center or reference/information service center? Specify Yes or No.
046 _ Yes _ No
4. Does the SLAA host or provide any funding to a State Center for the Book? Specify Yes or No. 047 _ Yes _ No
Part D: Services to Libraries and Library Cooperatives 5. Which of the following services are provided directly or by contract by the SLAA to libraries or library cooperatives?
Specify Directly, Contract, or Not Provided for each service, for each type of library and library cooperatives.
Note: A Library Cooperative may serve single-type of multi-type libraries. Services provided directly by the SLAA are those provided without any intermediary by the SLAA to libraries or library cooperatives. Services provided by contract by the SLAA are those provided by a third party or intermediary under legal contract to the SLAA.
Types of Services
Type of Library
Public(a)
Academic(b)
School(c)
Special(d)
Library cooperatives
(e)
Services to libraries and library cooperatives 48 Accreditation of libraries 50 Administration of State aid 51 Certification of librarians 52 Collection of library statistics 53 Consulting services
57 Library legislation preparation/review
64 State standards/guidelines
71 Administration of library system support
75 LSTA state program grants 76 LSTA statewide services Operational Assistance
55 Cooperative purchasing of library materials
56 Interlibrary loan referral services
62 Reference referral services Coordination/Integration
65 Statewide coordinated digital program or service
66Statewide public relations/library promotion campaigns

E-4 | Institute of Museum and Library Services
State Library Administrative Agency Survey: Fiscal Year 2014—E–60
Types of Services
Type of Library
Public(a)
Academic(b)
School(c)
Special(d)
Library cooperatives
(e)
67 Statewide virtual reference service
70Universal Service Program (review and approval of technology plans)
74 Statewide resource sharing
72Involvement in the acquisition of other federal program funds
Program Assistance
54 Continuing education programs
58 Library planning/evaluation/research
59 Literacy programs
61 Preservation/conservationservices
68 Summer reading programs 73 Statewide reading programs
Follow-up Questions 53.1. Which of the following consulting services do you provide? Please answer each of the questions
below by selecting one of the choices provided.
Consulting Service
53.1.1 Construction ⃝ yes ⃝ no ⃝ don't know
53.1.2 Library management/organizational development ⃝ yes ⃝ no ⃝ don't know
53.1.3 Continuing Education ⃝ yes ⃝ no ⃝ don't know
53.1.4 Technology/Connectivity ⃝ yes ⃝ no ⃝ don't know
53.1.5 Marketing/Communications ⃝ yes ⃝ no ⃝ don't know
53.1.6 E-Rate ⃝ yes ⃝ no ⃝ don't know
53.1.7 Adult literacy ⃝ yes ⃝ no ⃝ don't know
53.1.8 Youth services ⃝ yes ⃝ no ⃝ don't know
53.1.9 Other: _______ write in (250 characters max)
59.1. Which of the following types of literacy programs do you support? Please answer each of the questions below by selecting one of the choices provided. Type of Literacy Programs
59.1.1 Language literacy ⃝ yes ⃝ no ⃝ don't know
59.1.2 Numerical literacy ⃝ yes ⃝ no ⃝ don't know
59.1.3 Information literacy ⃝ yes ⃝ no ⃝ don't know
59.1.4 Digital literacy ⃝ yes ⃝ no ⃝ don't know
59.1.5 Financial literacy ⃝ yes ⃝ no ⃝ don't know
59.1.6 Health literacy ⃝ yes ⃝ no ⃝ don't know

State Library Administrative Agency Survey Fiscal Year 2012 | E-5
State Library Administrative Agency Survey: Fiscal Year 2014—E–61
59.1.7 Family/Intergenerational literacy ⃝ yes ⃝ no ⃝ don't know
72.1. Which federal agencies other than IMLS do you apply for funding from? Please answer each of the questions below by selecting one of the choices provided.
Federal agency
72.1.1 Department of Education ⃝ yes ⃝ no ⃝ don't know 72.1.2 Department of Agriculture ⃝ yes ⃝ no ⃝ don't know 72.1.3 Federal Communication Commission/Universal Service
Administrative Company ⃝ yes ⃝ no ⃝ don't know 72.1.4 Department of Labor ⃝ yes ⃝ no ⃝ don't know
72.1.5 Other:________________ write in (250 characters max)
73.1 Do you support the following statewide reading programs for target populations listed below? Please mark those that apply.
73.1.1 Early Childhood/Preschool (0–5 years old) ⃝ yes ⃝ no ⃝ don't know
73.1.2 Middle Childhood (6–12 years old) ⃝ yes ⃝ no ⃝ don't know
73.1.3 Young Adults/High School (13–18 years) ⃝ yes ⃝ no ⃝ don't know
73.1.4 Adults (19–65 years) ⃝ yes ⃝ no ⃝ don't know
73.1.5 Older Adults (65+ years) ⃝ yes ⃝ no ⃝ don't know
Part E: Public Service Hours, Outlets, and User Groups 6. Enter the total hours open in a typical week for ALL SLAA outlets, regardless of whom they serve. Do not report an
allied operations outlet as an SLAA outlet. Example: If the SLAA has a main outlet with no bookmobile or other outlets and is open for public service 40 hours in a typical week, report 40 hours. If the SLAA has a main outlet, a bookmobile, and two other outlets open 40, 20, 35, and 35 hours respectively, in a typical week, report 130 hours (40 + 20 + 35 + 35 = 130 hours per typical week).
Number
077a Total hours/week (all SLAA outlets, regardless of whom they serve)
7. Enter the total hours that the main or central SLAA outlet is open in a typical week to serve the general public or state government employees, by the following categories. Only one outlet may be designated as the main or central outlet.
Number 077b Total hours/week (main or central outlet) 078 Monday-Friday after 5:00 p.m. (main or central outlet) 079 Saturday and Sunday (main or central outlet)
8. Enter the total number of SLAA outlets by type, regardless of whom they serve. Only one outlet may be designated as the main or central outlet. Do not report an allied operations outlet as an SLAA outlet.
082 Main or central outlet _______________________ 083 Other outlets, excluding bookmobiles _______________________ 084 Bookmobiles _______________________ 085 TOTAL OUTLETS _______________________
9. Enter the number of SLAA outlets that serve the following user groups, in whole or in part, by type of outlet.

E-6 | Institute of Museum and Library Services
State Library Administrative Agency Survey: Fiscal Year 2014—E–62
User Groups
Type of outlet Main or Central
outlet (a)
Other outlets, excluding book-
mobiles (b)
Book- mobiles (c)
TOTAL OUTLETS (d)
086 Blind/physically handicapped individuals
087 Residents of state correctional institutions
088 Residents of other state institutions
089 State government employees (executive, legislative, or judicial)
090 General public
Part F: Collections 10. Enter the total number of volumes or physical units in the following selected formats in all SLAA outlets (main or
central, bookmobiles, and other outlets) that serve the general public and/or state government employees. Selected formats Number
091 Book and serial volumes (exclude microforms) (exclude collections of braille books owned by the National Library Service for the Blind and Physically Handicapped, Library of Congress)
092 Audio materials (exclude collections of talking books owned by the National Library Service for the Blind and Physically Handicapped, Library of Congress)
094 Video materials 095 Current serial subscriptions (titles, not individual issues) (include print
subscriptions only) (exclude microform, electronic, and digital subscriptions) 096 Government documents (include only government documents not
accessible through the library catalog and not reported elsewhere)
11. Is the SLAA designated as a Federal or State depository library for government documents? Specify Yes or No for each item.
106 _ Yes _ No State depository library 107 _ Yes _ No Federal depository library—Specify Yes or No for each item:
108 _ Yes _ No Regional 109 _ Yes _ No Selective
Part G: Library Service Transactions 12. Enter ANNUAL totals for the following types of service transactions in all SLAA outlets (main or central, bookmobiles,
and other outlets) that serve the general public and/or state government employees. Service transactions Number
110 Circulation (Exclude items checked out to another library) 111 Interlibrary loan/document delivery: Provided to other libraries 112 Received from other libraries and document delivery services 113 Reference transactions 114 Library visits

State Library Administrative Agency Survey Fiscal Year 2012 | E-7
State Library Administrative Agency Survey: Fiscal Year 2014—E–63
Part H: Library Development Transactions 13. Enter ANNUAL totals for the following types of library development transactions of the SLAA.
Library development transactions Number 115 LSTA and State grants: Grants awarded 117 Continuing education programs: Number of events 118 Total attendance at events
Part I: Staff 14. Enter total number of SLAA staff in FTEs (full-time equivalents) (to two decimal places), by type of service. Report all
staff on the payroll as of October 1, 2014, and unfilled but budgeted positions.
Note: Forty hours per week is the measure of full-time employment for this survey. FTEs (full-time equivalents) of employees in any category may be computed by taking the number of hours worked per week by all employees in that category and dividing it by 40. Report staff based on the SLAA organization chart. A given position (e.g., State Data Coordinator) may be part of administration in one agency, library development in another, and library services in another agency. If an employee provides more than one service, allocate the FTE among appropriate categories.
Type of Service ALA-MLS Librarians
(a)
Non ALA-MLS Librarians And
Non MLS Librarians
(b)
Other (Professional And Non-Professional)
Staff(c)
Total Staff (d)
Prior Year Total
119 Administration 120 Library development 121 Library services 122 Other services 123 TOTAL STAFF
Part J: Revenues 15. Are all public library state funds administered by the SLAA? Specify Yes or No.
Note: Answer this question based on state funds distributed to individual public libraries and library cooperatives serving public libraries only in state fiscal year 2014. If no state funds are reported in Part K in items 179(b) or 180(b), the answer should be No.
152 _ Yes _ No
16. Does SLAA administer any state funds for the following types of libraries? Specify Yes or No.
Note: Answer this question based on state funds distributed to libraries and library cooperatives in state fiscal year2014. If no state funds are reported in Part K in items 179(b) to 183(b) or 185(b), the answer should be No.
153a _ Yes _ No Academic libraries 153b _ Yes _ No School library media centers 153c _ Yes _ No Special libraries 153d _ Yes _ No Library cooperatives
17. Enter total SLAA revenue, by source and type of revenue. Exclude carryover funds. Include revenue for allied operations only if it is part of SLAA budget. Include all funds distributed to libraries and library cooperatives if the funds are administered by the SLAA.
Federal revenue Amount 154 LSTA (Library Services and Technology Act) State Programs
(Report all LSTA funds drawn down from the federal government during state fiscal year 2014, regardless of year of authorization)
155 Other Federal revenue: 156 Specify program(s) and title(s):
______________________________________________

E-8 | Institute of Museum and Library Services
State Library Administrative Agency Survey: Fiscal Year 2014—E–64
Federal revenue Amount 157 TOTAL FEDERAL REVENUE State Revenue 167 SLAA operation 168 State aid to libraries 169 Other State revenue 170 TOTAL STATE REVENUE
171 Other revenue 172 TOTAL REVENUE
Part K: Expenditures 18. Enter total SLAA expenditures, by source of revenue and type of expenditure. Include all LSTA expenditures. Include
expenditures for allied operations only if the expenditures are from the SLAA budget. Include all funds distributed to libraries and library cooperatives if the funds are administered by the SLAA. Operating expenditures for SLAA and allied operations (Do not include funds distributed to libraries and library cooperatives in items 173 to 178)
Amount by source
Federal (a)
State (b)
Other (c)
TOTAL (d)
173 Salaries and wages 174 Employee benefits 175 TOTAL STAFF
EXPENDITURES
176 Collection expenditures 177 Other operating expenditures 178 TOTAL OPERATING
EXPENDITURES
Financial assistance to libraries and library cooperatives (include all funds distributed to libraries and library cooperatives if the funds are administered by the SLAA) 179 Individual public libraries 180 Library cooperatives serving
public libraries only
181 Other individual libraries 182 Library cooperatives serving
more than one type of library
183 Single agency or library providing statewide service
184 Library construction 185 Other assistance 186 TOTAL FINANCIAL
ASSISTANCE
Other expenditures for SLAA and allied operations only 187 Capital outlay 188 Other expenditures 189 TOTAL EXPENDITURES

State Library Administrative Agency Survey Fiscal Year 2012 | E-9
State Library Administrative Agency Survey: Fiscal Year 2014—E–65
Part L: LSTA State Program Expenditures 19. Enter total SLAA state program expenditures, by type of expenditure. Report expenditures in one and only one
category. These expenditures should also be reported in Part K. Type of expenditure Amount
190 Statewide service (exclude sub-grants to single libraries or agencies providing statewide services)
191 Grants (include sub-grants to single libraries or agencies providing statewide services)
192 LSTA administration 193 TOTAL LSTA EXPENDITURES
Part M: Electronic Services and Information (a) 21. Does the SLAA fund or facilitate any of the following electronic networking functions at the state level? Specify Yes or
No for each item.
206 _ Yes _ No Electronic network planning or monitoring 207 _ Yes _ No Electronic network operation
Database development: 208 _ Yes _ No Bibliographic databases 209 _ Yes _ No Full text or data files
22. Does the SLAA fund or facilitate digitization or digital programs or services in any of the following instances? Specify Yes or No for each item.
210a _ Yes _ No For the SLAA itself 210b _ Yes _ No Via grants or contracts to other state agencies 210c _ Yes _ No Via grants or contracts to other libraries or library cooperatives
23. Does the SLAA fund or facilitate library access to the Internet in any of the following ways? Specify Yes or No for each item.
Training or consulting to facilitate access: 211a _ Yes _ No Library staff (state and local) 211b _ Yes _ No State library end users
212 _ Yes _ No Providing direct funding for Internet access 213 _ Yes _ No Providing equipment 214 _ Yes _ No Providing access to directories, databases, or online catalogs via the Internet 215 _ Yes _ No Managing a Web site, file server, bulletin boards, or electronic mailing lists
24. Enter the number of workstations that are used for Internet access by the general public in all SLAA outlets that serve the public, by the following categories. Include terminals used by both the SLAA staff and the public. Exclude terminals that are for SLAA staff use only.
Internet workstations available to the general public Number 220a Library-owned public-access graphical workstations that connect to the
Internet for a dedicated purpose (e.g., to access an OPAC or specific database, or to train the public) or multiple purposes. (For this count, the term “library-owned” includes computers leased by the state library agency.)
220b All other public access Internet workstations in the library. (Report non-library computers placed in the library by other agencies or groups. Report non-graphical workstations.)

E-10 | Institute of Museum and Library Services
State Library Administrative Agency Survey: Fiscal Year 2014—E–66
Part M: Electronic Services and Information (b) 25. How much does the SLAA expend for statewide database licensing, by source of revenue? These expenditures
should also be reported in Part K. Federal
(a) State(b)
Other (c)
TOTAL (d)
223 Statewide database licensing
26. Do your statewide database licenses, paid for by funds reported in question 25, include access by the following? Specify Yes or No for each item.
224 _ Yes _ No Public libraries 225 _ Yes _ No Academic libraries 226 _ Yes _ No School library media centers 227 _ Yes _ No Special libraries 228 _ Yes _ No Library cooperatives 229 _ Yes _ No Other state agencies 230 _ Yes _ No Remote users
27. Does the SLAA facilitate or subsidize electronic access to the bibliographic records or holdings of other libraries in the state in any of the following ways? Specify Yes or No for each item.
234 _ Yes _ No Web-based union catalog (international, national, statewide, multistate, regional) 236 _ Yes _ No Other type of electronic access 237 _ Yes Specify __________________________
28. Is the SLAA an applicant for the Universal Service (E-rate discount) Program? Specify Yes or No for each item.
238 _ Yes _ No

State Library Administrative Agency Survey Fiscal Year 2012 | F-1
Appendix F. FY 14 SLAA Survey Instructions for Completing Survey Items

F-2 | Institute of Museum and Library Services
State Library Administrative Agency Survey: Fiscal Year 2014—F–67
Appendix F. FY 14 SLAA Survey Instructions for Completing Survey Items
Instructions for Completing Survey Items
A State Library Administrative Agency (SLAA) is the official agency of a State charged by law of that State with the extension and development of public library services throughout the State, which has adequate authority under law of the State to administer State plans in accordance with the provisions of the Library Services and Technology Act (LSTA). State Library Administrative Agency is abbreviated throughout this survey as SLAA.
Table of Contents SPECIFIC INSTRUCTIONS .................................................................................... 68
Part A: State Library Administrative Agency Identification ....................................... 68
Part B: Governance ................................................................................................. 69
Part C: Allied Operations, State Resource or Reference-Information Service Center, and State Center for the Book ................................................................................. 69
Part D: Services to Libraries and Library Cooperatives ........................................... 71
Part E: Public Service Hours, Outlets, and User Groups ......................................... 77
Part F: Collections ................................................................................................... 80
Part G: Library Service Transactions ....................................................................... 82
Part H: Library Development Transactions .............................................................. 83
Part I: Staff............................................................................................................... 84
Part J: Revenue ....................................................................................................... 85
Part K: Expenditures ................................................................................................ 87
Part L: LSTA State Program Expenditures .............................................................. 90
Part M: Electronic Services and Information (a) ....................................................... 91
Part M: Electronic Services and Information (b) ....................................................... 93

State Library Administrative Agency Survey Fiscal Year 2012 | F-3
State Library Administrative Agency Survey: Fiscal Year 2014—F–68
GENERAL INSTRUCTIONS
1. Respond to each item in this survey. Read the definitions and/or instructions for the item before responding to it.
2. Before responding to any items in a question, read the note (if any) following the question in the survey instructions.
3. All data in this survey, INCLUDING federal fiscal data, are to be reported on the basis of State fiscal year 2014, as specified in items 022 and 023. EXCEPTION: Data in Part B and Part I are requested as of October 1, 2014.
4. In responding to items, include data for all outlets of the SLAA, unless otherwise directed. EXCLUDE data for a local public or academic library serving as a State resource center or State reference/information service center under contract with the SLAA.
5. For data items requiring numerical answers, please respond as follows:
(a) A value greater than 0 if appropriate. If exact data do not exist, and a good estimate can be given, please do so;
(b) 0 (zero) if the answer is zero or none; or
(c) -1 if your SLAA has the item but does not collect data on the item, or if you don't know the answer.
SPECIFIC INSTRUCTIONS
Part A: State Library Administrative Agency Identification
001 SLAA name. Enter the full official name of the SLAA.
Physical Location Address
002-006 Enter the address of the physical location of the SLAA. Include the street address, city, State, Zip Code, and Zip+4.
Mailing Address
007-010b Enter the mailing address of the SLAA. Include the street address or post office box, city, State, Zip code, and Zip+4.
011 Web address. Enter the Web address of the SLAA. The Web address is the Uniform Resource Locator (URL) of the World Wide Web home page of the SLAA.

F-4 | Institute of Museum and Library Services
State Library Administrative Agency Survey: Fiscal Year 2014—F–69
Chief Officer of SLAA
012-016 Enter the name, title, telephone number, fax number, and email address of the chief officer of the SLAA.
Survey Respondent
017-021 Enter the name, title, telephone number, fax number, and email address of the respondent to this survey.
Reporting Period
022-023 Fiscal year starting and ending dates. Enter the starting and ending dates for State fiscal year 2014, which is the period for which data in this report are requested (except Part B and Part I data). Enter the month and day in two digits each, and the year in four digits. For example: June 30, 2014 would be entered as 06/30/2014.
Part B: Governance
1. Specify the SLAA's location in State government as of October 1, 2014.
024 (This item is reserved for future use.)
025 Branch of government. Specify the branch of government in which the SLAA is located.
026-033 Type of executive branch agency. If the SLAA is located in the Executive branch, specify whether the SLAA is an independent agency or part of a larger agency. If the SLAA is part of a larger agency that is not listed in item 029, enter the name of the agency in item 030.
034-039 (These items are reserved for future use.)
Part C: Allied Operations, State Resource or Reference-Information Service Center, and State Center for the Book
2. Enter Yes or No for each item to indicate whether the SLAA is combined with any of the allied operations listed below. Do not report a Library for the Blind and Physically Handicapped, a State Center for the Book, or a contract with another library or other entity to provide a service on behalf of the SLAA.
Note: An allied operation is an office, bureau, division, center, or other organizational unit or service within an SLAA with staff, mission, and resources to provide service not ordinarily considered a State Library Administrative Agency function. It is characterized by having:
State Library Administrative Agency Survey Fiscal Year 2012 | F-5
State Library Administrative Agency Survey: Fiscal Year 2014—F–70
(a) a specific mission, which may be a part of the SLAA’s overall mission statement;
(b) staff assigned for that mission; that staff usually includes professionals other than librarians (such as historians, archivists, curators, etc.) appropriate to its mission;
(c) a high-level manager or supervisor who reports to the SLAA chief officer or to a deputy designated by the chief officer;
(d) Financial resources clearly identified and managed for the operation.
Note: Do not report the following as allied operations: a Library for the Blind and Physically Handicapped, a State Center for the Book, a law library, or a contract with another library or other entity to provide a service on behalf of the SLAA.
040 State archives. This operation is responsible for preserving and servicing noncurrent official records of State organizations and institutions that are of continuing value (1) to the legal and administrative functioning of State government, (2) for the verification and protection of the rights of individuals, and (3) for historical and other research. It usually includes records of antecedent colonial and territorial governments. Materials are stored, arranged, and described so that needed records can be found readily.
041 Primary State legislative research organization. This operation conducts research and gathers, digests, and analyzes information in a close and confidential relationship with members of the State legislature and their staff.
Note: As an allied service, the organization is distinguished from specialized reference service which a State Library Administrative Agency may provide to government and other users by responding to reference questions from legislative personnel, providing information service, furnishing bibliographic and net search results, and instructing and guiding users in conducting their research. At the federal level, the parallel might be the difference between parts of the Library of Congress: (1) the Congressional Research Service, and (2) various reference services and subject divisions of the Library.
042 State history museum/art gallery. This operation collects, preserves, and displays cultural artifacts and/or works of art related to the State's political, social, economic, and cultural history.
043 State records management service. This operation manages the life cycle of the State's own records and records of local government from creation to disposition. Disposition includes the preservation of certain records as well as the disposal of nonessential records.
F-6 | Institute of Museum and Library Services
State Library Administrative Agency Survey: Fiscal Year 2014—F–71
044 Other allied operation. If any other operations are allied with the SLAA, enter Yes for this item.
045 Specify. If any other operations are allied with the SLAA, enter the name of the operation in this item.
3. Enter Yes or No to indicate whether the SLAA contracts with a local public library or academic library to serve as a State resource center or State reference/information service center.
046 State resource center or State reference/information service center. This is an operation outside the SLAA, administered by a local public library or academic library, which provides library materials and information services to libraries and individuals throughout the state. It is administratively separate from the SLAA but receives grant or contract funds from the SLAA for providing services.
4. Enter Yes or No to indicate whether the SLAA is the host institution for, or provides any funding to, a State Center for the Book.
047 State Center for the Book. The State Center for the Book is part of the Center for the Book program sponsored by the Library of Congress which promotes books, reading, and literacy, and is hosted or funded by the State.
Part D: Services to Libraries and Library Cooperatives
5. Indicate which of the specified services are provided directly or by contract by the SLAA to different types of libraries or library cooperatives. Specify Directly, Contract, or Not Provided for each service, for each type of library and library cooperatives.
Note: A Library Cooperative may serve single-type or multi-type libraries. Services provided directly by the SLAA are those provided without any intermediary by the SLAA to libraries or library cooperatives. Services provided by contract by the SLAA are those provided by a third party or intermediary under legal contract to the SLAA.
Type of Library
Academic Library. A library forming an integral part of a college, university, or other academic institution for postsecondary education, organized and administered to meet the needs of students, faculty, and affiliated staff of the institution.

State Library Administrative Agency Survey Fiscal Year 2012 | F-7
State Library Administrative Agency Survey: Fiscal Year 2014—F–72
Public Library. A library that serves all residents of a given community, district, or region, and (typically) receives its financial support, in whole or part, from public funds.
School Library Media Center. A library that is an integral part of the educational program of an elementary or secondary school with materials and services that meet the curricular, information, and recreational needs of students, teachers, and administrators.
Special Library. A library in a business firm, professional association, government agency, or other organized group; a library that is maintained by a parent organization to serve a specialized clientele; or an independent library that may provide materials or services, or both, to the public, a segment of the public, or to other libraries. Scope of collections and services are limited to the subject interests of the host or parent institution. Includes libraries in State institutions.
Library Cooperative. A Library Cooperative is an organization that has its own budget and staff and provides library and information services for the mutual benefit of participating or member libraries. The organization’s participants or members are primarily libraries, which are not under the organization’s administrative control. The organization may also be termed a network, system, district, or consortium. A Library Cooperative may serve single-type or multi-type libraries.
Services to Libraries and Library Cooperatives
048 Accreditation of libraries. The SLAA may endorse or approve officially libraries which meet criteria specified by the State.
050 Administration of State aid. Includes determining compliance with eligibility criteria and performance standards, overseeing processes through which grant recipients are determined, announcing grant recipients and disbursing funds, monitoring and receiving reports from grant recipients, and other activities involved in the management of financial assistance provided by the State to libraries.
051 Certification of librarians. The SLAA may credential library staff with the rank or title of librarian by attesting officially to their qualifications. These qualifications may include a master's degree from a graduate program accredited by the American Library Association, another level or type of educational attainment, confirmation of participation in continuing education activities, and/or residency in the State for a specified period.
F-8 | Institute of Museum and Library Services
State Library Administrative Agency Survey: Fiscal Year 2014—F–73
052 Collection of library statistics. Every SLAA collects statistics on public libraries and participates in the Federal-State Cooperative System (FSCS) for Public Library Data (the name of FSCS was changed in December of 2007 to the Public Library Statistics Cooperative (PLSC). Many SLAAs collect statistics on institutional and other special libraries. Some SLAAs assist in the collection of academic library statistics. A few SLAAs collect statistics on school library media centers. These data collections usually involve the design and administration of survey instruments as well as data entry and processing and report design and dissemination.
053 Consulting services. Individual or small-group contacts to help libraries to attain goals and objectives and to deal with specific needs and problems. Consultants provide guidance on problems of concern to local personnel, assistance in identifying problems not clearly recognized, and identification of opportunities for increased or improved performance.
53.1 Types of consulting services provided
53.1.1 Construction. Includes new buildings and structures, as well as additions, alterations, conversions, expansions, reconstruction, renovations, rehabilitations, and major replacements.
53.1.2 Library Management/Organizational Development. Includes helping libraries to attain goals and objectives and to deal with specific needs and problems of specific groups, such as issues of concern to local personnel, assistance in identifying problems not clearly recognized, and identification of opportunities for increased or improved performance.
53.1.3 Continuing education. Learning activities to increase skills and knowledge of the library workforce.
53.1.4 Technology/Connectivity. Includes computing, networking, broadband, and related topics.
53.1.5 Marketing/Communications. Includes promoting and communicating the value of libraries and library services and programs.
53.1.6 E-Rate. Universal Service Discount Program for libraries and schools.
53.1.7 Adult literacy. Basic reading and writing skills for adults.
53.1.8 Youth services. Services and programs to engage young persons (under 18) in library programs and services.

State Library Administrative Agency Survey Fiscal Year 2012 | F-9
State Library Administrative Agency Survey: Fiscal Year 2014—F–74
054 Continuing education programs. Includes staff development events for library personnel at all levels as well as training events for trustees and other State and local government officials who have authority over or responsibility for libraries.
055 Cooperative purchasing of library materials. Two or more independent libraries of any type engaging in joint activities related to purchasing materials, together with the maintenance of the necessary records of these additions. Also included are joint activities related to the identification and verification of titles, fund accounting, processing payments, and claims.
056 Interlibrary loan referral services. Activities involving bibliographic service centers or utilities, regional systems (federations or cooperatives), consortia, and resource centers, such as identifying libraries believed to own requested materials and/or transmitting interlibrary loan requests in accordance with established protocols or prevailing practices.
057 Library legislation preparation/review. Minimally, addresses the governance and financing of the SLAA, public library service, and library service to blind and physically handicapped persons and residents of State institutions. It usually permits the types of public library structures, such as municipal, countywide, regional, federated, cooperative, and contractual agreements. It may also provide mandates for SLAA functions, other types of libraries (e.g., academic, school), and multi-type cooperation.
058 Library planning/evaluation/research. Activities involved in designing and assessing library programs and services and studying issues facing libraries. Examples: The Public Library Association (PLA) planning for results process for public libraries and the outcome based evaluation process.
059 Literacy program support. A statewide program to assist individuals with limited skills to develop skills that enable them to function in society without assistance from others.
59.1 Types of literacy programs
59.1.1 Language literacy. Programs that promote the ability to read and write.
59.1.2 Numerical literacy. Programs that promote the ability to use, understand, and apply numerical concepts and techniques.
59.1.3 Information literacy. Programs that promote the ability to recognize the need for information and the ability to find, evaluate, and use information.
59.1.4 Digital literacy. Programs that promote the ability to effectively find, evaluate, and create information using digital technology.

F-10 | Institute of Museum and Library Services
State Library Administrative Agency Survey: Fiscal Year 2014—F–75
59.1.5 Financial literacy. Programs that promote the ability to understand personal financial matters.
59.1.6 Health literacy. Programs that promote the ability to understand basic health information and builds the capacity to make appropriate health decisions based on this information.
59.1.7 Family/Intergenerational literacy. Programs that promote the incorporation of spoken and written word into meaningful activities with the family unit.
061 Preservation/conservation services. Specific measures undertaken for the repair, maintenance, restoration, or protection of library materials, including but not limited to binding and rebinding, materials conversion (to microform for example), deacidification, and lamination.
062 Reference referral services. Provision of information about or from groups or organizations. A reference referral transaction involves the provision of information about a group or organization and its activities, services or agencies, and calendar. Such a transaction typically requires the determination of the user's need and the appropriate group or organization to meet the need. Such a transaction may require directing the user to persons or organizations external to the library for an answer to a question.
064 State standards/guidelines. The SLAA may promulgate standards or guidelines that define adequacy, equity, and/or excellence in library service. Standards or guidelines may be quantitative, qualitative, or both. Maintaining standards or following guidelines may be a requirement for receiving State aid and/or LSTA grants.
065 Statewide coordinated digital program or service. Activities providing for the digitization of documents, publications, or sets of records or realia to be made available for public use (for example, digitization of a series of city reports, local newspapers, or genealogical records).
066 Statewide public relations/library promotion campaigns. A concerted public relations program usually organized around a particular theme or issue, with specific objectives, and using a variety of techniques in concert (e.g., press releases, events, publications, exhibits).
067 Statewide virtual reference service. Reference service supported by chat-based Web technology that provides access for all or a significant portion of the residents of the state through libraries or remotely, typically on a 24-hours-per-day/7-days-a-week basis.

State Library Administrative Agency Survey Fiscal Year 2012 | F-11
State Library Administrative Agency Survey: Fiscal Year 2014—F–76
068 Summer Reading Programs. A statewide reading promotion campaign typically implemented between school years to encourage children and young adults to maintain or improve their reading skills.
070 Universal Service Program (review and approval of technology plans). The State Library Administrative Agency reviews and approves technology plans for libraries or library cooperatives applying for universal service discounts (also known as E-rate discounts) under the Universal Service Program, established by the Federal Communications Commission (FCC) under the Telecommunications Act of 1996.
071 Administration of library system support. Includes determining compliance with eligibility criteria and performance standards, overseeing processes through which funds are disbursed, monitoring and receiving reports, and other activities involved in the management of financial assistance provided by the State. Library systems are defined here as cooperatives established under state law and supported by public funding. Systems may be single- or multi-type cooperatives.
072 Involvement in the acquisition of other federal program funds. Providing technical assistance to receive federal assistance funds. Involvement in the acquisition of technical assistance funds includes determining compliance with eligibility criteria and performance standards, overseeing processes through which funds are disbursed, monitoring and receiving reports, and other activities involved in the management of financial assistance provided by the federal government from an agency other than the Institute of Museum and Library Services.
72.1 Federal agencies IMLS applies for funds
72.1.1 Department of Education. Funding received from the Department of Education. Examples include Vocational Educational National Programs, and Recreational Programs.
72.1.2 Department of Agriculture. Funding received from the Department of Agriculture. Examples include USDA’s Rural Development Community Facilities Grant Program, Community Facilities Program, and Rural Utility Service.
72.1.3 Federal Communication Commission/Universal Service Administration Company. Funding or discounted services received or provided from the Federal Communication Commission or the Universal Service Administrative Company. Examples include Schools and Library Program (E-Rate).

F-12 | Institute of Museum and Library Services
State Library Administrative Agency Survey: Fiscal Year 2014—F–77
72.1.4 Department of Labor. Funding received from the Department of Labor. Examples include Labor Literacy Innovations Grant, and Project Compass.
073 Statewide reading programs. A statewide coordinated program to support, maintain, or improve reading skills.
73.1 Target populations for statewide reading promotion campaigns
074 Statewide resource sharing. Organized efforts that enable and support the sharing of services and materials through coordination and collaboration (e.g., databases, e-books, ILL, cataloging).
075 LSTA state program grants. Funds distributed by the SLAA to recipients who meet eligibility criteria specified by LSTA and the State. Such funds are awarded for the purposes specified in successful grant proposals. Such grants may be awarded competitively or on a formula basis. Include sub-grants made to libraries or outside agencies to provide or assist in providing such services.
076 LSTA statewide services. Statewide services supported by the SLAA using LSTA funds.
Part E: Public Service Hours, Outlets, and User Groups
6. Enter in the spaces provided the total hours open in a typical week for all SLAA outlets (main or central, bookmobiles, and other outlets), regardless of whom they serve. Do no report an allied operations outlet as an SLAA outlet. Example: If the SLAA has a main outlet with no bookmobile or other outlets and is open for public service 40 hours in a typical week, report 40 hours. If the SLAA has a main outlet, a bookmobile, and two other outlets open 40, 20, 35, and 35 hours, respectively, in a typical week, report 130 hours (40+20+35+35=130 hours per typical week).
Note: Main or central outlet, bookmobiles, and other outlets (excluding bookmobiles) are defined in the instructions to question 8. Report total hours open in a typical week for all SLAA outlets, regardless of whom they serve, and regardless of whether they are open on a walk-in or referral basis. Exclude data for a local public or academic library serving as a State resource center or State reference/information service center under contract with the SLAA. Do not report data for non-SLAA outlets, even though the SLAA may provide funding or services to such outlets.
A "typical week" is a time that is neither unusually busy nor unusually slow. Avoid holidays, vacation periods, and days when unusual events are taking place in the community or in the library. Choose a week in which the library is

State Library Administrative Agency Survey Fiscal Year 2012 | F-13
State Library Administrative Agency Survey: Fiscal Year 2014—F–78
open its regular hours. Include seven consecutive calendar days from Sunday through Saturday or whenever the library is usually open.
077a Total hours/week (all SLAA outlets, regardless of whom they serve). Sum of hours open during a typical week for all SLAA outlets (main or central, bookmobiles, and other outlets), regardless of whom them serve. Do not report an allied operations outlet as an SLAA outlet.
7. Enter in the spaces provided the total hours that the main or central SLAA outlet is open in a typical week to serve the general public or state government employees, by the specified categories. Only one outlet may be designated as the main or central outlet.
Note: Main or central outlet is defined in the instructions to question 8. Report public service hours for the main or central SLAA outlet, regardless of whether the outlet is open on a walk-in or referral basis. Exclude data for a local public or academic library serving as a State resource center or State reference/information service center under contract with the SLAA. Exclude service hours if the outlet only serves blind and physically handicapped individuals through the National Library Service for the Blind and Physically Handicapped, Library of Congress. Also exclude service hours if the outlet only serves residents of State correctional institutions or residents of other State institutions, unless the outlet is administered and staffed by the SLAA. Do not report data for a non-SLAA outlet, even though the SLAA may provide funding or services to such an outlet.
077b Total hours/week (main or central outlet). Sum of hours open during a typical week for the main or central outlet.
078 Monday–Friday after 5:00 p.m. (main or central outlet). Sum of hours open after 5:00 p.m. Monday through Friday during a typical week for the main or central outlet.
079 Saturday and Sunday (main or central outlet). Sum of hours open on Saturday and Sunday during a typical week for the main or central outlet.
080-081 (These items are reserved for future use.)
8. Enter in the spaces provided the total number of SLAA outlets, by type of outlet, regardless of whom they serve. Only one outlet may be designated as the main or central outlet. Do not report an allied operations outlet as an SLAA outlet.

F-14 | Institute of Museum and Library Services
State Library Administrative Agency Survey: Fiscal Year 2014—F–79
Note: An SLAA outlet has regular hours of service in which SLAA staff are present to serve its users. The staff and all service costs are paid by the SLAA as part of its regular operation. A loan of books or total collections (whether permanent or short-term) to another agency, library, or school does not constitute an SLAA outlet inasmuch as it is not administered and staffed by the SLAA.
082 Main or central outlet. A single unit library or the unit where the principal collections are located and handled.
Note: An SLAA administrative center which is separate from the principal collections and is not open to users should not be included as an outlet. Only one outlet may be designated as the main or central outlet. When two or more outlets are considered main or central outlets, one outlet should be designated as the central outlet and the others should be designated as “other outlets (excluding bookmobiles).”
083 Other outlets (excluding bookmobiles). Units that have all of the following: (1) separate quarters; (2) a permanent basic collection of books and/or other materials; (3) a permanent paid staff; and (4) a regular schedule of hours open to users.
084 Bookmobiles. Trucks or vans specially equipped to carry books and other library materials. They serve as traveling branch libraries. Count vehicles in use, rather than the number of stops each vehicle makes.
085 Total outlets. Sum of items 082-084.
9. Enter in the spaces provided the number of SLAA outlets that serve the following user groups, in whole or in part, by type of outlet.
Note: Main or central outlet, bookmobiles, and other outlets (excluding bookmobiles) are defined in the instructions to question 8.
086 Blind and physically handicapped individuals. Outlets serving this user group may contain talking books on discs and tapes and books in Braille made available from the National Library Service for the Blind and Physically Handicapped, Library of Congress. In addition, such outlets may contain large print books for the visually handicapped and captioned films for the deaf. These outlets provide such library materials and library services to blind or physically handicapped residents who have been certified by competent authority as unable to read or to use conventional printed materials as a result of physical limitations.
087 Residents of State correctional institutions. Outlets serving this user group provide books, other library materials, and access to other information resources

State Library Administrative Agency Survey Fiscal Year 2012 | F-15
State Library Administrative Agency Survey: Fiscal Year 2014—F–80
as well as other library services to residents of prisons, reformatories, and other correctional institutions operated or substantially supported by the State.
088 Residents of other State institutions. Outlets serving this user group provide books, other library materials, and access to other information resources as well as other library services to patients or residents of residential training schools, hospitals, nursing homes, and other general or special institutions operated or substantially supported by the State.
089 State government employees (executive, legislative, or judicial). Outlets serving this user group provide books, other library materials, and access to other information resources as well as other library services to employees of all branches of State government.
090 General public. Report all SLAA outlets that serve the general public, regardless of whether they are open on a walk-in or referral basis. Outlets serving this user group function as the State-level equivalent of a local public library, providing books, other library materials, and electronic access to locally mounted and remote information resources for all State residents.
Part F: Collections
10. Enter in the spaces provided the total number of volumes or physical units in the specified formats in all SLAA outlets (main or central, bookmobiles, and other outlets) that serve the general public and/or State government employees.
Note: Main or central outlet, bookmobiles, and other outlets (excluding bookmobiles) are defined in the instructions to question 8. Report collections for all SLAA outlets that serve the general public, regardless of whether they are open on a walk-in or referral basis. Exclude data for a local public or academic library serving as a State resource center or State reference/information service center under contract with the SLAA. Exclude collections of braille and talking books owned by the National Library Service for the Blind and Physically Handicapped, Library of Congress. Also exclude collections that are specifically intended to only serve residents of State correctional institutions or residents of other State institutions, unless such outlets are administered and staffed by the SLAA.
091 Book and serial volumes (exclude microforms) (exclude collections of braille books owned by the National Library Service for the Blind and Physically Handicapped, Library of Congress). Books are non-periodical printed publications bound in hard or soft covers, or in loose-leaf format, of at least 49 pages, exclusive of the cover pages; or juvenile non-periodical publications of any length bound in hard or soft covers. Serials are publications issued in successive parts, usually at regular intervals, and as a rule, intended to be

F-16 | Institute of Museum and Library Services
State Library Administrative Agency Survey: Fiscal Year 2014—F–81
continued indefinitely. Serials include periodicals (magazines, newspapers, annuals reports, yearbooks, etc.) memoirs, proceedings, and transactions of societies. Except for the current volume, count unbounded serials as volumes when the library has at least half of the issues in a publisher's volume.
092 Audio materials (exclude collections of talking books owned by the National Library Service for the Blind and Physically Handicapped, Library of Congress). These are materials on which sounds (only) are stored (recorded) and that can be reproduced (played back) mechanically or electronically, or both. Included are records, audiocassettes, audio cartridges, audiodiscs, audioreels, talking books, and other sound recordings.
093 (This item is reserved for future use.)
094 Video materials. These are materials on which pictures, sound, or both are recorded. Electronic playback reproduces pictures, sounds, or both using a television receiver or monitor.
095 Current serial subscriptions (titles, not individual issues) (include print subscriptions only) (exclude microform, electronic, and digital subscriptions). These include current subscriptions received, both purchased and gifts. This count does not include the number of individual issues, but rather each serial title. Report the total number of titles subscribed to, including duplicates. Do not report individual issues. Report print subscriptions only. Exclude microform, electronic, and digital subscriptions.
096 Government documents (include only government documents not accessible through the library catalog and not reported elsewhere). For government documents not accessible through the library catalog and not reported on other lines, report the number of volumes or physical units of such materials in all formats. A government document is a publication in any format bearing a government imprint. Includes publications of federal, State, local, and foreign governments and intergovernmental organizations to which governments belong and appoint representatives (e.g., United Nations, Organization of American States).
097-105 (These items are reserved for future use.)
11. Enter Yes or No for each item (106-109) to indicate whether the SLAA is designated as a federal or State depository library for government documents, and whether it is a regional or selective federal depository. Note: A government document is a publication in any format bearing a government imprint. Includes publications of federal, State, local, and foreign governments and intergovernmental organizations to which governments

State Library Administrative Agency Survey Fiscal Year 2012 | F-17
State Library Administrative Agency Survey: Fiscal Year 2014—F–82
belong and appoint representatives (e.g., United Nations, Organization of American States).
106 State depository library. A library officially designated as a depository of publications bearing the imprint of the State government.
107 Federal depository library. A library officially designated as a depository of publications bearing the imprint of the federal government. These libraries receive publications issued by the executive, judicial, and the legislative branches at no charge in exchange for providing free public access. Enter Yes or No to items 108 and 109 to indicate if the SLAA is a regional or selective depository
108 Regional. Regional depositories receive one copy of all materials distributed by the federal government.
109 Selective. Selective depositories receive only those materials they select.
Part G: Library Service Transactions
12. Enter in the spaces provided ANNUAL totals for the specified types of service transactions for all SLAA outlets (main or central, bookmobiles, and other outlets) that serve the general public and/or State government employees.
Note: Main or central outlet, bookmobiles, and other outlets (excluding bookmobiles) are defined in the instructions to question 8. Report library service transactions for all SLAA outlets that serve the general public, regardless of whether they are open on a walk-in or referral basis. Exclude data for a local public or academic library serving as a State resource center or State reference/information service center under contract with the SLAA. Exclude service transactions for outlets or outlet service points that only serve blind and physically handicapped individuals through the National Library Service for the Blind and Physically Handicapped, Library of Congress. Also exclude service transactions for outlets that only serve residents of State correctional institutions or other State institutions, unless such outlets are administered and staffed by the SLAA.
110 Circulation (Exclude items checked out to another library). These are transactions that involve lending an item from the State Library collection or borrowed from another library for use generally, although not always, outside the library. This activity includes charging materials manually or electronically. Also report each renewal as a circulation transaction. Exclude in-house use resulting from counting items in the collection as they are reshelved after use and without any formal tracking system. Exclude items checked out to another library.
Interlibrary Loan/Document Delivery

F-18 | Institute of Museum and Library Services
State Library Administrative Agency Survey: Fiscal Year 2014—F–83
111 Provided to other libraries. These are library materials, or copies of materials, loaned from the SLAA collection to another library upon request. Do not include loans or copies of materials from one SLAA outlet to another SLAA outlet.
112 Received from other libraries and document delivery services. These are library materials, or copies of materials, borrowed by the SLAA from another library or obtained by the SLAA from a commercial document delivery service. Do not include loans or copies of materials from one SLAA outlet to another SLAA outlet.
113 Reference transactions. A reference transaction is an information contact which involves the knowledge, use, recommendations, interpretation or instruction in the use of one or more information sources by a member of the SLAA staff. The term includes information and referral service. Information sources include printed and non-printed materials, machine-readable databases (including computer-assisted instruction), catalogs and other records of holdings and through communication or referral, other libraries, and institutions and persons both inside and outside the library. When a staff member utilizes information gained from previous use of information sources to answer a question, report as a reference transaction even if the source is not consulted again during the transaction. If necessary, multiply a typical week by 52. Exclude directional transactions. (See definition of typical week in question 6.)
114 Library visits. This is the total number of persons per year entering SLAA outlets, including persons attending activities, meetings, and those persons requiring no staff services. If necessary, multiply a typical week by 52. A "typical week" is defined in the instructions to question 6.
Part H: Library Development Transaction
13. Enter in the spaces provided ANNUAL totals for the specified types of library development transactions of the SLAA.
LSTA and State Grants
115 Grants awarded. Report the total annual number of LSTA and State grants awarded by the SLAA during state fiscal year 2014.
116 (Item is reserved for future use.)
Continuing Education Programs
State Library Administrative Agency Survey Fiscal Year 2012 | F-19
State Library Administrative Agency Survey: Fiscal Year 2014—F–84
117 Number of events. Report the total number of continuing education events (workshops, training sessions, etc.) which (1) the SLAA sponsored and itself presented and (2) another agency presented with the help of SLAA funding and planning support. Do not count events for which the SLAA is only a nominal sponsor. Do not count events for an allied operation.
Where event is offered via video conferencing, consider presentation simulcast to multiple locations as one event. If presentation is offered multiple times, each offering should be counted as a separate event. Where delivery is via synchronous Web presentation and the number of concurrent participants is limited and they must sign up to participate, count each offering of the Web training as one event. Where delivery is via the Web with asynchronous participation and no limitation of participants, count Web event as one event.
118 Total attendance at events. Report the total annual attendance at continuing education events reported in item 117. Attendance should include total number of participants in events regardless of delivery method. If Web event is delivered asynchronously, recommend counting only participants who complete the continuing education offering.
Part I: Staff
14. Enter total number of SLAA staff in FTEs (full-time equivalents) (to two decimal places), by type of service. Report all staff on the payroll as of October 1, 2014, and unfilled but budgeted positions.
Note: Forty hours per week is the measure of full-time employment for this survey. FTEs (full-time equivalents) of employees in any category may be computed by taking the number of hours worked per week by all employees in that category and dividing it by 40. Report staff based on the SLAA organization chart. A given position (e.g., State Data Coordinator) may be part of administration in one agency, library development in another, and library services in another agency. If an employee provides more than one service, allocate the FTE among appropriate categories.
Type of Position
(a) Librarians with ALA-MLS Librarians with master’s degrees from programs of library and information studies accredited by the American Library Association.
(b) Librarians other than ALA-MLS Librarians employed by the SLAA. This includes staff employed by the SLAA in the librarian occupational category who have Master’s Degrees in Library Science from programs not accredited by ALA and librarians who do not have MLS degrees.

F-20 | Institute of Museum and Library Services
State Library Administrative Agency Survey: Fiscal Year 2014—F–85
(c) These are professionals and non-professionals, employed by the SLAA, who are not in the librarian occupational category, regardless of degree or training, such as archivists, accountants, business managers, public relations, and human resources staff and other employees paid from the SLAA budget, including plant operations, security, and maintenance staff.
(d) Total Staff. Sum of items a-c.
Type of Service
119 Administration. Usually includes the chief officer of the SLAA and his or her immediate staff.
May include officers responsible for the SLAA's fiscal affairs; public relations; and planning, evaluation, and research.
120 Library development. Usually includes staff responsible for the development of public library services. May include staff responsible for administering State and LSTA grant programs; providing consulting and continuing education services; and promoting resource sharing and other forms of interlibrary cooperation. (See instructions to question 5 for definitions of types of libraries.)
121 Library services. Staff responsible for providing library service from the SLAA. Includes public, technical, and other library services.
122 Other services. Includes staff not reported in items 119-121, such as staff in allied operations.
123 Total staff. Sum of items 119-122.
124-151 (These items are reserved for future use.)
Part J: Revenue
15. Enter Yes or No to indicate whether all public library funds from state sources are administered by the SLAA.
Note: Answer this question based on state funds distributed to individual public libraries and library cooperatives serving public libraries in state fiscal year 2014. If no state funds are reported in Part K in items 179(b) or 180(b), the answer should be No.
152 SLAA administration of all public library state funds
16. Enter Yes or No to indicate whether any funds from state sources are administered by the SLAA for the following types of libraries.

State Library Administrative Agency Survey Fiscal Year 2012 | F-21
State Library Administrative Agency Survey: Fiscal Year 2014—F–86
Note: Answer this question based on state funds distributed to libraries and library cooperatives in state fiscal year 2014. If no state funds are reported in Part K in related items 179(b) to 183(b) or 185(b), the answer should be No.
153a Academic libraries (definition is provided in question 5).
153b School library media centers (definition is provided in question 5).
153c Special libraries (definition is provided in question 5).
153d Library cooperatives (definition is provided in question 5).
17. Enter in the spaces provided total funds received as revenue by the SLAA during the reporting period specified in items 022-023. EXCLUDE carryover. Include revenue for allied operations only if the revenue is part of the SLAA budget. Include all funds distributed to libraries and library cooperatives if the funds are administered by the SLAA.
Note: Exclude carryover when reporting revenue. Carryover means funds carried forward from the previous year, sometimes called an “opening balance” or “fund balance”.
Federal Revenue
154 LSTA (Library Services and Technology Act) State Programs Note: Report the funds drawn down from the federal government from the LSTA State Program during state fiscal year 2014. Do not report LSTA National Leadership Grants--report these grants in item 155 (Other Federal revenue).
155 Other Federal revenue. If the SLAA received other federal revenue (e.g., National Endowment for the Humanities grants, National Historical Publications and Records Commission grants, LSCA Title II grants, LSTA National Leadership Grants, etc.), report that revenue in this item. If your state acts as the fiscal agent for a multi-state grant, report only the funds designated for your state.
156 Specify program(s) and title(s). If other federal revenue is reported in item 155, specify its source in this item.
157 Total Federal revenue. Sum of items 154 and 155.
158-166 (These items are reserved for future use.)
State Revenue
F-22 | Institute of Museum and Library Services
State Library Administrative Agency Survey: Fiscal Year 2014—F–87
167 SLAA operation. Report revenue received from the State to support operation and services of the SLAA. Do not include revenue received for major capital expenditures, contributions to endowments, or revenue passed through to another agency, or funds unspent in the previous fiscal year.
168 State aid to libraries. Report revenue received from the State for distribution to libraries, library cooperatives, and agencies. Include funds derived from State sources (exclusive of Federal funds) and appropriated by a State legislature to a State Library Administrative Agency for payment or transfer to an individual library; a group of libraries; or an agency or library, other than the SLAA, that provides a Statewide service to libraries or citizens. Exclude State funds used to administer the State Library Administrative Agency or to deliver Statewide services to libraries or citizens where the service is administered directly by the SLAA; State funds allocated for school library operations when the State Library Administrative Agency is under the State education agency; and federal funds.
169 Other State revenue. Report revenue received from the State for any other purpose, such as interagency transfers.
170 Total State revenue. Sum of items 167-169.
171 Other revenue. Include (1) any other revenue from public sources; (2) revenue received from private sources, such as foundations, corporations, Friends groups, and individuals; and (3) SLAA-generated revenue, such as fines and fees for services.
172 Total revenue. Sum of items 157 +170 + 171.
Part K: Expenditures
18. Enter in the spaces provided total SLAA expenditures, by source of revenue and type of expenditure. Include all LSTA expenditures. Include expenditures for allied operations only if the expenditures are from the SLAA budget. Include all funds distributed to libraries and library cooperatives if the funds are administered by the SLAA.
Operating Expenditures for SLAA and Allied Operations (items 173-178)
Note: These are the current and recurrent costs necessary to the provision of services by the SLAA. Include LSTA expenditures for statewide services (item 190) conducted directly by the SLAA. Include LSTA expenditures for LSTA administration (item 192). Exclude LSTA expenditures for grants (item 191). Do not include funds distributed to libraries and library cooperatives; report them instead in items 179 to 186.

State Library Administrative Agency Survey Fiscal Year 2012 | F-23
State Library Administrative Agency Survey: Fiscal Year 2014—F–88
173 Salaries and wages. Salaries and wages for all SLAA staff, including plant operation, security, and maintenance staff for the reporting year. Include salaries and wages before deductions, but exclude employee benefits.
174 Employee benefits. Benefits outside of salaries and wages paid and accruing to employees, including plant operation, security and maintenance staff, regardless of whether the benefits or equivalent cash options are available to all employees. Include amounts spent by the SLAA for direct, paid employee benefits, including Social Security, retirement, medical insurance, life insurance, guaranteed disability income protection, unemployment compensation, worker's compensation, tuition, and housing benefits. Only that part of any employee benefits paid out of the SLAA budget should be reported.
175 Total staff expenditures. Sum of items 173-174.
176 Collection expenditures. Includes all expenditures for materials purchased or leased for use by SLAA users, including print materials, microforms, machine-readable materials, audiovisual materials, etc.
177 Other operating expenditures. Includes all operating expenditures not reported in items 173-176.
178 Total operating expenditures. Sum of items 175-177.
Financial Assistance to Libraries and Library Cooperatives (items 179-186)
Note: Include LSTA expenditures for grants (item 191). Exclude LSTA expenditures for statewide services (190) conducted directly by the SLAA and LSTA expenditures for LSTA administration (item 192). Include all funds distributed to libraries and library cooperatives if the funds are administered by the SLAA.
179 Individual public libraries. Financial assistance to individual public libraries for services to their population of legal service area. These are libraries that are governed exclusively by a single board or political subdivision. Municipal libraries, county libraries, consolidated multi-county libraries, and library districts are considered individual libraries if there is only one administrative entity. Exclude construction aid.
180 Library cooperatives serving public libraries only. Financial assistance to library cooperatives serving public libraries only for services to their population of legal service area. Exclude construction aid.
181 Other individual libraries. Financial assistance to other individual libraries for services to their population or constituency. These are libraries other than

F-24 | Institute of Museum and Library Services
State Library Administrative Agency Survey: Fiscal Year 2014—F–89
public libraries and school library media centers. Exclude grants to public libraries and to school library media centers. Report financial assistance to school library media centers in item 185. Exclude construction aid.
182 Library cooperatives serving more than one type of library. Financialassistance to library cooperatives serving more than one type of library for services to their population of legal service area. Exclude construction aid.
183 Single agency or library providing statewide service. Financial assistance to a single entity (agency, library, library cooperative, etc.) for services offered to all libraries in the state, or all state residents, or a significant portion of all libraries or state residents. Exclude funds administered directly by the SLAA to provide such services. Exclude construction aid.
184 Library construction. Do not report data for this item in items 179-183, 185, or 187. Includes construction of new buildings and acquisition, expansion, remodeling, and alteration of existing buildings, and the purchase, lease, and installation of equipment of any such buildings, or any combination of such activities (including architects' fees and the cost of acquisition of land). Equipment includes information and building technologies, video and telecommunications equipment, machinery, utilities, and built-in equipment and any necessary enclosures or structures to house them. Exclude construction aid expended on the SLAA.
185 Other assistance. Expenditures for other assistance to libraries and library cooperatives not reported in items 179-184, such as financial assistance to school library media centers. Exclude construction aid.
186 Total financial assistance to libraries and library cooperatives. Sum of items 179-185.
Other expenditures for SLAA and Allied Operations Only (items 187 and 188)
187 Capital outlay. Funds for the acquisition of or additions to fixed assets such as building sites, new buildings and building additions, new equipment (including major computer installations), initial book stock, furnishings for new or expanded buildings, and new vehicles. Exclude replacement and repair of existing furnishings and equipment, regular purchase of library materials, and investments for capital appreciation. Exclude the amount reported for this item from all other items except item 189. Include construction aid expended on the SLAA. Exclude construction aid expended on other libraries and library cooperatives. Include expenditures for allied operations only if the expenditures are from the SLAA budget.

State Library Administrative Agency Survey Fiscal Year 2012 | F-25
State Library Administrative Agency Survey: Fiscal Year 2014—F–90
Note: State accounting practices shall determine whether a specific item is a capital expense or an operating expense, regardless of the examples in this definition.
188 Other expenditures. These are expenditures not reported in items 173-187. Exclude construction aid. Include expenditures for allied operations only if the expenditures are from the SLAA budget.
189 Total expenditures. Sum of items 178 and 186-188.
Part L: LSTA State Program Expenditures
19. Enter in the spaces provided total LSTA state program expenditures, by type of expenditure. Report expenditures in one and only one category. These expenditures should also be reported in Part K.
190 Statewide services (exclude sub-grants to single libraries or agencies providing statewide services). Funds expended by the SLAA to provide services to libraries and individuals throughout the State. Include expenditures for statewide services conducted directly by the SLAA. Exclude sub-grants made to single libraries or other outside agencies to provide or assist in providing such services.
Note: These expenditures should also be reported in Part K, under operating expenditures (items 173-178); capital outlay (item 187); or other expenditures (item 188), as appropriate. DO NOT report them as financial assistance to libraries and library cooperatives (items 179-186).
191 Grants (include sub-grants to single libraries or agencies providing statewide services). Funds distributed by the SLAA to recipients who meet eligibility criteria specified by LSTA and the State. Such funds are usually awarded for purposes specified in successful grant proposals. Such grants may be awarded competitively or on a formula basis. Include sub-grants made to single libraries or other outside agencies to provide or assist in providing statewide services.
Note: These expenditures should also be reported in Part K, under financial assistance to libraries and library cooperatives (items 179-186), as appropriate. DO NOT report them as SLAA operating expenditures (items 173-178), capital outlay (item 187), or other expenditures (item 188).
192 LSTA administration. Expenditures of LSTA funds for administrative costs in connection with programs and services carried out under this Act.
193 Total LSTA expenditures. Sum of items 190-192.
199-205 (These items are reserved for future use.)

F-26 | Institute of Museum and Library Services
State Library Administrative Agency Survey: Fiscal Year 2014—F–91
Part M: Electronic Services and Information (a)
21. Enter Yes or No for each item to indicate whether the SLAA funds or facilitates the specified electronic networking functions at the State level. Note: A State-level electronic information network involves the wide-area use of telecommunications to link libraries via microcomputers or terminals to automated library systems. The network may include online public access catalogs and other library applications; locally mounted or online databases (bibliographic, full text, or data); bibliographic utilities; and other information resources. Access to such networks may be via modem (i.e., dial access) or dedicated lines (i.e., hard-wired). Such a network may or may not be connected to the Internet.
206 Electronic network planning or monitoring. Includes drafting Statewide plans, requests for proposals, and contracts and monitoring contracts for network development.
207 Electronic network operation. Includes acquiring, maintaining, or replacing substantial technological equipment necessary to provide access to information in electronic and other formats made possible by new information and communication technologies. May include hosting or sharing a mainframe, minicomputer, or file server, or facilitating reciprocal borrowing agreements and document delivery systems necessary to fully exploit such a network. Such a network may or may not be connected to the Internet.
Database Development
Note: Activities may include creation of new databases or conversion of existing databases into electronic format. Includes bibliographic databases as well as full text or data files.
208 Bibliographic databases. Includes machine-readable catalog records, other electronic indexes, and other databases which contain only references to or condensed surrogates for original materials.
209 Full text or data files. Full text files are files in which the information consists of the content of one or more complete intellectual products initially expressed primarily through the written word. Data files report the content of one or more complete intellectual products expressed primarily with numbers.
22. Enter Yes or No for each item to indicate whether the SLAA funds or facilitates digitization or digital programs or services in any of the following instances.
Note: Digitization or digital programs or services includes activities providing for the digitization of documents, publications, or sets of records or realia to be made available for public use.

State Library Administrative Agency Survey Fiscal Year 2012 | F-27
State Library Administrative Agency Survey: Fiscal Year 2014—F–92
210a For the SLAA itself
210b Via grants or contracts to other state agencies
210c Via grants or contracts to other libraries or library cooperatives
23. Enter Yes or No for each item to indicate whether the SLAA funds or facilitates library access to the Internet in the specified ways.
Note: The Internet is the global network of networks that, via a standardized addressing system and a common primary command structure, enables individuals and organizations to communicate via electronic mail, to access a host of online databases and other electronic information resources, and to transfer files electronically.
Training or consulting to facilitate access (items 211a and 211b):
211a Library staff (state and local). Includes all activities that facilitate Internet awareness and use by library staff (state and local) and "training the trainer" activities.
211b State library end-users. Includes all activities that facilitate Internet awareness and use by actual or potential state library end-users.
212 Providing direct funding for Internet access. Includes any grants of State, federal, and/or other SLAA funds to libraries or related organizations that facilitate (1) establishing Internet accounts for library-related individuals or organizations; (2) acquiring computer hardware, software, or peripherals necessary for Internet access; and (3) training or consulting with actual and potential Internet users.
213 Providing equipment. Includes computer hardware, software, and peripherals necessary for Internet access. Critical types of equipment, beyond basic hardware and operating system software, include modems and telecommunications software.
214 Providing access to directories, databases, or online catalogs via the Internet. Includes bibliographic files, locator files, and/or full text databases produced or licensed by the State Library Administrative Agency and available via the Internet.
Note: This item focuses on content available via the Internet.
215 Managing a Web site, file server, bulletin boards, or electronic mailing lists.Includes the development and maintenance of Internet menu systems,

F-28 | Institute of Museum and Library Services
State Library Administrative Agency Survey: Fiscal Year 2014—F–93
operation of equipment that provides Internet access to multiple files, or posting of electronic messages via the Internet.
Note: This item focuses on the structure through which content is available via the Internet.
216-219 (These items are reserved for future use.)
24. Enter in the spaces provided the number of workstations that are used for Internet access by the general public in all SLAA outlets that serve the public, by the specified categories. Include terminals used by both the SLAA staff and the public. Exclude terminals that are for SLAA staff use only.
Note: Report data only for all SLAA outlets that serve the general public. Exclude data for: (a) a local public or academic library serving as a State resource center or State reference/ information service center under contract with the SLAA; (b) outlets that only serve blind and physically handicapped individuals through the National Library Service for the Blind and Physically Handicapped, Library of Congress; (c) outlets that only serve residents of State correctional institutions or residents of other State institutions; (d) outlets that only serve state government employees; and (e) non-SLAA outlets, even though the SLAA may provide funding or services to such outlets.
220a Number of library-owned public-access graphical workstations that connect to the Internet for a dedicated purpose (e.g., to access an OPAC or specific database, or to train the public) or multiple purposes. (For this count, the term "library-owned" includes computers leased by the state library agency.)
220b Number of all other public access Internet workstations in the library. (Report non-library computers placed in the library by other agencies or groups. Report non-graphical workstations.)
Part M: Electronic Services and Information (b)
221-222 (These items are reserved for future use.)
25. Enter in the spaces provided total SLAA expenditures for statewide database licensing, by source of revenue. These expenditures should also be reported in Part K.
223 Statewide database licensing. Statewide contracted rights for access to and use of database(s) by libraries that are parties to a licensing agreement.
26. Enter Yes or No for each item to indicate whether statewide database licenses, paid for by the funds reported in question 25, include access by the following:
224 Public libraries (definition is provided in question 5).

State Library Administrative Agency Survey Fiscal Year 2012 | F-29
State Library Administrative Agency Survey: Fiscal Year 2014—F–94
225 Academic libraries (definition is provided in question 5).
226 School library media centers (definition is provided in question 5).
227 Special libraries (definition is provided in question 5).
228 Library cooperatives (definition is provided in question 5).
229 Other state agencies
230 Remote users. Authorized users having access to and use of licensed database(s) from sites outside of a library building.
27. Enter Yes or No to indicate whether the SLAA facilitates or subsidizes electronic access to the bibliographic records or holdings of other libraries in the state, by the specified categories.
231-233 (These items are reserved for future use.)
234 Web-based union catalog (international, national, statewide, multistate, and regional). A Web-based union catalog makes the aggregated electronic holdings of libraries in a nation, region, a library cooperative serving more than one type of library, or a state available via the World Wide Web. Holdings and indexes for a Web-based union catalog are mounted on a server that is connected to the Internet. Access to the bibliographic information in a web-based union catalog is available to any user with an Internet connection and a standard Web browser. National union catalogs include The Library of Congress and OCLC. OCLC also provides the holdings of libraries outside the United States.
Note: Report access to a Web-based union catalog via a Z39.50 gateway in this item, as it is a Web-based protocol.
235 (This item is reserved for future use.)
236 Other type of electronic access. If the SLAA facilitates or subsidizes a type of electronic access to the holdings of other libraries in the state not covered in items 231 to 234, enter Yes for this item.
237 Specify. If Yes was indicated for item 236, enter the type of electronic access in this item.
28. Enter Yes or No to indicate whether the SLAA is an applicant for the Universal Service Program (also known as the E-rate discount program).

F-30 | Institute of Museum and Library Services
State Library Administrative Agency Survey: Fiscal Year 2014—F–95
238 Applicant for Universal Service Program. The Universal Service Program was established by the Federal Communications Commission (FCC) under the Telecommunications Act of 1996. To be considered an applicant, the SLAA must have an FCC Form 470 and Form 471 on file with the FCC.
Notes:

State Library Administrative Agency Survey Fiscal Year 2012 | G-1
Appendix G. Data Tables
Table G-1. Number of FTE Staff Positions, by Group: FY 2006–14
Fiscal YearSmall Recovery
(n = 15)Steady Increase
(n = 9)Flat Recovery
(n = 27) National (n = 51)
2006 1,132.3 247.0 2,090.1 3,469.4
2008 1,078.2 251.8 2,071.1 3,401.1
2010 887.7 236.3 1,843.3 2,967.3
2012 798.6 240.1 1,775.6 2,814.3
2014 775.3 233.6 1,686.9 2,695.9
Source: State Library Administrative Agencies Survey, fiscal years 2006–14; Institute of Museum and Library Services; National Center for Education Statistics.
Table G-2. Changes in Number of FTE Staff Positions, by Type of Service and Group: FY 2006–14
Fiscal Year
2006 2008 2010 2012 2014
Administration
Small Recovery 176 148 144 110 110
Steady Recovery 50 55 45 43 46
Flat Recovery 229 233 218 207 209
National 456 436 406 360 364
Library development
Small Recovery 203 197 137 146 145
Steady Recovery 38 42 45 56 53
Flat Recovery 394 432 429 421 623
National 634 671 611 623 569
Library services
Small Recovery 586 563 454 388 386
Steady Recovery 132 132 130 116 111
Flat Recovery 1,091 1 ,061 903 850 836
National 1809 1 ,756 1 ,487 1 ,354 1 ,333
Other services
Small Recovery 167 170 153 155 137
Steady Recovery 28 24 17 26 24
Flat Recovery 376 345 293 297 271
National 571 538 464 477 430
Source: State Library Administrative Agencies Survey, fiscal years 2006–14; Institute of Museum and Library Services; National Center for Education Statistics.

G-2 | Institute of Museum and Library Services
Table G-3. Percentage of SLAAs Providing Selected Services to Libraries and Library Cooperatives, by Group: FY 2014
Type of service to libraries and library cooperatives
Item response
National (n = 51)
Small Recovery
group (n = 15)
Steady Increase
group (n = 9)
Flat Recovery group
(n = 27)
Percentage Percentage Percentage Percentage
Services
Consulting services Provided 96 100 89 96
Administrative library support Provided 61 60 78 56
LSTA state program grants Provided 84 80 67 93
LSTA statewide services Provided 100 100 100 100
Operational assistance
Cooperative purchasing of library materials
Provided 49 33 56 56
Reference referral services Provided 82 93 78 78
Coordination or integration
Statewide coordinated digital program or service
Provided 53 53 67 48
Statewide virtual reference service
Provided 37 53 33 30
Acquisition of other federal program funds
Provided 33 40 33 32
Statewide resource sharing Provided 94 100 100 96
Program assistance
Continuing education programs
Provided 96 100 89 96
Literacy program support Provided 67 67 56 70
Statewide reading programs Provided 69 73 67 72
Source: State Library Administrative Agencies Survey, fiscal year 2014; Institute of Museum and Library Services.

This page intentionally left blank

7206_09/16