STATE HANDBOOK: SOUTH AUSTRALIA - … · However this is unlikely to overcome the longer-term...
14
STATE HANDBOOK: SOUTH AUSTRALIA MARCH 2017 CONTENTS 2 | Key points 3 | In Focus: International exports 4 | Consumer & household sector 5 | NAB customer spending behaviours 6 | Business sector 7 | Commercial property sector 8 | Residential property 9 | Demographics 10 | Labour market 11 | Economic structure and trade 12 | Fiscal outlook 13 | Semi government and credit outlook 14 | State and territory forecasts CONTACTS Vyanne Lai Riki Polygenis Skye Masters Rob Brooker Economist Head of Australian Head of Interest Rate Strategy Manager, Economic Modelling +61 3 8697 9534 [email protected] +61 475 986 285 [email protected] Important Notice This document has been prepared by National Australia Bank Limited ABN 12 004 044 937 AFSL 230686 ("NAB"). Any advice contained in this document has been prepared without taking into account your objectives, financial situation or needs. Before acting on any advice in this document, NAB recommends that you consider whether the advice is appropriate for your circumstances. NAB recommends that you obtain and consider the relevant Product Disclosure Statement or other disclosure document, before making any decision about a product including whether to acquire or to continue to hold it. Please click here to view our disclaimer and terms of use.
Transcript of STATE HANDBOOK: SOUTH AUSTRALIA - … · However this is unlikely to overcome the longer-term...

STATE HANDBOOK: SOUTH AUSTRALIA MARCH 2017
CONTENTS 2 | Key points 3 | In Focus: International exports 4 | Consumer & household sector 5 | NAB customer spending behaviours 6 | Business sector 7 | Commercial property sector 8 | Residential property 9 | Demographics 10 | Labour market 11 | Economic structure and trade 12 | Fiscal outlook 13 | Semi government and credit outlook 14 | State and territory forecasts
CONTACTS
Vyanne Lai Riki Polygenis Skye Masters Rob Brooker Economist Head of Australian Head of Interest Rate Strategy Manager, Economic Modelling +61 3 8697 9534 [email protected] +61 475 986 285 [email protected]
Important Notice This document has been prepared by National Australia Bank Limited ABN 12 004 044 937 AFSL 230686 ("NAB"). Any advice contained in this document has been prepared without taking into account your objectives, financial situation or needs. Before acting on any advice in this document, NAB recommends that you consider whether the advice is appropriate for your circumstances. NAB recommends that you obtain and consider the relevant Product Disclosure Statement or other disclosure document, before making any decision about a product including whether to acquire or to continue to hold it. Please click here to view our disclaimer and terms of use.

0
1
2
3
4
5
6
7
NSW VIC QLD SA WA TAS NT ACT
2013-14 2014-15 2015-16 2016-17 (f) 2017-18 (f)
-4
0
4
8
12
1992 1996 2000 2004 2008 2012 2016
SA Australia
CHART 1: STATE GSP GROWTH FORECASTS Annual growth (%)
CHART 2: STATE FINAL DEMAND Per cent (%)
Source: ABS and NAB Group Economics 2
KEY POINTS: Soft patch ahead for SA economy but farm exports provide relief
The SA economy grew moderately by 1.9% in 2015-16, largely reflecting strong contributions from net exports and household consumption. Contribution from net exports to GSP was at a record level of 1.3ppts in 2015-16, which in turn reflects a sharp pick-up in agricultural and services exports, the latter reflecting stronger inflows of international students and tourists. While the state’s business conditions as indicated by our NAB Business Survey have deteriorated in late 2016, they have shown a subsequent recovery well into positive territory. There is evidence that increased government spending on infrastructure is aiding economic growth, as will the new shipbuilding program at Techport in Port Adelaide. However this is unlikely to overcome the longer-term economic challenges facing the state. An increasingly narrow industrial base, characterised by ongoing structural declines in steelworks and car manufacturing activity (Holden’s Elizabeth plant will officially shut down in October this year) and the lack of “modern” job opportunities in finance and technology that appeal more to younger workers, have witnessed a continuous outflow of interstate migration and consequently, a rapidly ageing population. The median age of the SA population is currently 40, the second highest of all states and territories after Tasmania at 42. Labour market conditions have continued to weigh on demand and price impetus for residential property. Following modest real GSP growth of 1.8% in 2015-16, we it to weaken to 0.8% in 2016-17 before recovering to 2.0% in 2017-18. The unemployment rate was 7.3% (year average) in 2015-16, although declined through the year. Since mid-2016 it has trended flat at around 6.7% but may begin edging up again: we expect the unemployment rate to average 7.0% in 2016-17 and 2017-18.
In 2015-16, household consumption was a standout contributor to GSP growth of the state at 1.6ppts, and more recent data on household expenditure and retail turnover growth have been relatively robust as well. That said, a weakening trend in aggregate income growth points to downside risks on consumption in the near term. Despite quite robust employment growth over 2016, SA’s overall labour market conditions remain among the weakest of across states, marked by a still-high unemployment rate and low participation rate. This in turn will continue to weigh on wages growth.
Following a slight contraction in 2015, SA dwelling prices rose by a respectable 4.2% over 2016. However, some indicators of housing market activity are pointing to a slowdown in momentum for the near-term. Average time on market and vendor discounting have increased from the same period last year, while further weakness in average rents and rental yields are providing a disincentive for investors (although yields are still higher than in Sydney or Melbourne). Given NAB’s expectation for the state’s economic, population and household income growth to remain subdued, both house and apartment prices are forecast to grow modestly, by 1.5% and 0.7% respectively in 2017.
SA’s business conditions, as reported by the NAB Monthly Business Survey, are back in positive territory after a dip in late 2016. SA capex expectations for the next 12 months have eased, while business investment continues to contract sharply, but NAB’s measure of capacity utilisation has risen. With the ongoing weakness in industrial production, we expect limited upside in SA business investment in 2017.
Net exports are likely to be a bright spot for SA in 2017 on the back of a record winter crop, offset partly by weaker volumes of dairy and protein exports. Meanwhile, the lower AUD is likely to continue to support services export (higher international student enrolments and overall tourism expenditure).

IN FOCUS: Robust international exports help boost SA economy
The growth in services exports is largely driven by a steady rise in international student numbers, as indicated by the number of student visas granted by the Australian government, as well as a pick-up in international tourists and their average spend (Chart 5). We expect more restrained growth in 2016-17 and a weaker contribution to GSP growth from net services exports in the year.
That said, SA rural exports are likely to rise in 2016-17 on the back of an expected bumper winter crop, with ABARES forecasting SA winter crop production to hit a record level of 9.8 million tonnes, 37% above that of 2015-16.
Source: ABS, NAB Group Economics
In 2015-16, SA net exports (in real terms) grew significantly on the back of a depreciated AUD, with services exports rising by a record rate of 12% in the year, while merchandise exports expanded by the fastest rate since 2010-11 at 11% (Chart 3).
Combined with relatively stable merchandise and services import volumes, this saw the contribution to GSP by net exports jump to 1.3ppt in 2015-16, to be its largest since the current ABS series began.
CHART 4: CONTRIBUTION TO GSP FROM NET EXPORTS Percentage point
CHART 3: INTERNATIONAL TRADE COMPONENTS Annual growth
CHART 5: STUDENT VISAS GRANTED BY SECTOR Number of visas
CHART 6: ABARES WINTER CROP PRODUCTION OUTLOOK ‘000 tonnes
3
-2.5-2.0-1.5-1.0-0.50.00.51.01.52.0%
-20-10
010203040
Merchandise Exports Merchandise ImportsServices Exports Services Imports
%
0
5,000
10,000
15,000
20,000Vocational Education and Training Sector Schools SectorPostgraduate Research Sector Non-Award SectorIndependent ELICOS Sector Higher Education Sector
0
2,500
5,000
7,500
10,000
12,500
2011–12 2012–13 2013–14 2014–15 2015–16 e 2016–17 f
Wheat Barley Canola

CONSUMER AND HOUSEHOLD SECTOR: SA household spending resilient despite subdued house price growth
Generally speaking however, SA consumers have become somewhat more conservative in their spending preferences more recently. Based on our NAB Consumer Behaviour Survey, consumers are now less inclined to spend on discretionary items such as travel, home improvements and personal goods etc., while continuing to focus on paying down their debt and spending on essential items such as their children’s expenses, medical expenses and utilities (Chart 9).
Source: ABS, NAB Group Economics 4
SA household spending growth continued to be reasonably robust despite a slowing trend in income growth, as indicated by a recent decline in total payroll income. Weak income growth overall is likely to weigh on consumption growth (Chart 7).
This partly reflects steady growth in the state’s retail trade, which has been holding up relatively well compared to the larger eastern states. The resilience in retail trade was despite generally subdued house price growth (hence less wealth creation), but this could mean that SA households potentially have a higher percentage of disposable income outside of mortgage repayments for spending on other goods and services (Chart 8).
CHART 7: AVERAGE COMPENSATION OF EMPLOYEES AND HOUSEHOLD CONSUMPTION GROWTH Year-on-year percentage growth
CHART 9: NAB CONSUMER ANXIETY SURVEY - CONSUMER SPENDING PREFERENCES Changes in Consumer Spending Preferences (net balance)
CHART 8: RETAIL TURNOVER AND HOUSE PRICE GROWTH Year-on-year percentage growth
-5%
0%
5%
10%
15%
2000 2002 2004 2006 2008 2010 2012 2014 2016
Nominal Household Consumption Total Compensation of Employees
-5.0%-3.0%-1.0%1.0%3.0%5.0%7.0%9.0%
-4.0%0.0%4.0%8.0%
12.0%16.0%20.0%24.0%
2006 2008 2010 2012 2014 2016
Adelaide House Price Growth (y/y %) -RHSRetail Turnover Growth (y/y%) - LHS
-40-30-20-10
01020Eating out
Entertainment
Major HH items
Personal goods
Charitable donations
Travel
Home improvements
Use of creditSavings, super,
investments
Transport
Groceries
Children
Medical expenses
Utilities
Paying off debt
Q3'16 Q4'16

NAB CUSTOMER SPENDING BEHAVIOURS: Spending growth in Adelaide and regional areas broadly similar
Source: ABS, NAB Group Economics 5
NAB’s customer transaction data allows for a more granular look at spending behaviours across regions in SA.
By individual postcode, spending growth in Metro Adelaide over the year was fastest in Macclesfield at 26%, followed by Ferryden Park (21.4%), Richmond and Enfield. In regional SA, spending was fastest in Keith (almost 67%) and Cummins (almost 35%), followed by Brinkworth and Coober Pedy.
[Customer spending on Accommodation, Cafes, Pubs & Restaurants was fastest in both Sydney Metro (13.8%) and NSW Regional areas (17.4%).]
CHART 10: GREATER ADELAIDE METRO AREA Year-ended growth to Q4 2016
CHART 11: REGIONAL SA (EX METRO) Year-ended growth to Q4 2016
CHART 12: TOP 20 GROWING METRO POSTCODES FOR SPENDING CHART 13: TOP 20 GROWING REGIONAL POSTCODES FOR SPENDING
Overall Growth
3.4%
Average Monthly
Spend (Q4) $2,031
Overall Growth
3.4%
Average Monthly
Spend (Q4) $1,783
66.9
%
34.9
%
29.9
%
26.0
%
23.9
%
22.8
%
22.7
%
21.0
%
19.0
%
14.0
%
13.4
%
12.8
%
11.1
%
10.9
%
9.7%
9.6%
9.4%
8.7%
8.7%
8.1%
0%
10%
20%
30%
40%
50%
60%
70%
Keit
h
Cum
min
s
Brin
kwor
th
Coob
er P
edy
Was
leys
Gla
dsto
ne
Why
alla
Jenk
ins
Clin
ton
Blyt
h
Pask
evill
e
Tint
inar
a
Aub
urn
Rive
rton
Men
ingi
e
Snow
tow
n
Barm
era
And
amoo
ka
Peno
la
Wat
erva
le
Roxb
y D
owns
5267 5631 5464 5723 5400 5473 5609 5570 5462 5552 5266 5451 5412 5264 5520 5345 5722 5277 5452 5725
Top 20 Postcodes by Spending Growth: SA Regional(Q4 2016 spend value on Q4 2015 spend value)
26.0
%
21.4
%
16.8
%
16.2
%
12.2
%
12.0
%
11.7
%
8.3%
8.3%
8.2%
8.0%
8.0%
7.9%
7.8%
7.7%
7.5%
7.3%
6.5%
6.4%
6.3%
0%
5%
10%
15%
20%
25%
30%
Mac
cles
field
Ferr
yden
Par
k
Rich
mon
d
Enfie
ld
Unl
ey
Para
field
Gar
dens
Woo
dvill
e W
est
Blac
kwoo
d
Mile
End
Larg
s Ba
y
Chri
stie
Dow
ns
Flin
ders
Par
k
Stir
ling
Ingl
e Fa
rm
Lock
leys
Port
Noa
rlun
ga
Sem
apho
re P
ark
Roya
l Par
k
Brom
pton
Wes
t Cr
oydo
n
5153 5010 5033 5085 5061 5107 5011 5051 5031 5016 5164 5025 5152 5098 5032 5167 5019 5014 5007 5008
Top 20 Postcodes by Spend Growth: Adelaide Metro(Q4 2016 spend value on Q4 2015 spend value)

-30
-20
-10
0
10
20
30
40
-30
-20
-10
0
10
20
30
40
2006 2007 2008 2009 2010 2011 2012 2013 2014 2015 2016 2017
Total South Australia
BUSINESS SECTOR: SA business conditions and capacity utilisation are positives
SA capex expectations for the next 12 months have eased, while business investment continues to contract sharply (Chart 12). This is likely to be a reflection of a continually shrinking manufacturing base in the state, which has been traditionally a major industry in terms of output and employment. In terms of business conditions, recreational and personal services and transport/utilities are the outperformers, while mining and construction continue to fare badly (Chart 13).
6 Source: ABS, NAB Group Economics
According to the monthly NAB Business Survey, SA business capacity utilisation has strengthened recently to remain notably above the recent trough in 2015 (Chart 10). This is broadly in line with the recent improvement in business conditions following a soft spot in late 2016 (Chart 11). The recent evolution of business conditions in SA resembles, but remains weaker than, the national average.
CHART 14: NAB BUSINESS SURVEY – CAPACITY UTILISATION Per cent of total capacity (%)
CHART 15: SPREAD IN NAB BUSINESS CONDITIONS Net balance, 3-month-moving-average
CHART 16: NAB SURVEY CAPEX EXPECTATIONS & PRIVATE BUSINESS INVESTMENT GROWTH
CHART 17; BUSINESS CONDITIONS AND CONFIDENCE BY INDUSTRY Net balance
74
76
78
80
82
84
86
2000 2002 2004 2006 2008 2010 2012 2014 2016
SA Total
%
-60
-40
-20
0
20
40
60
-30
-15
0
15
30
45
60
2001 2003 2005 2007 2009 2011 2013 2015 2017
SA Capex Expectations (12-month) - LHS
SA Business Investment Growth (y/y%) -RHS
%
-50-40-30-20-10
010203040 Net Balance (%). December quarter 2016
Conditions Confidence

COMMERCIAL PROPERTY/NON-RESIDENTIAL INVESTMENT: Activity tracking at low levels, but retail appears resilient. Capex likely to fall.
Consequently, capital expectations for buildings and structures for 2016-17 are now expected to be slightly above that actual expenditure in 2015-16, but below that of earlier years. Similarly. planned spending on machinery and equipment is expected to rise modestly in 2016-17 (Chart 16).
7 Source: ABS, NAB Group Economics
Reflecting the soft appetite for business investment, non-residential building approvals have been tracking at low levels, although there appears to be some tentative pick-ups in office building approvals and “other”, which mainly includes hotels and other forms of recreational accommodation (Chart 14).
The slight uptick in SA office building approvals coincides with a slight easing in office vacancy rates, albeit still at a historically high level. This continues to suggest a substantial amount of spare capacity in the commercial property sector (Chart 15).
CHART 18: NON-RESIDENTIAL BUILDING APPROVALS Million dollars
CHART 19: OFFICE APPROVALS AND VACANCY RATES
CHART 20: SA CAPITAL EXPENDITURE & EXPECTATIONS Actual & expected based on previous realisation ratio ($billion)
070140210280350420490
010203040506070
2002 2004 2006 2008 2010 2012 2014 2016
Retail/Wholesale -LHS Offices - LHS Factories- LHSWarehouses-LHS Other-RHS
$m m
3579111315170
8162432404856
2006 2008 2010 2012 2014 2016
Office Approvals (lhs)
Office Vacancy Rates (inverse, rhs)
%$m
0.0
1.0
2.0
3.0
4.0
Building & Structures Machinery & Equipment2013-14 2014-15 2015-16 2016-17 (e)
$b
-4.0-3.0-2.0-1.00.01.02.0
Q3'
13
Q4'
13
Q1'
14
Q2'
14
Q3'
14
Q4'
14
Q1'
15
Q2'
15
Q3'
15
Q4'
15
Q1'
16
Q2'
16
Q3'
16
Q4'
16
Nex
t Q
tr
Nex
t 12
m
Nex
t 2y
Australia SA/NT
ExpectationsEstimated price growth in relevant survey period
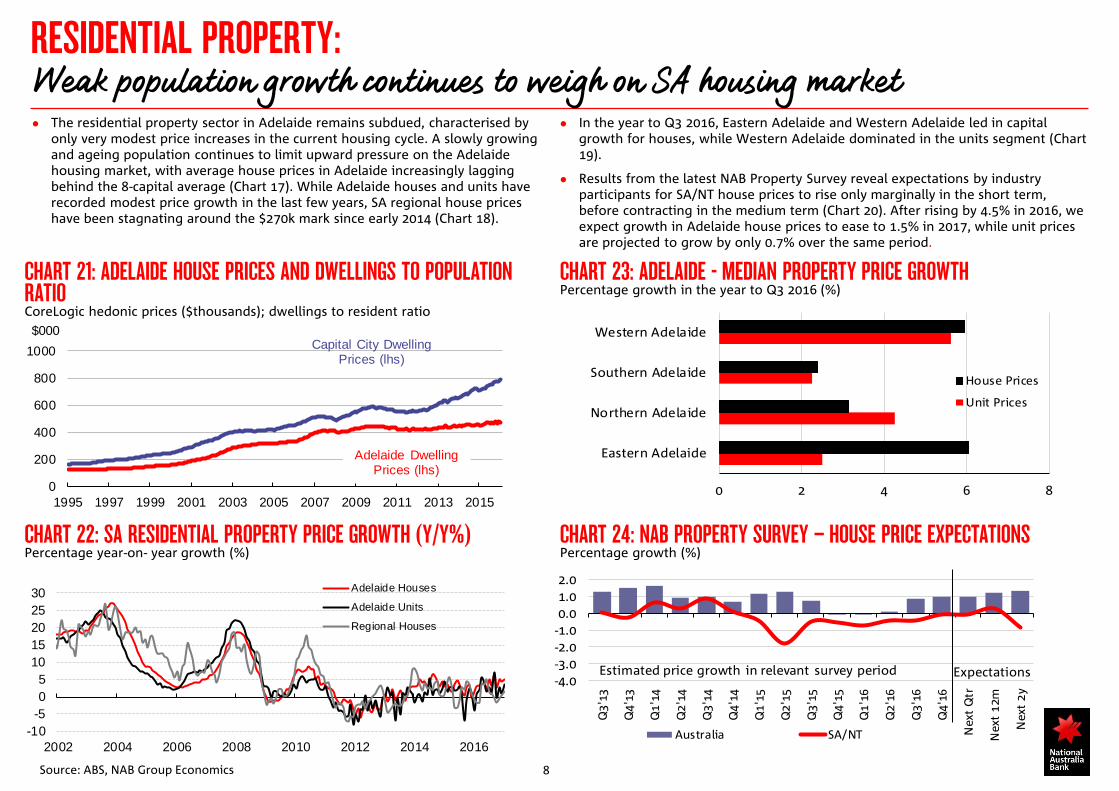
RESIDENTIAL PROPERTY: Weak population growth continues to weigh on SA housing market
In the year to Q3 2016, Eastern Adelaide and Western Adelaide led in capital growth for houses, while Western Adelaide dominated in the units segment (Chart 19).
Results from the latest NAB Property Survey reveal expectations by industry participants for SA/NT house prices to rise only marginally in the short term, before contracting in the medium term (Chart 20). After rising by 4.5% in 2016, we expect growth in Adelaide house prices to ease to 1.5% in 2017, while unit prices are projected to grow by only 0.7% over the same period.
8 Source: ABS, NAB Group Economics
The residential property sector in Adelaide remains subdued, characterised by only very modest price increases in the current housing cycle. A slowly growing and ageing population continues to limit upward pressure on the Adelaide housing market, with average house prices in Adelaide increasingly lagging behind the 8-capital average (Chart 17). While Adelaide houses and units have recorded modest price growth in the last few years, SA regional house prices have been stagnating around the $270k mark since early 2014 (Chart 18).
CHART 21: ADELAIDE HOUSE PRICES AND DWELLINGS TO POPULATION RATIO CoreLogic hedonic prices ($thousands); dwellings to resident ratio
CHART 22: SA RESIDENTIAL PROPERTY PRICE GROWTH (Y/Y%) Percentage year-on- year growth (%)
CHART 23: ADELAIDE - MEDIAN PROPERTY PRICE GROWTH Percentage growth in the year to Q3 2016 (%)
CHART 24: NAB PROPERTY SURVEY – HOUSE PRICE EXPECTATIONS Percentage growth (%)
-10-505
1015202530
2002 2004 2006 2008 2010 2012 2014 2016
Adelaide Houses
Adelaide Units
Regional Houses
0 2 4 6 8
Eastern Adelaide
Northern Adelaide
Southern Adelaide
Western Adelaide
House Prices
Unit Prices
0
200
400
600
800
1000
1995 1997 1999 2001 2003 2005 2007 2009 2011 2013 2015
$000
Adelaide Dwelling Prices (lhs)
Capital City Dwelling Prices (lhs)

-10
-5
0
5
10
15
20
25
2002 2004 2006 2008 2010 2012 2014 2016
'000s Natural increase Net overseas migrationNet interstate migration Total population growth
DEMOGRAPHICS: SA population growth continues to moderate as people leave for interstate
The SA population continues to age relative to the national average, with the median age of its population now at 40, the second highest after Tasmania at 42 (Chart 23).
The steady decline in the SA share of national population continues (Chart 24).
9 Source: ABS, NAB Group Economics
Growth in the South Australian population continues to underperform national average growth and, in recent quarters, has slowed markedly (Chart 21). The slowdown is largely driven by a continuous net outflow of interstate migration and to a lesser extent, softening net overseas migration (Chart 22).
CHART 28: SA SHARE OF AUS POPULATION AND GROWTH IN MIGRATION Quarterly population change (‘000 persons)/SA population as a percentage share of Australian population (%)
CHART 26: POPULATION GROWTH Four-quarter rolling sum (‘000 persons)
CHART 25: SA AND AUS POPULATION GROWTH Year-ended percentage growth (%)
CHART 27: MEDIAN AGE OF POPULATION BY STATE
0
0.5
1
1.5
2
2.5
1992 1994 1996 1998 2000 2002 2004 2006 2008 2010 2012 2014 2016
SA Pop Growth AUS Pop Growth
%26 28 30 32 34 36 38 40 42 44
AUSNSW
VICQLD
SAWATASNT
ACT
1996
2016
7.0%7.1%7.2%7.3%7.4%7.5%7.6%7.7%7.8%
-2,000-1,000
01,0002,0003,0004,0005,0006,000
2002 2004 2006 2008 2010 2012 2014 2016
Net overseas migration (LHS)
Net interstate migration (LHS)
Share of Aus population (RHS)
2
4
6
8
10
2002 2004 2006 2008 2010 2012 2014 2016
SA Greater Adelaide Rest of SA
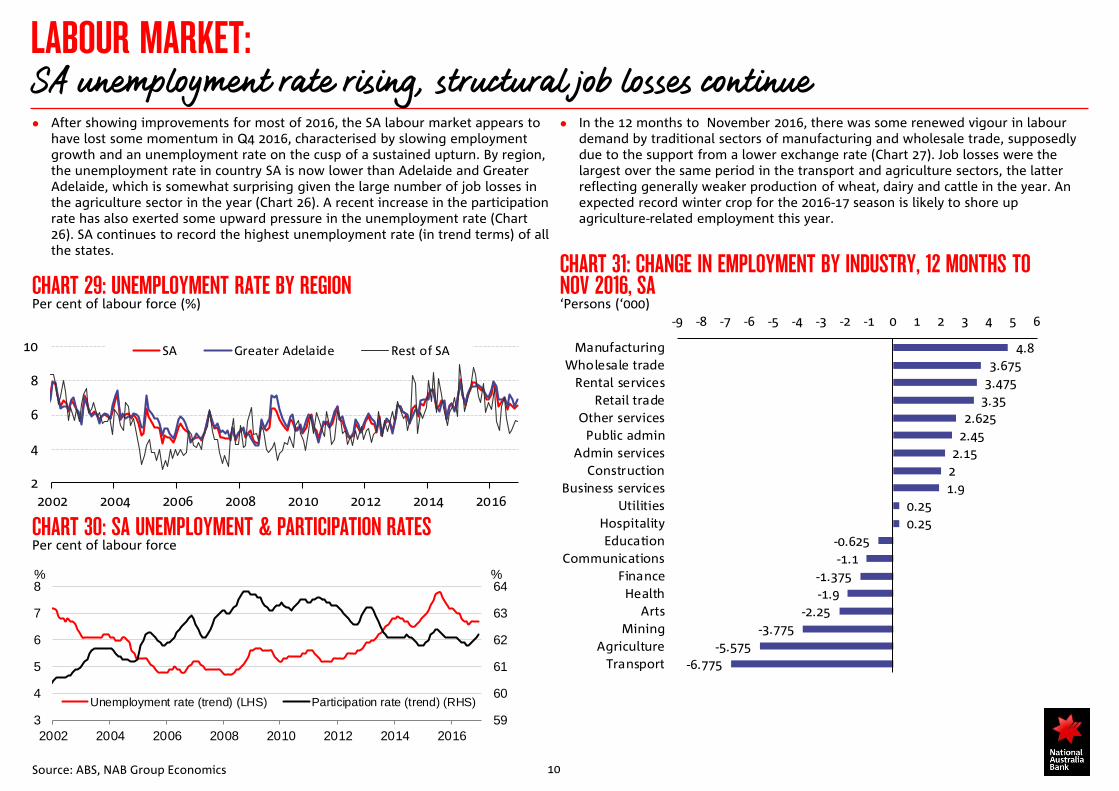
LABOUR MARKET: SA unemployment rate rising, structural job losses continue
In the 12 months to November 2016, there was some renewed vigour in labour demand by traditional sectors of manufacturing and wholesale trade, supposedly due to the support from a lower exchange rate (Chart 27). Job losses were the largest over the same period in the transport and agriculture sectors, the latter reflecting generally weaker production of wheat, dairy and cattle in the year. An expected record winter crop for the 2016-17 season is likely to shore up agriculture-related employment this year.
10 Source: ABS, NAB Group Economics
After showing improvements for most of 2016, the SA labour market appears to have lost some momentum in Q4 2016, characterised by slowing employment growth and an unemployment rate on the cusp of a sustained upturn. By region, the unemployment rate in country SA is now lower than Adelaide and Greater Adelaide, which is somewhat surprising given the large number of job losses in the agriculture sector in the year (Chart 26). A recent increase in the participation rate has also exerted some upward pressure in the unemployment rate (Chart 26). SA continues to record the highest unemployment rate (in trend terms) of all the states.
CHART 29: UNEMPLOYMENT RATE BY REGION Per cent of labour force (%)
CHART 31: CHANGE IN EMPLOYMENT BY INDUSTRY, 12 MONTHS TO NOV 2016, SA ‘Persons (‘000)
CHART 30: SA UNEMPLOYMENT & PARTICIPATION RATES Per cent of labour force
4.83.675
3.4753.35
2.6252.45
2.1521.9
0.250.25
-0.625-1.1
-1.375-1.9
-2.25-3.775
-5.575-6.775
-9 -8 -7 -6 -5 -4 -3 -2 -1 0 1 2 3 4 5 6
ManufacturingWholesale trade
Rental servicesRetail trade
Other servicesPublic admin
Admin servicesConstruction
Business servicesUtilities
HospitalityEducation
CommunicationsFinanceHealth
ArtsMining
AgricultureTransport
59
60
61
62
63
64
3
4
5
6
7
8
2002 2004 2006 2008 2010 2012 2014 2016
Unemployment rate (trend) (LHS) Participation rate (trend) (RHS)
% %
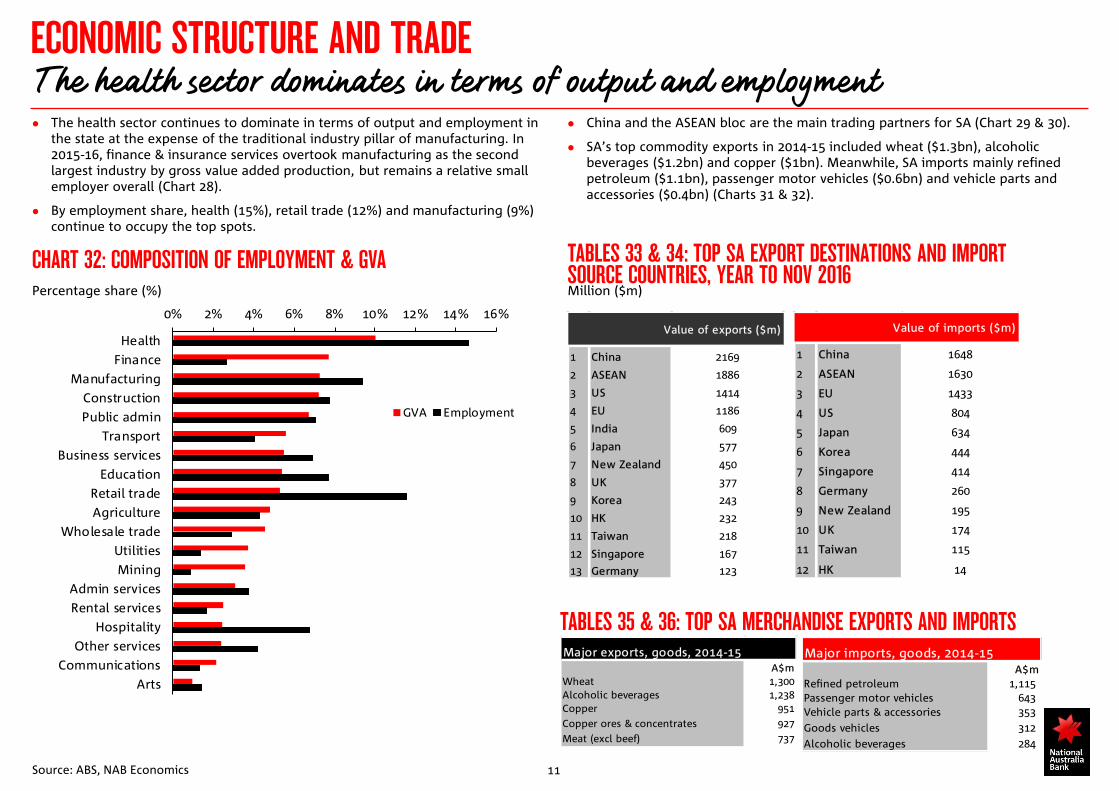
CHART 32: COMPOSITION OF EMPLOYMENT & GVA Percentage share (%)
11 Source: ABS, NAB Economics
ECONOMIC STRUCTURE AND TRADE The health sector dominates in terms of output and employment
0% 2% 4% 6% 8% 10% 12% 14% 16%
HealthFinance
ManufacturingConstructionPublic admin
TransportBusiness services
EducationRetail tradeAgriculture
Wholesale tradeUtilitiesMining
Admin servicesRental services
HospitalityOther services
CommunicationsArts
GVA Employment
TABLES 33 & 34: TOP SA EXPORT DESTINATIONS AND IMPORT SOURCE COUNTRIES, YEAR TO NOV 2016
Value of exports ($m)
1 China 2169
2 ASEAN 1886
3 US 1414
4 EU 1186
5 India 609
6 Japan 577
7 New Zealand 450
8 UK 377
9 Korea 243
10 HK 232
11 Taiwan 218
12 Singapore 167
13 Germany 123
Value of imports ($m)
1 China 1648
2 ASEAN 1630
3 EU 1433
4 US 804
5 Japan 634
6 Korea 444
7 Singapore 414
8 Germany 260
9 New Zealand 195
10 UK 174
11 Taiwan 115
12 HK 14
The health sector continues to dominate in terms of output and employment in the state at the expense of the traditional industry pillar of manufacturing. In 2015-16, finance & insurance services overtook manufacturing as the second largest industry by gross value added production, but remains a relative small employer overall (Chart 28).
By employment share, health (15%), retail trade (12%) and manufacturing (9%) continue to occupy the top spots.
China and the ASEAN bloc are the main trading partners for SA (Chart 29 & 30).
SA’s top commodity exports in 2014-15 included wheat ($1.3bn), alcoholic beverages ($1.2bn) and copper ($1bn). Meanwhile, SA imports mainly refined petroleum ($1.1bn), passenger motor vehicles ($0.6bn) and vehicle parts and accessories ($0.4bn) (Charts 31 & 32).
Major exports, goods, 2014-15A$m
Wheat 1,300Alcoholic beverages 1,238Copper 951Copper ores & concentrates 927Meat (excl beef) 737
Major imports, goods, 2014-15A$m
Refined petroleum 1,115 Passenger motor vehicles 643 Vehicle parts & accessories 353 Goods vehicles 312 Alcoholic beverages 284
Million ($m)
TABLES 35 & 36: TOP SA MERCHANDISE EXPORTS AND IMPORTS

FISCAL OUTLOOK General government net debt forecast to be higher in most years
Meanwhile, total taxation revenues have been revised down in all years, mainly due to lower-than-expected stamp duty revenues from residential property transactions. Meanwhile, GST grants have been revised up from 2017-18 reflecting changes to SA’s expected share of the GST pool, partially offset by reduced relative population share. GST is the single largest source of revenue for the state at 32% (Chart 34).
12
In its Mid-Year Budget Review, the SA government has revised its forecast for general government net operating surplus higher for the budget year ( up $46m to $300m) but moderately lower for the forward estimates. However, surpluses are expected grow overtime in the forward estimates period. Simultaneously, net debt has been revised marginally lower in 2016-17 and 2017-18, but higher in 2018-19 and 2019-20 (chart 33). This primarily reflects increased funding of new initiatives including strengthening families and child protection systems, a package to assist large businesses with electricity costs responses to severe weather events of September 2016.An increase in the return of equity from MAC is the main driver of improved net debt in the out years. Net debt is now expected to peak in 2018-19 at $6.6bn instead of $6.6bn at 2017–18.
CHART 37: SA NET OPERATING BALANCE CHART 38: SA COMPOSITION OF STATE REVENUE Percentage share (%)
33.544.555.566.577.58
3000
4000
5000
6000
7000
8000
2015-16 2016-17 e 2017-18 f 2018-19 f 2019-20 f
Net Debt Level Budget Updatet (LHS)
Net Debt Level Budget (LHS)
Net Debt as a Share of GSP Budget Update (RHS)
Net Debt as a Share of GSP Budget (RHS)
%$m
Taxation23%
GST32%
Other Grants
30%
Sales of Goods and
Services13%
Other-2%

SEMI GOVERNMENT BONDS AND CREDIT RATINGS SA government credit rating metrics at risk of slight downgrade by S&P
SAFA funding program for FY17 is $5.5bn (vs $3.7bnbn in FY16). This comprises $0.1bn of new financing, $2bn of PN and ECP rollovers and $3.4bn of maturities. For liquidity reasons SAFA plans to refinance the Sep 17 bond line (2.4bn outstanding) via issuing into existing 2025 and 2016 lines and potentially creating 2022, 2024 and 2027 (Chart 38).
Source: SAFA and SA budget papers 13
On a total state level, net debt will rise to $13.8bn in FY 17 (from $10.9bn) which is expected to be close to the peak for net debt over the forecast horizon. The rise in net debt in FY 17 largely reflects the financial obligations for the new Royal Adelaide Hospital (Chart 35).
S&P is yet to confirm SA’s credit rating. Our estimates of the rating metrics show some slippage from the MYBR but it is not material (Chart 37).
CHART 39: SA NON-FINANCIAL PUBLIC SECTOR NET DEBT CHART 41: S&P CREDIT METRIC: BUDGET PERFORMANCE METRICS
CHART 40: SA BORROWING PROGRAMME CHART 42: SAFA TERM BONDS OUTSTANDING AS AT END JUNE 2016
8
9
10
11
12
13
14
15
2015-16 2016-17 2017-18 2018-19 2019-20
$bnFY-17 BudgetFY16 MYBR
FY16
-1
0
1
2
3
4
5
6
7
FY 15 FY 16 e FY 17 (f) FY 18 (f) FY 19 (f) FY 20(f)
AUDbn
Refinancing
New financing
Borrowing programme
nb: forecasts for new financing estimated from budget
Pre funding/liquidty
0.0
0.5
1.0
1.5
2.0
2.5
3.0AUDbn
Issuance as at 30

FORECASTS BY STATE AND TERRITORY: South Australia to grow at more moderate rates than the national average
Source: ABS, CoreLogicNAB Economics
NAB’s economic forecasts by state and territory are below. For a summary of the outlook by state, please see the States Handbook – Overview which contains links to the detailed handbook for each state and territory.
REAL GROSS STATE PRODUCT AND UNEMPLOYMENT RATE FORECASTS Annual average
14
HEDONIC HOUSE PRICE FORECASTS* Through the year growth to Q4
HEDONIC UNIT/APARTMENT PRICE FORECASTS * Through the year growth to Q4
NAB growth and unemployment rate forecasts for the states
14-15 15-16 16-17f 17-18f 14-15 15-16 16-17f 17-18fNSW 2.6 3.5 2.7 2.9 5.9 5.4 5.1 5.3VIC 2.6 3.3 2.7 2.9 6.4 5.9 5.7 5.7QLD 1.2 2.0 3.5 3.5 6.5 6.2 6.2 5.8SA 2.0 1.9 0.8 2.0 6.9 7.3 7.0 7.0WA 3.6 1.9 0.5 2.8 5.4 6.0 6.5 6.3TAS 1.3 1.3 1.0 2.0 6.9 6.5 6.5 6.5NT 2.0 2.7 1.5 5.0 4.2 4.2 4.0 4.8ACT 1.3 3.4 2.3 2.5 4.5 4.5 4.3 4.3Australia 2.4 2.7 2.1 3.0 6.2 5.9 5.7 5.7
Unemployment RateGross State Product YoY