Identifying Crash Location from Chicago Traffic Crash Data ...

DOT HS 812 052 August 2014
State Data System Crash Data Report: 2000–2009

DISCLAIMER
This publication is distributed by the U.S. Department of Transportation, National Highway Traffic Safety Administration, in the interest of information exchange. The opinions, findings, and conclusions expressed in this publication are those of the authors and not necessarily those of the Department of Transportation or the National Highway Traffic Safety Administration. The United States Government assumes no liability for its contents or use thereof. If trade or manufacturers’ names or products are mentioned, it is because they are considered essential to the object of the publication and should not be construed as an endorsement. The United States Government does not endorse products or manufacturers.
Suggested APA Format Citation:
Nelli, D., Hansen, M., & O’Neil, M. (2014, August). State data system crash data report: 2000–2009. (Report No. DOT HS 812 052). Washington, DC: National Highway Traffic Safety Administration.

State Data System: Crash Data Report 2000–2009
1. Report No.
DOT HS 812 052 2. Government Accession No. 3. Recipient's Catalog No.
4. Title and Subtitle
State Data System Crash Data Report: 2000-2009 5. Report Date
August 2014
6. Performing Organization Code
7. Author(s)
Dheeraj Nelli, Marie Hansen, Morrie O’Neil 8. Performing Organization Report No.
9. Performing Organization Name and Address
Advanced Systems Technology & Management, Inc. 8229 Boone Boulevard, Suite 520 Vienna, VA 22182
10. Work Unit No. (TRAIS)
11. Contract or Grant No.
12. Sponsoring Agency Name and Address
National Highway Traffic Safety Administration National Center for Statistics and Analysis, NVS-412 1200 New Jersey Avenue SE. Washington, DC 20590
13. Type of Report and Period Covered
NHTSA Technical Report
14. Sponsoring Agency Code
Office of Data Acquisition, NVS-410
15. Supplementary Notes
16. Abstract
Since the early 1980s, the National Highway Traffic Safety Administration has been obtaining, from various States, computer data files coded from police crash reports. NHTSA refers to the collection of these computerized State data files as the State Data System (SDS). The SDS is maintained by NHTSA’s National Center for Statistics and Analysis (NCSA). Currently, there are 34 States participating in SDS: Alabama, Arkansas, California, Colorado, Connecticut, Delaware, Florida, Georgia, Illinois, Indiana, Iowa, Kansas, Kentucky, Louisiana, Maryland, Michigan, Minnesota, Missouri, Montana, Nebraska, New Jersey, New Mexico, New York, North Carolina, North Dakota, Ohio, Pennsylvania, South Carolina, Texas, Utah, Virginia, Washington, Wisconsin, and Wyoming. This report presents descriptive statistics summarizing motor vehicle traffic crashes that occurred from 2000 to 2009 in the SDS. The States’ crash data files are unique, contain large amounts of information, and are used by NHTSA analysts for a broad range of motor vehicle traffic crash research and reports and in the development of U.S. DOT regulation and policy. 17. Key Word 18. Distribution Statement
Document is available to the public from the National Technical Information Service www.ntis.gov
19. Security Classif. (of this report)
Unclassified 20. Security Classif. (of this page)
Unclassified 21. No. of Pages
281 22. Price
i

State Data System: Crash Data Report 2000–2009
Table of Contents Introduction ............................................................................................................................... ............................ 1
CRASHES............................................................................................................................... ...................................... 6
Table 1: Motor Vehicle Crashes by Crash Severity and Crash Type ....................................................................... 7
Table 2: Motor Vehicle Crashes‐Related to Alcohol by Crash Severity and Crash Type ...................................... 20
Table 3: Motor Vehicle Crashes by First Harmful Event and Crash Severity ....................................................... 38
Table 4: Motor Vehicle Crashes Where Driver Distraction/Inattention Was a Contributing Factor ................... 72
Table 5: Motor Vehicle Crashes Reported to Have Rollovers/Overturned Vehicles ........................................... 79
Table 6: Motor Vehicle Crashes Reported to Be Related to Speeding ................................................................ 85
Table 7: Motor Vehicle Crashes With Passenger Vehicle Cargo Loss or Shift...................................................... 91
VEHICLES ............................................................................................................................... ................................... 94
Table 8: Motor Vehicles Involved in Crashes by Vehicle Type and Crash Severity .............................................. 95
PEOPLE ............................................................................................................................... .................................... 130
Table 9: People Killed or Injured in Motor Vehicle Crashes by Person Type ..................................................... 131
Table 10: People Killed or Injured in Motor Vehicle Crashes by Age Group ..................................................... 144
Table 11: People Killed or Injured in Crashes with Drivers 16 to 20 Years Old.................................................. 179
Table 12: People Killed or Injured in Crashes with Drivers 65 to 98 Years Old.................................................. 183
Table 13: Pedestrians Involved in Crashes by Pedestrian Action ...................................................................... 188
Table 14: Pedestrians Involved in Crashes by Pedestrian Location ................................................................... 195
Table 15: People Killed or Injured in Alcohol‐Related Crashes .......................................................................... 200
Table 16: Restraint and Helmet Use for Motorists Killed or Injured in Crashes ................................................ 205
APPENDIX I ............................................................................................................................... .............................. 223
Associated Analyses and Reports ...................................................................................................................... 224
APPENDIX II ............................................................................................................................... ............................. 227
State‐Specific Notes ............................................................................................................................... ............ 228
APPENDIX III ............................................................................................................................... ............................ 263
Exposure Data ............................................................................................................................... ..................... 264
Exposure Data 1: Population by State ........................................................................................................... 265
Exposure Data 2: Vehicle Miles Traveled (millions) by State ......................................................................... 267
Exposure Data 3: Number of Licensed Drivers by State ................................................................................ 269
ii

State Data System: Crash Data Report 2000–2009
APPENDIX IV ............................................................................................................................... ............................ 271
First Harmful Event Categorization .................................................................................................................... 272
Vehicle Type Categorization .............................................................................................................................. 274
iii

State Data System: Crash Data Report 2000–2009
Introduction
The tables in this report are based on 2000 to 2009 data collected and processed by the National Highway Traffic Safety Administration’s State Data System (SDS). In 2005, NHTSA published a similar report based on the ten previous year’s data, State Data System Crash Data Report: 1990–1999 (Report No. DOT HS 809 504).
Since the early 1980s, NHTSA has been obtaining data files coded from police accident reports (PARs). The data is provided by the States, processed by NHTSA, and made available for analysis through the SDS. The SDS provides data not available in NHTSA’s other data systems. Although the Fatality Analysis Reporting System (FARS) is a census of fatal crashes, SDS also includes valuable data on injury and property‐damage‐only crashes. In contrast to the data in the National Automotive Sampling System General Estimates System (NASS‐GES), which is a sample of police reported motor vehicle traffic crashes designed to produce national estimates on general characteristics of such crashes across the United States, the SDS is a census of all police‐reported crashes for the participating States. The State crash files are used to support NHTSA’s efforts to identify traffic safety problems, develop and implement vehicle and driver countermeasures, evaluate motor vehicle standards, and study crash‐avoidance issues, crashworthiness issues, and the effectiveness of NHTSA’s regulations. A list of published research and evaluations conducted by NHTSA since the year 2000, using SDS data, is found in Appendix I.
In most instances, the State agencies that provide the data are State police departments, State highway safety departments, or State departments of transportation. The data are received in various formats and are then converted to Statistical Analysis System (SAS) data files. The SAS files are placed on NHTSA’s Local Area Network, where they are available for the analytical needs of NHTSA staff. The State crash data files in the SDS are not available for research outside NHTSA unless permission has been granted from the individual State to release their crash data.
At the time of its creation, the SDS consisted of 17 States:
California Kansas North Carolina Virginia Florida Maryland Ohio Washington Georgia Michigan Pennsylvania Illinois Missouri Texas Indiana New Mexico Utah
Since SDS has proven to be very valuable, NHTSA is currently expanding the program. New States that have joined are:
Alabama Iowa Nebraska Wisconsin Arkansas Louisiana New Jersey Wyoming Colorado Kentucky New York Connecticut Minnesota North Dakota Delaware Montana South Carolina
The tables in this report are based on data from the 34 States in the SDS. Occasionally, a State is not able to provide one or more years of data, or the SDS is unable to process the data, usually because it has multiple coding schemes during a transition year. For the 10 years covered in this report, the years of available data are:
1

State Data System: Crash Data Report 2000–2009
State Data Available For: State Data Available For:
Alabama 2000–2009 Missouri 2000–2009 Arkansas 2000–2009 Montana 2000–2008 California 2000–2009 Nebraska 2000–2009 Colorado 2000–2004 New Jersey 2001–2009 Connecticut 2000–2009 New Mexico 2000–2009 Delaware 2000–2004, 2007–2009 New York 2000, 2002–2009 Florida 2000–2009 North Carolina 2000–2009 Georgia 2000–2009 North Dakota 2003–2009 Illinois 2000–2009 Ohio 2000–2009 Indiana 2000, 2003–2009 Pennsylvania 2000–2001, 2003–2009 Iowa 2001–2009 South Carolina 2000–2009 Kansas 2000–2009 Texas 2000, 2002–2009 Kentucky 2000–2009 Utah 2000–2004 Louisiana 2005–2009 Virginia 2000–2009 Maryland 2000–2009 Washington 2000–2009 Michigan 2000–2009 Wisconsin 2000–2009 Minnesota 2000–2002, 2004–2009 Wyoming 2000–2009
Information provided by the States varies because individual States have different crash reporting criteria, collect different data items, and use different coding schemes. Although the SDS does not change the coding used by each State, the SDS does perform some basic standardization procedures by:
Adopting a common file structure; Adopting common variable names; and Eliminating variables that contain personal identifiers.
The common file structure used by the SDS organizes the information from the State PARs into three files for each year of a State’s data:
The crash file contains general crash characteristics describing the environmental and roadway conditions at the time of the crash.
The vehicle file contains information describing the vehicles involved in the crash. This file also includes selected driver characteristics.
The person file contains information describing the characteristics of the drivers, passengers, pedestrians, pedalcyclists and other non–motorists involved in the crash.
For some States, additional files (e.g., commercial vehicle files) are available depending on the structure of the data provided by the State.
The common variable name concept, adopted to help analysts, assigns the same variable names to variables in each State that describe comparable information. If it can be determined that two or more States use a variable that is substantially the same, the variable is considered to be a common variable, and the same name is assigned to the variable in each State. The information must be similar, but often does not contain the same attributes. For example, the common variable “First Harmful Event” is used by many States, but not all States include a code for striking a tree.
2

State Data System: Crash Data Report 2000–2009
Data Quality
One of the principles of the SDS is to create SAS data that contain values and codes that are as similar to the original State data as possible. Although most States have their own data quality control procedures, there can be considerable variation in these procedures between States and over time. The SDS reviews all data values and notes any erroneous codes that may make their way into a State’s data, however, SDS does not recode or otherwise change original data values nor does it perform edit checks to uncover inconsistencies between variables. Erroneous codes are noted in a “Readme File” that is produced for each State and made available to all SDS data users. In the following tables, erroneous codes are included in the “unknown” categories.
The SDS and State‐Published Crash Statistics
After the SDS produces the SAS data for a State, various crash counts are compared to counts in the State’s “crash facts” publications as part of data quality control. State crash fact publications, like SDS data, are usually based on information obtained from police accident reports, but State publications may include data from other sources as well. Aggregate SDS crash counts usually align very closely with State publications. Occasionally very small differences can be seen, which are usually due to minor updates the State has made after sending their data to the SDS. However, larger differences may be seen when comparing more narrowly defined crash characteristics—such as the number of alcohol‐related or speeding‐related crashes— since the State and the SDS may use different variables and assumptions, and the States may at times augment their studies with data unavailable to SDS, such as criminal justice or emergency management systems data. For these same reasons, differences may be seen between statistics published by a State and those in this report.
Reportable Crashes
All States have criteria that must be met for a crash to be included in their data, although the criteria vary from State to State. The typical criteria that States use to define reportable crashes are that the crash must involve a fatality or an injury that resulted from the crash, or meet a minimum dollar amount of property damage, which generally ranges from $500 to $1,500. Also, many States require that the crash occur on a public roadway, rather than on private property such as a parking lot. A small number of crashes that do not meet reporting criteria or location requirements may be included in a State’s data on a very limited basis. Reporting criteria for each State are shown in the Appendix II, “State Specific Notes.”
It should be noted that a few SDS States routinely include a relatively large number of non‐injury crashes that do not meet the dollar amount for property damage, or a large number that occur on private property. These are North Carolina, Nebraska, Kentucky, Virginia (starting in 2009), and Delaware (starting in 2007). These crashes can be identified and have been excluded from the tables in this report.
Changes in States’ Crash Records Systems
Large increases or decreases in the total number of crashes for a given State may be seen in some of the following tables, and are sometimes the result of changes in the State’s crash records system—such as changes in the kinds of crashes a State includes in its reporting system. For example, Table 1, “Motor Vehicle Crashes by Crash Severity and Crash Type,” shows that Connecticut property damage crashes nearly doubled from 2006 to 2007. This change was largely due to a change in Connecticut's reporting system: prior to 2007 crashes that occurred on local roads were included only if a fatality or injury was involved, but starting in 2007 all crashes on local roads meeting the crash reporting criteria (see Appendix I) are included. Consequently, in addition to the total number of crashes increasing for Connecticut starting in 2007, the proportion of fatal and injury crashes
3

State Data System: Crash Data Report 2000–2009
decreased. A similar dramatic change can be seen for Washington in 2001, when the State began to include crashes on county and local streets.
Other changes in reporting criteria—such as large increases in the minimum dollar amount of property damage—may also affect crash totals. For example, in 2009 the minimum dollar amount for reporting a property damage crash in Illinois increased from $500 to $1,500 (for crashes where all vehicles had insurance). The large decrease in property damage‐only crashes seen in Illinois in 2009 may have been partly a result of this new reporting criterion.
In addition, coding revisions may contribute to some of the large changes in certain State’s year to year totals. During the report period, many States added or dropped fields from their PARs or changed the attributes for a given field. When variables or attributes are added it may increase the ability to identify certain kinds of crashes, which results in higher counts for that particular kind of crash. For example, as part of their system redesign, Delaware added four vehicle‐level variables on sequence of event that provided new information on rollover. This change may have been responsible for the dramatic increase in rollover crashes reported by Delaware for 2007 (see Table 5: Motor Vehicle Crashes Reported to Have Rollovers/Overturned Vehicles).
Furthermore, it should be noted that although many large changes in yearly totals can be traced to the factors noted above, others may be due to issues at the State level that SDS cannot identify, such as changes in quality assurance or training programs. Appendix II “State Specific Notes” contain important information for each State that may impact the data reported and includes the crash criteria for each State and notes selected anomalies in data fields and reporting systems. It is beyond the scope of this report to identify all coding changes for all States during the report period.
Exposure Data
Changes in the number of crashes can also be viewed in terms of exposure data—such as population, the number of registered vehicles, and the number of miles traveled (VMT). Differences between States can also be a factor of demographic characteristics such as age, the amount of travel on various types of roadways (e.g., rural interstate vs. urban streets) and even the number and types of highway construction projects.
Exposure data is available in the Appendix III, “Exposure Data,” and contains the following tables:
Exposure Data 1: Population By State; Exposure Data 2: Vehicle Miles Traveled (by millions) by State; and Exposure Data 3: Number of Licensed Drivers by State.
Missing Data
The tables in this report reflect various types of missing data. For instance, one or more years of data have been omitted for some States because the State declined to make the data available to the SDS. Another example would be that more than one coding scheme was represented in a single year of data, and the SDS Techinical Manager determined that differences between the schemes were too extensive for translation.
In addition, over the course of ten years many States have modified their PARs by adding and dropping data items or changing their coding schemes. In some instances, it was possible to translate old coding schemes to new ones for this report; however, if changes were too extensive to translate, the older variable was omitted. In
4

State Data System: Crash Data Report 2000–2009
the tables, missing years of data are represented by a period (.) and the missing variables or attributes are represented by a pound symbol (#).
5

State Data System: Crash Data Report 2000–2009
CRASHES
6

State Data System: Crash Data Report 2000–2009
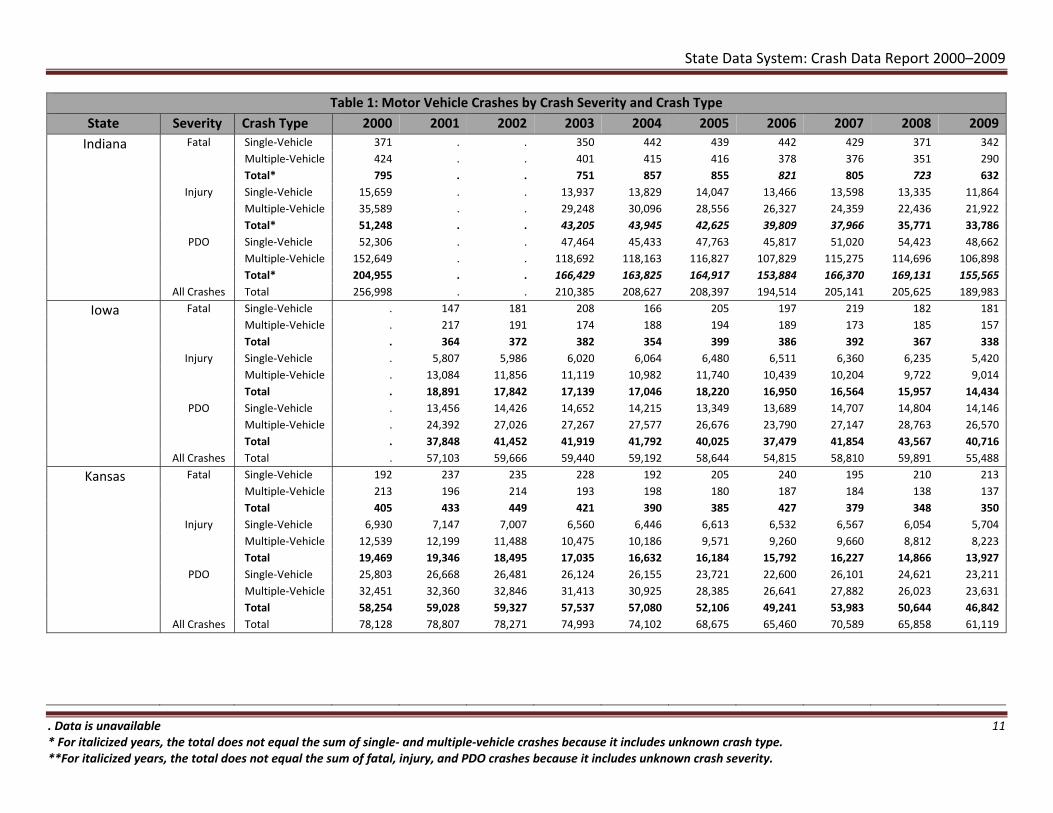
Table 1: Motor Vehicle Crashes by Crash Severity and Crash Type
Crash Type (single‐vehicle or multiple‐vehicle)
Crash type is usually derived from the variable “Number of Vehicles” in the States’ data. However, a few States (such as Delaware [2007–2008], New Mexico, and North Dakota) do not include this variable in their data. For these States, crash type was derived by counting the number of vehicles. Furthermore, some States include pedestrians or pedalcyclists or both in their number of vehicles variable, however, for the purpose of this report, if the State includes pedestrians and pedalcyclists then they are included in the multiple‐vehicle crash counts. Appendix II “State Specific Notes” identifies States that included non‐motorists in their “Number of Vehicles” variable. For States where the number of vehicles is not available—and consequently the crash type is derived by counting vehicles—pedestrians and pedalcyclists are excluded from the vehicle count. States for which crash type was derived in this manner are also identified in Appendix II.
In Table 1 “Motor Vehicle Crashes by Crash Severity and Crash Type,” all the unknown, missing, or undocumented values for the number of vehicles variable were grouped into an “unknown” category. The unknown single/multiple vehicle crashes are not shown as a separate category, but are included in the totals. Totals that include unknown single/multiple vehicle crashes are identified by a single asterisk (*) and are italicized for the applicable years.
Crash Severity
In the following table, crash severity is measured in terms of whether the crash involved a fatality, an injury without fatality, or property damage only (PDO). State definitions of crash severity vary and some States break down injury crashes into several categories (e.g., incapacitating injuries; visible, but not incapacitating injuries; possible, but not visible injuries; or injuries of unknown severity), while other States simply report an “Injury” crash. For the purposes of this report, all the types of injury crashes were combined into one category: “Injury Crash.”
Definitions of PDO crashes also vary significantly from State to State, and are usually dependent on a minimum dollar amount of damage resulting from the crash. The criteria for PDO crashes for each State are shown in Appendix II, “State Specific Notes – Reporting Criteria.”
In some States’ data, the crash severity variable has the attribute “unknown.” Unknown severity is treated differently in Table 1 depending on how the State treats it in its published crash statistics. For States that include unknown severity in PDO crash counts, unknown severity was also included in PDO crashes. For States that publish crash statistics with a separate category for unknown, unknowns are excluded from PDO but included in the total crash counts shown in the last row for the State; unknowns receive the same treatment for States that do not address unknown severity in their published statistics. States where unknown severity is not grouped with PDO, but is included in total crash counts, are identified with a double asterisk (**) and the applicable years are italicized.
7

State Data System: Crash Data Report 2000–2009
Table 1: Motor Vehicle Crashes by Crash Severity and Crash Type
State Severity Crash Type 2000 2001 2002 2003 2004 2005 2006 2007 2008 2009
Alabama Fatal Single‐Vehicle 501 498 534 489 582 540 620 582 537 463 Multiple‐Vehicle 408 408 398 411 454 482 454 428 350 312 Total 909 906 932 900 1,036 1,022 1,074 1,010 887 775
Injury Single‐Vehicle 10,237 9,919 10,338 10,322 10,899 11,004 11,276 10,386 9,507 9,129 Multiple‐Vehicle 19,915 20,161 20,699 20,443 21,023 20,427 19,288 17,927 16,119 16,286 Total 30,152 30,080 31,037 30,765 31,922 31,431 30,564 28,313 25,626 25,415
PDO Single‐Vehicle 20,084 20,679 22,082 21,880 22,194 21,751 21,610 20,609 20,176 21,358 Multiple‐Vehicle 82,286 83,551 86,934 87,579 91,507 90,234 86,689 85,390 77,310 75,955 Total 102,370 104,230 109,016 109,459 113,701 111,985 108,299 105,999 97,486 97,313
All Crashes Total 133,431 135,216 140,985 141,124 146,659 144,438 139,937 135,322 123,999 123,503
Arkansas Fatal Single‐Vehicle 349 321 330 335 349 338 370 348 353 314 Multiple‐Vehicle 229 217 227 229 277 258 226 236 199 215 Total 578 538 557 564 626 596 596 584 552 529
Injury Single‐Vehicle 7,061 7,519 7,987 8,392 9,879 9,687 10,413 8,720 7,185 6,677 Multiple‐Vehicle 15,989 18,542 20,137 20,929 23,062 22,987 23,510 17,984 14,324 12,809 Total 23,050 26,061 28,124 29,321 32,941 32,674 33,923 26,704 21,509 19,486
PDO Single‐Vehicle 11,039 9,399 9,238 10,284 9,516 7,976 7,641 9,272 10,383 11,077 Multiple‐Vehicle 36,034 32,798 32,984 30,744 30,976 28,267 25,325 29,833 30,702 31,716 Total* 47,073 42,197 42,222 41,029 40,492 36,243 32,966 39,105 41,085 42,793
All Crashes Total 70,701 68,796 70,903 70,914 74,059 69,513 67,485 66,393 63,146 62,808
California Fatal Single‐Vehicle 1,146 1,278 1,340 1,327 1,339 1,393 1,321 1,328 1,145 1,010 Multiple‐Vehicle 2,185 2,239 2,310 2,399 2,362 2,429 2,472 2,229 1,968 1,795 Total 3,331 3,517 3,650 3,726 3,701 3,822 3,793 3,557 3,113 2,805
Injury Single‐Vehicle 30,962 32,154 32,190 33,703 34,354 34,407 33,763 33,000 31,226 29,244 Multiple‐Vehicle 167,386 169,324 173,033 170,471 169,032 164,301 156,194 151,994 139,270 134,280 Total 198,348 201,478 205,223 204,174 203,386 198,708 189,957 184,994 170,496 163,524
PDO Single‐Vehicle 58,721 60,347 60,670 62,043 62,466 65,045 63,723 61,371 56,652 53,498 Multiple‐Vehicle 250,848 257,220 275,195 269,011 268,742 265,150 261,730 251,986 222,334 206,401 Total* 309,569 317,567 335,869 331,055 331,208 330,195 325,453 313,357 278,986 259,899
All Crashes Total 511,248 522,562 544,742 538,955 538,295 532,725 519,203 501,908 452,595 426,228
. Data is unavailable * For italicized years, the total does not equal the sum of single‐ and multiple‐vehicle crashes because it includes unknown crash type. **For italicized years, the total does not equal the sum of fatal, injury, and PDO crashes because it includes unknown crash severity.
8

State Data System: Crash Data Report 2000–2009
Table 1: Motor Vehicle Crashes by Crash Severity and Crash Type
State Severity Crash Type 2000 2001 2002 2003 2004 2005 2006 2007 2008 2009
Colorado Fatal
Injury
PDO
All Crashes
Single‐Vehicle Multiple‐Vehicle Total* Single‐Vehicle Multiple‐Vehicle Total* Single‐Vehicle Multiple‐Vehicle Total* Total
344 372 417 307 320 . . . . . 285 295 257 265 278 . . . . . 631 667 675 572 599 . . . . .
9,580 9,639 9,520 9,543 10,266 . . . . . 24,283 24,387 24,401 22,483 21,807 . . . . . 33,930 34,072 33,977 32,045 32,201 . . . . . 21,137 22,767 23,865 23,440 27,560 . . . . . 74,426 77,727 78,422 73,486 87,395 . . . . . 95,820 100,842 102,562 97,068 124,906 . . . . . 130,381 135,581 137,214 129,686 157,706 . . . . .
Connecticut Fatal Single‐Vehicle 183 159 184 164 160 150 152 149 166 132 Multiple‐Vehicle 136 131 117 113 120 112 141 120 114 82 Total 319 290 301 277 280 262 293 269 280 214
Injury Single‐Vehicle 7,699 7,297 6,892 7,025 7,281 7,174 6,573 7,189 6,649 6,494 Multiple‐Vehicle 26,749 26,830 24,741 23,922 23,579 22,255 20,793 21,321 19,417 19,244 Total 34,448 34,127 31,633 30,947 30,860 29,429 27,366 28,510 26,066 25,738
PDO Single‐Vehicle 10,720 10,692 9,551 10,925 11,316 11,351 9,072 18,747 17,815 18,089 Multiple‐Vehicle 37,300 38,147 37,188 38,747 39,314 38,520 34,992 65,539 60,026 59,678 Total 48,020 48,839 46,739 49,672 50,630 49,871 44,064 84,286 77,841 77,767
All Crashes Total 82,787 83,256 78,673 80,896 81,770 79,562 71,723 113,065 104,187 103,719
Delaware Fatal
Injury
PDO
All Crashes
Single‐Vehicle Multiple‐Vehicle Total Single‐Vehicle Multiple‐Vehicle Total Single‐Vehicle Multiple‐Vehicle Total Total**
57 56 61 60 64 . . 56 62 54 64 63 55 77 66 . . 47 42 42 121 119 116 137 130 . . 103 104 96
1,543 1,487 1,522 1,400 1,356 . . 1,493 1,471 1,432 4,865 4,532 4,650 4,245 3,517 . . 3,766 3,578 3,514 6,408 6,019 6,172 5,645 4,873 . . 5,259 5,049 4,946 2,698 2,756 2,911 3,340 2,930 . . 2,468 2,451 2,458 11,991 11,512 12,018 11,899 10,629 . . 9,987 9,829 9,221 14,689 14,268 14,929 15,239 13,559 . . 12,455 12,280 11,679 21,218 20,406 21,217 21,021 18,562 . . 17,819 17,434 16,723
. Data is unavailable * For italicized years, the total does not equal the sum of single‐ and multiple‐vehicle crashes because it includes unknown crash type. **For italicized years, the total does not equal the sum of fatal, injury, and PDO crashes because it includes unknown crash severity.
9

State Data System: Crash Data Report 2000–2009
Table 1: Motor Vehicle Crashes by Crash Severity and Crash Type
State Severity Crash Type 2000 2001 2002 2003 2004 2005 2006 2007 2008 2009
Florida Fatal Single‐Vehicle 1,302 1,246 1,270 1,365 1,362 1,505 1,466 1,427 1,353 1,262 Multiple‐Vehicle 1,431 1,471 1,546 1,515 1,574 1,680 1,618 1,525 1,392 1,109 Total 2,733 2,717 2,816 2,880 2,936 3,185 3,084 2,952 2,745 2,371
Injury Single‐Vehicle 26,711 26,980 26,649 26,787 27,660 29,356 29,482 30,210 29,618 28,506 Multiple‐Vehicle 117,384 118,228 116,343 112,104 114,728 118,523 107,800 106,319 98,415 97,165 Total* 144,096 145,208 142,992 138,891 142,388 147,879 137,282 136,534 128,043 125,681
PDO Single‐Vehicle 17,371 18,544 18,918 18,317 19,122 20,874 21,218 21,969 22,355 21,044 Multiple‐Vehicle 82,341 89,700 85,744 83,206 88,456 96,667 94,616 96,287 89,925 86,707 Total 99,712 108,244 104,662 101,523 107,578 117,541 115,834 118,256 112,280 107,751
All Crashes Total** 246,541 256,169 250,470 243,296 252,902 268,605 256,200 257,742 243,068 235,803
Georgia Fatal Single‐Vehicle 582 565 555 597 563 666 680 630 629 697 Multiple‐Vehicle 801 910 812 872 904 928 882 868 752 646 Total 1,383 1,475 1,367 1,469 1,467 1,594 1,562 1,498 1,381 1,349
Injury Single‐Vehicle 17,146 16,771 17,505 17,626 18,763 19,373 18,836 18,847 17,858 20,229 Multiple‐Vehicle 66,508 68,671 68,537 69,113 71,136 71,700 69,015 66,087 59,436 61,456 Total* 83,654 85,442 86,042 86,739 89,899 91,073 87,851 84,934 77,294 81,730
PDO Single‐Vehicle 37,908 38,484 39,965 41,680 42,248 43,435 41,852 42,249 42,177 46,953 Multiple‐Vehicle 186,788 192,412 200,336 202,433 209,013 211,550 211,269 207,375 185,509 188,427 Total* 224,696 230,896 240,301 244,113 251,261 254,986 253,121 249,624 227,686 235,452
All Crashes Total 309,733 317,813 327,710 332,321 342,627 347,653 342,534 336,056 306,361 318,531
Illinois Fatal Single‐Vehicle 698 673 701 695 647 653 629 638 542 441 Multiple‐Vehicle 575 601 572 613 576 580 507 488 408 391 Total 1,273 1,274 1,273 1,308 1,223 1,233 1,136 1,126 950 832
Injury Single‐Vehicle 25,018 23,793 24,760 24,819 23,314 23,019 22,704 23,812 22,225 20,524 Multiple‐Vehicle 66,813 62,203 62,625 63,664 60,631 56,364 52,671 49,396 45,616 42,859 Total* 91,831 85,996 87,385 88,483 83,945 79,384 75,375 73,208 67,841 63,383
PDO Single‐Vehicle 57,728 57,633 60,829 62,750 62,575 61,845 62,002 69,169 73,112 50,313 Multiple‐Vehicle 311,812 295,852 289,211 284,230 285,267 278,957 270,338 279,355 266,479 177,909 Total 369,540 353,485 350,040 346,980 347,842 340,802 332,340 348,524 339,591 228,222
All Crashes Total 462,644 440,755 438,698 436,771 433,010 421,419 408,851 422,858 408,382 292,437
. Data is unavailable * For italicized years, the total does not equal the sum of single‐ and multiple‐vehicle crashes because it includes unknown crash type. **For italicized years, the total does not equal the sum of fatal, injury, and PDO crashes because it includes unknown crash severity.
10
State Data System: Crash Data Report 2000–2009
Table 1: Motor Vehicle Crashes by Crash Severity and Crash Type
State Severity Crash Type 2000 2001 2002 2003 2004 2005 2006 2007 2008 2009
Indiana Fatal
Injury
PDO
All Crashes
Single‐Vehicle Multiple‐Vehicle Total* Single‐Vehicle Multiple‐Vehicle Total* Single‐Vehicle Multiple‐Vehicle Total* Total
371 . . 350 442 439 442 429 371 342 424 . . 401 415 416 378 376 351 290 795 . . 751 857 855 821 805 723 632
15,659 . . 13,937 13,829 14,047 13,466 13,598 13,335 11,864 35,589 . . 29,248 30,096 28,556 26,327 24,359 22,436 21,922 51,248 . . 43,205 43,945 42,625 39,809 37,966 35,771 33,786 52,306 . . 47,464 45,433 47,763 45,817 51,020 54,423 48,662 152,649 . . 118,692 118,163 116,827 107,829 115,275 114,696 106,898 204,955 . . 166,429 163,825 164,917 153,884 166,370 169,131 155,565 256,998 . . 210,385 208,627 208,397 194,514 205,141 205,625 189,983
Iowa Fatal
Injury
PDO
All Crashes
Single‐Vehicle Multiple‐Vehicle Total Single‐Vehicle Multiple‐Vehicle Total Single‐Vehicle Multiple‐Vehicle Total Total
. 147 181 208 166 205 197 219 182 181
. 217 191 174 188 194 189 173 185 157
. 364 372 382 354 399 386 392 367 338
. 5,807 5,986 6,020 6,064 6,480 6,511 6,360 6,235 5,420
. 13,084 11,856 11,119 10,982 11,740 10,439 10,204 9,722 9,014
. 18,891 17,842 17,139 17,046 18,220 16,950 16,564 15,957 14,434
. 13,456 14,426 14,652 14,215 13,349 13,689 14,707 14,804 14,146
. 24,392 27,026 27,267 27,577 26,676 23,790 27,147 28,763 26,570
. 37,848 41,452 41,919 41,792 40,025 37,479 41,854 43,567 40,716
. 57,103 59,666 59,440 59,192 58,644 54,815 58,810 59,891 55,488
Kansas Fatal Single‐Vehicle 192 237 235 228 192 205 240 195 210 213 Multiple‐Vehicle 213 196 214 193 198 180 187 184 138 137 Total 405 433 449 421 390 385 427 379 348 350
Injury Single‐Vehicle 6,930 7,147 7,007 6,560 6,446 6,613 6,532 6,567 6,054 5,704 Multiple‐Vehicle 12,539 12,199 11,488 10,475 10,186 9,571 9,260 9,660 8,812 8,223 Total 19,469 19,346 18,495 17,035 16,632 16,184 15,792 16,227 14,866 13,927
PDO Single‐Vehicle 25,803 26,668 26,481 26,124 26,155 23,721 22,600 26,101 24,621 23,211 Multiple‐Vehicle 32,451 32,360 32,846 31,413 30,925 28,385 26,641 27,882 26,023 23,631 Total 58,254 59,028 59,327 57,537 57,080 52,106 49,241 53,983 50,644 46,842
All Crashes Total 78,128 78,807 78,271 74,993 74,102 68,675 65,460 70,589 65,858 61,119
. Data is unavailable * For italicized years, the total does not equal the sum of single‐ and multiple‐vehicle crashes because it includes unknown crash type. **For italicized years, the total does not equal the sum of fatal, injury, and PDO crashes because it includes unknown crash severity.
11

State Data System: Crash Data Report 2000–2009
Table 1: Motor Vehicle Crashes by Crash Severity and Crash Type
State Severity Crash Type 2000 2001 2002 2003 2004 2005 2006 2007 2008 2009
Kentucky Fatal Single‐Vehicle 354 356 378 394 397 437 403 423 380 356 Multiple‐Vehicle 354 403 431 451 456 449 434 380 378 374 Total 708 759 809 845 853 886 837 803 758 730
Injury Single‐Vehicle 11,166 10,424 10,480 10,135 9,897 9,861 9,383 9,112 9,015 8,780 Multiple‐Vehicle 23,429 22,461 21,876 20,820 19,942 19,152 18,071 16,972 16,212 16,255 Total* 34,595 32,887 32,358 30,959 29,844 29,013 27,455 26,086 25,230 25,036
PDO Single‐Vehicle 20,665 20,282 21,334 22,181 22,232 21,403 22,224 22,336 23,809 24,181 Multiple‐Vehicle 79,099 76,272 75,839 75,827 80,772 78,066 76,736 75,316 73,286 76,285 Total* 99,773 96,558 97,179 98,024 103,020 99,474 98,960 97,664 97,099 100,471
All Crashes Total 135,076 130,204 130,346 129,828 133,717 129,373 127,252 124,553 123,087 126,237
Louisiana Fatal
Injury
PDO
All Crashes
Single‐Vehicle Multiple‐Vehicle Total* Single‐Vehicle Multiple‐Vehicle Total* Single‐Vehicle Multiple‐Vehicle Total* Total**
. . . . . 452 505 515 489 429
. . . . . 423 385 385 331 300
. . . . . 875 890 900 820 729
. . . . . 10,893 11,307 11,539 11,109 10,855
. . . . . 38,590 37,457 36,608 35,380 34,477
. . . . . 49,487 48,765 48,169 46,520 45,335
. . . . . 16,197 18,417 18,382 18,877 18,683
. . . . . 91,929 94,061 92,063 91,154 91,109
. . . . . 108,130 112,488 110,658 110,700 109,793
. . . . . 158,492 162,143 159,776 158,085 155,857
Maryland Fatal Single‐Vehicle 269 309 305 288 315 286 299 310 283 290 Multiple‐Vehicle 305 293 301 308 261 290 294 248 256 226 Total* 574 602 606 596 576 577 593 558 539 516
Injury Single‐Vehicle 10,578 10,715 10,789 11,009 10,472 10,290 10,572 10,690 10,174 9,899 Multiple‐Vehicle 27,265 27,848 27,543 27,860 26,708 26,204 25,270 24,099 22,602 22,459 Total* 37,844 38,563 38,332 38,869 37,180 36,494 35,842 34,789 32,776 32,358
PDO Single‐Vehicle 15,025 15,534 16,102 17,931 16,695 16,559 17,036 17,506 16,824 17,715 Multiple‐Vehicle 46,099 46,776 48,141 51,236 48,943 48,774 48,315 47,854 45,237 45,794 Total* 61,132 62,390 66,540 69,633 65,640 65,465 65,351 65,361 62,061 63,517
All Crashes Total 99,550 101,555 105,478 109,098 103,396 102,536 101,786 100,708 95,376 96,391
. Data is unavailable * For italicized years, the total does not equal the sum of single‐ and multiple‐vehicle crashes because it includes unknown crash type. **For italicized years, the total does not equal the sum of fatal, injury, and PDO crashes because it includes unknown crash severity.
12

State Data System: Crash Data Report 2000–2009
Table 1: Motor Vehicle Crashes by Crash Severity and Crash Type
State Severity Crash Type 2000 2001 2002 2003 2004 2005 2006 2007 2008 2009
Michigan Fatal Single‐Vehicle 611 590 597 612 540 521 551 528 500 439 Multiple‐Vehicle 662 588 616 608 545 545 474 496 445 397 Total* 1,273 1,236 1,213 1,220 1,085 1,066 1,025 1,024 945 836
Injury Single‐Vehicle 25,999 23,170 25,184 24,515 22,801 22,353 20,315 21,193 20,335 18,808 Multiple‐Vehicle 62,293 55,560 56,408 53,234 51,576 45,659 40,972 39,534 36,371 34,742 Total* 88,396 82,141 81,712 77,768 74,388 68,012 61,287 60,727 56,706 53,550
PDO Single‐Vehicle 121,172 114,078 119,896 119,187 111,078 108,143 100,556 108,598 110,446 102,263 Multiple‐Vehicle 215,916 189,265 194,180 194,689 187,894 175,039 153,689 155,149 149,348 136,754 Total* 337,174 319,034 314,138 313,879 298,973 283,182 254,245 263,747 259,794 239,017
All Crashes Total 426,843 402,411 397,063 392,867 374,446 352,260 316,557 325,498 317,445 293,403
Minnesota Fatal
Injury
PDO
All Crashes
Single‐Vehicle Multiple‐Vehicle Total Single‐Vehicle Multiple‐Vehicle Total* Single‐Vehicle Multiple‐Vehicle Total* Total
265 257 322 . 216 204 201 224 228 203 292 251 268 . 304 296 255 239 192 168 557 508 590 . 520 500 456 463 420 371
9,432 9,428 9,067 . 7,308 6,991 6,936 8,462 8,572 7,870 21,399 19,848 19,072 . 20,758 19,627 17,727 16,502 15,331 14,280 30,831 29,276 28,140 . 28,066 26,618 24,663 24,978 23,914 22,159 17,622 17,288 16,856 . 16,036 15,611 13,736 15,201 16,549 14,403 54,577 51,907 49,375 . 46,651 45,084 39,890 40,846 38,191 36,542 72,202 69,199 66,239 . 62,688 60,695 53,626 56,064 54,761 50,968 103,590 98,983 94,969 . 91,274 87,813 78,745 81,505 79,095 73,498
Missouri Fatal Single‐Vehicle 515 558 603 592 567 620 555 526 485 455 Multiple‐Vehicle 476 414 476 501 439 496 415 373 358 331 Total* 991 973 1,082 1,095 1,006 1,117 971 900 845 786
Injury Single‐Vehicle 15,507 14,999 15,739 15,278 15,630 15,370 14,604 14,649 13,877 13,398 Multiple‐Vehicle 34,212 33,323 32,226 30,674 30,213 29,284 27,554 26,334 24,154 23,601 Total* 49,719 48,322 47,981 45,967 45,854 44,658 42,163 40,987 38,040 37,005
PDO Single‐Vehicle 30,053 28,915 29,119 28,559 28,886 27,901 26,986 29,073 29,177 27,913 Multiple‐Vehicle 113,042 110,439 107,611 106,980 106,490 101,419 97,087 95,100 87,768 87,290 Total* 143,095 139,354 136,743 135,566 135,400 129,350 124,094 124,189 116,977 115,224
All Crashes Total 193,805 188,649 185,806 182,628 182,260 175,125 167,228 166,076 155,862 153,015
. Data is unavailable * For italicized years, the total does not equal the sum of single‐ and multiple‐vehicle crashes because it includes unknown crash type. **For italicized years, the total does not equal the sum of fatal, injury, and PDO crashes because it includes unknown crash severity.
13

State Data System: Crash Data Report 2000–2009
Table 1: Motor Vehicle Crashes by Crash Severity and Crash Type
State Severity Crash Type 2000 2001 2002 2003 2004 2005 2006 2007 2008 2009
Montana Fatal
Injury
PDO
All Crashes
Single‐Vehicle Multiple‐Vehicle Total Single‐Vehicle Multiple‐Vehicle Total Single‐Vehicle Multiple‐Vehicle Total Total**
123 134 162 160 148 158 159 171 134 . 80 67 70 76 61 66 67 78 74 . 203 201 232 236 209 224 226 249 208 .
3,171 2,637 2,829 2,884 2,704 2,672 2,847 2,638 2,693 . 3,887 3,589 3,655 3,357 3,295 3,393 3,397 3,353 3,100 . 7,058 6,226 6,484 6,241 5,999 6,065 6,244 5,991 5,793 . 6,217 5,927 6,740 6,880 6,038 6,518 6,437 6,277 6,594 . 8,888 9,518 10,096 9,912 9,530 9,570 9,272 9,321 9,332 .
15,105 15,445 16,836 16,792 15,568 16,088 15,709 15,598 15,926 . 22,366 21,877 23,552 23,270 21,781 22,378 22,182 21,844 21,971 .
Nebraska Fatal Single‐Vehicle 126 106 162 132 118 129 123 121 100 102 Multiple‐Vehicle 116 110 110 125 111 109 103 109 89 103 Total 242 216 272 257 229 238 226 230 189 205
Injury Single‐Vehicle 5,191 4,972 4,455 4,401 4,242 4,030 3,827 4,040 3,914 3,807 Multiple‐Vehicle 13,716 12,626 11,146 10,387 10,181 9,366 8,653 8,903 8,414 8,405 Total 18,907 17,598 15,601 14,788 14,423 13,396 12,480 12,943 12,328 12,212
PDO Single‐Vehicle 11,905 12,430 12,222 12,668 9,152 9,068 8,864 9,756 9,363 9,657 Multiple‐Vehicle 16,932 17,561 18,123 18,873 13,487 12,977 11,209 12,947 12,746 12,590 Total 28,837 29,991 30,345 31,541 22,639 22,045 20,073 22,703 22,109 22,247
All Crashes Total** 47,986 47,805 46,218 46,587 37,291 35,679 32,779 35,876 34,626 34,664
New Jersey Fatal
Injury
PDO
All Crashes
Single‐Vehicle Multiple‐Vehicle Total* Single‐Vehicle Multiple‐Vehicle Total* Single‐Vehicle Multiple‐Vehicle Total* Total
. 374 314 361 360 397 381 373 365 324
. 335 236 327 320 299 310 288 214 221
. 710 550 689 680 696 691 661 579 545
. 19,432 19,811 20,405 20,358 19,593 18,344 18,627 18,697 18,384
. 62,252 63,146 59,370 58,628 55,548 51,550 50,175 49,387 49,000
. 81,707 82,971 79,786 78,996 75,150 69,998 68,806 68,093 67,394
. 37,069 39,112 43,330 42,635 41,631 39,818 42,690 42,297 43,109
. 193,040 197,266 200,213 201,074 197,926 184,172 194,643 191,167 190,182
. 230,279 236,458 243,578 243,743 239,589 224,857 237,349 233,480 233,294
. 312,696 319,979 324,053 323,419 315,435 295,546 306,816 302,152 301,233
. Data is unavailable * For italicized years, the total does not equal the sum of single‐ and multiple‐vehicle crashes because it includes unknown crash type. **For italicized years, the total does not equal the sum of fatal, injury, and PDO crashes because it includes unknown crash severity.
14

State Data System: Crash Data Report 2000–2009
Table 1: Motor Vehicle Crashes by Crash Severity and Crash Type
State Severity Crash Type 2000 2001 2002 2003 2004 2005 2006 2007 2008 2009
New Mexico Fatal Single‐Vehicle 228 279 251 215 211 211 219 205 180 160 Multiple‐Vehicle 160 136 147 151 229 209 205 166 146 159 Total 388 415 398 366 440 420 424 371 326 319
Injury Single‐Vehicle 3,862 3,871 3,811 3,707 3,853 3,372 3,066 3,051 3,372 3,299 Multiple‐Vehicle 13,699 14,008 13,386 13,024 13,627 12,492 11,607 10,757 10,736 9,838 Total* 17,562 17,879 17,197 16,731 17,480 15,864 14,673 13,808 14,108 13,137
PDO Single‐Vehicle 6,334 6,684 6,523 6,432 7,232 6,340 6,500 6,842 7,064 7,001 Multiple‐Vehicle 23,648 25,258 25,495 24,600 27,136 26,403 27,721 28,083 28,083 25,756 Total* 29,982 31,942 32,018 31,032 34,368 32,743 34,221 34,925 35,148 32,757
All Crashes Total** 47,932 50,236 49,613 48,129 52,288 49,027 49,318 49,104 49,583 46,213
New York Fatal
Injury
PDO
All Crashes
Single‐Vehicle Multiple‐Vehicle Total Single‐Vehicle Multiple‐Vehicle Total* Single‐Vehicle Multiple‐Vehicle Total Total
754 . 786 762 767 788 761 689 694 620 604 . 604 589 602 520 569 531 466 440
1,358 . 1,390 1,351 1,369 1,308 1,330 1,220 1,160 1,060 51,497 . 48,363 46,523 45,208 44,549 42,827 43,750 43,332 42,031 143,163 . 130,769 120,978 109,761 102,094 95,484 95,367 91,562 91,857 194,661 . 179,132 167,514 154,980 146,643 138,311 139,117 134,894 133,888 57,754 . 17,108 19,371 19,437 21,082 40,000 58,847 60,764 58,429 148,462 . 56,080 58,690 56,972 56,815 91,059 123,922 119,413 121,597 206,216 . 73,188 78,061 76,409 77,897 131,059 182,769 180,177 180,026 402,235 . 253,710 246,926 232,758 225,848 270,700 323,106 316,231 314,974
North Carolina Fatal Single‐Vehicle 755 741 813 727 785 800 839 890 844 737 Multiple‐Vehicle 652 622 613 673 636 617 588 639 496 497 Total 1,407 1,363 1,426 1,400 1,421 1,417 1,427 1,529 1,340 1,234
Injury Single‐Vehicle 23,836 22,842 23,712 24,001 24,833 23,629 23,339 24,184 23,268 22,744 Multiple‐Vehicle 63,067 60,203 58,848 59,475 58,466 54,673 52,657 51,950 48,505 46,650 Total 86,903 83,045 82,560 83,476 83,299 78,302 75,996 76,134 71,773 69,394
PDO Single‐Vehicle 34,461 34,682 37,296 42,039 42,091 40,505 41,854 43,447 44,146 46,321 Multiple‐Vehicle 90,516 91,852 93,691 96,569 96,846 94,501 93,599 95,997 90,137 86,507 Total 124,977 126,534 130,987 138,608 138,937 135,006 135,453 139,444 134,283 132,828
All Crashes Total** 220,291 217,926 222,180 231,459 231,219 222,272 220,307 224,307 214,358 209,695
. Data is unavailable * For italicized years, the total does not equal the sum of single‐ and multiple‐vehicle crashes because it includes unknown crash type. **For italicized years, the total does not equal the sum of fatal, injury, and PDO crashes because it includes unknown crash severity.
15

State Data System: Crash Data Report 2000–2009
Table 1: Motor Vehicle Crashes by Crash Severity and Crash Type
State Severity Crash Type 2000 2001 2002 2003 2004 2005 2006 2007 2008 2009
North Dakota Fatal
Injury
PDO
All Crashes
Single‐Vehicle Multiple‐Vehicle Total Single‐Vehicle Multiple‐Vehicle Total* Single‐Vehicle Multiple‐Vehicle Total Total
. . . 51 55 73 69 66 61 68
. . . 44 40 33 32 29 35 48
. . . 95 95 106 101 95 96 116
. . . 1,256 1,028 1,108 1,152 1,151 1,182 771
. . . 1,992 1,677 1,643 1,549 1,853 1,880 1,677
. . . 3,248 2,705 2,751 2,701 3,004 3,062 2,450
. . . 6,416 6,829 6,160 6,189 6,499 6,280 6,754
. . . 6,810 7,301 6,827 6,103 6,646 6,948 8,366
. . . 13,226 14,130 12,987 12,292 13,145 13,228 15,120
. . . 16,569 16,930 15,844 15,094 16,244 16,386 17,686
Ohio Fatal Single‐Vehicle 514 551 557 459 481 508 499 527 487 419 Multiple‐Vehicle 726 707 727 709 681 721 643 636 612 526 Total 1,240 1,258 1,284 1,168 1,162 1,229 1,142 1,163 1,099 945
Injury Single‐Vehicle 24,336 21,711 22,610 23,449 22,773 22,424 20,699 21,148 21,689 19,269 Multiple‐Vehicle 81,195 73,260 72,764 71,521 71,285 66,217 62,598 58,573 55,651 54,021 Total* 105,543 94,971 95,374 94,970 94,058 88,641 83,297 79,721 77,340 73,290
PDO Single‐Vehicle 75,260 76,090 78,904 85,052 79,133 75,951 69,212 71,303 74,070 65,718 Multiple‐Vehicle 198,412 201,993 199,474 200,334 195,936 183,788 175,275 170,669 161,956 154,314 Total* 273,721 278,083 278,378 285,386 275,069 259,739 244,487 241,972 236,026 220,032
All Crashes Total** 386,122 387,075 386,076 392,683 381,639 358,590 334,206 329,082 321,243 299,040
Pennsylvania Fatal
Injury
PDO
All Crashes
Single‐Vehicle Multiple‐Vehicle Total Single‐Vehicle Multiple‐Vehicle Total* Single‐Vehicle Multiple‐Vehicle Total* Total**
770 752 . 775 750 810 640 599 802 608 626 626 . 658 612 687 769 794 556 535
1,396 1,378 . 1,433 1,362 1,497 1,409 1,393 1,358 1,143 31,420 28,779 . 30,556 30,309 29,643 20,489 20,990 28,207 24,425 56,687 49,738 . 48,194 47,299 44,638 47,834 46,429 34,914 37,351 88,107 78,524 . 78,750 77,608 74,281 68,323 67,419 63,130 61,776 27,965 24,409 . 29,815 28,349 28,206 24,654 27,545 29,784 25,527 29,783 26,981 . 29,404 29,758 28,797 33,948 34,264 28,197 30,559 57,748 51,391 . 59,219 58,107 57,003 58,602 61,809 57,981 56,086 147,251 131,293 . 139,402 137,077 132,781 128,334 130,621 124,902 121,298
. Data is unavailable * For italicized years, the total does not equal the sum of single‐ and multiple‐vehicle crashes because it includes unknown crash type. **For italicized years, the total does not equal the sum of fatal, injury, and PDO crashes because it includes unknown crash severity.
16

State Data System: Crash Data Report 2000–2009
Table 1: Motor Vehicle Crashes by Crash Severity and Crash Type
State Severity Crash Type 2000 2001 2002 2003 2004 2005 2006 2007 2008 2009
South Carolina Fatal Single‐Vehicle 444 446 470 437 461 476 461 500 440 421 Multiple‐Vehicle 504 516 479 468 485 504 512 485 401 396 Total 948 962 949 905 946 980 973 985 841 817
Injury Single‐Vehicle 7,886 8,029 8,248 8,231 8,532 8,053 8,512 8,848 8,778 8,451 Multiple‐Vehicle 24,406 24,343 24,179 24,152 23,965 23,507 23,816 23,231 22,275 22,635 Total 32,292 32,372 32,427 32,383 32,497 31,560 32,328 32,079 31,053 31,086
PDO Single‐Vehicle 15,429 14,030 16,902 15,834 15,539 15,698 15,905 16,118 16,674 17,032 Multiple‐Vehicle 55,443 52,779 58,000 59,763 61,047 63,745 63,743 62,885 58,684 57,929 Total 70,872 66,809 74,902 75,597 76,586 79,443 79,648 79,003 75,358 74,961
All Crashes Total 104,112 100,143 108,278 108,885 110,029 111,983 112,949 112,067 107,252 106,864
Texas Fatal
Injury
PDO
All Crashes
Single‐Vehicle Multiple‐Vehicle Total* Single‐Vehicle Multiple‐Vehicle Total* Single‐Vehicle Multiple‐Vehicle Total* Total**
1,709 1,734 . 1,740 1,694 1,680 1,718 1,663 1,705 1,595 1,537 1,585 . 1,631 1,573 1,476 1,397 1,434 1,411 1,198 3,246 3,319 . 3,371 3,267 3,156 3,118 3,098 3,116 2,793 45,810 46,113 . 41,923 40,348 41,375 40,032 40,753 39,746 38,345 159,660 160,879 . 148,871 139,930 142,358 132,892 131,652 120,190 116,688 205,470 206,992 . 190,800 180,285 183,751 173,036 172,519 159,944 155,044 38,053 39,646 . 46,360 49,431 49,864 49,064 54,902 51,970 53,116 72,078 73,933 . 199,119 195,235 207,351 194,035 208,482 205,500 198,710
110,131 113,579 . 245,479 244,671 257,218 243,140 263,420 257,472 251,835 318,847 323,890 . 459,725 447,037 463,830 437,290 458,289 439,527 428,667
Utah Fatal
Injury
PDO
All Crashes
Single‐Vehicle Multiple‐Vehicle Total Single‐Vehicle Multiple‐Vehicle Total* Single‐Vehicle Multiple‐Vehicle Total* Total**
181 140 165 151 147 . . . . . 137 119 111 111 111 . . . . . 318 259 276 262 258 . . . . .
5,200 5,245 5,242 5,097 5,410 . . . . . 14,364 14,088 14,115 13,187 14,014 . . . . . 19,564 19,333 19,552 18,285 19,424 . . . . . 7,746 8,298 7,946 7,992 8,395 . . . . . 25,522 24,816 25,188 23,850 25,827 . . . . . 33,268 33,114 33,540 31,842 34,222 . . . . . 53,150 52,706 53,370 50,389 53,905 . . . . .
. Data is unavailable * For italicized years, the total does not equal the sum of single‐ and multiple‐vehicle crashes because it includes unknown crash type. **For italicized years, the total does not equal the sum of fatal, injury, and PDO crashes because it includes unknown crash severity.
17

State Data System: Crash Data Report 2000–2009
Table 1: Motor Vehicle Crashes by Crash Severity and Crash Type
State Severity Crash Type 2000 2001 2002 2003 2004 2005 2006 2007 2008 2009
Virginia Fatal Single‐Vehicle 479 502 496 480 484 539 524 561 468 427 Multiple‐Vehicle 373 353 336 380 353 336 341 379 324 267 Total 852 855 832 860 837 875 865 940 792 694
Injury Single‐Vehicle 16,070 16,323 16,086 16,692 16,660 16,672 15,793 15,522 15,606 13,769 Multiple‐Vehicle 38,214 38,853 38,474 38,349 38,530 37,041 36,265 33,601 33,257 30,515 Total 54,284 55,176 54,560 55,041 55,190 53,713 52,058 49,123 48,863 44,284
PDO Single‐Vehicle 25,626 26,535 28,251 32,582 30,479 29,358 25,707 26,000 24,044 21,316 Multiple‐Vehicle 60,885 62,019 64,094 66,365 67,401 69,903 73,062 69,342 61,617 50,444 Total* 86,511 88,554 92,345 98,947 97,880 99,261 98,769 95,342 85,661 71,764
All Crashes Total 141,647 144,585 147,737 154,848 153,907 153,849 151,692 145,405 135,316 116,742
Washington Fatal Single‐Vehicle 140 321 363 335 303 336 329 303 274 285 Multiple‐Vehicle 163 259 255 221 222 246 249 231 209 176 Total* 303 580 619 557 526 585 578 535 484 462
Injury Single‐Vehicle 5,183 12,034 11,963 11,532 11,344 12,261 12,098 11,720 11,120 10,679 Multiple‐Vehicle 15,444 36,678 35,649 32,264 32,874 34,723 33,253 31,122 27,981 25,040 Total* 20,646 48,771 47,647 43,852 44,269 47,022 45,392 42,892 39,148 35,789
PDO Single‐Vehicle 7,754 16,085 17,265 17,966 18,035 19,755 19,818 20,280 19,491 17,540 Multiple‐Vehicle 20,411 60,782 63,586 65,460 64,884 69,834 70,641 69,381 64,798 56,278 Total* 28,186 76,901 80,851 83,427 82,921 89,590 90,459 89,663 84,291 73,819
All Crashes Total** 49,135 126,255 129,118 127,836 127,716 137,197 136,437 133,101 123,932 110,070
Wisconsin Fatal Single‐Vehicle 344 373 386 416 391 382 392 351 309 280 Multiple‐Vehicle 379 318 341 337 323 324 277 314 246 215 Total 723 691 727 753 714 706 669 665 555 495
Injury Single‐Vehicle 15,071 14,063 14,591 15,111 14,156 14,153 13,605 13,727 13,115 11,606 Multiple‐Vehicle 29,684 26,846 26,564 25,790 25,713 24,784 23,115 23,674 21,919 19,479 Total 44,755 40,909 41,155 40,901 39,869 38,937 36,720 37,401 35,034 31,085
PDO Single‐Vehicle 42,949 38,448 41,804 44,023 42,068 41,177 38,706 41,251 41,347 37,250 Multiple‐Vehicle 64,222 57,940 57,759 57,899 57,634 56,360 53,784 58,428 60,802 52,906 Total 107,171 96,388 99,563 101,922 99,702 97,537 92,490 99,679 102,149 90,156
All Crashes Total 152,649 137,988 141,445 143,576 140,285 137,180 129,879 137,745 137,738 121,736
. Data is unavailable * For italicized years, the total does not equal the sum of single‐ and multiple‐vehicle crashes because it includes unknown crash type. **For italicized years, the total does not equal the sum of fatal, injury, and PDO crashes because it includes unknown crash severity.
18

State Data System: Crash Data Report 2000–2009
Table 1: Motor Vehicle Crashes by Crash Severity and Crash Type
State Severity Crash Type 2000 2001 2002 2003 2004 2005 2006 2007 2008 2009
Wyoming Fatal Single‐Vehicle Multiple‐Vehicle
90 106 100 94 96 99 42 49 51 47 46 48
108 61
101 35
90 49
84 32
Total 132 155 151 141 142 147 169 136 139 116 Injury Single‐Vehicle 1,960 1,841 1,987 2,118 2,010 2,012 2,163 2,193 1,914 1,685
Multiple‐Vehicle 1,990 1,866 2,004 1,995 1,950 1,965 2,170 2,173 1,863 1,675 Total 3,950 3,707 3,991 4,113 3,960 3,977 4,333 4,366 3,777 3,360
PDO Single‐Vehicle 4,123 4,129 4,178 5,180 4,800 4,924 5,631 5,647 6,318 5,477 Multiple‐Vehicle 6,252 6,233 6,362 6,883 6,670 6,834 6,839 7,279 7,476 6,554 Total 10,375 10,362 10,540 12,063 11,470 11,758 12,470 12,926 13,794 12,031
All Crashes Total 14,457 14,224 14,682 16,317 15,572 15,882 16,972 17,428 17,710 15,507
. Data is unavailable * For italicized years, the total does not equal the sum of single‐ and multiple‐vehicle crashes because it includes unknown crash type. **For italicized years, the total does not equal the sum of fatal, injury, and PDO crashes because it includes unknown crash severity.
19

State Data System: Crash Data Report 2000–2009
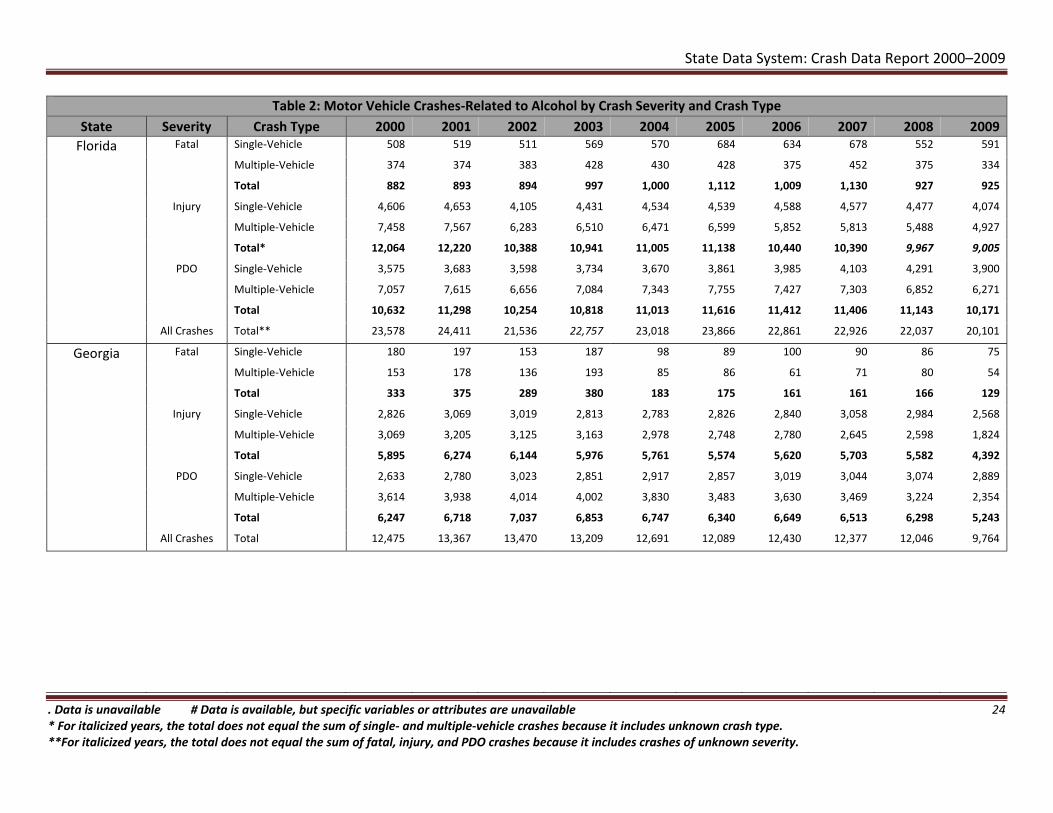
Table 2: Motor Vehicle Crashes‐Related to Alcohol by Crash Severity and Crash Type
This table indicates crashes where a driver of a motor vehicle, a pedestrian, or a pedalcyclist have positive blood alcohol concentration (BAC) or another indicator of alcohol consumption. It should be noted that the coding of alcohol‐related information varies greatly from State to State.
Alcohol‐related indicators that are available in the crash, vehicle, and person datasets were used for this table. Variables used include Contributing Factor(s), Driver/Non‐motorist Alcohol/Drug Involvement, Driver Condition, and Alcohol/Drug Test Results. Actual alcohol test results (BACs) are not provided by all the States. In general, if a BAC above .01 grams per deciliter (g/dL) was recorded for any driver, the crash was included in the alcohol‐related count. BACs coded as Unknown were not included in this count.
The unknown single‐ or multiple‐vehicle crashes are not shown as a separate category in this table, but are included in the totals. Totals that include unknown single‐/multiple‐vehicle crashes are identified by a single asterisk (*) and are italicized for the applicable years. Crashes where severity is unknown are not included in a separate row, but are included in the total crash count for the State. They can identified by a double asterisk (**) and are italicized for the specific years.
20

State Data System: Crash Data Report 2000–2009
Table 2: Motor Vehicle Crashes‐Related to Alcohol by Crash Severity and Crash Type
State Severity Crash Type 2000 2001 2002 2003 2004 2005 2006 2007 2008 2009 Alabama Fatal Single‐Vehicle 170 152 163 139 164 149 164 184 174 156
Multiple‐Vehicle 78 70 61 72 75 70 71 80 53 39
Total 248 222 224 211 239 219 235 264 227 195
Injury Single‐Vehicle 1,936 1,835 1,861 1,727 1,733 1,790 1,901 1,722 1,529 1,423
Multiple‐Vehicle 1,253 1,229 1,190 1,113 1,132 1,119 1,108 968 895 810
Total 3,189 3,064 3,051 2,840 2,865 2,909 3,009 2,690 2,424 2,233
PDO Single‐Vehicle 2,056 2,195 2,330 2,216 2,314 2,234 2,263 2,196 2,224 2,104
Multiple‐Vehicle 2,197 2,024 2,053 1,901 2,108 1,979 1,902 1,943 1,774 1,553
Total 4,253 4,219 4,383 4,117 4,422 4,213 4,165 4,139 3,998 3,657
All Crashes Total 7,690 7,505 7,658 7,168 7,526 7,341 7,409 7,093 6,649 6,085
Arkansas Fatal Single‐Vehicle 131 138 145 154 153 145 176 161 142 109
Multiple‐Vehicle 56 51 59 76 82 82 87 90 40 47
Total 187 189 204 230 235 227 263 251 182 156
Injury Single‐Vehicle 1,242 1,498 1,360 1,463 1,546 1,616 1,628 1,255 1,003 928
Multiple‐Vehicle 854 1,460 1,007 1,070 1,013 1,032 916 736 611 694
Total 2,096 2,958 2,367 2,533 2,559 2,648 2,544 1,991 1,614 1,622
PDO Single‐Vehicle 917 1,064 891 875 823 784 753 844 1,002 1,092
Multiple‐Vehicle 897 1,701 740 866 676 651 471 518 585 1,035
Total 1,814 2,765 1,631 1,741 1,499 1,435 1,224 1,362 1,587 2,127
All Crashes Total 4,097 5,912 4,202 4,504 4,293 4,310 4,031 3,604 3,383 3,905
. Data is unavailable # Data is available, but specific variables or attributes are unavailable * For italicized years, the total does not equal the sum of single‐ and multiple‐vehicle crashes because it includes unknown crash type. **For italicized years, the total does not equal the sum of fatal, injury, and PDO crashes because it includes crashes of unknown severity.
21

State Data System: Crash Data Report 2000–2009
Table 2: Motor Vehicle Crashes‐Related to Alcohol by Crash Severity and Crash Type
State Severity Crash Type 2000 2001 2002 2003 2004 2005 2006 2007 2008 2009 California Fatal Single‐Vehicle 518 588 585 574 626 634 643 627 581 526
Multiple‐Vehicle 743 787 794 818 839 888 908 827 733 679
Total 1,261 1,375 1,379 1,392 1,465 1,522 1,551 1,454 1,314 1,205
Injury Single‐Vehicle 7,276 7,676 7,797 7,802 8,023 7,901 8,235 8,450 8,032 7,350
Multiple‐Vehicle 13,485 13,922 14,135 14,041 14,055 14,025 13,870 13,646 12,788 11,907
Total 20,761 21,598 21,932 21,843 22,078 21,926 22,105 22,096 20,820 19,257
PDO Single‐Vehicle 9,015 9,398 9,711 9,970 10,200 10,674 11,253 11,557 11,340 10,737
Multiple‐Vehicle 16,440 17,449 18,987 19,009 19,588 19,863 20,873 20,994 19,606 17,852
Total 25,455 26,847 28,698 28,979 29,788 30,537 32,126 32,551 30,946 28,589
All Crashes Total 47,477 49,820 52,009 52,214 53,331 53,985 55,782 56,101 53,080 49,051
Colorado Fatal
Injury
PDO
All Crashes
Single‐Vehicle
Multiple‐Vehicle
Total
Single‐Vehicle
Multiple‐Vehicle
Total*
Single‐Vehicle
Multiple‐Vehicle
Total*
Total
123 134 141 116 110 . . . . .
43 68 58 52 59 . . . . .
166 202 199 168 169 . . . . .
1,814 1,812 1,790 1,658 1,717 . . . . .
1,665 1,670 1,624 1,374 1,350 . . . . .
3,480 3,483 3,422 3,035 3,068 . . . . .
1,688 1,900 1,938 1,843 2,153 . . . . .
2,405 2,476 2,461 2,173 2,612 . . . . .
4,100 4,387 4,410 4,021 4,768 . . . . .
7,746 8,072 8,031 7,224 8,005 . . . . .
. Data is unavailable # Data is available, but specific variables or attributes are unavailable * For italicized years, the total does not equal the sum of single‐ and multiple‐vehicle crashes because it includes unknown crash type. **For italicized years, the total does not equal the sum of fatal, injury, and PDO crashes because it includes crashes of unknown severity.
22

State Data System: Crash Data Report 2000–2009
Table 2: Motor Vehicle Crashes‐Related to Alcohol by Crash Severity and Crash Type
State Severity Crash Type 2000 2001 2002 2003 2004 2005 2006 2007 2008 2009 Connecticut Fatal Single‐Vehicle 80 87 74 80 74 63 72 72 68 72
Multiple‐Vehicle 39 43 40 38 25 31 38 36 36 33
Total 119 130 114 118 99 94 110 108 104 105
Injury Single‐Vehicle 506 457 443 431 455 468 437 442 431 537
Multiple‐Vehicle 619 586 519 518 467 482 454 423 419 465
Total 1,125 1,043 962 949 922 950 891 865 850 1,002
PDO Single‐Vehicle 399 411 398 404 442 456 414 786 772 993
Multiple‐Vehicle 356 383 313 365 363 369 367 690 652 722
Total 755 794 711 769 805 825 781 1,476 1,424 1,715
All Crashes Total 1,999 1,967 1,787 1,836 1,826 1,869 1,782 2,449 2,378 2,822
Delaware Fatal
Injury
PDO
All Crashes
Single‐Vehicle
Multiple‐Vehicle
Total
Single‐Vehicle
Multiple‐Vehicle
Total
Single‐Vehicle
Multiple‐Vehicle
Total
Total**
35 30 30 33 34 . . 24 31 29
23 24 16 27 14 . . 15 13 12
58 54 46 60 48 . . 39 44 41
377 367 373 322 297 . . 262 262 208
394 373 397 322 282 . . 220 189 191
771 740 770 644 579 . . 482 451 399
454 490 498 478 444 . . 354 329 324
495 562 564 501 485 . . 462 389 369
949 1,052 1,062 979 929 . . 816 718 693
1,778 1,846 1,878 1,683 1,556 . . 1,337 1,213 1,134
. Data is unavailable # Data is available, but specific variables or attributes are unavailable * For italicized years, the total does not equal the sum of single‐ and multiple‐vehicle crashes because it includes unknown crash type. **For italicized years, the total does not equal the sum of fatal, injury, and PDO crashes because it includes crashes of unknown severity.
23
State Data System: Crash Data Report 2000–2009
Table 2: Motor Vehicle Crashes‐Related to Alcohol by Crash Severity and Crash Type
State Severity Crash Type 2000 2001 2002 2003 2004 2005 2006 2007 2008 2009 Florida Fatal Single‐Vehicle 508 519 511 569 570 684 634 678 552 591
Multiple‐Vehicle 374 374 383 428 430 428 375 452 375 334
Total 882 893 894 997 1,000 1,112 1,009 1,130 927 925
Injury Single‐Vehicle 4,606 4,653 4,105 4,431 4,534 4,539 4,588 4,577 4,477 4,074
Multiple‐Vehicle 7,458 7,567 6,283 6,510 6,471 6,599 5,852 5,813 5,488 4,927
Total* 12,064 12,220 10,388 10,941 11,005 11,138 10,440 10,390 9,967 9,005
PDO Single‐Vehicle 3,575 3,683 3,598 3,734 3,670 3,861 3,985 4,103 4,291 3,900
Multiple‐Vehicle 7,057 7,615 6,656 7,084 7,343 7,755 7,427 7,303 6,852 6,271
Total 10,632 11,298 10,254 10,818 11,013 11,616 11,412 11,406 11,143 10,171
All Crashes Total** 23,578 24,411 21,536 22,757 23,018 23,866 22,861 22,926 22,037 20,101
Georgia Fatal Single‐Vehicle 180 197 153 187 98 89 100 90 86 75
Multiple‐Vehicle 153 178 136 193 85 86 61 71 80 54
Total 333 375 289 380 183 175 161 161 166 129
Injury Single‐Vehicle 2,826 3,069 3,019 2,813 2,783 2,826 2,840 3,058 2,984 2,568
Multiple‐Vehicle 3,069 3,205 3,125 3,163 2,978 2,748 2,780 2,645 2,598 1,824
Total 5,895 6,274 6,144 5,976 5,761 5,574 5,620 5,703 5,582 4,392
PDO Single‐Vehicle 2,633 2,780 3,023 2,851 2,917 2,857 3,019 3,044 3,074 2,889
Multiple‐Vehicle 3,614 3,938 4,014 4,002 3,830 3,483 3,630 3,469 3,224 2,354
Total 6,247 6,718 7,037 6,853 6,747 6,340 6,649 6,513 6,298 5,243
All Crashes Total 12,475 13,367 13,470 13,209 12,691 12,089 12,430 12,377 12,046 9,764
. Data is unavailable # Data is available, but specific variables or attributes are unavailable * For italicized years, the total does not equal the sum of single‐ and multiple‐vehicle crashes because it includes unknown crash type. **For italicized years, the total does not equal the sum of fatal, injury, and PDO crashes because it includes crashes of unknown severity.
24

State Data System: Crash Data Report 2000–2009
Table 2: Motor Vehicle Crashes‐Related to Alcohol by Crash Severity and Crash Type
State Severity Crash Type 2000 2001 2002 2003 2004 2005 2006 2007 2008 2009 Illinois Fatal Single‐Vehicle 304 266 297 308 308 259 280 279 263 191
Multiple‐Vehicle 152 169 174 162 166 148 167 152 111 119
Total 456 435 471 470 474 407 447 431 374 310
Injury Single‐Vehicle 2,872 2,820 3,008 3,289 3,211 3,265 2,966 2,896 2,763 2,535
Multiple‐Vehicle 3,463 3,130 3,158 3,348 3,033 2,904 2,805 2,641 2,400 2,071
Total 6,335 5,950 6,166 6,637 6,244 6,169 5,771 5,537 5,163 4,606
PDO Single‐Vehicle 2,914 2,934 3,184 3,431 3,448 3,624 3,903 4,150 3,936 3,026
Multiple‐Vehicle 6,642 5,947 5,837 6,009 5,878 6,447 5,914 6,072 5,354 3,846
Total 9,556 8,881 9,021 9,440 9,326 10,071 9,817 10,222 9,290 6,872
All Crashes Total 16,347 15,266 15,658 16,547 16,044 16,647 16,035 16,190 14,827 11,788
Indiana Fatal
Injury
PDO
All Crashes
Single‐Vehicle
Multiple‐Vehicle
Total*
Single‐Vehicle
Multiple‐Vehicle
Total*
Single‐Vehicle
Multiple‐Vehicle
Total*
Total
136 . . 123 164 142 174 168 139 106
79 . . 76 58 100 75 59 72 50
215 . . 199 222 242 250 227 211 156
2,563 . . 2,408 2,291 2,278 2,311 2,122 1,882 1,701
2,286 . . 2,322 2,294 2,332 1,833 1,400 1,233 1,165
4,849 . . 4,732 4,587 4,613 4,145 3,524 3,115 2,866
2,877 . . 3,339 2,906 2,942 3,084 2,827 2,861 2,724
3,936 . . 5,306 5,297 5,429 4,097 3,016 2,783 2,671
6,813 . . 8,651 8,209 8,378 7,190 5,844 5,644 5,395
11,877 . . 13,582 13,018 13,233 11,585 9,595 8,970 8,417
. Data is unavailable # Data is available, but specific variables or attributes are unavailable * For italicized years, the total does not equal the sum of single‐ and multiple‐vehicle crashes because it includes unknown crash type. **For italicized years, the total does not equal the sum of fatal, injury, and PDO crashes because it includes crashes of unknown severity.
25

State Data System: Crash Data Report 2000–2009
Table 2: Motor Vehicle Crashes‐Related to Alcohol by Crash Severity and Crash Type
State Severity Crash Type 2000 2001 2002 2003 2004 2005 2006 2007 2008 2009 Iowa Fatal
Injury
PDO
All Crashes
Single‐Vehicle
Multiple‐Vehicle
Total
Single‐Vehicle
Multiple‐Vehicle
Total
Single‐Vehicle
Multiple‐Vehicle
Total
Total
. 63 74 79 50 63 71 73 61 70
. 37 47 28 28 31 31 23 17 28
. 100 121 107 78 94 102 96 78 98
. 709 775 787 826 893 1,034 928 829 800
. 495 467 439 463 499 525 489 484 442
. 1,204 1,242 1,226 1,289 1,392 1,559 1,417 1,313 1,242
. 478 608 634 573 611 685 704 711 689
. 555 640 602 654 698 723 821 849 787
. 1,033 1,248 1,236 1,227 1,309 1,408 1,525 1,560 1,476
. 2,337 2,611 2,569 2,594 2,795 3,069 3,038 2,951 2,816
Kansas Fatal Single‐Vehicle 53 82 88 72 75 77 88 92 102 93
Multiple‐Vehicle 39 28 46 32 32 28 35 32 35 33
Total 92 110 134 104 107 105 123 124 137 126
Injury Single‐Vehicle 1,215 1,347 1,236 1,108 1,084 1,079 1,168 1,105 1,067 1,073
Multiple‐Vehicle 692 685 580 574 489 444 475 438 444 420
Total 1,907 2,032 1,816 1,682 1,573 1,523 1,643 1,543 1,511 1,493
PDO Single‐Vehicle 1,284 1,347 1,347 1,377 1,346 1,200 1,287 1,402 1,429 1,321
Multiple‐Vehicle 714 701 772 647 614 555 521 522 556 457
Total 1,998 2,048 2,119 2,024 1,960 1,755 1,808 1,924 1,985 1,778
All Crashes Total 3,997 4,190 4,069 3,810 3,640 3,383 3,574 3,591 3,633 3,397
. Data is unavailable # Data is available, but specific variables or attributes are unavailable * For italicized years, the total does not equal the sum of single‐ and multiple‐vehicle crashes because it includes unknown crash type. **For italicized years, the total does not equal the sum of fatal, injury, and PDO crashes because it includes crashes of unknown severity.
26

State Data System: Crash Data Report 2000–2009
Table 2: Motor Vehicle Crashes‐Related to Alcohol by Crash Severity and Crash Type
State Severity Crash Type 2000 2001 2002 2003 2004 2005 2006 2007 2008 2009 Kentucky Fatal Single‐Vehicle 125 102 116 119 123 135 117 132 90 89
Multiple‐Vehicle 55 55 68 56 67 66 52 45 62 48
Total 180 157 184 175 190 201 169 177 152 137
Injury Single‐Vehicle 1,745 1,566 1,534 1,431 1,336 1,335 1,304 1,279 1,109 1,044
Multiple‐Vehicle 1,200 1,128 1,115 990 958 885 877 757 789 779
Total* 2,945 2,694 2,649 2,422 2,294 2,220 2,182 2,036 1,898 1,823
PDO Single‐Vehicle 1,253 1,307 1,256 1,306 1,354 1,303 1,404 1,400 1,363 1,433
Multiple‐Vehicle 1,732 1,682 1,706 1,648 1,714 1,691 1,575 1,513 1,555 1,507
Total* 2,985 2,989 2,962 2,954 3,069 2,995 2,979 2,913 2,918 2,940
All Crashes Total 6,110 5,840 5,795 5,551 5,553 5,416 5,330 5,126 4,968 4,900
Louisiana Fatal
Injury
PDO
All Crashes
Single‐Vehicle
Multiple‐Vehicle
Total
Single‐Vehicle
Multiple‐Vehicle
Total*
Single‐Vehicle
Multiple‐Vehicle
Total
Total**
. . . . . 224 287 291 282 247
. . . . . 148 134 155 124 116
. . . . . 372 421 446 406 363
. . . . . 2,143 2,211 2,407 2,272 2,220
. . . . . 2,200 2,202 2,062 2,033 1,935
. . . . . 4,343 4,414 4,469 4,310 4,156
. . . . . 2,095 2,257 2,382 2,460 2,447
. . . . . 2,466 2,285 2,378 2,358 2,358
. . . . . 4,561 4,542 4,760 4,818 4,805
. . . . . 9,276 9,377 9,675 9,536 9,324
. Data is unavailable # Data is available, but specific variables or attributes are unavailable * For italicized years, the total does not equal the sum of single‐ and multiple‐vehicle crashes because it includes unknown crash type. **For italicized years, the total does not equal the sum of fatal, injury, and PDO crashes because it includes crashes of unknown severity.
27

State Data System: Crash Data Report 2000–2009
Table 2: Motor Vehicle Crashes‐Related to Alcohol by Crash Severity and Crash Type
State Severity Crash Type 2000 2001 2002 2003 2004 2005 2006 2007 2008 2009 Maryland Fatal Single‐Vehicle 103 110 104 101 143 133 135 133 117 78
Multiple‐Vehicle 68 71 61 56 74 74 81 76 71 47
Total 171 181 165 157 217 207 216 209 188 125
Injury Single‐Vehicle 1,554 1,609 1,586 1,511 1,482 1,453 1,530 1,585 1,336 1,317
Multiple‐Vehicle 1,768 1,695 1,691 1,609 1,548 1,585 1,601 1,453 1,359 1,329
Total 3,322 3,304 3,277 3,120 3,030 3,038 3,131 3,038 2,695 2,646
PDO Single‐Vehicle 1,700 1,776 1,737 2,008 1,945 1,843 2,023 1,988 1,878 1,924
Multiple‐Vehicle 2,771 2,610 2,696 2,770 2,770 2,775 2,674 2,725 2,512 2,664
Total* 4,471 4,386 4,592 4,835 4,715 4,629 4,697 4,713 4,390 4,588
All Crashes Total 7,964 7,871 8,034 8,112 7,962 7,874 8,044 7,960 7,273 7,359
Michigan Fatal Single‐Vehicle 275 293 265 271 237 232 243 239 222 198
Multiple‐Vehicle 152 133 146 119 122 116 120 105 95 93
Total* 427 445 411 390 359 348 363 344 317 291
Injury Single‐Vehicle 4,230 3,814 4,128 3,977 3,648 3,479 3,362 3,236 2,861 2,818
Multiple‐Vehicle 3,592 3,149 3,154 2,946 2,806 2,453 2,274 2,133 1,808 1,734
Total* 7,832 7,230 7,294 6,927 6,454 5,932 5,636 5,369 4,669 4,552
PDO Single‐Vehicle 5,533 4,835 5,205 5,053 4,894 4,764 4,390 4,343 4,080 3,883
Multiple‐Vehicle 4,944 4,533 4,640 4,337 4,413 3,955 3,532 3,527 3,254 2,934
Total* 10,477 9,864 9,846 9,390 9,307 8,719 7,922 7,870 7,334 6,817
All Crashes Total 18,736 17,539 17,551 16,707 16,120 14,999 13,921 13,583 12,320 11,660
. Data is unavailable # Data is available, but specific variables or attributes are unavailable * For italicized years, the total does not equal the sum of single‐ and multiple‐vehicle crashes because it includes unknown crash type. **For italicized years, the total does not equal the sum of fatal, injury, and PDO crashes because it includes crashes of unknown severity.
28

State Data System: Crash Data Report 2000–2009
Table 2: Motor Vehicle Crashes‐Related to Alcohol by Crash Severity and Crash Type
State Severity Crash Type 2000 2001 2002 2003 2004 2005 2006 2007 2008 2009 Minnesota Fatal
Injury
PDO
All Crashes
Single‐Vehicle
Multiple‐Vehicle
Total
Single‐Vehicle
Multiple‐Vehicle
Total
Single‐Vehicle
Multiple‐Vehicle
Total*
Total
142 126 153 . 99 108 107 114 24 24
77 56 52 . 67 73 54 57 15 11
219 182 205 . 166 181 161 171 39 35
# # # . # # # # 885 828
# # # . # # # # 560 493
# # # . # # # # 1,445 1,321
# # # . # # # # 804 760
# # # . # # # # 680 711
# # # . # # # # 1,484 1,472
# # # . # # # # 2,968 2,828
Missouri Fatal Single‐Vehicle 143 176 199 182 159 179 183 172 177 170
Multiple‐Vehicle 77 65 71 66 59 74 58 53 59 64
Total* 220 241 270 249 218 253 241 225 236 234
Injury Single‐Vehicle 2,471 2,450 2,533 2,315 2,417 2,324 2,365 2,274 2,111 2,120
Multiple‐Vehicle 1,561 1,474 1,390 1,289 1,276 1,217 1,168 1,061 1,005 916
Total* 4,032 3,924 3,923 3,604 3,693 3,541 3,534 3,335 3,118 3,036
PDO Single‐Vehicle 2,087 2,135 2,183 2,221 2,306 2,189 2,346 2,346 2,349 2,330
Multiple‐Vehicle 2,079 2,093 2,105 2,008 2,085 1,904 1,845 1,881 1,671 1,632
Total* 4,166 4,228 4,289 4,229 4,391 4,094 4,191 4,228 4,020 3,962
All Crashes Total 8,418 8,393 8,482 8,082 8,302 7,888 7,966 7,788 7,374 7,232
. Data is unavailable # Data is available, but specific variables or attributes are unavailable * For italicized years, the total does not equal the sum of single‐ and multiple‐vehicle crashes because it includes unknown crash type. **For italicized years, the total does not equal the sum of fatal, injury, and PDO crashes because it includes crashes of unknown severity.
29

State Data System: Crash Data Report 2000–2009
Table 2: Motor Vehicle Crashes‐Related to Alcohol by Crash Severity and Crash Type
State Severity Crash Type 2000 2001 2002 2003 2004 2005 2006 2007 2008 2009 Montana Fatal
Injury
PDO
All Crashes
Single‐Vehicle
Multiple‐Vehicle
Total
Single‐Vehicle
Multiple‐Vehicle
Total
Single‐Vehicle
Multiple‐Vehicle
Total
Total**
63 55 67 74 65 75 81 102 67 .
17 15 21 22 12 19 19 21 24 .
80 70 88 96 77 94 100 123 91 .
900 705 820 799 807 769 815 765 809 .
379 367 380 359 348 320 368 369 339 .
1,279 1,072 1,200 1,158 1,155 1,089 1,183 1,134 1,148 .
593 580 663 652 624 644 689 691 717 .
446 453 516 488 489 488 494 489 515 .
1,039 1,033 1,179 1,140 1,113 1,132 1,183 1,180 1,232 .
2,398 2,175 2,467 2,394 2,345 2,315 2,466 2,438 2,471 .
Nebraska Fatal Single‐Vehicle 55 53 72 70 65 52 56 62 50 64
Multiple‐Vehicle 34 37 35 37 26 24 27 22 17 47
Total 89 90 107 107 91 76 83 84 67 111
Injury Single‐Vehicle 706 605 717 731 748 729 721 689 697 655
Multiple‐Vehicle 593 514 551 474 524 514 428 479 436 405
Total 1,299 1,119 1,268 1,205 1,272 1,243 1,149 1,168 1,133 1,060
PDO Single‐Vehicle 650 573 891 865 715 733 735 798 806 753
Multiple‐Vehicle 313 362 432 421 325 319 315 353 349 294
Total 963 935 1,323 1,286 1,040 1,052 1,050 1,151 1,155 1,047
All Crashes Total 2,351 2,144 2,698 2,598 2,403 2,371 2,282 2,403 2,355 2,218
. Data is unavailable # Data is available, but specific variables or attributes are unavailable * For italicized years, the total does not equal the sum of single‐ and multiple‐vehicle crashes because it includes unknown crash type. **For italicized years, the total does not equal the sum of fatal, injury, and PDO crashes because it includes crashes of unknown severity.
30

State Data System: Crash Data Report 2000–2009
Table 2: Motor Vehicle Crashes‐Related to Alcohol by Crash Severity and Crash Type
State Severity Crash Type 2000 2001 2002 2003 2004 2005 2006 2007 2008 2009 New Jersey Fatal
Injury
PDO
All Crashes
Single‐Vehicle
Multiple‐Vehicle
Total*
Single‐Vehicle
Multiple‐Vehicle
Total*
Single‐Vehicle
Multiple‐Vehicle
Total*
Total
. 62 47 76 49 80 72 64 61 70
. 47 33 35 41 35 41 47 24 31
. 109 80 112 90 115 113 111 85 101
. 2,055 2,061 1,951 1,885 1,819 1,874 1,861 1,840 1,830
. 2,259 2,317 2,076 2,041 2,065 2,042 1,906 1,804 1,773
. 4,315 4,379 4,027 3,928 3,885 3,925 3,767 3,644 3,603
. 2,125 2,155 2,334 2,293 2,279 2,296 2,298 2,393 2,270
. 3,576 3,566 3,429 3,651 3,541 3,428 3,433 3,371 3,111
. 5,701 5,721 5,763 5,944 5,820 5,738 5,731 5,764 5,381
. 10,125 10,180 9,902 9,962 9,820 9,776 9,609 9,493 9,085
New Mexico Fatal Single‐Vehicle 107 139 137 110 84 83 107 85 72 83
Multiple‐Vehicle 73 49 65 74 93 84 81 72 58 53
Total 180 188 202 184 177 167 188 157 130 136
Injury Single‐Vehicle 785 773 771 752 693 587 540 473 567 591
Multiple‐Vehicle 978 984 962 955 886 659 678 628 624 576
Total 1,763 1,757 1,733 1,707 1,579 1,246 1,218 1,101 1,191 1,167
PDO Single‐Vehicle 697 685 715 752 726 584 665 624 743 756
Multiple‐Vehicle 772 843 846 846 838 697 700 660 744 699
Total 1,469 1,528 1,561 1,598 1,564 1,281 1,365 1,284 1,487 1,455
All Crashes Total 3,412 3,473 3,496 3,489 3,320 2,694 2,771 2,542 2,808 2,758
. Data is unavailable # Data is available, but specific variables or attributes are unavailable * For italicized years, the total does not equal the sum of single‐ and multiple‐vehicle crashes because it includes unknown crash type. **For italicized years, the total does not equal the sum of fatal, injury, and PDO crashes because it includes crashes of unknown severity.
31

State Data System: Crash Data Report 2000–2009
Table 2: Motor Vehicle Crashes‐Related to Alcohol by Crash Severity and Crash Type
State Severity Crash Type 2000 2001 2002 2003 2004 2005 2006 2007 2008 2009 New York Fatal
Injury
PDO
All Crashes
Single‐Vehicle
Multiple‐Vehicle
Total
Single‐Vehicle
Multiple‐Vehicle
Total*
Single‐Vehicle
Multiple‐Vehicle
Total
Total**
215 . 150 118 121 140 112 112 115 98
97 . 71 54 64 51 57 52 41 50
312 . 221 172 185 191 169 164 156 148
3,065 . 2,992 2,645 2,638 2,694 2,704 2,555 2,413 2,387
2,854 . 2,783 2,448 2,403 2,271 2,241 2,283 2,192 2,139
5,919 . 5,775 5,093 5,042 4,965 4,945 4,838 4,605 4,526
1,844 . 65 9 23 67 1,355 2,244 2,239 2,121
1,772 . 160 18 26 83 1,081 1,780 1,723 1,645
3,616 . 225 27 49 150 2,436 4,024 3,962 3,766
9,847 . 6,221 5,293 5,277 5,307 7,551 9,027 8,724 8,441
North Fatal Single‐Vehicle 324 254 271 254 262 301 278 348 320 290
Carolina Multiple‐Vehicle 131 104 107 109 125 102 101 123 97 85
Total 455 358 378 363 387 403 379 471 417 375
Injury Single‐Vehicle 4,318 4,486 4,349 3,986 4,272 4,268 4,083 4,340 4,383 3,944
Multiple‐Vehicle 3,764 3,703 3,112 2,779 2,773 2,593 2,413 2,374 2,258 2,184
Total 8,082 8,189 7,461 6,765 7,045 6,861 6,496 6,714 6,641 6,128
PDO Single‐Vehicle 2,666 2,954 2,821 2,925 3,068 2,901 3,203 3,136 3,368 3,323
Multiple‐Vehicle 3,376 3,737 2,855 2,446 2,386 2,388 2,313 2,320 2,252 2,055
Total 6,042 6,691 5,676 5,371 5,454 5,289 5,516 5,456 5,620 5,378
All Crashes Total** 14,867 15,511 13,782 12,716 13,081 12,798 12,665 12,853 12,924 12,081
. Data is unavailable # Data is available, but specific variables or attributes are unavailable * For italicized years, the total does not equal the sum of single‐ and multiple‐vehicle crashes because it includes unknown crash type. **For italicized years, the total does not equal the sum of fatal, injury, and PDO crashes because it includes crashes of unknown severity.
32

State Data System: Crash Data Report 2000–2009
Table 2: Motor Vehicle Crashes‐Related to Alcohol by Crash Severity and Crash Type
State Severity Crash Type 2000 2001 2002 2003 2004 2005 2006 2007 2008 2009 North Dakota Fatal
Injury
PDO
All Crashes
Single‐Vehicle
Multiple‐Vehicle
Total
Single‐Vehicle
Multiple‐Vehicle
Total*
Single‐Vehicle
Multiple‐Vehicle
Total
Total
. . . 28 23 33 39 44 31 31
. . . 20 5 7 7 9 9 12
. . . 48 28 40 46 53 40 43
. . . 315 244 272 289 281 246 157
. . . 132 152 141 129 126 132 127
. . . 447 396 413 418 407 378 285
. . . 293 287 274 243 269 327 348
. . . 310 310 331 306 291 309 352
. . . 603 597 605 549 560 636 700
. . . 1,098 1,021 1,058 1,013 1,020 1,054 1,028
Ohio Fatal Single‐Vehicle 197 240 298 242 256 270 268 260 243 223
Multiple‐Vehicle 139 149 191 195 176 186 200 178 182 138
Total 336 389 489 437 432 456 468 438 425 361
Injury Single‐Vehicle 4,774 4,633 4,699 4,337 4,304 4,276 4,050 3,904 3,624 3,428
Multiple‐Vehicle 4,639 3,881 3,826 3,591 3,571 3,426 3,193 2,745 2,767 2,505
Total* 9,414 8,514 8,525 7,928 7,875 7,702 7,243 6,649 6,391 5,933
PDO Single‐Vehicle 5,115 4,951 5,345 5,601 5,419 5,141 5,078 4,760 4,726 4,358
Multiple‐Vehicle 5,646 4,693 4,784 4,776 4,653 4,284 4,278 4,092 3,634 3,506
Total 10,761 9,644 10,129 10,377 10,072 9,425 9,356 8,852 8,360 7,864
All Crashes Total** 20,674 18,976 19,562 19,115 18,768 17,929 17,289 16,162 15,384 14,327
. Data is unavailable # Data is available, but specific variables or attributes are unavailable * For italicized years, the total does not equal the sum of single‐ and multiple‐vehicle crashes because it includes unknown crash type. **For italicized years, the total does not equal the sum of fatal, injury, and PDO crashes because it includes crashes of unknown severity.
33

State Data System: Crash Data Report 2000–2009
Table 2: Motor Vehicle Crashes‐Related to Alcohol by Crash Severity and Crash Type
State Severity Crash Type 2000 2001 2002 2003 2004 2005 2006 2007 2008 2009 Pennsylvania Fatal
Injury
PDO
All Crashes
Single‐Vehicle
Multiple‐Vehicle
Total
Single‐Vehicle
Multiple‐Vehicle
Total*
Single‐Vehicle
Multiple‐Vehicle
Total
Total**
342 339 . 333 333 365 314 287 354 282
136 165 . 156 140 161 186 193 131 126
478 504 . 489 473 526 500 480 485 408
5,889 5,510 . 5,281 5,290 5,177 4,218 4,023 4,710 3,855
3,194 3,111 . 3,106 3,195 2,926 3,279 3,373 1,940 2,386
9,083 8,621 . 8,387 8,485 8,103 7,497 7,396 6,652 6,241
3,854 3,698 . 4,222 4,159 3,924 3,173 3,256 3,748 2,847
1,163 1,215 . 1,407 1,517 1,412 2,229 2,284 1,098 1,824
5,017 4,913 . 5,629 5,676 5,336 5,402 5,540 4,846 4,671
14,578 14,038 . 14,505 14,634 13,965 13,399 13,416 12,149 11,475
South Fatal Single‐Vehicle 100 275 343 324 402 359 312 375 341 317
Carolina Multiple‐Vehicle 66 234 320 326 395 308 281 332 266 249
Total 166 509 663 650 797 667 593 707 607 566
Injury Single‐Vehicle 1,374 1,583 1,515 1,421 1,411 1,402 1,460 1,565 1,667 1,631
Multiple‐Vehicle 1,010 1,391 1,109 1,006 987 1,007 1,023 1,100 1,088 1,067
Total 2,384 2,974 2,624 2,427 2,398 2,409 2,483 2,665 2,755 2,698
PDO Single‐Vehicle 1,161 1,275 1,197 1,145 1,170 1,218 1,298 1,449 1,552 1,634
Multiple‐Vehicle 1,057 1,747 1,045 942 975 1,038 1,007 1,065 1,168 1,117
Total 2,218 3,022 2,242 2,087 2,145 2,256 2,305 2,514 2,720 2,751
All Crashes Total 4,768 6,505 5,529 5,164 5,340 5,332 5,381 5,886 6,082 6,015
. Data is unavailable # Data is available, but specific variables or attributes are unavailable * For italicized years, the total does not equal the sum of single‐ and multiple‐vehicle crashes because it includes unknown crash type. **For italicized years, the total does not equal the sum of fatal, injury, and PDO crashes because it includes crashes of unknown severity.
34

State Data System: Crash Data Report 2000–2009
Table 2: Motor Vehicle Crashes‐Related to Alcohol by Crash Severity and Crash Type
State Severity Crash Type 2000 2001 2002 2003 2004 2005 2006 2007 2008 2009 Texas Fatal
Injury
PDO
All Crashes
Single‐Vehicle
Multiple‐Vehicle
Total
Single‐Vehicle
Multiple‐Vehicle
Total*
Single‐Vehicle
Multiple‐Vehicle
Total*
Total**
685 595 . 502 432 395 502
363 403 . 401 364 304 337
1,048 998 . 903 796 699 839
6,767 6,752 . 6,620 6,210 6,171 6,156
8,654 8,389 . 8,064 7,796 7,309 6,943
15,421 15,141 . 14,686 14,006 13,485 13,109
5,435 5,413 . 6,092 6,388 6,391 6,148
4,517 4,403 . 7,315 7,193 7,238 6,945
9,952 9,816 . 13,407 13,581 13,629 13,094
26,421 25,955 . 32,179 31,506 30,884 30,607
521
364
885
6,229
6,952
13,186
6,961
7,685
14,651
32,652
553
368
921
6,278
6,509
12,788
7,017
7,636
14,653
31,941
560
312
872
6,238
6,249
12,487
7,150
7,417
14,568
31,430
Utah Fatal
Injury
PDO
All Crashes
Single‐Vehicle
Multiple‐Vehicle
Total
Single‐Vehicle
Multiple‐Vehicle
Total*
Single‐Vehicle
Multiple‐Vehicle
Total*
Total
42 30 24 18 22 . .
19 14 15 8 14 . .
61 44 39 26 36 . .
534 524 559 531 456 . .
621 622 578 495 460 . .
1,155 1,146 1,148 1,027 916 . .
364 382 405 390 379 . .
567 553 537 511 441 . .
931 935 949 901 820 . .
2,147 2,125 2,136 1,954 1,772 . .
.
.
.
.
.
.
.
.
.
.
.
.
.
.
.
.
.
.
.
.
.
.
.
.
.
.
.
.
.
.
. Data is unavailable # Data is available, but specific variables or attributes are unavailable * For italicized years, the total does not equal the sum of single‐ and multiple‐vehicle crashes because it includes unknown crash type. **For italicized years, the total does not equal the sum of fatal, injury, and PDO crashes because it includes crashes of unknown severity.
35
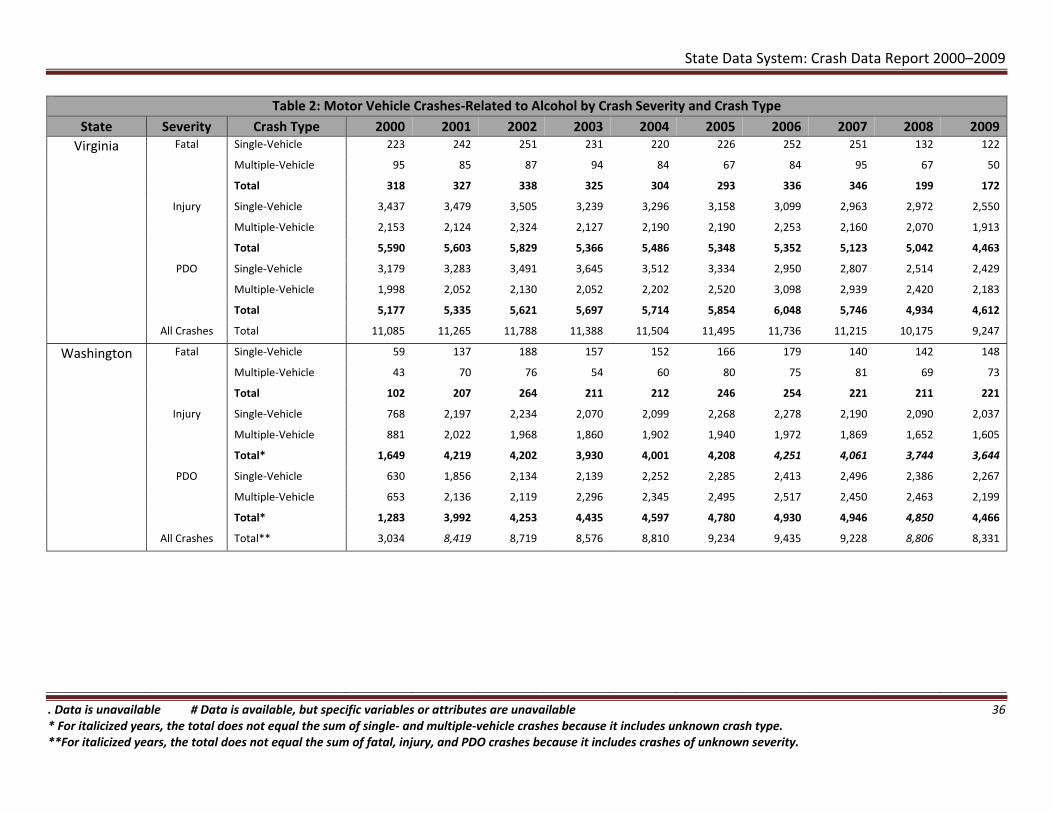
State Data System: Crash Data Report 2000–2009
Table 2: Motor Vehicle Crashes‐Related to Alcohol by Crash Severity and Crash Type
State Severity Crash Type 2000 2001 2002 2003 2004 2005 2006 2007 2008 2009 Virginia Fatal Single‐Vehicle 223 242 251 231 220 226 252 251 132 122
Multiple‐Vehicle 95 85 87 94 84 67 84 95 67 50
Total 318 327 338 325 304 293 336 346 199 172
Injury Single‐Vehicle 3,437 3,479 3,505 3,239 3,296 3,158 3,099 2,963 2,972 2,550
Multiple‐Vehicle 2,153 2,124 2,324 2,127 2,190 2,190 2,253 2,160 2,070 1,913
Total 5,590 5,603 5,829 5,366 5,486 5,348 5,352 5,123 5,042 4,463
PDO Single‐Vehicle 3,179 3,283 3,491 3,645 3,512 3,334 2,950 2,807 2,514 2,429
Multiple‐Vehicle 1,998 2,052 2,130 2,052 2,202 2,520 3,098 2,939 2,420 2,183
Total 5,177 5,335 5,621 5,697 5,714 5,854 6,048 5,746 4,934 4,612
All Crashes Total 11,085 11,265 11,788 11,388 11,504 11,495 11,736 11,215 10,175 9,247
Washington Fatal Single‐Vehicle 59 137 188 157 152 166 179 140 142 148
Multiple‐Vehicle 43 70 76 54 60 80 75 81 69 73
Total 102 207 264 211 212 246 254 221 211 221
Injury Single‐Vehicle 768 2,197 2,234 2,070 2,099 2,268 2,278 2,190 2,090 2,037
Multiple‐Vehicle 881 2,022 1,968 1,860 1,902 1,940 1,972 1,869 1,652 1,605
Total* 1,649 4,219 4,202 3,930 4,001 4,208 4,251 4,061 3,744 3,644
PDO Single‐Vehicle 630 1,856 2,134 2,139 2,252 2,285 2,413 2,496 2,386 2,267
Multiple‐Vehicle 653 2,136 2,119 2,296 2,345 2,495 2,517 2,450 2,463 2,199
Total* 1,283 3,992 4,253 4,435 4,597 4,780 4,930 4,946 4,850 4,466
All Crashes Total** 3,034 8,419 8,719 8,576 8,810 9,234 9,435 9,228 8,806 8,331
. Data is unavailable # Data is available, but specific variables or attributes are unavailable * For italicized years, the total does not equal the sum of single‐ and multiple‐vehicle crashes because it includes unknown crash type. **For italicized years, the total does not equal the sum of fatal, injury, and PDO crashes because it includes crashes of unknown severity.
36

State Data System: Crash Data Report 2000–2009
Table 2: Motor Vehicle Crashes‐Related to Alcohol by Crash Severity and Crash Type
State Severity Crash Type 2000 2001 2002 2003 2004 2005 2006 2007 2008 2009 Wisconsin Fatal Single‐Vehicle 181 197 204 230 219 204 206 210 154 162
Multiple‐Vehicle 88 74 73 84 76 88 78 95 63 58
Total 269 271 277 314 295 292 284 305 217 220
Injury Single‐Vehicle 2,977 2,841 3,038 2,984 2,856 2,901 2,840 2,655 2,181 1,935
Multiple‐Vehicle 1,831 1,777 1,683 1,604 1,632 1,483 1,371 1,434 1,116 926
Total 4,808 4,618 4,721 4,588 4,488 4,384 4,211 4,089 3,297 2,861
PDO Single‐Vehicle 2,465 2,269 2,481 2,573 2,601 2,649 2,513 2,578 2,389 2,134
Multiple‐Vehicle 2,119 2,126 2,062 2,154 2,163 2,053 2,028 1,998 1,875 1,700
Total 4,584 4,395 4,543 4,727 4,764 4,702 4,541 4,576 4,264 3,834
All Crashes Total 9,661 9,284 9,541 9,629 9,547 9,378 9,036 8,970 7,778 6,915
Wyoming Fatal Single‐Vehicle 31 46 43 40 42 46 47 41 50 40
Multiple‐Vehicle 9 13 14 12 10 10 14 6 15 11
Total 40 59 57 52 52 56 61 47 65 51
Injury Single‐Vehicle 298 266 305 310 288 324 307 320 353 319
Multiple‐Vehicle 174 164 179 174 145 179 196 208 201 172
Total 472 430 484 484 433 503 503 528 554 491
PDO Single‐Vehicle 179 220 248 256 221 256 237 251 340 312
Multiple‐Vehicle 253 251 248 264 263 326 307 317 359 396
Total 432 471 496 520 484 582 544 568 699 708
All Crashes Total 944 960 1,037 1,056 969 1,141 1,108 1,143 1,318 1,250
. Data is unavailable # Data is available, but specific variables or attributes are unavailable * For italicized years, the total does not equal the sum of single‐ and multiple‐vehicle crashes because it includes unknown crash type. **For italicized years, the total does not equal the sum of fatal, injury, and PDO crashes because it includes crashes of unknown severity.
37

State Data System: Crash Data Report 2000–2009
Table 3: Motor Vehicle Crashes by First Harmful Event and Crash Severity
The variable First Harmful Event is the first event during a crash that caused injury or property damage. States generally include a significant amount of detail for this variable, including the specific objects a vehicle collided with. However, given the variety in coding systems between States, it was difficult to combine all the States’ attributes into narrow categories. Consequently, this table categorizes first harmful event into six broad categories:
Non‐Collision Harmful Event, Collision With Motor Vehicle in Transport, Collision With Non‐fixed Object, Collision With Fixed Object, Other, and Unknown.
Appendix IV gives examples of how some of the harmful event attributes used by the States are distributed among the categories.
Some States allow the coding of “other” for first harmful event. For these States, “other” is shown as a separate category in this table since it cannot be assigned to one of the four event categories.
Certain States include events that do not directly cause injury or property damage—such as ran off roadway and cross median. These events are placed in the “Unknown” category. Also, some States include crashes where “none” can be coded for first harmful event. These are also included in the “Unknown” category.
In States where the first harmful event was not available in the crash file, it was derived from “vehicle sequence of events” in the vehicle file. The event for the lowest numbered vehicle in the crash was selected for the Crash First Harmful Event. If the first vehicle event was a non‐harmful event, the subsequent event was used. All non‐motorists and parked vehicles were excluded from this derivation.
Of the 34 States in the SDS, only one State did not have any variables that could be used to identify first harmful event.
38

State Data System: Crash Data Report 2000–2009
Table 3: Motor Vehicles Crashes by First Harmful Event and Crash Severity
State Severity First Harmful Event 2000 2001 2002 2003 2004 2005 2006 2007 2008 2009
Alabama Fatal
Injury
Non‐Collision Harmful Event
Collision with MV in Transport
Collision with non‐fixed object
Collision with fixed object
Other
Unknown
Total
77 92 86 84 99 100 117 127 82 52
372 376 367 364 414 427 417 395 326 296
72 74 73 84 92 97 95 83 74 59
373 350 395 355 415 389 433 388 394 292
15 14 11 13 16 9 12 17 11 10
0 0 0 0 0 0 0 0 0 66
909 906 932 900 1,036 1,022 1,074 1,010 887 775
Non‐Collision Harmful Event 1,374 1,285 1,346 1,374 1,522 1,576 1,548 1,479 1,212 997
Collision with MV in Transport 19,468 19,691 20,184 19,946 20,550 19,961 18,885 17,553 15,726 15,853
Collision with non‐fixed object 1,257 1,159 1,222 1,212 1,150 1,169 1,186 1,100 1,070 918
Collision with fixed object 7,774 7,660 8,007 7,937 8,407 8,374 8,657 7,897 7,384 6,177
Other 279 285 278 296 293 351 288 284 234 177
Unknown 0 0 0 0 0 0 0 0 0 1,293
PDO
Total 30,152 30,080 31,037 30,765 31,922 31,431 30,564 28,313 25,626 25,415
Non‐Collision Harmful Event 2,421 2,397 2,347 2,386 2,473 2,385 2,394 2,475 2,132 1,865
Collision with MV in Transport 78,185 79,338 82,425 83,194 86,667 85,658 82,184 80,944 73,268 71,565
Collision with non‐fixed object 6,854 6,740 7,067 6,696 7,113 6,922 7,054 6,886 6,661 6,481
Collision with fixed object 14,183 14,989 16,387 16,411 16,663 16,253 15,984 15,085 14,806 14,082
Other 727 766 790 772 785 767 683 609 619 690
Unknown 0 0 0 0 0 0 0 0 0 2,630
Total 102,370 104,230 109,016 109,459 113,701 111,985 108,299 105,999 97,486 97,313
. Data is unavailable # Data is available, but specific variables or attributes are unavailable 39

State Data System: Crash Data Report 2000–2009
Table 3: Motor Vehicles Crashes by First Harmful Event and Crash Severity
State Severity First Harmful Event 2000 2001 2002 2003 2004 2005 2006 2007 2008 2009
Arkansas Fatal
Injury
Non‐Collision Harmful Event
Collision with MV in Transport
Collision with non‐fixed object
Collision with fixed object
Other
Unknown
Total
100 65 91 80 71 104 93 95 73 59
224 215 222 225 274 251 222 234 193 206
64 60 59 50 55 57 46 60 66 53
168 196 183 208 224 182 234 191 216 206
3 2 0 0 1 2 1 2 4 5
19 0 2 1 1 0 0 2 0 0
578 538 557 564 626 596 596 584 552 529
Non‐Collision Harmful Event 1,551 1,271 1,326 1,464 1,631 1,605 1,724 1,580 1,139 905
Collision with MV in Transport 15,856 18,411 20,075 20,914 23,021 22,974 23,411 17,926 14,225 12,677
Collision with non‐fixed object 850 1,033 1,107 1,146 1,220 1,309 1,346 1,128 945 825
Collision with fixed object 2,650 4,905 5,410 5,705 6,970 6,589 7,291 5,940 4,974 4,614
Other 271 169 136 60 54 154 111 97 184 205
Unknown 1,872 272 70 32 45 43 40 33 42 260
PDO
Total 23,050 26,061 28,124 29,321 32,941 32,674 33,923 26,704 21,509 19,486
Non‐Collision Harmful Event 1,034 769 671 699 706 590 525 711 765 676
Collision with MV in Transport 35,641 32,694 32,908 30,743 30,946 28,247 25,306 29,750 30,575 31,862
Collision with non‐fixed object 2,666 2,166 2,092 3,501 2,065 1,944 1,856 2,202 2,317 2,266
Collision with fixed object 3,932 5,939 6,187 5,920 6,601 5,312 5,160 6,222 7,228 7,612
Other 516 201 191 67 70 95 71 133 154 307
Unknown 3,284 428 173 99 104 55 48 87 46 70
Total 47,073 42,197 42,222 41,029 40,492 36,243 32,966 39,105 41,085 42,793
. Data is unavailable # Data is available, but specific variables or attributes are unavailable 40

State Data System: Crash Data Report 2000–2009
Table 3: Motor Vehicles Crashes by First Harmful Event and Crash Severity
State Severity First Harmful Event 2000 2001 2002 2003 2004 2005 2006 2007 2008 2009
California Fatal
Injury
Non‐Collision Harmful Event
Collision with MV in Transport
Collision with non‐fixed object
Collision with fixed object
Unknown
Total
296 342 382 392 405 412 379 380 298 247
1,215 1,222 1,332 1,411 1,370 1,411 1,421 1,248 1,084 947
873 897 889 916 944 969 968 873 853 772
946 1,056 1,026 986 971 1,024 1,020 1,049 875 837
1 0 21 21 11 6 5 7 3 2
3,331 3,517 3,650 3,726 3,701 3,822 3,793 3,557 3,113 2,805
Non‐Collision Harmful Event 7,908 8,084 8,235 8,583 9,031 9,007 9,179 9,048 8,410 7,701
Collision with MV in Transport 135,488 137,667 139,801 137,726 136,386 132,759 125,298 120,675 108,015 103,823
Collision with non‐fixed object 29,826 29,576 30,588 30,010 30,142 29,359 28,640 29,103 29,665 29,034
Collision with fixed object 25,105 26,110 25,235 26,518 26,472 26,628 25,613 25,136 23,504 22,195
Unknown 21 41 1,364 1,337 1,355 955 1,227 1,032 902 771
PDO
Total 198,348 201,478 205,223 204,174 203,386 198,708 189,957 184,994 170,496 163,524
Non‐Collision Harmful Event 5,132 5,111 5,974 6,054 6,343 6,326 6,159 5,679 5,030 4,559
Collision with MV in Transport 216,755 221,869 232,485 226,666 225,793 222,496 218,159 208,950 181,706 169,213
Collision with non‐fixed object 36,528 37,589 42,726 42,557 43,384 43,655 44,474 44,031 42,202 39,018
Collision with fixed object 51,138 52,946 52,283 53,539 53,445 56,061 54,848 53,127 48,661 45,838
Unknown 16 52 2,401 2,239 2,243 1,657 1,813 1,570 1,387 1,271
Total 309,569 317,567 335,869 331,055 331,208 330,195 325,453 313,357 278,986 259,899
. Data is unavailable # Data is available, but specific variables or attributes are unavailable 41

State Data System: Crash Data Report 2000–2009
Table 3: Motor Vehicles Crashes by First Harmful Event and Crash Severity
State Severity First Harmful Event 2000 2001 2002 2003 2004 2005 2006 2007 2008 2009
Colorado Fatal
Injury
PDO
Non‐Collision Harmful Event
Collision with MV in Transport
Collision with non‐fixed object
Collision with fixed object
Unknown
Total
128 119 139 109 96 .
233 243 220 213 248 .
92 79 90 65 83 .
172 214 220 150 162 .
6 12 6 35 10 .
631 667 675 572 599 .
.
.
.
.
.
.
.
.
.
.
.
.
.
.
.
.
.
.
.
.
.
.
.
.
Non‐Collision Harmful Event
Collision with MV in Transport
Collision with non‐fixed object
Collision with fixed object
Unknown
Total
3,208 3,064 3,021 2,959 2,937 .
22,177 22,331 22,172 19,618 20,454 .
3,150 3,063 2,968 2,569 3,057 .
5,243 5,373 5,301 4,936 5,130 .
152 241 515 1,963 623 .
33,930 34,072 33,977 32,045 32,201 .
.
.
.
.
.
.
.
.
.
.
.
.
.
.
.
.
.
.
.
.
.
.
.
.
Non‐Collision Harmful Event
Collision with MV in Transport
Collision with non‐fixed object
Collision with fixed object
Unknown
Total
4,213 3,794 3,858 3,963 4,231 .
64,715 65,986 65,020 59,236 67,697 .
10,030 11,090 11,818 10,680 15,368 .
14,225 14,991 15,338 15,107 18,446 .
2,637 4,981 6,528 8,082 19,164 .
95,820 100,842 102,562 97,068 124,906 .
.
.
.
.
.
.
.
.
.
.
.
.
.
.
.
.
.
.
.
.
.
.
.
.
. Data is unavailable # Data is available, but specific variables or attributes are unavailable 42
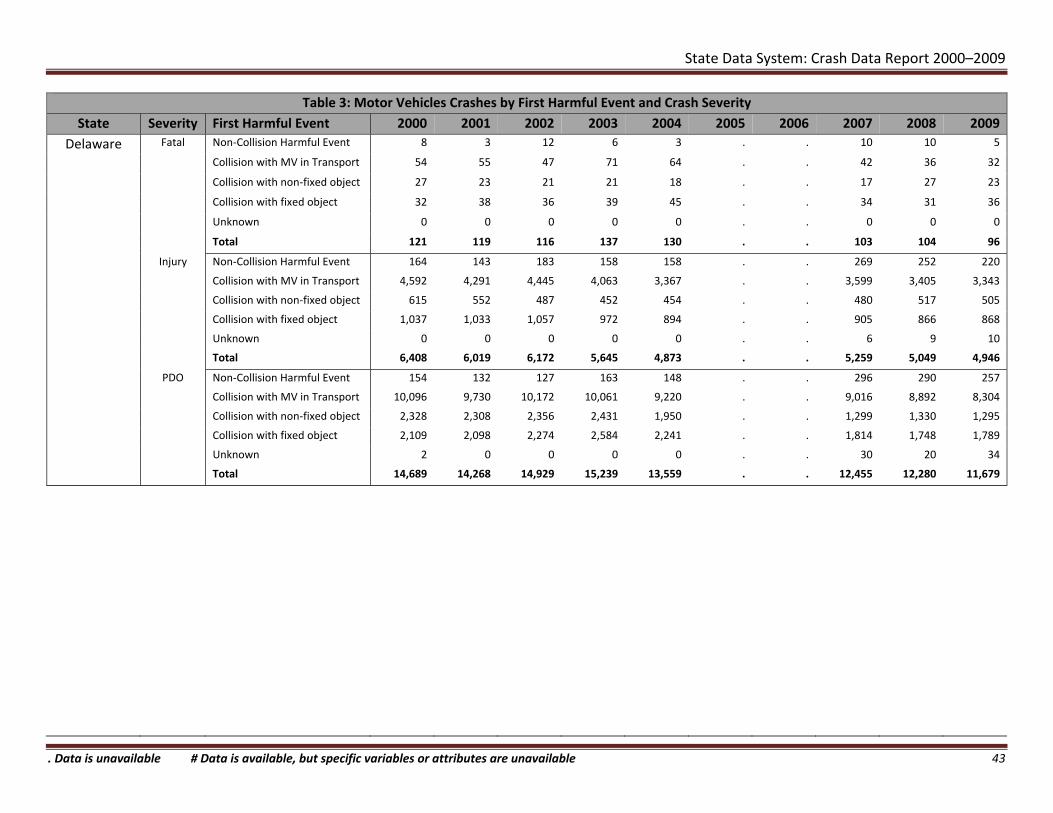
State Data System: Crash Data Report 2000–2009
Table 3: Motor Vehicles Crashes by First Harmful Event and Crash Severity
State Severity First Harmful Event 2000 2001 2002 2003 2004 2005 2006 2007 2008 2009
Delaware Fatal
Injury
PDO
Non‐Collision Harmful Event
Collision with MV in Transport
Collision with non‐fixed object
Collision with fixed object
Unknown
Total
8 3 12 6 3 .
54 55 47 71 64 .
27 23 21 21 18 .
32 38 36 39 45 .
0 0 0 0 0 .
121 119 116 137 130 .
.
.
.
.
.
.
10
42
17
34
0
103
10
36
27
31
0
104
5
32
23
36
0
96
Non‐Collision Harmful Event
Collision with MV in Transport
Collision with non‐fixed object
Collision with fixed object
Unknown
Total
164 143 183 158 158 .
4,592 4,291 4,445 4,063 3,367 .
615 552 487 452 454 .
1,037 1,033 1,057 972 894 .
0 0 0 0 0 .
6,408 6,019 6,172 5,645 4,873 .
.
.
.
.
.
.
269
3,599
480
905
6
5,259
252
3,405
517
866
9
5,049
220
3,343
505
868
10
4,946
Non‐Collision Harmful Event
Collision with MV in Transport
Collision with non‐fixed object
Collision with fixed object
Unknown
Total
154 132 127 163 148 .
10,096 9,730 10,172 10,061 9,220 .
2,328 2,308 2,356 2,431 1,950 .
2,109 2,098 2,274 2,584 2,241 .
2 0 0 0 0 .
14,689 14,268 14,929 15,239 13,559 .
.
.
.
.
.
.
296
9,016
1,299
1,814
30
12,455
290
8,892
1,330
1,748
20
12,280
257
8,304
1,295
1,789
34
11,679
. Data is unavailable # Data is available, but specific variables or attributes are unavailable 43
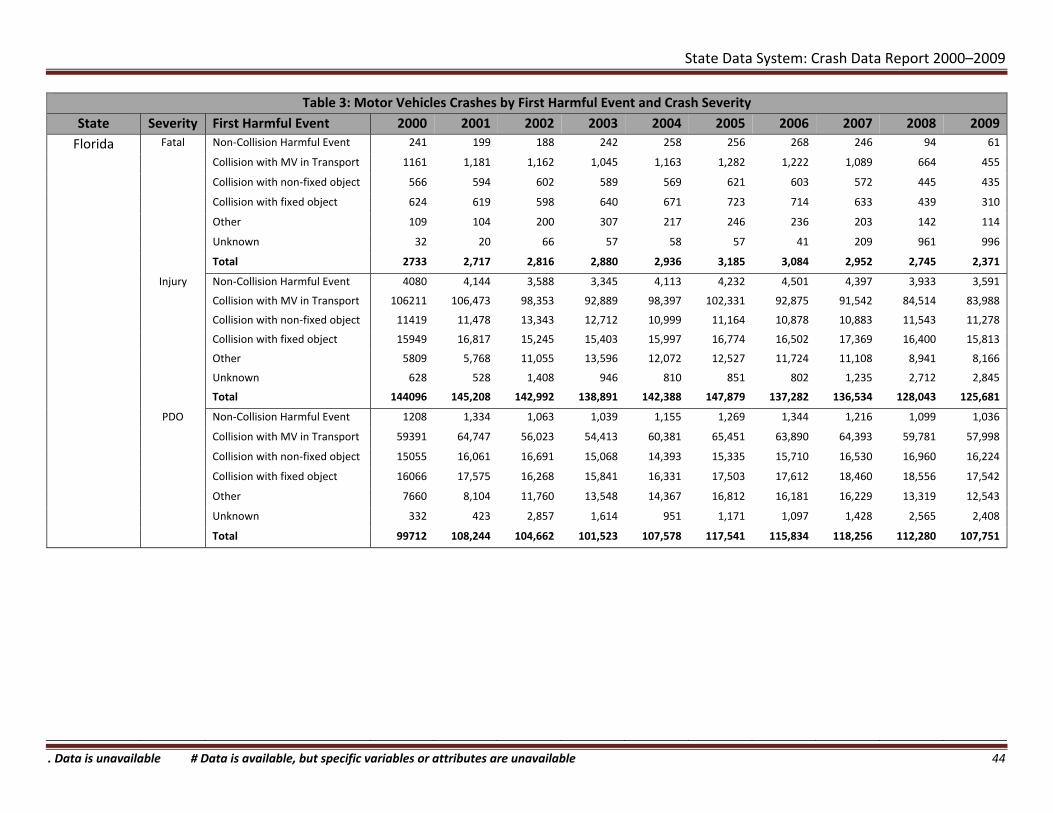
State Data System: Crash Data Report 2000–2009
Table 3: Motor Vehicles Crashes by First Harmful Event and Crash Severity
State Severity First Harmful Event 2000 2001 2002 2003 2004 2005 2006 2007 2008 2009
Florida Fatal
Injury
Non‐Collision Harmful Event
Collision with MV in Transport
Collision with non‐fixed object
Collision with fixed object
Other
Unknown
Total
241 199 188 242 258 256 268 246 94 61
1161 1,181 1,162 1,045 1,163 1,282 1,222 1,089 664 455
566 594 602 589 569 621 603 572 445 435
624 619 598 640 671 723 714 633 439 310
109 104 200 307 217 246 236 203 142 114
32 20 66 57 58 57 41 209 961 996
2733 2,717 2,816 2,880 2,936 3,185 3,084 2,952 2,745 2,371
Non‐Collision Harmful Event 4080 4,144 3,588 3,345 4,113 4,232 4,501 4,397 3,933 3,591
Collision with MV in Transport 106211 106,473 98,353 92,889 98,397 102,331 92,875 91,542 84,514 83,988
Collision with non‐fixed object 11419 11,478 13,343 12,712 10,999 11,164 10,878 10,883 11,543 11,278
Collision with fixed object 15949 16,817 15,245 15,403 15,997 16,774 16,502 17,369 16,400 15,813
Other 5809 5,768 11,055 13,596 12,072 12,527 11,724 11,108 8,941 8,166
Unknown 628 528 1,408 946 810 851 802 1,235 2,712 2,845
PDO
Total 144096 145,208 142,992 138,891 142,388 147,879 137,282 136,534 128,043 125,681
Non‐Collision Harmful Event 1208 1,334 1,063 1,039 1,155 1,269 1,344 1,216 1,099 1,036
Collision with MV in Transport 59391 64,747 56,023 54,413 60,381 65,451 63,890 64,393 59,781 57,998
Collision with non‐fixed object 15055 16,061 16,691 15,068 14,393 15,335 15,710 16,530 16,960 16,224
Collision with fixed object 16066 17,575 16,268 15,841 16,331 17,503 17,612 18,460 18,556 17,542
Other 7660 8,104 11,760 13,548 14,367 16,812 16,181 16,229 13,319 12,543
Unknown 332 423 2,857 1,614 951 1,171 1,097 1,428 2,565 2,408
Total 99712 108,244 104,662 101,523 107,578 117,541 115,834 118,256 112,280 107,751
. Data is unavailable # Data is available, but specific variables or attributes are unavailable 44
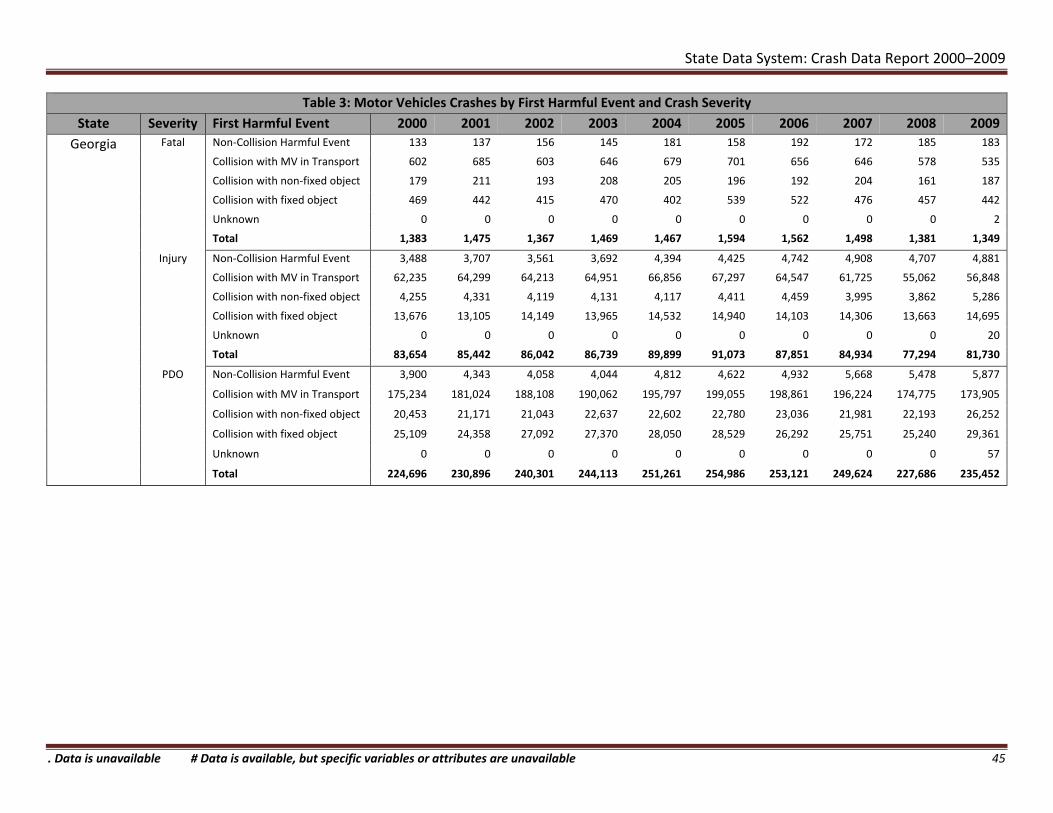
State Data System: Crash Data Report 2000–2009
Table 3: Motor Vehicles Crashes by First Harmful Event and Crash Severity
State Severity First Harmful Event 2000 2001 2002 2003 2004 2005 2006 2007 2008 2009
Georgia Fatal
Injury
Non‐Collision Harmful Event
Collision with MV in Transport
Collision with non‐fixed object
Collision with fixed object
Unknown
Total
133 137 156 145 181 158 192 172 185 183
602 685 603 646 679 701 656 646 578 535
179 211 193 208 205 196 192 204 161 187
469 442 415 470 402 539 522 476 457 442
0 0 0 0 0 0 0 0 0 2
1,383 1,475 1,367 1,469 1,467 1,594 1,562 1,498 1,381 1,349
Non‐Collision Harmful Event 3,488 3,707 3,561 3,692 4,394 4,425 4,742 4,908 4,707 4,881
Collision with MV in Transport 62,235 64,299 64,213 64,951 66,856 67,297 64,547 61,725 55,062 56,848
Collision with non‐fixed object 4,255 4,331 4,119 4,131 4,117 4,411 4,459 3,995 3,862 5,286
Collision with fixed object 13,676 13,105 14,149 13,965 14,532 14,940 14,103 14,306 13,663 14,695
Unknown 0 0 0 0 0 0 0 0 0 20
PDO
Total 83,654 85,442 86,042 86,739 89,899 91,073 87,851 84,934 77,294 81,730
Non‐Collision Harmful Event 3,900 4,343 4,058 4,044 4,812 4,622 4,932 5,668 5,478 5,877
Collision with MV in Transport 175,234 181,024 188,108 190,062 195,797 199,055 198,861 196,224 174,775 173,905
Collision with non‐fixed object 20,453 21,171 21,043 22,637 22,602 22,780 23,036 21,981 22,193 26,252
Collision with fixed object 25,109 24,358 27,092 27,370 28,050 28,529 26,292 25,751 25,240 29,361
Unknown 0 0 0 0 0 0 0 0 0 57
Total 224,696 230,896 240,301 244,113 251,261 254,986 253,121 249,624 227,686 235,452
. Data is unavailable # Data is available, but specific variables or attributes are unavailable 45

State Data System: Crash Data Report 2000–2009
Table 3: Motor Vehicles Crashes by First Harmful Event and Crash Severity
State Severity First Harmful Event 2000 2001 2002 2003 2004 2005 2006 2007 2008 2009
Illinois Fatal
Injury
Non‐Collision Harmful Event
Collision with MV in Transport
Collision with non‐fixed object
Collision with fixed object
Unknown
Total
151 134 126 133 144 123 114 124 111 69
528 541 514 545 514 529 451 435 362 349
240 243 230 227 216 217 188 202 188 147
354 356 403 403 348 364 383 365 289 267
0 0 0 0 1 0 0 0 0 0
1,273 1,274 1,273 1,308 1,223 1,233 1,136 1,126 950 832
Non‐Collision Harmful Event 5,127 4,823 5,042 5,077 4,327 4,545 3,768 3,856 3,529 3,144
Collision with MV in Transport 64,159 59,695 60,027 61,013 57,661 53,346 50,306 47,169 43,457 40,933
Collision with non‐fixed object 12,458 12,145 12,269 11,941 11,441 11,470 11,867 12,237 11,049 10,312
Collision with fixed object 9,971 9,308 10,024 10,434 10,245 9,528 9,423 9,902 9,806 8,994
Unknown 116 25 23 18 271 495 11 44 0 0
PDO
Total 91,831 85,996 87,385 88,483 83,945 79,384 75,375 73,208 67,841 63,383
Non‐Collision Harmful Event 6,747 6,212 6,060 5,760 4,299 4,860 4,645 5,309 6,108 3,996
Collision with MV in Transport 258,739 242,600 238,980 236,541 234,785 229,767 225,712 230,716 218,493 143,741
Collision with non‐fixed object 70,108 74,826 72,806 71,776 73,043 69,133 68,712 72,333 72,132 52,305
Collision with fixed object 32,024 29,292 31,958 32,700 33,965 34,133 33,087 39,849 42,858 28,180
Unknown 1,922 555 236 203 1,750 2,909 184 317 0 0
Total 369,540 353,485 350,040 346,980 347,842 340,802 332,340 348,524 339,591 228,222
. Data is unavailable # Data is available, but specific variables or attributes are unavailable 46
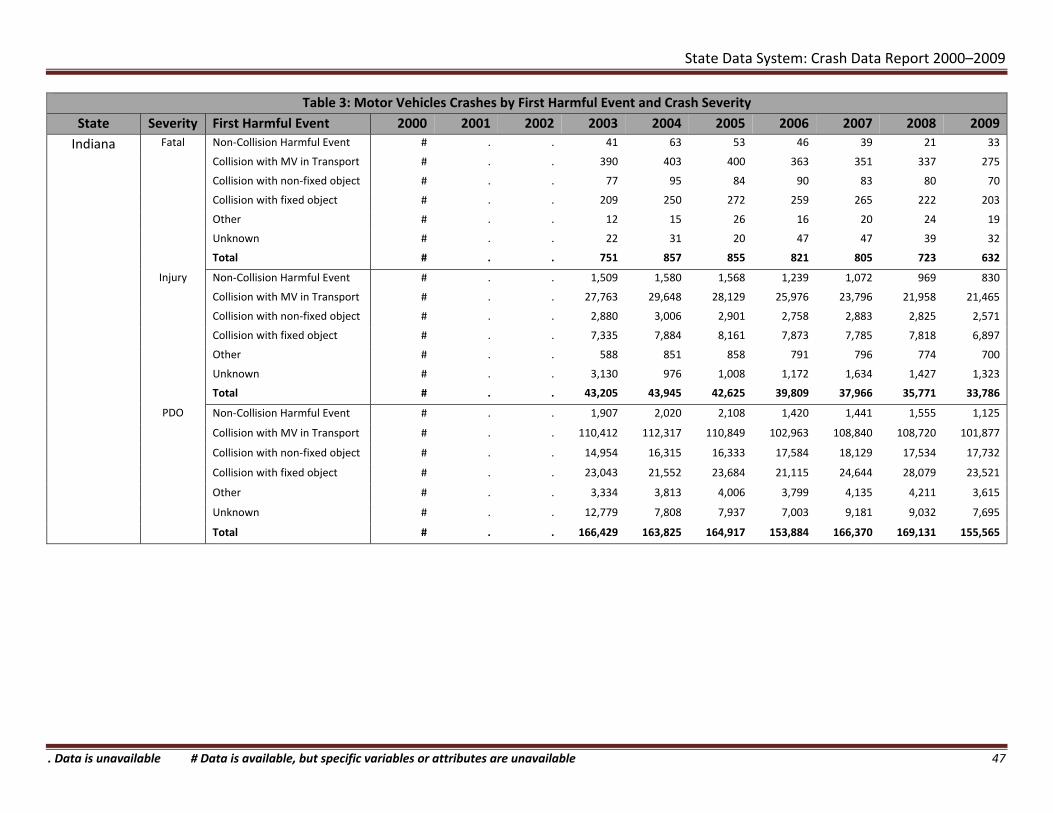
State Data System: Crash Data Report 2000–2009
Table 3: Motor Vehicles Crashes by First Harmful Event and Crash Severity
State Severity First Harmful Event 2000 2001 2002 2003 2004 2005 2006 2007 2008 2009
Indiana Fatal
Injury
PDO
Non‐Collision Harmful Event
Collision with MV in Transport
Collision with non‐fixed object
Collision with fixed object
Other
Unknown
Total
# . . 41 63 53
# . . 390 403 400
# . . 77 95 84
# . . 209 250 272
# . . 12 15 26
# . . 22 31 20
# . . 751 857 855
46
363
90
259
16
47
821
39
351
83
265
20
47
805
21
337
80
222
24
39
723
33
275
70
203
19
32
632
Non‐Collision Harmful Event
Collision with MV in Transport
Collision with non‐fixed object
Collision with fixed object
Other
Unknown
Total
# . . 1,509 1,580 1,568
# . . 27,763 29,648 28,129
# . . 2,880 3,006 2,901
# . . 7,335 7,884 8,161
# . . 588 851 858
# . . 3,130 976 1,008
# . . 43,205 43,945 42,625
1,239
25,976
2,758
7,873
791
1,172
39,809
1,072
23,796
2,883
7,785
796
1,634
37,966
969
21,958
2,825
7,818
774
1,427
35,771
830
21,465
2,571
6,897
700
1,323
33,786
Non‐Collision Harmful Event
Collision with MV in Transport
Collision with non‐fixed object
Collision with fixed object
Other
Unknown
Total
# . . 1,907 2,020 2,108
# . . 110,412 112,317 110,849
# . . 14,954 16,315 16,333
# . . 23,043 21,552 23,684
# . . 3,334 3,813 4,006
# . . 12,779 7,808 7,937
# . . 166,429 163,825 164,917
1,420
102,963
17,584
21,115
3,799
7,003
153,884
1,441
108,840
18,129
24,644
4,135
9,181
166,370
1,555
108,720
17,534
28,079
4,211
9,032
169,131
1,125
101,877
17,732
23,521
3,615
7,695
155,565
. Data is unavailable # Data is available, but specific variables or attributes are unavailable 47

State Data System: Crash Data Report 2000–2009
Table 3: Motor Vehicles Crashes by First Harmful Event and Crash Severity
State Severity First Harmful Event 2000 2001 2002 2003 2004 2005 2006 2007 2008 2009
Iowa Fatal
Injury
PDO
Non‐Collision Harmful Event
Collision with MV in Transport
Collision with non‐fixed object
Collision with fixed object
Other
Unknown
Total
. 53 79 76 58 70
. 191 179 163 174 183
. 36 32 37 45 41
. 69 82 106 77 102
. 0 0 0 0 0
. 15 0 0 0 3
. 364 372 382 354 399
66
177
48
93
0
2
386
84
172
42
94
0
0
392
79
168
38
81
0
1
367
73
147
33
85
0
0
338
Non‐Collision Harmful Event
Collision with MV in Transport
Collision with non‐fixed object
Collision with fixed object
Other
Unknown
Total
. 2,153 1,981 2,003 2,007 2,211
. 11,014 11,222 10,568 10,525 11,082
. 1,680 1,775 1,763 1,736 1,963
. 2,262 2,799 2,758 2,741 2,800
. 0 29 22 23 67
. 1,782 36 25 14 97
. 18,891 17,842 17,139 17,046 18,220
2,115
9,814
2,003
2,887
46
85
16,950
2,178
9,905
1,735
2,610
13
123
16,564
2,494
9,107
1,517
2,728
2
109
15,957
2,117
8,522
1,402
2,280
3
110
14,434
Non‐Collision Harmful Event
Collision with MV in Transport
Collision with non‐fixed object
Collision with fixed object
Other
Unknown
Total
. 2,258 2,014 1,997 1,776 1,952
. 18,067 23,648 24,381 24,725 23,938
. 6,794 11,089 10,632 10,802 9,716
. 3,262 4,440 4,677 4,277 4,133
. 2 117 102 127 97
. 7,465 144 130 85 189
. 37,848 41,452 41,919 41,792 40,025
1,780
21,666
10,343
3,558
41
91
37,479
2,305
24,595
10,353
4,369
23
209
41,854
2,944
25,003
10,274
5,095
5
246
43,567
2,297
23,282
10,443
4,466
7
221
40,716
. Data is unavailable # Data is available, but specific variables or attributes are unavailable 48

State Data System: Crash Data Report 2000–2009
Table 3: Motor Vehicles Crashes by First Harmful Event and Crash Severity
State Severity First Harmful Event 2000 2001 2002 2003 2004 2005 2006 2007 2008 2009
Kansas Fatal
Injury
Non‐Collision Harmful Event
Collision with MV in Transport
Collision with non‐fixed object
Collision with fixed object
Other
Unknown
Total
65 75 97 90 77 87 87 83 79 73
203 185 202 185 188 170 172 174 132 131
35 38 44 34 36 38 45 36 37 36
102 135 106 112 89 90 123 86 100 108
0 0 0 0 0 0 0 0 0 0
0 0 0 0 0 0 0 0 0 2
405 433 449 421 390 385 427 379 348 350
Non‐Collision Harmful Event 1,355 1,292 2,126 1,893 1,839 2,030 1,847 1,644 1,574 1,760
Collision with MV in Transport 12,401 12,071 11,352 10,364 10,058 9,450 9,155 9,511 8,701 8,093
Collision with non‐fixed object 1,589 1,697 1,537 1,491 1,492 1,415 1,410 1,378 1,306 1,238
Collision with fixed object 4,114 4,276 3,475 3,280 3,240 3,278 3,377 3,690 3,282 2,815
Other 1 1 1 0 0 0 0 0 0 0
Unknown 9 9 4 7 3 11 3 4 3 21
PDO
Total 19,469 19,346 18,495 17,035 16,632 16,184 15,792 16,227 14,866 13,927
Non‐Collision Harmful Event 1,683 1,669 2,479 2,327 2,099 2,168 1,682 1,810 1,627 2,015
Collision with MV in Transport 32,197 32,078 32,593 31,184 30,707 28,181 26,455 27,654 25,826 23,251
Collision with non‐fixed object 15,412 16,366 15,561 15,171 15,692 13,682 13,747 14,413 14,275 13,942
Collision with fixed object 8,889 8,869 8,643 8,816 8,548 8,050 7,339 10,085 8,879 7,532
Other 4 4 2 2 1 3 2 2 2 0
Unknown 69 42 49 37 33 22 16 19 35 102
Total 58,254 59,028 59,327 57,537 57,080 52,106 49,241 53,983 50,644 46,842
. Data is unavailable # Data is available, but specific variables or attributes are unavailable 49

State Data System: Crash Data Report 2000–2009
Table 3: Motor Vehicles Crashes by First Harmful Event and Crash Severity
State Severity First Harmful Event 2000 2001 2002 2003 2004 2005 2006 2007 2008 2009
Kentucky Fatal
Injury
Non‐Collision Harmful Event
Collision with MV in Transport
Collision with non‐fixed object
Collision with fixed object
Unknown
Total
38 58 50 59 75 72 78 95 82 62
279 321 349 366 373 357 350 310 285 316
68 70 73 69 63 77 75 56 77 46
321 305 334 346 337 377 333 336 306 302
2 5 3 5 5 3 1 6 8 4
708 759 809 845 853 886 837 803 758 730
Non‐Collision Harmful Event 1,052 912 1,041 916 1,162 1,323 1,366 1,457 1,427 1,397
Collision with MV in Transport 21,778 20,860 20,394 19,336 18,523 17,707 16,651 15,550 14,739 14,858
Collision with non‐fixed object 2,103 1,944 1,746 1,730 1,607 1,559 1,593 1,519 1,561 1,414
Collision with fixed object 9,234 8,779 8,822 8,645 8,264 8,150 7,629 7,311 7,226 6,927
Unknown 428 392 355 332 288 274 216 249 277 440
PDO
Total 34,595 32,887 32,358 30,959 29,844 29,013 27,455 26,086 25,230 25,036
Non‐Collision Harmful Event 1,189 1,217 1,463 1,358 1,562 1,730 1,869 1,864 1,982 1,750
Collision with MV in Transport 75,752 73,480 73,400 73,359 78,453 75,813 74,413 73,017 70,924 73,824
Collision with non‐fixed object 5,969 5,854 5,738 5,483 5,415 5,287 5,599 5,673 5,893 5,897
Collision with fixed object 13,756 13,543 14,658 15,746 15,641 14,841 15,287 15,310 16,184 16,156
Unknown 3,107 2,464 1,920 2,078 1,949 1,803 1,792 1,800 2,116 2,844
Total 99,773 96,558 97,179 98,024 103,020 99,474 98,960 97,664 97,099 100,471
. Data is unavailable # Data is available, but specific variables or attributes are unavailable 50

State Data System: Crash Data Report 2000–2009
Table 3: Motor Vehicles Crashes by First Harmful Event and Crash Severity
State Severity First Harmful Event 2000 2001 2002 2003 2004 2005 2006 2007 2008 2009
Louisiana Fatal
Injury
PDO
Non‐Collision Harmful Event
Collision with MV in Transport
Collision with non‐fixed object
Collision with fixed object
Unknown
Total
. . . . . 101
. . . . . 381
. . . . . 123
. . . . . 238
. . . . . 32
. . . . . 875
94
376
107
286
27
890
75
385
112
314
14
900
80
346
108
276
10
820
53
299
103
264
10
729
Non‐Collision Harmful Event
Collision with MV in Transport
Collision with non‐fixed object
Collision with fixed object
Unknown
Total
. . . . . 1,976
. . . . . 36,679
. . . . . 1,905
. . . . . 6,245
. . . . . 2,682
. . . . . 49,487
1,930
36,863
1,797
6,537
1,638
48,765
1,729
36,358
1,722
6,922
1,438
48,169
1,592
35,411
1,864
6,433
1,220
46,520
1,506
34,558
1,735
6,451
1,085
45,335
Non‐Collision Harmful Event
Collision with MV in Transport
Collision with non‐fixed object
Collision with fixed object
Unknown
Total
. . . . . 1,995
. . . . . 83,979
. . . . . 5,777
. . . . . 9,110
. . . . . 7,269
. . . . . 108,130
2,009
89,184
5,997
9,947
5,351
112,488
1,811
87,887
5,894
10,261
4,805
110,658
1,748
87,656
6,138
10,175
4,983
110,700
1,533
87,283
6,346
10,612
4,019
109,793
. Data is unavailable # Data is available, but specific variables or attributes are unavailable 51

State Data System: Crash Data Report 2000–2009
Table 3: Motor Vehicles Crashes by First Harmful Event and Crash Severity
State Severity First Harmful Event 2000 2001 2002 2003 2004 2005 2006 2007 2008 2009
Maryland Fatal
Injury
Non‐Collision Harmful Event
Collision with MV in Transport
Collision with non‐fixed object
Collision with fixed object
Other
Unknown
Total
15 20 16 18 13 13 21 18 10 14
244 249 250 261 212 251 244 204 223 181
113 114 117 130 117 117 109 120 113 120
186 200 208 171 208 177 191 190 165 166
0 0 0 1 0 3 0 0 0 1
16 19 15 15 26 16 28 26 28 34
574 602 606 596 576 577 593 558 539 516
Non‐Collision Harmful Event 707 684 706 770 717 772 812 820 732 683
Collision with MV in Transport 25,818 26,367 26,156 26,346 25,243 24,721 23,849 22,717 21,258 21,023
Collision with non‐fixed object 4,522 4,351 4,214 4,342 4,090 4,199 4,120 4,065 3,982 3,898
Collision with fixed object 6,126 6,304 6,317 6,397 6,060 5,732 5,851 5,973 5,512 5,335
Other 22 46 37 31 37 48 48 47 51 69
Unknown 649 811 902 983 1,033 1,022 1,162 1,167 1,241 1,350
PDO
Total 37,844 38,563 38,332 38,869 37,180 36,494 35,842 34,789 32,776 32,358
Non‐Collision Harmful Event 933 977 954 1,010 903 769 661 680 686 653
Collision with MV in Transport 35,120 36,483 38,798 39,599 37,701 37,967 37,233 36,482 34,366 34,764
Collision with non‐fixed object 11,690 11,152 11,650 12,761 11,844 11,560 11,948 12,127 11,678 11,770
Collision with fixed object 12,163 12,379 13,433 14,397 13,191 13,118 13,349 13,905 12,823 13,432
Other 28 57 50 54 53 64 67 57 75 71
Unknown 1,198 1,342 1,655 1,812 1,948 1,987 2,093 2,110 2,433 2,827
Total 61,132 62,390 66,540 69,633 65,640 65,465 65,351 65,361 62,061 63,517
. Data is unavailable # Data is available, but specific variables or attributes are unavailable 52

State Data System: Crash Data Report 2000–2009
Table 3: Motor Vehicles Crashes by First Harmful Event and Crash Severity
State Severity First Harmful Event 2000 2001 2002 2003 2004 2005 2006 2007 2008 2009
Michigan Fatal
Injury
Non‐Collision Harmful Event
Collision with MV in Transport
Collision with non‐fixed object
Collision with fixed object
Unknown
Total
119 114 113 126 107 101 120 104 88 88
602 547 542 535 489 489 423 452 410 354
225 186 201 235 182 179 193 168 162 158
322 322 316 312 302 295 287 300 283 235
5 67 41 12 5 2 2 0 2 1
1,273 1,236 1,213 1,220 1,085 1,066 1,025 1,024 945 836
Non‐Collision Harmful Event 5,420 4,949 4,529 4,928 4,995 4,578 4,348 4,591 4,407 3,973
Collision with MV in Transport 58,446 50,705 47,541 48,856 46,729 41,509 37,757 36,712 33,866 32,669
Collision with non‐fixed object 8,012 7,107 6,763 6,675 6,503 6,111 5,974 5,872 5,725 5,494
Collision with fixed object 13,979 11,722 11,987 13,506 12,436 12,489 11,083 11,847 11,418 10,428
Unknown 2,539 7,658 10,892 3,803 3,725 3,325 2,125 1,705 1,290 986
PDO
Total 88,396 82,141 81,712 77,768 74,388 68,012 61,287 60,727 56,706 53,550
Non‐Collision Harmful Event 9,653 8,457 7,805 7,981 8,674 7,942 7,051 7,808 7,999 6,236
Collision with MV in Transport 192,042 164,830 155,370 166,379 159,350 147,898 132,332 133,995 130,390 120,026
Collision with non‐fixed object 85,223 82,315 74,682 84,348 78,969 73,797 74,895 76,863 75,497 75,962
Collision with fixed object 38,990 31,377 33,522 39,108 36,792 38,913 30,902 37,226 39,812 32,597
Unknown 11,266 32,055 42,759 16,063 15,188 14,632 9,065 7,855 6,096 4,196
Total 337,174 319,034 314,138 313,879 298,973 283,182 254,245 263,747 259,794 239,017
. Data is unavailable # Data is available, but specific variables or attributes are unavailable 53

State Data System: Crash Data Report 2000–2009
Table 3: Motor Vehicles Crashes by First Harmful Event and Crash Severity
State Severity First Harmful Event 2000 2001 2002 2003 2004 2005 2006 2007 2008 2009
Minnesota Fatal
Injury
PDO
Non‐Collision Harmful Event
Collision with MV in Transport
Collision with non‐fixed object
Collision with fixed object
Other
Unknown
Total
90 105 121 . 102 103
278 242 257 . 255 242
57 63 68 . 68 62
124 91 137 . 84 86
8 7 7 . 10 6
0 0 0 . 1 1
557 508 590 . 520 500
99
194
66
91
6
0
456
99
226
54
81
3
0
463
83
188
58
80
9
2
420
68
153
60
79
10
1
371
Non‐Collision Harmful Event
Collision with MV in Transport
Collision with non‐fixed object
Collision with fixed object
Other
Unknown
Total
2,753 3,430 2,650 . 2,737 2,521
20,517 19,043 18,216 . 18,457 17,248
3,240 3,022 2,856 . 2,930 2,930
3,680 3,160 3,770 . 3,314 3,429
574 582 590 . 543 429
67 39 58 . 85 61
30,831 29,276 28,140 . 28,066 26,618
2,669
15,343
2,820
3,374
411
46
24,663
2,419
15,942
2,879
3,291
405
42
24,978
2,774
14,795
2,691
3,241
376
37
23,914
2,419
13,681
2,719
3,015
306
19
22,159
Non‐Collision Harmful Event
Collision with MV in Transport
Collision with non‐fixed object
Collision with fixed object
Other
Unknown
Total
2,848 4,229 2,436 . 2,424 2,475
47,963 45,323 43,822 . 41,798 39,973
10,973 11,211 10,214 . 9,748 9,265
8,972 7,022 8,362 . 7,401 8,102
1,125 1,190 1,122 . 933 646
321 224 283 . 384 234
72,202 69,199 66,239 . 62,688 60,695
2,299
35,130
8,795
6,728
526
148
53,626
2,147
37,626
8,090
7,519
558
124
56,064
2,881
34,885
7,508
8,786
616
85
54,761
2,521
33,074
7,205
7,573
531
64
50,968
. Data is unavailable # Data is available, but specific variables or attributes are unavailable 54

State Data System: Crash Data Report 2000–2009
Table 3: Motor Vehicles Crashes by First Harmful Event and Crash Severity
State Severity First Harmful Event 2000 2001 2002 2003 2004 2005 2006 2007 2008 2009
Missouri Fatal
Injury
Non‐Collision Harmful Event
Collision with MV in Transport
Collision with non‐fixed object
Collision with fixed object
Total
111 111 124 125 93 127 124 118 94 85
416 370 425 440 387 416 354 339 319 294
121 99 126 110 100 126 101 95 75 84
343 393 407 420 426 448 392 348 357 323
991 973 1,082 1,095 1,006 1,117 971 900 845 786
Non‐Collision Harmful Event 2,864 2,588 2,648 2,487 2,603 2,449 2,459 2,337 2,348 2,301
Collision with MV in Transport 32,725 31,968 30,844 29,334 28,902 28,054 26,384 25,093 22,949 22,467
Collision with non‐fixed object 3,539 3,375 3,300 3,207 3,129 3,006 2,932 2,880 2,797 2,771
Collision with fixed object 10,591 10,391 11,189 10,939 11,220 11,149 10,388 10,677 9,946 9,466
PDO
Total 49,719 48,322 47,981 45,967 45,854 44,658 42,163 40,987 38,040 37,005
Non‐Collision Harmful Event 3,293 3,020 2,893 2,538 2,608 2,349 2,223 2,258 2,322 2,143
Collision with MV in Transport 97,824 95,492 92,651 92,118 92,042 88,372 84,628 82,688 75,706 75,792
Collision with non‐fixed object 19,713 19,824 19,127 18,728 18,183 16,511 15,932 15,716 15,566 15,217
Collision with fixed object 22,265 21,018 22,072 22,182 22,567 22,118 21,311 23,527 23,383 22,072
Total 143,095 139,354 136,743 135,566 135,400 129,350 124,094 124,189 116,977 115,224
. Data is unavailable # Data is available, but specific variables or attributes are unavailable 55

State Data System: Crash Data Report 2000–2009
Table 3: Motor Vehicles Crashes by First Harmful Event and Crash Severity
State Severity First Harmful Event 2000 2001 2002 2003 2004 2005 2006 2007 2008 2009
Montana Fatal
Injury
PDO
Non‐Collision Harmful Event
Collision with MV in Transport
Collision with non‐fixed object
Collision with fixed object
Unknown
Total
61 72 75 76 65 89
68 62 63 65 54 47
22 15 26 23 22 28
51 50 68 72 68 60
1 2 0 0 0 0
203 201 232 236 209 224
66
62
22
75
1
226
81
66
24
78
0
249
66
66
24
51
1
208
.
.
.
.
.
.
Non‐Collision Harmful Event
Collision with MV in Transport
Collision with non‐fixed object
Collision with fixed object
Unknown
Total
1,321 1,016 1,176 1,152 1,153 1,078
3,521 3,139 3,303 3,024 2,996 3,057
720 577 653 635 531 599
1,472 1,086 1,335 1,416 1,300 1,315
24 408 17 14 19 16
7,058 6,226 6,484 6,241 5,999 6,065
1,157
3,042
656
1,376
13
6,244
1,020
3,021
631
1,309
10
5,991
1,029
2,768
602
1,366
28
5,793
.
.
.
.
.
.
Non‐Collision Harmful Event
Collision with MV in Transport
Collision with non‐fixed object
Collision with fixed object
Unknown
Total
1,282 1,316 1,409 1,365 1,315 1,337
7,311 7,842 8,472 8,273 7,945 7,938
3,452 3,249 3,448 3,678 3,470 3,524
2,944 2,580 3,390 3,369 2,741 3,199
116 458 117 107 97 90
15,105 15,445 16,836 16,792 15,568 16,088
1,301
7,758
3,600
2,974
76
15,709
1,081
7,680
3,680
3,084
73
15,598
1,175
7,683
3,561
3,330
177
15,926
.
.
.
.
.
.
. Data is unavailable # Data is available, but specific variables or attributes are unavailable 56

State Data System: Crash Data Report 2000–2009
Table 3: Motor Vehicles Crashes by First Harmful Event and Crash Severity
State Severity First Harmful Event 2000 2001 2002 2003 2004 2005 2006 2007 2008 2009
Nebraska Fatal
Injury
Non‐Collision Harmful Event
Collision with MV in Transport
Collision with non‐fixed object
Collision with fixed object
Other
Unknown
Total
41 44 89 63 56 73 59 52 51 54
111 107 104 120 110 101 95 105 88 100
31 25 25 24 17 24 26 14 11 17
59 40 54 50 46 40 46 58 39 34
0 0 0 0 0 0 0 1 0 0
0 0 0 0 0 0 0 0 0 0
242 216 272 257 229 238 226 230 189 205
Non‐Collision Harmful Event 1,076 1,519 1,515 1,441 1,545 1,378 1,324 1,189 1,045 1,143
Collision with MV in Transport 13,674 12,501 11,058 10,344 10,129 9,298 8,638 8,846 8,341 8,355
Collision with non‐fixed object 1,577 1,541 1,363 1,324 1,258 1,171 1,123 1,162 1,236 1,101
Collision with fixed object 2,572 2,037 1,662 1,674 1,491 1,549 1,394 1,735 1,691 1,597
Other 0 0 2 2 0 0 1 3 2 5
Unknown 8 0 1 3 0 0 0 8 13 11
PDO
Total 18,907 17,598 15,601 14,788 14,423 13,396 12,480 12,943 12,328 12,212
Non‐Collision Harmful Event 866 1,171 1,137 1,194 1,150 1,028 1,044 892 802 806
Collision with MV in Transport 16,871 17,482 18,040 18,782 13,425 12,942 11,165 12,917 12,663 12,529
Collision with non‐fixed object 7,684 7,967 7,697 7,852 5,630 5,351 5,496 5,800 5,742 5,980
Collision with fixed object 3,393 3,355 3,459 3,692 2,430 2,721 2,364 3,077 2,874 2,887
Other 0 0 7 8 2 2 0 7 13 7
Unknown 23 16 5 13 2 1 4 10 15 38
Total 28,837 29,991 30,345 31,541 22,639 22,045 20,073 22,703 22,109 22,247
. Data is unavailable # Data is available, but specific variables or attributes are unavailable 57

State Data System: Crash Data Report 2000–2009
Table 3: Motor Vehicles Crashes by First Harmful Event and Crash Severity
State Severity First Harmful Event 2000 2001 2002 2003 2004 2005 2006 2007 2008 2009
New Jersey Fatal
Injury
PDO
Non‐Collision Harmful Event
Collision with MV in Transport
Collision with non‐fixed object
Collision with fixed object
Other
Unknown
Total
. 22 33 25 52 23
. 595 449 602 582 649
. 19 21 14 16 8
. 18 17 26 20 9
. 0 0 0 0 0
. 56 30 22 10 7
. 710 550 689 680 696
29
273
178
209
1
1
691
27
231
174
227
2
0
661
25
171
173
207
0
3
579
20
167
176
181
0
1
545
Non‐Collision Harmful Event
Collision with MV in Transport
Collision with non‐fixed object
Collision with fixed object
Other
Unknown
Total
. 2,121 1,524 1,614 1,695 2,532
. 75,943 77,715 74,668 74,314 69,430
. 1,360 1,420 1,353 978 953
. 1,610 1,512 1,641 1,634 1,928
. 0 0 0 0 0
. 673 800 510 375 307
. 81,707 82,971 79,786 78,996 75,150
1,179
52,845
4,632
10,494
10
838
69,998
1,266
48,741
7,127
11,011
37
624
68,806
1,250
48,164
7,409
10,602
52
616
68,093
1,145
47,953
6,976
10,621
27
672
67,394
Non‐Collision Harmful Event
Collision with MV in Transport
Collision with non‐fixed object
Collision with fixed object
Other
Unknown
Total
. 3,830 2,955 3,388 3,371 5,058
. 202,079 211,553 216,810 221,748 218,146
. 10,607 10,040 11,577 9,738 8,179
. 5,774 5,570 6,104 5,925 6,464
. 0 0 0 0 0
. 7,989 6,340 5,699 2,961 1,742
. 230,279 236,458 243,578 243,743 239,589
1,005
170,397
21,411
28,461
43
3,540
224,857
1,412
155,860
44,967
32,688
101
2,321
237,349
1,045
150,858
48,531
31,572
103
1,371
233,480
986
148,488
50,334
32,306
93
1,087
233,294
. Data is unavailable # Data is available, but specific variables or attributes are unavailable 58
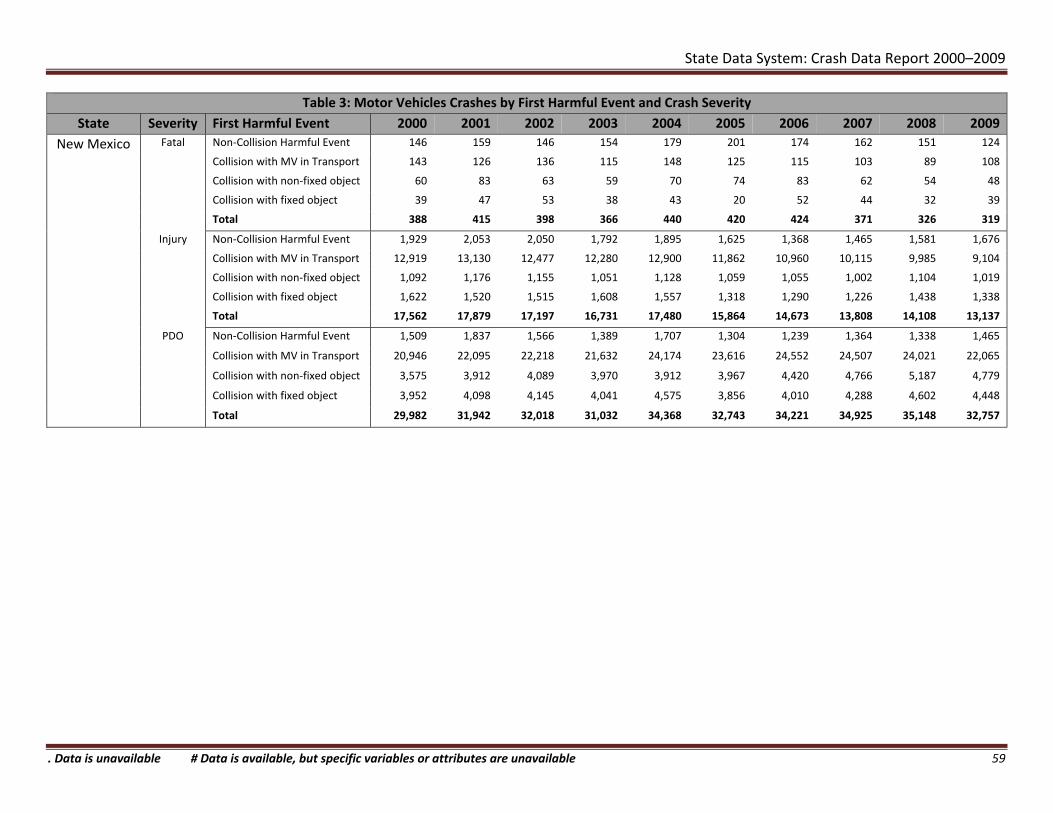
State Data System: Crash Data Report 2000–2009
Table 3: Motor Vehicles Crashes by First Harmful Event and Crash Severity
State Severity First Harmful Event 2000 2001 2002 2003 2004 2005 2006 2007 2008 2009
New Mexico Fatal
Injury
Non‐Collision Harmful Event
Collision with MV in Transport
Collision with non‐fixed object
Collision with fixed object
Total
146 159 146 154 179 201 174 162 151 124
143 126 136 115 148 125 115 103 89 108
60 83 63 59 70 74 83 62 54 48
39 47 53 38 43 20 52 44 32 39
388 415 398 366 440 420 424 371 326 319
Non‐Collision Harmful Event 1,929 2,053 2,050 1,792 1,895 1,625 1,368 1,465 1,581 1,676
Collision with MV in Transport 12,919 13,130 12,477 12,280 12,900 11,862 10,960 10,115 9,985 9,104
Collision with non‐fixed object 1,092 1,176 1,155 1,051 1,128 1,059 1,055 1,002 1,104 1,019
Collision with fixed object 1,622 1,520 1,515 1,608 1,557 1,318 1,290 1,226 1,438 1,338
PDO
Total 17,562 17,879 17,197 16,731 17,480 15,864 14,673 13,808 14,108 13,137
Non‐Collision Harmful Event 1,509 1,837 1,566 1,389 1,707 1,304 1,239 1,364 1,338 1,465
Collision with MV in Transport 20,946 22,095 22,218 21,632 24,174 23,616 24,552 24,507 24,021 22,065
Collision with non‐fixed object 3,575 3,912 4,089 3,970 3,912 3,967 4,420 4,766 5,187 4,779
Collision with fixed object 3,952 4,098 4,145 4,041 4,575 3,856 4,010 4,288 4,602 4,448
Total 29,982 31,942 32,018 31,032 34,368 32,743 34,221 34,925 35,148 32,757
. Data is unavailable # Data is available, but specific variables or attributes are unavailable 59

State Data System: Crash Data Report 2000–2009
Table 3: Motor Vehicles Crashes by First Harmful Event and Crash Severity
State Severity First Harmful Event 2000 2001 2002 2003 2004 2005 2006 2007 2008 2009
New York Fatal
Injury
PDO
Non‐Collision Harmful Event
Collision with MV in Transport
Collision with non‐fixed object
Collision with fixed object
Other
Unknown
Total
38 . 38 38 48 30
549 . 539 509 535 463
374 . 362 362 372 369
380 . 437 425 405 439
15 . 5 11 7 6
2 . 9 6 2 1
1,358 . 1,390 1,351 1,369 1,308
41
507
353
423
6
0
1,330
27
488
316
381
8
0
1,220
23
418
339
367
12
1
1,160
23
401
320
310
5
1
1,060
Non‐Collision Harmful Event
Collision with MV in Transport
Collision with non‐fixed object
Collision with fixed object
Other
Unknown
Total
1,611 . 2,226 2,243 2,243 2,136
141,495 . 128,903 119,404 108,291 100,860
27,068 . 24,311 23,509 22,665 22,465
22,572 . 21,952 20,737 20,478 20,022
1,443 . 1,033 979 1,105 1,072
472 . 707 642 198 88
194,661 . 179,132 167,514 154,980 146,643
1,839
94,334
22,337
18,644
1,085
72
138,311
1,867
94,418
22,182
19,449
1,137
64
139,117
1,702
90,582
22,251
19,223
1,069
67
134,894
1,590
90,982
22,191
17,982
1,092
51
133,888
Non‐Collision Harmful Event
Collision with MV in Transport
Collision with non‐fixed object
Collision with fixed object
Other
Unknown
Total
1,445 . 537 518 497 614
147,106 . 55,173 58,216 56,559 56,452
26,344 . 7,561 10,039 10,589 11,252
29,632 . 7,800 7,466 7,255 8,296
1,117 . 594 801 1,033 1,074
572 . 1,523 1,021 476 209
206,216 . 73,188 78,061 76,409 77,897
1,106
90,275
20,698
17,753
1,100
127
131,059
1,694
122,742
24,880
31,910
1,402
141
182,769
1,544
118,328
25,596
33,293
1,314
102
180,177
1,360
120,630
26,506
30,104
1,362
64
180,026
. Data is unavailable # Data is available, but specific variables or attributes are unavailable 60

State Data System: Crash Data Report 2000–2009
Table 3: Motor Vehicles Crashes by First Harmful Event and Crash Severity
State Severity First Harmful Event 2000 2001 2002 2003 2004 2005 2006 2007 2008 2009
North Carolina
Fatal
Injury
Non‐Collision Harmful Event
Collision with MV in Transport
Collision with non‐fixed object
Collision with fixed object
Unknown
Total
87 104 99 91 112 109 100 156 118 122
576 571 560 614 587 576 538 576 461 458
194 183 198 172 198 213 206 198 209 175
299 313 385 357 392 398 460 470 411 373
251 192 184 166 132 121 123 129 141 106
1,407 1,363 1,426 1,400 1,421 1,417 1,427 1,529 1,340 1,234
Non‐Collision Harmful Event 3,296 3,288 3,365 3,328 3,611 3,487 3,617 3,728 3,498 3,206
Collision with MV in Transport 60,206 58,215 57,054 57,537 56,669 53,128 51,243 50,882 47,458 45,676
Collision with non‐fixed object 4,111 3,923 3,675 3,812 3,878 3,636 3,672 3,753 3,663 3,486
Collision with fixed object 9,851 10,324 11,819 12,704 13,692 13,273 13,155 13,093 12,195 12,060
Unknown 9,439 7,295 6,647 6,095 5,449 4,778 4,309 4,678 4,959 4,966
PDO
Total 86,903 83,045 82,560 83,476 83,299 78,302 75,996 76,134 71,773 69,394
Non‐Collision Harmful Event 2,761 2,546 2,762 2,911 2,791 2,621 2,514 2,531 2,474 2,378
Collision with MV in Transport 85,108 87,722 89,511 92,073 92,371 90,296 89,482 91,943 86,265 82,720
Collision with non‐fixed object 15,554 17,514 16,456 18,269 18,334 18,496 20,468 21,952 22,297 21,899
Collision with fixed object 10,796 11,109 14,260 17,493 18,069 17,302 17,059 16,711 16,343 18,027
Unknown 10,758 7,643 7,998 7,862 7,372 6,291 5,930 6,307 6,904 7,804
Total 124,977 126,534 130,987 138,608 138,937 135,006 135,453 139,444 134,283 132,828
. Data is unavailable # Data is available, but specific variables or attributes are unavailable 61

State Data System: Crash Data Report 2000–2009
Table 3: Motor Vehicles Crashes by First Harmful Event and Crash Severity
State Severity First Harmful Event 2000 2001 2002 2003 2004 2005 2006 2007 2008 2009
North Dakota
Fatal
Injury
PDO
Non‐Collision Harmful Event
Collision with MV in Transport
Collision with non‐fixed object
Collision with fixed object
Unknown
Total
. . . 26 32 34
. . . 42 39 36
. . . 10 11 18
. . . 16 11 10
. . . 1 2 8
. . . 95 95 106
37
33
7
17
7
101
24
28
11
16
16
95
28
34
11
5
18
96
29
52
8
15
12
116
Non‐Collision Harmful Event
Collision with MV in Transport
Collision with non‐fixed object
Collision with fixed object
Unknown
Total
. . . 574 493 453
. . . 1,923 1,669 1,653
. . . 318 230 244
. . . 423 261 294
. . . 10 52 107
. . . 3,248 2,705 2,751
448
1,562
241
314
136
2,701
345
1,873
265
390
131
3,004
450
1,913
260
304
135
3,062
276
1,743
170
139
122
2,450
Non‐Collision Harmful Event
Collision with MV in Transport
Collision with non‐fixed object
Collision with fixed object
Unknown
Total
. . . 767 929 642
. . . 5,800 6,266 5,925
. . . 5,228 5,558 4,972
. . . 1,387 1,230 1,207
. . . 44 147 241
. . . 13,226 14,130 12,987
564
5,308
5,129
1,049
242
12,292
462
5,846
5,368
1,187
282
13,145
677
6,238
4,876
1,119
318
13,228
1,000
7,763
4,937
990
430
15,120
. Data is unavailable # Data is available, but specific variables or attributes are unavailable 62

State Data System: Crash Data Report 2000–2009
Table 3: Motor Vehicles Crashes by First Harmful Event and Crash Severity
State Severity First Harmful Event 2000 2001 2002 2003 2004 2005 2006 2007 2008 2009
Ohio Fatal
Injury
Non‐Collision Harmful Event
Collision with MV in Transport
Collision with non‐fixed object
Collision with fixed object
Other
Total
39 32 36 28 24 34 33 16 23 12
424 502 490 451 428 438 385 367 339 317
131 101 113 110 129 128 130 120 122 101
148 52 71 57 51 42 50 43 36 44
498 571 574 522 530 587 544 617 579 471
1,240 1,258 1,284 1,168 1,162 1,229 1,142 1,163 1,099 945
Non‐Collision Harmful Event 2,301 1,658 1,527 1,498 1,595 1,664 1,595 998 792 735
Collision with MV in Transport 54,821 67,934 67,468 65,971 65,953 58,469 54,398 50,429 47,097 46,102
Collision with non‐fixed object 9,792 5,078 5,049 5,087 4,902 5,216 5,664 5,814 6,127 5,773
Collision with fixed object 8,216 2,794 2,720 2,931 2,668 3,459 2,765 2,651 2,835 2,413
Other 30,413 17,507 18,610 19,483 18,940 19,833 18,875 19,829 20,489 18,267
PDO
Total 105,543 94,971 95,374 94,970 94,058 88,641 83,297 79,721 77,340 73,290
Non‐Collision Harmful Event 4,917 4,165 3,744 3,775 3,735 3,714 3,346 2,444 1,995 1,922
Collision with MV in Transport 140,448 186,795 184,128 184,639 180,570 161,021 150,268 143,510 134,646 128,898
Collision with non‐fixed object 49,221 44,353 44,525 46,574 44,016 43,683 46,390 47,471 46,714 45,465
Collision with fixed object 17,826 8,396 8,575 8,963 8,280 10,775 8,660 8,990 9,847 8,010
Other 61,309 34,374 37,406 41,435 38,468 40,546 35,823 39,557 42,824 35,737
Total 273,721 278,083 278,378 285,386 275,069 259,739 244,487 241,972 236,026 220,032
. Data is unavailable # Data is available, but specific variables or attributes are unavailable 63

State Data System: Crash Data Report 2000–2009
Table 3: Motor Vehicles Crashes by First Harmful Event and Crash Severity
State Severity First Harmful Event 2000 2001 2002 2003 2004 2005 2006 2007 2008 2009
Pennsylvania Fatal
Injury
PDO
Non‐Collision Harmful Event
Collision with MV in Transport
Collision with non‐fixed object
Collision with fixed object
Other
Unknown
Total
63 62 . 74 64 84
588 577 . 576 566 626
178 205 . 187 164 171
567 532 . 593 568 615
0 0 . 0 0 0
0 2 . 3 0 1
1,396 1,378 . 1,433 1,362 1,497
88
699
13
608
0
1
1,409
83
735
12
562
0
1
1,393
81
669
14
594
0
0
1,358
54
607
6
475
0
1
1,143
Non‐Collision Harmful Event
Collision with MV in Transport
Collision with non‐fixed object
Collision with fixed object
Other
Unknown
Total
2,306 2,024 . 2,730 3,145 3,152
54,808 49,026 . 47,095 46,042 43,396
7,998 7,274 . 7,285 7,437 7,089
22,977 20,021 . 21,537 20,844 20,520
2 88 . 0 0 0
16 91 . 103 140 124
88,107 78,524 . 78,750 77,608 74,281
2,805
46,282
707
18,448
0
81
68,323
2,949
44,753
690
18,963
0
64
67,419
2,571
40,959
734
18,844
0
22
63,130
2,323
41,443
697
17,292
0
21
61,776
Non‐Collision Harmful Event
Collision with MV in Transport
Collision with non‐fixed object
Collision with fixed object
Other
Unknown
Total
2,269 2,032 . 2,540 2,573 2,558
28,868 26,378 . 28,568 28,784 27,789
5,039 4,526 . 4,964 4,702 4,641
21,560 18,342 . 23,097 21,953 21,939
0 55 . 0 0 0
12 58 . 50 95 76
57,748 51,391 . 59,219 58,107 57,003
2,368
32,530
2,458
21,165
0
81
58,602
2,615
32,730
2,302
24,102
0
60
61,809
2,062
30,250
2,566
23,076
0
27
57,981
1,950
29,549
2,737
21,828
0
22
56,086
. Data is unavailable # Data is available, but specific variables or attributes are unavailable 64

State Data System: Crash Data Report 2000–2009
Table 3: Motor Vehicles Crashes by First Harmful Event and Crash Severity
State Severity First Harmful Event 2000 2001 2002 2003 2004 2005 2006 2007 2008 2009
South Carolina
Fatal
Injury
Non‐Collision Harmful Event
Collision with MV in Transport
Collision with non‐fixed object
Collision with fixed object
Other
Unknown
Total
82 94 102 136 119 89 120 140 108 107
361 392 365 355 353 355 365 331 272 275
122 113 99 98 116 127 125 132 119 101
365 252 358 313 352 396 357 376 338 327
10 3 5 3 5 11 5 5 4 7
8 108 20 0 1 2 1 1 0 0
948 962 949 905 946 980 973 985 841 817
Non‐Collision Harmful Event 1,705 1,598 1,662 1,917 2,179 1,866 2,166 2,238 2,174 2,060
Collision with MV in Transport 18,997 20,268 20,494 20,655 20,781 20,249 20,447 20,598 19,273 19,448
Collision with non‐fixed object 5,155 4,024 3,623 3,341 3,155 3,193 3,365 3,054 3,049 3,094
Collision with fixed object 6,241 4,385 5,243 6,094 6,107 6,017 6,066 5,973 6,346 6,296
Other 155 120 127 218 180 205 197 190 192 176
Unknown 39 1,977 1,278 158 95 30 87 26 19 12
PDO
Total 32,292 32,372 32,427 32,383 32,497 31,560 32,328 32,079 31,053 31,086
Non‐Collision Harmful Event 2,363 1,665 2,013 2,359 2,443 2,256 2,221 2,374 2,340 2,218
Collision with MV in Transport 44,452 44,892 49,859 51,479 53,479 55,307 54,780 56,396 51,490 50,161
Collision with non‐fixed object 13,321 10,551 11,058 8,991 8,380 9,234 9,835 8,351 8,623 8,960
Collision with fixed object 10,354 6,779 9,463 11,878 11,522 11,971 12,108 11,281 12,309 13,062
Other 293 283 427 567 587 601 572 536 541 512
Unknown 89 2,639 2,082 323 175 74 132 65 55 48
Total 70,872 66,809 74,902 75,597 76,586 79,443 79,648 79,003 75,358 74,961
. Data is unavailable # Data is available, but specific variables or attributes are unavailable 65

State Data System: Crash Data Report 2000–2009
Table 3: Motor Vehicles Crashes by First Harmful Event and Crash Severity
State Severity First Harmful Event 2000 2001 2002 2003 2004 2005 2006 2007 2008 2009
Texas Fatal
Injury
PDO
Non‐Collision Harmful Event
Collision with MV in Transport
Collision with non‐fixed object
Collision with fixed object
Other
Unknown
Total
558 565 . 491 439 469
1,383 1,409 . 1,432 1,396 1,286
514 548 . 520 552 511
781 788 . 916 856 874
10 9 . 11 22 16
0 0 . 1 2 0
3,246 3,319 . 3,371 3,267 3,156
522
1,208
490
878
20
0
3,118
419
1,260
487
916
15
1
3,098
460
1,213
517
915
10
1
3,116
437
1,049
422
876
8
1
2,793
Non‐Collision Harmful Event
Collision with MV in Transport
Collision with non‐fixed object
Collision with fixed object
Other
Unknown
Total
11,541 11,231 . 10,041 9,960 11,148
154,898 156,154 . 142,696 133,672 136,067
10,591 10,594 . 10,119 8,887 9,059
27,937 28,501 . 27,157 26,888 26,514
503 512 . 662 731 934
0 0 . 125 147 29
205,470 206,992 . 190,800 180,285 183,751
11,495
126,877
8,307
25,486
762
109
173,036
10,316
125,481
8,865
27,021
696
140
172,519
9,419
114,712
9,672
25,535
532
74
159,944
8,746
111,214
9,403
25,125
533
23
155,044
Non‐Collision Harmful Event
Collision with MV in Transport
Collision with non‐fixed object
Collision with fixed object
Other
Unknown
Total
6,337 6,318 . 6,823 7,591 8,811
66,924 68,598 . 185,150 181,107 192,500
6,098 6,335 . 14,911 15,157 15,878
30,060 31,564 . 36,300 38,358 37,094
712 764 . 2,105 2,220 2,887
0 0 . 190 238 48
110,131 113,579 . 245,479 244,671 257,218
8,980
180,539
15,656
35,562
2,226
177
243,140
8,661
193,693
16,024
42,473
2,291
278
263,420
6,319
190,956
16,755
41,331
1,960
151
257,472
5,477
184,251
16,561
43,621
1,902
23
251,835
. Data is unavailable # Data is available, but specific variables or attributes are unavailable 66

State Data System: Crash Data Report 2000–2009
Table 3: Motor Vehicles Crashes by First Harmful Event and Crash Severity
State Severity First Harmful Event 2000 2001 2002 2003 2004 2005 2006 2007 2008 2009
Utah Fatal
Injury
PDO
Non‐Collision Harmful Event
Collision with MV in Transport
Collision with non‐fixed object
Collision with fixed object
Other
Unknown
Total
13 10 12 14 17 .
106 91 90 86 77 .
44 39 31 27 34 .
9 8 13 9 7 .
3 4 3 1 1 .
143 107 127 125 122 .
318 259 276 262 258 .
.
.
.
.
.
.
.
.
.
.
.
.
.
.
.
.
.
.
.
.
.
.
.
.
.
.
.
.
Non‐Collision Harmful Event
Collision with MV in Transport
Collision with non‐fixed object
Collision with fixed object
Other
Unknown
Total
661 588 575 613 635 .
13,787 13,539 13,671 12,741 13,492 .
1,496 1,450 1,441 1,378 1,478 .
784 714 729 813 764 .
127 123 121 107 157 .
2,709 2,919 3,015 2,633 2,898 .
19,564 19,333 19,552 18,285 19,424 .
.
.
.
.
.
.
.
.
.
.
.
.
.
.
.
.
.
.
.
.
.
.
.
.
.
.
.
.
Non‐Collision Harmful Event
Collision with MV in Transport
Collision with non‐fixed object
Collision with fixed object
Other
Unknown
Total
1,008 762 871 891 861 .
24,542 23,734 24,411 22,897 24,783 .
2,412 2,539 2,463 2,263 2,370 .
1,703 1,716 1,675 1,890 1,668 .
521 603 664 595 661 .
3,082 3,760 3,456 3,306 3,879 .
33,268 33,114 33,540 31,842 34,222 .
.
.
.
.
.
.
.
.
.
.
.
.
.
.
.
.
.
.
.
.
.
.
.
.
.
.
.
.
. Data is unavailable # Data is available, but specific variables or attributes are unavailable 67

State Data System: Crash Data Report 2000–2009
Table 3: Motor Vehicles Crashes by First Harmful Event and Crash Severity
State Severity First Harmful Event 2000 2001 2002 2003 2004 2005 2006 2007 2008 2009
Virginia Fatal
Injury
PDO
Non‐Collision Harmful Event
Collision with MV in Transport
Collision with non‐fixed object
Collision with fixed object
Unknown
Total
# # # # # #
# # # # # #
# # # # # #
# # # # # #
# # # # # #
# # # # # #
#
#
#
#
#
#
#
#
#
#
#
#
74
212
63
244
199
792
74
203
85
281
51
694
Non‐Collision Harmful Event
Collision with MV in Transport
Collision with non‐fixed object
Collision with fixed object
Unknown
Total
# # # # # #
# # # # # #
# # # # # #
# # # # # #
# # # # # #
# # # # # #
#
#
#
#
#
#
#
#
#
#
#
#
2,135
21,592
2,126
9,879
13,131
48,863
2,061
27,534
2,568
9,980
2,141
44,284
Non‐Collision Harmful Event
Collision with MV in Transport
Collision with non‐fixed object
Collision with fixed object
Unknown
Total
# # # # # #
# # # # # #
# # # # # #
# # # # # #
# # # # # #
# # # # # #
#
#
#
#
#
#
#
#
#
#
#
#
1,142
37,821
6,829
14,977
24,892
85,661
1,295
45,225
6,193
15,828
3,223
71,764
. Data is unavailable # Data is available, but specific variables or attributes are unavailable 68

State Data System: Crash Data Report 2000–2009
Table 3: Motor Vehicles Crashes by First Harmful Event and Crash Severity
State Severity First Harmful Event 2000 2001 2002 2003 2004 2005 2006 2007 2008 2009
Washington Fatal
Injury
Non‐Collision Harmful Event
Collision with MV in Transport
Collision with non‐fixed object
Collision with fixed object
Unknown
Total
51 86 103 68 72 56 74 67 59 65
149 235 227 202 196 218 224 204 176 145
24 86 89 89 71 96 81 84 84 75
79 173 200 198 187 215 199 180 165 177
0 0 0 0 0 0 0 0 0 0
303 580 619 557 526 585 578 535 484 462
Non‐Collision Harmful Event 1,651 2,623 2,372 2,355 2,367 2,551 2,332 2,317 2,088 2,001
Collision with MV in Transport 14,996 35,525 34,837 31,638 32,126 33,933 32,503 30,416 26,800 23,956
Collision with non‐fixed object 774 3,884 3,657 3,445 3,534 3,646 3,692 3,485 4,018 3,903
Collision with fixed object 3,224 6,729 6,781 6,414 6,242 6,892 6,865 6,672 6,242 5,929
Unknown 1 10 0 0 0 0 0 2 0 0
PDO
Total 20,646 48,771 47,647 43,852 44,269 47,022 45,392 42,892 39,148 35,789
Non‐Collision Harmful Event 1,755 2,545 2,470 2,369 2,394 2,462 2,371 2,393 2,132 1,903
Collision with MV in Transport 19,769 52,632 54,904 54,466 55,539 59,900 60,954 59,505 54,636 47,886
Collision with non‐fixed object 1,423 9,488 9,904 12,429 10,677 11,407 11,090 11,315 11,556 9,712
Collision with fixed object 5,238 12,210 13,573 14,163 14,311 15,821 16,044 16,450 15,967 14,318
Unknown 1 26 0 0 0 0 0 0 0 0
Total 28,186 76,901 80,851 83,427 82,921 89,590 90,459 89,663 84,291 73,819
. Data is unavailable # Data is available, but specific variables or attributes are unavailable 69

State Data System: Crash Data Report 2000–2009
Table 3: Motor Vehicles Crashes by First Harmful Event and Crash Severity
State Severity First Harmful Event 2000 2001 2002 2003 2004 2005 2006 2007 2008 2009
Wisconsin Fatal
Injury
Non‐Collision Harmful Event
Collision with MV in Transport
Collision with non‐fixed object
Collision with fixed object
Unknown
Total
90 103 104 105 95 84 109 85 81 77
349 294 308 313 302 307 265 289 233 208
76 69 71 84 81 64 70 78 68 45
208 224 244 251 236 251 225 213 172 165
0 1 0 0 0 0 0 0 1 0
723 691 727 753 714 706 669 665 555 495
Non‐Collision Harmful Event 3,006 3,155 2,668 2,875 2,838 2,882 2,657 3,027 3,312 2,850
Collision with MV in Transport 28,357 25,579 25,279 24,498 24,502 23,652 22,004 22,756 21,119 18,805
Collision with non‐fixed object 3,985 3,951 3,716 3,743 3,513 3,532 3,555 3,426 3,134 2,922
Collision with fixed object 9,370 8,184 9,455 9,742 8,985 8,843 8,478 8,176 7,457 6,493
Unknown 37 40 37 43 31 28 26 16 12 15
PDO
Total 44,755 40,909 41,155 40,901 39,869 38,937 36,720 37,401 35,034 31,085
Non‐Collision Harmful Event 3,420 3,544 2,923 2,916 3,043 2,903 2,668 3,514 4,696 3,789
Collision with MV in Transport 53,336 47,006 47,291 47,507 47,535 46,253 43,278 47,552 49,605 42,974
Collision with non‐fixed object 29,393 29,118 29,265 30,220 28,347 26,227 27,078 27,727 25,931 25,513
Collision with fixed object 20,922 16,619 20,009 21,202 20,725 22,097 19,411 20,836 21,875 17,847
Unknown 100 101 75 77 52 57 55 50 42 33
Total 107,171 96,388 99,563 101,922 99,702 97,537 92,490 99,679 102,149 90,156
. Data is unavailable # Data is available, but specific variables or attributes are unavailable 70

State Data System: Crash Data Report 2000–2009
Table 3: Motor Vehicles Crashes by First Harmful Event and Crash Severity
State Severity First Harmful Event 2000 2001 2002 2003 2004 2005 2006 2007 2008 2009
Wyoming Fatal
Injury
Non‐Collision Harmful Event
Collision with MV in Transport
Collision with non‐fixed object
Collision with fixed object
Unknown
Total
56 63 57 62 62 64 66 59 59 62
34 45 41 42 40 43 54 33 46 28
16 7 11 13 6 11 11 6 11 8
26 40 42 24 34 29 38 38 23 18
0 0 0 0 0 0 0 0 0 0
132 155 151 141 142 147 169 136 139 116
Non‐Collision Harmful Event 1,084 1,011 1,075 1,174 1,116 1,126 1,226 1,153 1,131 905
Collision with MV in Transport 1,751 1,590 1,755 1,759 1,721 1,733 1,895 1,908 1,673 1,523
Collision with non‐fixed object 443 419 469 454 456 467 495 519 356 335
Collision with fixed object 672 687 692 726 667 651 717 786 611 595
Unknown 0 0 0 0 0 0 0 0 4 0
PDO
Total 3,950 3,707 3,991 4,113 3,960 3,977 4,333 4,366 3,775 3,358
Non‐Collision Harmful Event 1,194 1,172 1,160 1,353 1,033 1,168 1,405 1,283 1,624 1,081
Collision with MV in Transport 5,036 4,906 5,037 5,343 5,257 5,361 5,318 5,620 5,743 5,041
Collision with non‐fixed object 2,543 2,697 2,662 3,418 3,475 3,484 3,818 3,974 4,021 3,741
Collision with fixed object 1,602 1,587 1,681 1,949 1,705 1,745 1,929 2,049 2,329 2,112
Unknown 0 0 0 0 0 0 0 0 32 5
Total 10,375 10,362 10,540 12,063 11,470 11,758 12,470 12,926 13,749 11,980
. Data is unavailable # Data is available, but specific variables or attributes are unavailable 71

State Data System: Crash Data Report 2000–2009
Table 4: Motor Vehicle Crashes Where Driver Distraction/Inattention Was a
Contributing Factor
The following table shows the numbers of crashes where driver distraction and/or inattention were identified as likely contributing factors in the crash. Distraction caused by cell phone use is also reported for States where it could be identified. This table shows considerable variation between States and over time, which may be partly attributable to the difficulty of defining and identifying distraction, and the difficulty of determining whether it was a factor in a crash.
Most States do not provide definitions for “distraction” or “inattention” in their PAR manuals or in the other documentation they provide to the SDS. About one‐third of the SDS States list both distraction and inattention as separate possible contributing factors (without definitions), however, some States use the terms interchangeably. Since most States did not provide definitions for their terms “distraction” and “inattention,” both of these terms are grouped into “distraction” in this table. For NHTSA’s definitions of inattention and distraction, see Overview of the National Highway Traffic Safety Administration’s Driver Distraction Program (Report No. DOT HS 811 299).
The method for capturing distraction‐related information on PARs varies greatly, and this may contribute to the differences in crash counts seen in this table. Some States have a separate distraction field where one or more specific distractions can be selected from a list of possible distractions. Other States include distraction or cell phone use as choices from a broad range of possible contributing factors that can include vehicle‐ and environment‐related factors. In some States, officers can select only one or two contributing factors while in other States they can select as many as eight contributing factors. Some States have collected information on distraction for over ten years, but have added phone‐related distraction only for more recent years. The data for two SDS States do not have any variables for distraction or cell phone use for the years of this report.
Another difference in the coding of distraction is that some States do not offer a place to code “not distracted” on the PAR. This usually occurs when distraction is part of a contributing factor block, where an officer can only check a box for each possible factor, or check “unknown.” For these States, if the contributing factor variable was blank in the SDS data, the driver was categorized as not distracted for the following table. For States that provide both “no contributing” and “unknown” coding choices, blanks were categorized as “unknown.”
72

State Data System: Crash Data Report 2000–2009
Table 4: Motor Vehicle Crashes Where Driver Distraction/Inattention Was a Contributing Factor State Distraction 2000 2001 2002 2003 2004 2005 2006 2007 2008 2009
Arkansas Phone
Other Distraction
None
Unknown
Total
# # # # # # # #
# # # # # # # #
# # # # # # # #
# # # # # # # #
# # # # # # # #
832
4,476
36,723
21,115
63,146
979
3,319
45,014
13,496
62,808
California Phone
Other Distraction
None
Unknown
Total
# 972 # # 1,291 1,563 1,575 1,650
68,541 56,466 50,632 43,869 36,788 36,996 34,090 31,441
404,695 430,530 450,736 452,919 460,096 460,610 451,031 439,353
38,012 34,594 43,374 42,167 40,120 33,556 32,507 29,464
511,248 522,562 544,742 538,955 538,295 532,725 519,203 501,908
1,339
27,471
396,251
27,534
452,595
1,179
25,516
374,098
25,435
426,228
Colorado Phone
Other Distraction
None
Unknown
Total
# # # # # . . .
20,047 20,900 20,527 18,582 20,199 . . .
21,755 21,897 22,754 21,735 25,380 . . .
88,579 92,784 93,933 89,369 112,127 . . .
130,381 135,581 137,214 129,686 157,706 . . .
.
.
.
.
.
.
.
.
.
.
Delaware Phone
Other Distraction
None
Unknown
Total
# # # # # . . 208
# # # # # . . 7,523
# # # # # . . 8,569
# # # # # . . 1,519
# # # # # . . 17,819
250
7,540
8,305
1,338
17,433
221
7,073
8,166
1,263
16,723
Florida Phone
Other Distraction
None
Unknown
Total
# # # # # # # #
# 1,493 2,026 1,752 1,876 2,177 1,968 2,183
240,745 248,097 237,326 233,322 244,842 260,639 248,757 249,577
5,796 6,579 11,118 8,222 6,184 5,789 5,475 5,982
246,541 256,169 250,470 243,296 252,902 268,605 256,200 257,742
#
2,086
232,957
8,025
243,068
#
2,162
225,293
8,348
235,803
Georgia Phone
Other Distraction
None
Unknown
Total
# # # # 249 754 850 1,038
8,179 8,711 8,864 9,221 10,447 12,595 14,056 15,329
301,552 309,098 318,841 323,095 331,920 334,289 327,613 319,671
2 4 5 5 11 15 15 18
309,733 317,813 327,710 332,321 342,627 347,653 342,534 336,056
906
14,435
291,001
19
306,361
297
6,077
311,687
470
318,531
. Data is unavailable # Data is available, but specific variables or attributes are unavailable. 73

State Data System: Crash Data Report 2000–2009
Table 4: Motor Vehicle Crashes Where Driver Distraction/Inattention Was a Contributing Factor State Distraction 2000 2001 2002 2003 2004 2005 2006 2007 2008 2009
Illinois Phone 54 59 463 1,296 1,360 1,382 1,277 1,357 1,196 1,294
Other Distraction 7,014 6,007 11,890 16,272 13,419 13,301 13,127 13,367 12,553 9,907
None 455,475 434,631 426,232 419,140 418,231 406,736 392,993 408,132 394,633 281,236
Unknown 101 58 113 63 0 0 1,454 2 0 0
Total 462,644 440,755 438,698 436,771 433,010 421,419 408,851 422,858 408,382 292,437
Indiana Phone
Other Distraction
None
Unknown
Total
1,129 . . 1,872 1,084 1,101 1,194 1,254 1,200 1,216
450 . . 2,093 7,189 7,365 8,012 9,121 8,729 8,781
72,888 . . 185,349 191,082 186,428 169,881 179,155 195,554 179,792
182,531 . . 21,071 9,272 13,503 15,427 15,611 142 194
256,998 . . 210,385 208,627 208,397 194,514 205,141 205,625 189,983
Iowa Phone
Other Distraction
None
Unknown
Total
. 518 569 574 677 682 667 694 735 761
. 728 704 629 654 623 559 593 543 569
. 38,998 40,665 42,980 45,009 45,281 41,796 47,013 49,104 44,106
. 16,859 17,728 15,257 12,852 12,058 11,793 10,510 9,509 10,052
. 57,103 59,666 59,440 59,192 58,644 54,815 58,810 59,891 55,488
Kansas Phone
Other Distraction
None
Unknown
Total
# # # 278 370 396 453 461 494 696
30,158 31,223 30,563 26,844 26,103 23,072 22,295 21,332 19,927 15,964
47,685 47,313 47,434 47,668 47,513 45,101 42,624 48,718 45,261 44,035
285 271 274 203 116 106 88 78 176 424
78,128 78,807 78,271 74,993 74,102 68,675 65,460 70,589 65,858 61,119
Kentucky Phone 360 429 475 614 791 878 863 940 957 1,036
Other Distraction 51,276 51,971 52,194 52,552 56,305 55,192 54,416 52,127 49,665 53,400
None 78,494 73,131 73,422 73,056 73,133 70,018 68,700 68,255 69,209 68,467
Unknown 4,947 4,674 4,259 3,608 3,488 3,286 3,276 3,232 3,260 3,336
Total 135,077 130,205 130,350 129,830 133,717 129,374 127,255 124,554 123,091 126,239
Louisiana Phone
Other Distraction
None
Unknown
Total
. . . . . 2,554 2,671 2,823 2,697 2,904
. . . . . 14,734 13,927 13,545 13,093 13,332
. . . . . 85,301 88,797 88,427 87,716 86,903
. . . . . 55,904 56,748 55,087 54,583 52,718
. . . . . 158,493 162,143 159,882 158,089 155,857
. Data is unavailable # Data is available, but specific variables or attributes are unavailable. 74

State Data System: Crash Data Report 2000–2009
Table 4: Motor Vehicle Crashes Where Driver Distraction/Inattention Was a Contributing Factor State Distraction 2000 2001 2002 2003 2004 2005 2006 2007 2008 2009
Maryland Phone 18 102 118 226 306 396 456 481 482 505
Other Distraction 56,661 57,470 61,423 67,765 64,852 62,729 61,807 60,415 56,499 54,627
None 30,827 30,204 33,917 32,693 28,324 30,797 35,389 37,079 34,922 39,726
Unknown 12,044 13,779 10,020 8,414 9,914 8,614 4,134 2,734 3,473 1,533
Total 99,550 101,555 105,478 109,098 103,396 102,536 101,786 100,709 95,376 96,391
Michigan Phone 967 814 857 867 1,004 1,006 926 868 901 850
Other Distraction 4,408 4,224 3,875 3,785 3,782 3,509 3,530 3,285 3,083 3,266
None 319,116 288,391 289,435 293,609 290,417 276,990 249,735 259,137 255,971 171,578
Unknown 102,352 108,982 102,896 94,606 79,243 70,755 62,366 62,208 57,490 117,709
Total 426,843 402,411 397,063 392,867 374,446 352,260 316,557 325,498 317,445 293,403
Minnesota Phone
Other Distraction
None
Unknown
Total
180 177 223 . 230 213 192 195 179 133
29,475 28,330 28,320 . 24,179 23,207 20,211 20,392 18,703 17,009
54,446 52,083 50,614 . 64,706 61,884 56,115 58,625 57,968 54,080
19,489 18,393 15,812 . 2,158 2,509 2,227 2,293 2,245 2,276
103,590 98,983 94,969 . 91,273 87,813 78,745 81,505 79,095 73,498
Missouri Phone
Other Distraction
None
Unknown
Total
# # 987 1,092 1,286 1,524 1,700 1,746 1,855 1,900
# 96,973 54,350 52,039 50,542 48,140 46,423 44,769 41,051 40,291
# 91,676 130,445 129,493 130,432 125,458 119,105 119,558 112,956 110,823
# 0 24 4 0 3 0 3 0 1
# 188,649 185,806 182,628 182,260 175,125 167,228 166,076 155,862 153,015
Montana Phone
Other Distraction
None
Unknown
Total
9 42 62 61 78 101 138 146 127 .
7,045 6,952 7,362 7,118 6,815 6,973 7,072 6,707 5,499 .
15,312 14,883 16,128 16,091 14,888 15,304 14,750 14,656 16,079 .
0 0 0 0 0 0 222 335 266 .
22,366 21,877 23,552 23,270 21,781 22,378 22,182 21,844 21,971 .
Nebraska Phone
Other Distraction
None
Unknown
Total
# # 117 115 114 114 101 121 140 153
# # 3,933 4,209 3,208 3,119 3,027 3,106 3,093 3,334
# # 33,388 33,471 27,497 26,316 24,272 26,913 26,234 26,685
# # 8,780 8,791 6,472 6,130 5,379 5,736 5,159 4,492
# # 46,218 46,586 37,291 35,679 32,779 35,876 34,626 34,664
. Data is unavailable # Data is available, but specific variables or attributes are unavailable. 75

State Data System: Crash Data Report 2000–2009
Table 4: Motor Vehicle Crashes Where Driver Distraction/Inattention Was a Contributing Factor State Distraction 2000 2001 2002 2003 2004 2005 2006 2007 2008 2009
New Jersey Phone
Other Distraction
None
Unknown
Total
. # # # # # 1,678 1,749
. # # # # # 125,132 137,772
. # # # # # 161,006 158,877
. # # # # # 7,730 8,418
. # # # # # 295,546 306,816
1,723
140,976
151,822
7,631
302,152
1,755
140,205
151,578
7,695
301,233
New Mexico Phone
Other Distraction
None
Unknown
Total
# # # 118 164 258 331 315
326 369 158 40,874 46,379 43,373 42,596 36,488
370 348 224 6,029 4,806 4,646 5,456 11,090
47,236 49,519 49,231 1,108 939 750 935 1,211
47,932 50,236 49,613 48,129 52,288 49,027 49,318 49,104
287
34,309
13,630
1,356
49,582
283
27,696
16,907
1,327
46,213
New York Phone
Other Distraction
None
Unknown
Total
# . 192 194 193 193 321 295
# . 32,639 26,654 25,382 25,068 36,629 46,653
# . 83,875 66,188 62,157 65,562 104,918 148,185
# . 137,004 153,890 145,026 135,025 128,832 127,973
# . 253,710 246,926 232,758 225,848 270,700 323,106
364
46,799
141,741
127,327
316,231
422
49,076
145,858
119,618
314,974
North Carolina Phone
Other Distraction
None
Unknown
Total
# # # # # # # #
39,949 44,507 46,402 49,607 51,353 52,178 51,822 52,615
171,519 164,801 167,820 173,026 171,559 162,120 160,476 163,726
8,823 8,618 7,958 8,826 8,307 7,974 8,009 7,966
220,291 217,926 222,180 231,459 231,219 222,272 220,307 224,307
#
49,271
157,701
7,386
214,358
#
46,670
156,696
6,329
209,695
North Dakota Phone
Other Distraction
None
Unknown
Total
. . . # # # # #
. . . 2,038 1,961 1,955 1,944 2,126
. . . 14,471 14,913 13,758 12,785 13,626
. . . 60 56 131 365 492
. . . 16,569 16,930 15,844 15,094 16,244
#
2,108
13,764
514
16,386
#
1,120
15,889
677
17,686
Ohio Phone
Other Distraction
None
Unknown
Total
# # # # # # # #
14,507 13,334 12,405 12,083 11,644 10,901 10,385 10,623
350,355 352,644 352,162 358,610 348,652 327,897 304,762 299,190
21,260 21,097 21,509 21,990 21,343 19,792 19,059 19,269
386,122 387,075 386,076 392,683 381,639 358,590 334,206 329,082
#
10,442
293,232
17,569
321,243
#
10,259
272,080
16,701
299,040
. Data is unavailable # Data is available, but specific variables or attributes are unavailable. 76

State Data System: Crash Data Report 2000–2009
Table 4: Motor Vehicle Crashes Where Driver Distraction/Inattention Was a Contributing Factor State Distraction 2000 2001 2002 2003 2004 2005 2006 2007 2008 2009
Pennsylvania Phone
Other Distraction
None
Unknown
Total
301 666 . 1,037 1,234 1,250 1,303 1,293
4,009 8,984 . 10,023 10,923 10,603 11,250 11,116
142,862 119,445 . 124,441 122,078 117,918 106,778 106,093
79 2,198 . 3,901 2,842 3,010 9,003 12,119
147,251 131,293 . 139,402 137,077 132,781 128,334 130,621
1,091
11,038
104,508
8,265
124,902
1,161
11,263
100,715
8,159
121,298
South Carolina Phone
Other Distraction
None
Unknown
Total
# # 159 301 373 448 417 377
# 10,062 12,130 11,616 11,504 11,506 11,009 10,407
# 87,674 95,643 96,759 97,883 99,773 101,264 101,073
# 2,406 346 209 269 256 259 210
# 100,143 108,278 108,885 110,029 111,983 112,949 112,067
335
9,274
97,460
183
107,252
324
8,224
98,172
144
106,864
Texas Phone
Other Distraction
None
Unknown
Total
# # . 4,313 4,161 4,130 3,300 3,302
# # . 107,744 103,917 109,041 99,301 103,335
# # . 332,232 324,065 334,756 318,558 335,214
# # . 15,436 14,894 15,903 16,131 16,438
# # . 459,725 447,037 463,830 437,290 458,289
3,171
98,637
322,017
15,702
439,527
3,299
91,490
319,399
14,479
428,667
Utah Phone
Other Distraction
None
Unknown
Total
# # 151 134 146 . . .
# # 707 700 735 . . .
# # 48,788 45,767 47,142 . . .
# # 3,724 3,788 5,882 . . .
# # 53,370 50,389 53,905 . . .
.
.
.
.
.
.
.
.
.
.
Virginia Phone
Other Distraction
None
Unknown
Total
# # # # 1,267 1,509 1,625 1,565
# # # # 26,022 24,736 25,174 23,961
# # # # 1,874 1,836 1,766 1,661
# # # # 124,744 125,768 123,127 118,218
# # # # 153,907 153,849 151,692 145,405
1,682
26,965
30
106,639
135,316
1,542
24,706
87,717
2,777
116,742
Washington Phone
Other Distraction
None
Unknown
Total
# # # 706 739 957 1,902 1,779
# 6,932 11,822 12,757 10,402 10,366 15,124 16,982
# 54,754 96,099 95,989 97,174 105,461 100,017 95,700
# 64,569 21,197 18,384 19,401 20,413 19,394 18,640
# 126,255 129,118 127,836 127,716 137,197 136,437 133,101
1,185
17,794
87,127
17,826
123,932
1,398
16,561
81,311
10,800
110,070
. Data is unavailable # Data is available, but specific variables or attributes are unavailable. 77

State Data System: Crash Data Report 2000–2009
Table 4: Motor Vehicle Crashes Where Driver Distraction/Inattention Was a Contributing Factor State Distraction 2000 2001 2002 2003 2004 2005 2006 2007 2008 2009
Wisconsin Phone
Other Distraction
None
Unknown
Total
# # # # # # # #
28,425 27,684 28,410 27,752 27,762 26,791 26,762 27,119
103,215 89,641 92,010 93,200 91,377 91,016 83,761 91,048
21,009 20,663 21,025 22,624 21,146 19,373 19,356 19,578
152,649 137,988 141,445 143,576 140,285 137,180 129,879 137,745
#
25,789
94,425
17,524
137,738
#
24,359
80,080
17,297
121,736
Wyoming Phone
Other Distraction
None
Unknown
Total
# # # # # # # #
2,540 2,613 2,750 2,807 2,750 2,597 2,685 2,818
11,395 11,007 11,317 12,793 12,135 12,569 13,490 13,515
522 604 615 717 687 716 797 1,095
14,457 14,224 14,682 16,317 15,572 15,882 16,972 17,428
285
1,036
16,334
55
17,710
244
957
14,248
58
15,507
. Data is unavailable # Data is available, but specific variables or attributes are unavailable. 78

State Data System: Crash Data Report 2000–2009
Table 5: Motor Vehicle Crashes Reported to Have Rollovers/Overturned Vehicles
This table identifies crashes where the vehicles overturned or rolled over. The most common variables that identify “rollover” or “overturn” crashes are first harmful event, vehicle sequence of events, point of initial impact, and vehicle damage area. Rollover and overturn are often used together and only a few States treat them as separate variables or attributes.
Non‐motorists and motorcycles were excluded from this table. Variation in the yearly counts for some States might be due, in part, to changes in the variables available to identify rollover. For example, a State may have coded only first harmful event at the crash level for several years, and then added several sequence of event variables at the vehicle level, which could capture more instances of rollover.
Table 5 reports rollover crashes by crash severity. Crashes where severity is “unknown” are not included in a separate row, but are included in the totals. They are identified by a single asterisk (*) and are italicized for the specific years.
79

State Data System: Crash Data Report 2000–2009
Table 5: Motor Vehicle Crashes Reported to Have Rollovers/Overturned Vehicles State Severity 2000 2001 2002 2003 2004 2005 2006 2007 2008 2009
Alabama Fatal 172 178 183 180 206 197 219 236 186 86
Injury 2,770 2,614 2,753 2,656 2,887 2,981 3,040 2,921 2,341 1,345
PDO 2,318 2,259 2,373 2,361 2,474 2,465 2,495 2,484 2,168 1,214
Total 5,260 5,051 5,309 5,197 5,567 5,643 5,754 5,641 4,695 2,645
Arkansas Fatal 111 78 98 67 63 87 86 89 68 58
Injury 1,535 1,300 1,179 1,273 1,374 1,384 1,503 1,374 928 847
PDO 1,046 792 640 654 661 545 498 638 639 621
Total 2,692 2,170 1,917 1,994 2,098 2,016 2,087 2,101 1,635 1,526
California Fatal 209 239 388 384 376 385 347 337 245 217
Injury 4,347 4,601 6,877 7,175 7,363 7,558 7,330 7,079 6,098 5,635
PDO 3,562 3,680 4,986 5,077 5,423 5,594 5,500 4,933 4,361 3,883
Total 8,118 8,520 12,251 12,636 13,162 13,537 13,177 12,349 10,704 9,735
Colorado Fatal
Injury
PDO
Total
110 100 123 96 80 . . . . .
2,550 2,345 2,258 2,203 2,134 . . . . .
2,770 2,573 2,552 2,578 2,733 . . . . .
5,430 5,018 4,933 4,877 4,947 . . . . .
Connecticut Fatal 10 13 11 7 6 5 6 7 2 2
Injury 259 278 215 178 178 217 222 224 243 249
PDO 140 168 105 131 128 126 116 211 150 191
Total 409 459 331 316 312 348 344 442 395 442
Delaware Fatal
Injury
PDO
Total
7 3 12 4 1 . . 96 94 88
122 108 130 107 104 . . 485 436 417
120 103 100 125 110 . . 587 537 444
249 214 242 236 215 . . 1,168 1,067 949
Florida Fatal 522 498 538 581 586 690 650 593 364 288
Injury 8,364 8,470 8,344 8,052 8,671 9,030 9,130 9,072 7,562 6,976
PDO 1,869 2,134 1,970 1,870 2,225 2,481 2,566 2,535 2,228 2,000
Total 10,755 11,102 10,852 10,503 11,482 12,201 12,346 12,200 10,154 9,264
. Data is unavailable *For italicized years, the total does not equal the sum of fatal, injury, and PDO crashes because it includes crashes of unknown severity.
80

State Data System: Crash Data Report 2000–2009
Table 5: Motor Vehicle Crashes Reported to Have Rollovers/Overturned Vehicles State Severity 2000 2001 2002 2003 2004 2005 2006 2007 2008 2009
Georgia Fatal 241 269 274 243 285 294 320 316 288 270
Injury 5,704 5,377 5,898 5,476 6,097 6,277 6,960 7,038 6,187 6,223
PDO 3,795 3,927 3,882 3,641 4,075 4,234 6,248 7,735 5,987 6,136
Total 9,740 9,573 10,054 9,360 10,457 10,805 13,528 15,089 12,462 12,629
Illinois Fatal 278 293 293 284 238 290 250 227 200 155
Injury 4,736 4,401 4,731 4,642 4,466 4,391 4,015 3,677 3,260 3,018
PDO 3,948 3,384 3,274 3,106 3,290 3,337 3,178 3,497 3,545 2,533
Total 8,962 8,078 8,298 8,032 7,994 8,018 7,443 7,401 7,005 5,706
Indiana Fatal
Injury
PDO
Total
135 . . 40 52 41 33 33 11 20
2,872 . . 1,243 1,162 1,144 806 700 579 519
2,823 . . 1,408 1,369 1,350 837 884 942 672
5,830 . . 2,691 2,583 2,535 1,676 1,617 1,532 1,211
Iowa Fatal
Injury
PDO
Total
. 39 63 56 48 50 53 62 58 60
. 1,665 1,480 1,444 1,489 1,591 1,542 1,529 1,641 1,452
. 1,627 1,342 1,291 1,167 1,252 1,109 1,422 1,770 1,484
. 3,331 2,885 2,791 2,704 2,893 2,704 3,013 3,469 2,996
Kansas Fatal 56 64 90 145 139 133 156 151 136 80
Injury 1,032 948 1,765 2,212 2,176 2,228 2,385 2,279 2,123 1,424
PDO 782 789 1,486 1,632 1,514 1,506 1,497 1,725 1,410 1,075
Total 1,870 1,801 3,341 3,989 3,829 3,867 4,038 4,155 3,669 2,579
Kentucky Fatal 115 148 175 192 240 280 255 257 216 192
Injury 1,930 1,650 1,951 2,056 2,946 3,105 3,186 3,323 3,235 3,235
PDO 1,184 1,053 1,188 1,626 2,294 2,263 2,322 2,398 2,647 2,511
Total 3,229 2,851 3,314 3,874 5,480 5,648 5,763 5,978 6,098 5,938
Louisiana Fatal
Injury
PDO
Total*
. . . . . 227 252 241 232 162
. . . . . 3,410 3,516 3,404 3,000 3,024
. . . . . 1,625 1,687 1,640 1,527 1,415
. . . . . 5,262 5,455 5,288 4,759 4,601
. Data is unavailable *For italicized years, the total does not equal the sum of fatal, injury, and PDO crashes because it includes crashes of unknown severity.
81

State Data System: Crash Data Report 2000–2009
Table 5: Motor Vehicle Crashes Reported to Have Rollovers/Overturned Vehicles State Severity 2000 2001 2002 2003 2004 2005 2006 2007 2008 2009
Maryland Fatal 149 157 179 154 155 136 174 136 114 121
Injury 2,615 2,771 2,787 2,962 2,809 2,793 2,849 2,915 2,479 2,300
PDO 1,635 1,565 1,865 2,028 1,831 1,861 1,761 1,864 1,626 1,605
Total 4,399 4,493 4,831 5,144 4,795 4,790 4,784 4,915 4,219 4,026
Michigan Fatal 456 262 247 234 204 208 211 189 202 166
Injury 14,734 8,107 7,971 7,847 8,178 7,423 6,721 6,972 6,425 5,995
PDO 44,738 10,282 9,881 9,392 11,059 10,102 8,439 9,302 9,771 8,865
Total 59,928 18,651 18,099 17,473 19,441 17,733 15,371 16,463 16,398 15,026
Minnesota Fatal
Injury
PDO
Total
164 166 194 . 151 142 127 143 114 88
3,378 4,156 3,380 . 3,354 2,944 3,029 2,692 3,025 2,651
2,913 4,357 2,588 . 2,537 2,475 2,217 2,100 2,893 2,560
6,455 8,679 6,162 . 6,042 5,561 5,373 4,935 6,032 5,299
Missouri Fatal 91 83 412 380 356 414 350 314 293 238
Injury 2,147 1,887 6,016 5,708 5,838 5,744 5,478 5,219 4,599 4,349
PDO 1,783 1,505 3,387 3,221 3,298 3,158 3,048 3,145 3,032 2,706
Total 4,021 3,475 9,815 9,309 9,492 9,316 8,876 8,678 7,924 7,293
Montana Fatal
Injury
PDO
Total*
83 102 102 126 104 108 112 107 79 .
1,636 1,275 1,523 1,490 1,468 1,403 1,497 1,312 1,279 .
1,189 1,189 1,356 1,289 1,314 1,335 1,330 1,092 1,137 .
2,908 2,567 2,981 2,905 2,886 2,847 2,939 2,512 2,496 .
Nebraska Fatal 78 62 104 84 74 82 61 71 71 77
Injury 1,754 1,677 1,656 1,568 1,609 1,372 1,290 1,276 1,193 1,231
PDO 923 1,055 1,024 1,102 1,036 943 962 869 784 783
Total 2,755 2,794 2,784 2,754 2,719 2,397 2,313 2,216 2,048 2,091
New Jersey Fatal
Injury
PDO
Total
. 84 74 72 87 92 104 90 100 63
. 2,601 2,609 2,690 2,922 2,806 3,100 2,975 2,788 2,534
. 1,242 1,194 1,426 1,306 1,381 1,397 1,427 1,300 1,209
. 3,927 3,877 4,188 4,315 4,279 4,601 4,492 4,188 3,806
. Data is unavailable *For italicized years, the total does not equal the sum of fatal, injury, and PDO crashes because it includes crashes of unknown severity.
82

State Data System: Crash Data Report 2000–2009
Table 5: Motor Vehicle Crashes Reported to Have Rollovers/Overturned Vehicles State Severity 2000 2001 2002 2003 2004 2005 2006 2007 2008 2009
New Mexico Fatal 132 146 139 150 162 185 155 140 137 113
Injury 1,575 1,671 1,692 1,469 1,534 1,259 950 1,096 1,102 1,240
PDO 1,006 1,165 1,101 942 1,182 821 795 919 855 953
Total 2,713 2,982 2,932 2,561 2,878 2,265 1,900 2,155 2,094 2,306
New York Fatal
Injury
PDO
Total
32 . 27 20 27 20 22 20 8 12
1,316 . 1,343 1,317 1,236 1,131 987 990 869 770
857 . 199 204 167 183 365 669 629 518
2,205 . 1,569 1,541 1,430 1,334 1,374 1,679 1,506 1,300
North Carolina Fatal 354 372 379 405 401 392 424 467 398 359
Injury 8,437 8,103 8,527 8,568 9,243 8,741 8,589 9,167 8,112 7,557
PDO 3,798 3,372 3,898 4,282 4,515 4,119 3,934 4,215 3,946 3,843
Total* 13,305 12,544 13,521 13,988 14,933 13,932 13,597 14,537 13,132 12,322
North Dakota Fatal
Injury
PDO
Total
. . . 46 37 60 58 51 42 54
. . . 624 571 574 613 563 589 342
. . . 709 918 708 655 631 748 972
. . . 1,379 1,526 1,342 1,326 1,245 1,379 1,368
Ohio Fatal 211 313 320 267 283 281 261 250 206 214
Injury 5,345 6,175 6,429 6,208 6,599 6,586 5,897 5,936 5,749 5,372
PDO 2,938 3,059 3,504 3,737 3,902 3,895 2,966 3,349 3,469 3,039
Total* 8,558 9,725 10,456 10,366 11,010 10,948 9,276 9,635 9,507 8,700
Pennsylvania Fatal
Injury
PDO
Total*
309 272 . 289 260 320 320 296 313 231
6,785 6,190 . 6,318 6,242 6,468 6,036 6,146 5,828 5,172
3,770 3,299 . 3,964 3,565 3,783 3,516 4,135 3,409 3,135
10,864 9,761 . 10,571 10,067 10,571 9,872 10,577 9,739 8,711
South Carolina Fatal 140 181 187 203 219 218 203 242 178 174
Injury 1,985 2,592 2,836 2,840 3,213 2,905 3,194 3,255 3,072 2,938
PDO 2,008 2,049 2,514 2,609 2,837 2,717 2,669 2,783 2,570 2,392
Total 4,133 4,822 5,537 5,652 6,269 5,840 6,066 6,280 5,820 5,504
. Data is unavailable *For italicized years, the total does not equal the sum of fatal, injury, and PDO crashes because it includes crashes of unknown severity.
83

State Data System: Crash Data Report 2000–2009
Table 5: Motor Vehicle Crashes Reported to Have Rollovers/Overturned Vehicles State Severity 2000 2001 2002 2003 2004 2005 2006 2007 2008 2009 Texas Fatal
Injury
PDO
Total*
488 520 . 637 499 448 545 495 585 509
5,686 5,886 . 8,527 8,061 8,387 9,154 7,973 7,740 7,304
390 349 . 4,987 4,936 5,065 5,566 5,363 5,153 4,806
6,564 6,755 . 14,617 13,929 14,370 15,829 14,335 14,084 13,162
Utah Fatal
Injury
PDO
Total
146 111 143 139 127 . . . . .
2,425 2,448 2,493 1,996 2,193 . . . . .
1,166 1,164 1,129 1,016 1,124 . . . . .
3,737 3,723 3,765 3,151 3,444 . . . . .
Virginia Fatal 63 66 61 60 71 50 53 50 61 59
Injury 1,843 1,845 1,685 1,895 2,139 2,019 1,787 1,773 1,877 1,558
PDO 1,227 1,126 1,220 1,412 1,689 1,483 1,358 1,257 1,205 1,051
Total 3,133 3,037 2,966 3,367 3,899 3,552 3,198 3,080 3,143 2,668
Washington Fatal 50 81 210 153 148 166 165 152 130 136
Injury 1,786 2,517 4,208 3,923 3,709 4,076 3,776 3,600 3,265 3,237
PDO 1,330 2,022 3,277 3,160 3,145 3,326 3,243 3,340 3,087 2,927
Total* 3,166 4,620 7,695 7,236 7,002 7,568 7,184 7,093 6,482 6,300
Wisconsin Fatal 102 114 118 124 120 116 111 94 85 90
Injury 2,968 3,060 2,744 2,859 2,888 2,781 2,629 2,832 2,838 2,350
PDO 2,607 2,852 2,180 2,288 2,555 2,449 2,216 2,634 3,497 2,623
Total 5,677 6,026 5,042 5,271 5,563 5,346 4,956 5,560 6,420 5,063
Wyoming Fatal 84 102 87 73 82 81 98 69 68 70
Injury 1,161 1,095 1,196 1,200 1,162 1,156 1,206 1,203 1,082 889
PDO 904 889 988 1,070 810 942 1,118 961 1,194 841
Total 2,149 2,086 2,271 2,343 2,054 2,179 2,422 2,233 2,344 1,800
. Data is unavailable *For italicized years, the total does not equal the sum of fatal, injury, and PDO crashes because it includes crashes of unknown severity.
84

State Data System: Crash Data Report 2000–2009
Table 6: Motor Vehicle Crashes Reported to Be Related to Speeding
This table identifies crashes where motor vehicles were reported to have been speeding at the time of the crash. Although almost all States address the issue of speeding, States provide different variables to identify speed‐related crashes. For example, some States identify which vehicle in the crash was speeding, or driving too fast for conditions, while other States include information on speeding violations or capture this information only in a crash‐level variable such as “contributing factors.” In this table, speeding was not derived based on variables such as “posted speed limit” and “actual speed.”
States with specific years where speed‐related crashes cannot be identified are represented by a pound symbol (#). Crashes where severity is “unknown” are not included as a separate row, but are included in the totals. They can identified by a single asterisk (*) and are italicized for the specific years.
85

State Data System: Crash Data Report 2000–2009
Table 6: Motor Vehicle Crashes Reported to Be Related to Speeding State Severity 2000 2001 2002 2003 2004 2005 2006 2007 2008 2009
Alabama Fatal 278 257 298 293 318 334 370 359 338 248
Injury 3,271 3,131 3,256 3,210 3,329 3,504 3,715 3,392 2,959 2,956
PDO 3,798 3,781 4,105 3,996 3,947 4,090 4,086 3,904 3,654 4,502
Total 7,347 7,169 7,659 7,499 7,594 7,928 8,171 7,655 6,951 7,706
Arkansas Fatal 126 109 97 80 94 66 64 50 45 50
Injury 2,941 2,292 2,419 2,197 2,802 1,997 2,102 1,673 1,443 1,243
PDO 4,649 2,827 2,762 2,263 2,680 1,666 1,574 2,001 2,373 2,375
Total 7,716 5,228 5,278 4,540 5,576 3,729 3,740 3,724 3,861 3,668
California Fatal 841 932 1,048 1,067 1,021 1,132 1,128 1,134 914 769
Injury 66,347 67,648 67,039 67,604 67,695 67,213 64,067 61,757 56,336 54,286
PDO 105,517 110,427 113,580 113,180 113,932 113,930 112,691 106,878 94,568 89,794
Total 172,705 179,007 181,667 181,851 182,648 182,275 177,886 169,769 151,818 144,849
Connecticut Fatal 59 58 73 50 49 37 34 40 26 41
Injury 4,056 3,756 3,509 3,781 3,511 3,452 2,916 3,060 2,655 2,770
PDO 5,713 5,558 4,860 6,029 5,767 5,995 3,939 7,707 7,131 7,900
Total 9,828 9,372 8,442 9,860 9,327 9,484 6,889 10,807 9,812 10,711
Delaware Fatal
Injury
PDO
Total
13 15 20 22 24 . . 32 21 22
390 388 407 399 368 . . 465 424 396
806 725 851 954 895 . . 808 694 759
1,209 1,128 1,278 1,375 1,287 . . 1,305 1,139 1,177
Florida Fatal 438 412 466 457 479 482 535 491 307 223
Injury 5,142 5,167 5,774 5,048 5,055 5,220 4,968 4,773 4,131 3,693
PDO 2,303 2,667 2,841 2,496 2,584 2,743 2,557 2,683 2,430 2,110
Total 7,883 8,246 9,081 8,001 8,118 8,445 8,060 7,947 6,868 6,026
Georgia Fatal 293 308 288 305 303 309 342 323 273 127
Injury 7,908 7,938 8,260 8,072 8,144 8,093 7,558 7,104 6,443 2,873
PDO 10,978 10,705 11,523 11,463 11,263 11,324 10,323 9,545 9,031 5,052
Total 19,179 18,951 20,071 19,840 19,710 19,726 18,223 16,972 15,747 8,052
. Data is unavailable # Data is available, but specific variables or attributes are unavailable. *For italicized years, the total does not equal the sum of fatal, injury, and PDO crashes because it includes crashes of unknown severity.
86

State Data System: Crash Data Report 2000–2009
Table 6: Motor Vehicle Crashes Reported to Be Related to Speeding State Severity 2000 2001 2002 2003 2004 2005 2006 2007 2008 2009 Illinois Fatal 297 282 319 394 341 306 317 261 245 209
Injury 15,010 12,694 13,535 14,495 13,629 12,555 10,873 11,492 11,692 10,151
PDO 32,819 25,582 29,992 32,664 33,072 32,197 27,677 35,466 40,898 26,926
Total* 48,126 38,558 43,846 47,553 47,042 45,058 38,867 47,219 52,835 37,286
Indiana Fatal
Injury
PDO
Total
189 . . 173 172 202 156 161 183 133
4,893 . . 5,153 5,098 4,994 4,162 4,236 4,533 3,894
10,536 . . 12,718 12,974 14,165 9,669 13,397 17,286 13,424
15,618 . . 18,044 18,244 19,361 13,987 17,794 22,002 17,451
Iowa Fatal
Injury
PDO
Total
. 43 47 62 44 61 55 58 53 42
. 1,600 1,474 1,543 1,647 1,694 1,410 1,692 1,954 1,450
. 2,207 1,999 2,645 2,555 2,802 1,859 3,425 4,473 3,447
. 3,850 3,520 4,250 4,246 4,557 3,324 5,175 6,480 4,939
Kansas Fatal 108 111 121 112 94 100 110 89 87 82
Injury 3,287 3,052 2,966 2,618 2,689 2,657 2,249 2,755 2,347 1,890
PDO 5,835 5,422 5,682 5,638 5,369 5,379 3,809 6,636 5,483 4,139
Total 9,230 8,585 8,769 8,368 8,152 8,136 6,168 9,480 7,917 6,111
Kentucky Fatal 151 151 171 160 179 181 160 146 132 115
Injury 3,611 3,060 3,198 3,127 2,950 2,730 2,570 2,173 2,239 2,054
PDO 5,573 4,839 5,357 6,073 5,878 4,842 4,815 4,197 4,785 4,732
Total 9,335 8,050 8,726 9,360 9,007 7,753 7,545 6,516 7,156 6,901
Louisiana Fatal
Injury
PDO
Total*
. . . . . 49 58 58 46 52
. . . . . 732 783 639 587 630
. . . . . 937 1,015 873 836 969
. . . . . 1,718 1,856 1,571 1,469 1,651
Maryland Fatal 206 199 202 192 202 203 224 195 179 177
Injury 7,835 7,542 7,844 9,265 8,415 8,716 8,782 8,666 8,068 8,007
PDO 10,427 10,149 11,636 14,011 12,832 13,452 13,518 13,781 13,274 13,674
Total 18,468 17,890 19,682 23,468 21,449 22,371 22,524 22,642 21,521 21,858
. Data is unavailable # Data is available, but specific variables or attributes are unavailable. *For italicized years, the total does not equal the sum of fatal, injury, and PDO crashes because it includes crashes of unknown severity.
87

State Data System: Crash Data Report 2000–2009
Table 6: Motor Vehicle Crashes Reported to Be Related to Speeding State Severity 2000 2001 2002 2003 2004 2005 2006 2007 2008 2009
Michigan Fatal 260 275 260 271 223 228 210 207 202 171
Injury 11,716 9,881 10,181 10,907 9,788 9,696 7,729 9,054 9,639 8,290
PDO 30,304 23,612 26,395 29,449 27,635 29,227 19,703 27,739 33,792 25,233
Total* 42,280 33,768 36,836 40,627 37,646 39,151 27,642 37,000 43,633 33,694
Minnesota Fatal
Injury
PDO
Total
158 144 165 . 138 140 140 106 113 80
5,315 5,142 4,633 . 4,642 4,235 3,659 3,714 3,781 3,128
9,929 8,950 8,113 . 8,296 7,980 5,902 7,076 7,889 6,707
15,402 14,236 12,911 . 13,076 12,355 9,701 10,896 11,783 9,915
Missouri Fatal 353 367 428 447 417 451 397 371 368 321
Injury 10,410 9,522 11,039 10,682 10,801 10,125 9,241 9,886 9,078 8,371
PDO 19,261 16,597 20,129 20,513 20,111 19,015 16,855 20,678 19,813 17,797
Total 30,024 26,486 31,596 31,642 31,329 29,591 26,493 30,935 29,259 26,489
Montana Fatal
Injury
PDO
Total*
78 77 83 86 81 81 86 85 53 .
1,613 1,219 1,558 1,524 1,300 1,375 1,330 1,267 977 .
2,947 2,309 3,108 3,277 2,295 2,852 2,488 2,515 2,317 .
4,638 3,606 4,749 4,887 3,677 4,309 3,905 3,869 3,347 .
Nebraska Fatal
Injury
PDO
Total
# # 32 30 27 27 26 27 22 20
# # 1,106 1,063 1,062 1,053 649 1,043 811 840
# # 1,603 1,865 1,371 1,619 892 1,721 1,487 1,581
# # 2,741 2,958 2,460 2,699 1,567 2,791 2,320 2,441
New Jersey Fatal
Injury
PDO
Total
. 87 73 105 101 103 163 164 139 99
. 4,161 4,661 5,043 4,925 4,945 7,200 7,186 6,742 6,771
. 7,707 8,762 10,264 9,858 10,401 13,499 15,490 14,488 15,230
. 11,955 13,496 15,412 14,884 15,449 20,862 22,840 21,369 22,100
New Mexico Fatal
Injury
PDO
Total
# # # 151 168 159 159 149 141 142
# # # 2,785 3,272 2,614 2,397 2,349 2,313 2,260
# # # 3,419 4,780 3,689 4,034 4,358 4,116 3,935
# # # 6,355 8,220 6,462 6,590 6,856 6,570 6,337
. Data is unavailable # Data is available, but specific variables or attributes are unavailable. *For italicized years, the total does not equal the sum of fatal, injury, and PDO crashes because it includes crashes of unknown severity.
88

State Data System: Crash Data Report 2000–2009
Table 6: Motor Vehicle Crashes Reported to Be Related to Speeding State Severity 2000 2001 2002 2003 2004 2005 2006 2007 2008 2009
New York Fatal
Injury
PDO
Total
350 . 402 395 385 377 384 361 368 309
16,116 . 15,415 14,481 13,833 13,820 12,654 14,003 13,831 12,822
14,881 . 1,238 118 511 1,727 7,366 16,672 17,342 15,085
31,347 . 17,055 14,994 14,729 15,924 20,404 31,036 31,541 28,216
North Carolina Fatal 540 516 557 504 498 453 495 519 402 369
Injury 14,911 12,531 13,190 13,147 13,271 11,472 10,393 9,959 9,095 9,011
PDO 14,050 10,757 14,097 15,988 16,313 12,960 11,390 10,909 10,648 13,272
Total* 29,804 24,061 28,137 29,887 30,312 25,125 22,522 21,626 20,446 22,944
North Dakota Fatal
Injury
PDO
Total
. . . 25 29 36 37 41 30 34
. . . 659 611 638 608 617 639 438
. . . 1,825 1,920 1,801 1,449 1,601 1,898 2,092
. . . 2,509 2,560 2,475 2,094 2,259 2,567 2,564
Ohio Fatal 433 452 419 365 376 372 357 381 348 287
Injury 15,159 14,312 14,508 14,519 14,331 13,639 12,647 12,790 13,278 11,750
PDO 23,812 22,133 24,095 25,318 24,299 23,241 20,218 21,649 23,746 19,907
Total* 40,030 38,436 40,404 41,538 40,397 38,363 33,958 35,659 38,263 32,630
Pennsylvania Fatal
Injury
PDO
Total*
285 393 . . 535 650 519 593 498 406
13,676 15,237 . . 18,868 18,584 14,067 14,646 13,473 12,855
11,072 11,615 . . 16,786 16,982 13,291 15,618 14,039 13,552
25,033 27,245 . . 36,189 36,216 27,877 30,857 28,628 27,364
South Carolina Fatal 106 332 375 334 385 399 368 382 330 310
Injury 1,108 9,038 9,429 9,640 9,986 9,532 9,669 9,542 9,408 9,611
PDO 1,577 16,736 20,707 22,023 22,636 23,232 23,317 22,783 22,521 22,762
Total 2,791 26,106 30,511 31,997 33,007 33,163 33,354 32,707 32,259 32,683
Texas Fatal
Injury
PDO
Total*
1,166 1,176 . 984 894 872 968 845 959 791
69,298 70,736 . 63,871 60,945 61,292 57,819 58,772 53,006 51,235
38,000 39,787 . 71,452 71,681 74,128 69,934 79,791 75,641 75,778
108,464 111,699 . 148,547 145,735 148,455 142,033 153,113 141,664 139,849
. Data is unavailable # Data is available, but specific variables or attributes are unavailable. *For italicized years, the total does not equal the sum of fatal, injury, and PDO crashes because it includes crashes of unknown severity.
89

State Data System: Crash Data Report 2000–2009
Table 6: Motor Vehicle Crashes Reported to Be Related to Speeding State Severity 2000 2001 2002 2003 2004 2005 2006 2007 2008 2009 Utah Fatal
Injury
PDO
Total*
103 80 86 78 58 . . . . .
2,934 3,002 2,754 2,599 2,051 . . . . .
4,678 5,028 4,342 4,476 3,654 . . . . .
7,715 8,110 7,183 7,153 5,763 . . . . .
Virginia Fatal 375 378 392 394 360 384 392 431 124 99
Injury 15,579 16,217 16,902 17,565 14,327 13,133 12,117 11,510 2,923 2,607
PDO 20,325 20,976 23,167 26,137 20,595 19,211 16,922 17,194 3,446 3,348
Total 36,279 37,571 40,461 44,096 35,282 32,728 29,431 29,135 6,493 6,054
Washington Fatal 116 196 270 193 196 200 214 210 188 184
Injury 7,039 11,784 11,718 10,572 10,416 11,452 11,056 10,659 9,687 8,766
PDO 8,377 14,940 16,499 15,541 15,719 17,687 17,688 18,552 17,654 15,270
Total 15,532 26,920 28,487 26,306 26,331 29,339 28,959 29,422 27,529 24,220
Wisconsin Fatal 203 215 237 249 234 227 242 226 170 160
Injury 8,150 6,457 6,817 6,913 7,043 7,074 5,986 6,618 7,141 5,189
PDO 14,906 9,803 11,631 12,757 13,094 14,278 10,579 13,644 17,844 11,802
Total 23,259 16,475 18,685 19,919 20,371 21,579 16,807 20,488 25,155 17,151
Wyoming Fatal 21 31 26 34 36 25 35 34 59 42
Injury 861 749 779 873 759 725 874 909 1,086 818
PDO 2,055 1,722 1,795 2,190 1,662 1,823 2,144 2,298 2,947 2,494
Total 2,937 2,502 2,600 3,097 2,457 2,573 3,053 3,241 4,092 3,354
. Data is unavailable # Data is available, but specific variables or attributes are unavailable. *For italicized years, the total does not equal the sum of fatal, injury, and PDO crashes because it includes crashes of unknown severity.
90

State Data System: Crash Data Report 2000–2009
Table 7: Motor Vehicle Crashes With Passenger Vehicle Cargo Loss or Shift
A topic of recent interest to the traffic safety community is gauging the degree of risk posed by passenger vehicles with improperly secured loads. At issue are fallen loads that are struck by another vehicle and fallen loads that are not struck but cause vehicles to strike other objects while trying to avoid them. A recent survey of NHTSA data conducted by the Government Accountability Office found that very few States collect the kind of data needed for this type of assessment (Federal and State Efforts‐Related to Accidents that Involve Non‐Commercial Vehicles Carrying Unsecured Loads, Report No. GAO‐13‐24, November 2012)
States frequently code “cargo loss or shift” as part of the sequence of vehicle events. However, it is usually not possible to determine whether the cargo was improperly secured, whether the cargo was struck, or whether another vehicle struck some other object while trying to avoid the fallen cargo. Only one SDS State coded “collision with fallen load” during the 2000–2009 timeframe, and for this State it was impossible to know whether the fallen load had been on a passenger vehicle.
It was determined that 13 States in the SDS provide data that allow a count of crashes where passenger vehicles experienced a cargo loss or shift. States frequently combine these two types of event into one category termed “cargo loss or shift.” Where the data allows, this table also shows a subset of these crashes where another vehicle in the crash struck a non‐fixed object. Unfortunately, it is not possible to determine whether the non‐fixed object was actually the cargo lost by the passenger vehicle. However, because vehicle number is frequently assigned based on the sequence of events in a crash, the vehicles identified as having struck a non‐fixed object were restricted to those with a vehicle number higher than that of the passenger vehicle with cargo loss or shift.
The first row for each State shows the number of crashes where a passenger vehicle experienced cargo loss or shift and another vehicle in the crash, with a higher vehicle number, struck a non‐fixed object. It seems likely that this count is the upper bound for the number of crashes where a vehicle struck cargo from a passenger vehicle. The second row, showing crashes where a passenger vehicle experienced cargo loss/shift but non‐fixed objects were not struck, represents the upper bound for crashes where a vehicle may have swerved to avoid the cargo but did not strike it. However for both of these scenarios some crashes may have been eliminated by the requirement that the vehicle with cargo loss must have a higher vehicle number than that of the other vehicle.
91

State Data System: Crash Data Report 2000–2009
Table 7: Motor Vehicle Crashes With Passenger Vehicle Cargo Loss or Shift State Cargo Loss 2000 2001 2002 2003 2004 2005 2006 2007 2008 2009
Delaware Cargo Loss: With Strike*
Cargo Loss: No Strike**
Total
# # # # # .
# # # # # .
# # # # # .
.
.
.
0
16
16
1
17
18
1
19
20
Florida Cargo Loss: With Strike*
Cargo Loss: No Strike**
Total
# # 60 54 78 88
# # 214 197 229 280
# # 274 251 307 368
105
257
362
117
189
306
114
167
281
100
164
264
Illinois Cargo Loss: With Strike*
Cargo Loss: No Strike**
Total
40 37 52 60 77 59
118 108 109 97 100 104
158 145 161 157 177 163
18
112
130
19
116
135
40
66
106
26
35
61
Indiana Cargo Loss: With Strike*
Cargo Loss: No Strike**
Total
# . . 0 0 0
# . . 798 303 356
# . . 798 303 356
0
501
501
0
697
697
0
705
705
0
590
590
Iowa Cargo Loss: With Strike*
Cargo Loss: No Strike**
Total
. 8 9 12 6 20
. 59 78 83 71 78
. 67 87 95 77 98
7
64
71
14
65
79
4
66
70
8
59
67
Kentucky Cargo Loss: With Strike*
Cargo Loss: No Strike**
Total
80 64 81 46 51 51
87 79 95 84 97 92
167 143 176 130 148 143
59
108
167
60
100
160
54
83
137
52
91
143
Louisiana Cargo Loss: With Strike*
Cargo Loss: No Strike**
Total
. . . . . 121
. . . . . 275
. . . . . 396
129
311
440
119
175
294
100
163
263
102
170
272
Michigan Cargo Loss: With Strike*
Cargo Loss: No Strike**
Total
256 218 222 240 218 209
592 506 535 528 634 655
848 724 757 768 852 864
199
427
626
192
414
606
166
418
584
166
386
552
Minnesota Cargo Loss: With Strike*
Cargo Loss: No Strike**
Total
30 21 26 . 9 19
151 161 164 . 113 91
181 182 190 . 122 110
14
96
110
8
73
81
8
58
66
10
49
59
. Data is unavailable # Data is available, but specific variables or attributes are unavailable * A passenger vehicle had cargo loss and a second vehicle in the crash struck a non‐fixed object (likely upper bound for the number of crashes where a vehicle struck cargo from a passenger vehicle). ** A passenger vehicle had cargo loss but a second vehicle in the crash did not strike a non‐fixed object (likely upper bound for the number of crashes where passenger vehicle cargo loss may have played a role in the crash, but the cargo was not struck in that crash). 92

State Data System: Crash Data Report 2000–2009
Table 7: Motor Vehicle Crashes With Passenger Vehicle Cargo Loss or Shift State Cargo Loss 2000 2001 2002 2003 2004 2005 2006 2007 2008 2009
Missouri Cargo Loss: With Strike*
Cargo Loss: No Strike**
Total
# # 77 32 34 25
# # 479 484 560 547
# # 556 516 594 572
17
602
619
22
551
573
7
462
469
12
476
488
New Jersey Cargo Loss: With Strike*
Cargo Loss: No Strike**
Total
. 20 18 31 38 35
. 125 146 118 146 143
. 145 164 149 184 178
55
114
169
50
121
171
44
105
149
62
88
150
Ohio Cargo Loss: With Strike*
Cargo Loss: No Strike**
Total
106 218 213 222 233 212
879 871 925 813 851 773
985 1,089 1,138 1,035 1,084 985
221
701
922
199
682
881
174
592
766
167
566
733
South Carolina
Cargo Loss: With Strike*
Cargo Loss: No Strike**
Total
# 0 0 0 0 0
# 128 143 143 153 122
# 128 143 143 153 122
0
150
150
0
170
170
28
193
221
30
213
243
Washington Cargo Loss: With Strike*
Cargo Loss: No Strike**
Total
# # 34 23 43 38
# # 48 34 57 60
# # 82 57 100 98
40
40
80
37
44
81
33
36
69
38
34
72
. Data is unavailable # Data is available, but specific variables or attributes are unavailable * A passenger vehicle had cargo loss and a second vehicle in the crash struck a non‐fixed object (likely upper bound for the number of crashes where a vehicle struck cargo from a passenger vehicle). ** A passenger vehicle had cargo loss but a second vehicle in the crash did not strike a non‐fixed object (likely upper bound for the number of crashes where passenger vehicle cargo loss may have played a role in the crash, but the cargo was not struck in that crash). 93

State Data System: Crash Data Report 2000–2009
VEHICLES
94

State Data System: Crash Data Report 2000–2009
Table 8: Motor Vehicles Involved in Crashes by Vehicle Type and Crash Severity
This table counts the motor vehicles involved in crashes by the following vehicle type categories.
Passenger Car Light Truck Large Truck Motorcycle Bus Other/Unknown
The motor vehicles are further grouped into 3 crash severity categories.
Fatal Injury Property Damage Only (PDO)
If a State included parked vehicles in its files, they are included in the vehicle counts in Table 8. One reason they are included is that many States do not distinguish between illegal and legal parking. Consequently some vehicles that NHTSA would consider in transport (e.g., illegally parked on a roadway) might be classified as “parked” by a State. The motor vehicle types in Table 8 are defined as follows:
Passenger car: Includes vehicles such as compact, mid‐size, 2‐door, 4‐door, sedan, and hatchback.
Light truck: Includes pick‐up trucks, SUVs, utility trucks, vans, or trucks with gross vehicle weight ratings (GVWRs) of less than equal to 10,000 pounds.
Large truck: Includes all trucks with GVWR greater than 10,000 pounds. The common attributes that States use are: single unit truck, truck/trailer, truck/tractor, and truck/semi‐trailer.
Motorcycle: Includes all motorcycles, mopeds, and motor scooters.
Bus: Includes all types of buses including school buses.
Vehicle type attributes such as “car with trailer” or “pickup with trailer” were categorized based on the vehicle type of the power unit.
“Other/unknown” includes all other vehicle types that cannot be categorized in the above mentioned five vehicle types. The “other/unknown” category varies significantly from State to State. Some States have an “other” or “unknown” attribute while other States have a variety of vehicle types—such as farm machine, motor home/RV, emergency vehicle, snowmobile, and construction equipment. If a State had missing values, the missing values were grouped into the “other/unknown” category.
Appendix IV gives examples of how some of the vehicle type attributes used by the States are distributed among the categories.
95

State Data System: Crash Data Report 2000–2009
Table 8: Motor Vehicles Involved in Crashes by Vehicle Type and Crash Severity
State Severity Vehicle Type 2000 2001 2002 2003 2004 2005 2006 2007 2008 2009
Alabama Fatal
Injury
Passenger Car
Light Truck
Large Truck
Motorcycle
Bus
Other/Unknown
Total
686 646 664 646 703 695 671 615 540 475
471 515 509 514 611 657 661 615 519 410
158 151 129 162 143 131 135 128 125 84
47 43 47 52 75 65 109 89 97 75
3 4 1 2 4 0 7 6 2 3
86 95 93 89 113 104 109 102 93 104
1,451 1,454 1,443 1,465 1,649 1,652 1,692 1,555 1,376 1,151
Passenger Car 33,222 32,541 33,022 31,926 32,364 30,726 29,060 26,441 23,969 23,880
Light Truck 17,163 17,864 18,911 19,379 20,312 20,601 20,414 19,388 17,216 15,254
Large Truck 1,879 1,846 1,858 1,820 2,119 2,017 1,764 1,539 1,197 1,225
Motorcycle 645 730 753 906 1,022 1,286 1,355 1,345 1,405 1,066
Bus 99 94 86 92 118 109 107 100 84 99
Other/Unknown 839 863 895 884 899 874 881 795 751 2,841
PDO
Total 53,847 53,938 55,525 55,007 56,834 55,613 53,581 49,608 44,622 44,365
Passenger Car 114,830 115,182 118,595 116,674 119,348 115,548 110,302 107,595 98,332 96,723
Light Truck 65,119 68,532 72,757 75,614 80,115 81,258 79,499 79,600 72,514 64,759
Large Truck 7,736 7,276 7,704 7,879 8,616 8,323 7,770 6,970 6,061 5,390
Motorcycle 293 331 333 383 485 551 602 646 660 538
Bus 485 491 507 605 600 623 622 653 567 563
Other/Unknown 1,411 1,555 1,654 1,634 1,981 1,735 1,659 1,408 1,274 9,927
Total 189,874 193,367 201,550 202,789 211,145 208,038 200,454 196,872 179,408 177,900
. Data is unavailable # Data is available, but specific variables or attributes are unavailable. 96

State Data System: Crash Data Report 2000–2009
Table 8: Motor Vehicles Involved in Crashes by Vehicle Type and Crash Severity
State Severity Vehicle Type 2000 2001 2002 2003 2004 2005 2006 2007 2008 2009
Arkansas Fatal
Injury
Passenger Car
Light Truck
Large Truck
Motorcycle
Bus
Other/Unknown
Total
377 344 344 319 387 321 288 296 277 266
323 299 333 338 387 365 399 348 326 348
96 94 73 101 93 137 99 111 75 96
33 39 41 52 58 68 74 80 75 68
1 6 2 1 6 3 0 2 4 1
27 18 24 18 25 19 27 17 25 13
857 800 817 829 956 913 887 854 782 792
Passenger Car 23,747 25,544 27,164 28,582 29,901 28,920 29,145 22,609 18,084 16,226
Light Truck 14,443 17,280 19,672 20,009 24,609 24,696 26,055 20,204 16,061 14,891
Large Truck 1,281 1,553 1,687 1,693 2,194 2,231 2,305 1,872 1,485 1,196
Motorcycle 599 789 798 841 1,109 1,377 1,364 1,368 1,438 1,167
Bus 100 141 145 153 165 196 200 142 134 106
Other/Unknown 1,064 1,629 1,371 1,520 968 911 907 617 553 630
PDO
Total 41,234 46,936 50,837 52,798 58,946 58,331 59,976 46,812 37,755 34,216
Passenger Car 47,550 40,622 40,071 38,469 36,174 32,634 29,310 34,155 35,477 36,801
Light Truck 31,114 28,980 30,783 28,924 31,487 28,593 26,309 31,816 32,973 34,719
Large Truck 2,859 2,836 3,014 2,913 3,379 2,850 2,382 2,813 3,015 2,803
Motorcycle 178 169 144 182 164 225 194 272 346 347
Bus 212 251 246 204 209 202 186 273 243 287
Other/Unknown 3,070 3,809 2,815 2,899 1,889 1,682 1,314 1,413 1,369 1,401
Total 84,983 76,667 77,073 73,591 73,302 66,186 59,695 70,742 73,423 76,358
. Data is unavailable # Data is available, but specific variables or attributes are unavailable. 97

State Data System: Crash Data Report 2000–2009
Table 8: Motor Vehicles Involved in Crashes by Vehicle Type and Crash Severity
State Severity Vehicle Type 2000 2001 2002 2003 2004 2005 2006 2007 2008 2009
California Fatal
Injury
Passenger Car
Light Truck
Large Truck
Motorcycle
Bus
Other/Unknown
Total
3,281 3,669 3,832 3,797 3,300 3,434 3,377 3,340 2,961 2,714
1,230 1,094 1,052 1,094 969 948 953 891 725 730
403 400 380 363 369 367 387 392 292 261
288 300 327 387 381 428 452 487 566 406
42 38 44 37 31 35 48 38 36 26
100 98 597 445 930 890 868 647 370 265
5,344 5,599 6,232 6,123 5,980 6,102 6,085 5,795 4,950 4,402
Passenger Car 278,419 298,488 304,316 292,018 241,163 233,019 221,209 227,944 211,883 208,962
Light Truck 79,611 65,509 60,378 58,543 50,269 45,689 42,673 41,578 36,554 35,088
Large Truck 9,261 9,245 8,781 8,755 8,524 8,423 7,856 7,397 6,181 5,150
Motorcycle 7,311 8,087 8,639 9,488 9,348 9,332 10,069 11,091 11,689 10,419
Bus 2,316 2,203 2,189 2,013 1,750 1,829 1,748 1,852 1,911 1,657
Other/Unknown 4,027 4,255 16,455 25,320 81,855 84,236 80,130 62,904 51,523 45,404
PDO
Total 380,945 387,787 400,758 396,137 392,909 382,528 363,685 352,766 319,741 306,680
Passenger Car 411,731 446,973 477,158 460,881 393,548 372,046 366,362 369,499 341,617 327,089
Light Truck 133,696 115,956 112,711 107,947 95,035 84,909 82,673 80,232 69,632 65,273
Large Truck 29,801 28,377 28,312 27,723 26,111 25,108 24,388 23,357 19,730 16,512
Motorcycle 1,534 1,690 2,095 2,180 2,018 2,079 2,226 2,471 2,663 2,310
Bus 4,677 4,982 5,154 4,830 4,390 4,508 4,480 4,955 4,600 4,197
Other/Unknown 16,568 16,995 29,465 38,223 120,831 148,592 148,443 124,578 97,640 82,298
Total 598,007 614,973 654,895 641,784 641,933 637,242 628,572 605,092 535,882 497,679
. Data is unavailable # Data is available, but specific variables or attributes are unavailable. 98

State Data System: Crash Data Report 2000–2009
Table 8: Motor Vehicles Involved in Crashes by Vehicle Type and Crash Severity
State Severity Vehicle Type 2000 2001 2002 2003 2004 2005 2006 2007 2008 2009
Colorado Fatal
Injury
PDO
Passenger Car
Light Truck
Large Truck
Motorcycle
Bus
Other/Unknown
Total
604 567 612 515 581 . .
220 250 235 189 223 . .
66 87 48 61 63 . .
69 85 71 63 81 . .
5 6 6 9 4 . .
297 338 353 318 281 . .
1,261 1,333 1,325 1,155 1,233 . .
.
.
.
.
.
.
.
.
.
.
.
.
.
.
.
.
.
.
.
.
.
Passenger Car
Light Truck
Large Truck
Motorcycle
Bus
Other/Unknown
Total
46,345 46,400 46,567 41,681 43,841 . .
12,110 12,199 11,933 10,418 10,685 . .
1,215 1,172 1,187 1,053 1,130 . .
1,434 1,563 1,713 1,676 1,821 . .
226 286 267 244 217 . .
7,862 8,026 7,780 10,346 7,790 . .
69,192 69,646 69,447 65,418 65,484 . .
.
.
.
.
.
.
.
.
.
.
.
.
.
.
.
.
.
.
.
.
.
Passenger Car
Light Truck
Large Truck
Motorcycle
Bus
Other/Unknown
Total
119,862 125,129 127,138 117,470 139,266 . .
36,644 38,025 38,148 34,595 40,205 . .
4,259 4,100 4,323 4,198 4,803 . .
502 543 588 558 689 . .
1,196 1,333 1,349 1,203 1,296 . .
29,238 32,809 33,369 35,110 57,461 . .
191,701 201,939 204,915 193,134 243,720 . .
.
.
.
.
.
.
.
.
.
.
.
.
.
.
.
.
.
.
.
.
.
. Data is unavailable # Data is available, but specific variables or attributes are unavailable. 99

State Data System: Crash Data Report 2000–2009
Table 8: Motor Vehicles Involved in Crashes by Vehicle Type and Crash Severity
State Severity Vehicle Type 2000 2001 2002 2003 2004 2005 2006 2007 2008 2009
Connecticut Fatal
Injury
Passenger Car
Light Truck
Large Truck
Motorcycle
Bus
Other/Unknown
Total
308 303 295 291 259 284 310 280 272 207
33 23 22 16 28 17 24 21 24 14
84 66 55 63 65 58 67 60 58 38
51 49 50 28 58 47 59 40 59 48
2 0 2 1 3 5 4 2 3 2
6 7 4 10 15 10 8 13 6 3
484 448 428 409 428 421 472 416 422 312
Passenger Car 53,413 53,130 49,525 47,539 47,322 44,681 41,972 43,257 39,588 39,153
Light Truck 2,818 2,945 2,702 2,908 2,611 2,637 2,288 2,139 1,756 1,758
Large Truck 6,303 5,917 5,442 5,545 5,472 5,179 4,588 4,731 4,355 4,453
Motorcycle 930 1,043 993 963 1,046 1,134 1,121 1,372 1,380 1,154
Bus 349 341 285 282 273 289 288 271 263 281
Other/Unknown 916 931 835 806 736 738 658 804 710 645
PDO
Total 64,729 64,307 59,782 58,043 57,460 54,658 50,915 52,574 48,052 47,444
Passenger Car 69,826 71,682 69,556 72,076 74,443 73,000 65,909 123,601 114,542 114,439
Light Truck 4,457 4,448 4,292 4,858 4,571 4,478 3,672 6,410 5,545 5,305
Large Truck 11,766 11,505 10,835 11,915 11,830 11,732 10,064 17,768 15,966 15,993
Motorcycle 142 143 173 193 181 217 191 405 403 393
Bus 515 533 432 504 469 479 436 1,285 1,224 1,386
Other/Unknown 1,372 1,411 1,342 1,435 1,304 1,329 1,165 4,028 3,531 3,314
Total 88,078 89,722 86,630 90,981 92,798 91,235 81,437 153,497 141,211 140,830
. Data is unavailable # Data is available, but specific variables or attributes are unavailable. 100

State Data System: Crash Data Report 2000–2009
Table 8: Motor Vehicles Involved in Crashes by Vehicle Type and Crash Severity
State Severity Vehicle Type 2000 2001 2002 2003 2004 2005 2006 2007 2008 2009
Delaware Fatal
Injury
PDO
Passenger Car
Light Truck
Large Truck
Motorcycle
Bus
Other/Unknown
Total
138 136 101 172 128 . .
27 28 50 36 47 . .
19 12 20 15 13 . .
5 10 8 13 10 . .
1 0 1 4 2 . .
2 3 0 2 3 . .
192 189 180 242 203 . .
82
47
8
16
3
3
159
64
63
9
17
2
3
158
71
52
10
14
1
3
151
Passenger Car
Light Truck
Large Truck
Motorcycle
Bus
Other/Unknown
Total
9,432 8,440 8,839 7,477 7,475 . .
2,001 2,249 2,187 2,523 1,111 . .
310 317 304 291 209 . .
154 168 191 204 139 . .
104 96 90 65 58 . .
121 113 63 77 49 . .
12,122 11,383 11,674 10,637 9,041 . .
6,064
2,871
322
338
91
139
9,825
5,897
2,784
272
296
102
140
9,491
5,863
2,691
245
250
69
137
9,255
Passenger Car
Light Truck
Large Truck
Motorcycle
Bus
Other/Unknown
Total
20,420 18,836 21,240 19,379 20,670 . .
4,717 5,698 5,062 6,712 3,080 . .
887 847 716 792 553 . .
40 67 48 75 44 . .
223 259 204 218 147 . .
1,440 1,218 834 1,160 695 . .
27,727 26,925 28,104 28,336 25,189 . .
14,900
7,200
944
65
168
480
23,757
14,918
6,999
827
75
193
441
23,453
14,049
6,738
690
49
144
414
22,084
. Data is unavailable # Data is available, but specific variables or attributes are unavailable. 101

State Data System: Crash Data Report 2000–2009
Table 8: Motor Vehicles Involved in Crashes by Vehicle Type and Crash Severity
State Severity Vehicle Type 2000 2001 2002 2003 2004 2005 2006 2007 2008 2009
Florida Fatal
Injury
Passenger Car
Light Truck
Large Truck
Motorcycle
Bus
Other/Unknown
Total
2,465 2,531 2,486 2,401 2,347 2,603 2,532 2,415 2,217 1,878
1,170 1,109 1,271 1,283 1,391 1,439 1,340 1,268 1,113 1,014
349 396 427 418 425 477 390 324 315 212
270 291 341 390 431 508 587 587 570 437
37 21 29 25 28 31 32 32 31 24
126 122 121 143 144 157 155 179 179 92
4,417 4,470 4,675 4,660 4,766 5,215 5,036 4,805 4,425 3,657
Passenger Car 192,033 191,914 185,418 176,648 177,804 182,842 167,005 168,046 158,282 157,460
Light Truck 65,414 66,953 70,004 69,003 72,219 76,127 70,217 67,918 60,242 59,246
Large Truck 9,480 9,356 9,288 9,297 9,965 10,910 9,650 8,401 6,990 6,177
Motorcycle 5,120 5,894 6,186 6,946 7,669 8,342 8,952 9,243 9,717 8,650
Bus 1,518 1,497 1,582 1,526 1,521 1,649 1,408 1,375 1,336 1,233
Other/Unknown 9,073 10,235 8,580 8,087 9,246 9,479 8,342 7,989 7,131 7,006
PDO
Total 282,638 285,849 281,058 271,507 278,424 289,349 265,574 262,972 243,698 239,772
Passenger Car 108,250 115,810 114,432 111,140 117,626 126,778 125,264 129,012 125,612 122,395
Light Truck 37,245 40,505 42,978 43,744 47,096 52,755 51,797 51,428 46,562 43,905
Large Truck 6,465 7,053 7,270 7,348 8,890 10,296 9,529 8,909 7,727 6,706
Motorcycle 576 652 624 680 789 874 1,039 1,029 1,047 934
Bus 1,050 1,089 1,141 1,171 1,206 1,365 1,355 1,299 1,262 1,134
Other/Unknown 37,805 43,706 35,073 31,441 31,847 35,048 33,899 35,359 31,206 29,807
Total 191,391 208,815 201,518 195,524 207,454 227,116 222,883 227,036 213,416 204,881
. Data is unavailable # Data is available, but specific variables or attributes are unavailable. 102

State Data System: Crash Data Report 2000–2009
Table 8: Motor Vehicles Involved in Crashes by Vehicle Type and Crash Severity
State Severity Vehicle Type 2000 2001 2002 2003 2004 2005 2006 2007 2008 2009
Georgia Fatal
Injury
Passenger Car
Light Truck
Large Truck
Motorcycle
Bus
Other/Unknown
Total
1,098 1,127 1,048 1,091 1,111 1,102 1,035 954 853 825
799 900 839 866 896 1,040 1,019 953 839 838
212 237 210 207 243 253 239 217 179 144
61 99 85 113 113 147 157 170 184 152
12 8 9 12 12 7 11 13 13 6
201 230 257 259 225 219 232 223 221 234
2,383 2,601 2,448 2,548 2,600 2,768 2,693 2,530 2,289 2,199
Passenger Car 100,974 102,192 100,280 98,561 99,768 99,410 94,660 90,820 83,257 87,218
Light Truck 49,862 53,069 55,821 57,886 61,391 63,255 61,418 58,852 52,054 56,819
Large Truck 5,043 4,953 4,817 4,963 5,290 5,680 5,269 4,971 3,777 3,238
Motorcycle 1,525 1,862 1,786 2,115 2,441 2,693 3,015 3,226 3,401 2,913
Bus 635 674 589 613 610 647 622 646 634 604
Other/Unknown 3,861 3,860 3,895 4,090 4,158 4,159 4,148 3,965 3,705 4,145
PDO
Total 161,900 166,610 167,188 168,228 173,658 175,844 169,132 162,480 146,828 154,937
Passenger Car 262,680 265,824 272,369 270,881 275,228 275,316 273,966 272,113 250,093 259,315
Light Truck 137,677 146,626 157,529 163,228 171,945 176,965 176,136 170,699 150,750 155,968
Large Truck 15,721 16,007 15,908 16,312 17,077 18,239 17,994 17,008 13,537 10,692
Motorcycle 509 592 650 731 857 941 1,066 1,127 1,233 1,014
Bus 2,310 2,352 2,348 2,364 2,365 2,559 2,652 2,582 2,637 2,424
Other/Unknown 5,149 5,070 5,429 6,427 6,865 6,481 6,305 6,488 6,036 5,785
Total 424,046 436,471 454,233 459,943 474,337 480,501 478,119 470,017 424,286 435,198
. Data is unavailable # Data is available, but specific variables or attributes are unavailable. 103

State Data System: Crash Data Report 2000–2009
Table 8: Motor Vehicles Involved in Crashes by Vehicle Type and Crash Severity
State Severity Vehicle Type 2000 2001 2002 2003 2004 2005 2006 2007 2008 2009
Illinois Fatal
Injury
Passenger Car
Light Truck
Large Truck
Motorcycle
Bus
Other/Unknown
Total
1,025 1,019 1,043 1,039 950 944 837 802 658 612
654 631 635 673 628 636 598 598 500 446
175 186 163 184 149 213 173 149 146 94
127 138 102 141 160 158 133 161 133 141
12 13 10 7 5 14 11 11 12 9
29 39 52 32 63 34 42 38 25 24
2,022 2,026 2,005 2,076 1,955 1,999 1,794 1,759 1,474 1,326
Passenger Car 115,716 108,566 109,379 108,999 102,059 94,066 89,211 83,569 76,397 72,244
Light Truck 37,892 37,539 40,358 43,479 42,780 41,081 39,263 38,199 35,664 34,235
Large Truck 5,551 4,914 4,649 5,085 4,833 4,776 4,331 4,176 3,915 3,041
Motorcycle 2,312 2,395 2,466 2,690 2,895 3,008 2,641 3,195 3,248 2,946
Bus 1,272 1,213 1,190 1,174 1,111 1,045 1,085 1,005 978 901
Other/Unknown 10,823 7,524 5,923 4,726 4,064 3,791 3,109 3,286 2,919 1,987
PDO
Total 173,566 162,151 163,965 166,153 157,742 147,767 139,640 133,430 123,121 115,354
Passenger Car 459,760 437,064 428,570 417,976 415,088 400,167 391,268 403,554 388,793 261,247
Light Truck 153,016 152,510 161,376 169,274 173,301 174,368 170,335 178,767 173,099 120,255
Large Truck 31,408 28,023 26,045 26,043 26,076 26,986 26,105 26,543 24,716 14,563
Motorcycle 1,717 2,251 1,729 1,680 1,374 1,453 1,458 1,572 1,627 922
Bus 5,974 5,883 5,145 5,065 4,944 5,229 4,938 5,524 5,395 3,189
Other/Unknown 55,607 48,054 41,112 35,012 36,345 34,996 31,165 34,731 33,618 22,879
Total 707,482 673,785 663,977 655,050 657,128 643,199 625,269 650,691 627,248 423,055
. Data is unavailable # Data is available, but specific variables or attributes are unavailable. 104

State Data System: Crash Data Report 2000–2009
Table 8: Motor Vehicles Involved in Crashes by Vehicle Type and Crash Severity
State Severity Vehicle Type 2000 2001 2002 2003 2004 2005 2006 2007 2008 2009
Indiana Fatal
Injury
PDO
Passenger Car
Light Truck
Large Truck
Motorcycle
Bus
Other/Unknown
Total
728 . . 542 608 539 556
305 . . 433 473 526 454
179 . . 169 177 148 140
74 . . 78 104 114 113
3 . . 4 6 6 9
35 . . 22 20 18 17
1,324 . . 1,248 1,388 1,351 1,289
500
474
149
122
9
19
1,273
509
357
129
128
5
21
1,149
422
347
112
119
6
17
1,023
Passenger Car
Light Truck
Large Truck
Motorcycle
Bus
Other/Unknown
Total
59,656 . . 45,220 45,333 42,931 40,241
19,159 . . 26,249 28,098 27,233 25,047
4,667 . . 2,726 2,984 2,854 1,820
1,892 . . 1,736 2,087 2,089 2,260
325 . . 337 287 318 267
7,355 . . 1,547 829 827 1,054
93,054 . . 77,815 79,618 76,252 70,689
38,180
23,665
1,177
2,589
201
1,039
66,851
35,578
21,837
1,253
2,738
186
657
62,249
34,449
20,759
1,404
2,298
229
640
59,779
Passenger Car
Light Truck
Large Truck
Motorcycle
Bus
Other/Unknown
Total
192,112 . . 161,874 158,861 157,270 147,173
69,301 . . 102,919 105,516 106,456 97,459
21,020 . . 14,357 14,604 14,257 12,538
554 . . 685 746 768 842
1,565 . . 1,663 1,519 1,579 1,417
82,513 . . 8,639 4,541 5,252 7,200
367,065 . . 290,137 285,787 285,582 266,629
158,568
103,703
13,719
946
1,529
10,297
288,762
164,092
102,054
13,420
1,053
1,736
9,203
291,558
153,358
95,464
10,147
940
1,596
8,105
269,610
. Data is unavailable # Data is available, but specific variables or attributes are unavailable. 105

State Data System: Crash Data Report 2000–2009
Table 8: Motor Vehicles Involved in Crashes by Vehicle Type and Crash Severity
State Severity Vehicle Type 2000 2001 2002 2003 2004 2005 2006 2007 2008 2009
Iowa Fatal
Injury
PDO
Passenger Car
Light Truck
Large Truck
Motorcycle
Bus
Other/Unknown
Total
. 271 274 236 253 262 254
. 192 204 215 178 218 188
. 76 71 64 64 70 81
. 43 46 51 42 49 61
. 3 3 3 4 5 0
. 17 14 9 14 8 16
. 602 612 578 555 612 600
204
234
74
63
4
9
588
226
209
77
58
2
14
586
189
187
65
57
4
10
512
Passenger Car
Light Truck
Large Truck
Motorcycle
Bus
Other/Unknown
Total
. 20,984 19,114 17,668 17,134 17,753 15,811
. 10,340 10,061 9,869 10,256 11,030 10,272
. 1,141 1,128 1,043 1,063 1,216 1,055
. 656 691 827 830 984 889
. 110 81 91 89 103 95
. 917 611 513 380 714 892
. 34,148 31,686 30,011 29,752 31,800 29,014
15,210
10,460
1,156
1,005
103
458
28,392
14,238
10,290
1,238
1,024
101
273
27,164
12,917
9,780
985
896
75
243
24,896
Passenger Car
Light Truck
Large Truck
Motorcycle
Bus
Other/Unknown
Total
. 36,732 40,582 39,720 39,309 36,730 33,072
. 19,848 22,896 23,368 24,611 24,444 22,137
. 2,732 2,678 2,713 2,791 3,122 2,468
. 166 166 130 129 154 158
. 228 221 266 287 294 250
. 4,279 4,544 5,073 4,478 4,035 5,025
. 63,985 71,087 71,270 71,605 68,779 63,110
36,226
25,651
3,304
149
338
5,465
71,133
37,156
27,269
3,653
158
369
5,920
74,525
34,102
25,536
2,840
134
321
6,419
69,352
. Data is unavailable # Data is available, but specific variables or attributes are unavailable. 106

State Data System: Crash Data Report 2000–2009
Table 8: Motor Vehicles Involved in Crashes by Vehicle Type and Crash Severity
State Severity Vehicle Type 2000 2001 2002 2003 2004 2005 2006 2007 2008 2009
Kansas Fatal
Injury
Passenger Car
Light Truck
Large Truck
Motorcycle
Bus
Other/Unknown
Total
342 353 366 255 241 208 232 226 187 177
185 166 183 270 253 242 256 266 200 211
81 80 82 73 83 74 65 79 56 51
21 27 31 35 32 34 59 51 46 48
4 2 3 4 3 4 4 3 2 1
7 16 13 11 7 19 13 2 8 40
640 644 678 648 619 581 629 627 499 528
Passenger Car 23,599 22,981 21,904 16,987 16,072 14,956 14,705 14,717 13,192 12,365
Light Truck 8,636 8,618 8,186 10,384 10,567 10,422 10,163 10,774 9,827 9,260
Large Truck 1,083 1,161 972 903 897 934 785 912 880 633
Motorcycle 568 591 629 666 783 827 897 957 1,019 887
Bus 92 113 89 88 76 85 71 82 97 72
Other/Unknown 194 128 146 227 187 158 173 175 172 912
PDO
Total 34,172 33,592 31,926 29,255 28,582 27,382 26,794 27,617 25,187 24,129
Passenger Car 59,971 60,572 61,397 49,059 48,343 43,687 41,203 43,010 40,537 37,688
Light Truck 27,036 27,032 27,340 35,962 36,453 34,032 32,414 35,964 33,102 30,132
Large Truck 3,529 3,584 3,314 3,377 3,202 3,069 2,741 3,039 2,930 2,323
Motorcycle 112 144 158 157 173 179 147 188 178 220
Bus 303 333 295 337 325 264 240 281 300 259
Other/Unknown 1,965 1,970 2,091 2,265 1,916 1,452 1,413 1,574 1,614 1,618
Total 92,916 93,635 94,595 91,157 90,412 82,683 78,158 84,056 78,661 72,240
. Data is unavailable # Data is available, but specific variables or attributes are unavailable. 107

State Data System: Crash Data Report 2000–2009
Table 8: Motor Vehicles Involved in Crashes by Vehicle Type and Crash Severity
State Severity Vehicle Type 2000 2001 2002 2003 2004 2005 2006 2007 2008 2009
Kentucky Fatal
Injury
Passenger Car
Light Truck
Large Truck
Motorcycle
Bus
Other/Unknown
Total
551 574 561 573 617 609 562 520 449 452
361 417 481 504 497 488 467 421 432 451
103 100 125 126 136 135 114 114 106 114
40 62 46 61 74 87 102 121 102 91
3 2 5 5 5 2 3 4 7 6
36 23 41 45 29 40 39 37 43 20
1,094 1,178 1,259 1,314 1,358 1,361 1,287 1,217 1,139 1,134
Passenger Car 37,910 35,103 33,827 31,532 29,894 28,678 26,805 24,886 23,905 23,947
Light Truck 17,923 18,388 18,688 18,474 17,927 17,370 16,618 15,683 14,886 15,378
Large Truck 2,334 1,969 1,909 1,862 2,043 2,014 1,898 1,689 1,586 1,361
Motorcycle 885 1,003 999 1,094 1,248 1,322 1,312 1,558 1,631 1,441
Bus 255 223 210 184 198 192 201 196 203 187
Other/Unknown 1,255 1,181 1,163 1,127 920 863 884 950 814 696
PDO
Total 60,562 57,867 56,796 54,273 52,230 50,439 47,718 44,962 43,025 43,010
Passenger Car 109,675 103,392 101,361 100,740 105,857 101,875 100,020 97,820 97,179 102,277
Light Truck 55,926 57,824 60,803 62,611 67,325 65,060 65,127 64,242 62,264 65,117
Large Truck 8,606 7,649 7,282 7,556 8,528 8,473 8,409 8,033 7,693 6,925
Motorcycle 305 352 373 429 449 575 556 645 749 678
Bus 1,228 1,163 1,100 1,120 1,260 1,252 1,150 1,196 1,200 1,268
Other/Unknown 6,472 6,250 6,113 5,757 5,467 5,143 5,150 5,742 5,556 4,987
Total 182,212 176,630 177,032 178,213 188,886 182,378 180,412 177,678 174,641 181,252
. Data is unavailable # Data is available, but specific variables or attributes are unavailable. 108

State Data System: Crash Data Report 2000–2009
Table 8: Motor Vehicles Involved in Crashes by Vehicle Type and Crash Severity
State Severity Vehicle Type 2000 2001 2002 2003 2004 2005 2006 2007 2008 2009
Louisiana Fatal
Injury
PDO
Passenger Car
Light Truck
Large Truck
Motorcycle
Bus
Other/Unknown
Total
. . . . . 503 514
. . . . . 600 607
. . . . . 140 103
. . . . . 76 93
. . . . . 9 4
. . . . . 60 41
. . . . . 1,388 1,362
483
594
125
88
5
44
1,339
447
527
99
86
4
42
1,205
377
498
75
102
4
27
1,083
Passenger Car
Light Truck
Large Truck
Motorcycle
Bus
Other/Unknown
Total
. . . . . 49,453 46,127
. . . . . 36,069 37,715
. . . . . 2,983 3,181
. . . . . 1,408 1,542
. . . . . 405 304
. . . . . 3,682 3,465
. . . . . 94,000 92,334
44,884
37,821
2,762
1,589
333
3,093
90,482
43,214
36,980
2,681
1,692
339
2,464
87,370
41,878
36,955
2,178
1,581
369
1,994
84,955
Passenger Car
Light Truck
Large Truck
Motorcycle
Bus
Other/Unknown
Total
. . . . . 104,832 103,407
. . . . . 80,956 88,709
. . . . . 7,631 8,116
. . . . . 393 452
. . . . . 1,066 1,025
. . . . . 11,191 10,962
. . . . . 206,069 212,671
100,315
88,893
7,525
455
982
10,267
208,437
99,698
89,220
7,564
505
1,046
9,320
207,353
100,266
91,059
6,027
483
1,055
7,582
206,472
. Data is unavailable # Data is available, but specific variables or attributes are unavailable. 109

State Data System: Crash Data Report 2000–2009
Table 8: Motor Vehicles Involved in Crashes by Vehicle Type and Crash Severity
State Severity Vehicle Type 2000 2001 2002 2003 2004 2005 2006 2007 2008 2009
Maryland Fatal
Injury
Passenger Car
Light Truck
Large Truck
Motorcycle
Bus
Other/Unknown
Total
503 520 542 541 447 445 468 404 400 402
205 198 188 188 154 167 318 285 298 271
75 82 71 78 94 76 76 72 53 73
53 56 57 61 68 88 86 98 83 79
9 7 7 11 10 10 9 6 5 8
121 113 136 167 140 165 15 22 23 12
966 976 1,001 1,046 913 951 972 887 862 845
Passenger Car 47,202 47,661 46,671 45,559 42,762 40,884 39,284 36,976 35,006 35,682
Light Truck 12,590 12,880 12,560 12,976 12,480 12,291 22,172 22,219 20,603 18,650
Large Truck 2,687 2,364 2,415 2,631 2,581 2,703 2,398 2,134 1,800 1,837
Motorcycle 990 1,134 1,089 1,126 1,339 1,460 1,583 1,584 1,598 1,612
Bus 613 635 579 642 647 598 607 559 605 558
Other/Unknown 7,431 8,459 9,412 10,662 10,753 11,193 1,264 1,397 1,226 1,650
PDO
Total 71,513 73,133 72,726 73,596 70,562 69,129 67,308 64,869 60,838 59,989
Passenger Car 68,543 69,978 73,895 74,568 69,964 67,917 66,734 65,277 62,245 65,058
Light Truck 19,230 19,773 20,729 21,718 20,563 20,740 37,439 38,046 35,831 32,605
Large Truck 5,488 4,905 5,465 5,907 5,635 5,849 5,434 5,167 4,447 4,646
Motorcycle 262 289 281 294 338 355 369 371 423 603
Bus 2,525 2,580 2,505 2,539 2,496 2,585 2,458 2,625 2,593 2,458
Other/Unknown 17,053 17,986 20,360 23,142 22,405 23,686 7,853 8,256 8,048 9,899
Total 113,101 115,511 123,235 128,168 121,401 121,132 120,287 119,742 113,587 115,269
. Data is unavailable # Data is available, but specific variables or attributes are unavailable. 110

State Data System: Crash Data Report 2000–2009
Table 8: Motor Vehicles Involved in Crashes by Vehicle Type and Crash Severity
State Severity Vehicle Type 2000 2001 2002 2003 2004 2005 2006 2007 2008 2009
Michigan Fatal
Injury
Passenger Car
Light Truck
Large Truck
Motorcycle
Bus
Other/Unknown
Total
1,226 1,170 1,120 1,181 1,036 976 923 903 851 772
520 503 505 507 430 425 346 368 319 268
150 131 133 114 125 117 120 123 98 72
88 97 87 84 84 124 123 129 130 111
12 3 4 3 7 5 7 3 6 3
101 132 101 108 84 79 60 73 74 79
2,097 2,036 1,950 1,997 1,766 1,726 1,579 1,599 1,478 1,305
Passenger Car 112,849 103,225 102,736 97,996 94,663 84,859 77,197 75,621 70,443 67,999
Light Truck 38,672 34,719 34,503 32,217 31,689 28,470 24,799 23,565 20,703 19,249
Large Truck 3,707 2,974 3,067 2,990 2,987 2,754 2,298 2,285 2,199 1,536
Motorcycle 2,704 2,738 2,546 2,676 2,613 2,941 2,730 3,102 3,401 2,813
Bus 312 243 195 188 218 204 196 225 208 242
Other/Unknown 4,966 7,221 6,670 5,125 3,755 3,247 2,813 2,940 2,799 2,643
PDO
Total 163,210 151,120 149,717 141,192 135,925 122,475 110,033 107,738 99,753 94,482
Passenger Car 381,987 351,343 349,749 351,940 340,168 321,143 289,999 300,227 297,468 279,324
Light Truck 149,877 137,011 134,354 132,327 128,175 119,715 103,926 103,579 96,602 84,596
Large Truck 15,583 14,001 13,247 13,066 13,065 12,135 10,094 10,648 10,505 7,718
Motorcycle 875 839 810 889 877 822 830 947 959 877
Bus 1,129 938 840 794 969 1,023 852 990 952 904
Other/Unknown 23,509 32,545 29,681 23,163 16,606 15,223 12,833 12,948 12,139 11,006
Total 572,960 536,677 528,681 522,179 499,860 470,061 418,534 429,339 418,625 384,425
. Data is unavailable # Data is available, but specific variables or attributes are unavailable. 111

State Data System: Crash Data Report 2000–2009
Table 8: Motor Vehicles Involved in Crashes by Vehicle Type and Crash Severity
State Severity Vehicle Type 2000 2001 2002 2003 2004 2005 2006 2007 2008 2009
Minnesota Fatal
Injury
PDO
Passenger Car
Light Truck
Large Truck
Motorcycle
Bus
Other/Unknown
Total
508 416 466 . 346 328 313
237 242 272 . 328 304 243
77 64 80 . 72 67 64
38 41 49 . 56 63 72
8 5 4 . 4 9 4
35 32 245 . 16 13 12
903 800 1,116 . 822 784 708
324
331
82
60
12
16
825
264
238
64
72
3
20
661
234
206
47
49
7
19
562
Passenger Car
Light Truck
Large Truck
Motorcycle
Bus
Other/Unknown
Total
37,532 34,813 33,659 . 29,242 27,145 24,847
13,789 13,119 12,777 . 17,846 17,403 15,610
1,444 1,349 1,232 . 1,469 1,369 1,217
994 1,063 1,024 . 1,210 1,257 1,345
311 266 228 . 270 277 253
2,408 2,396 2,258 . 822 747 717
56,478 53,006 51,178 . 50,859 48,198 43,989
25,091
16,255
1,192
1,448
269
707
44,962
23,769
15,351
1,111
1,434
244
556
42,465
22,090
14,406
924
1,166
288
474
39,348
Passenger Car
Light Truck
Large Truck
Motorcycle
Bus
Other/Unknown
Total
85,401 79,986 76,976 . 64,420 61,877 54,755
32,154 31,120 30,738 . 40,668 39,882 35,253
4,026 3,759 3,289 . 4,222 4,085 3,453
168 179 182 . 186 175 160
981 917 775 . 897 912 793
9,431 10,441 8,996 . 4,133 3,752 3,559
132,161 126,402 120,956 . 114,526 110,683 97,973
57,852
37,233
3,538
208
938
3,242
103,011
55,430
35,947
3,359
222
947
2,731
98,636
51,808
34,275
2,813
204
913
2,351
92,364
. Data is unavailable # Data is available, but specific variables or attributes are unavailable. 112

State Data System: Crash Data Report 2000–2009
Table 8: Motor Vehicles Involved in Crashes by Vehicle Type and Crash Severity
State Severity Vehicle Type 2000 2001 2002 2003 2004 2005 2006 2007 2008 2009
Missouri Fatal
Injury
Passenger Car
Light Truck
Large Truck
Motorcycle
Bus
Other/Unknown
Total
753 729 740 777 664 749 679 528 504 493
622 529 660 639 616 668 561 554 521 462
191 140 176 170 167 172 147 146 115 86
44 53 59 88 57 88 93 91 104 86
7 6 10 10 8 9 7 9 7 5
29 31 46 40 28 46 28 33 32 39
1,646 1,488 1,691 1,724 1,540 1,732 1,515 1,361 1,283 1,171
Passenger Car 56,265 54,005 51,620 48,218 46,754 44,809 41,917 39,745 36,686 36,118
Light Truck 28,827 28,907 29,744 29,078 29,610 29,282 27,860 27,322 25,151 24,708
Large Truck 3,499 3,175 3,033 2,930 2,850 2,857 2,501 2,519 2,177 1,703
Motorcycle 1,075 1,297 1,269 1,437 1,581 1,809 1,891 1,994 2,103 2,000
Bus 566 521 552 469 498 477 407 420 402 409
Other/Unknown 571 570 653 647 699 629 641 646 547 568
PDO
Total 90,803 88,475 86,871 82,779 81,992 79,863 75,217 72,646 67,066 65,506
Passenger Car 156,756 151,895 145,317 142,577 139,959 131,303 125,056 122,616 115,102 114,918
Light Truck 86,070 84,670 86,229 87,603 89,793 88,000 84,950 85,451 79,410 79,293
Large Truck 12,874 12,461 12,058 11,731 11,852 11,400 11,078 10,717 9,524 8,178
Motorcycle 373 437 359 344 442 423 470 488 551 529
Bus 2,236 2,261 2,316 2,132 2,073 1,960 1,879 1,911 1,973 1,751
Other/Unknown 6,550 6,331 6,726 6,575 6,293 5,741 5,464 5,323 4,910 4,663
Total 264,859 258,055 253,005 250,962 250,412 238,827 228,897 226,506 211,470 209,332
. Data is unavailable # Data is available, but specific variables or attributes are unavailable. 113

State Data System: Crash Data Report 2000–2009
Table 8: Motor Vehicles Involved in Crashes by Vehicle Type and Crash Severity
State Severity Vehicle Type 2000 2001 2002 2003 2004 2005 2006 2007 2008 2009
Montana Fatal
Injury
PDO
Passenger Car
Light Truck
Large Truck
Motorcycle
Bus
Other/Unknown
Total
117 90 90 114 101 84 110
123 137 163 169 138 153 134
24 26 22 21 16 23 25
14 11 25 12 20 29 25
0 0 1 1 0 0 1
12 8 9 6 8 6 5
290 272 310 323 283 295 300
104
162
31
33
1
7
338
85
129
28
38
1
9
290
.
.
.
.
.
.
.
Passenger Car
Light Truck
Large Truck
Motorcycle
Bus
Other/Unknown
Total
5,712 4,909 5,299 4,762 4,686 4,597 4,678
4,866 4,074 4,564 4,409 4,276 4,426 4,481
362 301 317 321 289 320 326
282 237 253 316 328 367 411
39 33 36 23 26 33 14
103 486 117 108 98 98 103
11,364 10,040 10,586 9,939 9,703 9,841 10,013
4,434
4,393
307
427
31
112
9,704
4,138
4,189
281
393
26
209
9,236
.
.
.
.
.
.
.
Passenger Car
Light Truck
Large Truck
Motorcycle
Bus
Other/Unknown
Total
11,926 14,285 15,725 15,160 14,109 14,218 13,359
10,773 9,089 9,957 10,362 9,895 10,284 10,478
1,013 889 930 989 895 960 919
40 56 73 49 57 88 76
87 101 122 109 104 118 134
632 941 737 671 620 595 621
24,471 25,361 27,544 27,340 25,680 26,263 25,587
12,606
11,056
935
69
113
691
25,470
12,407
11,352
961
104
127
928
25,879
.
.
.
.
.
.
.
. Data is unavailable # Data is available, but specific variables or attributes are unavailable. 114

State Data System: Crash Data Report 2000–2009
Table 8: Motor Vehicles Involved in Crashes by Vehicle Type and Crash Severity
State Severity Vehicle Type 2000 2001 2002 2003 2004 2005 2006 2007 2008 2009
Nebraska Fatal
Injury
Passenger Car
Light Truck
Large Truck
Motorcycle
Bus
Other/Unknown
Total
156 140 164 171 136 151 142 156 96 118
144 126 150 148 142 151 135 126 115 133
56 60 61 52 40 47 28 46 38 42
3 10 16 12 21 16 18 14 20 15
0 2 1 4 1 1 1 2 0 1
16 10 19 10 11 4 10 15 15 17
375 348 411 397 351 370 334 359 284 326
Passenger Car 21,311 19,124 17,184 15,638 14,851 13,559 12,624 12,647 12,233 11,809
Light Truck 11,387 10,660 9,479 9,358 9,656 9,028 8,415 8,914 8,077 8,272
Large Truck 924 917 693 694 680 665 601 623 631 563
Motorcycle 242 284 287 322 353 399 419 436 543 469
Bus 76 71 59 60 61 64 67 52 66 63
Other/Unknown 910 1,155 979 861 760 606 524 714 685 862
PDO
Total 34,850 32,211 28,681 26,933 26,361 24,321 22,650 23,386 22,235 22,038
Passenger Car 25,580 25,875 26,624 27,283 19,351 18,509 16,557 18,427 18,361 17,468
Light Truck 16,509 17,171 17,722 19,107 14,335 14,286 12,715 14,831 13,933 14,385
Large Truck 1,721 1,750 1,613 1,685 1,362 1,248 1,218 1,324 1,294 1,296
Motorcycle 37 39 77 68 41 51 43 61 70 59
Bus 126 148 136 179 88 107 99 108 160 133
Other/Unknown 2,721 3,501 3,426 3,244 1,937 1,776 1,475 1,880 1,959 2,432
Total 46,694 48,484 49,598 51,566 37,114 35,977 32,107 36,631 35,777 35,773
. Data is unavailable # Data is available, but specific variables or attributes are unavailable. 115

State Data System: Crash Data Report 2000–2009
Table 8: Motor Vehicles Involved in Crashes by Vehicle Type and Crash Severity
State Severity Vehicle Type 2000 2001 2002 2003 2004 2005 2006 2007 2008 2009
New Jersey Fatal
Injury
PDO
Passenger Car
Light Truck
Large Truck
Motorcycle
Bus
Other/Unknown
Total
. 667 510 635 606 608 594
. 187 175 254 245 252 272
. 87 67 97 107 125 85
. 65 44 55 73 65 93
. 7 14 12 9 16 9
. 130 77 84 78 33 37
. 1,143 887 1,137 1,118 1,099 1,090
599
222
94
88
10
21
1,034
458
226
68
88
7
32
879
467
187
78
73
12
30
847
Passenger Car
Light Truck
Large Truck
Motorcycle
Bus
Other/Unknown
Total
. 115,100 116,501 108,872 106,297 99,078 92,069
. 25,545 27,894 29,265 30,608 31,028 30,562
. 4,912 4,966 4,853 4,843 4,489 4,189
. 2,097 2,076 1,999 2,270 2,243 2,103
. 1,077 1,066 1,030 1,070 1,003 829
. 6,157 6,046 5,169 4,755 4,312 2,441
. 154,888 158,549 151,188 149,843 142,153 132,193
89,016
30,835
4,139
2,259
882
2,074
129,205
88,326
29,799
3,830
2,363
812
2,294
127,424
87,949
30,047
3,380
1,997
870
2,178
126,421
Passenger Car
Light Truck
Large Truck
Motorcycle
Bus
Other/Unknown
Total
. 301,033 306,736 305,593 304,026 295,174 275,219
. 73,400 80,744 89,810 95,108 98,792 97,163
. 24,581 25,443 26,337 26,138 25,434 23,867
. 867 724 783 831 868 736
. 4,567 4,618 4,823 4,668 4,626 3,527
. 30,604 28,893 29,815 27,712 26,236 21,097
. 435,052 447,158 457,161 458,483 451,130 421,609
288,606
104,721
24,843
723
3,858
22,186
444,937
286,478
101,160
22,241
772
3,776
22,764
437,191
285,818
102,404
19,523
708
3,836
23,318
435,607
. Data is unavailable # Data is available, but specific variables or attributes are unavailable. 116

State Data System: Crash Data Report 2000–2009
Table 8: Motor Vehicles Involved in Crashes by Vehicle Type and Crash Severity
State Severity Vehicle Type 2000 2001 2002 2003 2004 2005 2006 2007 2008 2009
New Mexico Fatal
Injury
Passenger Car
Light Truck
Large Truck
Motorcycle
Bus
Other/Unknown
Total
238 218 220 253 388 340 313 250 231 260
235 255 243 182 163 151 150 137 119 114
41 47 57 38 58 57 66 61 44 30
33 33 38 36 44 40 53 51 51 46
5 1 4 2 1 2 0 1 1 1
27 22 22 43 71 86 97 75 61 53
579 576 584 554 725 676 679 575 507 504
Passenger Car 18,377 18,419 17,696 17,372 17,665 16,016 14,682 12,906 13,895 12,153
Light Truck 12,788 13,085 12,513 12,017 13,028 11,464 10,609 10,336 9,536 9,494
Large Truck 580 656 575 543 630 643 553 465 411 380
Motorcycle 618 739 757 761 796 861 916 881 1,138 971
Bus 67 93 76 68 55 77 76 82 73 52
Other/Unknown 1,236 1,286 1,325 1,292 1,311 1,419 1,462 1,775 1,816 1,744
PDO
Total 33,666 34,278 32,942 32,053 33,485 30,480 28,298 26,445 26,869 24,794
Passenger Car 28,292 29,493 30,201 29,142 31,878 30,020 31,207 30,694 32,906 28,728
Light Truck 22,115 23,760 23,236 22,799 25,672 24,068 25,289 25,646 23,528 23,408
Large Truck 1,374 1,812 1,525 1,472 1,729 1,856 1,755 1,414 1,398 1,156
Motorcycle 117 145 177 167 195 218 289 315 384 309
Bus 209 249 194 185 193 268 295 299 301 273
Other/Unknown 2,921 3,300 3,660 3,328 3,509 4,324 4,882 6,337 6,406 6,179
Total 55,028 58,759 58,993 57,093 63,176 60,754 63,717 64,705 64,923 60,053
. Data is unavailable # Data is available, but specific variables or attributes are unavailable. 117

State Data System: Crash Data Report 2000–2009
Table 8: Motor Vehicles Involved in Crashes by Vehicle Type and Crash Severity
State Severity Vehicle Type 2000 2001 2002 2003 2004 2005 2006 2007 2008 2009
New York Fatal
Injury
PDO
Passenger Car
Light Truck
Large Truck
Motorcycle
Bus
Other/Unknown
Total
1,506 . 1,484 1,428 1,456 1,351 1,312
231 . 265 248 262 233 230
153 . 90 109 88 75 116
127 . 146 160 151 174 206
37 . 21 28 26 18 40
69 . 79 130 118 160 123
2,123 . 2,085 2,103 2,101 2,011 2,027
1,310
223
101
176
25
98
1,933
1,215
185
78
193
15
111
1,797
1,108
167
67
163
17
108
1,630
Passenger Car
Light Truck
Large Truck
Motorcycle
Bus
Other/Unknown
Total
305,756 . 272,109 251,243 229,218 215,213 202,609
21,594 . 24,335 23,383 22,133 20,700 19,114
8,326 . 3,753 3,566 3,288 3,136 2,926
3,931 . 4,126 4,166 4,339 4,718 4,436
5,888 . 2,374 2,452 2,316 2,185 2,112
18,891 . 15,003 26,216 24,660 22,808 21,756
364,386 . 321,700 311,026 285,954 268,760 252,953
202,579
19,166
3,048
4,904
2,337
21,837
253,871
195,734
17,636
2,817
4,827
2,179
21,594
244,787
196,777
17,211
2,373
4,545
2,094
21,060
244,060
Passenger Car
Light Truck
Large Truck
Motorcycle
Bus
Other/Unknown
Total
288,304 . 97,975 100,323 98,009 99,476 173,433
33,006 . 10,355 11,222 10,869 11,161 21,480
14,081 . 2,044 1,257 1,162 1,245 3,438
522 . 165 170 223 218 474
4,201 . 790 874 874 892 1,559
26,815 . 9,228 27,133 26,510 25,942 29,635
366,929 . 120,557 140,979 137,647 138,934 230,019
242,003
31,584
5,402
548
2,260
35,640
317,437
237,820
30,258
4,980
640
2,285
33,671
309,654
240,561
29,661
4,641
674
2,139
33,916
311,592
. Data is unavailable # Data is available, but specific variables or attributes are unavailable. 118

State Data System: Crash Data Report 2000–2009
Table 8: Motor Vehicles Involved in Crashes by Vehicle Type and Crash Severity
State Severity Vehicle Type 2000 2001 2002 2003 2004 2005 2006 2007 2008 2009
North Carolina
Fatal
Injury
Passenger Car
Light Truck
Large Truck
Motorcycle
Bus
Other/Unknown
Total
1,150 1,058 1,079 1,059 1,062 968 944 1,033 852 837
723 703 758 831 783 792 855 856 738 692
186 203 180 175 192 211 163 164 149 116
101 109 123 105 137 151 153 202 173 164
9 4 6 10 8 7 5 11 11 10
49 53 51 60 45 54 46 53 42 47
2,218 2,130 2,197 2,240 2,227 2,183 2,166 2,319 1,965 1,866
Passenger Car 101,135 95,630 92,247 89,983 87,562 81,196 77,799 77,144 72,382 69,584
Light Truck 49,097 48,343 49,692 52,974 53,796 51,024 49,773 49,914 46,605 46,230
Large Truck 5,392 4,677 4,551 4,735 4,954 4,458 4,130 3,956 3,322 2,657
Motorcycle 2,277 2,363 2,387 2,534 2,881 3,152 3,529 3,831 4,292 3,719
Bus 545 512 519 545 469 486 494 543 545 449
Other/Unknown 3,271 3,044 2,975 3,278 3,183 2,915 2,985 2,742 2,370 2,238
PDO
Total 161,717 154,569 152,371 154,049 152,845 143,231 138,710 138,130 129,516 124,877
Passenger Car 134,695 135,911 136,311 138,501 136,480 131,866 131,490 135,076 130,191 126,867
Light Truck 72,893 75,797 81,536 88,660 91,420 89,923 89,775 92,933 88,106 87,653
Large Truck 9,361 8,400 8,673 9,386 9,428 9,320 8,921 8,536 7,461 6,298
Motorcycle 306 334 303 343 377 449 507 521 600 465
Bus 841 938 883 995 1,007 945 962 1,050 1,008 875
Other/Unknown 4,969 4,676 4,975 5,612 5,534 5,339 5,589 5,413 4,772 4,465
Total 223,065 226,056 232,681 243,497 244,246 237,842 237,244 243,529 232,138 226,623
. Data is unavailable # Data is available, but specific variables or attributes are unavailable. 119
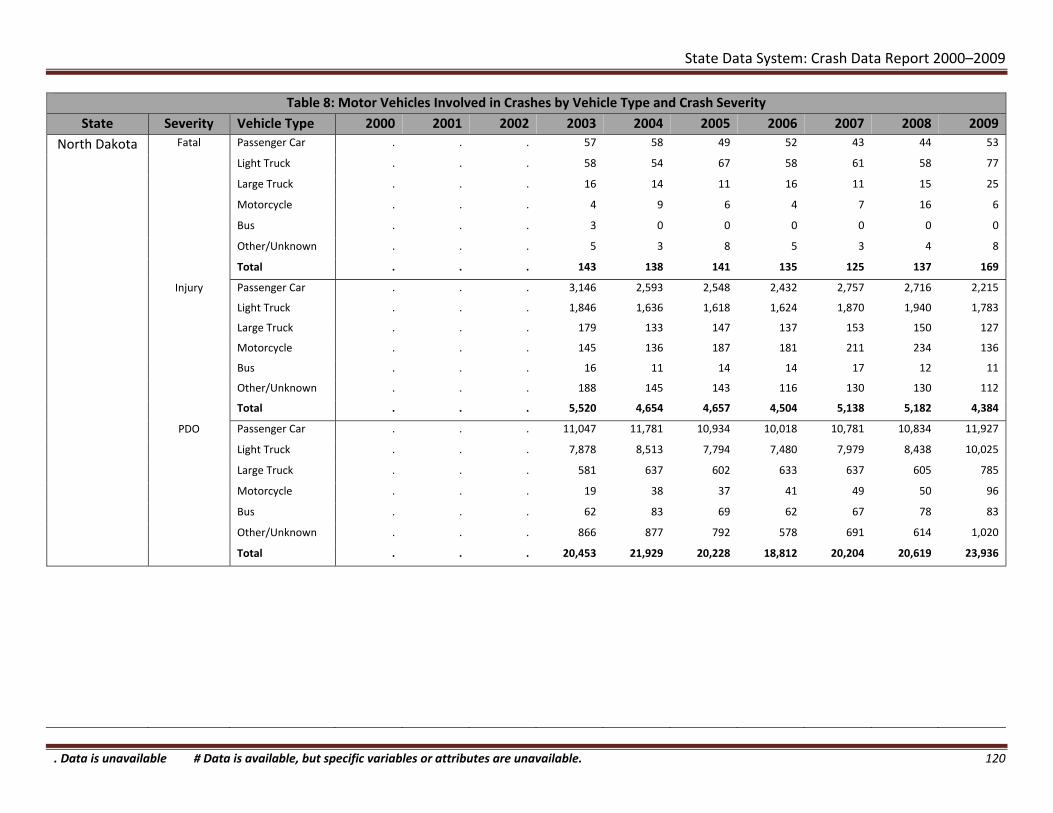
State Data System: Crash Data Report 2000–2009
Table 8: Motor Vehicles Involved in Crashes by Vehicle Type and Crash Severity
State Severity Vehicle Type 2000 2001 2002 2003 2004 2005 2006 2007 2008 2009
North Dakota Fatal
Injury
PDO
Passenger Car
Light Truck
Large Truck
Motorcycle
Bus
Other/Unknown
Total
. . . 57 58 49 52
. . . 58 54 67 58
. . . 16 14 11 16
. . . 4 9 6 4
. . . 3 0 0 0
. . . 5 3 8 5
. . . 143 138 141 135
43
61
11
7
0
3
125
44
58
15
16
0
4
137
53
77
25
6
0
8
169
Passenger Car
Light Truck
Large Truck
Motorcycle
Bus
Other/Unknown
Total
. . . 3,146 2,593 2,548 2,432
. . . 1,846 1,636 1,618 1,624
. . . 179 133 147 137
. . . 145 136 187 181
. . . 16 11 14 14
. . . 188 145 143 116
. . . 5,520 4,654 4,657 4,504
2,757
1,870
153
211
17
130
5,138
2,716
1,940
150
234
12
130
5,182
2,215
1,783
127
136
11
112
4,384
Passenger Car
Light Truck
Large Truck
Motorcycle
Bus
Other/Unknown
Total
. . . 11,047 11,781 10,934 10,018
. . . 7,878 8,513 7,794 7,480
. . . 581 637 602 633
. . . 19 38 37 41
. . . 62 83 69 62
. . . 866 877 792 578
. . . 20,453 21,929 20,228 18,812
10,781
7,979
637
49
67
691
20,204
10,834
8,438
605
50
78
614
20,619
11,927
10,025
785
96
83
1,020
23,936
. Data is unavailable # Data is available, but specific variables or attributes are unavailable. 120

State Data System: Crash Data Report 2000–2009
Table 8: Motor Vehicles Involved in Crashes by Vehicle Type and Crash Severity
State Severity Vehicle Type 2000 2001 2002 2003 2004 2005 2006 2007 2008 2009
Ohio Fatal
Injury
Passenger Car
Light Truck
Large Truck
Motorcycle
Bus
Other/Unknown
Total
1,027 1,033 1,021 948 914 920 799 819 722 622
490 613 620 605 575 661 590 605 557 515
201 188 210 168 198 195 169 147 144 124
125 121 144 148 137 181 168 190 212 163
10 8 9 14 7 10 15 10 13 5
125 46 31 51 47 38 54 44 52 40
1,978 2,009 2,035 1,934 1,878 2,005 1,795 1,815 1,700 1,469
Passenger Car 131,582 113,636 110,982 107,979 105,045 95,606 90,112 83,084 78,648 75,338
Light Truck 47,331 50,161 52,534 53,894 55,453 53,726 51,061 49,676 48,712 47,217
Large Truck 6,306 5,373 5,459 5,551 5,723 5,404 4,717 4,656 4,239 3,623
Motorcycle 2,819 3,075 2,978 3,117 3,345 3,491 3,310 3,844 3,855 3,406
Bus 805 728 755 723 733 719 636 631 641 575
Other/Unknown 6,369 2,954 3,387 3,496 3,349 3,082 2,658 2,374 2,068 2,110
PDO
Total 195,212 175,927 176,095 174,760 173,648 162,028 152,494 144,265 138,163 132,269
Passenger Car 303,843 297,705 292,426 290,311 277,774 257,740 244,254 235,795 227,714 212,570
Light Truck 128,459 149,766 154,514 163,835 163,703 157,338 149,466 151,681 147,071 140,820
Large Truck 23,099 22,641 21,759 22,631 22,520 21,329 19,193 18,962 17,623 14,496
Motorcycle 729 826 825 817 833 908 935 1,114 1,050 881
Bus 2,964 3,321 3,142 3,307 3,080 2,835 2,642 2,631 2,635 2,603
Other/Unknown 23,339 17,288 17,239 17,220 15,180 14,588 13,869 12,811 11,920 12,306
Total 482,433 491,547 489,905 498,121 483,090 454,738 430,359 422,994 408,013 383,676
. Data is unavailable # Data is available, but specific variables or attributes are unavailable. 121

State Data System: Crash Data Report 2000–2009
Table 8: Motor Vehicles Involved in Crashes by Vehicle Type and Crash Severity
State Severity Vehicle Type 2000 2001 2002 2003 2004 2005 2006 2007 2008 2009
Pennsylvania Fatal
Injury
PDO
Passenger Car
Light Truck
Large Truck
Motorcycle
Bus
Other/Unknown
Total
1,143 1,218 . 1,498 1,279 1,154 1,090
606 581 . 344 497 722 699
175 177 . 198 169 181 174
157 134 . 161 142 202 173
16 11 . 12 3 5 9
33 35 . 27 19 29 215
2,130 2,156 . 2,240 2,109 2,293 2,360
1,086
699
217
220
4
200
2,426
924
693
196
239
9
194
2,255
801
609
143
201
10
173
1,937
Passenger Car
Light Truck
Large Truck
Motorcycle
Bus
Other/Unknown
Total
102,089 99,088 . 103,214 95,718 88,965 80,031
40,163 28,012 . 24,055 29,285 29,398 32,597
4,670 3,531 . 3,419 2,960 3,249 2,900
2,576 2,501 . 2,297 2,752 3,143 3,171
988 576 . 396 274 254 358
1,854 1,447 . 795 852 670 5,855
152,340 135,155 . 134,176 131,841 125,679 124,912
73,853
34,592
3,617
3,498
353
6,075
121,988
66,076
34,139
3,046
3,785
638
5,438
113,122
64,957
35,386
2,815
3,457
651
5,335
112,601
Passenger Car
Light Truck
Large Truck
Motorcycle
Bus
Other/Unknown
Total
59,485 58,594 . 70,014 65,184 62,657 66,006
26,341 19,407 . 18,604 23,144 23,435 28,468
4,000 2,871 . 2,991 2,753 3,033 2,868
161 166 . 145 143 149 200
357 247 . 224 152 160 203
620 394 . 294 314 264 1,130
90,964 81,679 . 92,272 91,690 89,698 98,875
65,082
32,164
3,812
187
176
1,068
102,489
59,557
31,555
3,327
204
243
584
95,470
57,014
31,616
2,893
175
295
498
92,491
. Data is unavailable # Data is available, but specific variables or attributes are unavailable. 122

State Data System: Crash Data Report 2000–2009
Table 8: Motor Vehicles Involved in Crashes by Vehicle Type and Crash Severity
State Severity Vehicle Type 2000 2001 2002 2003 2004 2005 2006 2007 2008 2009
South Carolina
Fatal
Injury
Passenger Car
Light Truck
Large Truck
Motorcycle
Bus
Other/Unknown
Total
830 711 696 624 606 667 645 561 505 486
333 470 486 535 559 545 539 626 459 493
178 116 104 105 106 127 94 92 88 85
88 91 93 96 97 104 115 138 121 117
2 7 5 0 7 6 8 3 4 5
20 24 22 18 13 18 28 25 23 8
1,451 1,419 1,406 1,378 1,388 1,467 1,429 1,445 1,200 1,194
Passenger Car 41,371 37,624 36,579 35,252 34,254 32,881 32,889 31,582 30,269 30,439
Light Truck 12,708 17,788 19,036 20,044 20,863 20,917 21,696 21,936 21,134 22,133
Large Truck 3,523 1,982 1,775 1,898 1,878 1,843 1,718 1,636 1,312 1,126
Motorcycle 1,249 1,469 1,342 1,337 1,584 1,475 1,771 1,947 2,161 1,773
Bus 192 194 184 185 171 191 168 159 189 159
Other/Unknown 456 440 452 491 490 450 557 561 510 558
PDO
Total 59,499 59,497 59,368 59,207 59,240 57,757 58,799 57,821 55,575 56,188
Passenger Car 89,923 77,254 83,181 82,210 81,548 83,728 82,857 79,874 76,318 74,373
Light Truck 30,964 40,593 47,778 51,211 53,961 57,178 58,486 60,179 55,909 57,397
Large Truck 8,839 5,068 5,370 5,384 5,523 5,580 5,413 5,103 4,177 3,622
Motorcycle 310 290 345 342 395 547 416 457 536 418
Bus 361 353 389 369 366 421 436 434 416 437
Other/Unknown 983 983 1,204 1,311 1,303 1,386 1,507 1,447 1,441 1,389
Total 131,380 124,541 138,267 140,827 143,096 148,840 149,115 147,494 138,797 137,636
. Data is unavailable # Data is available, but specific variables or attributes are unavailable. 123

State Data System: Crash Data Report 2000–2009
Table 8: Motor Vehicles Involved in Crashes by Vehicle Type and Crash Severity
State Severity Vehicle Type 2000 2001 2002 2003 2004 2005 2006 2007 2008 2009
Texas Fatal
Injury
PDO
Passenger Car
Light Truck
Large Truck
Motorcycle
Bus
Other/Unknown
Total
2,155 2,145 . 2,010 2,008 1,815 1,779
2,158 2,321 . 2,488 2,343 2,204 2,209
418 393 . 414 400 402 362
239 242 . 348 296 378 357
28 18 . 16 17 18 12
70 61 . 1,197 1,222 1,260 1,127
5,068 5,180 . 6,473 6,286 6,077 5,846
1,657
2,235
386
424
8
1,142
5,852
1,641
2,143
374
544
21
1,204
5,927
1,478
2,032
244
451
10
919
5,134
Passenger Car
Light Truck
Large Truck
Motorcycle
Bus
Other/Unknown
Total
218,462 214,590 . 190,241 174,746 176,261 162,735
152,531 158,489 . 154,646 149,053 152,774 145,059
9,805 9,642 . 6,721 6,903 6,422 6,695
4,242 4,839 . 5,553 5,685 6,771 7,168
1,888 1,977 . 1,455 1,366 1,309 1,242
4,186 4,345 . 28,068 25,205 29,641 26,302
391,114 393,882 . 386,684 362,958 373,178 349,201
159,003
146,186
7,032
7,382
1,297
26,704
347,604
145,873
134,454
6,512
9,123
1,163
23,674
320,799
141,929
133,565
5,168
7,747
1,079
21,926
311,414
Passenger Car
Light Truck
Large Truck
Motorcycle
Bus
Other/Unknown
Total
100,444 100,553 . 225,633 219,489 229,622 213,883
76,921 81,937 . 206,609 207,666 219,983 209,646
6,983 7,096 . 13,423 13,544 14,017 14,014
164 212 . 605 657 832 842
644 736 . 2,128 2,061 2,226 2,091
1,753 1,775 . 35,771 34,321 42,300 38,494
186,909 192,309 . 484,169 477,738 508,980 478,970
227,489
228,866
15,947
918
2,154
41,195
516,569
226,748
224,479
15,193
1,172
2,110
36,102
505,804
222,390
222,037
11,993
1,001
2,071
32,230
491,722
. Data is unavailable # Data is available, but specific variables or attributes are unavailable. 124

State Data System: Crash Data Report 2000–2009
Table 8: Motor Vehicles Involved in Crashes by Vehicle Type and Crash Severity
State Severity Vehicle Type 2000 2001 2002 2003 2004 2005 2006 2007 2008 2009
Utah Fatal
Injury
PDO
Passenger Car
Light Truck
Large Truck
Motorcycle
Bus
Other/Unknown
Total
208 161 155 155 159 . .
205 186 191 193 173 . .
44 36 49 25 33 . .
21 29 19 23 30 . .
6 2 2 2 3 . .
3 5 6 8 5 . .
487 419 422 406 403 . .
.
.
.
.
.
.
.
.
.
.
.
.
.
.
.
.
.
.
.
.
.
Passenger Car
Light Truck
Large Truck
Motorcycle
Bus
Other/Unknown
Total
21,357 20,971 21,044 19,794 20,678 . .
14,104 13,992 13,913 13,101 13,831 . .
915 824 990 738 869 . .
636 664 704 675 831 . .
122 98 95 80 97 . .
317 339 436 370 437 . .
37,451 36,888 37,182 34,758 36,743 . .
.
.
.
.
.
.
.
.
.
.
.
.
.
.
.
.
.
.
.
.
.
Passenger Car
Light Truck
Large Truck
Motorcycle
Bus
Other/Unknown
Total
32,967 32,378 32,873 31,784 33,868 . .
24,851 24,770 24,994 23,223 25,129 . .
2,333 2,033 2,283 1,839 2,174 . .
89 84 82 84 108 . .
251 267 264 217 196 . .
876 921 1,105 979 1,181 . .
61,367 60,453 61,601 58,126 62,656 . .
.
.
.
.
.
.
.
.
.
.
.
.
.
.
.
.
.
.
.
.
.
. Data is unavailable # Data is available, but specific variables or attributes are unavailable. 125

State Data System: Crash Data Report 2000–2009
Table 8: Motor Vehicles Involved in Crashes by Vehicle Type and Crash Severity
State Severity Vehicle Type 2000 2001 2002 2003 2004 2005 2006 2007 2008 2009
Virginia Fatal
Injury
Passenger Car
Light Truck
Large Truck
Motorcycle
Bus
Other/Unknown
Total
714 693 624 652 592 552 586 586 561 449
390 416 402 449 424 460 461 509 420 350
124 114 100 128 114 126 120 114 77 81
45 47 55 59 62 71 73 137 92 83
4 6 6 4 8 15 4 7 7 6
29 36 43 25 34 34 38 31 25 22
1,306 1,312 1,230 1,317 1,234 1,258 1,282 1,384 1,182 991
Passenger Car 63,200 61,271 60,609 58,986 58,743 55,979 54,851 50,247 50,794 45,224
Light Truck 26,905 28,806 29,956 31,735 33,873 33,871 32,599 31,332 30,394 28,140
Large Truck 3,263 3,299 2,978 3,240 3,583 3,490 3,146 2,900 2,786 2,499
Motorcycle 1,498 1,674 1,565 1,570 1,928 2,112 2,330 2,427 2,585 2,157
Bus 482 484 450 472 434 491 436 419 433 421
Other/Unknown 4,199 6,131 4,968 4,924 2,794 2,173 2,236 1,948 1,742 2,567
PDO
Total 99,547 101,665 100,526 100,927 101,355 98,116 95,598 89,273 88,734 81,008
Passenger Car 94,467 91,659 95,916 97,983 98,288 99,690 103,531 98,038 89,948 73,084
Light Truck 44,794 47,669 51,477 57,815 60,203 63,667 63,170 62,059 53,858 45,936
Large Truck 6,131 5,981 6,093 6,544 7,418 7,539 7,046 6,518 5,502 4,775
Motorcycle 447 480 246 308 294 377 406 400 380 280
Bus 811 861 825 927 927 1,054 1,053 937 990 744
Other/Unknown 8,521 11,800 10,196 10,448 6,886 6,090 6,537 6,101 4,698 4,824
Total 155,171 158,450 164,753 174,025 174,016 178,417 181,743 174,053 155,376 129,643
. Data is unavailable # Data is available, but specific variables or attributes are unavailable. 126

State Data System: Crash Data Report 2000–2009
Table 8: Motor Vehicles Involved in Crashes by Vehicle Type and Crash Severity
State Severity Vehicle Type 2000 2001 2002 2003 2004 2005 2006 2007 2008 2009
Washington Fatal
Injury
PDO
Passenger Car
Light Truck
Large Truck
Motorcycle
Bus
Other/Unknown
Total
# # 422 373 338 405 374
# # 356 334 320 315 344
# # 67 50 60 71 81
# # 62 62 80 72 81
# # 3 6 2 8 4
# # 170 163 140 164 16
# # 1,080 988 940 1,035 900
318
332
82
73
8
19
832
297
269
73
83
5
13
740
281
264
42
71
4
16
678
Passenger Car
Light Truck
Large Truck
Motorcycle
Bus
Other/Unknown
Total
# # 52,793 47,680 47,415 49,610 46,763
# # 31,959 29,722 30,307 32,998 32,474
# # 2,186 2,055 2,229 2,267 2,384
# # 1,491 1,544 1,859 2,071 2,166
# # 357 396 395 443 378
# # 7,258 6,626 6,708 6,987 1,947
# # 96,044 88,023 88,913 94,376 86,112
43,161
30,851
2,280
2,210
381
1,956
80,839
38,938
28,178
1,836
2,354
378
1,798
73,482
35,376
26,309
1,340
2,086
415
1,269
66,795
Passenger Car
Light Truck
Large Truck
Motorcycle
Bus
Other/Unknown
Total
# # 82,932 84,713 82,785 88,623 87,662
# # 52,901 54,205 55,642 60,911 63,022
# # 5,510 5,356 5,721 6,318 6,920
# # 327 406 455 481 596
# # 852 1,069 1,070 1,138 1,113
# # 16,065 17,168 16,254 17,254 8,594
# # 158,587 162,917 161,927 174,725 167,907
85,245
63,387
6,786
564
1,103
8,611
165,696
79,232
59,578
5,948
624
1,298
8,641
155,321
70,276
53,324
4,333
474
1,077
6,343
135,827
. Data is unavailable # Data is available, but specific variables or attributes are unavailable. 127

State Data System: Crash Data Report 2000–2009
Table 8: Motor Vehicles Involved in Crashes by Vehicle Type and Crash Severity
State Severity Vehicle Type 2000 2001 2002 2003 2004 2005 2006 2007 2008 2009
Wisconsin Fatal
Injury
Passenger Car
Light Truck
Large Truck
Motorcycle
Bus
Other/Unknown
Total
716 651 740 721 693 681 627 639 544 444
222 204 218 218 201 193 168 170 153 143
114 103 116 96 99 87 89 86 66 48
80 77 87 102 85 95 91 116 90 89
6 9 5 4 5 7 6 6 2 4
23 17 20 13 15 15 14 17 19 16
1,161 1,061 1,186 1,154 1,098 1,078 995 1,034 874 744
Passenger Car 61,903 56,248 56,582 55,220 54,895 53,478 50,530 51,410 47,639 42,634
Light Truck 11,378 10,095 10,131 9,885 9,578 9,140 8,180 8,343 7,662 6,720
Large Truck 2,806 2,484 2,287 2,154 2,295 2,179 1,935 1,982 1,869 1,497
Motorcycle 1,942 2,122 1,995 2,349 2,253 2,568 2,404 2,712 2,768 2,273
Bus 479 440 391 374 357 328 351 332 342 278
Other/Unknown 1,385 1,364 1,182 1,290 1,126 537 533 578 571 549
PDO
Total 79,893 72,753 72,568 71,272 70,504 68,230 63,933 65,357 60,851 53,951
Passenger Car 128,426 116,153 119,345 117,297 115,682 119,188 113,261 121,602 123,766 108,103
Light Truck 29,911 26,262 26,922 27,359 26,211 25,420 22,869 23,573 24,072 19,960
Large Truck 8,588 7,525 7,330 7,200 7,057 7,024 6,612 6,837 7,074 5,472
Motorcycle 304 358 375 387 388 376 351 446 519 437
Bus 951 903 750 829 815 804 741 826 932 834
Other/Unknown 8,353 7,770 7,368 11,488 11,866 5,659 6,808 9,446 11,117 12,413
Total 176,533 158,971 162,090 164,560 162,019 158,471 150,642 162,730 167,480 147,219
. Data is unavailable # Data is available, but specific variables or attributes are unavailable. 128

State Data System: Crash Data Report 2000–2009
Table 8: Motor Vehicles Involved in Crashes by Vehicle Type and Crash Severity
State Severity Vehicle Type 2000 2001 2002 2003 2004 2005 2006 2007 2008 2009
Wyoming Fatal
Injury
Passenger Car
Light Truck
Large Truck
Motorcycle
Bus
Other/Unknown
Total
91 95 101 70 81 85 102 70 59 41
49 64 52 63 52 56 72 54 78 79
18 27 26 28 46 25 49 21 30 13
6 9 14 20 15 22 18 26 19 13
15 11 12 14 11 9 15 6 1 2
5 3 1 3 5 1 5 1 4 3
184 209 206 198 210 198 261 178 191 151
Passenger Car 3,419 3,268 3,534 3,562 3,500 3,470 3,653 3,612 2,495 2,288
Light Truck 1,600 1,414 1,596 1,574 1,502 1,560 1,706 1,798 2,312 2,301
Large Truck 446 380 427 444 409 361 540 540 525 346
Motorcycle 212 217 222 295 249 301 352 395 294 277
Bus 340 341 315 346 349 338 359 353 17 9
Other/Unknown 99 84 92 87 100 96 78 97 259 98
PDO
Total 6,116 5,704 6,186 6,308 6,109 6,126 6,688 6,795 5,902 5,319
Passenger Car 9,212 9,255 9,617 10,813 10,374 10,611 10,816 11,008 8,151 7,451
Light Truck 4,797 4,838 4,921 5,289 5,089 5,448 5,497 5,988 7,995 7,656
Large Truck 1,396 1,226 1,081 1,392 1,198 1,149 1,463 1,632 1,723 991
Motorcycle 26 39 25 56 60 50 82 63 63 44
Bus 1,046 1,007 1,037 1,041 1,044 1,038 1,066 1,130 79 67
Other/Unknown 493 582 592 729 708 684 739 772 3,690 2,756
Total 16,970 16,947 17,273 19,320 18,473 18,980 19,663 20,593 21,701 18,965
. Data is unavailable # Data is available, but specific variables or attributes are unavailable. 129

State Data System: Crash Data Report 2000–2009
PEOPLE
130

State Data System: Crash Data Report 2000–2009
Table 9: People Killed or Injured in Motor Vehicle Crashes by Person Type
Injury Severity
Injury severity attributes can vary significantly among States. Some States use the Killed (K), Incapacitating (A), Non‐incapacitating (B), Possible (C) and No Injury (O) codes (“KABCO”) to describe injury severity, while other States simply group all injury severities into an “injured” category. For some States, “injured” may also include attributes such as “evident injury, but not incapacitating,” “complaint of injury,” or “injured, severity unknown.” For the purpose of this table, “injury” includes any attribute that the State considers “injured.”
Counts of uninjured people are not included in Tables 9 through 16 because of reporting differences between States and within States over time. For example, some States include all drivers, but include passengers only if they are injured or killed.
Person Type
The four person type categories and definitions used in this table are:
Driver: An occupant of a vehicle who is in physical control of a motor vehicle in transport, or for an out‐of‐control vehicle, an occupant who was in control until control was lost.
Passenger: Any occupant of a motor vehicle who is not a driver. Pedalcyclist: A person on a vehicle that is powered solely by pedals. Pedestrian: Any non‐motorist who is not a pedalcyclist.
Some States identify skaters, people in wheelchairs, or people in horse‐drawn carriages as distinct types of non‐motorists; however, most States group all non‐motorists who are not pedalcyclists into the broad category of “pedestrians.” Given the difficulty of identifying narrowly defined types of non‐motorists for most States, all non‐motorists other than pedalcyclists are grouped into the “Pedestrian” category in this table.
Some States include attributes such as not reported, other, and unknown. All of these attributes were included in the “unknown” person type. This category is not shown as a separate row in the following table; however, they are included in “totals.” The totals with unknown person type can be identified by a single asterisk (*) that are italicized for the applicable years.
131

State Data System: Crash Data Report 2000–2009
Table 9: People Killed or Injured in Motor Vehicle Crashes by Person Type
State Injury Severity Person Type 2000 2001 2002 2003 2004 2005 2006 2007 2008 2009
Alabama Killed Driver 692 683 698 685 800 792 841 776 700 611
Passenger 217 226 259 230 264 260 255 249 171 164
Pedestrian 63 68 63 64 81 75 81 69 73 45
Pedalcyclist 7 6 5 11 6 12 9 9 4 5
Total* 979 983 1,025 990 1,151 1,139 1,186 1,103 948 847
Injured Driver 29,180 29,059 30,016 29,680 31,001 30,315 29,771 27,511 24,685 24,214
Passenger 13,303 13,189 13,413 13,050 13,363 12,864 12,214 11,110 9,975 10,207
Pedestrian 592 565 585 601 605 564 584 549 468 366
Pedalcyclist 259 244 255 254 215 216 184 192 181 125
Total* 43,334 43,057 44,269 43,585 45,184 43,959 42,753 39,362 35,309 35,098
Arkansas Killed Driver 438 410 433 448 480 482 479 463 432 432
Passenger 174 159 167 153 195 132 148 138 117 117
Pedestrian 36 41 34 39 42 37 35 45 47 39
Pedalcyclist 4 1 7 1 4 3 3 4 4 4
Total 652 611 641 641 721 654 665 650 600 592
Injured Driver 24,239 28,864 32,267 34,474 39,992 41,123 44,456 32,727 24,646 21,286
Passenger 13,432 17,587 19,573 20,799 23,684 23,014 24,524 16,636 11,582 9,111
Pedestrian 353 422 467 490 465 421 428 392 368 369
Pedalcyclist 118 129 163 181 190 189 162 150 154 108
Total 38,142 47,002 52,470 55,944 64,331 64,747 69,570 49,905 36,750 30,874
California Killed Driver 1,924 2,037 2,199 2,252 2,255 2,275 2,292 2,208 1,910 1,668
Passenger 995 1,050 1,053 1,130 1,011 1,143 1,011 966 708 698
Pedestrian 695 723 717 719 705 755 740 670 653 604
Pedalcyclist 116 116 120 124 123 131 154 123 130 106
Total 3,730 3,926 4,089 4,225 4,094 4,304 4,197 3,967 3,401 3,076
Injured Driver 178,655 183,266 187,161 186,947 184,022 180,458 171,105 164,663 147,981 140,787
Passenger 97,769 96,648 97,726 95,011 92,881 88,020 82,396 77,530 68,494 66,642
Pedestrian 14,632 14,737 14,965 14,529 14,506 13,970 13,865 14,043 13,785 13,451
Pedalcyclist 11,967 11,256 10,837 10,679 10,948 10,350 10,208 10,451 11,613 11,897
Total 303,023 305,907 310,689 307,166 302,357 292,798 277,574 266,687 241,873 232,777
. Data is Unavailable # Data is available, but specific variables or attributes are unavailable. * For italicized years, the total does not equal the sum of driver, passenger, pedestrian, and pedalcyclist because it includes unknown person type.
132

State Data System: Crash Data Report 2000–2009
Table 9: People Killed or Injured in Motor Vehicle Crashes by Person Type
State Injury Severity Person Type 2000 2001 2002 2003 2004 2005 2006 2007 2008 2009
Colorado Killed
Injured
Driver
Passenger
Pedestrian
Pedalcyclist
Total
Driver
Passenger
Pedestrian
Pedalcyclist
Total
432 460 473 382 400 . . . . .
186 224 195 165 187 . . . . .
75 63 70 58 70 . . . . .
11 17 12 4 16 . . . . .
704 764 750 609 673 . . . . .
33,353 32,968 32,742 29,042 30,169 . . . . .
16,298 15,808 15,414 13,150 13,382 . . . . .
1,175 1,312 1,346 1,186 1,549 . . . . .
1,037 1,008 1,037 993 1,182 . . . . .
51,863 51,096 50,539 44,371 46,282 . . . . .
Connecticut Killed Driver 224 213 194 190 202 182 220 193 198 159
Passenger 67 67 77 71 60 59 48 66 52 40
Pedestrian 49 35 50 35 27 34 38 32 47 27
Pedalcyclist 3 3 4 2 5 3 5 5 6 1
Total 343 318 325 298 294 278 311 296 303 227
Injured Driver 34,045 33,472 31,417 30,433 30,275 28,632 26,776 27,645 25,365 25,081
Passenger 15,123 14,805 13,788 12,782 12,319 11,296 10,540 10,576 9,363 9,775
Pedestrian 1,295 1,376 1,172 1,173 1,062 1,087 1,064 1,220 1,082 1,080
Pedalcyclist 797 796 668 658 611 642 574 656 595 541
Total 51,260 50,449 47,045 45,046 44,267 41,657 38,954 40,097 36,405 36,477
Delaware Killed
Injured
Driver
Passenger
Pedestrian
Pedalcyclist
Total*
Driver
Passenger
Pedestrian
Pedalcyclist
Total*
69 80 74 93 87 . . 74 72 66
36 40 33 33 33 . . 24 24 24
22 17 14 18 17 . . 17 22 15
3 2 4 2 3 . . 0 6 6
130 139 125 146 140 . . 115 124 112
6,452 6,200 6,297 5,697 4,816 . . 5,185 4,867 4,760
3,501 3,357 3,325 2,880 2,453 . . 2,002 1,924 1,933
317 286 243 222 240 . . 259 270 263
150 122 100 100 90 . . 99 121 124
10,420 9,965 9,965 8,899 7,599 . . 7,547 7,183 7,083
. Data is Unavailable # Data is available, but specific variables or attributes are unavailable. * For italicized years, the total does not equal the sum of driver, passenger, pedestrian, and pedalcyclist because it includes unknown person type.
133

State Data System: Crash Data Report 2000–2009
Table 9: People Killed or Injured in Motor Vehicle Crashes by Person Type
State Injury Severity Person Type 2000 2001 2002 2003 2004 2005 2006 2007 2008 2009
Florida Killed Driver 1,722 1,701 1,806 1,857 1,914 2,041 2,022 1,921 1,812 1,495
Passenger 688 692 745 718 720 797 671 655 540 485
Pedestrian 506 510 484 509 504 576 546 529 505 482
Pedalcyclist 83 110 109 95 119 119 126 121 110 100
Total 2,999 3,013 3,144 3,179 3,257 3,533 3,365 3,226 2,967 2,562
Injured Driver 149,352 150,440 147,945 142,745 146,972 153,724 141,314 141,025 130,480 127,680
Passenger 69,809 71,713 69,185 66,376 67,789 67,651 61,580 60,791 56,702 57,427
Pedestrian 7,782 7,894 7,447 7,449 7,551 7,975 7,754 7,553 7,867 7,677
Pedalcyclist 4,645 4,553 5,034 5,069 4,880 4,580 4,266 4,355 4,424 4,427
Total 231,588 234,600 229,611 221,639 227,192 233,930 214,914 213,724 199,473 197,211
Georgia Killed Driver 982 1,048 962 1,030 1,068 1,173 1,162 1,092 1,032 1,011
Passenger 412 430 391 403 399 400 367 384 315 276
Pedestrian 139 158 166 161 156 150 157 157 140 155
Pedalcyclist 14 20 12 16 18 21 17 15 21 19
Total 1,547 1,656 1,531 1,610 1,641 1,744 1,703 1,648 1,508 1,461
Injured Driver 85,037 86,826 87,461 88,379 92,266 93,674 90,129 87,695 79,273 83,638
Passenger 42,711 42,569 42,279 42,005 43,039 42,600 40,650 37,241 34,038 37,614
Pedestrian 2,066 2,145 2,118 2,090 1,981 2,073 2,057 1,957 1,881 1,921
Pedalcyclist 757 723 701 741 706 705 719 594 599 606
Total 130,571 132,263 132,559 133,215 137,992 139,052 133,555 127,487 115,791 123,779
Illinois Killed Driver 849 846 864 888 843 842 802 767 654 576
Passenger 359 352 339 357 330 329 285 285 224 203
Pedestrian 190 189 195 192 156 171 143 178 138 112
Pedalcyclist 18 27 22 17 25 21 24 18 27 20
Total 1,416 1,414 1,420 1,454 1,354 1,363 1,254 1,248 1,043 911
Injured Driver 87,533 81,652 82,984 87,673 78,933 74,355 67,790 65,584 60,407 56,569
Passenger 37,380 33,075 35,116 34,587 33,447 28,427 29,662 27,511 24,799 24,221
Pedestrian 6,568 6,414 6,459 5,906 5,818 5,716 6,240 6,201 5,538 5,273
Pedalcyclist 3,284 2,993 3,059 2,969 3,232 3,335 3,204 3,870 3,352 3,129
Total 134,765 124,134 127,618 131,135 121,430 111,833 106,896 103,166 94,096 89,192
. Data is Unavailable # Data is available, but specific variables or attributes are unavailable. * For italicized years, the total does not equal the sum of driver, passenger, pedestrian, and pedalcyclist because it includes unknown person type.
134

State Data System: Crash Data Report 2000–2009
Table 9: People Killed or Injured in Motor Vehicle Crashes by Person Type
State Injury Severity Person Type 2000 2001 2002 2003 2004 2005 2006 2007 2008 2009
Indiana Killed
Injured
Driver
Passenger
Pedestrian
Pedalcyclist
Total*
Driver
Passenger
Pedestrian
Pedalcyclist
Total*
584 . . # 644 661 612 628 555 493
218 . . # 218 200 199 200 186 139
56 . . # 72 64 75 60 61 55
# . . # 13 13 19 13 16 7
888 . . # 947 938 905 901 818 694
45,968 . . # 43,215 41,655 38,974 36,208 33,911 32,105
19,872 . . # 16,182 15,491 14,517 13,727 12,471 12,272
1,877 . . # 1,362 1,360 1,420 1,591 1,604 1,469
# . . # 885 763 852 960 875 804
74,259 . . # 61,762 59,374 55,858 52,491 48,863 46,655
Iowa Killed
Injured
Driver
Passenger
Pedestrian
Pedalcyclist
Total*
Driver
Passenger
Pedestrian
Pedalcyclist
Total*
. 282 285 300 255 307 313 291 287 271
. 117 95 100 98 102 88 117 92 72
. 18 19 19 25 25 26 24 19 21
. 3 4 3 7 11 5 7 5 2
. 423 406 441 388 451 439 445 411 371
. 18,933 16,812 15,948 15,692 15,587 14,455 14,889 14,761 13,269
. 7,551 6,726 6,154 6,152 5,859 5,288 5,358 5,063 4,632
. 515 528 495 483 450 443 520 480 446
. 411 421 434 460 387 439 440 434 395
. 28,322 24,668 23,234 23,020 22,468 20,828 21,412 21,017 18,952
Kansas Killed Driver 325 349 354 311 310 303 344 295 278 272
Passenger 110 117 128 130 125 98 95 99 82 87
Pedestrian 21 25 24 24 21 24 23 20 19 22
Pedalcyclist 3 2 5 6 3 4 6 2 5 6
Total* 461 494 511 471 459 429 468 416 385 387
Injured Driver 19,060 19,033 17,988 16,527 16,016 15,497 15,208 15,822 14,490 13,356
Passenger 9,134 8,880 8,190 7,447 6,922 6,414 6,327 6,292 5,864 5,556
Pedestrian 507 569 528 496 451 475 442 478 401 383
Pedalcyclist 322 307 325 305 357 320 330 279 269 283
Total* 29,072 28,828 27,059 24,793 23,777 22,722 22,320 22,903 21,058 19,673
. Data is Unavailable # Data is available, but specific variables or attributes are unavailable. * For italicized years, the total does not equal the sum of driver, passenger, pedestrian, and pedalcyclist because it includes unknown person type.
135

State Data System: Crash Data Report 2000–2009
Table 9: People Killed or Injured in Motor Vehicle Crashes by Person Type
State Injury Severity Person Type 2000 2001 2002 2003 2004 2005 2006 2007 2008 2009
Kentucky Killed Driver 541 569 638 662 685 697 669 646 597 595
Passenger 210 211 222 223 242 232 194 186 165 155
Pedestrian 52 53 54 60 49 55 54 47 69 39
Pedalcyclist 4 8 9 5 6 12 5 1 7 5
Total* 808 841 924 954 982 996 922 880 838 794
Injured Driver 34,319 32,619 32,290 30,562 29,496 28,723 27,129 25,693 24,604 24,531
Passenger 17,369 16,011 15,830 15,184 14,303 13,701 12,796 11,963 11,545 11,761
Pedestrian 971 889 839 849 819 801 814 804 831 821
Pedalcyclist 449 386 349 359 335 329 295 324 357 297
Total* 53,123 49,923 49,324 46,976 44,976 43,563 41,044 38,798 37,343 37,414
Louisiana Killed
Injured
Driver
Passenger
Pedestrian
Pedalcyclist
Total
Driver
Passenger
Pedestrian
Pedalcyclist
Total
. . . . . 627 665 639 585 544
. . . . . 209 200 220 210 159
. . . . . 108 99 111 110 109
. . . . . 22 23 23 10 12
. . . . . 966 987 993 915 824
. . . . . 52,518 51,973 50,955 49,006 47,652
. . . . . 28,489 26,636 26,446 25,096 24,477
. . . . . 1,188 958 1,016 1,176 1,121
. . . . . 665 549 534 624 584
. . . . . 82,860 80,116 78,951 75,902 73,834
Maryland Killed Driver 375 411 408 382 392 375 429 374 358 344
Passenger 137 137 141 143 140 127 117 121 109 83
Pedestrian 99 100 104 117 96 102 95 112 115 113
Pedalcyclist 6 13 7 6 11 7 7 7 7 10
Total* 617 662 661 651 643 613 651 615 592 550
Injured Driver 37,582 38,416 39,004 38,981 37,204 36,494 35,762 34,384 32,064 31,703
Passenger 17,655 17,739 17,156 16,783 15,622 14,659 14,097 13,514 12,496 12,548
Pedestrian 2,791 2,726 2,630 2,773 2,519 2,662 2,642 2,568 2,518 2,519
Pedalcyclist 883 762 746 661 673 627 646 641 631 561
Total* 59,032 59,891 59,861 59,537 56,658 55,031 53,564 51,476 48,121 47,331
. Data is Unavailable # Data is available, but specific variables or attributes are unavailable. * For italicized years, the total does not equal the sum of driver, passenger, pedestrian, and pedalcyclist because it includes unknown person type.
136
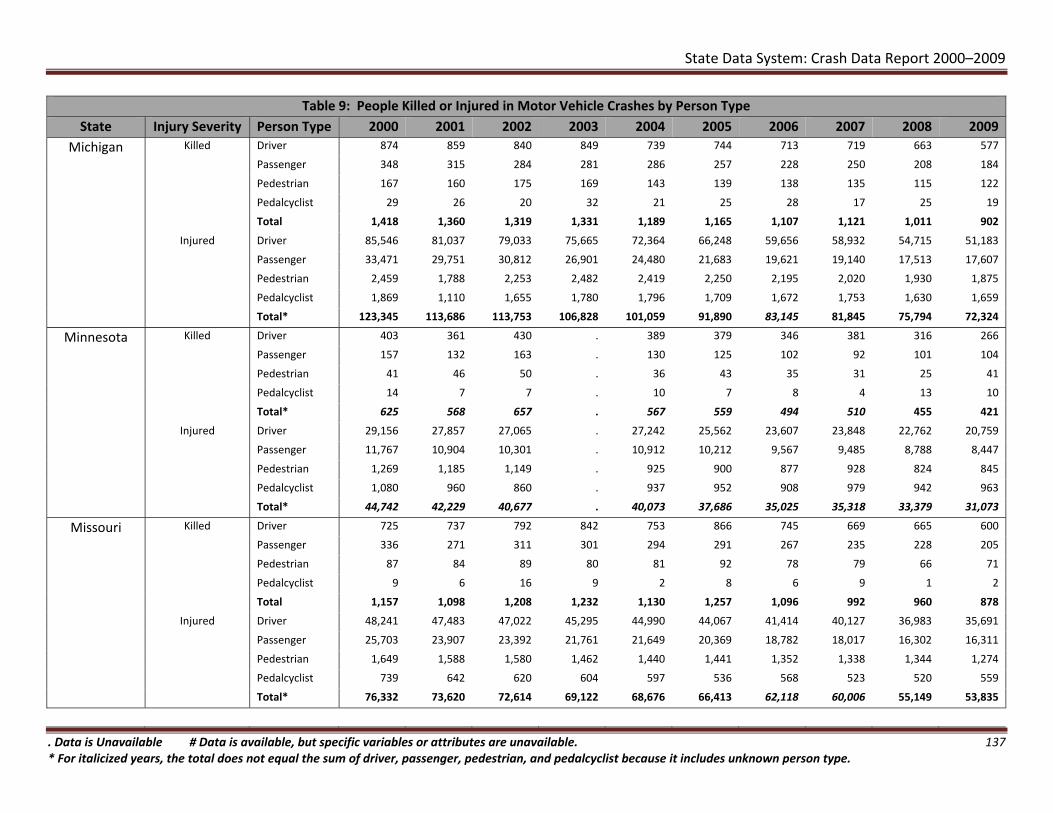
State Data System: Crash Data Report 2000–2009
Table 9: People Killed or Injured in Motor Vehicle Crashes by Person Type
State Injury Severity Person Type 2000 2001 2002 2003 2004 2005 2006 2007 2008 2009
Michigan Killed Driver 874 859 840 849 739 744 713 719 663 577
Passenger 348 315 284 281 286 257 228 250 208 184
Pedestrian 167 160 175 169 143 139 138 135 115 122
Pedalcyclist 29 26 20 32 21 25 28 17 25 19
Total 1,418 1,360 1,319 1,331 1,189 1,165 1,107 1,121 1,011 902
Injured Driver 85,546 81,037 79,033 75,665 72,364 66,248 59,656 58,932 54,715 51,183
Passenger 33,471 29,751 30,812 26,901 24,480 21,683 19,621 19,140 17,513 17,607
Pedestrian 2,459 1,788 2,253 2,482 2,419 2,250 2,195 2,020 1,930 1,875
Pedalcyclist 1,869 1,110 1,655 1,780 1,796 1,709 1,672 1,753 1,630 1,659
Total* 123,345 113,686 113,753 106,828 101,059 91,890 83,145 81,845 75,794 72,324
Minnesota Killed
Injured
Driver
Passenger
Pedestrian
Pedalcyclist
Total*
Driver
Passenger
Pedestrian
Pedalcyclist
Total*
403 361 430 . 389 379 346 381 316 266
157 132 163 . 130 125 102 92 101 104
41 46 50 . 36 43 35 31 25 41
14 7 7 . 10 7 8 4 13 10
625 568 657 . 567 559 494 510 455 421
29,156 27,857 27,065 . 27,242 25,562 23,607 23,848 22,762 20,759
11,767 10,904 10,301 . 10,912 10,212 9,567 9,485 8,788 8,447
1,269 1,185 1,149 . 925 900 877 928 824 845
1,080 960 860 . 937 952 908 979 942 963
44,742 42,229 40,677 . 40,073 37,686 35,025 35,318 33,379 31,073
Missouri Killed Driver 725 737 792 842 753 866 745 669 665 600
Passenger 336 271 311 301 294 291 267 235 228 205
Pedestrian 87 84 89 80 81 92 78 79 66 71
Pedalcyclist 9 6 16 9 2 8 6 9 1 2
Total 1,157 1,098 1,208 1,232 1,130 1,257 1,096 992 960 878
Injured Driver 48,241 47,483 47,022 45,295 44,990 44,067 41,414 40,127 36,983 35,691
Passenger 25,703 23,907 23,392 21,761 21,649 20,369 18,782 18,017 16,302 16,311
Pedestrian 1,649 1,588 1,580 1,462 1,440 1,441 1,352 1,338 1,344 1,274
Pedalcyclist 739 642 620 604 597 536 568 523 520 559
Total* 76,332 73,620 72,614 69,122 68,676 66,413 62,118 60,006 55,149 53,835
. Data is Unavailable # Data is available, but specific variables or attributes are unavailable. * For italicized years, the total does not equal the sum of driver, passenger, pedestrian, and pedalcyclist because it includes unknown person type.
137

State Data System: Crash Data Report 2000–2009
Table 9: People Killed or Injured in Motor Vehicle Crashes by Person Type
State Injury Severity Person Type 2000 2001 2002 2003 2004 2005 2006 2007 2008 2009
Montana Killed
Injured
Driver
Passenger
Pedestrian
Pedalcyclist
Total*
Driver
Passenger
Pedestrian
Pedalcyclist
Total*
148 157 178 176 160 163 169 193 152 .
64 59 66 61 52 59 69 59 59 .
12 9 14 10 10 14 12 15 10 .
8 0 1 2 2 4 2 4 3 .
237 230 267 252 229 251 263 276 229 .
6,785 5,690 6,344 6,003 5,911 6,102 6,239 5,929 5,564 .
3,678 2,972 3,382 3,304 3,038 2,761 2,899 2,851 2,563 .
148 149 164 146 125 142 131 115 130 .
176 164 158 153 147 138 152 146 151 .
10,805 9,002 10,086 9,650 9,263 9,211 9,469 9,069 8,465 .
Nebraska Killed Driver 177 161 213 191 171 187 173 173 157 169
Passenger 75 62 78 81 70 74 81 71 46 40
Pedestrian 20 12 12 12 9 9 9 8 5 9
Pedalcyclist 2 5 2 2 1 3 2 1 0 3
Total* 276 247 307 293 254 276 269 256 209 223
Injured Driver 19,566 17,809 15,536 14,733 14,306 13,392 12,444 12,897 12,157 11,930
Passenger 8,883 8,079 6,999 6,401 6,261 5,701 5,287 5,334 4,881 5,110
Pedestrian 504 495 500 471 437 377 389 441 417 394
Pedalcyclist 387 297 357 363 316 299 268 255 324 277
Total* 29,429 26,803 23,477 22,041 21,406 19,855 18,455 19,006 17,835 17,776
New Jersey Killed
Injured
Driver
Passenger
Pedestrian
Pedalcyclist
Total*
Driver
Passenger
Pedestrian
Pedalcyclist
Total*
. 418 335 430 441 423 400 417 337 312
. 158 118 169 123 149 153 133 105 88
. 118 143 138 144 157 170 144 144 160
. 23 7 9 18 14 7 10 19 13
. 726 609 752 739 752 738 709 611 577
. 74,259 75,167 73,562 72,619 68,611 65,012 63,158 62,103 61,495
. 33,812 33,793 31,870 30,976 28,583 25,832 24,921 24,205 24,381
. 5,872 5,947 5,936 5,872 5,738 5,279 5,265 5,188 5,088
. 2,466 2,279 2,253 2,383 2,236 1,762 1,694 1,997 1,949
. 116,905 117,579 113,997 112,200 105,499 98,261 95,454 94,113 93,562
. Data is Unavailable # Data is available, but specific variables or attributes are unavailable. * For italicized years, the total does not equal the sum of driver, passenger, pedestrian, and pedalcyclist because it includes unknown person type.
138

State Data System: Crash Data Report 2000–2009
Table 9: People Killed or Injured in Motor Vehicle Crashes by Person Type
State Injury Severity Person Type 2000 2001 2002 2003 2004 2005 2006 2007 2008 2009
New Mexico Killed Driver 248 243 244 231 280 274 266 237 203 221
Passenger 118 139 139 136 175 126 128 101 111 92
Pedestrian 48 72 59 53 55 61 70 52 40 41
Pedalcyclist 5 7 3 3 3 4 4 7 7 3
Total* 435 464 449 438 522 488 484 413 368 361
Injured Driver 17,635 17,815 17,200 16,835 17,435 15,883 14,794 13,861 14,192 13,091
Passenger 8,910 8,884 8,450 7,838 8,169 7,255 6,625 5,905 5,540 5,599
Pedestrian 346 451 407 401 422 368 387 377 415 392
Pedalcyclist 284 279 298 226 328 306 291 273 316 280
Total* 27,380 27,536 26,441 25,414 26,481 24,005 22,217 20,555 20,559 19,473
New York Killed
Injured
Driver
Passenger
Pedestrian
Pedalcyclist
Total*
Driver
Passenger
Pedestrian
Pedalcyclist
Total*
757 . 809 809 823 770 801 762 669 603
301 . 330 302 301 264 269 231 211 209
335 . 326 327 328 328 318 272 302 307
38 . 34 38 41 47 45 50 42 29
1,444 . 1,509 1,477 1,495 1,410 1,433 1,317 1,224 1,148
159,667 . 155,805 145,159 134,794 126,615 119,411 119,314 114,393 112,855
94,373 . 82,489 73,739 63,772 57,991 54,629 53,261 51,120 51,499
18,504 . 17,214 16,665 15,678 15,392 15,387 15,472 15,317 15,321
7,509 . 5,992 5,581 5,690 5,680 5,426 5,373 5,422 5,405
301,937 . 262,884 242,173 220,837 206,514 195,644 194,255 187,160 186,034
North Killed Driver 955 935 1,013 1,003 1,019 1,018 1,014 1,153 940 901
Carolina Passenger 405 402 362 383 368 329 350 347 303 277
Pedestrian 160 149 173 146 161 155 172 171 161 142
Pedalcyclist 27 26 16 18 20 37 18 17 30 13
Total* 1,559 1,533 1,576 1,557 1,578 1,546 1,559 1,694 1,450 1,344
Injured Driver 91,642 87,893 87,295 88,726 88,375 83,119 80,353 80,323 75,319 72,713
Passenger 46,752 43,468 43,547 43,561 42,255 38,368 37,393 36,801 34,588 34,505
Pedestrian 1,612 1,614 1,502 1,587 1,657 1,503 1,471 1,601 1,499 1,370
Pedalcyclist 867 852 771 575 573 617 634 714 720 644
Total* 141,277 134,226 133,395 134,574 132,972 123,778 120,003 119,653 112,397 109,503
. Data is Unavailable # Data is available, but specific variables or attributes are unavailable. * For italicized years, the total does not equal the sum of driver, passenger, pedestrian, and pedalcyclist because it includes unknown person type.
139

State Data System: Crash Data Report 2000–2009
Table 9: People Killed or Injured in Motor Vehicle Crashes by Person Type
State Injury Severity Person Type 2000 2001 2002 2003 2004 2005 2006 2007 2008 2009
North Dakota Killed
Injured
Driver
Passenger
Pedestrian
Pedalcyclist
Total
Driver
Passenger
Pedestrian
Pedalcyclist
Total
. . . 72 75 87 78 68 69 91
. . . 26 18 26 29 38 27 44
. . . 7 5 9 4 4 3 4
. . . 0 2 2 0 0 1 1
. . . 105 100 124 111 110 100 140
. . . 3,174 3,013 2,896 2,781 2,881 2,939 3,035
. . . 1,467 1,436 1,329 1,203 1,145 1,135 1,262
. . . 78 90 61 40 73 44 85
. . . 102 79 82 84 87 89 76
. . . 4,821 4,618 4,368 4,108 4,186 4,207 4,458
Ohio Killed Driver 943 944 980 880 866 919 878 877 831 715
Passenger 304 322 333 289 305 302 248 257 244 208
Pedestrian 92 96 90 101 96 94 96 107 98 81
Pedalcyclist 22 17 14 8 18 13 17 16 18 18
Total 1,361 1,379 1,417 1,278 1,285 1,328 1,239 1,257 1,191 1,022
Injured Driver 113,362 97,665 97,376 96,863 96,568 90,684 84,888 80,953 77,757 73,545
Passenger 48,429 36,219 41,203 40,142 39,468 36,621 34,015 31,727 30,797 30,212
Pedestrian 2,879 2,924 2,691 2,489 2,382 2,397 2,444 2,164 2,313 2,262
Pedalcyclist 2,118 2,039 1,988 1,869 1,759 1,691 1,632 1,597 1,593 1,601
Total 166,788 138,847 143,258 141,363 140,177 131,393 122,979 116,441 112,460 107,620
Pennsylvania Killed
Injured
Driver
Passenger
Pedestrian
Pedalcyclist
Total*
Driver
Passenger
Pedestrian
Pedalcyclist
Total*
995 967 . 1,051 997 1,106 1,044 1,020 1,048 858
337 355 . 329 327 326 290 294 261 243
172 195 . 174 151 162 170 155 142 136
16 15 . 21 15 22 13 20 8 16
1,520 1,532 . 1,575 1,490 1,616 1,525 1,491 1,461 1,255
84,754 76,056 . 76,316 75,512 72,432 63,680 62,432 58,746 57,393
38,740 34,762 . 34,009 33,791 31,237 26,795 25,898 23,523 23,760
5,522 5,184 . 4,997 4,953 4,741 4,565 4,618 4,357 4,229
2,454 1,860 . 1,669 1,682 1,440 1,312 1,427 1,402 1,380
131,470 117,862 . 116,991 115,938 109,850 96,590 94,624 88,106 86,812
. Data is Unavailable # Data is available, but specific variables or attributes are unavailable. * For italicized years, the total does not equal the sum of driver, passenger, pedestrian, and pedalcyclist because it includes unknown person type.
140

State Data System: Crash Data Report 2000–2009
Table 9: People Killed or Injured in Motor Vehicle Crashes by Person Type
State Injury Severity Person Type 2000 2001 2002 2003 2004 2005 2006 2007 2008 2009
South Killed Driver 681 652 692 632 692 688 650 650 561 610
Carolina Passenger 273 264 250 239 236 282 244 282 236 179
Pedestrian 80 106 94 79 86 97 125 109 100 88
Pedalcyclist 25 25 15 15 21 17 13 21 15 13
Total* 1,063 1,060 1,053 969 1,046 1,093 1,044 1,077 921 894
Injured Driver 33,069 33,184 33,670 33,063 33,218 32,872 32,372 32,084 30,370 31,078
Passenger 19,071 17,610 16,996 16,679 16,529 16,695 16,288 15,608 15,117 15,789
Pedestrian 854 868 868 848 795 780 830 872 854 770
Pedalcyclist 498 464 487 514 481 504 463 469 521 465
Total* 53,647 52,332 52,220 51,266 51,195 50,993 50,145 49,279 47,023 48,303
Texas Killed
Injured
Driver
Passenger
Pedestrian
Pedalcyclist
Total*
Driver
Passenger
Pedestrian
Pedalcyclist
Total*
2,234 2,251 . 2,375 2,200 2,136 2,210 2,204 2,201 2,036
990 905 . 978 986 933 868 789 784 653
418 460 . 408 457 442 391 418 444 347
36 45 . 58 52 47 47 50 48 49
3,774 3,739 . 3,822 3,700 3,558 3,521 3,463 3,477 3,089
212,508 213,318 . 195,975 185,017 189,064 178,283 175,752 160,394 154,217
105,420 104,452 . 105,629 97,705 98,199 88,130 85,069 76,549 74,374
4,834 5,029 . 4,796 3,937 3,828 3,368 3,884 4,773 4,629
2,353 2,192 . 1,899 1,498 1,429 1,281 1,431 2,090 1,995
340,901 340,452 . 308,360 288,228 292,655 271,126 266,318 243,866 235,280
Utah Killed
Injured
Driver
Passenger
Pedestrian
Pedalcyclist
Total
Driver
Passenger
Pedestrian
Pedalcyclist
Total*
200 168 179 168 173 . . . . .
131 88 119 111 93 . . . . .
33 31 27 28 25 . . . . .
9 5 4 2 6 . . . . .
373 292 329 309 297 . . . . .
18,936 18,651 19,527 18,149 19,496 . . . . .
9,801 9,419 9,634 8,944 8,803 . . . . .
708 682 677 614 675 . . . . .
635 625 590 621 648 . . . . .
30,086 29,377 30,429 28,352 29,637 . . . . .
. Data is Unavailable # Data is available, but specific variables or attributes are unavailable. * For italicized years, the total does not equal the sum of driver, passenger, pedestrian, and pedalcyclist because it includes unknown person type.
141

State Data System: Crash Data Report 2000–2009
Table 9: People Killed or Injured in Motor Vehicle Crashes by Person Type
State Injury Severity Person Type 2000 2001 2002 2003 2004 2005 2006 2007 2008 2009
Virginia Killed Driver 595 597 571 628 615 643 643 702 611 512
Passenger 228 221 242 218 211 191 223 229 170 160
Pedestrian 91 100 88 87 87 91 83 88 76 73
Pedalcyclist 16 17 12 9 9 21 12 7 8 11
Total 930 935 913 942 922 946 961 1,026 865 756
Injured Driver 52,715 53,554 52,993 53,529 53,641 52,324 50,501 47,761 50,113 45,849
Passenger 24,248 23,699 23,183 22,599 22,119 21,053 20,089 18,461 16,791 15,105
Pedestrian 1,938 2,094 1,900 1,907 1,893 1,773 1,923 1,761 1,697 1,402
Pedalcyclist 904 840 820 807 833 873 835 839 322 607
Total 79,805 80,187 78,896 78,842 78,486 76,023 73,348 68,822 68,923 62,963
Washington Killed
Injured
Driver
Passenger
Pedestrian
Pedalcyclist
Total
Driver
Passenger
Pedestrian
Pedalcyclist
Total
227 392 445 369 366 404 404 365 358 310
112 180 159 155 147 161 152 132 94 118
102 143 76 85 63 77 73 63 61 62
# 4 3 3 1 6 5 5 5 5
441 719 683 612 577 648 634 565 518 495
20,700 47,310 46,181 42,244 43,031 45,450 43,447 40,894 36,899 33,670
9,078 19,690 18,899 16,776 16,843 17,513 16,402 14,939 13,601 12,764
8 1,438 1,864 1,857 1,764 1,884 1,970 1,907 1,913 1,814
# 157 160 147 145 152 969 938 974 1,007
29,786 68,595 67,104 61,024 61,783 64,999 62,788 58,678 53,387 49,255
Wisconsin Killed Driver 537 523 561 572 547 538 502 512 402 381
Passenger 203 191 187 199 166 211 150 164 130 120
Pedestrian 56 48 52 58 57 44 62 60 59 41
Pedalcyclist 10 9 9 12 14 14 8 11 9 7
Total 806 771 809 841 784 807 722 747 600 549
Injured Driver 42,277 38,723 38,943 38,874 37,758 36,960 34,636 35,127 32,703 28,770
Passenger 19,993 18,039 17,437 16,555 16,156 15,087 14,282 14,105 12,635 11,555
Pedestrian 2,151 2,034 1,933 1,925 1,793 1,844 1,854 1,799 1,637 1,547
Pedalcyclist 1,353 1,292 1,229 1,235 1,197 1,186 1,135 1,199 1,081 1,044
Total 65,774 60,088 59,542 58,589 56,904 55,077 51,907 52,230 48,056 42,916
. Data is Unavailable # Data is available, but specific variables or attributes are unavailable. * For italicized years, the total does not equal the sum of driver, passenger, pedestrian, and pedalcyclist because it includes unknown person type.
142

State Data System: Crash Data Report 2000–2009
Table 9: People Killed or Injured in Motor Vehicle Crashes by Person Type
State Injury Severity Person Type 2000 2001 2002 2003 2004 2005 2006 2007 2008 2009
Wyoming Killed Driver
Passenger
84 120 115 102 101 118
52 54 48 52 57 37
129
56
109
38
105
46
86
43
Pedestrian 12 5 4 7 3 7 6 2 7 2
Pedalcyclist 2 1 2 1 0 2 0 0 1 2
Total* 152 186 176 165 164 170 195 149 159 134
Injured Driver 3,697 3,413 3,735 3,886 3,804 3,830 4,241 4,254 3,673 3,217
Passenger 2,061 1,958 2,130 2,089 2,007 2,006 2,086 2,064 1,650 1,569
Pedestrian 86 90 95 89 113 116 87 93 94 78
Pedalcyclist 102 106 84 67 67 87 91 77 80 74
Total* 6,015 5,657 6,146 6,250 6,114 6,112 6,650 6,620 5,523 4,967
. Data is Unavailable # Data is available, but specific variables or attributes are unavailable. * For italicized years, the total does not equal the sum of driver, passenger, pedestrian, and pedalcyclist because it includes unknown person type.
143

State Data System: Crash Data Report 2000–2009
Table 10: People Killed or Injured in Motor Vehicle Crashes by Age Group
Age is the person’s reported age at the time of crash and is categorized into the following groups.
Less than 5 years old 5 to 9 years old 10 to 15 years old 16 to 20 years old 21 to 24 years old 25 to 34 years old 35 to 44 years old 45 to 54 years old 55 to 64 years old 65 to 74 years old Greater than 74 years old Unknown
Most States have a variable for age for all person types. However, in some States, the date of birth (DOB) variable is available instead of age. In those States, age was derived from the DOB and the date of the crash.
“Age 0” is included in the “Less than 5 years old” group, while the age group “Greater than 74 years old” includes ages over 74 years old to 120 years old. Any age over 120 years old was grouped into “Unknown.” Some States indicate age 0 or 99 as Unknown. For those States, 0 or 99 were included in “Unknown” category.
California counts a fetal death as a separate fatality. There were 8 to 17 fetal fatalities per year from 2004 to 2009. Fetal deaths were not shown as a separate row in Table 10, but are included in the total fatality counts. The yearly fatality totals are italicized if they include fetal deaths.
144

State Data System: Crash Data Report 2000–2009
Table 10 : People Killed or Injured in Motor Vehicle Crashes by Age Group State Injury Severity Age Group 2000 2001 2002 2003 2004 2005 2006 2007 2008 2009
Alabama Killed < 5 Yrs.
5 Yrs. ‐ 9 Yrs.
10 Yrs. ‐ 15 Yrs.
16 Yrs. ‐ 20 Yrs.
21 Yrs. ‐ 24 Yrs.
25 Yrs. ‐ 34 Yrs.
35 Yrs. ‐ 44 Yrs.
45 Yrs. ‐ 54 Yrs.
55 Yrs. ‐ 64 Yrs.
65 Yrs. ‐ 74 Yrs.
> 74 Yrs.
Unknown
Total
16 18 19 9 23 16 13 5 11 5
16 18 19 12 12 15 20 11 5 6
27 32 31 24 38 31 36 22 21 14
149 153 140 143 165 165 163 160 127 95
96 98 107 103 118 107 125 133 100 63
162 174 180 157 188 209 220 172 170 131
189 156 177 165 182 167 200 174 145 121
111 118 123 164 159 165 181 161 169 115
78 76 96 84 106 113 103 112 109 97
68 55 64 56 75 87 54 80 38 64
66 84 68 72 80 62 70 69 51 63
1 1 1 1 5 2 1 4 2 73
979 983 1,025 990 1,151 1,139 1,186 1,103 948 847
Injured < 5 Yrs. 1,207 1,130 1,145 1,085 1,117 1,090 1,009 964 798 494
5 Yrs. ‐ 9 Yrs. 1,435 1,344 1,314 1,281 1,325 1,294 1,223 1,020 917 594
10 Yrs. ‐ 15 Yrs. 2,376 2,421 2,371 2,392 2,396 2,197 2,061 1,763 1,563 1,022
16 Yrs. ‐ 20 Yrs. 8,135 8,070 8,171 8,009 8,030 7,729 7,472 6,702 5,953 4,950
21 Yrs. ‐ 24 Yrs. 4,280 4,462 4,625 4,599 4,748 4,784 4,591 4,213 3,602 3,228
25 Yrs. ‐ 34 Yrs. 7,843 7,638 7,869 7,678 7,984 7,840 7,926 7,069 6,451 5,895
35 Yrs. ‐ 44 Yrs. 6,843 6,658 6,867 6,444 6,775 6,519 6,233 5,889 5,253 4,689
45 Yrs. ‐ 54 Yrs. 4,955 4,894 5,131 5,364 5,643 5,469 5,501 5,059 4,686 4,453
55 Yrs. ‐ 64 Yrs. 2,709 2,857 3,026 3,117 3,449 3,419 3,355 3,378 3,103 2,974
65 Yrs. ‐ 74 Yrs. 1,915 1,907 1,957 1,913 2,017 1,896 1,849 1,799 1,561 1,586
> 74 Yrs. 1,407 1,420 1,517 1,434 1,401 1,450 1,316 1,259 1,195 1,081
Unknown 229 256 276 269 299 272 217 247 227 4,132
Total 43,334 43,057 44,269 43,585 45,184 43,959 42,753 39,362 35,309 35,098
. Data is unavailable # Data is available, but specific variables or attributes are unavailable. 145

State Data System: Crash Data Report 2000–2009
Table 10 : People Killed or Injured in Motor Vehicle Crashes by Age Group State Injury Severity Age Group 2000 2001 2002 2003 2004 2005 2006 2007 2008 2009
Arkansas Killed < 5 Yrs.
5 Yrs. ‐ 9 Yrs.
10 Yrs. ‐ 15 Yrs.
16 Yrs. ‐ 20 Yrs.
21 Yrs. ‐ 24 Yrs.
25 Yrs. ‐ 34 Yrs.
35 Yrs. ‐ 44 Yrs.
45 Yrs. ‐ 54 Yrs.
55 Yrs. ‐ 64 Yrs.
65 Yrs. ‐ 74 Yrs.
> 74 Yrs.
Unknown
Total
12 19 12 15 12 8 15 7 6 7
8 12 3 11 17 6 11 7 7 9
30 22 23 20 22 16 14 16 16 14
78 99 91 77 101 86 97 92 84 55
49 59 76 77 64 76 75 68 60 42
110 93 118 92 131 107 119 97 100 102
111 97 98 102 114 85 102 84 82 98
99 81 81 97 101 84 83 99 88 108
59 43 51 70 61 77 77 84 75 73
42 36 47 31 38 54 35 42 46 48
54 50 41 49 59 53 36 48 36 35
0 0 0 0 1 2 1 6 0 1
652 611 641 641 721 654 665 650 600 592
Injured < 5 Yrs. 1,306 1,783 2,061 2,154 2,667 2,677 2,763 1,770 1,093 780
5 Yrs. ‐ 9 Yrs. 1,313 1,818 2,041 2,188 2,683 2,526 2,809 1,690 1,085 861
10 Yrs. ‐ 15 Yrs. 2,243 2,842 3,124 3,559 3,884 3,696 3,839 2,572 1,750 1,280
16 Yrs. ‐ 20 Yrs. 7,016 8,461 9,929 10,250 11,531 11,276 12,223 8,323 5,858 4,635
21 Yrs. ‐ 24 Yrs. 4,079 4,869 5,577 5,809 6,703 6,677 7,139 5,203 3,777 3,077
25 Yrs. ‐ 34 Yrs. 6,689 8,103 8,748 9,248 10,774 10,866 11,935 8,832 6,637 5,697
35 Yrs. ‐ 44 Yrs. 5,737 6,791 7,373 7,713 8,976 9,114 9,641 6,996 5,193 4,338
45 Yrs. ‐ 54 Yrs. 4,158 5,038 5,537 5,947 7,016 7,295 7,896 6,114 4,682 4,029
55 Yrs. ‐ 64 Yrs. 2,374 3,006 3,402 3,783 4,410 4,610 5,287 3,996 3,074 2,733
65 Yrs. ‐ 74 Yrs. 1,641 1,960 2,137 2,313 2,617 2,715 2,823 2,135 1,537 1,530
> 74 Yrs. 1,238 1,568 1,713 1,866 1,992 2,144 2,090 1,490 1,079 998
Unknown 348 763 828 1,114 1,078 1,151 1,125 784 985 916
Total 38,142 47,002 52,470 55,944 64,331 64,747 69,570 49,905 36,750 30,874
. Data is unavailable # Data is available, but specific variables or attributes are unavailable. 146

State Data System: Crash Data Report 2000–2009
Table 10 : People Killed or Injured in Motor Vehicle Crashes by Age Group State Injury Severity Age Group 2000 2001 2002 2003 2004 2005 2006 2007 2008 2009
California Killed < 5 Yrs.
5 Yrs. ‐ 9 Yrs.
10 Yrs. ‐ 15 Yrs.
16 Yrs. ‐ 20 Yrs.
21 Yrs. ‐ 24 Yrs.
25 Yrs. ‐ 34 Yrs.
35 Yrs. ‐ 44 Yrs.
45 Yrs. ‐ 54 Yrs.
55 Yrs. ‐ 64 Yrs.
65 Yrs. ‐ 74 Yrs.
> 74 Yrs.
Unknown
Total
112 100 70 72 64 65 64 67 45 50
89 74 68 74 60 73 55 56 43 49
104 114 106 135 139 124 97 104 73 54
462 519 590 565 531 554 544 448 388 344
342 408 404 433 407 475 478 493 396 331
590 653 646 645 701 704 695 681 607 521
598 624 649 650 624 674 609 542 451 385
503 514 556 566 584 592 596 588 509 495
268 310 346 364 345 407 422 356 367 341
273 250 235 265 230 235 234 251 207 198
389 360 338 373 335 319 310 298 272 263
0 0 65 67 66 70 76 74 35 34
3,730 3,926 4,089 4,225 4,094 4,304 4,197 3,967 3,401 3,076
Injured < 5 Yrs. 8,091 7,682 5,117 4,747 4,609 4,198 3,993 3,669 3,346 3,376
5 Yrs. ‐ 9 Yrs. 10,889 10,216 9,666 9,150 8,865 7,769 7,322 6,518 5,909 5,634
10 Yrs. ‐ 15 Yrs. 17,346 17,238 17,334 16,829 16,474 15,165 13,776 12,956 11,289 10,843
16 Yrs. ‐ 20 Yrs. 45,409 46,129 46,564 45,059 43,725 42,147 39,518 37,883 32,964 31,092
21 Yrs. ‐ 24 Yrs. 31,164 31,928 32,733 33,219 33,142 33,199 31,140 29,919 26,530 25,100
25 Yrs. ‐ 34 Yrs. 59,648 59,223 58,515 57,527 55,904 54,202 51,208 49,323 45,253 43,811
35 Yrs. ‐ 44 Yrs. 52,759 52,849 52,193 51,417 50,119 47,551 44,405 41,648 37,665 35,272
45 Yrs. ‐ 54 Yrs. 37,727 39,617 40,222 40,778 41,283 40,802 39,270 38,587 35,599 34,351
55 Yrs. ‐ 64 Yrs. 19,508 20,283 21,509 22,325 22,800 23,048 23,107 23,040 22,218 22,300
65 Yrs. ‐ 74 Yrs. 11,651 11,690 11,605 11,540 11,216 11,037 10,891 10,609 10,137 10,338
> 74 Yrs. 8,831 9,052 9,374 8,941 8,804 8,257 7,952 8,047 7,274 7,060
Unknown 0 0 5,857 5,634 5,416 5,423 4,992 4,488 3,689 3,600
Total 303,023 305,907 310,689 307,166 302,357 292,798 277,574 266,687 241,873 232,777
. Data is unavailable # Data is available, but specific variables or attributes are unavailable. 147

State Data System: Crash Data Report 2000–2009
Table 10 : People Killed or Injured in Motor Vehicle Crashes by Age Group State Injury Severity Age Group 2000 2001 2002 2003 2004 2005 2006 2007 2008 2009
Colorado Killed < 5 Yrs.
5 Yrs. ‐ 9 Yrs.
10 Yrs. ‐ 15 Yrs.
16 Yrs. ‐ 20 Yrs.
21 Yrs. ‐ 24 Yrs.
25 Yrs. ‐ 34 Yrs.
35 Yrs. ‐ 44 Yrs.
45 Yrs. ‐ 54 Yrs.
55 Yrs. ‐ 64 Yrs.
65 Yrs. ‐ 74 Yrs.
> 74 Yrs.
Unknown
Total
12 14 12 9 11 .
10 13 16 8 13 .
22 29 22 31 15 .
71 103 113 89 102 .
64 60 86 57 61 .
99 123 125 96 121 .
115 144 112 94 90 .
92 99 92 83 100 .
48 42 59 67 68 .
45 40 34 30 27 .
45 41 47 41 48 .
81 56 32 4 17 .
704 764 750 609 673 .
.
.
.
.
.
.
.
.
.
.
.
.
.
.
.
.
.
.
.
.
.
.
.
.
.
.
.
.
.
.
.
.
.
.
.
.
.
.
.
.
.
.
.
.
.
.
.
.
.
.
.
.
Injured < 5 Yrs.
5 Yrs. ‐ 9 Yrs.
10 Yrs. ‐ 15 Yrs.
16 Yrs. ‐ 20 Yrs.
21 Yrs. ‐ 24 Yrs.
25 Yrs. ‐ 34 Yrs.
35 Yrs. ‐ 44 Yrs.
45 Yrs. ‐ 54 Yrs.
55 Yrs. ‐ 64 Yrs.
65 Yrs. ‐ 74 Yrs.
> 74 Yrs.
Unknown
Total
955 965 930 806 782 .
1,406 1,347 1,364 1,130 1,135 .
2,752 2,667 2,583 2,253 2,380 .
8,010 7,733 8,386 7,208 7,200 .
4,330 4,520 5,206 4,556 4,779 .
7,892 7,715 8,634 7,515 7,555 .
6,805 6,305 6,960 6,364 6,610 .
4,973 4,903 5,806 5,379 5,809 .
2,314 2,365 2,874 2,853 3,063 .
1,451 1,353 1,508 1,334 1,473 .
1,078 966 1,140 1,052 1,128 .
9,897 10,257 5,148 3,921 4,368 .
51,863 51,096 50,539 44,371 46,282 .
.
.
.
.
.
.
.
.
.
.
.
.
.
.
.
.
.
.
.
.
.
.
.
.
.
.
.
.
.
.
.
.
.
.
.
.
.
.
.
.
.
.
.
.
.
.
.
.
.
.
.
.
. Data is unavailable # Data is available, but specific variables or attributes are unavailable. 148

State Data System: Crash Data Report 2000–2009
Table 10 : People Killed or Injured in Motor Vehicle Crashes by Age Group State Injury Severity Age Group 2000 2001 2002 2003 2004 2005 2006 2007 2008 2009
Connecticut Killed < 5 Yrs.
5 Yrs. ‐ 9 Yrs.
10 Yrs. ‐ 15 Yrs.
16 Yrs. ‐ 20 Yrs.
21 Yrs. ‐ 24 Yrs.
25 Yrs. ‐ 34 Yrs.
35 Yrs. ‐ 44 Yrs.
45 Yrs. ‐ 54 Yrs.
55 Yrs. ‐ 64 Yrs.
65 Yrs. ‐ 74 Yrs.
> 74 Yrs.
Unknown
Total
3 6 2 1 2 1 2 2 1 2
3 1 1 4 5 0 1 2 0 1
6 4 5 3 7 4 3 6 8 2
36 59 57 49 40 38 52 47 30 30
34 39 32 54 41 35 42 34 38 27
57 65 49 51 51 36 49 40 51 47
67 48 52 39 47 46 48 41 33 32
37 32 43 36 40 36 36 49 55 31
31 22 19 20 25 32 31 24 28 28
17 14 15 15 13 13 13 17 19 9
52 28 47 26 21 32 32 33 38 17
0 0 3 0 2 5 2 1 2 1
343 318 325 298 294 278 311 296 303 227
Injured < 5 Yrs. 879 858 870 716 813 662 631 647 608 701
5 Yrs. ‐ 9 Yrs. 1,292 1,325 1,137 1,071 948 902 882 795 725 787
10 Yrs. ‐ 15 Yrs. 2,131 2,086 1,996 1,924 1,710 1,563 1,429 1,463 1,277 1,216
16 Yrs. ‐ 20 Yrs. 7,985 7,647 7,333 6,597 6,566 6,024 5,785 5,777 5,063 4,718
21 Yrs. ‐ 24 Yrs. 5,158 5,419 4,872 4,758 4,734 4,551 4,159 4,460 4,031 4,103
25 Yrs. ‐ 34 Yrs. 10,379 9,743 8,950 8,280 8,173 7,589 6,943 7,279 6,582 6,794
35 Yrs. ‐ 44 Yrs. 9,101 8,956 8,355 8,056 7,653 7,371 6,705 6,595 6,044 5,685
45 Yrs. ‐ 54 Yrs. 6,131 6,296 5,921 5,904 6,084 5,739 5,563 5,834 5,554 5,584
55 Yrs. ‐ 64 Yrs. 3,368 3,361 3,219 3,388 3,388 3,369 3,167 3,412 3,213 3,405
65 Yrs. ‐ 74 Yrs. 1,925 1,968 1,769 1,685 1,655 1,559 1,475 1,590 1,443 1,626
> 74 Yrs. 1,691 1,678 1,691 1,682 1,624 1,485 1,413 1,427 1,282 1,257
Unknown 1,220 1,112 932 985 919 843 802 818 583 601
Total 51,260 50,449 47,045 45,046 44,267 41,657 38,954 40,097 36,405 36,477
. Data is unavailable # Data is available, but specific variables or attributes are unavailable. 149

State Data System: Crash Data Report 2000–2009
Table 10 : People Killed or Injured in Motor Vehicle Crashes by Age Group State Injury Severity Age Group 2000 2001 2002 2003 2004 2005 2006 2007 2008 2009
Delaware Killed < 5 Yrs.
5 Yrs. ‐ 9 Yrs.
10 Yrs. ‐ 15 Yrs.
16 Yrs. ‐ 20 Yrs.
21 Yrs. ‐ 24 Yrs.
25 Yrs. ‐ 34 Yrs.
35 Yrs. ‐ 44 Yrs.
45 Yrs. ‐ 54 Yrs.
55 Yrs. ‐ 64 Yrs.
65 Yrs. ‐ 74 Yrs.
> 74 Yrs.
Unknown
Total
4 2 3 0 2 .
1 1 2 0 1 .
10 3 4 2 4 .
24 21 17 27 26 .
11 9 13 20 10 .
18 35 20 20 23 .
25 18 22 22 25 .
10 19 13 24 15 .
5 8 10 8 8 .
7 10 9 11 9 .
15 13 12 12 16 .
0 0 0 0 1 .
130 139 125 146 140 .
.
.
.
.
.
.
.
.
.
.
.
.
.
1
2
3
14
16
22
19
16
11
7
4
0
115
3
3
1
8
11
25
22
16
12
9
12
2
124
#
#
#
#
#
#
#
#
#
#
#
#
#
Injured < 5 Yrs.
5 Yrs. ‐ 9 Yrs.
10 Yrs. ‐ 15 Yrs.
16 Yrs. ‐ 20 Yrs.
21 Yrs. ‐ 24 Yrs.
25 Yrs. ‐ 34 Yrs.
35 Yrs. ‐ 44 Yrs.
45 Yrs. ‐ 54 Yrs.
55 Yrs. ‐ 64 Yrs.
65 Yrs. ‐ 74 Yrs.
> 74 Yrs.
Unknown
Total
324 332 306 233 253 .
397 345 309 256 240 .
635 619 567 484 464 .
1,932 1,804 1,800 1,552 1,371 .
1,057 1,029 1,128 1,029 859 .
1,846 1,780 1,741 1,572 1,332 .
1,703 1,558 1,614 1,435 1,159 .
1,064 1,106 1,114 1,049 846 .
610 610 611 600 527 .
419 394 400 324 268 .
337 309 291 244 187 .
96 79 84 121 93 .
10,420 9,965 9,965 8,899 7,599 .
.
.
.
.
.
.
.
.
.
.
.
.
.
130
202
325
1,190
822
1,333
1,204
1,047
637
342
246
69
7,547
135
163
304
1,051
795
1,310
1,131
1,013
665
345
221
50
7,183
#
#
#
#
#
#
#
#
#
#
#
#
#
. Data is unavailable # Data is available, but specific variables or attributes are unavailable. 150

State Data System: Crash Data Report 2000–2009
Table 10 : People Killed or Injured in Motor Vehicle Crashes by Age Group State Injury Severity Age Group 2000 2001 2002 2003 2004 2005 2006 2007 2008 2009
Florida Killed < 5 Yrs.
5 Yrs. ‐ 9 Yrs.
10 Yrs. ‐ 15 Yrs.
16 Yrs. ‐ 20 Yrs.
21 Yrs. ‐ 24 Yrs.
25 Yrs. ‐ 34 Yrs.
35 Yrs. ‐ 44 Yrs.
45 Yrs. ‐ 54 Yrs.
55 Yrs. ‐ 64 Yrs.
65 Yrs. ‐ 74 Yrs.
> 74 Yrs.
Unknown
Total
29 22 41 35 41 44 30 37 32 25
38 40 32 30 41 45 28 36 21 21
89 74 71 85 91 64 68 66 34 44
344 350 347 363 360 444 375 377 327 246
250 274 281 282 325 366 412 354 307 269
468 468 474 496 445 552 549 525 493 404
510 499 565 513 490 546 501 482 448 366
414 408 402 436 507 527 483 512 493 428
247 256 272 298 302 316 339 303 324 285
207 208 212 226 239 219 217 186 184 207
358 355 342 332 338 331 285 279 251 236
45 59 105 83 78 79 78 69 53 31
2,999 3,013 3,144 3,179 3,257 3,533 3,365 3,226 2,967 2,562
Injured < 5 Yrs. 3,897 4,009 4,030 4,165 4,111 4,242 3,889 3,986 3,961 3,811
5 Yrs. ‐ 9 Yrs. 6,280 6,264 4,768 4,924 5,078 5,545 4,910 5,130 4,634 4,509
10 Yrs. ‐ 15 Yrs. 10,959 11,100 9,529 9,603 9,817 9,603 8,820 8,502 7,489 7,466
16 Yrs. ‐ 20 Yrs. 33,889 34,157 31,080 30,777 31,488 32,636 30,662 29,902 26,304 25,159
21 Yrs. ‐ 24 Yrs. 21,667 22,861 21,768 21,520 22,609 24,011 22,462 22,479 20,862 20,520
25 Yrs. ‐ 34 Yrs. 43,573 43,241 40,374 38,660 39,497 40,907 37,625 37,491 35,089 35,663
35 Yrs. ‐ 44 Yrs. 40,533 40,183 38,011 36,145 36,952 37,624 33,689 32,938 30,410 29,191
45 Yrs. ‐ 54 Yrs. 27,979 28,914 28,355 27,970 29,776 30,800 28,631 29,207 28,130 28,594
55 Yrs. ‐ 64 Yrs. 16,620 17,211 17,064 17,463 18,139 19,367 18,174 18,658 18,266 18,685
65 Yrs. ‐ 74 Yrs. 11,933 11,671 10,905 10,670 10,694 10,856 10,257 9,960 9,925 10,437
> 74 Yrs. 10,159 9,993 9,242 9,141 8,987 9,057 8,311 8,155 8,088 8,135
Unknown 4,099 4,996 14,485 10,601 10,044 9,282 7,484 7,316 6,315 5,041
Total 231,588 234,600 229,611 221,639 227,192 233,930 214,914 213,724 199,473 197,211
. Data is unavailable # Data is available, but specific variables or attributes are unavailable. 151

State Data System: Crash Data Report 2000–2009
Table 10 : People Killed or Injured in Motor Vehicle Crashes by Age Group State Injury Severity Age Group 2000 2001 2002 2003 2004 2005 2006 2007 2008 2009
Georgia Killed < 5 Yrs.
5 Yrs. ‐ 9 Yrs.
10 Yrs. ‐ 15 Yrs.
16 Yrs. ‐ 20 Yrs.
21 Yrs. ‐ 24 Yrs.
25 Yrs. ‐ 34 Yrs.
35 Yrs. ‐ 44 Yrs.
45 Yrs. ‐ 54 Yrs.
55 Yrs. ‐ 64 Yrs.
65 Yrs. ‐ 74 Yrs.
> 74 Yrs.
Unknown
Total
34 27 27 19 33 37 37 22 28 35
26 27 29 22 22 22 22 16 21 19
42 62 39 63 46 45 28 37 29 29
215 228 200 214 188 233 220 225 152 102
143 174 152 148 168 154 187 167 160 134
282 261 254 260 273 287 296 309 249 256
245 279 256 276 260 257 236 250 238 236
182 215 212 225 229 243 244 229 213 213
109 124 117 138 152 196 169 168 181 194
121 111 96 94 114 113 121 104 98 119
122 127 124 122 137 140 113 101 100 92
26 21 25 29 19 17 30 20 39 32
1,547 1,656 1,531 1,610 1,641 1,744 1,703 1,648 1,508 1,461
Injured < 5 Yrs. 3,180 3,102 3,180 3,244 3,298 3,465 3,380 3,057 2,812 3,436
5 Yrs. ‐ 9 Yrs. 4,152 4,034 4,094 4,004 4,099 4,121 3,839 3,491 2,981 3,204
10 Yrs. ‐ 15 Yrs. 6,618 6,546 6,416 6,443 6,600 6,287 6,039 5,202 4,644 4,965
16 Yrs. ‐ 20 Yrs. 20,793 20,540 20,728 20,228 20,533 20,798 19,966 18,514 16,180 16,054
21 Yrs. ‐ 24 Yrs. 13,766 13,820 14,266 14,609 15,010 14,940 14,371 13,333 11,913 13,224
25 Yrs. ‐ 34 Yrs. 27,123 27,238 26,561 26,851 27,791 27,743 25,939 24,745 22,515 24,013
35 Yrs. ‐ 44 Yrs. 22,265 22,776 22,520 22,513 23,133 23,358 22,263 21,142 19,294 19,887
45 Yrs. ‐ 54 Yrs. 14,961 15,629 16,148 16,276 17,243 17,668 17,190 16,891 15,896 17,372
55 Yrs. ‐ 64 Yrs. 7,862 8,313 8,669 9,141 9,929 10,443 10,409 10,489 9,746 10,938
65 Yrs. ‐ 74 Yrs. 4,516 4,843 4,592 4,630 4,894 4,862 4,693 4,696 4,427 5,144
> 74 Yrs. 3,061 3,068 3,026 3,098 3,053 3,142 2,942 2,795 2,655 2,897
Unknown 2,274 2,354 2,359 2,178 2,409 2,225 2,524 3,132 2,728 2,645
Total 130,571 132,263 132,559 133,215 137,992 139,052 133,555 127,487 115,791 123,779
. Data is unavailable # Data is available, but specific variables or attributes are unavailable. 152

State Data System: Crash Data Report 2000–2009
Table 10 : People Killed or Injured in Motor Vehicle Crashes by Age Group State Injury Severity Age Group 2000 2001 2002 2003 2004 2005 2006 2007 2008 2009
Illinois Killed < 5 Yrs.
5 Yrs. ‐ 9 Yrs.
10 Yrs. ‐ 15 Yrs.
16 Yrs. ‐ 20 Yrs.
21 Yrs. ‐ 24 Yrs.
25 Yrs. ‐ 34 Yrs.
35 Yrs. ‐ 44 Yrs.
45 Yrs. ‐ 54 Yrs.
55 Yrs. ‐ 64 Yrs.
65 Yrs. ‐ 74 Yrs.
> 74 Yrs.
Unknown
Total
23 22 13 19 18 17 20 18 12 12
19 17 19 20 15 15 16 12 14 12
43 41 50 44 41 36 36 36 24 12
179 212 206 223 165 176 177 192 122 98
158 157 168 159 161 176 132 145 121 94
251 218 249 233 231 214 201 197 187 161
220 228 193 218 213 197 193 178 149 137
177 166 167 164 183 175 189 169 165 141
114 115 100 118 126 119 120 123 91 91
85 88 116 98 68 102 65 69 63 51
141 149 139 158 130 131 105 108 95 102
6 1 0 0 3 5 0 1 0 0
1,416 1,414 1,420 1,454 1,354 1,363 1,254 1,248 1,043 911
Injured < 5 Yrs. 2,824 2,391 2,498 2,633 2,396 1,930 2,236 2,109 1,791 1,855
5 Yrs. ‐ 9 Yrs. 4,110 3,673 3,912 3,742 3,363 2,635 3,015 2,803 2,437 2,364
10 Yrs. ‐ 15 Yrs. 6,989 6,411 6,692 6,600 6,117 5,085 5,286 5,113 4,217 4,110
16 Yrs. ‐ 20 Yrs. 22,494 20,285 21,284 21,411 18,817 16,876 16,569 15,399 13,298 12,679
21 Yrs. ‐ 24 Yrs. 13,647 12,868 13,500 13,964 12,949 11,430 11,042 10,491 9,443 8,812
25 Yrs. ‐ 34 Yrs. 26,025 23,503 23,745 24,738 22,427 20,011 19,443 18,806 17,491 16,606
35 Yrs. ‐ 44 Yrs. 22,729 20,782 20,707 21,110 19,122 17,316 16,465 15,968 14,603 13,436
45 Yrs. ‐ 54 Yrs. 15,967 15,352 15,884 16,601 15,808 14,851 14,713 14,439 13,656 12,907
55 Yrs. ‐ 64 Yrs. 8,477 8,304 8,693 9,633 8,935 8,719 8,640 8,847 8,581 8,297
65 Yrs. ‐ 74 Yrs. 4,970 4,784 4,901 5,041 4,697 4,185 4,278 4,299 4,037 3,970
> 74 Yrs. 3,898 3,745 3,835 3,910 3,659 3,533 3,407 3,262 3,076 3,038
Unknown 2,635 2,036 1,967 1,752 3,140 5,262 1,802 1,630 1,466 1,118
Total 134,765 124,134 127,618 131,135 121,430 111,833 106,896 103,166 94,096 89,192
. Data is unavailable # Data is available, but specific variables or attributes are unavailable. 153

State Data System: Crash Data Report 2000–2009
Table 10 : People Killed or Injured in Motor Vehicle Crashes by Age Group State Injury Severity Age Group 2000 2001 2002 2003 2004 2005 2006 2007 2008 2009
Indiana Killed < 5 Yrs.
5 Yrs. ‐ 9 Yrs.
10 Yrs. ‐ 15 Yrs.
16 Yrs. ‐ 20 Yrs.
21 Yrs. ‐ 24 Yrs.
25 Yrs. ‐ 34 Yrs.
35 Yrs. ‐ 44 Yrs.
45 Yrs. ‐ 54 Yrs.
55 Yrs. ‐ 64 Yrs.
65 Yrs. ‐ 74 Yrs.
> 74 Yrs.
Unknown
Total
14 . . # 19 15
17 . . # 10 9
30 . . # 29 23
142 . . # 148 125
91 . . # 101 112
132 . . # 155 154
140 . . # 125 140
111 . . # 125 134
66 . . # 86 96
60 . . # 61 60
73 . . # 81 68
12 . . # 7 2
888 . . # 947 938
16
18
16
131
90
141
154
124
100
49
64
2
905
7
16
27
119
68
148
134
142
96
63
81
0
901
10
15
23
122
86
140
101
132
91
41
56
1
818
7
9
19
78
68
121
106
106
61
55
64
0
694
Injured < 5 Yrs.
5 Yrs. ‐ 9 Yrs.
10 Yrs. ‐ 15 Yrs.
16 Yrs. ‐ 20 Yrs.
21 Yrs. ‐ 24 Yrs.
25 Yrs. ‐ 34 Yrs.
35 Yrs. ‐ 44 Yrs.
45 Yrs. ‐ 54 Yrs.
55 Yrs. ‐ 64 Yrs.
65 Yrs. ‐ 74 Yrs.
> 74 Yrs.
Unknown
Total
1,399 . . # 1,140 1,149
2,272 . . # 1,618 1,469
3,864 . . # 2,917 2,882
13,874 . . # 11,506 10,757
7,013 . . # 6,524 6,203
11,942 . . # 10,696 10,326
10,552 . . # 9,304 8,923
7,453 . . # 7,960 7,832
4,180 . . # 4,684 4,749
2,750 . . # 2,386 2,504
2,196 . . # 2,307 2,033
6,764 . . # 720 547
74,259 . . # 61,762 59,374
1,063
1,455
2,685
10,414
5,619
9,484
8,257
7,413
4,814
2,350
2,048
256
55,858
1,114
1,483
2,407
9,549
5,357
9,233
7,649
7,023
4,427
2,322
1,843
84
52,491
870
1,253
2,197
8,347
4,770
8,558
7,402
6,940
4,573
2,186
1,708
59
48,863
979
1,133
2,099
8,087
4,618
8,011
6,521
6,563
4,468
2,173
1,737
266
46,655
. Data is unavailable # Data is available, but specific variables or attributes are unavailable. 154

State Data System: Crash Data Report 2000–2009
Table 10 : People Killed or Injured in Motor Vehicle Crashes by Age Group State Injury Severity Age Group 2000 2001 2002 2003 2004 2005 2006 2007 2008 2009
Iowa Killed < 5 Yrs.
5 Yrs. ‐ 9 Yrs.
10 Yrs. ‐ 15 Yrs.
16 Yrs. ‐ 20 Yrs.
21 Yrs. ‐ 24 Yrs.
25 Yrs. ‐ 34 Yrs.
35 Yrs. ‐ 44 Yrs.
45 Yrs. ‐ 54 Yrs.
55 Yrs. ‐ 64 Yrs.
65 Yrs. ‐ 74 Yrs.
> 74 Yrs.
Unknown
Total
. 5 5 3 6 5
. 8 10 4 7 5
. 11 14 19 22 17
. 48 44 61 48 70
. 49 39 47 41 42
. 43 58 66 45 46
. 89 53 55 43 66
. 39 48 57 68 62
. 25 51 32 33 42
. 25 17 25 22 35
. 50 54 61 50 54
. 31 13 11 3 7
. 423 406 441 388 451
7
3
6
61
39
45
63
63
47
33
69
3
439
5
6
28
54
43
57
53
75
42
22
58
2
445
2
5
9
45
35
62
54
69
53
32
43
2
411
6
2
11
38
27
60
57
61
41
36
27
5
371
Injured < 5 Yrs.
5 Yrs. ‐ 9 Yrs.
10 Yrs. ‐ 15 Yrs.
16 Yrs. ‐ 20 Yrs.
21 Yrs. ‐ 24 Yrs.
25 Yrs. ‐ 34 Yrs.
35 Yrs. ‐ 44 Yrs.
45 Yrs. ‐ 54 Yrs.
55 Yrs. ‐ 64 Yrs.
65 Yrs. ‐ 74 Yrs.
> 74 Yrs.
Unknown
Total
. 331 362 380 401 340
. 445 532 528 554 505
. 1,244 1,420 1,318 1,409 1,247
. 5,215 5,046 4,675 4,492 4,236
. 2,535 2,337 2,399 2,344 2,269
. 4,040 3,715 3,512 3,527 3,493
. 3,888 3,517 3,267 3,146 3,119
. 2,982 2,744 2,772 2,792 2,759
. 1,569 1,559 1,649 1,686 1,789
. 1,023 973 989 1,028 966
. 957 1,019 1,027 1,074 937
. 4,093 1,444 718 567 808
. 28,322 24,668 23,234 23,020 22,468
326
470
1,157
4,075
2,111
3,045
2,886
2,619
1,664
868
925
682
20,828
356
508
1,114
4,060
2,171
3,406
2,832
2,781
1,818
955
888
523
21,412
334
449
998
3,657
2,086
3,404
2,831
3,000
1,928
1,002
869
459
21,017
295
374
936
3,418
1,880
3,067
2,432
2,577
1,874
898
837
364
18,952
. Data is unavailable # Data is available, but specific variables or attributes are unavailable. 155

State Data System: Crash Data Report 2000–2009
Table 10 : People Killed or Injured in Motor Vehicle Crashes by Age Group State Injury Severity Age Group 2000 2001 2002 2003 2004 2005 2006 2007 2008 2009
Kansas Killed < 5 Yrs.
5 Yrs. ‐ 9 Yrs.
10 Yrs. ‐ 15 Yrs.
16 Yrs. ‐ 20 Yrs.
21 Yrs. ‐ 24 Yrs.
25 Yrs. ‐ 34 Yrs.
35 Yrs. ‐ 44 Yrs.
45 Yrs. ‐ 54 Yrs.
55 Yrs. ‐ 64 Yrs.
65 Yrs. ‐ 74 Yrs.
> 74 Yrs.
Unknown
Total
5 7 7 7 11 5 3 6 4 4
8 6 6 6 5 14 3 4 2 2
31 22 21 23 22 18 16 16 15 7
77 92 97 80 66 57 59 54 48 55
41 51 49 51 37 41 53 40 50 35
56 63 63 70 60 57 75 59 49 73
76 61 75 61 61 60 58 58 59 39
48 65 65 60 61 66 61 65 53 57
36 40 42 45 49 42 49 51 43 40
30 37 33 25 39 30 35 28 29 32
53 50 52 43 48 38 55 34 31 40
0 0 1 0 0 1 1 1 2 3
461 494 511 471 459 429 468 416 385 387
Injured < 5 Yrs. 652 623 626 565 502 472 422 446 388 398
5 Yrs. ‐ 9 Yrs. 959 913 814 722 667 621 622 596 611 548
10 Yrs. ‐ 15 Yrs. 2,051 2,034 1,755 1,720 1,568 1,458 1,310 1,259 1,168 1,031
16 Yrs. ‐ 20 Yrs. 6,328 6,233 5,791 5,201 4,936 4,557 4,599 4,316 3,976 3,615
21 Yrs. ‐ 24 Yrs. 3,050 3,026 2,879 2,727 2,640 2,515 2,480 2,573 2,285 2,176
25 Yrs. ‐ 34 Yrs. 4,710 4,714 4,316 3,972 3,762 3,603 3,647 3,838 3,635 3,426
35 Yrs. ‐ 44 Yrs. 4,183 4,090 3,873 3,450 3,162 3,087 2,999 3,123 2,743 2,569
45 Yrs. ‐ 54 Yrs. 3,093 3,139 3,019 2,869 2,886 2,772 2,801 3,014 2,788 2,476
55 Yrs. ‐ 64 Yrs. 1,612 1,570 1,694 1,560 1,671 1,708 1,622 1,862 1,681 1,738
65 Yrs. ‐ 74 Yrs. 1,080 1,130 1,066 911 890 875 849 910 860 760
> 74 Yrs. 1,020 998 941 838 881 842 761 761 705 681
Unknown 334 358 285 258 212 212 208 205 218 255
Total 29,072 28,828 27,059 24,793 23,777 22,722 22,320 22,903 21,058 19,673
. Data is unavailable # Data is available, but specific variables or attributes are unavailable. 156
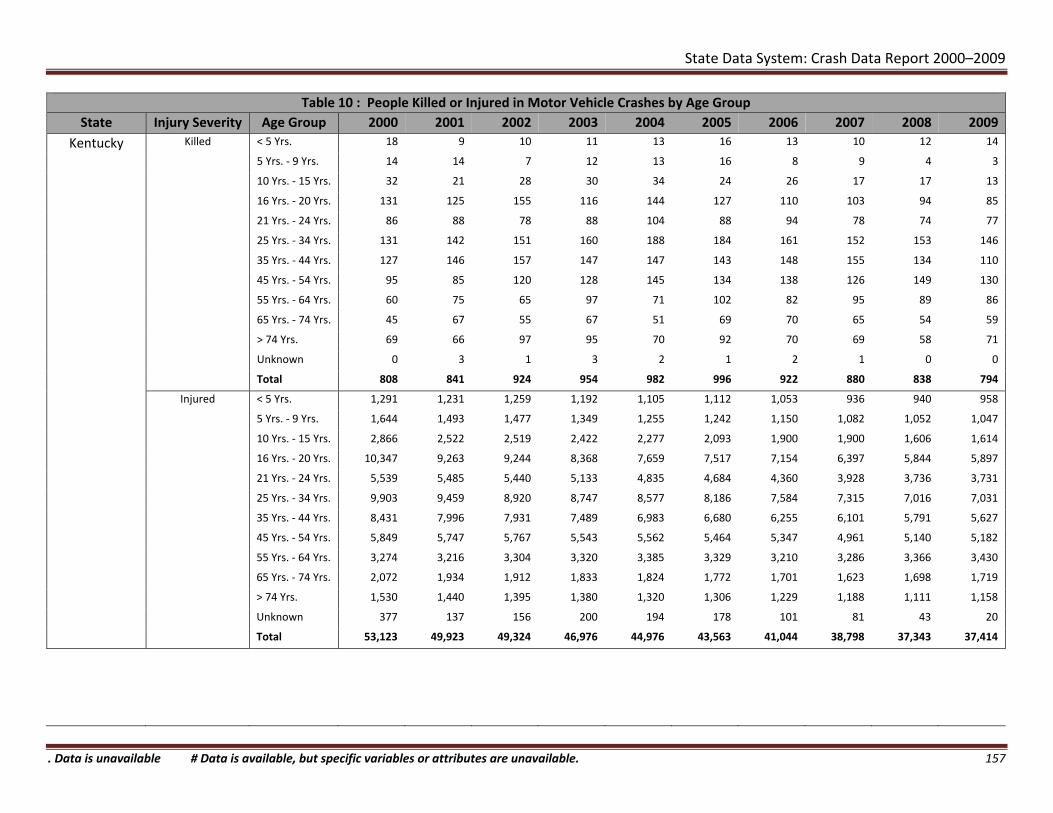
State Data System: Crash Data Report 2000–2009
Table 10 : People Killed or Injured in Motor Vehicle Crashes by Age Group State Injury Severity Age Group 2000 2001 2002 2003 2004 2005 2006 2007 2008 2009
Kentucky Killed < 5 Yrs.
5 Yrs. ‐ 9 Yrs.
10 Yrs. ‐ 15 Yrs.
16 Yrs. ‐ 20 Yrs.
21 Yrs. ‐ 24 Yrs.
25 Yrs. ‐ 34 Yrs.
35 Yrs. ‐ 44 Yrs.
45 Yrs. ‐ 54 Yrs.
55 Yrs. ‐ 64 Yrs.
65 Yrs. ‐ 74 Yrs.
> 74 Yrs.
Unknown
Total
18 9 10 11 13 16 13 10 12 14
14 14 7 12 13 16 8 9 4 3
32 21 28 30 34 24 26 17 17 13
131 125 155 116 144 127 110 103 94 85
86 88 78 88 104 88 94 78 74 77
131 142 151 160 188 184 161 152 153 146
127 146 157 147 147 143 148 155 134 110
95 85 120 128 145 134 138 126 149 130
60 75 65 97 71 102 82 95 89 86
45 67 55 67 51 69 70 65 54 59
69 66 97 95 70 92 70 69 58 71
0 3 1 3 2 1 2 1 0 0
808 841 924 954 982 996 922 880 838 794
Injured < 5 Yrs. 1,291 1,231 1,259 1,192 1,105 1,112 1,053 936 940 958
5 Yrs. ‐ 9 Yrs. 1,644 1,493 1,477 1,349 1,255 1,242 1,150 1,082 1,052 1,047
10 Yrs. ‐ 15 Yrs. 2,866 2,522 2,519 2,422 2,277 2,093 1,900 1,900 1,606 1,614
16 Yrs. ‐ 20 Yrs. 10,347 9,263 9,244 8,368 7,659 7,517 7,154 6,397 5,844 5,897
21 Yrs. ‐ 24 Yrs. 5,539 5,485 5,440 5,133 4,835 4,684 4,360 3,928 3,736 3,731
25 Yrs. ‐ 34 Yrs. 9,903 9,459 8,920 8,747 8,577 8,186 7,584 7,315 7,016 7,031
35 Yrs. ‐ 44 Yrs. 8,431 7,996 7,931 7,489 6,983 6,680 6,255 6,101 5,791 5,627
45 Yrs. ‐ 54 Yrs. 5,849 5,747 5,767 5,543 5,562 5,464 5,347 4,961 5,140 5,182
55 Yrs. ‐ 64 Yrs. 3,274 3,216 3,304 3,320 3,385 3,329 3,210 3,286 3,366 3,430
65 Yrs. ‐ 74 Yrs. 2,072 1,934 1,912 1,833 1,824 1,772 1,701 1,623 1,698 1,719
> 74 Yrs. 1,530 1,440 1,395 1,380 1,320 1,306 1,229 1,188 1,111 1,158
Unknown 377 137 156 200 194 178 101 81 43 20
Total 53,123 49,923 49,324 46,976 44,976 43,563 41,044 38,798 37,343 37,414
. Data is unavailable # Data is available, but specific variables or attributes are unavailable. 157

State Data System: Crash Data Report 2000–2009
Table 10 : People Killed or Injured in Motor Vehicle Crashes by Age Group State Injury Severity Age Group 2000 2001 2002 2003 2004 2005 2006 2007 2008 2009
Louisiana Killed < 5 Yrs.
5 Yrs. ‐ 9 Yrs.
10 Yrs. ‐ 15 Yrs.
16 Yrs. ‐ 20 Yrs.
21 Yrs. ‐ 24 Yrs.
25 Yrs. ‐ 34 Yrs.
35 Yrs. ‐ 44 Yrs.
45 Yrs. ‐ 54 Yrs.
55 Yrs. ‐ 64 Yrs.
65 Yrs. ‐ 74 Yrs.
> 74 Yrs.
Unknown
Total
. . . . . 19
. . . . . 15
. . . . . 23
. . . . . 122
. . . . . 110
. . . . . 180
. . . . . 157
. . . . . 150
. . . . . 95
. . . . . 50
. . . . . 44
. . . . . 1
. . . . . 966
14
16
18
120
113
221
169
155
83
33
43
2
987
18
14
21
125
110
200
170
149
92
56
35
3
993
10
16
25
101
114
190
142
139
86
42
50
0
915
13
10
22
96
80
165
137
138
76
40
46
1
824
Injured < 5 Yrs.
5 Yrs. ‐ 9 Yrs.
10 Yrs. ‐ 15 Yrs.
16 Yrs. ‐ 20 Yrs.
21 Yrs. ‐ 24 Yrs.
25 Yrs. ‐ 34 Yrs.
35 Yrs. ‐ 44 Yrs.
45 Yrs. ‐ 54 Yrs.
55 Yrs. ‐ 64 Yrs.
65 Yrs. ‐ 74 Yrs.
> 74 Yrs.
Unknown
Total
. . . . . 3,117
. . . . . 2,790
. . . . . 4,539
. . . . . 13,644
. . . . . 9,501
. . . . . 15,077
. . . . . 12,559
. . . . . 10,502
. . . . . 5,945
. . . . . 3,038
. . . . . 2,017
. . . . . 131
. . . . . 82,860
3,062
2,592
3,786
12,630
9,522
15,170
11,884
10,561
6,007
2,847
1,923
132
80,116
3,105
2,612
3,764
12,420
9,309
15,078
11,439
10,276
6,048
2,876
1,880
144
78,951
3,194
2,486
3,400
11,077
8,825
14,704
10,975
10,147
6,117
2,916
1,861
200
75,902
3,146
2,457
3,269
9,451
8,763
15,000
10,307
9,858
6,492
3,068
1,858
165
73,834
. Data is unavailable # Data is available, but specific variables or attributes are unavailable. 158

State Data System: Crash Data Report 2000–2009
Table 10 : People Killed or Injured in Motor Vehicle Crashes by Age Group State Injury Severity Age Group 2000 2001 2002 2003 2004 2005 2006 2007 2008 2009
Maryland Killed < 5 Yrs.
5 Yrs. ‐ 9 Yrs.
10 Yrs. ‐ 15 Yrs.
16 Yrs. ‐ 20 Yrs.
21 Yrs. ‐ 24 Yrs.
25 Yrs. ‐ 34 Yrs.
35 Yrs. ‐ 44 Yrs.
45 Yrs. ‐ 54 Yrs.
55 Yrs. ‐ 64 Yrs.
65 Yrs. ‐ 74 Yrs.
> 74 Yrs.
Unknown
Total
6 5 9 6 8 4 7 3 9 1
5 9 13 12 12 8 5 4 6 5
18 23 12 19 27 18 9 19 13 11
91 96 81 92 92 71 82 82 70 66
57 83 67 57 74 71 78 79 60 51
106 97 117 117 101 102 105 109 111 87
108 96 105 93 84 104 114 102 89 62
75 75 76 93 81 78 90 94 97 107
51 64 63 53 56 48 66 57 45 59
38 47 50 44 48 47 37 30 31 45
59 66 59 58 54 55 55 34 53 50
3 1 9 7 6 7 3 2 8 6
617 662 661 651 643 613 651 615 592 550
Injured < 5 Yrs. 1,393 1,422 1,295 1,361 1,207 1,197 1,159 1,184 1,175 1,208
5 Yrs. ‐ 9 Yrs. 1,946 1,805 1,730 1,699 1,602 1,406 1,288 1,291 1,218 1,189
10 Yrs. ‐ 15 Yrs. 3,134 3,062 2,782 2,809 2,617 2,546 2,225 2,104 1,822 1,686
16 Yrs. ‐ 20 Yrs. 9,174 9,051 9,401 8,846 8,529 8,141 7,834 7,262 6,543 6,152
21 Yrs. ‐ 24 Yrs. 5,752 5,945 6,153 6,185 5,878 5,904 5,723 5,501 5,231 5,142
25 Yrs. ‐ 34 Yrs. 11,588 11,324 11,067 11,140 10,257 9,936 9,829 9,433 9,035 9,033
35 Yrs. ‐ 44 Yrs. 10,573 10,783 10,566 10,255 9,430 9,393 8,905 8,462 7,599 7,236
45 Yrs. ‐ 54 Yrs. 7,056 7,318 7,437 7,684 7,341 7,353 7,410 7,313 6,856 7,019
55 Yrs. ‐ 64 Yrs. 3,562 3,840 4,071 4,312 4,218 4,282 4,319 4,185 4,043 4,127
65 Yrs. ‐ 74 Yrs. 2,060 2,114 2,131 2,128 1,996 1,990 2,021 1,991 1,984 2,018
> 74 Yrs. 1,589 1,717 1,753 1,847 1,655 1,706 1,699 1,653 1,614 1,490
Unknown 1,205 1,510 1,475 1,271 1,928 1,177 1,152 1,097 1,001 1,031
Total 59,032 59,891 59,861 59,537 56,658 55,031 53,564 51,476 48,121 47,331
. Data is unavailable # Data is available, but specific variables or attributes are unavailable. 159

State Data System: Crash Data Report 2000–2009
Table 10 : People Killed or Injured in Motor Vehicle Crashes by Age Group State Injury Severity Age Group 2000 2001 2002 2003 2004 2005 2006 2007 2008 2009
Michigan Killed < 5 Yrs.
5 Yrs. ‐ 9 Yrs.
10 Yrs. ‐ 15 Yrs.
16 Yrs. ‐ 20 Yrs.
21 Yrs. ‐ 24 Yrs.
25 Yrs. ‐ 34 Yrs.
35 Yrs. ‐ 44 Yrs.
45 Yrs. ‐ 54 Yrs.
55 Yrs. ‐ 64 Yrs.
65 Yrs. ‐ 74 Yrs.
> 74 Yrs.
Unknown
Total
17 15 19 16 18 13 10 10 10 7
24 28 15 25 20 21 14 14 11 11
69 47 58 55 50 53 35 39 25 21
199 183 190 171 174 145 116 160 118 114
109 127 114 131 113 93 122 97 83 59
227 201 195 173 180 161 173 153 136 144
204 218 204 192 172 187 167 152 148 122
158 162 160 180 156 174 172 161 164 157
133 92 91 129 109 120 118 131 125 96
101 86 80 88 67 72 68 74 77 56
140 154 140 145 124 123 112 130 114 114
37 47 53 26 6 3 0 0 0 1
1,418 1,360 1,319 1,331 1,189 1,165 1,107 1,121 1,011 902
Injured < 5 Yrs. 1,951 1,662 1,680 1,413 1,363 1,172 1,051 981 883 1,049
5 Yrs. ‐ 9 Yrs. 3,238 2,843 2,666 2,289 2,165 1,945 1,759 1,658 1,356 1,441
10 Yrs. ‐ 15 Yrs. 6,406 5,577 5,434 5,052 4,837 4,364 3,712 3,483 3,120 3,027
16 Yrs. ‐ 20 Yrs. 20,722 19,155 18,647 17,720 16,954 15,109 13,628 13,180 11,545 11,236
21 Yrs. ‐ 24 Yrs. 11,616 10,978 10,741 10,512 10,215 9,217 8,034 7,907 7,373 7,080
25 Yrs. ‐ 34 Yrs. 21,898 19,966 19,005 18,186 17,440 15,394 13,784 13,777 12,647 11,620
35 Yrs. ‐ 44 Yrs. 19,838 18,307 17,586 16,718 16,396 14,874 13,410 12,783 11,708 10,564
45 Yrs. ‐ 54 Yrs. 14,932 14,482 14,134 14,183 14,262 13,269 12,193 12,240 11,989 11,274
55 Yrs. ‐ 64 Yrs. 7,773 7,429 7,782 7,942 8,384 8,008 7,749 7,875 7,836 7,814
65 Yrs. ‐ 74 Yrs. 4,788 4,515 4,252 4,053 4,046 3,823 3,608 3,804 3,683 3,669
> 74 Yrs. 3,858 3,709 3,835 3,553 3,517 3,387 3,102 3,122 2,733 2,811
Unknown 6,325 5,063 7,991 5,207 1,480 1,328 1,115 1,035 921 739
Total 123,345 113,686 113,753 106,828 101,059 91,890 83,145 81,845 75,794 72,324
. Data is unavailable # Data is available, but specific variables or attributes are unavailable. 160

State Data System: Crash Data Report 2000–2009
Table 10 : People Killed or Injured in Motor Vehicle Crashes by Age Group State Injury Severity Age Group 2000 2001 2002 2003 2004 2005 2006 2007 2008 2009
Minnesota Killed < 5 Yrs.
5 Yrs. ‐ 9 Yrs.
10 Yrs. ‐ 15 Yrs.
16 Yrs. ‐ 20 Yrs.
21 Yrs. ‐ 24 Yrs.
25 Yrs. ‐ 34 Yrs.
35 Yrs. ‐ 44 Yrs.
45 Yrs. ‐ 54 Yrs.
55 Yrs. ‐ 64 Yrs.
65 Yrs. ‐ 74 Yrs.
> 74 Yrs.
Unknown
Total
6 8 12 . 9 7
10 8 12 . 9 8
19 19 33 . 17 18
99 80 96 . 87 78
64 64 63 . 60 59
106 88 94 . 73 73
87 85 93 . 74 100
80 63 90 . 84 80
48 44 56 . 50 52
33 41 34 . 34 35
73 68 73 . 68 49
0 0 1 . 2 0
625 568 657 . 567 559
3
2
14
79
52
82
61
73
43
34
51
0
494
4
4
13
56
56
66
79
65
65
52
50
0
510
11
7
11
46
38
83
61
51
60
36
51
0
455
10
4
8
42
31
54
65
63
60
27
57
0
421
Injured < 5 Yrs.
5 Yrs. ‐ 9 Yrs.
10 Yrs. ‐ 15 Yrs.
16 Yrs. ‐ 20 Yrs.
21 Yrs. ‐ 24 Yrs.
25 Yrs. ‐ 34 Yrs.
35 Yrs. ‐ 44 Yrs.
45 Yrs. ‐ 54 Yrs.
55 Yrs. ‐ 64 Yrs.
65 Yrs. ‐ 74 Yrs.
> 74 Yrs.
Unknown
Total
726 626 541 . 655 545
1,200 1,026 917 . 885 810
2,484 2,166 2,060 . 1,865 1,749
8,775 8,199 8,146 . 7,069 6,607
4,514 4,363 4,364 . 4,457 4,280
7,731 7,355 6,668 . 6,825 6,492
7,048 6,532 6,103 . 6,143 5,703
4,822 4,844 4,793 . 4,992 4,939
2,485 2,376 2,438 . 2,925 2,760
1,612 1,530 1,411 . 1,485 1,438
1,462 1,420 1,425 . 1,380 1,224
1,883 1,792 1,811 . 1,392 1,139
44,742 42,229 40,677 . 40,073 37,686
527
790
1,495
6,161
3,828
6,035
5,147
4,746
2,775
1,344
1,139
1,038
35,025
527
730
1,505
5,760
3,835
6,207
5,072
4,999
2,953
1,407
1,317
1,006
35,318
516
721
1,286
5,258
3,568
6,067
4,845
4,820
3,002
1,376
1,127
793
33,379
448
673
1,268
4,833
3,240
5,693
4,381
4,326
2,965
1,357
1,121
768
31,073
. Data is unavailable # Data is available, but specific variables or attributes are unavailable. 161

State Data System: Crash Data Report 2000–2009
Table 10 : People Killed or Injured in Motor Vehicle Crashes by Age Group State Injury Severity Age Group 2000 2001 2002 2003 2004 2005 2006 2007 2008 2009
Missouri Killed < 5 Yrs.
5 Yrs. ‐ 9 Yrs.
10 Yrs. ‐ 15 Yrs.
16 Yrs. ‐ 20 Yrs.
21 Yrs. ‐ 24 Yrs.
25 Yrs. ‐ 34 Yrs.
35 Yrs. ‐ 44 Yrs.
45 Yrs. ‐ 54 Yrs.
55 Yrs. ‐ 64 Yrs.
65 Yrs. ‐ 74 Yrs.
> 74 Yrs.
Unknown
Total
16 11 8 14 12 15 8 13 7 7
28 18 16 18 13 13 14 11 9 11
41 36 43 43 34 33 31 23 27 16
217 183 183 192 186 196 184 147 137 107
105 104 137 124 134 143 120 95 90 82
160 167 186 170 170 168 177 133 149 141
197 191 194 187 184 204 163 146 132 136
126 134 162 160 147 171 141 158 154 141
111 78 95 115 96 119 109 108 90 96
59 80 77 84 58 91 67 67 72 55
97 92 103 122 93 97 82 89 88 83
0 4 4 3 3 7 0 2 5 3
1,157 1,098 1,208 1,232 1,130 1,257 1,096 992 960 878
Injured < 5 Yrs. 1,544 1,432 1,202 1,195 1,212 1,171 978 954 850 861
5 Yrs. ‐ 9 Yrs. 2,428 2,194 2,104 1,948 1,927 1,892 1,665 1,542 1,314 1,387
10 Yrs. ‐ 15 Yrs. 4,580 4,083 3,941 3,869 3,779 3,612 3,001 2,834 2,457 2,459
16 Yrs. ‐ 20 Yrs. 15,355 14,624 14,492 13,013 12,699 11,971 11,466 10,695 9,665 9,332
21 Yrs. ‐ 24 Yrs. 7,586 7,651 7,650 7,524 7,490 7,108 6,721 6,472 5,858 5,869
25 Yrs. ‐ 34 Yrs. 13,316 12,623 12,317 11,810 11,651 11,374 10,828 10,411 9,838 9,697
35 Yrs. ‐ 44 Yrs. 12,099 11,727 11,336 10,484 10,223 9,787 8,804 8,708 7,847 7,408
45 Yrs. ‐ 54 Yrs. 8,411 8,588 8,649 8,279 8,455 8,530 8,224 8,142 7,698 7,396
55 Yrs. ‐ 64 Yrs. 4,597 4,507 4,659 4,824 4,900 5,077 4,968 4,947 4,821 4,747
65 Yrs. ‐ 74 Yrs. 3,048 2,908 2,943 2,830 2,640 2,649 2,606 2,538 2,349 2,384
> 74 Yrs. 2,541 2,425 2,324 2,250 2,204 2,060 2,085 2,042 1,841 1,739
Unknown 827 858 997 1,096 1,496 1,182 772 721 611 556
Total 76,332 73,620 72,614 69,122 68,676 66,413 62,118 60,006 55,149 53,835
. Data is unavailable # Data is available, but specific variables or attributes are unavailable. 162

State Data System: Crash Data Report 2000–2009
Table 10 : People Killed or Injured in Motor Vehicle Crashes by Age Group State Injury Severity Age Group 2000 2001 2002 2003 2004 2005 2006 2007 2008 2009
Montana Killed < 5 Yrs.
5 Yrs. ‐ 9 Yrs.
10 Yrs. ‐ 15 Yrs.
16 Yrs. ‐ 20 Yrs.
21 Yrs. ‐ 24 Yrs.
25 Yrs. ‐ 34 Yrs.
35 Yrs. ‐ 44 Yrs.
45 Yrs. ‐ 54 Yrs.
55 Yrs. ‐ 64 Yrs.
65 Yrs. ‐ 74 Yrs.
> 74 Yrs.
Unknown
Total
4 1 1 4 1 5
8 8 3 1 0 1
12 7 8 16 7 7
35 26 38 36 36 25
24 20 23 28 22 26
44 38 38 33 32 52
33 39 36 33 27 32
26 38 51 40 38 31
22 26 27 26 28 34
12 13 22 17 17 18
17 14 20 18 20 20
0 0 0 0 1 0
237 230 267 252 229 251
4
2
6
31
32
34
40
50
23
17
24
0
263
1
2
7
33
31
37
45
56
31
21
12
0
276
1
5
6
30
21
46
30
35
24
14
15
2
229
.
.
.
.
.
.
.
.
.
.
.
.
.
Injured < 5 Yrs.
5 Yrs. ‐ 9 Yrs.
10 Yrs. ‐ 15 Yrs.
16 Yrs. ‐ 20 Yrs.
21 Yrs. ‐ 24 Yrs.
25 Yrs. ‐ 34 Yrs.
35 Yrs. ‐ 44 Yrs.
45 Yrs. ‐ 54 Yrs.
55 Yrs. ‐ 64 Yrs.
65 Yrs. ‐ 74 Yrs.
> 74 Yrs.
Unknown
Total
261 227 248 258 214 225
299 242 270 268 229 239
931 681 767 712 680 632
2,382 1,961 2,141 1,961 1,924 1,772
1,065 886 1,046 1,058 1,004 979
1,566 1,302 1,517 1,440 1,416 1,444
1,541 1,366 1,460 1,294 1,176 1,151
1,308 1,088 1,250 1,217 1,150 1,239
665 569 649 710 749 794
426 366 390 411 392 418
358 310 346 311 312 306
3 4 2 10 17 12
10,805 9,002 10,086 9,650 9,263 9,211
204
213
637
1,810
1,018
1,510
1,272
1,312
774
380
314
25
9,469
202
223
507
1,681
1,010
1,460
1,087
1,278
854
429
297
41
9,069
196
186
435
1,541
889
1,365
1,099
1,118
807
376
296
157
8,465
.
.
.
.
.
.
.
.
.
.
.
.
.
. Data is unavailable # Data is available, but specific variables or attributes are unavailable. 163

State Data System: Crash Data Report 2000–2009
Table 10 : People Killed or Injured in Motor Vehicle Crashes by Age Group State Injury Severity Age Group 2000 2001 2002 2003 2004 2005 2006 2007 2008 2009
Nebraska Killed < 5 Yrs.
5 Yrs. ‐ 9 Yrs.
10 Yrs. ‐ 15 Yrs.
16 Yrs. ‐ 20 Yrs.
21 Yrs. ‐ 24 Yrs.
25 Yrs. ‐ 34 Yrs.
35 Yrs. ‐ 44 Yrs.
45 Yrs. ‐ 54 Yrs.
55 Yrs. ‐ 64 Yrs.
65 Yrs. ‐ 74 Yrs.
> 74 Yrs.
Unknown
Total
4 3 4 6 4 4 8 3 2 2
7 5 6 7 5 1 4 5 2 2
3 9 12 11 16 10 14 9 7 8
55 46 56 46 37 41 50 49 33 30
23 24 42 34 29 32 29 25 22 21
38 30 34 40 19 35 36 30 26 39
38 41 37 40 34 34 24 32 19 35
34 34 43 45 42 39 27 36 33 32
23 13 23 20 20 33 25 16 21 18
20 13 29 16 15 11 25 18 17 14
31 26 20 28 29 34 27 33 25 22
0 3 1 0 4 2 0 0 2 0
276 247 307 293 254 276 269 256 209 223
Injured < 5 Yrs. 758 626 514 471 484 425 391 353 322 365
5 Yrs. ‐ 9 Yrs. 851 700 694 614 629 553 480 551 442 466
10 Yrs. ‐ 15 Yrs. 1,801 1,634 1,506 1,447 1,301 1,117 1,154 1,107 938 1,000
16 Yrs. ‐ 20 Yrs. 6,313 5,546 4,992 4,486 4,182 3,953 3,593 3,496 3,166 3,266
21 Yrs. ‐ 24 Yrs. 3,139 2,890 2,558 2,488 2,435 2,212 1,925 2,124 1,893 1,888
25 Yrs. ‐ 34 Yrs. 5,028 4,493 3,910 3,701 3,435 3,305 3,014 3,323 3,181 3,022
35 Yrs. ‐ 44 Yrs. 4,311 3,922 3,298 3,154 2,967 2,804 2,562 2,653 2,418 2,330
45 Yrs. ‐ 54 Yrs. 3,056 2,921 2,694 2,525 2,617 2,398 2,341 2,331 2,377 2,318
55 Yrs. ‐ 64 Yrs. 1,584 1,530 1,323 1,352 1,553 1,432 1,458 1,430 1,562 1,587
65 Yrs. ‐ 74 Yrs. 1,014 950 834 788 783 736 693 744 682 720
> 74 Yrs. 771 786 700 657 704 646 591 599 562 572
Unknown 803 805 454 358 316 274 253 295 292 242
Total 29,429 26,803 23,477 22,041 21,406 19,855 18,455 19,006 17,835 17,776
. Data is unavailable # Data is available, but specific variables or attributes are unavailable. 164
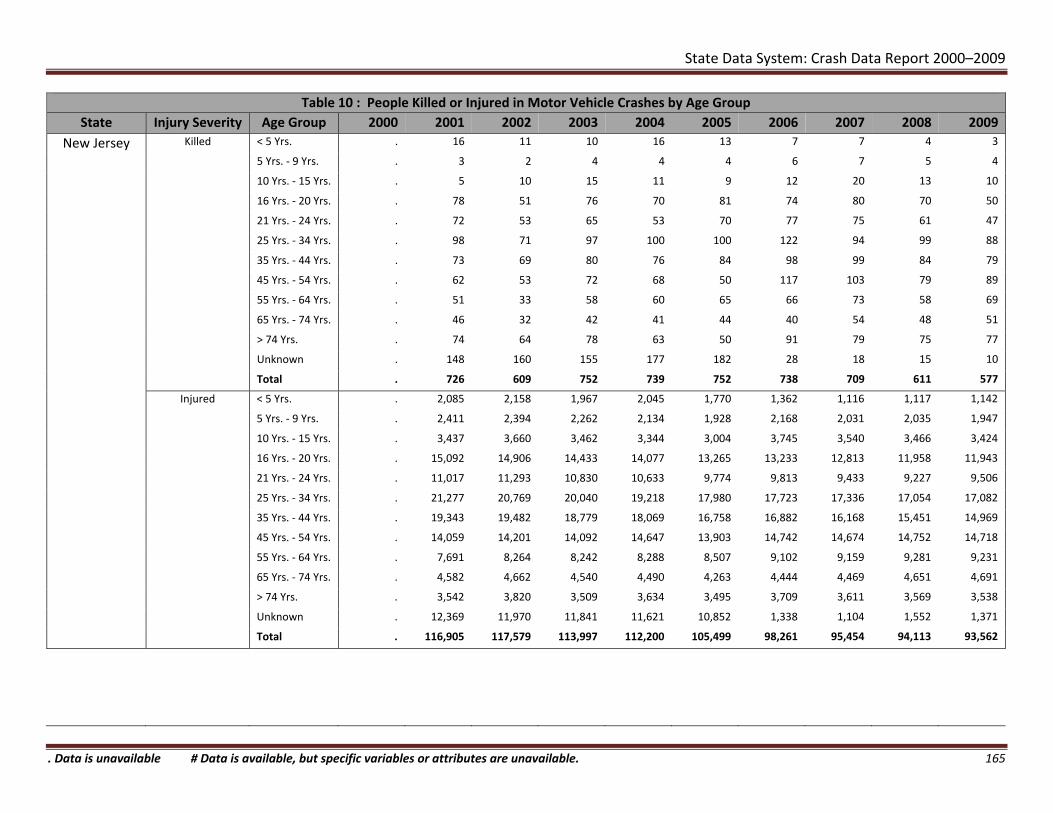
State Data System: Crash Data Report 2000–2009
Table 10 : People Killed or Injured in Motor Vehicle Crashes by Age Group State Injury Severity Age Group 2000 2001 2002 2003 2004 2005 2006 2007 2008 2009
New Jersey Killed < 5 Yrs.
5 Yrs. ‐ 9 Yrs.
10 Yrs. ‐ 15 Yrs.
16 Yrs. ‐ 20 Yrs.
21 Yrs. ‐ 24 Yrs.
25 Yrs. ‐ 34 Yrs.
35 Yrs. ‐ 44 Yrs.
45 Yrs. ‐ 54 Yrs.
55 Yrs. ‐ 64 Yrs.
65 Yrs. ‐ 74 Yrs.
> 74 Yrs.
Unknown
Total
. 16 11 10 16 13
. 3 2 4 4 4
. 5 10 15 11 9
. 78 51 76 70 81
. 72 53 65 53 70
. 98 71 97 100 100
. 73 69 80 76 84
. 62 53 72 68 50
. 51 33 58 60 65
. 46 32 42 41 44
. 74 64 78 63 50
. 148 160 155 177 182
. 726 609 752 739 752
7
6
12
74
77
122
98
117
66
40
91
28
738
7
7
20
80
75
94
99
103
73
54
79
18
709
4
5
13
70
61
99
84
79
58
48
75
15
611
3
4
10
50
47
88
79
89
69
51
77
10
577
Injured < 5 Yrs.
5 Yrs. ‐ 9 Yrs.
10 Yrs. ‐ 15 Yrs.
16 Yrs. ‐ 20 Yrs.
21 Yrs. ‐ 24 Yrs.
25 Yrs. ‐ 34 Yrs.
35 Yrs. ‐ 44 Yrs.
45 Yrs. ‐ 54 Yrs.
55 Yrs. ‐ 64 Yrs.
65 Yrs. ‐ 74 Yrs.
> 74 Yrs.
Unknown
Total
. 2,085 2,158 1,967 2,045 1,770
. 2,411 2,394 2,262 2,134 1,928
. 3,437 3,660 3,462 3,344 3,004
. 15,092 14,906 14,433 14,077 13,265
. 11,017 11,293 10,830 10,633 9,774
. 21,277 20,769 20,040 19,218 17,980
. 19,343 19,482 18,779 18,069 16,758
. 14,059 14,201 14,092 14,647 13,903
. 7,691 8,264 8,242 8,288 8,507
. 4,582 4,662 4,540 4,490 4,263
. 3,542 3,820 3,509 3,634 3,495
. 12,369 11,970 11,841 11,621 10,852
. 116,905 117,579 113,997 112,200 105,499
1,362
2,168
3,745
13,233
9,813
17,723
16,882
14,742
9,102
4,444
3,709
1,338
98,261
1,116
2,031
3,540
12,813
9,433
17,336
16,168
14,674
9,159
4,469
3,611
1,104
95,454
1,117
2,035
3,466
11,958
9,227
17,054
15,451
14,752
9,281
4,651
3,569
1,552
94,113
1,142
1,947
3,424
11,943
9,506
17,082
14,969
14,718
9,231
4,691
3,538
1,371
93,562
. Data is unavailable # Data is available, but specific variables or attributes are unavailable. 165

State Data System: Crash Data Report 2000–2009
Table 10 : People Killed or Injured in Motor Vehicle Crashes by Age Group State Injury Severity Age Group 2000 2001 2002 2003 2004 2005 2006 2007 2008 2009
New Mexico Killed < 5 Yrs.
5 Yrs. ‐ 9 Yrs.
10 Yrs. ‐ 15 Yrs.
16 Yrs. ‐ 20 Yrs.
21 Yrs. ‐ 24 Yrs.
25 Yrs. ‐ 34 Yrs.
35 Yrs. ‐ 44 Yrs.
45 Yrs. ‐ 54 Yrs.
55 Yrs. ‐ 64 Yrs.
65 Yrs. ‐ 74 Yrs.
> 74 Yrs.
Unknown
Total
6 3 7 10 9 9 6 4 4 11
7 12 9 9 11 11 9 7 1 5
16 17 18 21 15 16 15 9 10 9
60 46 73 53 75 67 53 54 35 43
49 37 50 49 46 48 55 47 41 35
74 93 62 78 91 95 93 73 65 58
78 80 75 82 80 66 73 55 56 59
49 71 54 51 67 73 74 67 59 52
32 41 52 31 50 49 45 38 42 34
29 27 26 26 42 26 30 24 25 23
33 34 19 25 34 24 22 26 28 30
2 3 4 3 2 4 9 9 2 2
435 464 449 438 522 488 484 413 368 361
Injured < 5 Yrs. 556 500 506 463 521 488 517 406 394 377
5 Yrs. ‐ 9 Yrs. 866 822 864 752 813 759 672 636 585 558
10 Yrs. ‐ 15 Yrs. 1,917 1,681 1,680 1,536 1,544 1,438 1,306 1,047 986 1,007
16 Yrs. ‐ 20 Yrs. 5,036 4,979 4,712 4,485 4,405 3,971 3,599 3,267 3,080 2,963
21 Yrs. ‐ 24 Yrs. 2,598 2,783 2,659 2,708 2,732 2,405 2,263 2,102 2,150 1,960
25 Yrs. ‐ 34 Yrs. 4,625 4,660 4,300 4,281 4,565 4,021 3,766 3,516 3,629 3,496
35 Yrs. ‐ 44 Yrs. 4,382 4,395 4,077 3,792 3,988 3,543 3,182 2,899 2,925 2,646
45 Yrs. ‐ 54 Yrs. 3,258 3,472 3,346 3,233 3,422 3,234 2,855 2,727 2,857 2,690
55 Yrs. ‐ 64 Yrs. 1,785 1,850 1,873 1,907 2,144 2,024 1,921 1,855 1,869 1,931
65 Yrs. ‐ 74 Yrs. 1,149 1,098 1,131 1,080 1,115 986 915 942 956 866
> 74 Yrs. 756 774 747 781 774 717 656 632 670 617
Unknown 452 522 546 396 458 419 565 526 458 362
Total 27,380 27,536 26,441 25,414 26,481 24,005 22,217 20,555 20,559 19,473
. Data is unavailable # Data is available, but specific variables or attributes are unavailable. 166

State Data System: Crash Data Report 2000–2009
Table 10 : People Killed or Injured in Motor Vehicle Crashes by Age Group State Injury Severity Age Group 2000 2001 2002 2003 2004 2005 2006 2007 2008 2009
New York Killed < 5 Yrs.
5 Yrs. ‐ 9 Yrs.
10 Yrs. ‐ 15 Yrs.
16 Yrs. ‐ 20 Yrs.
21 Yrs. ‐ 24 Yrs.
25 Yrs. ‐ 34 Yrs.
35 Yrs. ‐ 44 Yrs.
45 Yrs. ‐ 54 Yrs.
55 Yrs. ‐ 64 Yrs.
65 Yrs. ‐ 74 Yrs.
> 74 Yrs.
Unknown
Total
21 . 21 23 11 15
24 . 20 15 19 13
44 . 36 28 56 29
170 . 227 201 202 183
118 . 150 147 133 160
220 . 217 225 215 199
225 . 221 192 205 187
177 . 190 192 181 178
124 . 119 139 134 127
115 . 101 120 120 109
191 . 178 175 196 187
15 . 29 20 23 23
1,444 . 1,509 1,477 1,495 1,410
11
15
28
177
172
224
184
178
148
115
172
9
1,433
14
10
23
153
121
191
182
192
148
96
169
18
1,317
6
19
22
114
124
200
149
160
137
103
174
16
1,224
15
20
26
129
112
189
135
151
130
93
132
16
1,148
Injured < 5 Yrs.
5 Yrs. ‐ 9 Yrs.
10 Yrs. ‐ 15 Yrs.
16 Yrs. ‐ 20 Yrs.
21 Yrs. ‐ 24 Yrs.
25 Yrs. ‐ 34 Yrs.
35 Yrs. ‐ 44 Yrs.
45 Yrs. ‐ 54 Yrs.
55 Yrs. ‐ 64 Yrs.
65 Yrs. ‐ 74 Yrs.
> 74 Yrs.
Unknown
Total
4,877 . 3,467 3,105 2,910 2,674
8,769 . 6,755 6,057 5,385 4,936
13,571 . 11,387 10,450 9,947 8,748
39,415 . 34,782 31,558 28,246 25,570
30,783 . 27,532 25,194 22,373 20,735
63,598 . 53,505 47,571 42,065 38,533
56,073 . 48,775 44,182 39,603 36,823
36,803 . 34,017 32,489 30,794 29,505
18,770 . 18,584 18,148 17,512 17,480
10,795 . 9,971 9,462 8,725 8,494
7,926 . 7,697 7,257 7,032 6,730
10,557 . 6,412 6,700 6,245 6,286
301,937 . 262,884 242,173 220,837 206,514
2,510
4,444
8,062
24,409
19,850
36,437
33,799
28,585
16,925
8,208
6,490
5,925
195,644
2,522
4,224
7,562
23,964
19,651
36,385
32,637
29,302
17,537
8,301
6,577
5,593
194,255
2,388
3,990
7,171
22,620
18,767
35,171
30,865
28,792
17,557
8,178
6,145
5,516
187,160
2,335
3,893
6,888
21,559
19,081
35,518
29,797
29,078
17,774
8,299
6,223
5,589
186,034
. Data is unavailable # Data is available, but specific variables or attributes are unavailable. 167

State Data System: Crash Data Report 2000–2009
Table 10 : People Killed or Injured in Motor Vehicle Crashes by Age Group State Injury Severity Age Group 2000 2001 2002 2003 2004 2005 2006 2007 2008 2009
North Carolina
Killed < 5 Yrs.
5 Yrs. ‐ 9 Yrs.
10 Yrs. ‐ 15 Yrs.
16 Yrs. ‐ 20 Yrs.
21 Yrs. ‐ 24 Yrs.
25 Yrs. ‐ 34 Yrs.
35 Yrs. ‐ 44 Yrs.
45 Yrs. ‐ 54 Yrs.
55 Yrs. ‐ 64 Yrs.
65 Yrs. ‐ 74 Yrs.
> 74 Yrs.
Unknown
Total
32 24 22 23 27 23 27 15 17 19
24 22 24 16 30 15 21 17 12 21
49 54 38 44 47 38 40 34 26 24
189 201 210 212 228 214 194 202 189 170
150 152 153 159 169 147 162 184 140 151
264 263 263 278 272 271 250 321 254 213
290 247 267 250 249 221 241 258 231 167
197 202 225 171 186 237 223 252 215 220
110 126 166 135 138 144 156 170 163 153
109 100 89 96 101 99 109 113 88 84
144 141 119 172 130 135 135 126 113 117
1 1 0 1 1 2 1 2 2 5
1,559 1,533 1,576 1,557 1,578 1,546 1,559 1,694 1,450 1,344
Injured < 5 Yrs. 3,620 3,594 3,445 3,605 3,587 3,113 3,064 3,437 3,161 3,095
5 Yrs. ‐ 9 Yrs. 4,138 3,903 3,733 3,739 3,670 3,376 3,257 3,259 2,986 2,892
10 Yrs. ‐ 15 Yrs. 6,509 6,369 6,454 6,224 6,181 5,536 5,496 5,152 4,622 4,575
16 Yrs. ‐ 20 Yrs. 22,418 21,524 21,870 21,922 21,672 19,766 19,492 18,936 17,384 16,842
21 Yrs. ‐ 24 Yrs. 16,149 14,876 15,066 15,143 14,696 13,657 13,453 13,163 12,051 11,942
25 Yrs. ‐ 34 Yrs. 29,565 27,201 26,443 26,376 25,871 23,865 22,653 22,381 21,089 20,516
35 Yrs. ‐ 44 Yrs. 23,796 22,209 21,751 22,004 21,688 20,110 19,161 18,993 17,891 17,138
45 Yrs. ‐ 54 Yrs. 16,530 16,215 16,019 16,397 16,250 15,809 15,361 15,808 15,022 14,616
55 Yrs. ‐ 64 Yrs. 8,874 8,897 9,395 9,575 10,005 9,529 9,553 10,041 9,977 9,798
65 Yrs. ‐ 74 Yrs. 5,541 5,321 5,192 5,335 5,049 4,856 4,776 4,967 4,779 4,802
> 74 Yrs. 4,080 4,034 3,937 4,119 4,163 4,000 3,594 3,411 3,262 3,130
Unknown 57 83 90 135 140 161 143 105 173 157
Total 141,277 134,226 133,395 134,574 132,972 123,778 120,003 119,653 112,397 109,503
. Data is unavailable # Data is available, but specific variables or attributes are unavailable. 168

State Data System: Crash Data Report 2000–2009
Table 10 : People Killed or Injured in Motor Vehicle Crashes by Age Group State Injury Severity Age Group 2000 2001 2002 2003 2004 2005 2006 2007 2008 2009
North Dakota Killed < 5 Yrs.
5 Yrs. ‐ 9 Yrs.
10 Yrs. ‐ 15 Yrs.
16 Yrs. ‐ 20 Yrs.
21 Yrs. ‐ 24 Yrs.
25 Yrs. ‐ 34 Yrs.
35 Yrs. ‐ 44 Yrs.
45 Yrs. ‐ 54 Yrs.
55 Yrs. ‐ 64 Yrs.
65 Yrs. ‐ 74 Yrs.
> 74 Yrs.
Unknown
Total
. . . 1 1 3
. . . 0 2 4
. . . 7 6 2
. . . 16 9 18
. . . 10 4 13
. . . 10 16 17
. . . 16 10 13
. . . 9 19 24
. . . 11 6 9
. . . 9 8 7
. . . 16 19 14
. . . 0 0 0
. . . 105 100 124
4
0
10
19
6
13
16
13
14
10
6
0
111
1
1
4
18
13
28
15
9
11
4
6
0
110
2
2
2
10
13
18
17
16
7
3
10
0
100
2
2
2
20
10
24
17
20
19
4
20
0
140
Injured < 5 Yrs.
5 Yrs. ‐ 9 Yrs.
10 Yrs. ‐ 15 Yrs.
16 Yrs. ‐ 20 Yrs.
21 Yrs. ‐ 24 Yrs.
25 Yrs. ‐ 34 Yrs.
35 Yrs. ‐ 44 Yrs.
45 Yrs. ‐ 54 Yrs.
55 Yrs. ‐ 64 Yrs.
65 Yrs. ‐ 74 Yrs.
> 74 Yrs.
Unknown
Total
. . . 146 131 150
. . . 149 119 92
. . . 379 339 286
. . . 1,119 976 941
. . . 544 554 537
. . . 679 648 658
. . . 610 627 583
. . . 520 550 483
. . . 294 298 281
. . . 209 169 184
. . . 172 206 172
. . . 0 1 1
. . . 4,821 4,618 4,368
132
98
285
837
539
659
446
484
289
182
157
0
4,108
129
91
235
783
555
679
542
517
311
172
165
7
4,186
91
68
233
803
488
681
529
588
389
170
162
5
4,207
105
97
281
740
575
774
562
577
383
186
174
4
4,458
. Data is unavailable # Data is available, but specific variables or attributes are unavailable. 169

State Data System: Crash Data Report 2000–2009
Table 10 : People Killed or Injured in Motor Vehicle Crashes by Age Group State Injury Severity Age Group 2000 2001 2002 2003 2004 2005 2006 2007 2008 2009
Ohio Killed < 5 Yrs.
5 Yrs. ‐ 9 Yrs.
10 Yrs. ‐ 15 Yrs.
16 Yrs. ‐ 20 Yrs.
21 Yrs. ‐ 24 Yrs.
25 Yrs. ‐ 34 Yrs.
35 Yrs. ‐ 44 Yrs.
45 Yrs. ‐ 54 Yrs.
55 Yrs. ‐ 64 Yrs.
65 Yrs. ‐ 74 Yrs.
> 74 Yrs.
Unknown
Total
18 15 11 15 11 10 11 16 14 13
28 20 16 13 14 16 21 14 12 9
57 40 46 46 51 37 23 22 36 23
207 202 214 201 205 186 163 155 131 124
126 135 136 120 139 115 116 135 104 70
224 228 220 191 184 224 199 228 191 157
222 219 241 202 186 219 167 195 180 162
164 198 190 174 191 193 198 174 190 177
106 104 113 119 92 124 138 132 147 114
93 88 99 76 81 82 88 68 81 76
114 122 129 113 126 120 115 118 105 97
2 8 2 8 5 2 0 0 0 0
1,361 1,379 1,417 1,278 1,285 1,328 1,239 1,257 1,191 1,022
Injured < 5 Yrs. 4,040 2,141 3,312 3,221 3,317 2,932 2,739 2,536 2,435 2,361
5 Yrs. ‐ 9 Yrs. 5,005 3,356 4,103 4,046 3,756 3,572 3,329 3,027 2,970 2,836
10 Yrs. ‐ 15 Yrs. 8,404 6,137 7,285 7,025 6,711 6,116 5,527 4,906 4,851 4,531
16 Yrs. ‐ 20 Yrs. 30,393 24,867 25,824 24,552 24,065 22,117 20,544 18,692 17,471 17,113
21 Yrs. ‐ 24 Yrs. 16,326 14,382 14,940 15,225 14,671 13,884 12,695 11,859 11,322 10,742
25 Yrs. ‐ 34 Yrs. 29,841 24,990 25,067 24,639 24,495 23,041 21,443 20,567 19,839 18,790
35 Yrs. ‐ 44 Yrs. 27,300 23,568 22,765 22,141 21,795 20,369 18,728 17,879 17,047 15,728
45 Yrs. ‐ 54 Yrs. 20,041 17,765 18,177 18,696 18,921 18,076 17,313 16,706 16,538 15,542
55 Yrs. ‐ 64 Yrs. 10,500 9,299 9,936 10,414 11,058 10,597 10,399 10,382 10,615 10,467
65 Yrs. ‐ 74 Yrs. 6,938 5,973 5,960 5,760 5,743 5,472 5,266 5,161 4,995 5,170
> 74 Yrs. 5,157 4,462 4,662 4,532 4,530 4,238 4,102 3,936 3,716 3,717
Unknown 2,843 1,907 1,227 1,112 1,115 979 894 790 661 623
Total 166,788 138,847 143,258 141,363 140,177 131,393 122,979 116,441 112,460 107,620
. Data is unavailable # Data is available, but specific variables or attributes are unavailable. 170

State Data System: Crash Data Report 2000–2009
Table 10 : People Killed or Injured in Motor Vehicle Crashes by Age Group State Injury Severity Age Group 2000 2001 2002 2003 2004 2005 2006 2007 2008 2009
Pennsylvania Killed < 5 Yrs.
5 Yrs. ‐ 9 Yrs.
10 Yrs. ‐ 15 Yrs.
16 Yrs. ‐ 20 Yrs.
21 Yrs. ‐ 24 Yrs.
25 Yrs. ‐ 34 Yrs.
35 Yrs. ‐ 44 Yrs.
45 Yrs. ‐ 54 Yrs.
55 Yrs. ‐ 64 Yrs.
65 Yrs. ‐ 74 Yrs.
> 74 Yrs.
Unknown
Total
23 14 . 12 16 15
22 24 . 17 12 11
29 36 . 33 44 31
231 245 . 257 210 212
151 149 . 151 134 189
245 236 . 221 209 248
250 230 . 230 208 223
169 185 . 203 212 198
120 98 . 125 141 158
96 105 . 105 104 120
184 196 . 171 182 202
0 14 . 50 18 9
1,520 1,532 . 1,575 1,490 1,616
16
21
30
196
170
250
245
182
136
103
162
14
1,525
14
4
33
230
174
212
201
203
155
93
165
7
1,491
10
5
18
180
177
245
206
195
163
102
155
5
1,461
9
10
21
153
126
189
164
215
120
88
158
2
1,255
Injured < 5 Yrs.
5 Yrs. ‐ 9 Yrs.
10 Yrs. ‐ 15 Yrs.
16 Yrs. ‐ 20 Yrs.
21 Yrs. ‐ 24 Yrs.
25 Yrs. ‐ 34 Yrs.
35 Yrs. ‐ 44 Yrs.
45 Yrs. ‐ 54 Yrs.
55 Yrs. ‐ 64 Yrs.
65 Yrs. ‐ 74 Yrs.
> 74 Yrs.
Unknown
Total
2,151 1,800 . 1,985 1,997 1,915
4,221 3,515 . 3,077 3,015 2,731
6,692 5,806 . 5,407 5,673 4,686
22,418 19,664 . 18,938 18,592 17,578
12,960 11,783 . 12,260 12,079 11,603
23,689 19,657 . 19,134 18,631 17,425
21,025 18,309 . 18,147 17,075 16,374
15,120 13,820 . 14,213 14,288 13,997
8,389 7,472 . 8,278 8,510 8,335
5,965 5,104 . 4,780 4,847 4,580
5,140 4,953 . 4,743 4,517 4,314
3,700 5,979 . 6,029 6,714 6,312
131,470 117,862 . 116,991 115,938 109,850
1,525
2,364
4,343
16,264
10,855
15,858
14,480
12,827
7,955
4,052
4,126
1,941
96,590
1,489
2,385
4,062
15,258
10,352
15,845
14,242
13,098
8,182
4,175
3,830
1,706
94,624
1,330
1,989
3,567
13,971
9,723
14,845
13,013
12,507
8,072
4,172
3,726
1,191
88,106
1,456
2,075
3,416
13,324
9,488
14,824
12,221
12,356
8,297
4,396
3,955
1,004
86,812
. Data is unavailable # Data is available, but specific variables or attributes are unavailable. 171

State Data System: Crash Data Report 2000–2009
Table 10 : People Killed or Injured in Motor Vehicle Crashes by Age Group State Injury Severity Age Group 2000 2001 2002 2003 2004 2005 2006 2007 2008 2009
South Carolina
Killed < 5 Yrs.
5 Yrs. ‐ 9 Yrs.
10 Yrs. ‐ 15 Yrs.
16 Yrs. ‐ 20 Yrs.
21 Yrs. ‐ 24 Yrs.
25 Yrs. ‐ 34 Yrs.
35 Yrs. ‐ 44 Yrs.
45 Yrs. ‐ 54 Yrs.
55 Yrs. ‐ 64 Yrs.
65 Yrs. ‐ 74 Yrs.
> 74 Yrs.
Unknown
Total
16 10 9 12 11 10 11 12 8 5
20 16 15 15 6 9 6 12 8 7
41 50 35 20 25 37 28 35 18 21
111 143 156 123 135 123 126 141 121 106
120 109 101 97 122 114 104 134 105 86
193 192 202 185 201 219 194 180 154 167
178 199 182 167 178 175 180 191 157 138
139 135 130 138 150 164 175 170 143 140
92 82 77 78 99 96 86 86 84 111
83 55 72 59 52 64 63 68 56 56
66 64 66 73 60 71 61 41 62 52
4 5 8 2 7 11 10 7 5 5
1,063 1,060 1,053 969 1,046 1,093 1,044 1,077 921 894
Injured < 5 Yrs. 1,643 1,123 1,134 1,059 1,055 1,105 1,052 996 917 1,052
5 Yrs. ‐ 9 Yrs. 1,765 1,614 1,481 1,427 1,471 1,426 1,373 1,318 1,169 1,279
10 Yrs. ‐ 15 Yrs. 3,364 3,051 3,074 2,829 2,706 2,535 2,349 2,210 2,026 2,228
16 Yrs. ‐ 20 Yrs. 8,945 8,713 8,674 8,212 8,108 8,134 8,102 7,953 7,199 7,241
21 Yrs. ‐ 24 Yrs. 5,777 5,623 5,576 5,648 5,706 5,656 5,427 5,355 5,015 5,227
25 Yrs. ‐ 34 Yrs. 10,231 9,696 9,439 9,193 9,284 9,326 9,112 8,995 8,650 9,101
35 Yrs. ‐ 44 Yrs. 8,582 8,506 8,303 7,918 7,991 7,762 7,455 7,247 7,146 6,885
45 Yrs. ‐ 54 Yrs. 5,965 6,186 6,373 6,514 6,509 6,515 6,589 6,433 6,390 6,427
55 Yrs. ‐ 64 Yrs. 3,208 3,399 3,658 3,835 3,988 4,101 4,252 4,275 4,204 4,392
65 Yrs. ‐ 74 Yrs. 2,097 2,040 2,130 2,098 2,075 2,100 2,104 2,098 2,132 2,177
> 74 Yrs. 1,855 1,484 1,449 1,511 1,372 1,452 1,365 1,430 1,361 1,449
Unknown 137 897 929 1,022 930 881 965 969 814 845
Total 53,569 52,332 52,220 51,266 51,195 50,993 50,145 49,279 47,023 48,303
. Data is unavailable # Data is available, but specific variables or attributes are unavailable. 172

State Data System: Crash Data Report 2000–2009
Table 10 : People Killed or Injured in Motor Vehicle Crashes by Age Group State Injury Severity Age Group 2000 2001 2002 2003 2004 2005 2006 2007 2008 2009
Texas Killed < 5 Yrs.
5 Yrs. ‐ 9 Yrs.
10 Yrs. ‐ 15 Yrs.
16 Yrs. ‐ 20 Yrs.
21 Yrs. ‐ 24 Yrs.
25 Yrs. ‐ 34 Yrs.
35 Yrs. ‐ 44 Yrs.
45 Yrs. ‐ 54 Yrs.
55 Yrs. ‐ 64 Yrs.
65 Yrs. ‐ 74 Yrs.
> 74 Yrs.
Unknown
Total
85 86 . 70 93 72
74 63 . 66 76 59
127 120 . 131 125 132
582 585 . 565 489 474
407 355 . 393 406 368
685 644 . 655 629 629
578 619 . 592 565 532
462 449 . 506 465 483
258 265 . 321 305 285
217 226 . 185 216 207
261 295 . 249 283 252
38 32 . 89 48 65
3,774 3,739 . 3,822 3,700 3,558
54
59
120
456
420
608
531
513
307
178
205
70
3,521
69
45
83
421
404
592
544
540
319
172
230
44
3,463
61
40
80
444
383
675
534
540
333
183
181
23
3,477
58
36
79
383
319
578
485
458
336
170
171
16
3,089
Injured < 5 Yrs.
5 Yrs. ‐ 9 Yrs.
10 Yrs. ‐ 15 Yrs.
16 Yrs. ‐ 20 Yrs.
21 Yrs. ‐ 24 Yrs.
25 Yrs. ‐ 34 Yrs.
35 Yrs. ‐ 44 Yrs.
45 Yrs. ‐ 54 Yrs.
55 Yrs. ‐ 64 Yrs.
65 Yrs. ‐ 74 Yrs.
> 74 Yrs.
Unknown
Total
11,472 11,371 . 10,188 9,510 9,737
12,798 12,623 . 10,846 10,461 10,382
19,421 19,052 . 16,463 15,350 14,916
58,873 57,161 . 48,356 45,249 44,607
36,735 37,275 . 34,045 32,140 32,473
68,176 68,181 . 58,361 54,698 55,851
55,987 55,216 . 46,838 44,569 44,691
37,500 38,440 . 34,992 34,196 35,370
18,385 19,277 . 18,582 18,677 20,258
10,879 11,083 . 9,799 9,418 9,587
7,517 7,592 . 6,633 6,465 6,681
3,158 3,181 . 13,257 7,495 8,102
340,901 340,452 . 308,360 288,228 292,655
8,486
9,175
13,105
40,505
30,127
52,307
41,809
34,523
19,681
9,286
6,381
5,741
271,126
7,926
8,917
12,464
39,634
28,967
51,217
41,280
34,478
20,480
9,273
6,152
5,530
266,318
6,999
8,063
11,039
35,281
26,528
47,359
37,405
32,452
19,677
8,986
5,802
4,275
243,866
7,106
7,899
10,769
33,995
25,323
45,706
35,841
31,274
19,435
8,868
5,672
3,392
235,280
. Data is unavailable # Data is available, but specific variables or attributes are unavailable. 173

State Data System: Crash Data Report 2000–2009
Table 10 : People Killed or Injured in Motor Vehicle Crashes by Age Group State Injury Severity Age Group 2000 2001 2002 2003 2004 2005 2006 2007 2008 2009
Utah Killed < 5 Yrs.
5 Yrs. ‐ 9 Yrs.
10 Yrs. ‐ 15 Yrs.
16 Yrs. ‐ 20 Yrs.
21 Yrs. ‐ 24 Yrs.
25 Yrs. ‐ 34 Yrs.
35 Yrs. ‐ 44 Yrs.
45 Yrs. ‐ 54 Yrs.
55 Yrs. ‐ 64 Yrs.
65 Yrs. ‐ 74 Yrs.
> 74 Yrs.
Unknown
Total
12 9 5 11 6 .
12 7 8 13 6 .
13 15 18 13 11 .
54 52 61 54 31 .
48 32 35 19 39 .
56 41 47 47 56 .
54 38 35 37 42 .
50 39 37 28 35 .
25 18 34 34 27 .
18 20 26 29 18 .
30 19 23 19 19 .
1 2 0 5 7 .
373 292 329 309 297 .
.
.
.
.
.
.
.
.
.
.
.
.
.
.
.
.
.
.
.
.
.
.
.
.
.
.
.
.
.
.
.
.
.
.
.
.
.
.
.
.
.
.
.
.
.
.
.
.
.
.
.
.
Injured < 5 Yrs.
5 Yrs. ‐ 9 Yrs.
10 Yrs. ‐ 15 Yrs.
16 Yrs. ‐ 20 Yrs.
21 Yrs. ‐ 24 Yrs.
25 Yrs. ‐ 34 Yrs.
35 Yrs. ‐ 44 Yrs.
45 Yrs. ‐ 54 Yrs.
55 Yrs. ‐ 64 Yrs.
65 Yrs. ‐ 74 Yrs.
> 74 Yrs.
Unknown
Total
695 744 745 708 694 .
988 921 884 889 903 .
1,833 1,658 1,703 1,646 1,593 .
6,762 6,556 6,384 5,781 5,870 .
3,858 4,003 3,968 3,542 3,858 .
5,334 5,066 5,421 5,146 5,681 .
3,838 3,747 3,887 3,594 3,748 .
2,931 2,916 3,060 2,830 3,039 .
1,522 1,418 1,701 1,685 1,817 .
925 864 981 940 898 .
683 755 784 734 713 .
717 729 911 857 823 .
30,086 29,377 30,429 28,352 29,637 .
.
.
.
.
.
.
.
.
.
.
.
.
.
.
.
.
.
.
.
.
.
.
.
.
.
.
.
.
.
.
.
.
.
.
.
.
.
.
.
.
.
.
.
.
.
.
.
.
.
.
.
.
. Data is unavailable # Data is available, but specific variables or attributes are unavailable. 174

State Data System: Crash Data Report 2000–2009
Table 10 : People Killed or Injured in Motor Vehicle Crashes by Age Group State Injury Severity Age Group 2000 2001 2002 2003 2004 2005 2006 2007 2008 2009
Virginia Killed < 5 Yrs.
5 Yrs. ‐ 9 Yrs.
10 Yrs. ‐ 15 Yrs.
16 Yrs. ‐ 20 Yrs.
21 Yrs. ‐ 24 Yrs.
25 Yrs. ‐ 34 Yrs.
35 Yrs. ‐ 44 Yrs.
45 Yrs. ‐ 54 Yrs.
55 Yrs. ‐ 64 Yrs.
65 Yrs. ‐ 74 Yrs.
> 74 Yrs.
Unknown
Total
10 13 3 6 7 8 15 9 10 9
9 10 6 12 13 16 7 14 8 3
34 17 29 28 17 24 22 22 14 12
157 141 165 126 150 122 147 133 136 92
85 87 98 84 98 122 122 137 102 96
165 140 139 150 163 119 137 175 126 123
147 144 127 150 123 155 123 128 128 110
101 128 127 125 123 130 146 148 139 111
69 77 84 92 72 95 94 95 90 76
57 66 55 68 69 75 58 73 52 55
91 108 72 100 82 74 86 85 59 66
5 4 8 1 5 6 4 7 1 3
930 935 913 942 922 946 961 1,026 865 756
Injured < 5 Yrs. 1,614 1,539 1,537 1,518 1,593 1,451 1,520 1,310 1,219 1,017
5 Yrs. ‐ 9 Yrs. 2,265 2,126 1,890 1,931 1,830 1,722 1,702 1,517 1,304 1,251
10 Yrs. ‐ 15 Yrs. 4,035 3,803 3,501 3,458 3,124 3,129 2,774 2,500 2,212 1,945
16 Yrs. ‐ 20 Yrs. 14,021 14,164 13,503 12,324 12,406 11,993 11,803 10,699 10,353 8,947
21 Yrs. ‐ 24 Yrs. 8,316 8,428 8,615 8,855 8,787 8,560 8,195 7,764 7,667 7,046
25 Yrs. ‐ 34 Yrs. 15,252 15,046 14,851 15,079 14,673 13,968 13,360 12,503 12,819 11,939
35 Yrs. ‐ 44 Yrs. 13,683 13,632 13,364 13,545 13,213 12,753 11,888 11,074 11,083 9,877
45 Yrs. ‐ 54 Yrs. 9,396 9,873 10,129 10,135 10,647 10,491 10,222 9,833 10,196 9,370
55 Yrs. ‐ 64 Yrs. 5,141 5,298 5,515 5,919 6,226 6,234 6,118 6,178 6,205 6,018
65 Yrs. ‐ 74 Yrs. 2,945 3,086 2,951 3,041 3,036 2,957 2,920 2,861 2,966 2,909
> 74 Yrs. 2,085 2,178 2,176 2,166 2,143 2,048 2,118 1,946 1,933 1,833
Unknown 1,052 1,014 864 871 808 717 728 637 966 811
Total 79,805 80,187 78,896 78,842 78,486 76,023 73,348 68,822 68,923 62,963
. Data is unavailable # Data is available, but specific variables or attributes are unavailable. 175

State Data System: Crash Data Report 2000–2009
Table 10 : People Killed or Injured in Motor Vehicle Crashes by Age Group State Injury Severity Age Group 2000 2001 2002 2003 2004 2005 2006 2007 2008 2009
Washington Killed < 5 Yrs.
5 Yrs. ‐ 9 Yrs.
10 Yrs. ‐ 15 Yrs.
16 Yrs. ‐ 20 Yrs.
21 Yrs. ‐ 24 Yrs.
25 Yrs. ‐ 34 Yrs.
35 Yrs. ‐ 44 Yrs.
45 Yrs. ‐ 54 Yrs.
55 Yrs. ‐ 64 Yrs.
65 Yrs. ‐ 74 Yrs.
> 74 Yrs.
Unknown
Total
0 2 14 8 9 15 9 5 7 7
0 1 9 10 6 5 4 2 1 5
0 3 21 17 6 15 11 21 6 14
39 64 106 89 104 67 110 83 51 60
30 59 75 54 75 75 82 70 62 65
64 97 118 94 83 122 91 97 96 82
63 109 104 94 77 75 75 77 73 61
47 83 92 91 67 91 111 73 76 79
40 45 51 38 53 66 71 57 55 60
16 26 45 42 41 35 30 29 36 31
29 48 47 70 47 69 38 47 55 30
113 182 1 5 9 13 2 4 0 1
441 719 683 612 577 648 634 565 518 495
Injured < 5 Yrs. 88 102 842 749 783 798 733 640 604 627
5 Yrs. ‐ 9 Yrs. 119 172 1,276 1,188 1,174 1,278 1,195 1,124 963 895
10 Yrs. ‐ 15 Yrs. 235 491 2,754 2,383 2,366 2,353 2,338 2,072 1,852 1,711
16 Yrs. ‐ 20 Yrs. 3,547 8,235 11,557 9,908 9,960 10,068 9,339 8,416 7,373 6,678
21 Yrs. ‐ 24 Yrs. 2,395 5,294 7,140 6,498 6,814 7,348 6,960 6,312 5,713 5,122
25 Yrs. ‐ 34 Yrs. 4,911 10,164 12,137 11,121 10,995 11,704 11,580 10,808 10,052 9,526
35 Yrs. ‐ 44 Yrs. 4,570 9,828 11,357 10,263 10,029 10,657 10,189 9,476 8,539 7,668
45 Yrs. ‐ 54 Yrs. 3,483 7,882 9,467 8,691 9,130 9,546 9,461 9,082 8,108 7,452
55 Yrs. ‐ 64 Yrs. 1,727 3,680 4,934 4,895 5,086 5,684 5,787 5,728 5,473 5,235
65 Yrs. ‐ 74 Yrs. 770 1,806 2,230 2,194 2,258 2,371 2,257 2,342 2,294 2,176
> 74 Yrs. 491 1,298 1,735 1,719 1,657 1,765 1,712 1,604 1,409 1,370
Unknown 7,450 19,643 1,675 1,415 1,531 1,427 1,237 1,074 1,007 795
Total 29,786 68,595 67,104 61,024 61,783 64,999 62,788 58,678 53,387 49,255
. Data is unavailable # Data is available, but specific variables or attributes are unavailable. 176

State Data System: Crash Data Report 2000–2009
Table 10 : People Killed or Injured in Motor Vehicle Crashes by Age Group State Injury Severity Age Group 2000 2001 2002 2003 2004 2005 2006 2007 2008 2009
Wisconsin Killed < 5 Yrs.
5 Yrs. ‐ 9 Yrs.
10 Yrs. ‐ 15 Yrs.
16 Yrs. ‐ 20 Yrs.
21 Yrs. ‐ 24 Yrs.
25 Yrs. ‐ 34 Yrs.
35 Yrs. ‐ 44 Yrs.
45 Yrs. ‐ 54 Yrs.
55 Yrs. ‐ 64 Yrs.
65 Yrs. ‐ 74 Yrs.
> 74 Yrs.
Unknown
Total
8 15 12 10 8 7 7 8 9 4
18 12 9 15 13 8 4 14 8 4
25 20 24 18 20 21 15 19 13 15
126 98 134 132 104 125 112 111 73 67
73 92 90 105 101 92 92 91 63 52
108 119 109 121 117 136 120 118 83 85
131 126 120 121 111 107 94 92 84 78
102 105 117 118 109 109 105 111 87 87
57 66 66 65 58 80 67 75 67 61
64 45 43 46 60 48 44 42 52 43
94 73 84 90 83 73 62 66 60 53
0 0 1 0 0 1 0 0 1 0
806 771 809 841 784 807 722 747 600 549
Injured < 5 Yrs. 1,082 1,059 971 943 861 813 811 785 617 655
5 Yrs. ‐ 9 Yrs. 1,845 1,689 1,520 1,605 1,427 1,289 1,205 1,210 1,042 1,033
10 Yrs. ‐ 15 Yrs. 4,041 3,524 3,325 3,154 2,957 2,953 2,528 2,353 2,127 1,935
16 Yrs. ‐ 20 Yrs. 13,270 11,968 12,013 11,236 10,476 9,818 9,262 8,997 7,672 6,993
21 Yrs. ‐ 24 Yrs. 6,693 6,432 6,547 6,584 6,525 6,015 5,778 5,723 5,099 4,504
25 Yrs. ‐ 34 Yrs. 11,362 10,185 9,887 9,513 9,554 9,532 8,837 8,986 8,486 7,457
35 Yrs. ‐ 44 Yrs. 10,512 9,573 9,275 9,224 8,819 8,507 8,003 7,884 7,405 6,055
45 Yrs. ‐ 54 Yrs. 7,727 7,169 7,219 7,503 7,354 7,403 7,000 7,437 7,186 6,281
55 Yrs. ‐ 64 Yrs. 3,845 3,636 3,867 4,145 4,236 4,332 4,153 4,603 4,459 4,173
65 Yrs. ‐ 74 Yrs. 2,517 2,301 2,379 2,258 2,282 2,181 2,060 2,110 1,996 1,934
> 74 Yrs. 2,307 2,108 2,095 2,010 1,997 1,881 1,929 1,835 1,708 1,664
Unknown 573 444 444 414 416 353 341 307 259 232
Total 65,774 60,088 59,542 58,589 56,904 55,077 51,907 52,230 48,056 42,916
. Data is unavailable # Data is available, but specific variables or attributes are unavailable. 177

State Data System: Crash Data Report 2000–2009
Table 10 : People Killed or Injured in Motor Vehicle Crashes by Age Group State Injury Severity Age Group 2000 2001 2002 2003 2004 2005 2006 2007 2008 2009
Wyoming Killed < 5 Yrs.
5 Yrs. ‐ 9 Yrs.
10 Yrs. ‐ 15 Yrs.
16 Yrs. ‐ 20 Yrs.
21 Yrs. ‐ 24 Yrs.
25 Yrs. ‐ 34 Yrs.
35 Yrs. ‐ 44 Yrs.
45 Yrs. ‐ 54 Yrs.
55 Yrs. ‐ 64 Yrs.
65 Yrs. ‐ 74 Yrs.
> 74 Yrs.
Unknown
Total
5 4 4 4 4 2 1 5 0 1
5 3 4 1 1 1 1 0 1 3
9 6 7 6 4 3 9 4 5 2
20 16 30 18 21 19 21 20 18 24
7 16 15 15 24 30 24 16 21 11
24 35 34 24 20 25 41 27 33 20
20 20 23 26 30 28 28 19 21 18
24 30 28 38 37 26 30 25 29 27
14 23 14 16 11 15 22 22 14 12
13 17 9 6 5 11 6 5 12 11
11 16 7 11 7 10 12 6 5 5
0 0 1 0 0 0 0 0 0 0
152 186 176 165 164 170 195 149 159 134
Injured < 5 Yrs. 134 131 132 167 167 151 158 170 105 108
5 Yrs. ‐ 9 Yrs. 178 158 167 173 151 171 172 196 160 136
10 Yrs. ‐ 15 Yrs. 405 383 388 343 346 364 368 338 276 255
16 Yrs. ‐ 20 Yrs. 1,354 1,220 1,400 1,246 1,248 1,168 1,328 1,227 994 885
21 Yrs. ‐ 24 Yrs. 646 626 678 667 725 662 748 685 587 561
25 Yrs. ‐ 34 Yrs. 909 865 959 1,006 941 987 1,069 1,142 1,041 880
35 Yrs. ‐ 44 Yrs. 905 819 836 883 798 766 892 855 735 669
45 Yrs. ‐ 54 Yrs. 689 680 703 810 767 789 821 901 727 642
55 Yrs. ‐ 64 Yrs. 355 306 368 427 453 468 548 538 478 468
65 Yrs. ‐ 74 Yrs. 204 196 199 256 214 262 237 241 206 191
> 74 Yrs. 132 140 151 135 152 189 176 151 138 115
Unknown 104 133 165 137 152 135 133 176 76 57
Total 6,015 5,657 6,146 6,250 6,114 6,112 6,650 6,620 5,523 4,967
. Data is unavailable # Data is available, but specific variables or attributes are unavailable. 178

State Data System: Crash Data Report 2000–2009
Table 11: People Killed or Injured in Crashes with Drivers 16 to 20 Years Old
This table shows the number of people killed or injured in crashes where at least one driver was 16 to 20 years old. Various NHTSA reports have used either 15 to 20 or 16 to 20 years old to define teen drivers; this table uses the 16 to 20 category.
All States have the data fields required to produce this table. Most States report driver age and for the few that do not, age was derived from driver date of birth and crash date.
179

State Data System: Crash Data Report 2000–2009
Table 11: People Killed or Injured in Crashes with Drivers 16 to 20 Years Old
State Injury Severity 2000 2001 2002 2003 2004 2005 2006 2007 2008 2009
Alabama Killed Injured Total
205 212 206 206 251 237 242 13,410 13,170 13,372 13,099 13,004 12,323 11,911 13,615 13,382 13,578 13,305 13,255 12,560 12,153
199 10,650 10,849
166 9,491 9,657
137 9,285 9,422
Arkansas Killed Injured Total
128 130 117 118 157 120 134 11,684 14,417 17,153 17,820 20,019 19,359 20,460 11,812 14,547 17,270 17,938 20,176 19,479 20,594
129 13,978 14,107
109 10,068 10,177
89 7,830 7,919
California Killed Injured Total
720 790 878 802 762 826 779 75,204 76,086 77,906 74,841 72,675 70,268 64,319 75,924 76,876 78,784 75,643 73,437 71,094 65,098
660 60,944 61,604
569 52,202 52,771
472 49,102 49,574
Colorado Killed Injured Total
112 143 142 130 160 . . 11,964 11,225 13,011 11,251 11,428 . . 12,076 11,368 13,153 11,381 11,588 . .
.
.
.
.
.
.
.
.
.
Connecticut Killed Injured Total
62 79 78 59 59 49 64 12,954 12,514 12,161 11,079 10,721 9,778 9,479 13,016 12,593 12,239 11,138 10,780 9,827 9,543
65 9,295 9,360
40 8,095 8,135
33 7,691 7,724
Delaware Killed Injured Total
32 25 26 34 35 . . 3,115 3,022 2,996 2,591 2,061 . . 3,147 3,047 3,022 2,625 2,096 . .
22 1,926 1,948
21 1,811 1,832
# # #
Florida Killed Injured Total
603 586 545 585 605 690 604 60,627 60,067 57,470 55,715 55,632 57,645 53,221 61,230 60,653 58,015 56,300 56,237 58,335 53,825
644 52,269 52,913
504 45,745 46,249
382 43,669 44,051
Georgia Killed Injured Total
297 352 295 323 319 327 316 36,597 36,436 36,618 35,387 35,859 35,615 34,294 36,894 36,788 36,913 35,710 36,178 35,942 34,610
300 31,477 31,777
239 27,552 27,791
138 26,856 26,994
Illinois Killed Injured Total
283 320 315 321 258 250 255 38,165 34,873 36,186 36,643 32,607 29,549 27,930 38,448 35,193 36,501 36,964 32,865 29,799 28,185
282 25,499 25,781
167 21,756 21,923
133 21,297 21,430
Indiana Killed Injured Total
209 . . # 219 186 193 24,673 . . # 18,700 17,470 16,926 24,882 . . # 18,919 17,656 17,119
175 15,454 15,629
158 13,302 13,460
126 13,362 13,488
Iowa Killed Injured Total
. 82 84 96 80 92 92
. 10,104 8,742 7,785 7,464 7,125 6,562
. 10,186 8,826 7,881 7,544 7,217 6,654
88 6,458 6,546
69 5,988 6,057
57 5,620 5,677
Kansas Killed Injured Total
116 136 123 107 92 83 78 10,283 10,023 9,179 8,295 7,850 7,113 7,237 10,399 10,159 9,302 8,402 7,942 7,196 7,315
80 7,037 7,117
65 6,135 6,200
78 5,812 5,890
. Data is unavailable # Data is available, but specific variables or attributes are unavailable 180

State Data System: Crash Data Report 2000–2009
Table 11: People Killed or Injured in Crashes with Drivers 16 to 20 Years Old
State Injury Severity 2000 2001 2002 2003 2004 2005 2006 2007 2008 2009
Kentucky Killed Injured Total
188 184 224 163 198 180 168 16,347 14,770 14,898 13,175 12,031 11,745 11,175 16,535 14,954 15,122 13,338 12,229 11,925 11,343
140 9,870
10,010
139 8,944 9,083
133 9,135 9,268
Louisiana Killed Injured Total
. . . . . 183 184
. . . . . 23,770 21,544
. . . . . 23,953 21,728
184 20,962 21,146
141 18,993 19,134
118 14,734 14,852
Maryland Killed Injured Total
134 135 135 147 122 113 111 15,144 15,079 15,449 14,755 13,794 13,243 12,575 15,278 15,214 15,584 14,902 13,916 13,356 12,686
114 11,652 11,766
106 10,325 10,431
88 9,789 9,877
Michigan Killed Injured Total
331 285 293 262 249 221 189 35,278 32,338 32,349 30,395 28,299 24,939 22,768 35,609 32,623 32,642 30,657 28,548 25,160 22,957
233 21,549 21,782
176 19,218 19,394
158 18,728 18,886
Minnesota Killed Injured Total
157 127 151 . 142 114 112 14,918 13,961 13,575 . 12,218 11,172 10,158 15,075 14,088 13,726 . 12,360 11,286 10,270
99 9,718 9,817
70 8,637 8,707
72 8,105 8,177
Missouri Killed Injured Total
306 253 283 277 244 257 247 25,015 23,700 23,040 20,833 19,978 19,180 18,332 25,321 23,953 23,323 21,110 20,222 19,437 18,579
175 16,935 17,110
192 15,164 15,356
154 14,789 14,943
Montana Killed Injured Total
48 40 46 43 38 31 38 3,587 2,935 3,232 2,879 2,866 2,711 2,706 3,635 2,975 3,278 2,922 2,904 2,742 2,744
34 2,607 2,641
35 2,191 2,226
.
.
.
Nebraska Killed Injured Total
71 67 67 69 59 53 71 11,319 9,954 8,839 7,999 7,385 6,986 6,258 11,390 10,021 8,906 8,068 7,444 7,039 6,329
72 6,253 6,325
48 5,697 5,745
52 5,638 5,690
New Jersey Killed Injured Total
. 126 87 130 110 113 118
. 25,318 25,141 24,375 24,109 22,423 22,039
. 25,444 25,228 24,505 24,219 22,536 22,157
109 21,073 21,182
105 20,419 20,524
70 20,039 20,109
New Mexico Killed Injured Total
86 86 98 82 89 80 76 8,748 8,760 8,237 7,858 7,809 7,118 6,401 8,834 8,846 8,335 7,940 7,898 7,198 6,477
67 5,640 5,707
55 5,467 5,522
68 5,146 5,214
New York Killed Injured Total
268 . 303 254 268 212 239 55,267 . 52,893 47,414 43,466 39,277 37,424 55,535 . 53,196 47,668 43,734 39,489 37,663
232 36,343 36,575
178 34,127 34,305
194 33,218 33,412
North Carolina Killed Injured Total
255 267 300 312 346 305 289 37,565 36,648 37,268 37,167 36,665 33,663 32,796 37,820 36,915 37,568 37,479 37,011 33,968 33,085
293 31,903 32,196
253 28,832 29,085
227 28,351 28,578
. Data is unavailable # Data is available, but specific variables or attributes are unavailable 181

State Data System: Crash Data Report 2000–2009
Table 11: People Killed or Injured in Crashes with Drivers 16 to 20 Years Old
State Injury Severity 2000 2001 2002 2003 2004 2005 2006 2007 2008 2009
North Dakota Killed Injured Total
. . . 26 11 23 21
. . . 1,685 1,530 1,431 1,302
. . . 1,711 1,541 1,454 1,323
21 1,283 1,304
17 1,304 1,321
23 1,182 1,205
Ohio Killed Injured Total
320 288 318 296 289 259 238 51,642 42,196 43,522 41,571 40,527 36,588 34,517 51,962 42,484 43,840 41,867 40,816 36,847 34,755
231 30,782 31,013
210 28,662 28,872
185 28,348 28,533
Pennsylvania Killed Injured Total
304 348 . 331 320 279 279 35,194 30,928 . 29,579 29,014 26,757 24,247 35,498 31,276 . 29,910 29,334 27,036 24,526
305 22,449 22,754
238 20,538 20,776
223 19,847 20,070
South Carolina Killed Injured Total
162 208 198 181 187 178 179 10,575 9,468 9,829 9,413 9,307 9,106 9,112 10,737 9,676 10,027 9,594 9,494 9,284 9,291
186 8,945 9,131
134 8,295 8,429
142 8,677 8,819
Texas Killed Injured Total
868 891 . 805 748 668 693 102,927 101,018 . 82,868 78,107 76,582 69,579 103,795 101,909 . 83,673 78,855 77,250 70,272
642 68,043 68,685
637 60,419 61,056
541 58,460 59,001
Utah Killed Injured Total
88 68 73 72 56 . . 11,771 11,496 11,228 10,358 10,334 . . 11,859 11,564 11,301 10,430 10,390 . .
.
.
.
.
.
.
.
.
.
Virginia Killed Injured Total
211 205 213 178 193 151 197 23,462 23,524 21,883 20,433 20,319 19,453 18,905 23,673 23,729 22,096 20,611 20,512 19,604 19,102
176 17,046 17,222
171 16,884 17,055
121 14,932 15,053
Washington Killed Injured Total
101 151 155 122 125 106 140 8,297 20,916 19,788 17,233 17,212 17,505 16,103 8,398 21,067 19,943 17,355 17,337 17,611 16,243
109 14,607 14,716
80 12,442 12,522
87 11,543 11,630
Wisconsin Killed Injured Total
200 154 205 189 147 167 151 22,637 19,299 19,590 18,296 17,272 16,017 14,692 22,837 19,453 19,795 18,485 17,419 16,184 14,843
156 14,388 14,544
114 12,258 12,372
90 11,225 11,315
Wyoming Killed Injured Total
25 27 34 23 28 22 31 1,951 1,864 2,076 1,820 1,809 1,749 1,919 1,976 1,891 2,110 1,843 1,837 1,771 1,950
22 1,820 1,842
21 1,417 1,438
33 1,264 1,297
. Data is unavailable # Data is available, but specific variables or attributes are unavailable 182

State Data System: Crash Data Report 2000–2009
Table 12: People Killed or Injured in Crashes with Drivers 65 to 98 Years Old
This table shows the number of people killed or injured in crashes where at least one driver was 65 to 98 years old. For a number of States, it appears that 99 is used as both an age and unknown (at times disregarding PAR manual instructions) and therefore the maximum driver age for these tables is 98.
For the few States that do not report driver age, it was derived from driver date of birth and the crash date.
183

State Data System: Crash Data Report 2000–2009
Table 12: People Killed or Injured in Crashes With Drivers 65 to 98 Years Old State Injury Severity 2000 2001 2002 2003 2004 2005 2006 2007 2008 2009
Alabama Killed
Injured
Total
136 155 143 133 168 164 151
6,293 6,232 6,361 6,243 6,366 6,053 5,832
6,429 6,387 6,504 6,376 6,534 6,217 5,983
163
5,582
5,745
111
4,959
5,070
143
5,322
5,465
Arkansas Killed
Injured
Total
112 99 95 90 127 109 89
5,594 7,133 7,747 8,536 9,544 9,711 10,246
5,706 7,232 7,842 8,626 9,671 9,820 10,335
92
7,301
7,393
96
5,293
5,389
96
4,961
5,057
California Killed
Injured
Total
520 475 493 569 504 497 489
37,537 37,971 38,505 37,385 36,042 34,084 33,016
38,057 38,446 38,998 37,954 36,546 34,581 33,505
491
32,670
33,161
418
30,401
30,819
404
30,801
31,205
Colorado Killed
Injured
Total
83 74 80 70 74 . .
4,072 3,756 4,564 4,202 4,474 . .
4,155 3,830 4,644 4,272 4,548 . .
.
.
.
.
.
.
.
.
.
Connecticut Killed
Injured
Total
56 46 53 36 40 46 47
7,218 6,992 6,641 6,280 5,974 5,772 5,369
7,274 7,038 6,694 6,316 6,014 5,818 5,416
53
5,451
5,504
45
5,132
5,177
28
5,319
5,347
Delaware Killed
Injured
Total
20 23 16 28 32 . .
1,541 1,486 1,395 1,197 939 . .
1,561 1,509 1,411 1,225 971 . .
12
1,146
1,158
17
1,137
1,154
#
#
#
Florida Killed
Injured
Total
573 618 597 597 595 588 580
41,839 41,516 39,829 38,246 37,992 38,198 35,218
42,412 42,134 40,426 38,843 38,587 38,786 35,798
530
34,088
34,618
489
33,700
34,189
472
34,696
35,168
Georgia Killed
Injured
Total
268 262 252 242 277 277 257
15,347 16,020 15,426 15,769 16,068 16,146 15,389
15,615 16,282 15,678 16,011 16,345 16,423 15,646
234
14,980
15,214
231
14,123
14,354
240
16,260
16,500
Illinois Killed
Injured
Total
221 236 220 264 197 229 164
16,905 16,031 16,165 16,777 15,485 14,237 14,043
17,126 16,267 16,385 17,041 15,682 14,466 14,207
189
13,802
13,991
170
13,020
13,190
157
12,693
12,850
Indiana Killed
Injured
Total
140 . . # 150 147 143
10,203 . . # 8,684 8,481 8,192
10,343 . . # 8,834 8,628 8,335
159
7,481
7,640
125
6,972
7,097
126
7,061
7,187
. Data is unavailable # Data is available, but specific variables or attributes are unavailable 184

State Data System: Crash Data Report 2000–2009
Table 12: People Killed or Injured in Crashes With Drivers 65 to 98 Years Old State Injury Severity 2000 2001 2002 2003 2004 2005 2006 2007 2008 2009 Iowa Killed
Injured
Total
. 89 74 99 82 101 108
. 4,574 3,944 3,677 3,798 3,624 3,304
. 4,663 4,018 3,776 3,880 3,725 3,412
93
3,236
3,329
89
3,240
3,329
70
3,095
3,165
Kansas Killed
Injured
Total
87 98 85 79 82 73 101
4,002 4,011 3,669 3,241 3,173 2,977 2,907
4,089 4,109 3,754 3,320 3,255 3,050 3,008
61
2,986
3,047
69
2,847
2,916
79
2,672
2,751
Kentucky Killed
Injured
Total
116 127 157 158 139 158 168
6,710 6,406 6,270 6,116 5,974 5,651 5,618
6,826 6,533 6,427 6,274 6,113 5,809 5,786
151
5,240
5,391
128
5,099
5,227
147
5,309
5,456
Louisiana Killed
Injured
Total
. . . . . 101 97
. . . . . 9,906 9,618
. . . . . 10,007 9,715
100
9,675
9,775
99
9,530
9,629
120
10,028
10,148
Maryland Killed
Injured
Total
102 113 107 108 103 96 111
7,205 7,695 7,811 7,636 7,065 6,856 7,075
7,307 7,808 7,918 7,744 7,168 6,952 7,186
79
6,731
6,810
84
6,518
6,602
101
6,634
6,735
Michigan Killed
Injured
Total
239 236 213 246 210 192 185
15,818 14,737 14,813 13,935 13,582 12,794 11,886
16,057 14,973 15,026 14,181 13,792 12,986 12,071
198
12,007
12,205
207
11,388
11,595
177
11,519
11,696
Minnesota Killed
Injured
Total
117 106 114 . 111 90 88
5,682 5,468 5,183 . 5,189 4,691 4,396
5,799 5,574 5,297 . 5,300 4,781 4,484
104
4,816
4,920
95
4,589
4,684
84
4,648
4,732
Missouri Killed
Injured
Total
193 195 203 208 166 206 177
10,400 10,020 9,960 9,503 9,222 8,891 8,595
10,593 10,215 10,163 9,711 9,388 9,097 8,772
168
8,302
8,470
163
7,764
7,927
157
7,652
7,809
Montana Killed
Injured
Total
37 29 44 36 34 38 44
1,411 1,194 1,308 1,273 1,273 1,302 1,191
1,448 1,223 1,352 1,309 1,307 1,340 1,235
39
1,284
1,323
31
1,183
1,214
.
.
.
Nebraska Killed
Injured
Total
61 47 55 48 50 48 54
3,637 3,587 3,038 2,887 2,876 2,613 2,543
3,698 3,634 3,093 2,935 2,926 2,661 2,597
55
2,535
2,590
43
2,416
2,459
38
2,514
2,552
. Data is unavailable # Data is available, but specific variables or attributes are unavailable 185

State Data System: Crash Data Report 2000–2009
Table 12: People Killed or Injured in Crashes With Drivers 65 to 98 Years Old State Injury Severity 2000 2001 2002 2003 2004 2005 2006 2007 2008 2009
New Jersey Killed
Injured
Total
. 147 122 133 131 129 127
. 15,276 15,762 15,213 15,127 14,335 14,395
. 15,423 15,884 15,346 15,258 14,464 14,522
131
14,382
14,513
115
14,659
14,774
131
14,716
14,847
New Mexico Killed
Injured
Total
64 61 44 51 78 59 50
3,699 3,583 3,718 3,527 3,659 3,326 2,935
3,763 3,644 3,762 3,578 3,737 3,385 2,985
58
2,787
2,845
51
2,966
3,017
63
2,752
2,815
New York Killed
Injured
Total
221 . 225 259 273 236 254
31,069 . 31,309 29,559 27,886 26,500 25,508
31,290 . 31,534 29,818 28,159 26,736 25,762
211
25,626
25,837
235
25,145
25,380
193
25,596
25,789
North Carolina Killed
Injured
Total
272 256 226 284 270 228 257
18,862 18,622 18,047 18,234 17,556 16,288 16,283
19,134 18,878 18,273 18,518 17,826 16,516 16,540
276
16,473
16,749
218
15,964
16,182
215
15,830
16,045
North Dakota Killed
Injured
Total
. . . 24 25 20 16
. . . 716 693 604 580
. . . 740 718 624 596
12
558
570
14
629
643
29
635
664
Ohio Killed
Injured
Total
235 238 255 209 215 223 220
23,207 20,357 20,414 19,807 19,786 18,615 17,863
23,442 20,595 20,669 20,016 20,001 18,838 18,083
208
17,440
17,648
220
16,656
16,876
178
16,737
16,915
Pennsylvania Killed
Injured
Total
266 288 . 280 270 308 253
20,053 18,126 . 17,030 16,885 16,202 14,563
20,319 18,414 . 17,310 17,155 16,510 14,816
269
14,310
14,579
258
13,801
14,059
276
14,273
14,549
South Carolina Killed
Injured
Total
169 128 159 128 111 151 149
5,193 4,812 4,966 5,103 4,830 4,872 4,823
5,362 4,940 5,125 5,231 4,941 5,023 4,972
125
4,716
4,841
123
4,753
4,876
123
5,111
5,234
Texas Killed
Injured
Total
497 516 . 482 517 440 421
36,386 36,530 . 31,530 30,563 30,963 29,614
36,883 37,046 . 32,012 31,080 31,403 30,035
420
28,716
29,136
417
27,591
28,008
386
27,002
27,388
Utah Killed
Injured
Total
43 46 43 43 38 . .
3,279 3,141 3,322 3,225 3,192 . .
3,322 3,187 3,365 3,268 3,230 . .
.
.
.
.
.
.
.
.
.
. Data is unavailable # Data is available, but specific variables or attributes are unavailable 186

State Data System: Crash Data Report 2000–2009
Table 12: People Killed or Injured in Crashes With Drivers 65 to 98 Years Old State Injury Severity 2000 2001 2002 2003 2004 2005 2006 2007 2008 2009 Virginia Killed
Injured
Total
137 176 138 183 162 157 161
9,892 10,221 9,811 9,979 9,885 9,739 9,595
10,029 10,397 9,949 10,162 10,047 9,896 9,756
160
9,000
9,160
127
9,464
9,591
135
8,908
9,043
Washington Killed
Injured
Total
69 89 98 109 95 89 72
3,326 8,034 7,801 7,404 7,689 7,702 7,460
3,395 8,123 7,899 7,513 7,784 7,791 7,532
73
7,433
7,506
85
6,970
7,055
67
6,793
6,860
Wisconsin Killed
Injured
Total
170 126 136 140 146 143 103
9,026 8,436 8,337 7,755 7,903 7,490 7,168
9,196 8,562 8,473 7,895 8,049 7,633 7,271
112
7,093
7,205
121
6,697
6,818
106
6,425
6,531
Wyoming Killed
Injured
Total
21 29 24 19 13 27 26
583 604 572 662 616 705 636
604 633 596 681 629 732 662
17
648
665
23
579
602
18
525
543
. Data is unavailable # Data is available, but specific variables or attributes are unavailable 187

State Data System: Crash Data Report 2000–2009
Table 13: Pedestrians Involved in Crashes by Pedestrian Action
This table identifies the number of pedestrians involved in crashes, grouped by pedestrian action prior to the first harmful event. Although some States include other non‐motorists in the pedestrian action category, this table is limited to actions by pedestrians only.
Pedestrian action can be categorized into seven broad categories.
Crossing Roadway Walking With Traffic Walking Against Traffic In Roadway—Other Going to or From School Other Unknown
However, the attributes associated with pedestrian action vary considerably from State to State, and—to preserve meaningful detail—different pedestrian action categories are shown in this table for various States.
The “other” category in this table includes actions that the States categorize as “other” and also categories that only a small number of States identify, such as “working on vehicle.”
Of the 23 States that code pedestrian action, 10 States have a separate attribute that indicates whether or not the pedestrian was walking to or from school. The definition of “school” is largely undefined by the States. Also, some States have very disaggregated school‐related categories such as “entering or crossing behind a school bus” and “approaching or leaving a school bus.” In the following table, all school‐related pedestrian activities were grouped into “walking to/from school.”
188

State Data System: Crash Data Report 2000–2009
Table 13: Pedestrians Involved in Crashes by Pedestrian Action
State Pedestrian Action 2000 2001 2002 2003 2004 2005 2006 2007 2008 2009 Arkansas Crossing Roadway 91 203 146 176 189 159 173 161 154 176
WalkingWith Traffic 34 25 46 41 35 57 27 45 48 42
Walking Against Traffic 7 9 8 10 15 5 10 8 7 11
In Roadway ‐ Other 43 61 85 79 81 78 69 65 65 76
Going To or From School 1 0 2 1 3 0 1 5 2 2
Other 77 85 102 103 114 127 144 133 135 112
Unknown 196 120 138 177 126 78 94 66 49 39
Total 449 503 527 587 563 504 518 483 460 458
Colorado Crossing Roadway
Walking With Traffic
Walking Against Traffic
In Roadway ‐ Other
Other
Unknown
Total
661 737 668 555 692 . . . . .
35 22 29 28 23 . . . . .
21 14 17 14 17 . . . . .
94 104 129 89 145 . . . . .
135 173 170 161 266 . . . . .
677 709 695 722 776 . . . . .
1,623 1,759 1,708 1,569 1,919 . . . . .
Connecticut Crossing Roadway 843 857 783 732 683 729 694 837 732 750
Walking With/Against Traffic 99 120 104 122 88 87 80 93 114 108
In Roadway ‐ Other 82 79 64 54 52 51 79 75 71 52
Working in Trafficway 15 9 13 6 10 7 10 16 10 8
Going To or From School 4 2 5 1 6 3 0 0 3 4
Other 327 367 283 314 274 276 266 321 293 294
Total 1,370 1,434 1,252 1,229 1,113 1,153 1,129 1,342 1,223 1,216
Delaware Crossing Roadway
Walking With/Against Traffic
In Roadway ‐ Other
Other
Unknown
Total
212 194 177 151 190 . . 103 124 148
36 12 12 19 19 . . 203 206 224
87 95 64 70 47 . . 61 82 49
4 2 4 0 1 . . 33 25 26
0 0 0 0 0 . . 5 5 7
339 303 257 240 257 . . 405 442 454
. Data is unavailable # Data is available, but specific variables or attributes are unavailable 189

State Data System: Crash Data Report 2000–2009
Table 13: Pedestrians Involved in Crashes by Pedestrian Action
State Pedestrian Action 2000 2001 2002 2003 2004 2005 2006 2007 2008 2009 Florida Crossing Roadway 4,784 4,680 3,908 3,639 3,593 3,826 3,834 3,752 3,963 3,930
Walking With Traffic 445 450 477 487 511 550 520 494 561 555
Walking Against Traffic 189 172 200 186 211 203 192 165 228 203
In Roadway ‐ Other 663 729 746 715 777 702 649 627 647 583
Other 2,790 2,911 3,044 3,139 3,140 3,401 3,079 3,038 3,259 3,299
Unknown 0 0 151 271 306 459 565 549 282 169
Total 8,871 8,942 8,526 8,437 8,538 9,141 8,839 8,625 8,940 8,739
Georgia Crossing Roadway
Walking With Traffic
Walking Against Traffic
In Roadway ‐ Other
Other
Total
1,335 1,454 1,325 1,356 1,296 1,263 1,232 1,199 1,119 #
176 185 185 161 201 218 207 191 205 #
65 73 85 96 77 88 94 87 82 #
325 346 334 376 392 506 549 533 528 #
581 493 632 541 466 489 460 464 437 #
2,482 2,551 2,561 2,530 2,432 2,564 2,542 2,474 2,371 #
Illinois Crossing Roadway 1,952 1,926 1,989 1,807 1,566 1,465 1,707 1,785 1,704 1,534
Walking With Traffic 252 243 254 232 296 352 427 466 427 337
Walking Against Traffic 344 316 332 337 318 335 389 415 344 329
In Roadway ‐ Other 2,125 2,061 1,882 1,624 1,424 1,268 1,462 1,361 1,250 1,126
Going To or From School 10 11 14 6 8 6 15 11 13 9
Other 1,523 1,463 1,517 1,432 1,330 1,191 1,410 1,380 1,268 1,177
None 92 86 111 144 85 97 150 129 149 151
Unknown 674 633 647 657 1,130 1,516 1,654 2,383 2,844 1,850
Total 6,972 6,739 6,746 6,239 6,157 6,230 7,214 7,930 7,999 6,513
Indiana Crossing Roadway
Walking With Traffic
Walking Against Traffic
In Roadway ‐ Other
Going To or From School
Other
Unknown
Total
881 . . 261 203 216 431 637 729 638
84 . . 7 5 11 22 33 32 39
60 . . 8 14 11 25 41 32 36
283 . . 422 338 347 402 612 612 616
7 . . 7 2 2 2 7 4 0
484 . . 175 154 181 239 385 463 374
134 . . 811 869 839 523 124 25 15
1,933 . . 1,691 1,585 1,607 1,644 1,839 1,897 1,718
. Data is unavailable # Data is available, but specific variables or attributes are unavailable 190

State Data System: Crash Data Report 2000–2009
Table 13: Pedestrians Involved in Crashes by Pedestrian Action
State Pedestrian Action 2000 2001 2002 2003 2004 2005 2006 2007 2008 2009 Iowa Crossing Roadway
Walking With/Against Traffic
In Roadway ‐ Other
Other
Unknown
Total
. 203 233 236 232 234 221 267 226 205
. 127 156 141 147 134 156 155 145 144
. 68 53 71 73 70 56 72 87 77
. 48 54 52 56 45 48 56 37 40
. 124 82 60 36 30 30 26 26 30
. 570 578 560 544 513 511 576 521 496
Kansas Crossing Roadway 317 331 290 286 252 290 244 261 237 124
Walking With/Against Traffic 68 84 84 90 77 86 88 92 83 178
In Roadway ‐ Other 116 122 141 118 110 105 86 102 69 71
Going To or From School 0 0 0 0 0 0 0 0 0 26
Other 28 51 36 34 35 38 42 43 31 31
Unknown 19 22 15 12 17 4 7 9 14 14
Total 548 610 566 540 491 523 467 507 434 444
Louisiana Crossing Roadway
Walking With Traffic
Walking Against Traffic
In Roadway ‐ Other
Other
Unknown
Total
. . . . . 667 548 568 701 688
. . . . . 121 98 139 151 157
. . . . . 46 45 58 77 64
. . . . . 225 187 177 207 188
. . . . . 136 130 114 167 164
. . . . . 297 201 274 260 235
. . . . . 1,492 1,209 1,330 1,563 1,496
Maryland Crossing Roadway 1,793 1,830 1,844 1,736 1,637 1,750 1,765 1,801 1,816 1,630
Walking With Traffic 204 160 157 204 187 180 192 156 172 180
Walking Against Traffic 196 165 152 198 165 168 194 156 102 119
In Roadway ‐ Other 628 603 570 707 555 619 555 574 482 471
Going To or From School 9 8 4 15 6 10 6 7 6 5
Other 181 128 90 68 75 78 91 90 105 127
Unknown 278 329 323 381 375 366 372 334 345 418
Total 3,289 3,223 3,140 3,309 3,000 3,171 3,175 3,118 3,028 2,950
. Data is unavailable # Data is available, but specific variables or attributes are unavailable 191

State Data System: Crash Data Report 2000–2009
Table 13: Pedestrians Involved in Crashes by Pedestrian Action
State Pedestrian Action 2000 2001 2002 2003 2004 2005 2006 2007 2008 2009 Michigan Crossing Roadway 1,559 1,118 1,335 1,588 1,494 1,368 1,379 1,277 1,215 1,154
Walking With Traffic 161 102 162 142 164 159 171 183 175 162
Walking Against Traffic 65 24 50 42 55 46 47 30 45 43
In Roadway ‐ Other 460 367 425 480 415 444 396 354 350 350
Other 281 189 258 278 298 238 220 224 227 252
Unknown 380 369 456 421 459 442 416 367 314 302
Total 2,906 2,169 2,686 2,951 2,885 2,697 2,629 2,435 2,326 2,263
Missouri Crossing Roadway 521 529 799 763 685 720 700 739 757 727
Walking With Traffic 93 85 68 65 94 87 91 82 85 73
Walking Against Traffic 54 65 77 69 72 98 79 76 76 72
In Roadway ‐ Other 953 940 598 519 537 544 458 437 448 406
Other 81 77 107 95 127 100 94 104 100 74
Unknown 146 123 136 140 130 112 127 121 118 172
Total 1,848 1,819 1,785 1,651 1,645 1,661 1,549 1,559 1,584 1,524
Montana Crossing Roadway
Walking With Traffic
Walking Against Traffic
In Roadway ‐ Other
Going To or From School
Other
Unknown
Total
87 91 94 92 77 95 94 74 87 .
5 11 7 18 11 7 8 15 11 .
1 3 4 6 9 2 4 4 2 .
69 57 64 43 54 45 43 42 46 .
0 3 0 0 2 0 1 0 0 .
11 12 19 13 10 11 9 18 14 .
2 2 6 2 3 4 3 6 14 .
175 179 194 174 166 164 162 159 174 .
New Jersey Crossing Roadway
Walking With Traffic
Walking Against Traffic
In Roadway ‐ Other
Going To or From School
Other
Unknown
Total
. 3,660 3,810 3,623 3,703 3,568 2,200 2,202 2,307 2,461
. 195 157 206 192 212 129 126 148 170
. 87 80 80 109 69 74 84 114 112
. 1,011 939 963 867 885 784 780 699 780
. 19 8 11 14 13 117 115 95 130
. 981 939 897 912 985 714 736 808 939
. 1,043 1,138 1,222 1,172 1,015 2,873 2,784 2,748 2,320
. 6,996 7,071 7,002 6,969 6,747 6,891 6,827 6,919 6,912
. Data is unavailable # Data is available, but specific variables or attributes are unavailable 192

State Data System: Crash Data Report 2000–2009
Table 13: Pedestrians Involved in Crashes by Pedestrian Action
State Pedestrian Action 2000 2001 2002 2003 2004 2005 2006 2007 2008 2009 New Mexico Crossing Roadway 147 212 208 160 195 206 215 224 187 191
Walking With Traffic 28 36 35 35 31 40 34 29 32 33
Walking Against Traffic 16 19 24 17 21 23 21 22 12 20
Other 81 87 81 81 132 76 97 81 67 98
Unknown 152 206 176 209 151 122 147 152 235 183
Total 424 560 524 502 530 467 514 508 533 525
North Carolina Crossing Roadway 622 565 523 565 576 527 546 657 598 550
Walking With Traffic 233 279 281 240 277 249 299 299 285 278
Walking Against Traffic 168 205 182 174 198 188 176 190 181 168
In Roadway ‐ Other 519 472 476 522 497 461 407 410 375 360
Other 265 265 253 277 303 271 246 251 268 203
Unknown 38 17 21 29 40 39 35 22 13 19
Total 1,845 1,803 1,736 1,807 1,891 1,735 1,709 1,829 1,720 1,578
Pennsylvania Crossing Roadway
Walking With /Against Traffic
In Roadway ‐ Other
Going To or From School
Other
Unknown
Total
195 1,205 . 1,625 1,646 1,571 1,552 1,477 1,403 1,450
4,242 2,921 . 2,039 1,799 1,671 1,550 1,700 1,663 1,553
744 705 627 590 529 543 557 468 470
5 # # # # # # # #
356 62 0 0 0 397 341 330 296
218 570 940 1,133 1,198 943 1,047 692 634
5,760 5,463 5,231 5,168 4,969 4,985 5,122 4,556 4,403
Utah Crossing Roadway
Walking With Traffic
Walking Against Traffic
In Roadway ‐ Other
Going To or From School
Other
Unknown
Total
21 19 26 28 29 . . . . .
13 16 13 10 23 . . . . .
8 12 14 19 20 . . . . .
177 184 147 125 169 . . . . .
14 12 9 9 20 . . . . .
32 29 22 24 23 . . . . .
14 24 210 86 36 . . . . .
785 752 880 676 739 . . . . .
. Data is unavailable # Data is available, but specific variables or attributes are unavailable 193

State Data System: Crash Data Report 2000–2009
Table 13: Pedestrians Involved in Crashes by Pedestrian Action
State Pedestrian Action 2000 2001 2002 2003 2004 2005 2006 2007 2008 2009 Virginia Crossing Roadway 900 860 823 793 812 796 872 800 850 739
Walking With Traffic 114 139 124 137 133 141 131 122 114 68
Walking Against Traffic 58 67 45 82 58 46 44 46 49 36
In Roadway ‐ Other 226 255 214 200 226 182 193 171 299 224
Going To or From School 9 9 7 8 8 9 8 11 6 11
Other 467 567 486 527 514 459 495 451 381 310
Unknown 255 297 289 247 229 231 263 248 75 98
Total 2,029 2,194 1,988 1,994 1,980 1,864 2,006 1,849 1,774 1,486
Washington Crossing Roadway
Walking With Traffic
Walking Against Traffic
In Roadway ‐ Other
Other
Unknown
Total
# 1,120 1,337 1,356 1,305 1,418 1,571 1,473 1,472 1,410
# 47 63 64 61 60 64 69 66 81
# 29 77 71 62 68 68 71 76 53
# 158 200 194 205 203 201 191 207 232
# 195 355 437 347 375 350 321 327 269
# 278 10 5 14 12 1 37 5 3
# 1,827 2,042 2,127 1,994 2,136 2,255 2,162 2,153 2,048
Wyoming Crossing Roadway
Walking With Traffic
Walking Against Traffic
In Roadway ‐ Other
Other
Unknown
Total
30 30 27 32 53 44 # # 53 41
5 4 7 4 5 9 # # 13 14
2 2 0 2 2 1 # # 7 5
47 40 40 41 34 53 # # 19 12
13 18 24 16 21 14 # # 0 0
1 1 1 1 1 2 # # 10 12
98 95 99 96 116 123 # # 102 84
. Data is unavailable # Data is available, but specific variables or attributes are unavailable 194

State Data System: Crash Data Report 2000–2009
Table 14: Pedestrians Involved in Crashes by Pedestrian Location
Only 8 SDS States have variables that describe non‐motorists’ location prior to the first harmful event. Although some States include other non‐motorists in the pedestrian action category, this table is limited to actions by pedestrians only. The attributes for this variable vary considerably from State to State and resulted in some of the differences in categories seen in this table.
Pedestrian location can be broadly categorized into the following categories.
Intersection – Marked Crosswalk Intersection – Unmarked Crosswalk Midblock – Marked Crosswalk Travel Lane – Other Location Bicycle Lane Shoulder/Roadside Sidewalk Median/X‐ing Island Driveway Access Shared Use Path/Trail Non‐Trafficway Other Unknown
Of the 8 States that code pedestrian location, 3 have a separate attribute for “bicycle lane.” Because this table is limited to pedestrians, the counts are sparse for this category.
195

State Data System: Crash Data Report 2000–2009
Table 14: Pedestrians Involved in Crashes by Pedestrian Location
State Pedestrian Location 2000 2001 2002 2003 2004 2005 2006 2007 2008 2009
Illinois Intersection ‐Marked Cross Walk 1,596 1,559 1,709 1,568 1,497 1,499 1,747 1,767 1,798 1,765
Intersection ‐ Unmarked Cross Walk 403 381 398 403 313 303 293 282 271 285
Intersection ‐ Other 205 212 225 208 164 153 161 178 164 146
Travel Lane ‐ Other Location 3,744 3,647 3,401 3,059 2,802 2,575 3,019 3,002 2,748 2,368
Bicycle Lane 0 0 0 0 0 0 0 1 0 2
Driveway Access 116 102 132 105 91 97 102 97 116 103
Non‐Trafficway 283 243 277 268 242 205 301 268 243 238
Unknown 625 595 604 628 1,048 1,398 1,591 2,335 2,659 1,606
Total 6,972 6,739 6,746 6,239 6,157 6,230 7,214 7,930 7,999 6,513
Kansas Intersection ‐Marked Cross Walk 97 87 90 100 97 95 113 114 83 75
Intersection ‐ Unmarked Cross Walk 49 51 47 42 46 50 44 46 43 53
Intersection ‐ Other 60 52 61 80 58 66 72 75 51 57
Travel Lane ‐ Other Location 296 351 304 253 222 265 200 209 199 193
Non‐Trafficway 24 42 47 42 43 36 31 47 34 41
Other 1 0 1 2 1 3 0 0 0 4
Unknown 21 27 16 21 24 8 7 16 24 21
Total 548 610 566 540 491 523 467 507 434 444
Maryland Intersection ‐Marked Cross Walk 471 530 503 546 530 590 622 599 672 648
Travel Lane ‐ Other Location 1,987 1,901 1,948 2,015 1,702 1,799 1,736 1,741 1,660 1,602
Bicycle Lane 2 3 6 2 6 4 3 6 1 9
Shoulder/Roadside 353 322 249 240 255 226 210 232 258 249
Sidewalk 135 135 119 113 111 150 171 143 134 165
Other 150 161 128 188 152 175 220 180 170 165
Unknown 191 171 187 205 244 227 213 217 133 112
Total 3,289 3,223 3,140 3,309 3,000 3,171 3,175 3,118 3,028 2,950
. Data is unavailable # Data is available, but specific variables or attributes are unavailable 196

State Data System: Crash Data Report 2000–2009
Table 14: Pedestrians Involved in Crashes by Pedestrian Location
State Pedestrian Location 2000 2001 2002 2003 2004 2005 2006 2007 2008 2009
Nebraska Intersection ‐Marked Cross Walk
Intersection ‐ Unmarked Cross Walk
Intersection ‐ Other
Travel Lane ‐ Other Location
Shoulder/Roadside
Sidewalk
Median/X‐ing Island
Driveway Access
Shared Use Path/Trail
Non‐Trafficway
Unknown
Total
# # 90 61 68 53 46 65 66 47
# # 12 8 4 4 2 2 6 3
# # 36 29 21 25 25 34 23 31
# # 154 146 141 111 114 140 117 126
# # 17 6 5 10 6 10 7 7
# # 9 20 16 13 11 17 23 8
# # 5 1 2 4 1 4 2 5
# # 3 1 3 6 3 8 6 0
# # 1 2 1 1 0 3 0 1
# # 15 10 13 8 3 14 12 11
# # 174 200 172 151 189 153 161 165
# # 516 484 446 386 400 450 423 404
Ohio Intersection ‐Marked Cross Walk 765 271 527 490 454 458 553 460 540 562
Intersection ‐ Unmarked Cross Walk 609 95 179 182 165 187 184 171 181 187
Midblock ‐Marked Cross Walk 35 28 26 26 30 26 24 33 37 34
Travel Lane ‐ Other Location 1,335 568 1,219 1,210 1,105 1,174 1,207 1,059 1,179 1,088
Shoulder/Roadside 71 39 72 84 72 99 103 84 84 104
Sidewalk 142 35 84 65 62 81 68 47 71 76
Median/X‐ing Island 9 2 9 10 9 5 3 10 13 4
Driveway Access 26 11 26 23 21 21 19 21 23 27
Shared Use Path/Trail 6 4 6 5 5 5 4 5 3 1
Non‐Trafficway 66 31 56 67 46 60 65 60 51 64
Unknown 313 2,408 1,022 850 915 752 683 633 561 498
Total 3,377 3,492 3,226 3,012 2,884 2,868 2,913 2,583 2,743 2,645
. Data is unavailable # Data is available, but specific variables or attributes are unavailable 197

State Data System: Crash Data Report 2000–2009
Table 14: Pedestrians Involved in Crashes by Pedestrian Location
State Pedestrian Location 2000 2001 2002 2003 2004 2005 2006 2007 2008 2009
Pennsylvania Intersection ‐Marked Cross Walk
Intersection ‐ Unmarked Cross Walk
Midblock ‐Marked Cross Walk
Travel Lane ‐ Other Location
Shoulder/Roadside
Sidewalk
Median/X‐ing Island
Driveway Access
Shared Use Path/Trail
Non‐Trafficway
Unknown
Total
# 0 . 761 558 441
# 217 . 277 257 213
# 0 . 69 55 57
# 1,462 . 2,122 1,669 1,524
# 104 . 181 116 162
# 68 . 74 78 46
# 8 . 11 13 10
# 0 . 61 37 34
# 0 . 0 0 0
# 61 . 100 56 94
# 3,543 . 1,575 2,329 2,388
# 5,463 . 5,231 5,168 4,969
506
231
0
1,658
145
73
7
29
5
100
2,231
4,985
568
247
0
1,832
171
81
12
41
9
86
2,075
5,122
687
294
0
1,645
152
70
15
38
3
139
1,513
4,556
708
258
0
1,702
176
80
13
53
10
180
1,223
4,403
Washington Intersection ‐Marked Cross Walk
Intersection ‐ Unmarked Cross Walk
Travel Lane ‐ Other Location
Bicycle Lane
Shoulder/Roadside
Sidewalk
Other
Unknown
Total
# 561 700 726 700 760
# 163 189 202 236 243
# 642 744 698 686 766
# 1 1 3 1 3
# 66 129 134 131 126
# 65 127 142 130 120
# 56 144 220 106 117
# 273 8 2 4 1
# 1,827 2,042 2,127 1,994 2,136
886
291
739
2
127
103
106
1
2,255
841
275
702
4
117
114
77
32
2,162
849
294
693
6
141
97
71
2
2,153
832
269
706
2
101
87
51
0
2,048
. Data is unavailable # Data is available, but specific variables or attributes are unavailable 198

State Data System: Crash Data Report 2000–2009
Table 14: Pedestrians Involved in Crashes by Pedestrian Location
State Pedestrian Location 2000 2001 2002 2003 2004 2005 2006 2007 2008 2009
Wisconsin Intersection ‐Marked Cross Walk
Intersection ‐ Unmarked Cross Walk
502 450 530 521 469 473
1,006 935 834 818 786 801
503
824
491
767
469
741
432
686
Sidewalk 68 102 84 81 73 72 73 66 87 71
Non‐Trafficway 373 323 311 312 295 317 328 349 268 240
Unknown 924 918 851 825 719 710 677 671 616 548
Total 2,873 2,728 2,610 2,557 2,342 2,373 2,405 2,344 2,181 1,977
. Data is unavailable # Data is available, but specific variables or attributes are unavailable 199

State Data System: Crash Data Report 2000–2009
Table 15: People Killed or Injured in Alcohol‐Related Crashes
This table identifies killed or injured in alcohol related crashes. Injury severity attributes from Table 9 “people Killed or Injured in Motor Vehicle Crashes by Person Type” and alcohol‐related attributes from Table 2 “Alcohol‐Related Crashes by Crash Severity and Crash Type” were used to create this table.
200

State Data System: Crash Data Report 2000–2009
Table 15: People Killed or Injured in Alcohol‐Related Crashes
State Injury Severity 2000 2001 2002 2003 2004 2005 2006 2007 2008 2009
Alabama Killed
Injured
265
4,651
240 238 237 257 249
4,398 4,413 4,066 4,087 4,079
271
4,262
296
3,834
237
3,460
214
3,063
Arkansas Killed
Injured
204
3,612
213 242 273 269 247
5,243 4,164 4,449 4,604 4,680
309
4,708
276
3,478
194
2,589
177
2,537
California Killed
Injured
1,428
32,479
1,541 1,539 1,586 1,615 1,732
33,443 34,010 33,316 33,605 32,975
1,746
33,069
1,621
32,750
1,435
30,178
1,328
27,962
Colorado Killed
Injured
187
5,527
228 218 190 190 .
5,505 5,298 4,581 4,593 .
.
.
.
.
.
.
.
.
Connecticut Killed
Injured
128
1,705
151 126 127 106 103
1,680 1,458 1,474 1,395 1,390
114
1,326
120
1,310
114
1,250
113
1,467
Delaware Killed
Injured
61
1,239
67 47 63 52 .
1,226 1,231 1,034 934 .
.
.
48
662
50
655
44
549
Florida Killed
Injured
979
19,775
1,000 1,007 1,096 1,095 1,239
20,001 16,867 17,384 17,584 17,784
1,101
16,320
1,252
16,306
1,006
15,540
1,008
14,150
Georgia Killed
Injured
383
9,716
422 331 421 210 182
10,130 10,020 9,829 9,006 8,707
174
8,585
172
8,602
184
8,293
132
6,616
Illinois Killed
Injured
514
9,878
498 541 541 538 459
8,996 9,473 10,141 9,348 8,957
500
8,722
479
8,356
422
7,519
353
6,839
Indiana Killed
Injured
241
6,977
. . # 247 271
. . # 6,394 6,382
273
5,699
248
4,796
239
4,228
170
3,775
Iowa Killed
Injured
.
.
118 131 123 86 100
1,845 1,728 1,732 1,816 1,796
120
2,146
114
1,911
89
1,752
104
1,674
. Data is unavailable # Data is available, but specific variables or attributes are unavailable 201
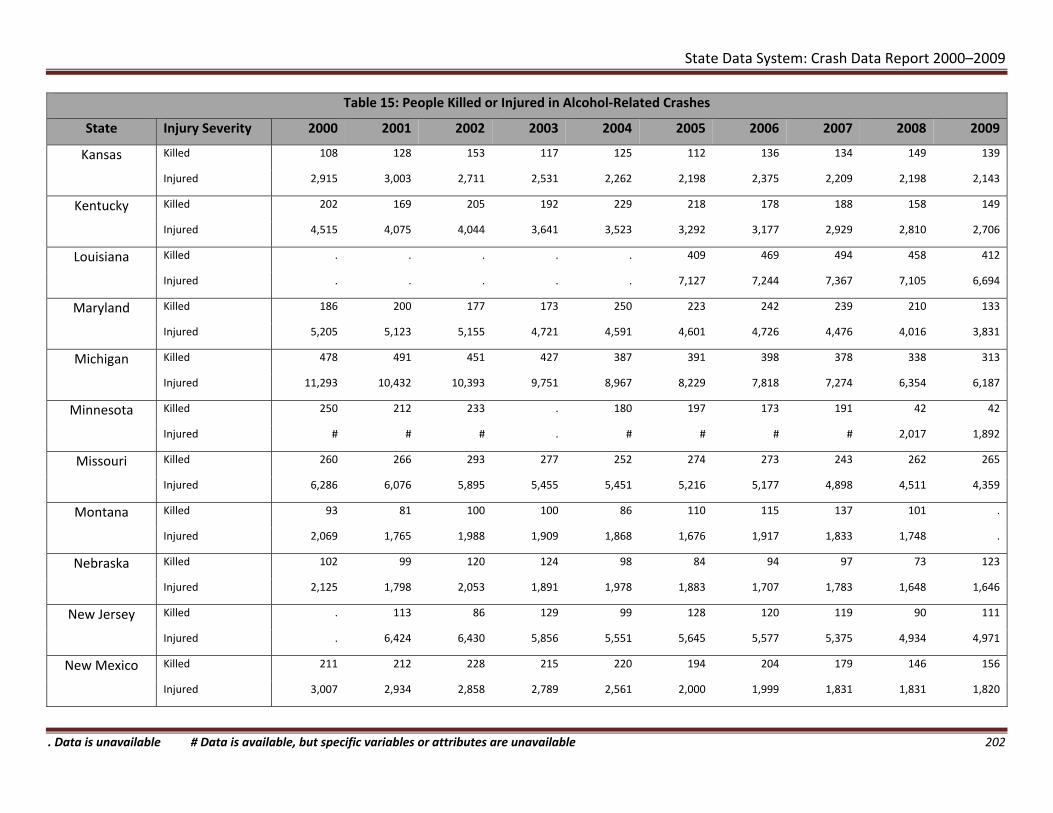
State Data System: Crash Data Report 2000–2009
Table 15: People Killed or Injured in Alcohol‐Related Crashes
State Injury Severity 2000 2001 2002 2003 2004 2005 2006 2007 2008 2009
Kansas Killed
Injured
108
2,915
128 153 117 125 112
3,003 2,711 2,531 2,262 2,198
136
2,375
134
2,209
149
2,198
139
2,143
Kentucky Killed
Injured
202
4,515
169 205 192 229 218
4,075 4,044 3,641 3,523 3,292
178
3,177
188
2,929
158
2,810
149
2,706
Louisiana Killed
Injured
.
.
. . . . 409
. . . . 7,127
469
7,244
494
7,367
458
7,105
412
6,694
Maryland Killed
Injured
186
5,205
200 177 173 250 223
5,123 5,155 4,721 4,591 4,601
242
4,726
239
4,476
210
4,016
133
3,831
Michigan Killed
Injured
478
11,293
491 451 427 387 391
10,432 10,393 9,751 8,967 8,229
398
7,818
378
7,274
338
6,354
313
6,187
Minnesota Killed
Injured
250
#
212 233 . 180 197
# # . # #
173
#
191
#
42
2,017
42
1,892
Missouri Killed
Injured
260
6,286
266 293 277 252 274
6,076 5,895 5,455 5,451 5,216
273
5,177
243
4,898
262
4,511
265
4,359
Montana Killed
Injured
93
2,069
81 100 100 86 110
1,765 1,988 1,909 1,868 1,676
115
1,917
137
1,833
101
1,748
.
.
Nebraska Killed
Injured
102
2,125
99 120 124 98 84
1,798 2,053 1,891 1,978 1,883
94
1,707
97
1,783
73
1,648
123
1,646
New Jersey Killed
Injured
.
.
113 86 129 99 128
6,424 6,430 5,856 5,551 5,645
120
5,577
119
5,375
90
4,934
111
4,971
New Mexico Killed
Injured
211
3,007
212 228 215 220 194
2,934 2,858 2,789 2,561 2,000
204
1,999
179
1,831
146
1,831
156
1,820
. Data is unavailable # Data is available, but specific variables or attributes are unavailable 202

State Data System: Crash Data Report 2000–2009
Table 15: People Killed or Injured in Alcohol‐Related Crashes
State Injury Severity
Killed
Injured
2000 2001 2002 2003 2004 2005 2006 2007 2008 2009
New York 333
9,012
. 251 204 213 210
. 8,694 7,489 7,440 7,180
182
6,955
178
6,851
165
6,534
170
6,512
North Carolina Killed
Injured
490
13,067
404 414 403 433 442
12,838 12,006 10,652 10,824 10,447
400
9,742
511
10,087
448
9,928
409
9,323
North Dakota Killed
Injured
.
.
. . 53 28 45
. . 739 701 685
47
641
62
610
45
573
53
615
Ohio Killed
Injured
368
14,352
424 531 475 486 487
12,309 12,696 11,609 11,466 11,382
502
10,418
476
9,566
462
9,166
398
8,536
Pennsylvania Killed
Injured
520
13,469
569 . 539 532 565
12,883 . 12,506 12,548 11,809
534
10,393
519
10,340
518
9,192
458
8,551
South Carolina Killed
Injured
184
3,742
555 748 697 886 753
4,854 4,453 3,979 4,128 4,070
634
4,033
771
4,288
661
4,175
621
4,248
Texas Killed
Injured
1,224
26,167
1,128 . 1,053 913 802
25,553 . 24,106 23,034 21,685
953
20,950
1,001
20,669
1,023
19,798
964
19,132
Utah Killed
Injured
71
1,848
49 42 30 41 .
1,758 1,876 1,546 1,372 .
.
.
.
.
.
.
.
.
Virginia Killed
Injured
356
8,251
358 375 361 343 322
8,211 8,465 7,819 7,911 7,512
374
7,543
378
7,130
218
6,915
187
6,189
Washington Killed
Injured
118
2,577
244 290 240 236 269
6,330 6,342 5,741 5,899 6,190
277
6,264
240
5,772
234
5,262
244
5,238
Wisconsin Killed
Injured
301
7,027
306 294 348 326 331
6,782 6,758 6,620 6,397 6,180
306
5,841
338
5,715
235
4,444
240
3,901
. Data is unavailable # Data is available, but specific variables or attributes are unavailable 203

State Data System: Crash Data Report 2000–2009
Table 15: People Killed or Injured in Alcohol‐Related Crashes
State Injury Severity 2000 2001 2002 2003 2004 2005 2006 2007 2008 2009
Wyoming Killed 42 79 63 60 56 62 70 50 79 58
Injured 720 651 785 718 676 732 805 763 806 755
. Data is unavailable # Data is available, but specific variables or attributes are unavailable 204

State Data System: Crash Data Report 2000–2009
Table 16: Restraint and Helmet Use for Motorists Killed or Injured in Crashes
This table counts motorists killed or injured and their restraint or helmet use at the time of the crashes.
The following categories are used for this table.
Restraint used Restraint not used Helmet used Helmet not used Unknown.
Restraint and helmet use were derived from variables such as “restraint use,” “safety equipment use,” and “helmet use.” The category “restraint used” includes all types of restraints such as lap/shoulder belts, child safety seats, and child booster seats. Air bag availability and deployment are not considered in this table because of the variety and complexity of State coding for air bags.
Motorcycle helmet used/not used is reported for motorcycle and moped operators only (i.e., pedalcyclists or other non‐motorists are excluded from these counts). For most States it is not possible to distinguish between certified and non‐certified motorcycle helmets for the years covered by this report.
Non‐motorists—including people in parked vehicles—were excluded from this table.
205

State Data System: Crash Data Report 2000–2009
Table 16: Restraint and Helmet Use for Motorists Killed or Injured in Crashes
State Injury Severity
Restraint/Helmet 2000 2001 2002 2003 2004 2005 2006 2007 2008 2009
Alabama Killed
Injured
Restraint Used
Restraint Not Used
Helmet Used
Helmet Not Used
Unknown
Total
Restraint Used
Restraint Not Used
Helmet Used
Helmet Not Used
Unknown
Total
297 369 356 347 409 371
528 450 501 468 530 561
40 38 40 45 69 59
3 5 5 7 7 3
36 35 44 40 32 45
904 897 946 907 1,047 1,039
33,353 34,379 35,813 35,405 36,552 35,221
7,534 6,172 6,027 5,536 5,902 5,814
656 733 745 891 982 1,231
42 44 47 64 67 90
761 736 609 660 682 627
42,346 42,064 43,241 42,556 44,185 42,983
374
568
98
7
38
1,085
33,757
6,030
1,289
95
603
41,774
349
535
75
8
38
1,005
31,208
5,418
1,299
76
450
38,451
287
450
86
11
24
858
28,177
4,410
1,366
85
434
34,472
#
#
#
#
#
#
#
#
#
#
#
#
Arkansas Killed
Injured
Restraint Used
Restraint Not Used
Helmet Used
Helmet Not Used
Unknown
Total
Restraint Used
Restraint Not Used
Helmet Used
Helmet Not Used
Unknown
Total
150 138 157 146 168 155
370 344 353 326 371 321
6 12 10 17 22 29
26 28 30 38 35 36
44 37 39 62 63 61
596 559 589 589 659 602
24,050 33,515 38,929 42,150 49,346 50,581
9,218 7,208 6,688 6,486 6,906 6,383
153 364 345 401 558 673
402 437 476 467 581 720
3,079 3,581 4,321 4,457 5,564 5,100
36,902 45,105 50,759 53,961 62,955 63,457
147
310
19
56
75
607
55,519
6,186
699
681
5,209
68,294
157
280
31
43
79
590
36,314
6,601
713
704
4,567
48,899
113
288
28
38
64
531
21,595
7,882
706
775
4,875
35,833
155
267
25
37
57
541
19,561
5,638
#
647
4,000
29,846
. Data is unavailable # Data is available, but specific variables or attributes are unavailable 206

State Data System: Crash Data Report 2000–2009
Table 16: Restraint and Helmet Use for Motorists Killed or Injured in Crashes
State Injury Severity
Restraint/Helmet 2000 2001 2002 2003 2004 2005 2006 2007 2008 2009
California Killed Restraint Used 1,129 1,174 1,154 1,092 1,309 1,395 1,352 1,361 1,065 1,074
Restraint Not Used 847 922 1,005 879 901 949 936 858 740 667
Helmet Used 211 252 278 293 294 343 340 369 416 321
Helmet Not Used 46 31 28 35 34 34 45 40 39 34
Unknown 393 350 313 411 361 352 289 278 228 176
Total 2,626 2,729 2,778 2,710 2,899 3,073 2,962 2,906 2,488 2,272
Injured Restraint Used 213,223 214,525 214,438 193,705 186,892 182,519 171,744 175,081 158,830 158,491
Restraint Not Used 14,674 14,404 14,053 12,038 11,394 11,074 11,862 9,649 8,703 6,209
Helmet Used 5,840 6,908 7,376 7,703 7,521 7,286 7,727 8,692 8,905 8,333
Helmet Not Used 841 517 532 588 593 463 488 435 469 397
Unknown 16,461 15,438 12,213 14,986 17,589 13,598 11,629 10,331 8,912 7,347
Total 251,039 251,792 248,612 229,020 223,989 214,940 203,450 204,188 185,819 180,777
Colorado Killed
Injured
Restraint Used
Restraint Not Used
Helmet Used
Helmet Not Used
Unknown
Total
Restraint Used
Restraint Not Used
Helmet Used
Helmet Not Used
Unknown
Total
203 221 197 193 214 . . . . .
343 367 390 285 281 . . . . .
0 2 0 0 1 . . . . .
50 55 47 36 49 . . . . .
22 39 30 32 42 . . . . .
618 684 664 546 587 . . . . .
38,891 38,366 38,379 34,243 35,736 . . . . .
8,113 7,655 6,927 5,325 5,098 . . . . .
64 74 78 83 88 . . . . .
1,000 991 1,156 1,072 1,123 . . . . .
1,314 1,427 1,352 1,205 1,262 . . . . .
49,382 48,513 47,892 41,928 43,307 . . . . .
. Data is unavailable # Data is available, but specific variables or attributes are unavailable 207

State Data System: Crash Data Report 2000–2009
Table 16: Restraint and Helmet Use for Motorists Killed or Injured in Crashes
State Injury Severity
Restraint/Helmet 2000 2001 2002 2003 2004 2005 2006 2007 2008 2009
Connecticut Killed Restraint Used 83 89 76 85 83 78 92 94 74 55
Restraint Not Used 118 110 109 100 93 88 68 84 72 69
Helmet Used 17 12 14 7 20 15 23 19 22 21
Helmet Not Used 16 16 17 15 20 17 20 10 25 8
Unknown 54 51 54 50 37 38 62 46 54 46
Total 288 278 270 257 253 236 265 253 247 199
Injured Restraint Used 35,708 34,812 33,704 32,750 32,504 30,674 28,731 29,435 27,020 27,527
Restraint Not Used 5,057 4,528 3,605 2,972 2,596 2,261 2,058 1,886 1,566 1,513
Helmet Used 330 437 404 390 453 444 466 597 617 477
Helmet Not Used 321 355 315 314 325 381 346 385 378 306
Unknown 7,258 7,687 6,745 6,398 6,301 5,801 5,338 5,495 4,805 4,733
Total 48,674 47,819 44,773 42,824 42,179 39,561 36,939 37,798 34,386 34,556
Delaware Killed
Injured
Restraint Used
Restraint Not Used
Helmet Used
Helmet Not Used
Unknown
Total
Restraint Used
Restraint Not Used
Helmet Used
Helmet Not Used
Unknown
Total
28 39 36 50 54 . . 41 39 27
65 67 63 59 50 . . 35 30 41
2 4 3 6 5 . . 6 7 5
3 5 4 5 5 . . 9 9 9
7 3 1 4 4 . . 6 11 5
105 118 107 124 118 . . 97 96 87
7,534 7,350 7,692 6,921 6,177 . . 5,848 5,566 5,547
1,515 1,439 1,238 960 571 . . 479 401 341
78 68 67 92 62 . . 232 183 151
32 44 69 45 43 . . 97 93 87
712 592 501 508 369 . . 406 443 461
9,871 9,493 9,567 8,526 7,222 . . 7,062 6,686 6,587
. Data is unavailable # Data is available, but specific variables or attributes are unavailable 208

State Data System: Crash Data Report 2000–2009
Table 16: Restraint and Helmet Use for Motorists Killed or Injured in Crashes
State Injury Severity
Restraint/Helmet 2000 2001 2002 2003 2004 2005 2006 2007 2008 2009
Florida Killed Restraint Used 676 740 814 852 819 866 793 748 700 622
Restraint Not Used 1,317 1,217 1,078 1,142 1,170 1,294 1,150 1,073 892 758
Helmet Used 175 118 108 174 215 273 337 322 284 218
Helmet Not Used 64 142 180 175 207 211 222 237 189 150
Unknown 23 32 35 23 7 4 5 19 69 51
Total 2,255 2,249 2,215 2,366 2,418 2,648 2,507 2,399 2,134 1,799
Injured Restraint Used 169,922 175,971 175,167 169,089 173,258 179,932 163,684 163,689 151,226 152,651
Restraint Not Used 37,503 33,142 26,802 25,041 24,596 24,424 22,096 20,643 17,120 15,296
Helmet Used 3,366 2,825 2,811 3,504 3,827 4,704 5,279 5,467 5,852 5,057
Helmet Not Used 1,944 3,076 3,345 3,698 3,881 4,131 4,157 4,144 3,863 3,543
Unknown 858 862 654 644 1,086 802 818 1,002 1,287 1,059
Total 213,593 215,876 208,779 201,976 206,648 213,993 196,034 194,945 179,348 177,606
Georgia Killed Restraint Used 459 508 476 515 518 526 514 501 429 421 Restraint Not Used 663 616 602 602 633 701 660 657 583 478 Helmet Used 50 74 70 90 98 124 124 142 160 111 Helmet Not Used 7 18 7 12 7 14 17 20 14 20 Unknown 183 234 165 165 181 170 176 135 121 209 Total 1,362 1,450 1,320 1,384 1,437 1,535 1,491 1,455 1,307 1,239
Injured Restraint Used 94,713 96,629 98,635 99,580 102,514 103,456 99,167 95,543 87,910 96,723 Restraint Not Used 11,584 10,570 9,600 8,771 9,398 9,449 9,086 8,630 7,632 7,282 Helmet Used 1,309 1,610 1,567 1,888 2,188 2,423 2,698 2,866 3,071 2,558 Helmet Not Used 189 228 199 268 297 293 305 347 340 314 Unknown 18,606 19,089 18,367 18,369 19,285 19,058 17,843 15,908 12,869 12,412 Total 126,401 128,126 128,368 128,876 133,682 134,679 129,099 123,294 111,822 119,289
. Data is unavailable # Data is available, but specific variables or attributes are unavailable 209

State Data System: Crash Data Report 2000–2009
Table 16: Restraint and Helmet Use for Motorists Killed or Injured in Crashes
State Injury Severity
Restraint/Helmet 2000 2001 2002 2003 2004 2005 2006 2007 2008 2009
Illinois Killed Restraint Used 339 331 335 372 458 447 386 367 324 308
Restraint Not Used 525 524 550 489 456 472 493 411 349 274
Helmet Used 13 19 20 20 29 29 29 27 27 24
Helmet Not Used 76 86 48 84 2 9 88 111 94 91
Unknown 244 224 238 270 214 204 78 118 74 70
Total 1,197 1,184 1,191 1,235 1,159 1,161 1,074 1,034 868 767
Injured Restraint Used 91,635 85,625 90,070 95,114 89,154 80,210 78,183 75,130 68,656 65,124
Restraint Not Used 12,501 10,939 10,205 8,861 6,847 5,708 5,482 4,772 4,074 3,793
Helmet Used 315 425 438 512 625 609 576 773 789 803
Helmet Not Used 889 890 973 1,007 1,161 1,187 1,025 1,334 1,411 1,335
Unknown 14,559 13,505 13,679 14,525 12,504 13,122 10,655 9,477 8,987 8,764
Total 119,899 111,384 115,365 120,019 110,291 100,836 95,921 91,486 83,917 79,819
Indiana Killed
Injured
Restraint Used
Restraint Not Used
Helmet Used
Helmet Not Used
Unknown
Total
Restraint Used
Restraint Not Used
Helmet Used
Helmet Not Used
Unknown
Total
257 . . # 304 305 276 305 268 249
379 . . # 339 346 320 299 269 210
15 . . # 27 20 19 31 31 21
51 . . # 77 90 84 87 91 85
75 . . # 103 92 100 98 75 63
777 . . # 850 853 799 820 734 628
46,330 . . # 45,645 43,615 40,935 39,569 37,320 36,037
12,150 . . # 6,937 6,401 5,839 4,539 3,264 3,057
412 . . # 736 631 751 716 819 665
1,240 . . # 1,371 1,393 1,547 1,838 1,923 1,633
2,484 . . # 4,030 4,405 3,771 2,733 2,662 2,597
62,616 . . # 58,719 56,445 52,843 49,395 45,988 43,989
. Data is unavailable # Data is available, but specific variables or attributes are unavailable 210

State Data System: Crash Data Report 2000–2009
Table 16: Restraint and Helmet Use for Motorists Killed or Injured in Crashes
State Injury Severity
Restraint/Helmet 2000 2001 2002 2003 2004 2005 2006 2007 2008 2009
Iowa Killed
Injured
Restraint Used
Restraint Not Used
Helmet Used
Helmet Not Used
Unknown
Total
Restraint Used
Restraint Not Used
Helmet Used
Helmet Not Used
Unknown
Total
. 126 109 142 125 158 165 155 129 129
. 131 152 148 137 136 129 156 145 126
. 3 5 8 9 13 8 9 7 9
. 26 35 42 29 34 50 53 48 48
. 107 80 69 52 68 50 38 47 28
. 393 381 409 352 409 402 411 376 340
. 12,896 12,623 13,770 13,954 13,627 12,798 13,623 13,416 12,176
. 2,179 2,117 2,023 2,155 1,858 1,726 1,638 1,536 1,275
. 110 121 187 191 242 213 274 317 281
. 439 438 590 635 700 645 741 726 636
. 11,065 8,136 5,510 4,999 5,033 4,414 3,963 3,942 3,471
. 26,689 23,435 22,080 21,934 21,460 19,796 20,239 19,937 17,839
Kansas Killed Restraint Used 113 101 121 112 137 105 145 133 95 112
Restraint Not Used 233 271 246 227 205 192 172 161 169 139
Helmet Used 3 6 6 10 8 7 18 14 11 14
Helmet Not Used 6 8 18 13 8 8 24 18 14 12
Unknown 63 56 66 38 50 58 44 46 50 41
Total 418 442 457 400 408 370 403 372 339 318
Injured Restraint Used 18,648 18,912 18,096 16,991 16,460 15,985 15,624 16,571 15,101 14,172
Restraint Not Used 6,416 6,003 5,247 4,446 4,027 3,468 3,234 2,861 2,544 2,365
Helmet Used 166 157 163 203 263 284 303 379 401 366
Helmet Not Used 218 217 240 258 282 283 287 265 314 269
Unknown 2,385 2,255 2,070 1,697 1,533 1,496 1,678 1,612 1,627 1,395
Total 27,833 27,544 25,816 23,595 22,565 21,516 21,126 21,688 19,987 18,567
. Data is unavailable # Data is available, but specific variables or attributes are unavailable 211

State Data System: Crash Data Report 2000–2009
Table 16: Restraint and Helmet Use for Motorists Killed or Injured in Crashes
State Injury Severity
Restraint/Helmet 2000 2001 2002 2003 2004 2005 2006 2007 2008 2009
Kentucky Killed Restraint Used 238 226 289 275 304 291 256 288 239 278
Restraint Not Used 427 476 490 518 524 516 475 396 388 364
Helmet Used 16 19 15 22 25 31 32 41 41 36
Helmet Not Used 14 37 28 36 47 60 71 76 61 54
Unknown 26 9 9 9 8 4 1 1 0 0
Total 721 767 831 860 908 902 835 802 729 732
Injured Restraint Used 38,016 36,503 35,870 34,954 33,311 32,532 30,981 30,070 29,269 29,959
Restraint Not Used 11,071 9,570 9,331 8,239 7,716 7,252 6,545 5,008 4,381 4,147
Helmet Used 442 472 457 517 597 634 683 790 868 737
Helmet Not Used 335 465 481 558 659 711 687 845 879 816
Unknown 981 807 1,150 687 878 638 383 300 149 100
Total 50,845 47,817 47,289 44,955 43,161 41,767 39,279 37,013 35,546 35,759
Louisiana Killed
Injured
Restraint Used
Restraint Not Used
Helmet Used
Helmet Not Used
Unknown
Total
Restraint Used
Restraint Not Used
Helmet Used
Helmet Not Used
Unknown
Total
. . . . . 249 271 244 220 195
. . . . . 388 435 443 402 354
. . . . . 55 83 71 61 82
. . . . . 18 10 17 20 20
. . . . . 101 50 70 69 41
. . . . . 811 849 845 772 692
. . . . . 61,401 59,972 59,334 57,608 56,403
. . . . . 5,581 5,621 5,294 4,882 4,569
. . . . . 1,186 1,313 1,350 1,500 1,356
. . . . . 181 188 198 191 165
. . . . . 9,990 9,010 8,964 8,233 8,286
. . . . . 78,339 76,104 75,140 72,414 70,779
. Data is unavailable # Data is available, but specific variables or attributes are unavailable 212

State Data System: Crash Data Report 2000–2009
Table 16: Restraint and Helmet Use for Motorists Killed or Injured in Crashes
State Injury Severity
Restraint/Helmet 2000 2001 2002 2003 2004 2005 2006 2007 2008 2009
Maryland Killed Restraint Used 207 229 256 199 223 189 256 200 195 189
Restraint Not Used 142 161 135 135 111 113 122 103 106 88
Helmet Used 44 43 44 53 56 74 71 82 77 58
Helmet Not Used 7 9 4 2 9 9 9 9 8 12
Unknown 32 26 31 28 36 21 38 35 24 31
Total 432 468 470 417 435 406 496 429 410 378
Injured Restraint Used 38,606 38,873 39,672 39,964 37,577 35,911 40,919 39,112 36,331 36,015
Restraint Not Used 4,542 4,123 3,559 3,272 2,910 2,586 2,844 2,451 2,359 2,048
Helmet Used 722 791 808 873 1,006 1,181 1,231 1,236 1,224 1,146
Helmet Not Used 156 165 158 186 211 208 235 219 233 343
Unknown 5,546 5,815 4,780 3,509 3,531 3,287 3,566 3,695 3,491 3,157
Total 49,572 49,767 48,977 47,804 45,235 43,173 48,795 46,713 43,638 42,709
Michigan Killed Restraint Used 499 464 470 476 450 454 428 429 347 303
Restraint Not Used 417 391 340 352 307 272 254 262 252 203
Helmet Used 62 65 68 61 70 85 96 99 101 91
Helmet Not Used 8 5 3 5 3 7 4 4 12 8
Unknown 160 174 166 157 133 129 110 115 97 96
Total 1,146 1,099 1,047 1,051 963 947 892 909 809 701
Injured Restraint Used 93,345 85,316 83,368 81,394 80,673 73,177 65,837 64,856 59,822 57,163
Restraint Not Used 9,586 7,981 7,409 6,395 5,411 4,604 4,044 3,675 3,316 3,264
Helmet Used 1,798 1,870 1,799 1,911 1,906 2,239 2,166 2,503 2,837 2,347
Helmet Not Used 95 99 89 96 81 103 120 139 147 159
Unknown 10,453 9,621 12,279 9,451 6,286 5,555 5,178 4,784 4,123 3,959
Total 115,277 104,887 104,944 99,247 94,357 85,678 77,345 75,957 70,245 66,892
. Data is unavailable # Data is available, but specific variables or attributes are unavailable 213

State Data System: Crash Data Report 2000–2009
Table 16: Restraint and Helmet Use for Motorists Killed or Injured in Crashes
State Injury Severity
Restraint/Helmet 2000 2001 2002 2003 2004 2005 2006 2007 2008 2009
Minnesota Killed
Injured
Restraint Used
Restraint Not Used
Helmet Used
Helmet Not Used
Unknown
Total
Restraint Used
Restraint Not Used
Helmet Used
Helmet Not Used
Unknown
Total
155 149 212 . 213 211 167 195 170 148
281 246 289 . 232 215 190 193 144 127
6 9 6 . 15 18 15 11 12 11
29 30 30 . 29 34 53 45 53 37
86 68 48 . 23 19 16 18 23 34
557 502 585 . 512 497 441 462 402 357
27,304 26,312 25,255 . 29,881 28,495 26,049 26,613 25,294 23,943
6,718 5,853 5,589 . 4,073 3,344 3,163 2,784 2,512 1,867
326 398 366 . 433 418 486 561 548 467
531 561 557 . 494 539 554 528 576 439
6,417 5,828 5,807 . 2,929 2,697 2,701 2,604 2,412 2,266
41,296 38,952 37,574 . 37,810 35,493 32,953 33,090 31,342 28,982
Missouri Killed Restraint Used 272 249 264 293 272 315 240 249 218 221
Restraint Not Used 616 582 666 635 620 623 575 477 492 427
Helmet Used 35 41 47 73 45 70 78 70 89 65
Helmet Not Used 7 5 7 4 9 14 12 14 13 18
Unknown 120 117 93 115 84 106 85 73 61 50
Total 1,050 994 1,077 1,120 1,030 1,128 990 883 873 781
Injured Restraint Used 49,416 48,579 47,695 46,272 46,546 45,443 42,738 41,725 38,037 37,399
Restraint Not Used 15,558 14,007 13,863 11,894 11,334 10,331 9,276 8,560 7,688 7,226
Helmet Used 931 1,081 1,100 1,267 1,435 1,583 1,692 1,786 1,867 1,783
Helmet Not Used 68 71 64 72 121 128 148 184 171 180
Unknown 7,457 7,162 6,973 6,802 6,448 6,288 5,732 5,259 4,931 4,841
Total 73,430 70,900 69,695 66,307 65,884 63,773 59,586 57,514 52,694 51,429
. Data is unavailable # Data is available, but specific variables or attributes are unavailable 214

State Data System: Crash Data Report 2000–2009
Table 16: Restraint and Helmet Use for Motorists Killed or Injured in Crashes
State Injury Severity
Restraint/Helmet 2000 2001 2002 2003 2004 2005 2006 2007 2008 2009
Montana Killed
Injured
Restraint Used
Restraint Not Used
Helmet Used
Helmet Not Used
Unknown
Total
Restraint Used
Restraint Not Used
Helmet Used
Helmet Not Used
Unknown
Total
64 58 58 69 48 52
124 138 161 148 134 143
6 4 10 3 9 13
7 8 14 9 12 15
10 6 7 7 8 6
211 214 250 236 211 229
6,309 5,337 6,044 5,934 5,609 5,700
2,570 2,053 2,291 1,980 1,871 1,745
134 92 136 143 171 184
179 161 144 192 191 201
1,189 987 1,035 1,011 1,060 1,017
10,381 8,630 9,650 9,260 8,902 8,847
66
146
15
11
9
247
5,944
1,687
197
235
1,012
9,075
56
154
15
18
10
253
5,765
1,578
229
222
900
8,694
48
120
14
18
8
208
5,206
1,448
204
210
927
7,995
.
.
.
.
.
.
.
.
.
.
.
.
Nebraska Killed
Injured
Restraint Used
Restraint Not Used
Helmet Used
Helmet Not Used
Unknown
Total
Restraint Used
Restraint Not Used
Helmet Used
Helmet Not Used
Unknown
Total
57 58 66 71 72 68
155 115 159 147 110 146
# # 11 10 15 14
# # 3 2 4 3
31 45 38 37 33 32
243 221 277 267 234 263
21,055 18,454 15,433 14,880 14,750 13,832
5,141 4,622 3,860 3,307 2,850 2,709
# # 228 289 318 356
# # 38 30 32 35
1,936 2,369 2,545 2,268 2,334 2,006
28,133 25,470 22,104 20,774 20,284 18,938
75
135
13
2
23
248
12,820
2,418
387
37
1,952
17,614
71
115
10
3
37
236
13,028
2,280
397
29
2,248
17,982
64
90
16
4
18
192
12,163
2,027
466
49
2,080
16,785
59
106
10
4
23
202
12,174
2,120
408
32
1,830
16,564
. Data is unavailable # Data is available, but specific variables or attributes are unavailable 215

State Data System: Crash Data Report 2000–2009
Table 16: Restraint and Helmet Use for Motorists Killed or Injured in Crashes
State Injury Severity
Restraint/Helmet 2000 2001 2002 2003 2004 2005 2006 2007 2008 2009
New Jersey Killed
Injured
Restraint Used
Restraint Not Used
Helmet Used
Helmet Not Used
Unknown
Total
Restraint Used
Restraint Not Used
Helmet Used
Helmet Not Used
Unknown
Total
. 248 228 327 311 355 300 323 256 251
. 182 140 152 125 117 144 121 79 59
. 53 31 46 62 47 74 68 67 55
. 4 5 4 5 5 7 12 10 9
. 22 20 30 31 38 19 16 18 17
. 509 424 559 534 562 544 540 430 391
. 92,595 94,843 92,559 91,637 86,825 82,805 80,974 79,307 79,362
. 6,865 6,208 5,289 4,346 3,667 3,750 3,043 2,750 2,680
. 1,657 1,667 1,611 1,869 1,887 1,837 2,013 2,065 1,784
. 197 167 169 169 133 197 190 228 164
. 2,936 2,570 2,245 2,245 1,773 995 882 981 991
. 104,250 105,455 101,873 100,266 94,285 89,584 87,102 85,331 84,981
New Mexico Killed Restraint Used 104 115 113 100 153 161 159 127 129 143
Restraint Not Used 91 109 83 125 154 71 26 33 21 36
Helmet Used 10 9 9 9 8 0 0 0 1 0
Helmet Not Used 21 23 25 27 33 36 28 34 38 32
Unknown 17 17 26 18 51 51 70 51 51 34
Total 243 273 256 279 399 319 283 245 240 245
Injured Restraint Used 22,474 22,975 21,934 21,069 22,396 20,067 18,686 17,093 17,114 15,973
Restraint Not Used 1,872 1,578 1,580 1,434 1,089 714 292 164 187 264
Helmet Used 175 233 253 274 279 242 114 77 104 127
Helmet Not Used 303 384 423 535 569 637 796 790 924 702
Unknown 910 783 685 503 504 736 897 799 596 691
Total 25,734 25,953 24,875 23,815 24,837 22,396 20,785 18,923 18,925 17,757
. Data is unavailable # Data is available, but specific variables or attributes are unavailable 216

State Data System: Crash Data Report 2000–2009
Table 16: Restraint and Helmet Use for Motorists Killed or Injured in Crashes
State Injury Severity
Restraint/Helmet 2000 2001 2002 2003 2004 2005 2006 2007 2008 2009
New York Killed
Injured
Restraint Used
Restraint Not Used
Helmet Used
Helmet Not Used
Unknown
Total
Restraint Used
Restraint Not Used
Helmet Used
Helmet Not Used
Unknown
Total
424 . 433 443 496 399 405 411 346 340
347 . 315 277 248 218 231 184 146 123
83 . 103 120 122 131 154 142 139 134
26 . 26 20 16 19 22 24 29 16
112 . 162 153 129 135 106 98 98 75
992 . 1,039 1,013 1,011 902 918 859 758 688
199,872 . 177,936 162,197 149,428 141,305 134,491 133,877 128,228 128,588
21,757 . 13,981 11,278 9,518 8,239 7,406 6,868 6,411 6,148
2,779 . 2,962 3,015 3,272 3,655 3,515 3,923 3,882 3,654
170 . 735 708 681 653 564 598 551 499
43,153 . 33,382 31,945 25,910 21,215 18,410 17,470 16,707 16,020
267,731 . 228,996 209,143 188,809 175,067 164,386 162,736 155,779 154,909
North Killed Restraint Used 507 540 544 619 593 539 586 609 517 528
Carolina Restraint Not Used 605 564 605 545 529 529 537 555 491 428
Helmet Used 81 93 106 94 117 137 134 184 150 142
Helmet Not Used 10 11 11 10 12 12 13 13 17 15
Unknown 158 124 106 102 124 112 77 122 66 51
Total 1,361 1,332 1,372 1,370 1,375 1,329 1,347 1,483 1,241 1,164
Injured Restraint Used 118,222 113,457 113,306 114,941 113,439 105,239 101,530 101,182 94,543 93,049
Restraint Not Used 13,373 11,167 11,002 10,099 9,005 8,120 7,587 7,028 6,115 5,700
Helmet Used 2,054 2,130 2,175 2,358 2,753 2,977 3,280 3,602 4,060 3,529
Helmet Not Used 237 224 233 263 289 293 310 333 355 335
Unknown 3,995 3,779 3,535 3,653 3,945 3,872 4,038 3,889 3,724 3,738
Total 137,881 130,757 130,251 131,314 129,431 120,501 116,745 116,034 108,797 106,351
. Data is unavailable # Data is available, but specific variables or attributes are unavailable 217

State Data System: Crash Data Report 2000–2009
Table 16: Restraint and Helmet Use for Motorists Killed or Injured in Crashes
State Injury Severity
Restraint/Helmet 2000 2001 2002 2003 2004 2005 2006 2007 2008 2009
North Killed Restraint Used . . . 16 24 25 33 28 19 40
Dakota
Injured
Restraint Not Used
Helmet Used
Helmet Not Used
Unknown
Total
Restraint Used
Restraint Not Used
Helmet Used
Helmet Not Used
Unknown
Total
. . . 66 54 67 64 60 58 81
. . . 0 3 1 0 1 3 0
. . . 3 6 4 3 3 10 7
. . . 7 5 6 3 11 4 3
. . . 92 92 103 103 103 94 131
. . . 2,917 2,934 2,705 2,565 2,663 2,718 2,881
. . . 1,100 896 832 789 695 636 663
. . . 53 44 56 61 61 83 65
. . . 61 71 87 88 102 107 82
. . . 386 406 449 408 417 461 525
. . . 4,517 4,351 4,129 3,911 3,938 4,005 4,216
Ohio Killed Restraint Used 376 383 414 372 368 410 373 358 324 265
Restraint Not Used 579 638 637 550 537 517 457 479 420 395
Helmet Used 21 31 32 36 37 46 41 64 59 35
Helmet Not Used 84 86 104 100 90 129 110 118 143 122
Unknown 114 106 110 88 100 102 113 88 100 75
Total 1,174 1,244 1,297 1,146 1,132 1,204 1,094 1,107 1,046 892
Injured Restraint Used 123,182 104,530 108,596 109,371 109,192 101,818 95,633 90,826 87,881 84,585
Restraint Not Used 19,628 16,773 16,573 14,193 13,072 12,024 10,658 9,482 8,950 8,330
Helmet Used 1,019 1,192 1,061 1,184 1,352 1,365 1,402 1,708 1,821 1,505
Helmet Not Used 1,387 1,836 1,892 1,915 2,015 2,171 1,866 2,099 2,118 1,931
Unknown 11,644 7,524 7,953 7,709 7,880 7,585 7,418 6,754 6,119 5,786
Total 156,860 131,855 136,075 134,372 133,511 124,963 116,977 110,869 106,889 102,137
. Data is unavailable # Data is available, but specific variables or attributes are unavailable 218

State Data System: Crash Data Report 2000–2009
Table 16: Restraint and Helmet Use for Motorists Killed or Injured in Crashes
State Injury Severity
Restraint/Helmet 2000 2001 2002 2003 2004 2005 2006 2007 2008 2009
Pennsylvania Killed
Injured
Restraint Used
Restraint Not Used
Helmet Used
Helmet Not Used
Unknown
Total
Restraint Used
Restraint Not Used
Helmet Used
Helmet Not Used
Unknown
Total
344 321 . 389 383 374 350 338 339 311
620 627 . 628 597 665 633 571 576 458
103 100 . 115 69 104 92 98 115 98
3 19 . 35 61 83 76 111 113 98
242 239 . 202 200 193 168 177 138 112
1,312 1,306 . 1,369 1,310 1,419 1,319 1,295 1,281 1,077
69,339 62,617 . 65,687 64,572 61,973 56,457 55,963 53,565 53,428
20,541 20,706 . 17,628 16,839 15,333 14,478 13,251 11,593 11,003
1,881 2,057 . 1,757 1,694 1,897 1,993 2,256 2,442 2,244
43 369 . 576 1,088 1,313 1,217 1,328 1,450 1,307
31,059 24,004 . 24,125 24,519 22,647 15,825 14,850 12,706 12,643
122,863 109,753 . 109,773 108,712 103,163 89,970 87,648 81,756 80,625
South Killed Restraint Used 311 261 271 242 222 256 263 249 217 253
Carolina Restraint Not Used 519 527 525 506 587 562 472 490 416 385
Helmet Used 18 12 9 16 15 24 26 27 26 25
Helmet Not Used 43 68 74 68 71 72 78 94 93 81
Unknown 58 52 56 37 38 53 54 73 39 46
Total 949 920 935 869 933 967 893 933 791 790
Injured Restraint Used 41,228 39,955 39,648 38,555 38,227 38,004 38,944 38,050 36,493 39,004
Restraint Not Used 8,102 7,091 7,154 6,923 6,745 6,613 4,689 4,463 3,849 3,313
Helmet Used 307 316 280 278 352 375 442 511 553 506
Helmet Not Used 602 1,108 1,025 1,039 1,192 1,170 1,237 1,393 1,581 1,248
Unknown 1,265 2,184 2,408 2,713 3,048 3,141 3,158 3,161 2,817 2,636
Total 51,504 50,654 50,515 49,508 49,564 49,303 48,470 47,578 45,293 46,707
. Data is unavailable # Data is available, but specific variables or attributes are unavailable 219

State Data System: Crash Data Report 2000–2009
Table 16: Restraint and Helmet Use for Motorists Killed or Injured in Crashes
State Injury Severity
Restraint/Helmet 2000 2001 2002 2003 2004 2005 2006 2007 2008 2009
Texas Killed
Injured
Restraint Used
Restraint Not Used
Helmet Used
Helmet Not Used
Unknown
Total
Restraint Used
Restraint Not Used
Helmet Used
Helmet Not Used
Unknown
Total
1,008 951 . 1,402 1,468 1,283
1,257 1,346 . 1,386 1,235 1,220
72 76 . 119 115 142
125 153 . 189 156 203
151 99 . 203 164 144
2,613 2,625 . 3,299 3,138 2,992
242,970 241,639 . 255,432 243,907 247,748
29,221 26,371 . 20,986 18,605 17,962
2,070 2,330 . 2,485 2,656 3,442
2,002 2,376 . 2,708 2,749 3,347
5,794 4,945 . 16,766 11,483 10,426
282,057 277,661 . 298,377 279,400 282,925
1,272
1,143
141
203
264
3,023
224,412
12,897
4,069
3,260
18,064
262,702
1,283
1,028
179
221
212
2,923
225,730
12,138
4,208
3,333
11,632
257,041
1,177
1,011
230
294
220
2,932
204,999
10,889
5,376
4,067
9,649
234,980
1,086
949
168
260
191
2,654
200,983
9,956
4,479
3,534
8,096
227,048
Utah Killed
Injured
Restraint Used
Restraint Not Used
Helmet Used
Helmet Not Used
Unknown
Total
Restraint Used
Restraint Not Used
Helmet Used
Helmet Not Used
Unknown
Total
107 84 107 108 93 .
156 111 137 116 108 .
8 8 5 9 14 .
# # 10 9 10 .
57 49 32 24 37 .
328 254 291 266 262 .
21,103 21,162 22,079 20,939 22,250 .
4,206 3,570 3,286 2,668 2,282 .
218 255 293 270 338 .
24 21 202 223 278 .
2,963 2,842 3,007 2,726 2,847 .
28,514 27,850 28,867 26,826 27,995 .
.
.
.
.
.
.
.
.
.
.
.
.
.
.
.
.
.
.
.
.
.
.
.
.
.
.
.
.
.
.
.
.
.
.
.
.
.
.
.
.
.
.
.
.
.
.
.
.
. Data is unavailable # Data is available, but specific variables or attributes are unavailable 220

State Data System: Crash Data Report 2000–2009
Table 16: Restraint and Helmet Use for Motorists Killed or Injured in Crashes
State Injury Severity
Restraint/Helmet 2000 2001 2002 2003 2004 2005 2006 2007 2008 2009
Virginia Killed
Injured
Restraint Used
Restraint Not Used
Helmet Used
Helmet Not Used
Unknown
Total
Restraint Used
Restraint Not Used
Helmet Used
Helmet Not Used
Unknown
Total
270 258 241 266 295 253
438 455 436 438 418 454
# # # # 33 58
# # # # 24 9
31 29 41 39 37 46
739 742 718 743 807 820
57,492 57,291 57,699 59,213 61,462 59,748
12,032 10,925 10,367 8,813 8,809 8,364
# # # # 1,215 1,541
# # # # 571 531
2,172 2,263 2,160 2,111 2,591 2,252
71,696 70,479 70,226 70,137 74,648 72,436
290
455
53
8
47
853
57,185
7,964
1,815
463
2,255
69,682
292
452
125
7
40
916
54,352
6,871
1,847
531
1,946
65,547
281
367
83
2
29
762
55,280
5,721
2,100
178
2,299
65,578
236
331
68
5
21
661
51,003
4,818
1,845
98
1,442
59,206
Washington Killed
Injured
Restraint Used
Restraint Not Used
Helmet Used
Helmet Not Used
Unknown
Total
Restraint Used
Restraint Not Used
Helmet Used
Helmet Not Used
Unknown
Total
173 232 243 233 223 241
121 223 221 144 161 196
# # 49 50 67 68
# # 10 7 7 1
45 117 63 82 49 46
339 572 586 516 507 552
22,355 47,451 47,661 46,222 45,673 48,194
2,430 5,866 3,749 2,514 2,296 2,588
# # 1,370 1,446 1,737 1,921
# # 75 72 76 62
4,936 13,554 11,593 8,272 9,586 9,727
29,721 66,871 64,448 58,526 59,368 62,492
244
161
75
3
66
549
46,161
2,186
2,030
62
8,997
59,436
218
146
59
5
54
482
43,382
1,867
2,039
59
8,031
55,378
187
127
78
3
52
447
38,764
1,610
2,183
50
7,465
50,072
175
136
63
4
44
422
37,728
1,585
2,007
57
4,727
46,104
. Data is unavailable # Data is available, but specific variables or attributes are unavailable 221

State Data System: Crash Data Report 2000–2009
Table 16: Restraint and Helmet Use for Motorists Killed or Injured in Crashes
State Injury Severity
Restraint/Helmet 2000 2001 2002 2003 2004 2005 2006 2007 2008 2009
Wisconsin Killed Restraint Used 224 202 216 240 236 232 209 200 169 150
Restraint Not Used 369 357 377 355 338 352 285 298 217 220
Helmet Used 15 14 16 25 18 22 24 26 19 29
Helmet Not Used 29 36 40 44 40 48 46 46 40 34
Unknown 98 100 94 104 76 92 84 99 77 63
Total 735 709 743 768 708 746 648 669 522 496
Injured Restraint Used 45,519 41,264 41,542 41,650 41,685 39,825 37,396 37,719 34,855 31,433
Restraint Not Used 12,318 10,948 10,480 9,002 7,878 7,445 6,971 6,559 5,463 4,669
Helmet Used 564 692 657 812 869 967 884 1,122 1,227 909
Helmet Not Used 881 892 854 1,032 921 1,076 988 1,062 1,052 935
Unknown 2,757 2,740 2,696 2,771 2,384 2,586 2,533 2,607 2,552 2,243
Total 62,039 56,536 56,229 55,267 53,737 51,899 48,772 49,069 45,149 40,189
Wyoming Killed Restraint Used 52 48 47 48 51 48 55 50 38 33
Restraint Not Used 74 115 95 84 83 88 102 67 85 77
Helmet Used 1 1 4 3 4 5 3 9 9 3
Helmet Not Used 5 9 8 17 9 16 13 13 10 10
Unknown 5 6 7 4 11 1 11 3 4 4
Total 137 179 161 156 158 158 184 142 146 127
Injured Restraint Used 3,345 3,244 3,692 3,856 3,857 3,948 4,242 4,267 3,388 3,096
Restraint Not Used 1,669 1,504 1,495 1,297 1,236 1,134 1,223 1,164 949 852
Helmet Used 85 81 97 105 104 125 146 153 114 102
Helmet Not Used 155 159 144 218 155 196 221 247 203 202
Unknown 473 404 458 536 499 437 557 526 437 438
Total 5,727 5,392 5,886 6,012 5,851 5,840 6,389 6,357 5,091 4,690
. Data is unavailable # Data is available, but specific variables or attributes are unavailable 222

State Data System: Crash Data Report 2000–2009
APPENDIX I
223

State Data System: Crash Data Report 2000–2009
Associated Analyses and Reports
The following is a list of published research and evaluations conducted by NHTSA since the year 2000 that have involved SDS data. A full listing of NCSA publications can be found on the NCSA Data Resource Web site (www‐nrd.nhtsa.dot.gov/cats/index.aspx).
Technical Reports
Effectiveness of LED Stop Lamps for Reducing Rear‐End Crashes: Analyses of State Crash Data. Report No. DOT HS 811 712, February 2013 www‐nrd.nhtsa.dot.gov/Pubs/811712.pdf
Relationships between Fatality Risk, Mass, and Footprint in Model Year 2000‐2007 Passenger Cars and LTVs Report No. DOT HS 811 665, August 2012 www‐nrd.nhtsa.dot.gov/Pubs/811665.pdf
Incidence Rates of Pedestrian and Bicyclist Crashes by Hybrid Electric Passenger Vehicles: An Update Report No. DOT HS 811 526, October 2011 www‐nrd.nhtsa.dot.gov/Pubs/811526.pdf
The Effectiveness of Under ride Guards for Heavy Trailers Report No. DOT HS 811 375, October 2010 www‐nrd.nhtsa.dot.gov/Pubs/811375.pdf
Booster Seat Effectiveness Estimates Based on CDS and State Data Report No. DOT HS 811 338, July 2010 www‐nrd.nhtsa.dot.gov/Pubs/811338.pdf
The Effectiveness of ABS in Heavy Truck Tractors and Trailers Report No. DOT HS 811 339, July 2010 www‐nrd.nhtsa.dot.gov/Pubs/811339.pdf
Report to Congress NHTSA’s Crash Data Collection Programs Report No. DOT HS 811 337, April 2010 www‐nrd.nhtsa.dot.gov/Pubs/811337.pdf
Incidence of Pedestrian and Bicyclist Crashes by Hybrid Electric Passenger Vehicles Report No. DOT HS 811 204, September 2009 www‐nrd.nhtsa.dot.gov/Pubs/811204.pdf
224

State Data System: Crash Data Report 2000–2009
The Effectiveness of Amber Rear Turn Signals for Reducing Rear Impacts Report No. DOT HS 811 115, April 2009 www‐nrd.nhtsa.dot.gov/Pubs/811115.pdf
An Analysis of Speeding‐Related Crashes: Definitions and the Effects of Road Environments Report No. DOT HS 811 090, February 2009 www‐nrd.nhtsa.dot.gov/Pubs/811090.pdf
Fatalities and Injuries in Motor Vehicles Backing Crashes Report No. DOT HS 811 144, November 2008 www‐nrd.nhtsa.dot.gov/Pubs/811144.pdf
The Effectiveness of Daytime Running Lights for Passenger Vehicles Report No. DOT HS 811 029, September 2008 www‐nrd.nhtsa.dot.gov/Pubs/811029.pdf
Trends in Non‐Fatal Traffic Injuries: 1996 – 2005 Report No. DOT HS 810 944, May 2008 www‐nrd.nhtsa.dot.gov/Pubs/810944.pdf
Statistical Analysis of the Effectiveness of Electronic Stability Control (ESC) Systems – Final Report Report No. DOT HS 810 794), July 2007 www‐nrd.nhtsa.dot.gov/Pubs/810794.pdf
Preliminary Results Analyzing the Effectiveness of Electronic Stability Control (ESC) Systems Report No. DOT HS 809 790, September 2004 www‐nrd.nhtsa.dot.gov/Pubs/809790.pdf
Analysis of Crashes Involving 15‐Passenger Vans. Report No. DOT HS 809 735, May 2004 www‐nrd.nhtsa.dot.gov/Pubs/809735.pdf
Evaluation of Rear Window Defrosting and Defogging Systems Report No. DOT HS 809 724, March 2004 www‐nrd.nhtsa.dot.gov/Pubs/809724.pdf
Vehicle Weight, Fatality Risk and Crash Compatibility of Model Year 1991‐99 Passenger Cars and Light Trucks Report No. DOT HS 809 662, October 2003 www.nhtsa.dot.gov/cars/rules/regrev/evaluate/pdf/809662.pdf
The Effectiveness of Head Restraints in Light Trucks Report No. DOT HS 809 247, April 2001 www‐nrd.nhtsa.dot.gov/Pubs/809247.pdf
225

State Data System: Crash Data Report 2000–2009
Research Notes
Vehicle Aggressiveness in Real World Crashes (in Proceedings 19th Technical Conference on the Enhanced Safety of Vehicles) Report No. DOT HS 809 825, June 2005 www‐nrd.nhtsa.dot.gov/pdf/nrd‐01/esv/esv19/05‐0248‐O.pdf
Moving Children from the Front Seat to the Back Seat: The Influence of Child Safety Campaigns Report No. DOT HS 809 698, November 2003 www‐nrd.nhtsa.dot.gov/Pubs/809‐698.pdf
New Car Assessment Program; Rollover Resistance RIN 2127‐AI8, October 2003 www.nhtsa.dot.gov/cars/rules/rulings/RollFinal/index.html
The Rollover Propensity of Fifteen‐Passenger Vans. Report No. DOT HS 01 030, April 2001 www‐nrd.nhtsa.dot.gov/Pubs/01‐030.pdf
226

State Data System: Crash Data Report 2000–2009
APPENDIX II
227

State Data System: Crash Data Report 2000–2009
State‐Specific Notes
228

State Data System: Crash Data Report 2000–2009
Alabama
Reporting Criteria for 2000‐2009:
A fatality A personal injury requiring transportation for the purpose of obtaining immediate medical treatment A vehicle removed from the scene as a result of disabling damage A vehicle requiring intervening assistance before proceeding under its own power
Notes:
As part of an effort to become more MMUCC‐compliant, in 2009 Alabama made major changes to the descriptions and interpretation of new codes as part of updating its eCrash system. In 2009, which was the transition year, about 30 percent of the records came in on the new “eCrash” system and 70 percent from the old paper system. Where possible, SDS did a translation of the 2009 Alabama data from the eCrash system to the older paper‐based system.
The variable Number of Vehicles Involved includes vehicles and pedalcyclists. The vehicle file included non‐motorists such as pedalcyclists, people in animal‐ridden conveyances, and
trains. Table 8 (Motor Vehicles Involved in Crashes by Vehicle Type and Crash Severity) is based on information in the vehicle file; however, non‐motorists are excluded from the table.
The person type variable in the person file had no pedalcyclist identifier and vehicle type was used to identify pedalcyclists for Table 9 (People Killed or Injured in Motor Vehicles Crashes by Person Type).
Uninjured passengers are not included in the person file. The restraint device variable in the person file included pedalcyclist safety equipment use. These cases were
excluded from Table 16 (Safety Equipment and Helmet Use for People Killed or Injured in Motor Vehicle Crashes).
229

State Data System: Crash Data Report 2000–2009
Arkansas
Reporting Criteria for 2000‐2009:
A fatality A personal injury Property damage of $500 or more for the year 2000, $1,000 or more for the years 2001–2006, and $2,000 or
more for the years 2007–2009
Notes:
Arkansas reports that the increase in the number of injured people that started in 2001 is due to increased police reporting of “possible” injuries.
First harmful event is not available in the crash file and vehicle first harmful event was used to derive the first harmful event for Table 3 (Motor Vehicles Crashes by First Harmful Event and Crash Severity).
The 2009 data has a known coding issue for “Safety Equipment” for motorcyclists. All non‐fatally injured motorcyclists are coded either “none used” or “unknown.” ‖The attribute “helmet” was never coded. This coding issue does not exist for fatally injured motorcyclists.
230

State Data System: Crash Data Report 2000–2009
California
Reporting Criteria for 2000–2009:
A fatality (including fetal deaths) A personal injury Property damage of $500 or more
Notes:
The variable "Number of Vehicles Involved" includes vehicles, pedestrians, and pedalcyclists. The vehicle file includes non‐motorists such as pedalcyclists and pedestrians. Table 8 (Motor Vehicles
Involved in Crashes by Vehicle Type and Crash Severity) is based on information in the vehicle file, but non‐motorists were excluded from the table.
California counts a fetal death as a separate fatality; the person file has a separate record for each fetal death. There were between 8 and 17 fetal fatalities per year from 2004 to 2009. Fetal deaths were not shown in a separate row in Table 10 (People Killed or Injured in Motor Vehicle Crashes by Age Group), but are included in the total fatality counts. The totals are italicized if they include fetal deaths.
“Restraint Device 1” and “Restraint Device 2” were available beginning of 2003. Restraint Device 2 was used if Restraint Device 1 was coded as “unknown” or “air bag.”
231

State Data System: Crash Data Report 2000–2009
Colorado
Reporting Criteria for 2000–2004:
A fatality A personal injury Property damage of $500 or more
Notes:
Only 5 years of SDS data (2000 to 2004) are available for this report period. For 2004 the variable “Number of Vehicles Involved” counts only motor vehicles. Prior to 2004, it usually,
but not always, included pedalcyclists. The vehicle file included non‐motorists (pedalcyclists). Table 8 (Motor Vehicles Involved in Crashes by
Vehicle Type and Crash Severity) is based on information in the vehicle file, but non‐motorists were excluded from the table.
Vehicles that were driven by a person who was not the owner have two records in the Colorado person file—one record for the owner and one for the driver. Also, driverless vehicles have a record in the person file for the owner of the vehicle. These person types were excluded from all person counts in this report.
232

State Data System: Crash Data Report 2000–2009
Connecticut
Reporting Criteria for 2000–2009:
A fatality (Note: The death of a fetus of a pregnant female involved in a traffic collision is documented as a fatal injury if the coroner attributes the death to the collision)
A personal injury Property damage of $1,000 or more
Notes:
Before 2007 Connecticut crashes that occurred on local roads were reported only if a fatality or injury was involved. Beginning in 2007, all crashes on local roads meeting the crash reporting criteria are reported. The number of reported crashes increased from 71,723 in 2006 to 113,065 in 2007.
The variable “Number of Vehicles” in the crash files includes pedalcyclists and trains, but excludes pedestrians.
The vehicle file included non‐motorists (pedestrians, pedalcyclists) and trains. Table 8 (Motor Vehicles Involved in Crashes by Vehicle Type and Crash Severity) is based on information in the vehicle file, but non‐motorists were excluded from the table.
The “Age” variable was unavailable in the person file. Age was derived from variables Date of Birth and Accident Date.
First Harmful Event is not available in the crash file. The vehicle file has Vehicle Events, which are coded only for commercial vehicles. Therefore, First Harmful Event was not derived for Table 3 (Motor Vehicles Crashes by First Harmful Event and Crash Severity).
The variable that captures helmet use can be coded for both motorcycle operators and other person types such as pedalcyclists. For Table 16 (Safety Equipment and Helmet Use for Motorists Killed or Injured in Motor Vehicle Crashes) note that all non‐motorists were excluded from the helmet categories.
233

State Data System: Crash Data Report 2000–2009
Delaware
Reporting Criteria for 2000–2009:
A fatality A personal injury Property damage of $1,400 or more for 2000, and $1,500 or more for 2001–2009
Notes:
Delaware made extensive changes in its reporting system starting in 2005, when an electronic PAR was introduced that included major changes in data fields. Delaware used both paper‐based and electronic versions of the PAR for 2005 and 2006. Given the difficulty of mapping the data fields, SDS did not produce data for those years. The new reporting system was fully implemented starting in 2007.
The variable “Number of Vehicles” includes pedalcyclists and is available through 2004. The number of vehicles was derived for the years 2007–2009 by counting the number of vehicles in the Vehicle file; pedestrians and pedalcyclists were excluded from the derivation.
From 1998–2004, Uninjured passengers and pedestrians were not included in the person file. Starting in 2007, all people are included regardless of injury status.
For 2009, approximately 90 percent of the records had missing data for the age variable, and consequently the 2009 counts for Delaware are not in the three age‐related tables in this report.
The “Restraint System Used” variable in the person file includes attributes such as “bicycle helmet used/not used.” This information was excluded from Table 16 (Safety Equipment and Helmet Use for Motorists Killed or Injured in Crashes).
Prior to 2007, rollover crashes were identified by only one variable (first harmful event). For 2007–2009, there were additional variables (e.g., rollover and first‐fourth sequence of vehicle events), which may have contributed to the increase in rollover crashes seen in Table 5 (Motor Vehicle Crashes reported to Have Rollovers/Overturned Vehicles).
234

State Data System: Crash Data Report 2000–2009
Florida
Reporting Criteria for 2000–2009:
A fatality A personal injury A crash deemed severe enough to report by the investigating officer. An officer has discretion to submit a
PAR for crashes where a vehicle is rendered inoperable to the degree that a wrecker is required to remove it from traffic
A crash where at least one driver is under the influence of alcoholic beverages, chemical substances, controlled substances, or has an unlawful blood alcohol concentration
A crash involving damage to an attended vehicle or property where a vehicle has left the scene
Notes:
The variable “Number of Vehicles” includes pedalcyclists. The vehicle file included pedalcyclists and trains. Table 8 (Motor Vehicles Involved in Crashes by Vehicle
Type and Crash Severity) is based on information from the vehicle file, but note that non‐motorists and trains are excluded from the table.
First Harmful Event is available in the crash file only for 2000–2001. Vehicle First Harmful Event was used for years 2002–2009 to derive the FHE for Table 3 (Motor Vehicles Crashes by First Harmful Event and Crash Severity). Harmful events for non‐motorists and parked vehicles were excluded from the derivation.
The variable “Injury Severity” in the person file includes an attribute “non‐traffic fatality (death from causes other than injuries sustained in the motor vehicle crash).” This was not included in the Killed category of Table 9 (People Killed or Injured in Motor Vehicles Crashes by Person Type)
“Safety Equipment 1” and “Safety Equipment 2” were available in the person file. Safety Equipment 2 was used if Safety Equipment 1 was coded as unknown or air bag.
235

State Data System: Crash Data Report 2000–2009
Georgia
Reporting Criteria for 2000–2009:
A fatality A personal injury Property damage of $500 or more
Notes:
The variable “Number of Vehicles” includes pedalcyclists and pedestrians. The person file contains information for all person types regardless of injury level. The person file contains pedalcyclists, but they cannot be identified by “Person Type” alone. To identify
pedalcyclists in the Person File they must first be identified in the Vehicle file using “Vehicle Type.”
236

State Data System: Crash Data Report 2000–2009
Illinois
Reporting Criteria for 2000–2009:
A fatality A personal injury Property damage of $500 or more for 2000‐2008. Starting in, 2009, if all drivers involved were insured, the
amount increased to $1,500. If any driver did not have insurance, the threshold remained at $500
Notes:
The increase in 2009 for the reporting criteria property damage amounts (from $500 to $1,500) likely played a significant role in the large decline in PDO crashes reported for 2009.
Additional distraction‐related attributes were available beginning in 2002 and may have led to the increase in the reporting of distraction‐related crashes starting that year.
Alcohol indicators are only coded for drivers for all years except 2004; in 2004, “Alcohol Test Results” and “Driver Condition are coded for non‐motorists and drivers.
The variable that captures helmet use has the coding choices “helmet used” and “helmet not used.” It appears that for the years 2004–05, if a helmet was not used, this variable was frequently left blank rather than having “helmet not used” coded.
237

State Data System: Crash Data Report 2000–2009
Indiana
Reporting Criteria for 2000–2009:
A fatality A personal injury Property damage of $750 or more from 2000–2004, and $1,000 or more from 2005–2009
Notes:
Due to a system and PAR change in 2001, the data files for the years 2001 and 2002 were deemed by the State of Indiana and the SDS to be incomplete and are not included in the SDS system.
For 2003, the injury severity variable in the person file was unavailable. Hence, all the person‐level injury‐related tables are missing in this report for 2003.
The person data set includes all drivers, vehicle owners, trailer owners, pedestrians, and pedalcyclists, but includes vehicle passengers only if injured. The data set contains a record for every driver (if the driver is present) and a separate record for the vehicle owner, even if they are the same individual. For this report, all the vehicle owners and trailer owners were excluded.
Pedalcyclists could not be identified for the year 2000. Hence, data is missing for pedalcyclists in Table 9 (People Killed or Injured in Motor Vehicles Crashes by Person Type).
Information on first harmful event in Indiana’s crash‐level data cannot be mapped to the categories used in this report; however, useful event information is available at the vehicle level starting in 2003. From 2003– 2008 the first harmful event was available for each vehicle, and for 2009 up to four events are coded for each vehicle. Crash‐level first harmful event for this report was derived from this vehicle‐level information. The derivation excluded events for parked vehicles and non‐motorists.
238

State Data System: Crash Data Report 2000–2009
Iowa
Reporting Criteria for 2001–2009:
A fatality A personal injury requiring transportation for the purpose of obtaining immediate medical treatment A vehicle removed from the scene as a result of disabling damage A vehicle requiring intervening assistance before proceeding under its own power
Notes:
Iowa data are not available for the year 2000. The person file contains information for all drivers and for other people only if they are injured or killed.
239

State Data System: Crash Data Report 2000–2009
Kansas
Reporting Criteria for 2000–2009:
A fatality A personal injury Property damage of $500 or more for 2000–2004 and $1,000 or more for 2005–2009
Notes:
Kansas changed their PAR in 2009, however, for that year both the old and new PARs were used to record crash information. In 2009 approximately 60 percent of the crashes were coded with the old PAR. Kansas informed the SDS that when codes changed for a given variable the old codes were recoded to be compatible with the new codes. Several variables were introduced in the new PAR, and so for these new variables at least 60 percent will be coded "unknown" in the 2009 data. By 2010 the new PAR was used for all crashes.
The vehicle file contains records for trains. Table 8 (Motor Vehicles Involved in Crashes by Vehicle Type and Crash Severity) is based on information from the vehicle file, but note that trains are excluded from the table.
240

State Data System: Crash Data Report 2000–2009
Kentucky
Reporting Criteria for 2000–2009:
A fatality A personal injury Damage to the vehicle rendering it inoperable
Notes:
The variable “Number of Vehicles” includes both pedestrians and pedalcyclists. The vehicle file contains records for pedestrians, pedalcyclists, and other types of non‐motorists. Table 8
(Motor Vehicles Involved in Crashes by Vehicle Type and Crash Severity) is based on information from the vehicle file, but note that non‐motorists are excluded from the table.
The Kentucky person file includes vehicle owners who were not in the vehicle at the time of the crash and witnesses. Note that these person types were excluded from all tables in this report.
First harmful event was not available in the crash file. Vehicle first and second harmful events were used to derive the FHE for Table 3 (Motor Vehicles Crashes by First Harmful Event and Crash Severity). Harmful events for non‐motorists and parked vehicles were excluded from the derivation.
241

State Data System: Crash Data Report 2000–2009
Louisiana
Reporting Criteria for 2005–2009:
A fatality A personal injury Property damage of $500 or more
Notes:
Data is available for years 2005 through 2009. Louisiana is the most recent State to join the SDS. First harmful event was not available in the crash file. Vehicle sequence of events was used to derive the
FHE for Table 6 (Motor Vehicles Crashes by First Harmful Event and Crash Severity). Non‐motorists and parked vehicles were excluded from the derivation.
242

State Data System: Crash Data Report 2000–2009
Maryland
Reporting Criteria for 2000–2009:
A fatality A personal injury A vehicle involved in the crash towed from the scene
Notes:
Number of Vehicles was available for all years except 2009. Single/multiple vehicle crash information for this report was derived for 2009 based on counting vehicles in the vehicle file.
A crash severity variable was not available for the year 2009. For this report, crash severity was derived from Injury Severity in the person file.
243

State Data System: Crash Data Report 2000–2009
Michigan
Reporting Criteria for 2000–2009:
A fatality A personal injury Property damage of $400 for 2000–2003 and $1,000 for 2004–2009
Notes:
The vehicle type variable had an attribute called “van/motor home,” and there was no identifier available to separate motor homes from vans. Therefore, the “Light Truck” category in Table 8 (Motor Vehicles Involved in Crashes by Vehicle Type and Crash Severity) includes motorhomes.
Starting in 2004, the person file contains separate records for drivers and owners for vehicles driven by someone other than the owner. Owner records make up around 20 percent of the person file. The person file also contains a small number of records for witnesses. For this report, all vehicle owners and witnesses were excluded from person‐level counts.
Uninjured passengers are sometimes, but not always, included in the person file. The total number of occupants in a vehicle can be obtained from the vehicle file variable ‘Number of Occupants.’
First harmful event was not available in the crash file. Vehicle sequence of events was used to derive the FHE for Table 3 (Motor Vehicles Crashes by First Harmful Event and Crash Severity).
244

State Data System: Crash Data Report 2000–2009
Minnesota
Reporting Criteria for 2000–2009:
A fatality A personal injury Property damage of $1000 or more
Notes:
Minnesota data are not available for the year 2003. Number of vehicles was derived for years 2004–2006 by counting the number of vehicles in the Vehicle file;
pedestrians and pedalcyclists were excluded from the derivation Alcohol‐related crashes were identified using two variables in the person file—Alcohol Test Result and
Driver Condition. Alcohol test result is available only from 2000–2007 and is coded only for fatal crashes; from 2000–2002 it is coded only for drivers in fatal crashes and from 2004–2007 it is coded for both drivers and non‐motorists in fatal crashes. Starting in 2008, the variable Driver Condition is available and is coded for all crash severities. The use of these different variables probably accounts for the changes in crash counts seen in the tables related to alcohol.
The vehicle file contains records for pedestrians, pedalcyclists, and other types of non‐motorists. Table 8 (Motor Vehicles Involved in Crashes by Vehicle Type and Crash Severity) is based on information from the Vehicle file, but note that non‐motorists are excluded from the table.
“Restraint Device 1” and “Restraint Device 2” were available beginning in 2004. Restraint Device 2 was used if Restraint Device 1 was coded as unknown or not applicable.
245

State Data System: Crash Data Report 2000–2009
Missouri
Reporting Criteria for 2000–2009:
A fatality A personal injury Property damage of $500 or more
Notes:
For the years 2000–2001, the vehicle type variable in the vehicle file had an attribute “van/small bus <16 passengers.” There was no identifier available to separate small buses from vans. Therefore, the ‘Light Truck’ category in Table 8 (Motor Vehicles Involved in Crashes by Vehicle Type and Crash Severity) includes small bus <16 passengers.
Non‐motorists are included in the variable “Number of Vehicles Involved.” The variable Number of Motor Vehicles in the Crash file was used to identify single‐vehicle or multiple‐vehicle crashes for Table 1 (Motor Vehicle Crashes by Crash Severity and Crash Type).
Prior to 2006, the person file included all drivers, but passengers were included only if injured or killed. In 2006 some, but not all, uninjured passengers were included. Starting in 2007 all passengers are included regardless of injury status.
246

State Data System: Crash Data Report 2000–2009
Montana
Reporting Criteria for 2000–2009:
A fatality A personal injury Property damage of $400 or more for 2000, and $1,000 or more for 2001–2009
Notes:
The variable “Number of Vehicles” includes pedalcyclists. The vehicle file contains records for pedalcyclists. Table 8 (Motor Vehicles Involved in Crashes by Vehicle
Type and Crash Severity) is based on information from the Vehicle file, but note that pedalcyclists are excluded from the table.
The variable “Injury Severity” in the person file includes an attribute “died prior to accident.” This was not included in the Killed category of Table 9 (People Killed or Injured in Motor Vehicles Crashes by Person Type). Montana’s published crash facts also excluded this category.
First harmful event was not available in the crash file. Vehicle first harmful event was used to derive the FHE for Table 3 (Motor Vehicles Crashes by First Harmful Event and Crash Severity).
247

State Data System: Crash Data Report 2000–2009
Nebraska
Reporting Criteria for 2000–2009:
A fatality A personal injury Property damage of $500 or more for 2000–2003 and $1,000 for 2004–2009
Notes:
Around 20 to 30 percent of the crashes in the SDS data files for Nebraska do not meet the State’s reporting criteria; these crashes were excluded from crash counts in this report. In the SDS data files, these crashes can be identified by the accident level “Severity” variable. Also, there are a small number of cases that have been deemed to be non‐accident. Examples of these include incidents caused by deliberate intent, acts of nature, etc.
248

State Data System: Crash Data Report 2000–2009
New Jersey
Reporting Criteria for 2000–2009:
A fatality A personal injury Property damage of $500 or more
Notes:
First harmful event was not available in the crash file. Vehicle sequence of events was used to derive the FHE for Table 3 (Motor Vehicles Crashes by First Harmful Event and Crash Severity).
Starting in 2006, the vehicle file contains a small number of records for pedalcyclists. Table 8 (Motor Vehicles Involved in Crashes by Vehicle Type and Crash Severity) is based on information from the Vehicle file, but note that pedalcyclists are excluded from the table.
In 2006 New Jersey redesigned its PAR, which resulted in many new definitions and/or attributes for existing variables. For some variables the State attempted to recode pre‐2006 data to make it compatible with the new definitions and/or attributes. Consequently, for some variables, frequency distributions for 2001–2005 are quite different when compared to those for 2006 and beyond.
“Restraint Device 1” and “Restraint Device 2” were available in the person file. Restraint Device 2 was used if Restraint Device 1 was coded as unknown or air bag.
249

State Data System: Crash Data Report 2000–2009
New Mexico
Reporting Criteria for 2000–2009:
A fatality A personal injury Property damage of $500 or more
Notes:
Number of vehicles was derived for all the years from counting the number of vehicles in the vehicle file; pedestrians and pedalcyclists were excluded from the derivation
The variables “Alcohol Test Results” and “Alcohol Test Type’ are coded only for fatal crashes. Alcohol information is coded for drivers, non‐motorists, and fatally injured passengers. Other passengers may also be coded at the officer's discretion.
250

State Data System: Crash Data Report 2000–2009
New York
Reporting Criteria for 2000–2009:
A fatality A personal injury Property damage of $1,000 or more
Notes:
The vehicle file contains records for pedestrians, pedalcyclists, and other types of non‐motorists. Table 8 (Motor Vehicles Involved in Crashes by Vehicle Type and Crash Severity) is based on information from the Vehicle file, but note that non‐motorists are excluded from the table.
The total number of crashes varies considerably over the years, and the change is almost entirely due to changes in the number of PDO crashes. According to the State, these changes are the result of modifications in the statewide Accident Information System (AIS) maintained by the New York State Department of Motor Vehicles.
251

State Data System: Crash Data Report 2000–2009
North Carolina
Reporting Criteria for 2000–2009:
A fatality A personal injury Property damage of $1,000 or more
Notes:
The variable “Injury Severity” in the person file includes attributes such as “suicide” and “homicide.” These were not included in the “Killed” category of Table 9 (People Killed or Injured in Motor Vehicles Crashes by Person Type).
North Carolina regularly includes a large number of non‐reportable crashes in their data. The number of crashes that North Carolina considers “reportable” in their annual Crash Facts is based on crashes that occur on federal, State, or local traffic ways, and excludes those that occurred in what the State terms "Public Vehicular Areas (PVAs)." PVAs are roadways and parking lots in areas such as schools, parks, hospitals, and shopping centers. The PVA crashes and those caused by suicide or homicide are excluded from this report.
252

State Data System: Crash Data Report 2000–2009
North Dakota
Reporting Criteria for 2003–2009:
A fatality A personal injury Property damage of $1,000 or more Commercial vehicle involvement
Notes:
Number of vehicles was derived for all years by counting the number of vehicles in the vehicle file; pedestrians and pedalcyclists were excluded from the derivation.
Crash severity was derived for the year 2009 using the “Injury Severity” variable from the person file. The North Dakota PAR changed in 2009. Most of the changes were minor and involved adding only a few
new attributes to a small number of variables. It should be noted, however, that the new PAR was deployed mid‐year and consequently not all new codes were available for the entire year. Also not all of the North Dakota jurisdictions adopted the new PAR by the end of 2009. The 2009 PAR changes for Injury Class were more extensive.
253

State Data System: Crash Data Report 2000–2009
Ohio
Reporting Criteria for 2000–2009:
A fatality A personal injury Property damage of $400 or more
Notes:
The variable “Number of Vehicles” includes pedestrians and pedalcyclists. The vehicle file contains records for pedestrians, pedalcyclists, and other types of non‐motorists. Table 8
(Motor Vehicles Involved in Crashes by Vehicle Type and Crash Severity) is based on information from the Vehicle file, but note that non‐motorists are excluded from the table.
First harmful event was not available in the crash file. Vehicle sequence of events was used to derive the FHE for Table 3 (Motor Vehicles Crashes by First Harmful Event and Crash Severity).
254

State Data System: Crash Data Report 2000–2009
Pennsylvania
Reporting Criteria for 2000–2009:
A fatality A personal injury Damage to any vehicle to the extent that it cannot be driven under its own power in its customary manner
without further damage or hazard to the vehicle, other traffic elements, or the roadway, and therefore requires towing
Notes:
SDS did not process Pennsylvania data for 2002. The variable “Number of Vehicles” includes pedalcyclists. The vehicle file contains records for pedestrians starting in 2006. Table 8 (Motor Vehicles Involved in Crashes
by Vehicle Type and Crash Severity) is based on information from the vehicle file, but note that non‐motorists are excluded from the table.
255

State Data System: Crash Data Report 2000–2009
South Carolina
Reporting Criteria for 2000–2009:
A fatality A personal injury Property damage of $1,000 or more
Notes:
The variable “Number of Vehicles Involved” includes pedestrians and pedalcyclists. The vehicle file contains records for pedestrians, pedalcyclists, and other types of non‐motorists. Table 8
(Motor Vehicles Involved in Crashes by Vehicle Type and Crash Severity) is based on information from the Vehicle file, but note that non‐motorists are excluded from the table.
256

State Data System: Crash Data Report 2000–2009
Texas
Reporting Criteria for 2000–2009:
A fatality A personal injury Property damage of $500 or more for 2000, and $1,000 or more for 2001–2009
Notes:
Data for 2002 were not made available by the State. Texas sometimes performs updates on their crash data, and may go back as far as five years when updating
their data. The 2003–2009 SDS data are based on crash data updated and produced by Texas in September 2010.
257

State Data System: Crash Data Report 2000–2009
Utah
Reporting Criteria for 2000–2004:
A fatality A personal injury Property damage of $1,000 or more
Notes:
With the exception of some bus occupants, all uninjured occupants are included in Utah’s person files. When there are a large number of uninjured bus occupants in the crash, they are not included in the person file.
258

State Data System: Crash Data Report 2000–2009
Virginia
Reporting Criteria for 2000–2009:
A fatality A personal injury Property damage of $1,000 or more
Notes:
The variable “Number of Vehicles Involved” includes pedalcyclists. The vehicle file contains records for pedalcyclists. Table 8 (Motor Vehicles Involved in Crashes by Vehicle
Type and Crash Severity) is based on information from the Vehicle file, but note that pedalcyclists are excluded from the table.
Beginning in 2009 Virginia started providing information on non‐reportable crashes; however, these crashes are excluded from this report.
The variable Alcohol Test Results (BAC Test Results) is coded only for fatalities. Non‐fatalities are either coded 0 or left blank. Table 2 and Table 15 in this report are not affected because additional alcohol indicators such as Alcohol Involved and Driver/Pedestrian Drinking are coded for both fatalities and non‐fatalities.
Virginia did not code motorcyclist helmet information before 2004.
259

State Data System: Crash Data Report 2000–2009
Washington
Reporting Criteria for 2000–2009:
A fatality A personal injury Property damage of $700 or more
Notes:
The 2000 data sets only cover State route crashes. Starting in 2001 all crashes are included. Washington includes crashes caused by medical condition (2002–2009), intentional action to cause damage
(2001–2009) and/or legal intervention (2008—2009) in their data. These account for very few cases in the crash file.
The variable Injury Severity in the person file includes attributes “non‐traffic fatality” and “non‐traffic injury.” These were not included in the Killed and Injured categories, respectively for Table 9 (People Killed or Injured in Motor Vehicles Crashes by Person Type)
260

State Data System: Crash Data Report 2000–2009
Wisconsin
Reporting Criteria for 2000‐2009:
A fatality A personal injury Property damage $1,000 or more Damage of $200 or more to government property (except motor vehicles)
Notes:
The vehicle file contains records for pedalcyclists and trains. Table 8 (Motor Vehicles Involved in Crashes by Vehicle Type and Crash Severity) is based on information from the vehicle file, but note that pedalcyclists and trains are excluded from the table.
261

State Data System: Crash Data Report 2000–2009
Wyoming
Reporting Criteria for 2000–2009:
A fatality A personal injury Property damage of $1,000 or more
Notes:
Due to changes on Wyoming crash reporting system in 2008, Wyoming 2008–2009 crash data follow a new data format that resulted in many changes in the SDS files.
The variable Number of Vehicles Involved includes pedestrians and pedalcyclists. Prior to 2008, the vehicle file contains records for pedalcyclists. Table 8 (Motor Vehicles Involved in Crashes
by Vehicle Type and Crash Severity) is based on information from the vehicle file, but note that pedalcyclists are excluded from the table.
262

State Data System: Crash Data Report 2000–2009
APPENDIX III
263

State Data System: Crash Data Report 2000–2009
Exposure Data
264

State Data System: Crash Data Report 2000–2009
Exposure Data 1: Population by State State 2000 2001 2002 2003 2004 2005 2006 2007 2008 2009
Alabama 4,452,173 4,467,634 4,480,089 4,503,491 4,530,729 4,569,805 4,628,981 4,672,840 4,718,206 4,757,938 Arkansas 2,678,588 2,691,571 2,705,927 2,724,816 2,749,686 2,781,097 2,821,761 2,848,650 2,874,554 2,896,843 California 33,987,977 34,479,458 34,871,843 35,253,159 35,574,576 35,827,943 36,021,202 36,250,311 36,604,337 36,961,229 Colorado 4,326,921 4,425,687 4,490,406 4,528,732 4,575,013 4,631,888 4,720,423 4,803,868 4,889,730 4,972,195 Connecticut 3,411,777 3,432,835 3,458,749 3,484,336 3,496,094 3,506,956 3,517,460 3,527,270 3,545,579 3,561,807 Delaware 786,373 795,699 806,169 818,003 830,803 845,150 859,268 871,749 883,874 891,730 Florida 16,047,515 16,356,966 16,689,370 17,004,085 17,415,318 17,842,038 18,166,990 18,367,842 18,527,305 18,652,644 Georgia 8,227,303 8,377,038 8,508,256 8,622,793 8,769,252 8,925,922 9,155,813 9,349,988 9,504,843 9,620,846 Illinois 12,434,161 12,488,445 12,525,556 12,556,006 12,589,773 12,609,903 12,643,955 12,695,866 12,747,038 12,796,778 Indiana 6,091,866 6,127,760 6,155,967 6,196,638 6,233,007 6,278,616 6,332,669 6,379,599 6,424,806 6,459,325 Iowa 2,929,067 2,931,997 2,934,234 2,941,999 2,953,635 2,964,454 2,982,644 2,999,212 3,016,734 3,032,870 Kansas 2,693,681 2,702,162 2,713,535 2,723,004 2,734,373 2,745,299 2,762,931 2,783,785 2,808,076 2,832,704 Kentucky 4,049,021 4,068,132 4,089,875 4,117,170 4,146,101 4,182,742 4,219,239 4,256,672 4,289,878 4,317,074 Louisiana 4,471,885 4,477,875 4,497,267 4,521,042 4,552,238 4,576,628 4,302,665 4,375,581 4,435,586 4,491,648 Maryland 5,311,034 5,374,691 5,440,389 5,496,269 5,546,935 5,592,379 5,627,367 5,653,408 5,684,965 5,730,388 Michigan 9,952,450 9,991,120 10,015,710 10,041,152 10,055,315 10,051,137 10,036,081 10,001,284 9,946,889 9,901,591 Minnesota 4,933,692 4,982,796 5,018,935 5,053,572 5,087,713 5,119,598 5,163,555 5,207,203 5,247,018 5,281,203 Missouri 5,607,285 5,641,142 5,674,825 5,709,403 5,747,741 5,790,300 5,842,704 5,887,612 5,923,916 5,961,088 Montana 903,773 906,961 911,667 919,630 930,009 940,102 952,692 964,706 976,415 983,982 Nebraska 1,713,820 1,719,836 1,728,292 1,738,643 1,749,370 1,761,497 1,772,693 1,783,440 1,796,378 1,812,683 New Jersey 8,430,621 8,492,671 8,552,643 8,601,402 8,634,561 8,651,974 8,661,679 8,677,885 8,711,090 8,755,602 New Mexico 1,821,204 1,831,690 1,855,309 1,877,574 1,903,808 1,932,274 1,962,137 1,990,070 2,010,662 2,036,802 New York 19,001,780 19,082,838 19,137,800 19,175,939 19,171,567 19,132,610 19,104,631 19,132,335 19,212,436 19,307,066 North Carolina 8,081,614 8,210,122 8,326,201 8,422,501 8,553,152 8,705,407 8,917,270 9,118,037 9,309,449 9,449,566 North Dakota 642,023 639,062 638,168 638,817 644,705 646,089 649,422 652,822 657,569 664,968 Ohio 11,363,543 11,387,404 11,407,889 11,434,788 11,452,251 11,463,320 11,481,213 11,500,468 11,515,391 11,528,896 Pennsylvania 12,284,173 12,298,970 12,331,031 12,374,658 12,410,722 12,449,990 12,510,809 12,563,937 12,612,285 12,666,858 South Carolina 4,024,223 4,064,995 4,107,795 4,150,297 4,210,921 4,270,150 4,357,847 4,444,110 4,528,996 4,589,872 Texas 20,944,499 21,319,622 21,690,325 22,030,931 22,394,023 22,778,123 23,359,580 23,831,983 24,309,039 24,801,761
Source: U.S. Bureau of the Census, Historical National Population Estimates Released September 2011 (according to site, posted Sept. 28, 2011) 265

State Data System: Crash Data Report 2000–2009
Exposure Data 1: Population by State State 2000 2001 2002 2003 2004 2005 2006 2007 2008 2009
Utah 2,244,502 2,283,715 2,324,815 2,360,137 2,401,580 2,457,719 2,525,507 2,597,746 2,663,029 2,723,421 Virginia 7,105,817 7,198,362 7,286,873 7,366,977 7,475,575 7,577,105 7,673,725 7,751,000 7,833,496 7,925,937 Washington 5,910,512 5,985,722 6,052,349 6,104,115 6,178,645 6,257,305 6,370,753 6,461,587 6,562,231 6,667,426 Wisconsin 5,373,999 5,406,835 5,445,162 5,479,203 5,514,026 5,546,166 5,577,655 5,610,775 5,640,996 5,669,264 Wyoming 494,300 494,657 500,017 503,453 509,106 514,157 522,667 534,876 546,043 559,851
Source: U.S. Bureau of the Census, Historical National Population Estimates Released September 2011 (according to site, posted Sept. 28, 2011) 266

State Data System: Crash Data Report 2000–2009
Exposure Data 2: Vehicle Miles Traveled (millions) by State State 2000 2001 2002 2003 2004 2005 2006 2007 2008 2009 Alabama 56,534 56,769 57,515 58,637 59,035 59,640 60,668 61,410 59,303 61,300 Arkansas 29,167 29,433 30,080 30,639 31,648 31,972 33,007 33,171 33,163 33,154 California 306,649 310,575 321,696 323,592 328,917 329,267 327,478 328,312 327,286 324,486 Colorado 41,771 42,955 43,545 43,379 45,891 47,962 48,641 48,713 47,860 46,230 Connecticut 30,756 30,844 31,205 31,432 31,608 31,675 31,743 32,053 31,737 31,420 Delaware 8,240 8,615 8,875 9,044 9,301 9,508 9,442 9,483 8,976 9,080 Florida 150,945 170,587 178,367 185,511 196,444 201,531 203,741 206,121 198,616 196,379 Georgia 105,010 107,897 108,321 109,246 113,618 113,509 113,532 112,541 109,057 109,258 Illinois 102,866 103,038 105,401 106,536 109,135 107,706 106,869 107,483 106,079 105,846 Indiana 70,862 71,802 72,523 72,511 72,791 71,799 71,215 72,780 73,992 76,628 Iowa 29,433 30,016 30,847 31,108 31,538 31,060 31,355 31,253 30,713 31,065 Kansas 28,130 28,155 28,443 28,672 29,150 29,621 30,215 30,048 29,727 29,497 Kentucky 46,803 46,258 46,841 46,748 47,322 47,466 47,742 48,063 47,534 47,355 Louisiana 40,849 43,244 43,295 44,156 44,607 44,979 45,417 45,376 45,091 44,863 Maryland 50,174 51,996 53,702 54,701 55,284 56,319 56,302 56,503 55,023 55,293 Michigan 97,792 98,987 100,144 100,756 103,326 104,052 104,184 104,614 101,825 96,769 Minnesota 52,601 53,341 54,562 55,296 56,570 56,904 56,518 57,233 57,995 56,879 Missouri 67,083 67,632 68,163 68,252 68,994 68,754 68,834 69,151 68,273 69,003 Montana 9,882 10,011 10,395 10,874 11,207 11,126 11,265 11,307 10,812 11,011 Nebraska 18,081 18,102 18,719 19,016 19,171 19,291 19,415 19,439 19,170 19,359 New Jersey 67,446 68,725 69,942 69,778 72,844 73,819 75,371 76,152 73,629 73,029 New Mexico 22,760 23,232 22,789 22,844 23,942 23,966 25,787 26,850 26,279 26,013 New York 129,057 130,722 133,057 135,047 137,898 139,197 141,348 136,737 134,085 133,491 North Carolina 89,504 91,580 92,894 93,759 95,903 101,268 101,515 103,598 101,712 102,590 North Dakota 7,217 7,235 7,336 7,468 7,594 7,570 7,890 7,844 7,820 8,154 Ohio 105,903 106,589 107,861 108,938 111,654 110,491 111,247 110,631 108,302 110,591 Pennsylvania 102,337 103,004 104,517 106,347 108,070 108,042 108,278 108,699 107,848 103,206 South Carolina 45,538 46,601 47,290 48,120 49,551 49,434 50,199 51,109 49,597 49,130 Texas 220,064 216,269 221,026 223,418 231,008 235,170 238,256 243,443 235,382 229,984
Source: Annual Highway Statistics, Federal Highway Administration), Table VM‐2 and VM‐202 267

State Data System: Crash Data Report 2000–2009
Exposure Data 2: Vehicle Miles Traveled (millions) by State State 2000 2001 2002 2003 2004 2005 2006 2007 2008 2009 Utah 22,597 23,452 24,564 24,029 24,696 25,158 25,964 26,832 25,974 26,264 Virginia 74,801 73,745 77,450 76,868 78,877 80,337 81,095 82,077 82,278 80,927 Washington 53,330 53,665 54,776 55,015 55,673 55,476 56,517 56,939 55,558 56,417 Wisconsin 57,266 57,269 58,746 59,615 60,399 60,017 59,398 59,493 57,462 58,157 Wyoming 8,090 8,625 9,007 9,211 9,261 9,058 9,415 9,366 9,447 9,568
Source: Annual Highway Statistics, Federal Highway Administration), Table VM‐2 and VM‐202 268

State Data System: Crash Data Report 2000–2009
Exposure Data 3: Number of Licensed Drivers by State State 2000 2001 2002 2003 2004 2005 2006 2007 2008 2009
Alabama 3,521,444 3,559,897 3,577,986 3,598,034 3,613,138 3,637,414 3,665,180 3,691,762 3,753,550 3,782,284 Arkansas 1,947,867 1,961,883 1,965,008 1,998,127 1,862,430 2,024,466 2,034,975 2,046,039 2,055,189 2,065,065 California 21,243,939 21,623,793 22,394,800 22,657,288 22,761,088 22,895,965 23,021,279 23,467,452 23,697,667 23,680,643 Colorado 3,107,258 3,287,922 3,165,815 2,975,337 3,205,054 3,341,275 3,341,275 3,502,709 3,605,682 3,704,561 Connecticut 2,652,593 2,650,374 2,672,145 2,659,918 2,694,574 2,740,270 2,805,124 2,848,602 2,883,324 2,916,143 Delaware 556,688 564,099 573,021 585,136 533,943 610,406 619,877 624,472 651,877 699,745 Florida 12,853,428 12,743,403 12,744,055 12,905,813 13,146,357 13,373,700 13,988,630 14,138,846 14,033,844 14,005,066 Georgia 5,550,176 5,833,802 6,012,847 5,757,953 5,793,143 5,939,513 5,906,834 6,134,298 6,257,484 6,315,035 Illinois 7,961,046 7,809,500 8,033,399 8,054,232 8,057,683 7,870,872 8,071,253 8,190,023 8,260,940 8,301,118 Indiana 3,976,241 4,116,924 4,221,123 4,536,205 4,521,329 4,246,189 4,246,189 4,308,845 5,550,469 5,550,469 Iowa 1,952,508 1,978,748 1,992,803 1,977,909 2,003,723 2,033,417 2,040,873 2,093,649 1,989,663 2,145,333 Kansas 1,908,117 1,871,301 1,935,361 1,987,251 1,979,746 1,974,238 2,003,112 2,018,219 2,021,905 2,045,426 Kentucky 2,694,469 2,756,634 2,772,674 2,799,635 2,823,454 2,860,729 2,896,460 2,933,266 2,932,659 2,939,423 Louisiana 2,759,120 2,718,209 3,168,238 3,119,960 3,169,627 3,083,516 3,014,191 3,033,966 2,998,162 3,086,004 Maryland 3,382,451 3,451,966 3,523,311 3,552,187 3,594,251 3,709,594 3,694,290 3,737,847 3,786,650 3,904,685 Michigan 6,925,246 6,976,982 7,025,357 7,065,438 7,103,404 7,105,272 7,112,992 7,058,955 7,118,378 7,082,820 Minnesota 2,940,789 2,961,236 2,997,058 3,035,553 3,083,007 3,083,757 3,086,610 3,149,109 3,190,183 3,245,441 Missouri 3,856,271 3,862,300 3,931,448 3,965,610 4,047,652 4,135,394 4,139,632 4,161,957 4,196,682 4,217,910 Montana 678,899 683,351 694,743 704,509 712,880 715,512 723,976 735,753 738,982 737,964 Nebraska 1,195,219 1,267,284 1,275,206 1,311,332 1,315,819 1,320,617 1,327,916 1,330,698 1,346,406 1,349,295 New Jersey 5,654,973 5,715,089 5,711,794 5,728,975 5,799,532 5,870,720 5,834,227 5,782,155 5,782,155 5,923,538 New Mexico 1,239,043 1,231,701 1,243,894 1,236,488 1,271,365 1,304,721 1,338,246 1,365,249 1,365,249 1,377,983 New York 10,871,344 11,014,805 10,913,850 11,356,988 11,246,675 11,071,911 11,146,367 11,369,280 11,284,545 11,329,488 North Carolina 5,690,494 5,884,651 5,943,288 6,014,782 6,122,137 6,227,817 6,315,667 6,383,542 6,457,000 6,504,269 North Dakota 458,944 455,921 461,090 459,791 461,780 466,701 468,711 470,731 473,019 476,561 Ohio 8,205,524 7,736,115 7,707,870 7,656,362 7,675,007 7,707,842 7,739,410 7,975,774 7,962,266 7,937,498 Pennsylvania 8,229,490 8,226,202 8,323,741 8,369,575 8,430,142 8,460,530 8,526,204 8,600,691 8,646,273 8,687,206 South Carolina 2,842,553 2,849,885 2,918,957 2,918,957 2,972,369 2,987,593 3,067,747 3,126,890 3,185,408 3,268,498 Texas 13,462,023 13,045,727 13,184,629 13,498,071 14,543,528 14,659,390 14,906,701 15,184,123 15,374,063 15,374,063
Source: Annual Highway Statistics, Federal Highway Administration, Table DL‐20 269

State Data System: Crash Data Report 2000–2009
Exposure Data 3: Number of Licensed Drivers by State State 2000 2001 2002 2003 2004 2005 2006 2007 2008 2009
Utah 1,463,366 1,495,887 1,529,934 1,548,456 1,582,599 1,599,514 1,619,085 1,651,790 1,687,306 1,720,015 Virginia 4,836,993 4,920,753 5,158,232 5,045,857 5,112,523 5,178,156 5,210,685 5,259,512 5,301,182 5,347,745 Washington 4,154,501 4,237,845 4,381,417 4,407,269 4,504,581 4,681,927 4,790,864 4,879,705 4,953,872 5,026,521 Wisconsin 3,770,453 3,667,497 3,765,225 3,765,644 3,910,188 3,993,348 4,049,450 4,066,273 4,075,764 4,105,142 Wyoming 370,740 370,713 374,421 378,009 380,180 382,735 390,538 398,283 404,489 410,813
Source: Annual Highway Statistics, Federal Highway Administration, Table DL‐20 270

State Data System: Crash Data Report 2000–2009
APPENDIX IV
271

State Data System: Crash Data Report 2000–2009
First Harmful Event Categorization
Type of Event Category
Cargo/Equipment Loss or Shift Cross Centerline Cross Median Downhill Runaway Equipment Failure (blown tire, brake failure, etc.) Ran Off Roadway‐Left Ran Off Roadway‐Right Re‐Entering Roadway Separation of Units Vehicle Went Airborne
Non‐Harmful
Fell/Jumped from Vehicle Fire/Explosion Gas Inhalation Immersion Injured in Vehicle (Non‐Collision) Jackknife Pavement Surface Irregularity (ruts, potholes, grates, etc.) Rollover/Overturn Thrown or Falling Object Other Non‐Collision
Non‐Collision
Live Animal Non‐Motorist on Personal Conveyance Parked Motor Vehicle Pedalcyclist Pedestrian Railway Vehicle Ridden Animal or Animal‐Drawn Conveyance Working Motor Vehicle Other Object (Not Fixed)
Collision with Non‐Fixed Object
272

State Data System: Crash Data Report 2000–2009
Type of Event Category
Boulder Building Bridge Overhead Structure Bridge Pier or Support Bridge Rail (includes parapet) Cable Barrier Concrete Traffic Barrier Culvert Curb Ditch Embankment Fence Fire Hydrant Ground Guardrail End Guardrail Face Impact Attenuator/Crash Cushion Mail Box Other Post, Other Pole, or Other Supports Other Traffic Barrier Shrubbery Snow Bank Traffic Sign Support Traffic Signal Support Tree (standing only) Utility Pole/Light Support Wall Other Fixed Object
Collision with Fixed Object
Another Motor Vehicle in‐Transport Motor Vehicle in Transport Motor Vehicle in Motion Outside the Trafficway Motor Vehicle in Transport Strikes or Is Struck by
Collision With Motor Vehicle in Transport
273

Vehicle Type Categorization
Vehicle Type Category
Auto/automobile Compact car Large passenger car Mid‐size car Passenger car Passenger car with trailer Subcompact car Two‐door/four‐door sedan
Passenger Car
Full size van Panel truck/panel truck with trailer Pick‐up/pickup with trailer Sport utility vehicle Station wagon Truck less than 10,000 lbs. Utility vehicle Van/minivan
Light Truck
Heavy vehicle Logging truck Single‐unit truck Six‐wheel truck Ten‐wheel truck Tractor semi/double/triple trailer Trailer/freight trailer Truck over 10,000 lbs. Truck‐trailer combination Truck tractor only Truck tractor (bobtail) Two‐unit truck or multi‐unit truck
Large Truck
Dirt bike
Mini bike
Moped
Motorcycle
Motor scooter
Motorized bicycle
Motorcycle
274

Vehicle Type Category Activity bus Agriculture Bus
Bus
Bus (seats for 7–15 people, including driver)
Bus (seats for more than 15 people, including driver)
Commercial bus
Cross country bus
Privately owned church bus
School bus
Transit (city) bus
Other bus
Bus
All‐terrain vehicle Ambulance/rescue Combination vehicle Concrete mixer Dump truck Emergency vehicle Farm equipment/farm tractor Fire vehicle Garbage/refuse Go‐cart Highway construction equipment Limousine Maintenance/construction vehicle Military vehicle Motor home/recreational vehicle/camper Police vehicle Road equipment Snowmobile Taxi Other Unknown
Other/Unknown
275

DOT HS 812 052 August 2014
10735-072314-v3a