State Data Center Cost Allocation Plan Fiscal Year 2018 · State Data Center Cost Allocation Plan...
47
Last revised: October 2017 State Data Center Cost Allocation Plan Fiscal Year 2018 The Cost Allocation Plan is the State of Missouri’s initiative to develop a cost-based method to establish billing rates for Information Technology services and products. The Cost Allocation Plan works to ensure State of Missouri IT services are provided in a cost effective manner. 1 of 47
Transcript of State Data Center Cost Allocation Plan Fiscal Year 2018 · State Data Center Cost Allocation Plan...
Last revised: October 2017
State Data Center Cost Allocation Plan Fiscal Year 2018
The Cost Allocation Plan is the State of Missouri’s initiative to develop a cost-based method to establish billing rates for Information Technology services and products. The Cost Allocation Plan works to ensure State of Missouri IT services are provided in a cost effective manner.
1 of 47

TABLE of CONTENTS
INTRODUCTION, METHODOLOGY AND EXPLANATION OF TERMS .................................................................................. 3
BUDGET SUMMARY/BUDGET DETAILS .................................................................................................................. 7
BILLING RATES
CATEGORY 1: LINES/FEET PRINTED .................................................................................................................................. 13 CATEGORY 2: CPU SERVICE UNITS ................................................................................................................................... 14 CATEGORY 3: CICS TRANSACTIONS .................................................................................................................................. 16 CATEGORY 5: ZOS ENTERPRISE DATA BACKUP/GIGABYTE DAY .............................................................................................. 17 CATEGORY 7: AD & EXCHANGE ....................................................................................................................................... 18 CATEGORY 8: ZOS DATA STORAGE GIGABYTE/DAY ............................................................................................................. 19 CATEGORY 10: ZOS IDMS RUN UNITS ............................................................................................................................. 20 CATEGORY 11: ZOS DB2 SERVICE UNITS .......................................................................................................................... 21 CATEGORY 14: ALL FUSION CPU SERVICE UNITS ................................................................................................................ 22 CATEGORY 15: VM ...................................................................................................................................................... 23 CATEGORY 16: SAN ..................................................................................................................................................... 24 CATEGORY 17: PHYSICAL SERVER SUPPORT ........................................................................................................................ 25 CATEGORY 19: DISTSYS BACKUP-RECOVERY ...................................................................................................................... 26 CATEGORY 21: WEBSPHERE ........................................................................................................................................... 27 CATEGORY 23: SQL ...................................................................................................................................................... 28 CATEGORY 26: REMOTE SERVER SUPPORT ......................................................................................................................... 29 CATEGORY 27: VDI ...................................................................................................................................................... 30 CATEGORY 28: SFTP ............................................................................................................................................................ 31
CATEGORY 29: SHAREPOINT ........................................................................................................................................... 32 CATEGORY 32: ENTERPRISE FAX SERVICES ......................................................................................................................... 33
CATEGORY 33: SSRS .................................................................................................................................................... 34 CATEGORY 34: JIRA ..................................................................................................................................................... 35 CATEGORY 42: ONBASE ................................................................................................................................................ 36 CATEGORY 43: WEB UTILITY .......................................................................................................................................... 37
CATEGORY 44: MYSQL ................................................................................................................................................. 38 CATEGORY 45: WEB HOSTING..................................................................................................................................... 39 CATEGORY 47: TABLEAU ................................................................................................................................................ 40 CATEGORY 48: DB2LUW .............................................................................................................................................. 41 CATEGORY 49: BOX ..................................................................................................................................................... 42
FIVE YEAR RATE SUMMARY ................................................................................................................................. 43
AGENCY COMPARISON......................................................................................................................................... 44
2 of 47

SDC CAP
Introduction
The State Data Center’s Cost Allocation Plan was developed to establish a cost-based recovery method for the
State’s Information Technology Services. The benefits of the CAP are twofold. First, the CAP allows for a full-cost
recovery process of SDC services. Both, direct and indirect costs, are included in the full-cost recovery to minimize
under or over recovery of the SDC’s total budgeted costs. Secondly, each customer is treated in an equitable
manner, based on the resources used by that customer.
This document will provide the methodology used for determining the rates billed, an explanation of terms used,
summarized anticipated personnel expenses, itemized estimated expenditures for the SDC, a summarized list of
the costs per service with the rate calculation, an estimated billing based on utilization per customer, and a rate
comparison of the current year and the preceding four years.
Methodology
To develop the CAP, the following components were analyzed to establish the final SDC CAP rates.
Determination of the Rate Category for Services Provided: All services provided to the customer by the
SDC are identified and approved by the Chief Information Officer (CIO).
Units of Service: The unit of service used to measure the volume of the service provided by each CAP item
is established based on three criteria.
o The relationship to the function performed
o The measurability
o The controllability by the customer
Compilation of the Estimated Utilization by Customer: For each CAP item, the utilization by customer is
compiled and totaled to develop the basis for the billing rate computation.
Identify the Type of Cost: There are two types of costs identified in the CAP, allocated direct and
allocated indirect costs. Allocated direct costs are associated with personnel and equipment costs that
can be directly identified based on the type of service. Allocated indirect costs are related to support costs
for services provided by the SDC and cannot be identified by a specific type of service.
Determine the Allocated Direct Cost: Allocated direct costs are those costs budgeted for personnel,
equipment or other expenses that can be directly identified with providing a specific service. These costs
are accumulated to determine the total allocated direct costs associated with each type of service
provided.
Determine the Allocated Indirect Cost: Allocated indirect costs are those costs budgeted that are not
associated with a specific service. These costs are accumulated to determine the total allocated indirect
costs and prorated across each type of service provided.
Summarization of the Total Costs by Service: The summarized total cost by service is determined by
adding both direct and indirect allocated costs with job costs.
Calculated Rate per Unit of Service: The rate per unit of service is calculated by dividing the total annual
cost by the total estimated annual utilization.
3 of 47

SDC CAP
Explanation of Terms
Allocated Direct: The personnel services, equipment and other expenses directly identified with providing a service.
Allocated Indirect: The personnel services, equipment and other expenses indirectly identified with providing a
service.
All Fusion (COOL Gen) Service Units: An All Fusion Service unit is the translation of CPU resources used for batch
jobs and TSO transactions that occur while using the Cool Gen product.
Active Directory and Exchange: Active Directory (AD) is used to provide contact information globally. Exchange
services are those related to email provided by ITSD. The costs are based on the number of accounts and/or the
amount of email stored on the servers.
BOX.com: BOX.com is a cloud-based user-centric file collaboration/sharing/storage solution, which allows internal
and external users access to data. Access is granted based on the ownership of the data by the user, who
determines what users and access to the data. The State Data Center administers the State of Missouri Box
infrastructure
CICS Transaction: A CICS Transaction is a request made at a workstation. The request may be for a display of
information at that workstation or storage of information entered on the workstation.
CPU Priority Adjustment: CPU Priority Adjustments are based on the batch job priority class defined by the
customer and the time of day for TSO usage. Low priority jobs are billed at 75 percent of the normal CPU rate. Low
priority jobs are processed during the second and third shifts. Class One jobs are billed at 65 percent of the normal
CPU rate. These jobs are processed during weekends and holidays. TSO, CPU, and FOCUS CPU usage during non-
prime hours (5pm to 7am) and are billed at 75 percent of the normal CPU rate.
CPU Service Unit: The CPU resources used for the following batch jobs, TSO transactions, CICS transactions, IDMS
transactions, DB2 ClientServer transactions and FOCUS are monitored and measured to determine the CPU service
units. Service units used by DB2 transactions are reported under CISC, TSO and Batch.
DistSys Backup and Recovery: DistSys is an IBM software product used by the customer to backup servers and
workstations. The costs associated with this service are based on the amount of backup storage the customer uses.
DB2LUW: DB2 LUW is part of the IBM Universal Database Suite and runs on the distributed Windows, Linux, and
UNIX operating systems. IBM DB2 LUW is a relational DBMS system that provides a data platform for both
transactional and analytical operations.
Enterprise Fax Services: Enterprise Electronic Fax Service is a software product provided by Biscom. This service
allows for the electronic retrieval and sending of faxes. This service is managed by the SDC, but billed based on the
fax telephone number. Enterprise Fax charges will be invoiced on the Telecommunications invoice.
Laser Feet, Duplex Printing and Line Printed: Reports printed from the SDC Mainframe printer(s) is comprised of
the lines printed (impact) and/or the feet printed (laser/duplex) a cost is then assessed based on the printed line
and/or feet printed.
JIRA: JIRA is a software tool from Atlassian that can manage team activity and track issues. Many State Agencies
utilize this tool for software tracking.
Job Cost: Job costs are associated with the backup, maintenance and the monitoring of systems required providing
customer service by the SDC. The costs are applied based on the appropriate type of service.
MySQL: MySQL is an open-source relational database management system that runs on a Linux platform, and is a
central component of the widely used LAMP open-source web application software stack.
OnBase ECM: OnBase is State of MO standard Enterprise-level Electronic Content Management (ECM) system used
for the storage, retrieval and management of electronic content. Billing is based on “named” users.
4 of 47

SDC CAP
Physical Server Support: Physical Server Support encompasses the management of a physical server, including
the infrastructure. (This service was previously called Server Support.)
Remote Server Support: Remote Server Support encompasses the management, technical support and
hardware replacement for servers not located within the SDC.
Storage Area Network: SAN is the disk storage that is used by the Open System environment.
SharePoint: SharePoint services provide a vehicle to store, load and track documents, as well as provide a
resource for collaboration.
SQL Database Hosting Base Charge -All base costs associated with supporting customer databases are
included in the Database Hosting Base Charge except for the cost of the storage space for databases. The
base rate of the Database Hosting Base Charge is based upon the total number of all customer databases
supported by ITSD Database.
SQL Server Memory- The server memory comes into play when you have a dedicated server/instance to one
application. This maybe a large application on a COTS application that could have prerequisites for a large
amount of memory. With this charge we are simply passing on the cost of memory to the application.
SQL Database Hosting Overage Charge - Exclusive of the Database Hosting Base Charge is a separate Database
“overage” charge based upon the size of the database. Comparatively, the larger the database, the more disk
space, memory, support, and administration are needed to provide customer approved functionality and
performance. The Database Hosting Overage Charge accounts for the requirement of these additional
resources and is assessed on each additional gigabyte (GB) over 1 GB. Databases sized at less than or equal to
1 GB will not be assessed an overage charge.
SQL DBMS License Charge - The DBMS license charge comes into play when you have a dedicated
server/instance to one application. This maybe a large application or a COTS application that has prerequisites
for large amount of processing power. In order to keep the cost down for the DBMS systems, we are
leveraging putting on more databases on an instance/region. When the application needs large amount of
dedicated processing power, we have to have a way to bill this back. Most vendors now are basing their
licenses on cores and to keep this cost down in the virtual world we are building dedicated clusters of VM’s
and licensing every core. With this charge we are simply passing on the license cost of running the DBMS
software to the application.
SQL Server Reporting Services (SSRS): SSRS is the State of Missouri’s Enterprise standard for Reporting. SSRS is
a Microsoft product offering a full range of ready-to-use tools and services to help create, deploy, and manage
reports, as well as programming features that enable extending and customizing reporting functionality.
Tableau: Tableau is the State’s Enterprise Statistical Analysis platform. It can be used to connect to any data
source and present that data through a browser interface.
Virtual Desktop Infrastructure (VDI): VDI is the hosting of a desktop operating system within a virtual machine
(VM). The VM runs on a hosted, centralized server. Access to a VDI can be achieved with various end-point
devices.
Virtual Machine (VM): A VM uses specialized software to house the images of multiple servers on a single
machine.
WebSphere Application Server (WAS): WAS is an Enterprise IBM solution that provides the middleware
infrastructure to run and monitor round-the-clock, enterprise wide java web applications.
Web Hosting: Web Hosting is an Enterprise category that includes shared web services for IIS/.NET and LAMP
technologies. These technologies include both public facing and private facing web sites located on State
infrastructure.
Web Utility: Web Utility is an enterprise category which includes utility products related to web applications
and infrastructure. Products in this category include AppViewX, (a certificate management tool), SynRecovery,
5 of 47

SDC CAP
uDeploy (an application deployment automation tool), TFS, CSS, SVN, and GIT (all Code Repositories), Print
Services, and Tidal (a batch scheduler service), and load balancing services.
zOS Data Storage: zOS Data Storage provides direct access storage and is measured in gigabytes. The storage
is allocated for the customer and SDC data.
zOS DB2: The DB2 Service Unit is a translation of resources used by the DB2 product.
zOS Enterprise Data Backup: zOS Enterprise Data Backup is the utilization of data storage on tape format and
on HSM DASD. Utilization of storage is measured in gigabytes allocated to the customer and the SDC. (This was
previously called DSM.)
zOS IDMS: zOS IDMS run unit is an online or batch request to access data managed by the IDMS database
system.
6 of 47

SDC CAP
FY17 CAP FY18 CAP
Personal Services 6,011,607 5,623,727
Employee Benefits 2,695,005 2,599,937
Expense and Equipment 24,087,311 26,917,225Total Budgeted Costs 32,793,923 35,140,889
Number Description FY17 CAP FY18 CAP
Personal Services 6,011,607 5,623,727
Fringe Benefits 2,695,005 2,599,937
Total Personal Services and Fringe Benefits 8,706,612 8,223,663
Hardware Lease
103 CPU 573,990 573,990
105 DASD 432,242 108,061
106 DASD Growth 325,000 141,318
107 Deduplication/Replication HardwareLease 265,000 458,000
108 Disaster Recovery CPU (Springfield Site) 242,823 240,000
113 SAN DASD 1,169,215 860,000
Total Hardware Lease 3,008,270 2,381,369
Hardware Maintenance
205 DASD 68,000 230,000
206 Data Domain Server and Storage Maintenance 125,000 300,000
207 DistSys Backup Admin Servers Maint (TSM Win) 8,000 10,000
210 DistSys Fax Server Host Maintenance 7,918 7,918
214 External Coupling Facility 22,950 25,240
222 Print Burster/Trimmer/Stacker 120,000 110,000
223 Print Usage 165,000 150,000
224 Printer-Impact 5,000 5,000
225 Printer-Laser 74,000 86,000
229 Remote Server Maintenance 10,000 10,000
230 Service Processor 7,560 7,560
231 SAN Sever and Storage Maintenance 100,000 325,000
233 GTX Qualifier Maintenance 3,000 3,000
237 z/OS Virtual Tape 30,000 95,000
238 VM Server and Storage Maintenance 40,000 40,000
239 Batteries/UPS Maintenance 59,160 70,000
240 Generator Maintenance 8,129 8,129
243 VDI Server Maintenance 42,000 10,000
244 VDI Storage Maintenance 132,000 32,000
245 DistSys SVC Hardware Maint 20,000 10,000
246 QCX E138 MICR Verifier 1,395 1,395
Total Hardware Maintenance 1,049,112 1,536,242
Software Lease
303 Softek TDMF Replicator for zOS 48,141 27,000
305 BMC Mainview 115,791 115,791
306 CICS Transaction Gateway 51,666 55,000
307 CICS/TS V5 1,168,742 888,000
308 COBOL for MVS 159,361 112,000
309 Mackinney Software 8,800 8,800
State Data CenterBudget Summary
Budget Details
7 of 47
SDC CAP
Number Description FY17 CAP FY18 CAP
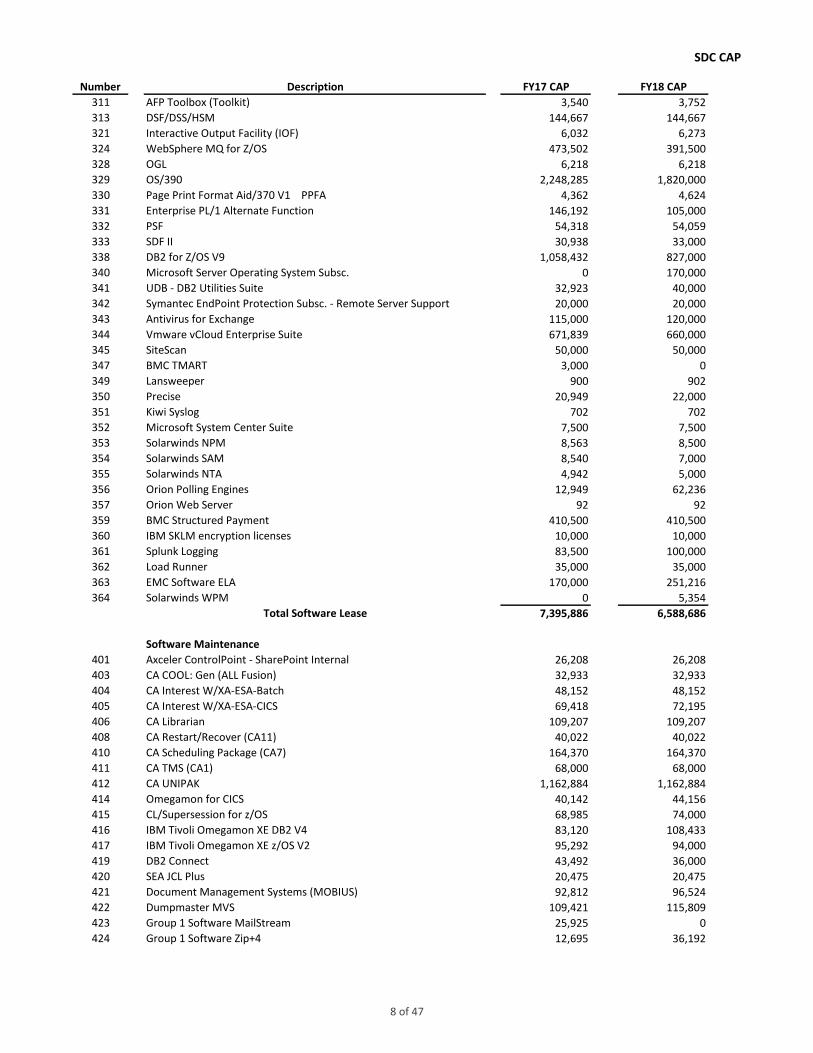
311 AFP Toolbox (Toolkit) 3,540 3,752
313 DSF/DSS/HSM 144,667 144,667
321 Interactive Output Facility (IOF) 6,032 6,273
324 WebSphere MQ for Z/OS 473,502 391,500
328 OGL 6,218 6,218
329 OS/390 2,248,285 1,820,000
330 Page Print Format Aid/370 V1 PPFA 4,362 4,624
331 Enterprise PL/1 Alternate Function 146,192 105,000
332 PSF 54,318 54,059
333 SDF II 30,938 33,000
338 DB2 for Z/OS V9 1,058,432 827,000
340 Microsoft Server Operating System Subsc. 0 170,000
341 UDB - DB2 Utilities Suite 32,923 40,000
342 Symantec EndPoint Protection Subsc. - Remote Server Support 20,000 20,000
343 Antivirus for Exchange 115,000 120,000
344 Vmware vCloud Enterprise Suite 671,839 660,000
345 SiteScan 50,000 50,000
347 BMC TMART 3,000 0
349 Lansweeper 900 902
350 Precise 20,949 22,000
351 Kiwi Syslog 702 702
352 Microsoft System Center Suite 7,500 7,500
353 Solarwinds NPM 8,563 8,500
354 Solarwinds SAM 8,540 7,000
355 Solarwinds NTA 4,942 5,000
356 Orion Polling Engines 12,949 62,236
357 Orion Web Server 92 92
359 BMC Structured Payment 410,500 410,500
360 IBM SKLM encryption licenses 10,000 10,000
361 Splunk Logging 83,500 100,000
362 Load Runner 35,000 35,000
363 EMC Software ELA 170,000 251,216
364 Solarwinds WPM 0 5,354
Total Software Lease 7,395,886 6,588,686
Software Maintenance
401 Axceler ControlPoint - SharePoint Internal 26,208 26,208
403 CA COOL: Gen (ALL Fusion) 32,933 32,933
404 CA Interest W/XA-ESA-Batch 48,152 48,152
405 CA Interest W/XA-ESA-CICS 69,418 72,195
406 CA Librarian 109,207 109,207
408 CA Restart/Recover (CA11) 40,022 40,022
410 CA Scheduling Package (CA7) 164,370 164,370
411 CA TMS (CA1) 68,000 68,000
412 CA UNIPAK 1,162,884 1,162,884
414 Omegamon for CICS 40,142 44,156415 CL/Supersession for z/OS 68,985 74,000
416 IBM Tivoli Omegamon XE DB2 V4 83,120 108,433
417 IBM Tivoli Omegamon XE z/OS V2 95,292 94,000
419 DB2 Connect 43,492 36,000
420 SEA JCL Plus 20,475 20,475
421 Document Management Systems (MOBIUS) 92,812 96,524
422 Dumpmaster MVS 109,421 115,809
423 Group 1 Software MailStream 25,925 0
424 Group 1 Software Zip+4 12,695 36,192
8 of 47

SDC CAP
Number Description FY17 CAP FY18 CAP
426 Symantec EndPoint Protection Subsc. 2,000 2,000
427 Red Hat Enterprise\Network Satellite Maint 60,000 80,000
428 Tivoli WAS\ND 139,906 139,906
429 Insync MVS 93,211 97,102431 Tic Toc 7,912 8,228432 DB2 LUW 8,943 0
433 Symantec EndPoint Protection Subsc. - VM 20,000 20,000
434 Connect:Direct 14,863 15,458
435 Merrill Consultants MXG 1,560 1,560
436 MVS Quick Reference 34,401 35,777
438 DistSys SSL Certificates 3,500 3,500
439 MoveIT Software Maint 6,252 9,615
440 Platinum DB2 Tools 781,536 781,536
441 RevealNet Reveal for DB2 90,000 90,000
442 MicroSoft Team Foundation Software Subscription 2,565 2,565
443 SAS Base 152,023 136,821
444 SAS/STAT 105,942 95,348
445 SAS/ACCESS 101,867 91,680
446 Rocket Software 25,000 25,000
447 SAS/ETS 105,942 95,348
448 EMC VTL License 15,000 15,000
451 SA Licenses for SQL 269,379 720,000
452 SI SYNC/SORT 29,719 29,719
453 SynRecovery software 1,000 1,000
454 SPC Systems Cobol RW Precompiler 2,935 3,052
456 Distributed Print Software Maintenance 37,250 0
457 DistSys Biscom Software Maintenance 10,000 20,000
458 DistSys SSRS Software Maintenance 17,981 24,210
460 Tivoli Storage Management 200,000 40,000
461 Maintenance for Foglight Replacement 10,000 0
462 Synthetic Monitoring Tool Maintenance 20,000 50,000
463 Vanguard Administration 59,260 64,001
465 Print Utilities Ricoh 0 75,000
466 CVS\SVN\GIT Maint 0 10,010
467 NETSCALER MAINTENANCE 42,120 42,120
468 SQL 105,977 105,977
469 VMWare Software Maintenance 247,042 261,400
470 Microsoft VDA Licensing (Software Subscription) 225,250 400,416
471 Catalog Recovery Software - zOS Enterprise Data Backup 5,405 5,405
472 SDI TN3270 Emulation 12,036 12,036
473 DB2 Maintenance 0 578,612
474 Software - Maintenance Renewals AD/Exchange 55,579 74,000
477 SAN Software 200,000 738,000
478 Vranger Software Maintenance 30,000 30,000
480 DistSys SolarWinds Storage Manager Maint 8,500 8,500
482 Software - Maintenance Renewals SharePoint 5,000 5,000
483 JIRA Software Maintenance plus plugin 10,868 10,868
486 z/OS Pitney Bowes Mail360 16,223 16,223
487 Solimar 15,750 15,750
488 NOC System Maintenance 20,000 0
489 uDeploy software Maintenance 0 50,000
490 Rocket software Fast Audit & Catalog audit 26,000 26,000
491 ITSM Tool Maintenance 0 120,000
492 Microsoft Exchange Server SA 0 448,257
493 IT Switch Moveit 2nd License 24,960 24,960
9 of 47
SDC CAP
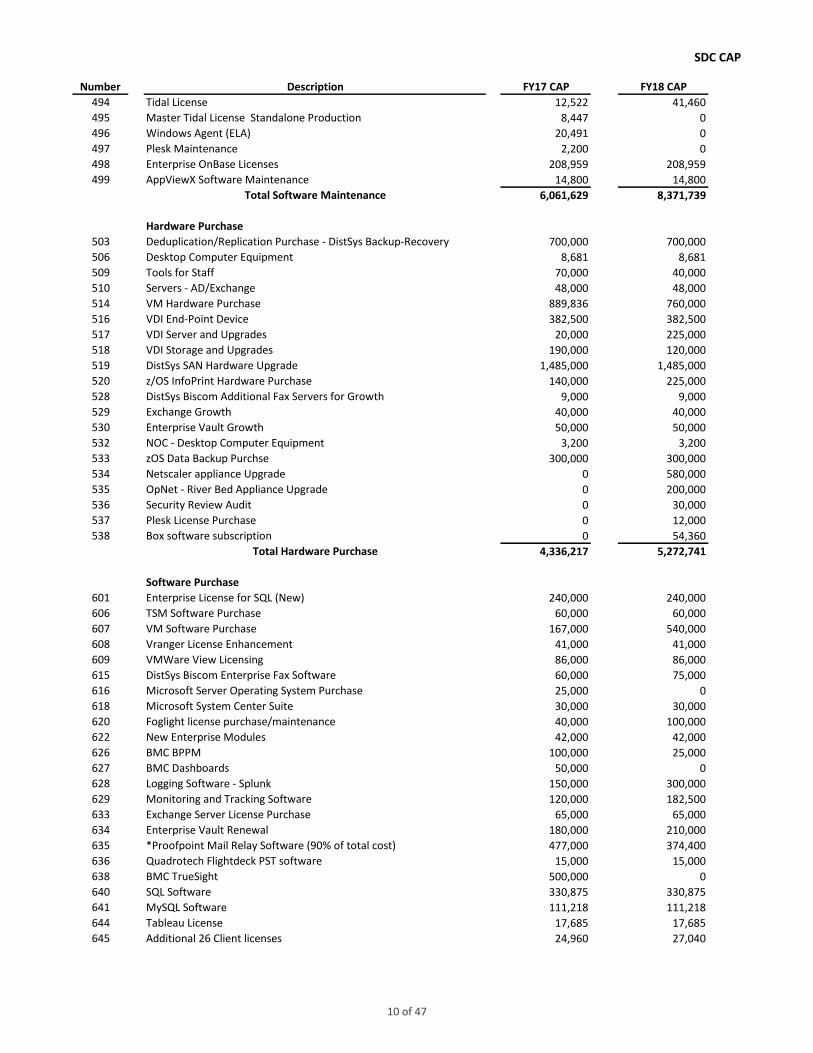
Number Description FY17 CAP FY18 CAP
494 Tidal License 12,522 41,460
495 Master Tidal License Standalone Production 8,447 0
496 Windows Agent (ELA) 20,491 0
497 Plesk Maintenance 2,200 0
498 Enterprise OnBase Licenses 208,959 208,959
499 AppViewX Software Maintenance 14,800 14,800
Total Software Maintenance 6,061,629 8,371,739
Hardware Purchase
503 Deduplication/Replication Purchase - DistSys Backup-Recovery 700,000 700,000
506 Desktop Computer Equipment 8,681 8,681
509 Tools for Staff 70,000 40,000
510 Servers - AD/Exchange 48,000 48,000
514 VM Hardware Purchase 889,836 760,000
516 VDI End-Point Device 382,500 382,500
517 VDI Server and Upgrades 20,000 225,000
518 VDI Storage and Upgrades 190,000 120,000
519 DistSys SAN Hardware Upgrade 1,485,000 1,485,000
520 z/OS InfoPrint Hardware Purchase 140,000 225,000
528 DistSys Biscom Additional Fax Servers for Growth 9,000 9,000
529 Exchange Growth 40,000 40,000
530 Enterprise Vault Growth 50,000 50,000
532 NOC - Desktop Computer Equipment 3,200 3,200
533 zOS Data Backup Purchse 300,000 300,000
534 Netscaler appliance Upgrade 0 580,000
535 OpNet - River Bed Appliance Upgrade 0 200,000
536 Security Review Audit 0 30,000
537 Plesk License Purchase 0 12,000
538 Box software subscription 0 54,360
Total Hardware Purchase 4,336,217 5,272,741
Software Purchase
601 Enterprise License for SQL (New) 240,000 240,000
606 TSM Software Purchase 60,000 60,000
607 VM Software Purchase 167,000 540,000
608 Vranger License Enhancement 41,000 41,000
609 VMWare View Licensing 86,000 86,000
615 DistSys Biscom Enterprise Fax Software 60,000 75,000
616 Microsoft Server Operating System Purchase 25,000 0
618 Microsoft System Center Suite 30,000 30,000
620 Foglight license purchase/maintenance 40,000 100,000
622 New Enterprise Modules 42,000 42,000
626 BMC BPPM 100,000 25,000
627 BMC Dashboards 50,000 0
628 Logging Software - Splunk 150,000 300,000
629 Monitoring and Tracking Software 120,000 182,500
633 Exchange Server License Purchase 65,000 65,000
634 Enterprise Vault Renewal 180,000 210,000
635 *Proofpoint Mail Relay Software (90% of total cost) 477,000 374,400
636 Quadrotech Flightdeck PST software 15,000 15,000
638 BMC TrueSight 500,000 0
640 SQL Software 330,875 330,875
641 MySQL Software 111,218 111,218
644 Tableau License 17,685 17,685
645 Additional 26 Client licenses 24,960 27,040
10 of 47

SDC CAP
Number Description FY17 CAP FY18 CAP
647 uDeploy additional Agents 0 50,277
648 AppViewX additional licenses 0 188
653 AD/EXCHANGE Quest MA 0 41,122
654 Rave Texting 0 1,000
Total Software Purchase 2,932,738 2,965,305
Expendable Supplies
704 Paper 300,000 400,000
705 Paper Storage and Transport-Fund Transfer F.M. 5,000 0
706 Printer Supplies 150,000 185,000
Total Expendable Supplies 455,000 585,000
General Support Expense
802 Consulting Service 60,000 50,000
807 IBM Server Support Line 45,000 45,000
808 MAN Connection/ANS Support/RLS Charges 112,800 112,800
811 Office Supplies, Equipment and Maintenance 12,500 50,000
812 Pagers & Cell Phones 8,000 16,000
813 Electrical Distribution, Maintenance 100,000 45,000
814 Postage/Inter Agency Mail Delivery 4,000 1,500
815 Printing and Binding 3,500 1,500
816 Racks, Cabinets, Furniture & Building Changes 100,000 60,000
818 S390 SoftwarExcel 158,980 174,878
820 Subscriptions & Publications 7,000 7,500
821 Telephone Service and Equipment 57,500 70,000
822 Training & Professional Development 10,000 22,500
823 Travel 15,000 27,000
824 Resource Oversight 35,000 35,000
825 VPN - Access Charge 3,000 3,000
827 SSL Certificates 4,000 2,000
828 Service Deployment Appliance 65,000 65,000
829 Shredding 1,500 2,000
830 SAN/NAS Support Line 30,000 20,000
831 Disaster Recovery Rental (Springnet) 115,000 450,000
832 Disaster Recovery Electric (Springnet) 38,000 111,000
833 RedHat/JBoss Support 6,000 0
835 AD & Exchange Contractor Services 50,000 50,000
836 AD & Exchange Training\Travel\Tools for Staff 22,500 22,500
837 FTP Staff Training\Travel\Tools for Staff 0 1,500
838 SAN Training\Travel\Tools for Staff 15,000 15,000
839 SQL Training \Travel\Tools for Staff 50,000 50,000
840 SharePoint Training \Travel\Tools for Staff 24,976 24,976
841 VM Training\Travel\Tools for Staff 5,000 5,000
842 TSM Training\Travel\Tools for Staff 10,000 10,000
844 Remote Server Support Training\Travel\Tools for Staff 5,000 0
845 WAS Training\Travel\Tools for Staff 18,000 9,000
848 VM Additional Charges for SharePoint 638 638
853 SSRS Training\Travel\Tools for Staff 2,000 2,000
857 Compco Software and Billing Expenses 98,000 98,000
858 Fiscal Costs 3,500 7,500
859 CPU Training\Travel\Tools for Staff 30,000 30,000
860 CICS Training\Travel\Tools for Staff 10,000 10,000
863 Watson & Walker Publication 1,323 1,323
869 SSL Training\Travel\Tools for Staff 12,600 8,000
870 Advantage Cert for AppViewX - SSL Certificate 188 0
11 of 47

SDC CAP
Number Description FY17 CAP FY18 CAP
872 NOC Training \Travel\Tools for Staff 35,000 35,000
873 Staff Training 19,500 19,500
874 VDI\Workstation 6,000 8,000
875 Microsoft Services for TFS Upgrade 10,000 0
876 Proofpoint consulting/support services 10,000 10,000
879 Biscom Tools, Utilities, Tranining 2,500 2,500
880 JIRA Training\Travel\Tools for Staff 1,500 1,500
881 MySQL Training \Travel\Tools for Staff 5,000 5,000
882 DB2 LUW Training\Travel\Tools for Staff 0 60,000
883 Tableau Training\Travel\Tools for Staff 3,500 2,000
884 ITSM Training 0 22,000
Total General Support Expense 1,443,505 1,882,615
Cost Adjustment
901 AD & Exchange Capital Cost -875,000 -138,000
902 AD & Exchange Depreciation 305,287 62,805
909 CPU Capital Cost -237,661 0
910 CPU Depreciation 373,505 108,126
911 DistSys Backup-Recovery Capital Cost -801,000 -760,000
912 DistSys Backup-Recovery Depreciation 479,688 328,274
913 Enterprise Fax Capital Cost -9,000 -9,000
914 Enterprise Fax Depreciation 9,248 12,872
919 Indirect Capital Cost -165,000 -79,360
920 Indirect Depreciation 112,112 0
923 Print Capital Cost -140,000 -225,000
924 Print Depreciation 118,568 107,087
927 Remote Server Support Capital Cost -25,000 0
928 Remote Server Support Depreciation 8,333 0
929 SAN Capital Cost -1,485,000 -1,485,000
930 SAN Depreciation 1,038,081 1,080,145
935 SQL Capital Cost -330,875 -342,525
936 SQL Depreciation 110,292 172,791
941 VDI Capital Cost -106,000 -345,000
942 VDI Depreciation 58,207 231,512
943 VM Capital Cost -1,096,836 -1,300,000
944 VM Depreciation 920,743 1,154,848
947 zOS Data Storage 0 42,767
951 zOS Enterprise Data Backup Capital Cost -300,000 -300,000
952 zOS Enterprise Data Backup Depreciation 208,303 109,890
959 NOC Capital Cost -953,200 -706,500
960 NOC Depreciation 317,734 200,000
967 OnBase ECM Capital Cost -42,000 -204,480
968 OnBase ECM Depreciation 14,000 46,497
971 MySQL Capital Cost -111,218 -111,218
972 MySQL Utility Depreciation 37,073 58,788
975 Tableau Utility Capital Cost -42,645 -17,685
976 Tableau Depreciation 14,215 3,537
977 WAS Depreciation 0 95,357
978 Web Utility Capital Cost 0 -580,000
979 Web Utility Depreciation 0 122,000Total Cost Adjustment -2,595,046 -2,666,472
Total Expense and Equipment 24,087,310 26,917,225
Grand Total 32,793,922 35,140,889
12 of 47
SDC CAP
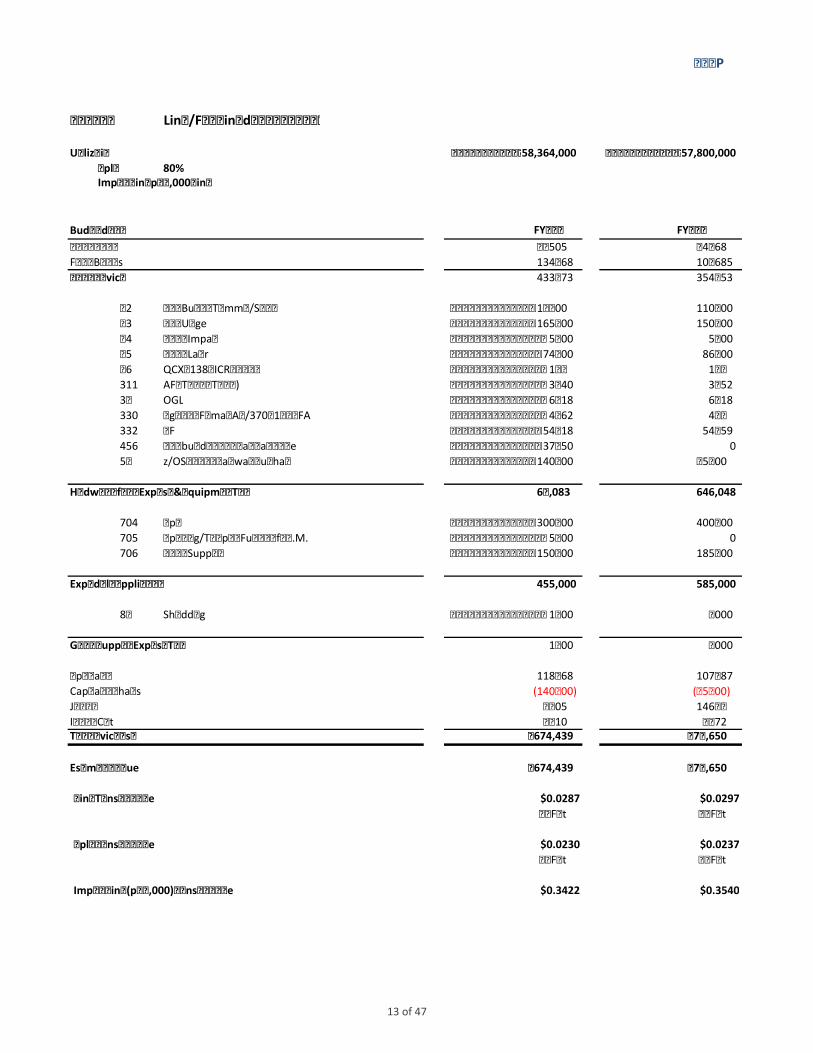
Category # 1 Lines/Feet Printed
Utilization 58,364,000 57,800,000
Duplex 80%
Impact Print per 1,000 Lines
Budgeted Costs FY17 CAP FY18 CAP
Direct Personnel 299,505 244,668
Fringe Benefits 134,268 109,685
Personal Services 433,773 354,353
222 Print Burster/Trimmer/Stacker 120,000 110,000
223 Print Usage 165,000 150,000
224 Printer-Impact 5,000 5,000
225 Printer-Laser 74,000 86,000
246 QCX E138 MICR Verifier 1,395 1,395
311 AFP Toolbox (Toolkit) 3,540 3,752
328 OGL 6,218 6,218
330 Page Print Format Aid/370 V1 PPFA 4,362 4,624
332 PSF 54,318 54,059
456 Distributed Print Software Maintenance 37,250 0
520 z/OS InfoPrint Hardware Purchase 140,000 225,000
Hardware/Software Expense & Equipment Total 611,083 646,048
704 Paper 300,000 400,000
705 Paper Strg/Transport-Fund Transfer F.M. 5,000 0
706 Printer Supplies 150,000 185,000
Expendable Supplies Total 455,000 585,000
829 Shredding 1,500 2,000
General Support Expense Total 1,500 2,000
Depreciation 118,568 107,087
Capital Purchases (140,000) (225,000)
Job Costs 94,705 146,490
Indirect Cost 99,810 99,672
Total Service Costs 1,674,439 1,715,650
Estimated Revenue 1,674,439 1,715,650
Print Transaction Rate $0.0287 $0.0297
Per Foot Per Foot
Duplex Transaction Rate $0.0230 $0.0237
Per Foot Per Foot
Impact Print (per 1,000) Transaction Rate $0.3422 $0.3540
13 of 47
SDC CAP
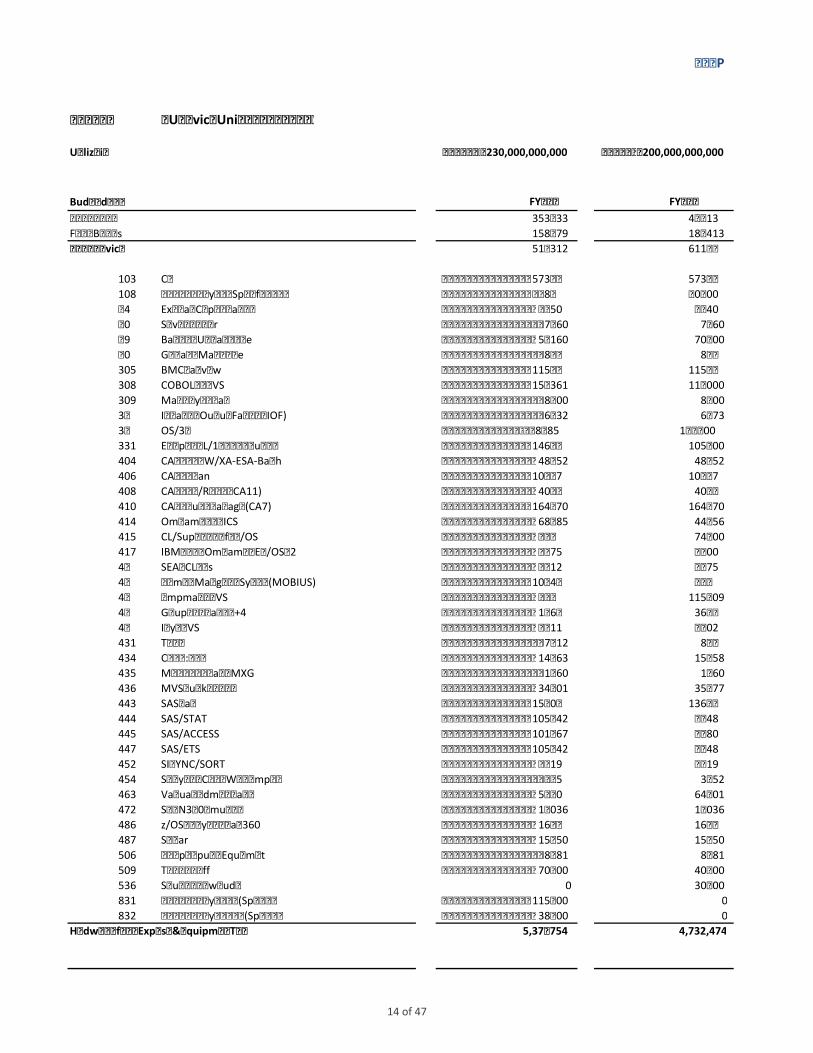
Category # 2 CPU Service Units
Utilization 1,230,000,000,000 1,200,000,000,000
Budgeted Costs FY17 CAP FY18 CAP
Direct Personnel 353,733 422,513
Fringe Benefits 158,579 189,413
Personal Services 512,312 611,926
103 CPU 573,990 573,990
108 Disaster Recovery CPU (Springfield Site) 242,823 240,000
214 External Coupling Facility 22,950 25,240
230 Service Processor 7,560 7,560
239 Batteries/UPS Maintenance 59,160 70,000
240 Generator Maintenance 8,129 8,129
305 BMC Mainview 115,791 115,791
308 COBOL for MVS 159,361 112,000
309 Mackinney Software 8,800 8,800
321 Interactive Output Facility (IOF) 6,032 6,273
329 OS/390 2,248,285 1,820,000
331 Enterprise PL/1 Alternate Function 146,192 105,000
404 CA Interest W/XA-ESA-Batch 48,152 48,152
406 CA Librarian 109,207 109,207
408 CA Restart/Recover (CA11) 40,022 40,022
410 CA Scheduling Package (CA7) 164,370 164,370
414 Omegamon for CICS 68,985 44,156
415 CL/Supersession for z/OS 95,292 74,000
417 IBM Tivoli Omegamon XE z/OS V2 20,475 94,000
420 SEA JCL Plus 92,812 20,475
421 Document Management Systems (MOBIUS) 109,421 96,524
422 Dumpmaster MVS 25,925 115,809
424 Group 1 Software Zip+4 12,695 36,192
429 Insync MVS 93,211 97,102
431 Tic Toc 7,912 8,228
434 Connect:Direct 14,863 15,458
435 Merrill Consultants MXG 1,560 1,560
436 MVS Quick Reference 34,401 35,777
443 SAS Base 152,023 136,821
444 SAS/STAT 105,942 95,348
445 SAS/ACCESS 101,867 91,680
447 SAS/ETS 105,942 95,348
452 SI SYNC/SORT 29,719 29,719
454 SPC Systems Cobol RW Precompiler 2,935 3,052
463 Vanguard Administration 59,260 64,001
472 SDI TN3270 Emulation 12,036 12,036
486 z/OS Pitney Bowes Mail360 16,223 16,223
487 Solimar 15,750 15,750
506 Desktop Computer Equipment 8,681 8,681
509 Tools for Staff 70,000 40,000
536 Security Review Audit 0 30,000
831 Disaster Recovery Rental (Springnet) 115,000 0
832 Disaster Recovery Electric (Springnet) 38,000 0
Hardware/Software Expense & Equipment Total 5,371,754 4,732,474
14 of 47

SDC CAP
Expendable Supplies Total 0 0
818 S390 SoftwarExcel 158,980 174,878
859 CPU Training\Travel\Tools for Staff 30,000 30,000
863 Watson & Walker Publication 1,323 1,323
General Support Expense Total 190,303 206,201
Depreciation 373,505 108,126
Capital Purchases (237,661) 0
Job Costs 397,412 911,837
Indirect Cost 1,494,202 383,820
Total Service Costs 8,101,827 6,954,384
Estimated Revenue 8,101,827 6,954,384
Transaction Rate $0.0066 $0.0058
Per 1,000 Service Units Per 1,000 Service Units
Prime/Peak Time Utilization for CPU will be billed at 100% of the CPU Rate
Non-Prime/Off Hours Utilization for CPU will be billed at 75% of the CPU Rate.
Low Priority Utilization for CPU will be billed at 65% of the CPU Rate.
15 of 47
SDC CAP
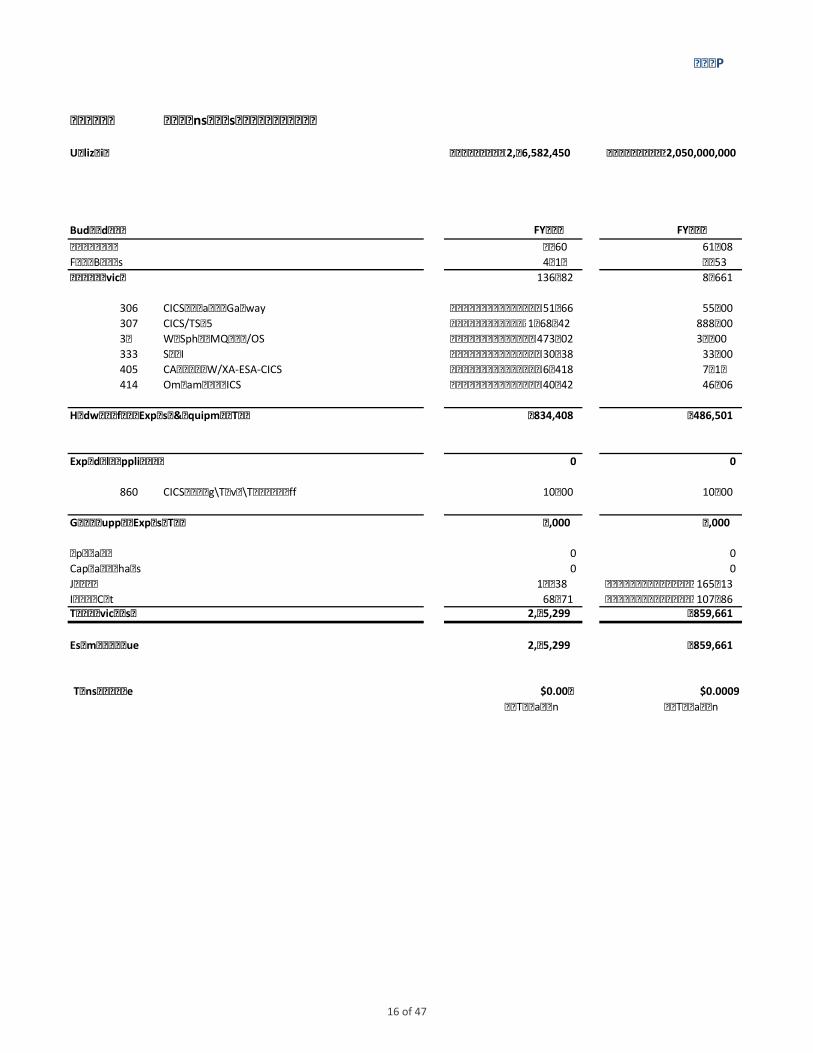
Category # 3 CICS Transactions
Utilization 2,186,582,450 2,050,000,000
Budgeted Costs FY17 CAP FY18 CAP
Direct Personnel 93,960 61,908
Fringe Benefits 42,122 27,753
Personal Services 136,082 89,661
306 CICS Transaction Gateway 51,666 55,000
307 CICS/TS V5 1,168,742 888,000
324 WebSphere MQ for Z/OS 473,502 391,500
333 SDF II 30,938 33,000
405 CA Interest W/XA-ESA-CICS 69,418 72,195
414 Omegamon for CICS 40,142 46,806
Hardware/Software Expense & Equipment Total 1,834,408 1,486,501
Expendable Supplies Total 0 0
860 CICS Training\Travel\Tools for Staff 10,000 10,000
General Support Expense Total 10,000 10,000
Depreciation 0 0
Capital Purchases 0 0
Job Costs 126,738 165,913
Indirect Cost 68,071 107,586
Total Service Costs 2,175,299 1,859,661
Estimated Revenue 2,175,299 1,859,661
Transaction Rate $0.0010 $0.0009
Per Transaction Per Transaction
16 of 47

SDC CAP
Category # 5
Utilization 133,806,080 155,000,000
Budgeted Costs FY17 CAP FY18 CAP
Direct Personnel 59,250 67,728
Fringe Benefits 26,561 30,362
Personal Services 85,811 98,090
233 GTX Qualifier Maintenance 3,000 3,000
237 z/OS Virtual Tape 30,000 95,000
411 CA TMS (CA1) 68,000 68,000
446 Rocket Software 25,000 25,000
448 EMC VTL License 15,000 15,000
471 Catalog Recovery Software - zOS Data Backup 5,405 5,405
533 zOS Data Backup Purchase 300,000 300,000
Hardware/Software Expense & Equipment Total 446,405 511,405
Expendable Supplies Total 0 0
General Support Expense Total 0 0
Depreciation J952 208,303 109,890
Capital Purchases (300,000) (300,000)
Job Costs 28,190 43,464
Indirect Cost 90,521 28,446
Total Service Costs 559,230 491,295
Estimated Revenue 559,230 491,295
Transaction Rate $0.0042 $0.0032
Per GB Per Day Per GB Per Day
zOS Data Backup GB/Day
17 of 47

SDC CAP
Category # 7 AD\Exchange
Utilization AD/Exchange 527,784 525,565
Utilization AD User ID 762,000 260,388
Budgeted Costs FY17 CAP FY18 CAP
Direct Personnel 497,437 497,953
Fringe Benefits 223,001 223,232
Personal Services 720,438 721,185
343 Antivirus for Exchange 115,000 120,000
438 DistSys SSL Certificates 3,500 3,500
474 Software - Maintenance Renewals AD/Exchange 55,579 74,000
510 Servers - AD/Exchange 48,000 48,000
514 VM Hardware 10,000 0
529 Exchange Growth 40,000 40,000
530 Enterprise Vault Growth 50,000 50,000
633 Exchange Server License Purchase 65,000 65,000
634 Enterprise Vault Renewal 180,000 210,000
635 *Proofpoint Mail Relay Software (90% of total cost) 477,000 374,400
636 Quadrotech Flightdeck PST software 15,000 15,000
653 AD/EXCHANGE Quest MA 41,122
Hardware/Software Expense & Equipment Total 1,059,079 1,041,022
Expendable Supplies Total 0 0
808 MAN Connection/ANS Support/RLS Charges 112,800 112,800
835 AD & Exchange Contractor Services 50,000 50,000
836 AD & Exchange Training\Travel\Tools for Staff 22,500 22,500
876 Proofpoint consulting/support services 10,000 10,000
General Support Expense Total 195,300 195,300
Depreciation J902 305,287 62,805
Capital Purchases (875,000) (138,000)
Job Costs 89,847 1,331,538
Indirect Cost 1,292,205 127,673
Total Service Costs 2,787,156 3,341,523
Estimated Revenue 2,787,156 3,341,523
AD-Exchange Rate AD-Exchange Rate
Transaction Rate 90% $4.75 $5.72
AD User ID Rate AD User ID Rate
Transaction Rate 10% $0.37 $1.28
18 of 47

SDC CAP
Category # 8
Utilization 26,163,200 11,000,000
Budgeted Costs FY17 CAP FY18 CAP
Direct Personnel 45,432 53,004
Fringe Benefits 20,367 23,762
Personal Services 65,799 76,766
105 DASD 432,242 108,061
106 DASD Growth 325,000 141,318
205 DASD 68,000 230,000
303 Softek TDMF Replicator for zOS 48,141 27,000
313 DSF/DSS/HSM 144,667 144,667
360 IBM SKLM encryption licenses 10,000 10,000
490 Rocket software Fast Audit & Catalog audit 26,000 26,000
Hardware/Software Expense & Equipment Total 1,054,050 687,046
Expendable Supplies Total 0 0
General Support Expense Total 0 0
Depreciation 0 42,767
Capital Purchases 0 0
Job Costs 71,663 79,481
Indirect Cost 0 54,709
Total Service Costs 1,191,512 940,768
Estimated Revenue 1,191,512 940,768
Transaction Rate $0.0455 $0.0855
Per GB Per Day Per GB Per Day
zOS Data Storage GB/Day
19 of 47

SDC CAP
Category # 10 zOS IDMS
Utilization 358,018,159 358,018,159
Budgeted Costs FY17 CAP FY18 CAP
Direct Personnel 96,724 94,176
Fringe Benefits 43,361 42,219
Personal Services 140,085 136,395
412 CA UNIPAK 1,162,884 1,162,884
Hardware/Software Expense & Equipment Total 1,162,884 1,162,884
Expendable Supplies Total 0 0
General Support Expense Total 0 0
Depreciation 0 0
Capital Purchases 0 0
Job Costs 83,381 131,613
Indirect Cost 150,991 88,127
Total Service Costs 1,537,341 1,519,019
Estimated Revenue 1,537,341 1,519,019
Transaction Rate $0.0043 $0.0042
Per Run Unit Per Run Unit
20 of 47

SDC CAP
Category # 11 zOS DB2
Utilization 1,151,366,410,556 870,000,000,000
Budgeted Costs FY17 CAP FY18 CAP
Direct Personnel 193,448 218,868
Fringe Benefits 86,723 98,119
Personal Services 280,171 316,987
338 DB2 for Z/OS V9 1,058,432 827,000
341 UDB - DB2 Utilities Suite 32,923 40,000
416 IBM Tivoli Omegamon XE DB2 V4 83,120 108,433
419 DB2 Connect 43,492 36,000
432 DB2 LUW 8,943 0
440 Platinum DB2 Tools 781,536 781,536
441 BMC SQL Performance 90,000 90,000
Hardware/Software Expense & Equipment Total 2,098,446 1,882,969
Expendable Supplies Total 0 0
General Support Expense Total 0 0
Depreciation 0 0
Capital Purchases 0 0
Job Costs 152,216 239,778
Indirect Cost 183,448 149,218
Total Service Costs 2,714,281 2,588,953
Estimated Revenue 2,714,281 2,588,953
Transaction Rate $0.0024 $0.0030
Per 1,000 Service Units Per 1,000 Service Units
21 of 47

SDC CAP
Category # 14
Utilization 6,353,044,312 1,800,000,000
Budgeted Costs FY17 CAP FY18 CAP
Direct Personnel 41,453 0
Fringe Benefits 18,583 0
Personal Services 60,036 0
403 CA COOL: Gen (ALL Fusion) 32,933 32,933
Hardware/Software Expense & Equipment Total 32,933 32,933
Expendable Supplies Total 0 0
General Support Expense Total 0 0
Depreciation 0 0
Capital Purchases 0 0
Job Costs 5,949 3,245
Indirect Cost 0 2,234
Total Service Costs 98,918 38,412
Estimated Revenue 98,918 38,412
Transaction Rate $0.0156 $0.0213
Per 1,000 Service Units Per 1,000 Service Units
All Fusion
22 of 47

SDC CAP
Category # 15 VM
Utilization 26,256 30,000
Budgeted Costs FY17 CAP FY18 CAP
Direct Personnel 248,719 250,566
Fringe Benefits 111,501 112,329
Personal Services 360,220 362,895
238 VM Server and Storage Maintenance 40,000 40,000
344 Vmware vCloud Enterprise Suite 671,839 660,000
427 Red Hat Enterprise\Network Satellite Maint 60,000 80,000
433 Symantec EndPoint Protection Subsc. - VM 20,000 20,000
514 VM Hardware Purchase 889,836 760,000
607 VM Software Purchase 167,000 540,000
620 Foglight license purchase/maintenance 40,000 100,000
Hardware/Software Expense & Equipment Total 1,879,777 2,200,000
Expendable Supplies Total 0 0
807 IBM Server Support Line 45,000 45,000
841 VM Training\Travel\Tools for Staff 5,000 5,000
General Support Expense Total 50,000 50,000
Depreciation J944 920,743 1,154,848
Capital Purchases (1,096,836) (1,300,000)
Job Costs 135,276 467,173
Indirect Cost 516,303 167,382
Total Service Costs 2,765,483 3,102,298
Estimated Revenue 2,765,483 3,102,298
Transaction Rate $105.33 $103.41
Per Image Per Month Per Image Per Month
An additional charge of $7 per Month extra for every one (1) gb of memory over our standard Configuration.
An additional charge of $11 per Month extra for every one (1) additional virtual CPU over 3 vCPUs..
23 of 47

SDC CAP
Category # 16 SAN
Utilization 12,327,322 15,000,000
Budgeted Costs FY17 CAP FY18 CAP
Direct Personnel 82,906 92,568
Fringe Benefits 37,167 41,498
Personal Services 120,073 134,066
113 SAN DASD 1,169,215 860,000
231 SAN Sever and Storage Maintenance 100,000 325,000
245 DistSys SVC Hardware Maint 20,000 10,000
477 SAN Software 200,000 738,000
480 DistSys SolarWinds Storage Manager Maint 8,500 8,500
519 DistSys SAN Hardware Upgrade 1,485,000 1,485,000
Hardware/Software Expense & Equipment Total 2,982,715 3,426,500
Expendable Supplies Total 0 0
830 SAN/NAS Support Line 30,000 20,000
838 SAN Training\Travel\Tools for Staff 15,000 15,000
General Support Expense Total 45,000 35,000
Depreciation 1,038,081 1,080,145
Capital Purchases (1,485,000) (1,485,000)
Job Costs 172,838 314,415
Indirect Cost 146,152 216,419
Total Service Costs 3,019,859 3,721,545
Estimated Revenue 3,019,859 3,721,545
Transaction Rate $0.2450 $0.2481
Per GB Per Month Per GB Per Month
24 of 47

SDC CAP
Category # 17
Utilization 1,368 1,051
Budgeted Costs FY17 CAP FY18 CAP
Direct Personnel 55,271 52,143
Fringe Benefits 24,778 23,376
Personal Services 80,049 75,519
426 Symantec EndPoint Protection Subsc. 2,000 2,000
Hardware/Software Expense & Equipment Total 2,000 2,000
Expendable Supplies Total 0 0
General Support Expense Total 0 0
Depreciation 0 0
Capital Purchases 0 0
Job Costs 5,251 7,639
Indirect Cost 116,921 5,258
Total Service Costs 204,221 90,416
Estimated Revenue 204,221 90,416
Transaction Rate $149.2844 $86.0283
Per Server Per Month Per Server Per Month
Physical Server Support
25 of 47
SDC CAP
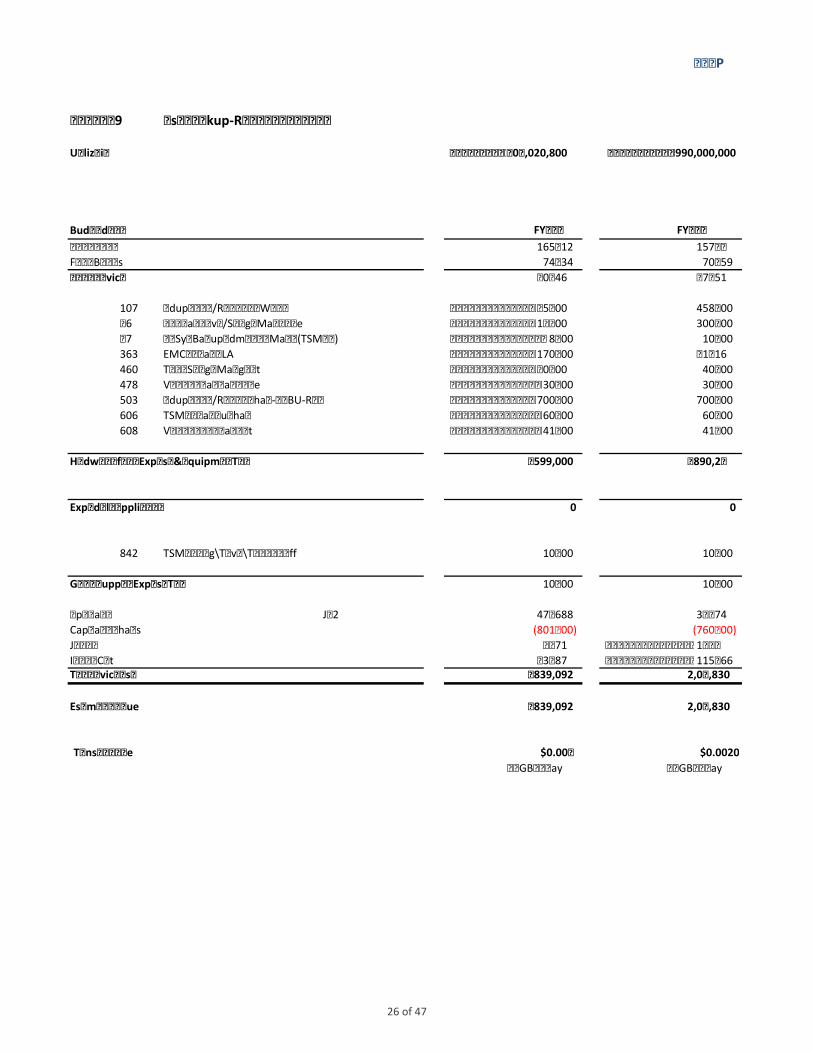
Category # 19
Utilization 1,011,020,800 990,000,000
Budgeted Costs FY17 CAP FY18 CAP
Direct Personnel 165,812 157,392
Fringe Benefits 74,334 70,559
Personal Services 240,146 227,951
107 Deduplication/Replication HW Lease 265,000 458,000
206 Data Domain Server/Storage Maintenance 125,000 300,000
207 DistSys Backup Admin Srvr Maint (TSM Win) 8,000 10,000
363 EMC Software ELA 170,000 251,216
460 Tivoli Storage Management 200,000 40,000
478 Vranger Software Maintenance 30,000 30,000
503 Deduplication/Replct Purchase-DistBU-Rcvry 700,000 700,000
606 TSM Software Purchase 60,000 60,000
608 Vranger License Enhancement 41,000 41,000
Hardware/Software Expense & Equipment Total 1,599,000 1,890,216
Expendable Supplies Total 0 0
842 TSM Training\Travel\Tools for Staff 10,000 10,000
General Support Expense Total 10,000 10,000
Depreciation J912 479,688 328,274
Capital Purchases (801,000) (760,000)
Job Costs 97,771 199,323
Indirect Cost 213,487 115,066
Total Service Costs 1,839,092 2,010,830
Estimated Revenue 1,839,092 2,010,830
Transaction Rate $0.0018 $0.0020
Per GB Per Day Per GB Per Day
DistSys Backup-Recovery
26 of 47

SDC CAP
Category # 21 WAS
Utilization 13,620 13,000
Budgeted Costs FY17 CAP FY18 CAP
Direct Personnel 132,650 128,774
Fringe Benefits 59,467 57,729
Personal Services 192,117 186,503
428 Tivoli WAS\ND 139,906 139,906
Hardware/Software Expense & Equipment Total 139,906 139,906
Expendable Supplies Total 0 0
845 WAS Training\Travel\Tools for Staff 18,000 9,000
General Support Expense Total 18,000 9,000
Depreciation J946 0 95,357
Capital Purchases 0 0
Job Costs 22,399 131,341
Indirect Cost 205,814 29,218
Total Service Costs 578,236 591,325
Estimated Revenue 578,236 591,325
Transaction Rate $42.45 $45.49
Per JVM Heap Size Per JVM Heap Size
27 of 47

SDC CAP
Category # 23 SQL
Utilization-Base 43% 39,756 41,600
Utilization-Memory per GB 4% 17,940 23,000
Utilization-Overage GB per Month 30% 789,264 950,000
Utilization-License per Month 23% 5,544 6,400
Budgeted Costs FY17 CAP FY18 CAP
Direct Personnel 555,472 526,828
Fringe Benefits 249,018 236,177
Personal Services 804,490 763,005
451 SA Licenses for SQL 269,379 720,000
601 Enterprise License for SQL (New) 240,000 240,000
640 SQL Software 330,875 330,875
Hardware/Software Expense & Equipment Total 840,254 1,290,875
Expendable Supplies Total 0 0
839 SQL Training \Travel\Tools for Staff 50,000 50,000
General Support Expense Total 50,000 50,000
Depreciation J936 110,292 172,791
Capital Purchases (330,875) (342,525)
Job Costs 94,336 679,663
Indirect Cost 1,004,822 131,189
Total Service Costs 2,573,319 2,744,998
Estimated Revenue 2,573,319 2,744,998
Base Transaction Rate 27.83 28.37
Memory Transaction Rate 4.30 4.77
Overage Transaction Rate 0.98 0.87
License Transaction Rate 106.76 98.65
28 of 47

SDC CAP
Category # 26 Remote Server Support
Utilization 3,636 3,200
Budgeted Costs FY17 CAP FY18 CAP
Direct Personnel 179,630 179,877
Fringe Benefits 80,528 80,639
Personal Services 260,158 260,516
229 Remote Server Maintenance 10,000 10,000
340 Microsoft Server Operating System Subsc. 20,000 170,000
342 Symantec EndPoint Protection Subsc.-RSS 25,000 20,000
Hardware/Software Expense & Equipment Total 55,000 200,000
Expendable Supplies Total 0 0
844 Remote Srvr Training\Travel\Tools for Staff 5,000 0
General Support Expense Total 5,000 0
Depreciation 8,333 0
Capital Purchases (25,000) 0
Job Costs 19,421 45,380
Indirect Cost 116,921 31,236
Total Service Costs 439,833 537,131
Estimated Revenue 439,833 537,131
Transaction Rate $120.9662 $167.8536
Per Server Per Month Per Server Per Month
29 of 47

SDC CAP
Category # 27 VDI
Utilization 42,250 49,500
Budgeted Costs FY17 CAP FY18 CAP
Direct Personnel 0 0
Fringe Benefits 0 0
Personal Services 0 0
243 VDI Server Maintenance 42,000 10,000
244 VDI Storage Maintenance 132,000 32,000
469 VMWare Software Maintenance 247,042 261,400
470 Microsoft VDA Licensing (Subscription) 225,250 400,416
492 Office 365 ProPlus 0 448,257
516 VDI End-Point Device 382,500 382,500
517 VDI Server and Upgrades 20,000 225,000
518 VDI Storage and Upgrades 190,000 120,000
609 VMWare View Licensing 86,000 86,000
Hardware/Software Expense & Equipment Total 1,324,792 1,965,573
Expendable Supplies Total 0 0
General Support Expense Total 0 0
Depreciation 58,203 231,512
Capital Purchases (106,000) (345,000)
Job Costs 0 0
NOC 81,719 182,506
Indirect Cost 29,230 125,623
Total Service Costs 1,387,944 2,160,214
Estimated Revenue 1,387,944 2,160,214
Transaction Rate VDI with Thin Client per month $32.85 $43.64
Transaction Rate VDI per month $40.59
Transaction Rate VDI - RDP Pool $8.21 $10.91
An additional charge of $7 per Month extra for every one (1) gb of memory over our standard Configuration.
An additional charge of $11 per Month extra for every one (1) additional virtual CPU over 2 vCPUs..
30 of 47

SDC CAP
Category # 28 sFTP
Utilization - 37,668
Budgeted Costs FY17 CAP FY18 CAP
Direct Personnel 0 28,056
Fringe Benefits 0 12,578
Personal Services 0 40,634
439 MoveIT Software Maint 0 9,615
Hardware/Software Expense & Equipment Total 0 9,615
Expendable Supplies Total 0 0
837 FTP Staff Training\Travel\Tools for Staff 0 1,500
General Support Expense Total 0 1,500
Depreciation 0 0
Capital Purchases 0 0
Job Costs 0 5,099
Indirect Cost 0 3,510
Total Service Costs 0 60,358
Estimated Revenue 0 60,358
Transaction Rate $0.00 $1.60
Per Unit Per Month Per Unit Per Month
sFTP services are included in the Web Combined category for fiscal year 2017. This is separated out for FY18.
31 of 47
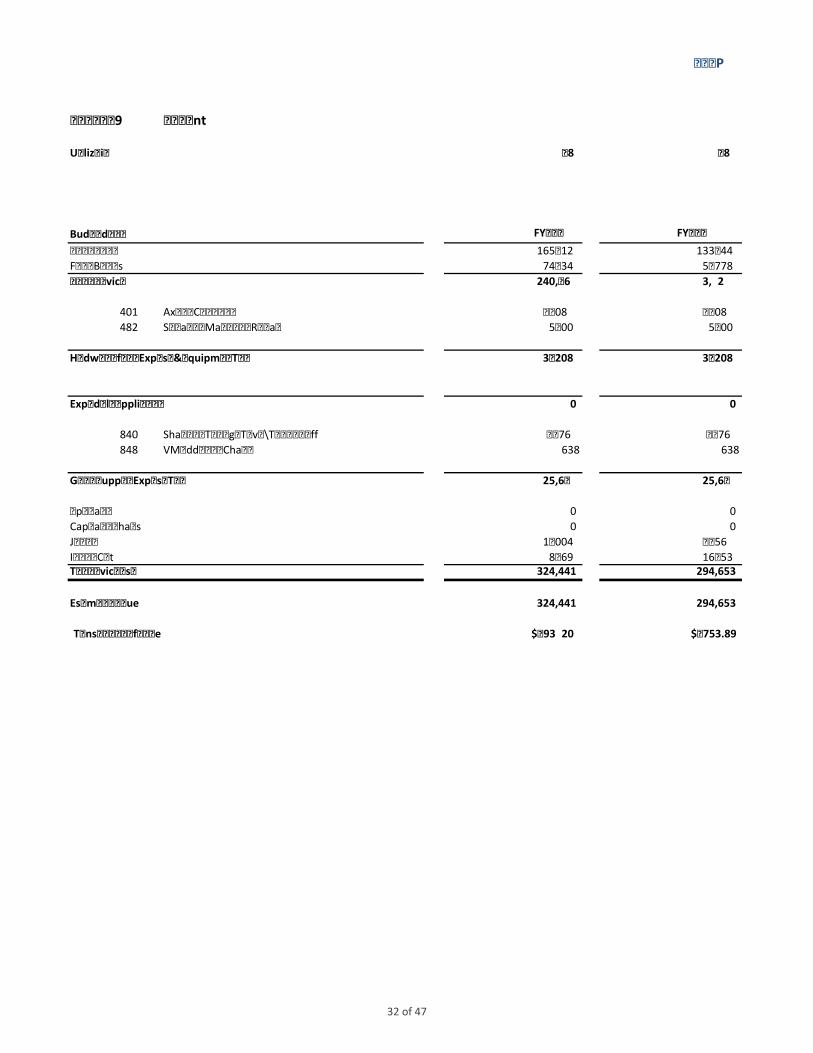
SDC CAP
Category # 29 SharePoint
Utilization 168 168
Budgeted Costs FY17 CAP FY18 CAP
Direct Personnel 165,812 133,344
Fringe Benefits 74,334 59,778
Personal Services 240,146 193,122
401 Axceler ControlPoint 26,208 26,208
482 Software - Maintenance Renewals 5,000 5,000
Hardware/Software Expense & Equipment Total 31,208 31,208
Expendable Supplies Total 0 0
840 SharePoint Training \Travel\Tools for Staff 24,976 24,976
848 638 638
General Support Expense Total 25,614 25,614
Depreciation 0 0
Capital Purchases 0 0
Job Costs 19,004 27,756
Indirect Cost 8,469 16,953
Total Service Costs 324,441 294,653
Estimated Revenue 324,441 294,653
Transaction Rate for Base $1,931.20 $1,753.89
VM Additional Charges
32 of 47
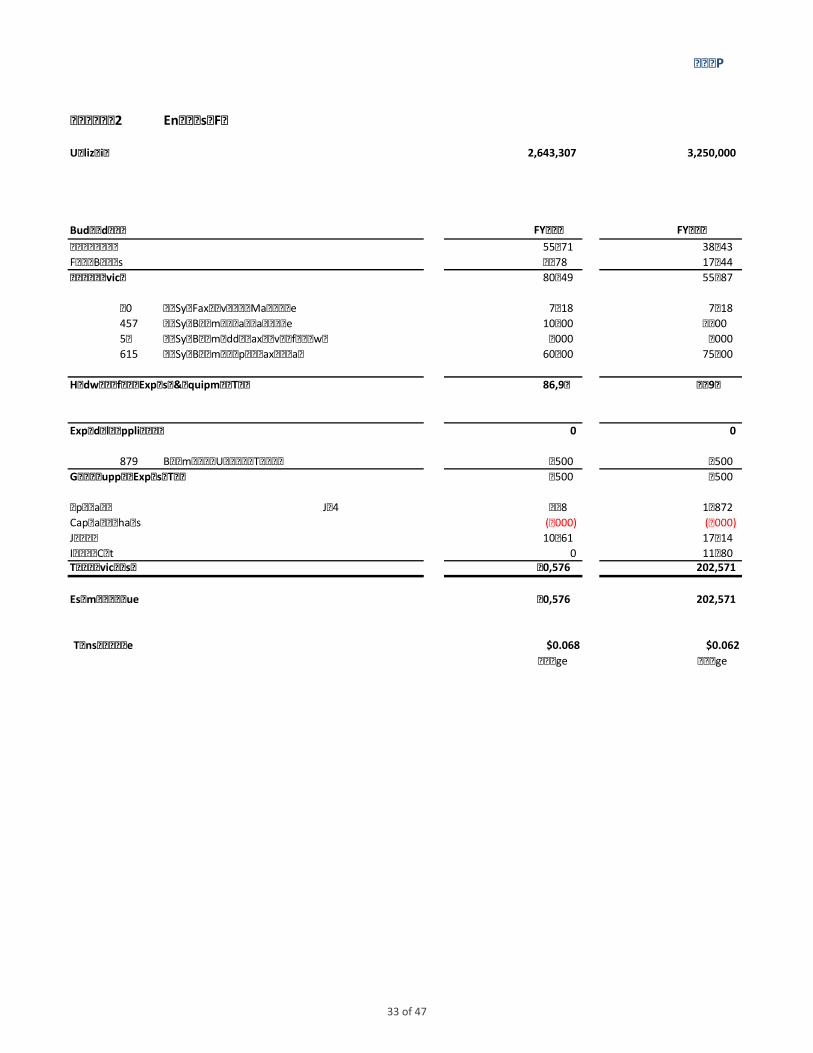
SDC CAP
Category # 32 Enterprise Fax
Utilization 2,643,307 3,250,000
Budgeted Costs FY17 CAP FY18 CAP
Direct Personnel 55,271 38,243
Fringe Benefits 24,778 17,144
Personal Services 80,049 55,387
210 DistSys Fax Server Host Maintenance 7,918 7,918
457 DistSys Biscom Software Maintenance 10,000 20,000
528 DistSys Biscom Addtl Fax Servers for Growth 9,000 9,000
615 DistSys Biscom Enterprise Fax Software 60,000 75,000
Hardware/Software Expense & Equipment Total 86,918 111,918
Expendable Supplies Total 0 0
879 Biscom Tools, Utilities, Tranining 2,500 2,500
General Support Expense Total 2,500 2,500
Depreciation J914 9,248 12,872
Capital Purchases (9,000) (9,000)
Job Costs 10,861 17,114
Indirect Cost 0 11,780
Total Service Costs 180,576 202,571
Estimated Revenue 180,576 202,571
Transaction Rate $0.068 $0.062
Per Page Per Page
33 of 47

SDC CAP
Category # 33 SSRS
Utilization for Base 1,656 3,000
Server Core Liscense for Dedicated Systems 76
Budgeted Costs FY17 CAP FY18 CAP
Direct Personnel 91,197 91,197
Fringe Benefits 40,884 40,884
Personal Services 132,081 132,081
458 DistSys SSRS Software Maintenance 17,981 24,210
Hardware/Software Expense & Equipment Total 17,981 24,210
Expendable Supplies Total 0 0
853 SSRS Training\Travel\Tools for Staff 2,000 2,000
General Support Expense Total 2,000 2,000
Depreciation 0 0
Capital Purchases 0 0
Job Costs 9,731 32,179
Indirect Cost 16,581 10,737
Total Service Costs 178,374 201,207
Estimated Revenue 178,374 201,207
Transaction Rate for Base $107.71 $67.07
For Base Per SSRS Instance/mon Per SSRS Instance/mon
Transaction Rate for Srvr Core Dedicated Systems $106.76
Dedicated SQL Lic/mon
34 of 47
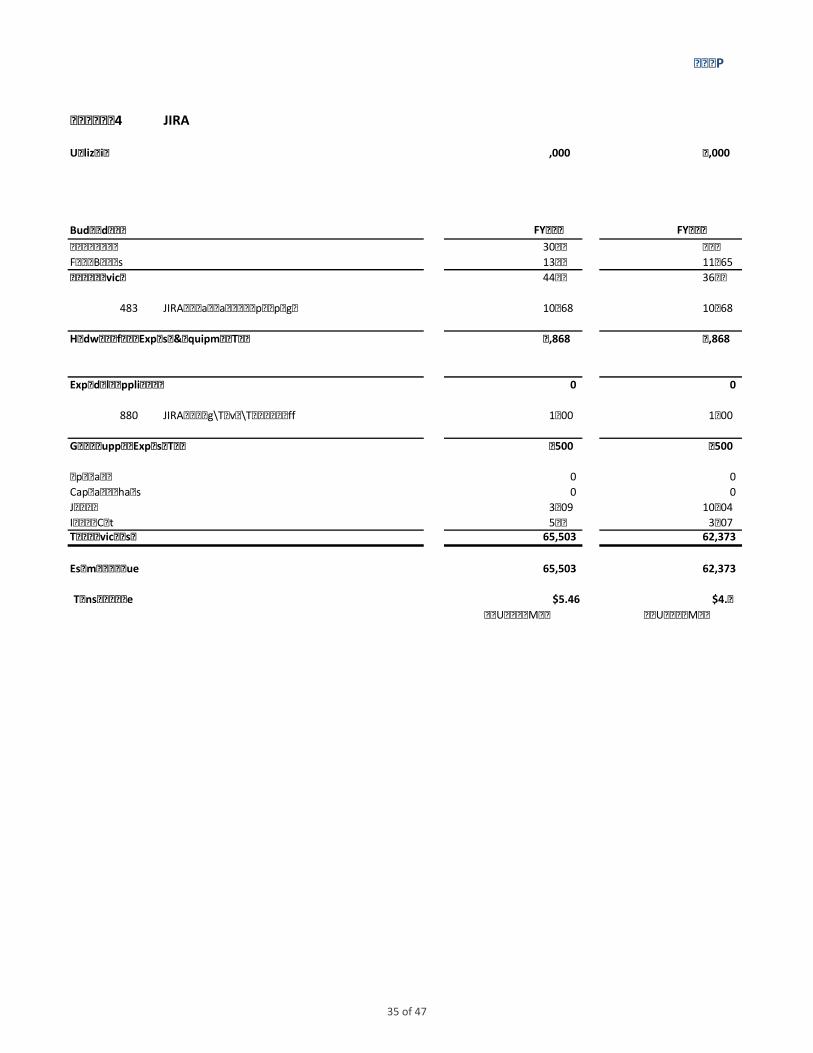
SDC CAP
Category # 34 JIRA
Utilization 12,000 15,000
Budgeted Costs FY17 CAP FY18 CAP
Direct Personnel 30,399 25,129
Fringe Benefits 13,628 11,265
Personal Services 44,027 36,394
483 JIRA Software Maintenance plus plugin 10,868 10,868
Hardware/Software Expense & Equipment Total 10,868 10,868
Expendable Supplies Total 0 0
880 JIRA Training\Travel\Tools for Staff 1,500 1,500
General Support Expense Total 1,500 1,500
Depreciation 0 0
Capital Purchases 0 0
Job Costs 3,609 10,304
Indirect Cost 5,499 3,307
Total Service Costs 65,503 62,373
Estimated Revenue 65,503 62,373
Transaction Rate $5.46 $4.16
Per User Per Month Per User Per Month
35 of 47

SDC CAP
Category # 42 OnBase
Utilization 34,140 44,400
Budgeted Costs FY17 CAP FY18 CAP
Direct Personnel 306,753 224,345
Fringe Benefits 137,517 100,574
Personal Services 444,270 324,919
498 Enterprise OnBase Licenses 208,959 208,959
622 New Enterprise Modules 42,000 42,000
Hardware/Software Expense & Equipment Total 250,959 250,959
Expendable Supplies Total 0 0
873 Staff Training 19,500 19,500
General Support Expense Total 19,500 19,500
Depreciation 14,000 46,497
Capital Purchases (42,000) (204,480)
Job Costs 43,946 83,085
Indirect Cost 39,984 29,668
Total Service Costs 770,659 550,148
Estimated Revenue 770,659 550,148
Transaction Rate $22.57 $12.39
Per Unit Per Month Per Unit Per Month
36 of 47

SDC CAP
Category # 43 Web Utility
Utilization 12,384 60,000
Budgeted Costs FY17 CAP FY18 CAP
Direct Personnel 0 0
Fringe Benefits 0 0
Personal Services 0 0
439 MoveIT Software Maint 6,252
442 MicroSoft Team Foundation Subscription 2,565 2,565
453 SynRecovery software 1,000 1,000
465 Print Utilities Ricoh 0 75,000
466 CVS\SVN\GIT Maint 0 10,010
467 Netscaler Maintenance 42,120 42,120
489 uDeploy software Maintenance 0 50,000
494 Tidal Maintenance 12,522 41,460
495 Tidal License 8,447 0
496 Windows Agent (ELA) 20,491 0
499 AppViewX Software Maintenance 14,800 14,800
534 Netscaler appliance Upgrade 0 580,000
646 Encapsula Service Purchase 0 0
647 uDeploy additional Agents 0 50,277
648 AppViewX additional licenses 0 188
Hardware/Software Expense & Equipment Total 108,197 867,420
Expendable Supplies Total 0 0
869 SSL Training\Travel\Tools for Staff 12,600 8,000
870 Advantage Cert for AppViewX - SSL Certificate 188 0
875 Microsoft Services for TFS Upgrade 10,000 0
General Support Expense Total 22,788 8,000
Depreciation 0 122,000
Capital Purchases 0 (580,000)
Job Costs 8,907 98,997
Indirect Cost 186,796 28,313
Total Service Costs 326,688 544,730
Estimated Revenue 326,688 544,730
Transaction Rate $26.38 $9.08
Per Site Per Month Per Site Per Month
The Web Combined category was broken out into three separate categories in FY18 to more accurately bill
charges. These new/revised categories are Web Utility, Web Hosting and sFTP.
37 of 47
SDC CAP
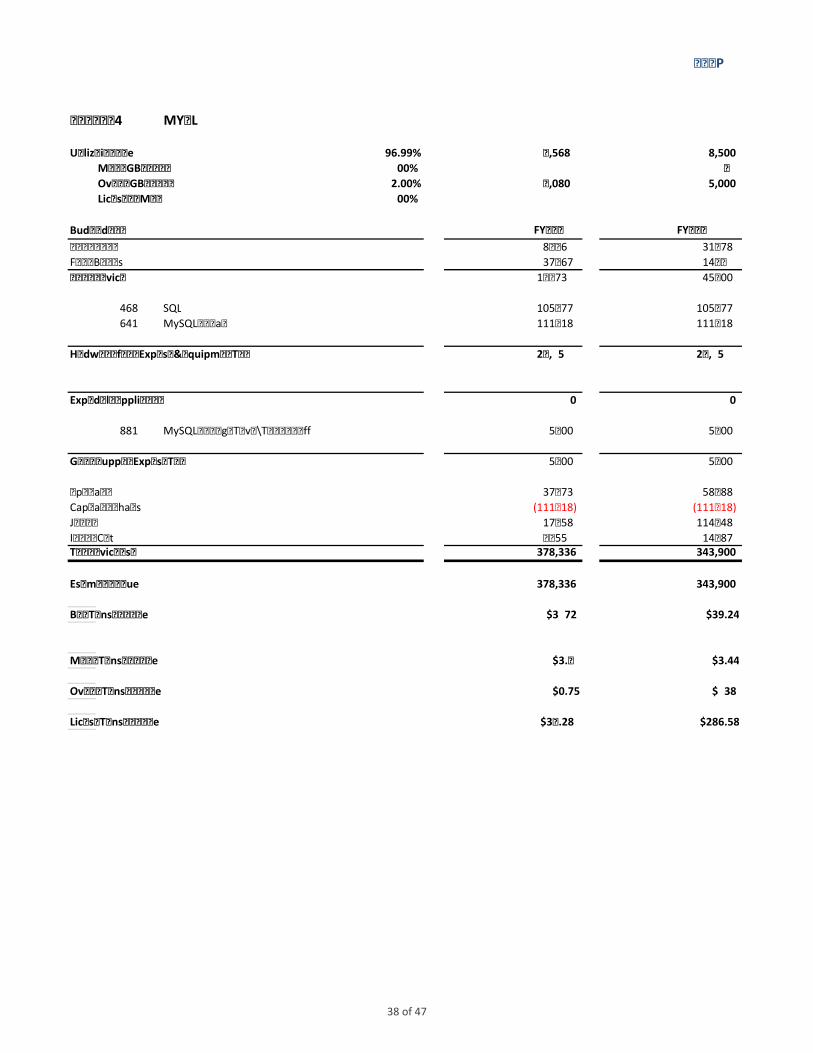
Category # 44 MYSQL
Utilization - Base 96.99% 11,568 8,500
Memory GB per Month 1.00% 12 10
Overage GB per Month 2.00% 10,080 5,000
License Per Month 1.00% 12 12
Budgeted Costs FY17 CAP FY18 CAP
Direct Personnel 82,906 31,278
Fringe Benefits 37,167 14,022
Personal Services 120,073 45,300
468 SQL 105,977 105,977
641 MySQL Software 111,218 111,218
Hardware/Software Expense & Equipment Total 217,195 217,195
Expendable Supplies Total 0 0
881 MySQL Training \Travel\Tools for Staff 5,000 5,000
General Support Expense Total 5,000 5,000
Depreciation 37,073 58,788
Capital Purchases (111,218) (111,218)
Job Costs 17,158 114,248
Indirect Cost 93,055 14,587
Total Service Costs 378,336 343,900
Estimated Revenue 378,336 343,900
Base Transaction Rate $31.72 $39.24
Memory Transaction Rate $3.15 $3.44
Overage Transaction Rate $0.75 $1.38
License Transaction Rate $315.28 $286.58
38 of 47

SDC CAP
Category # 45 Web Hosting
Utilization - 13,164
Budgeted Costs FY17 CAP FY18 CAP
Direct Personnel 0 0
Fringe Benefits 0 0
Personal Services 0 0
537 Plesk License Purchase 2,200 12,000
Hardware/Software Expense & Equipment Total 2,200 12,000
Expendable Supplies Total 0 0
874 SSL Training\Travel\Tools for Staff 6,000 8,000
General Support Expense Total 6,000 8,000
Depreciation 0 0
Capital Purchases 0 0
Job Costs 0 45,472
Indirect Cost 0 1,357
Total Service Costs 8,200 66,828
Estimated Revenue 8,200 66,828
Transaction Rate $5.08
Per Site Per Month Per Site Per Month
39 of 47

SDC CAP
Category # 47 Tableau
Utilization 1,560 1,560
Budgeted Costs FY17 CAP FY18 CAP
Direct Personnel 55,271 45,600
Fringe Benefits 24,778 20,442
Personal Services 80,049 66,042
493 24,960 24,960
644 17,685 17,685
645
Tableau MaintenanceGuardium LicensesAdditional 26 Client licenses 24,960 27,040
Hardware/Software Expense & Equipment Total 67,605 69,685
Expendable Supplies Total 0 0
883 Tableau Training\Travel\Tools for Staff 3500 2,000
General Support Expense Total 3,500 2,000
Depreciation 14,215 3,537
Capital Purchases (42,645) (17,685)
Job Costs 7,854 12,178
Indirect Cost 5,880 8,382
Total Service Costs 136,458 144,139
Estimated Revenue 136,458 144,139
Transaction Rate $87.47
Per User Per Month
$92.40
Per User Per Month
40 of 47
SDC CAP
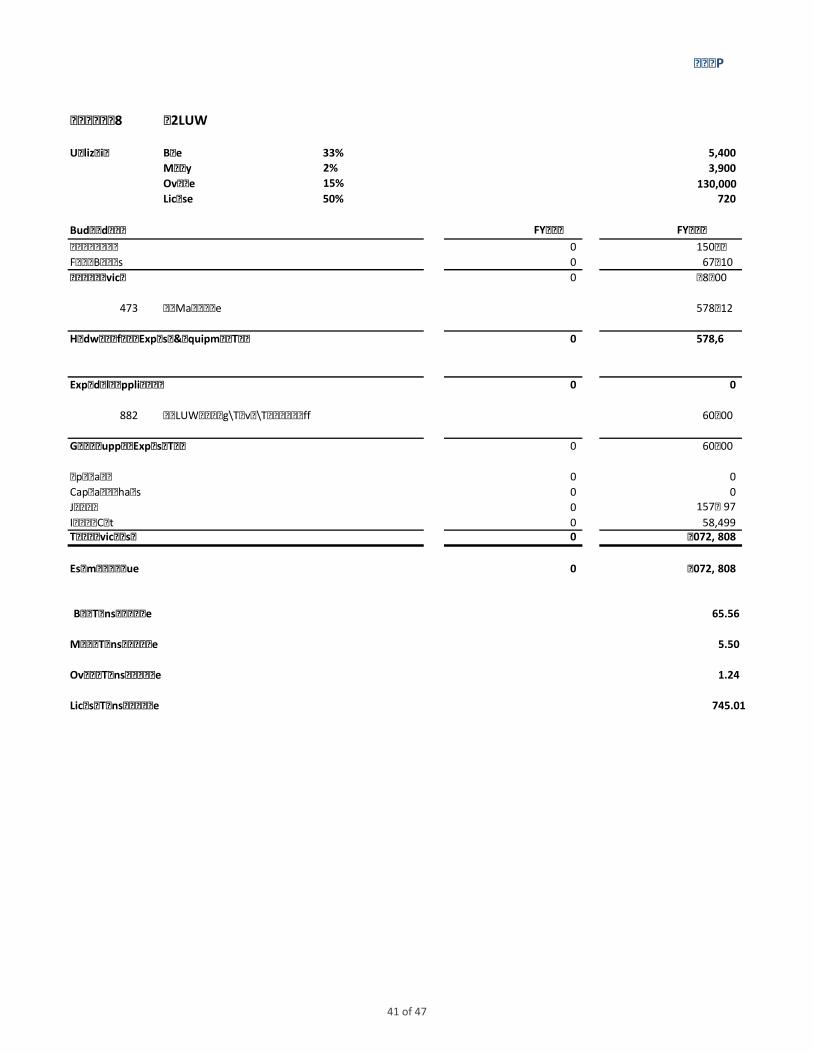
Category # 48 DB2LUW
Utilization Base 33% 5,400Memory 2% 3,900Overage 15% 130 ,000
License 50% 720
Budgeted Costs FY17 CAP FY18 CAP
Direct Personnel 0 150,590
Fringe Benefits 0 67,510
Personal Services 0 218,100
473 DB2 Maintenance 578,612
Hardware/Software Expense & Equipment Total 0 578,612
Expendable Supplies Total 0 0
882 DB2 LUW Training\Travel\Tools for Staff 60,000
General Support Expense Total 0 60,000
Depreciation 0 0
Capital Purchases 0 0
Job Costs 0 157,597Indirect Cost 0 58,499
Total Service Costs 0 1,072,808
Estimated Revenue 0 1,072,808
Base Transaction Rate 65.56
Memory Transaction Rate 5.50
Overage Transaction Rate 1.24
License Transaction Rate 745.01
41 of 47

SDC CAP
Category # 49 BOX
Utilization - 3,600
Budgeted Costs FY17 CAP FY18 CAP
Direct Personnel 0 5,904
Fringe Benefits 0 2,647
Personal Services 0 8,551
538 Box software subscription 54,360
Hardware/Software Expense & Equipment Total 0 54,360
Expendable Supplies Total 0 0
General Support Expense Total 0 0
Depreciation 0 0
Capital Purchases 0 0
Job Costs 0 6,199
Indirect Cost 0 4,267
Total Service Costs 0 73,377
Estimated Revenue 0 73,377
Transaction Rate $20.38
Per Agency Per Month
42 of 47

SDC CAP
Num. Category Description FY18 FY17 FY16 FY15 FY14
1 Laser Feet Printed 0.03 0.03 0.03 0.03 0.03
1 Lines (Impact) Printed/1000 0.35 0.34 0.39 0.39 0.38
1 Laser Feet Printed/Duplex 0.02 0.02 0.03 0.03 0.03
2 CPU Service Units/1000 0.01 0.01 0.01 0.01 0.01
3 CICS Transactions 0.001 0.001 0.001 0.001 0.001
5 zOS Enterprise Data Backup/GB Day 0.003 0.004 0.004 0.004 0.006
7 AD User ID per Month 1.28 0.37 0.94 0.77 0.76
7 AD & Exchange Mailbox per Month 5.72 4.75 4.75 4.97 4.37
8 zOS Data Storage/GB Day 0.09 0.05 0.15 0.10 0.13
10 zOS IDMS Run Units 0.004 0.004 0.004 0.004 0.005
11 zOS DB2 Service Units/1000 0.003 0.002 0.003 0.002 0.002
14 All Fusion CPU Service Units/1000 0.021 0.02 0.03 0.02 0.02
15 VM per Image per Month 103.40 105.33 99.70 124.63 99.75
16 SAN per 1GB per Month 0.25 0.25 0.17 0.18 0.17
17 Physical Server Support / Month 86.02 149.28 87.81 142.36 117.96
19 DistSys Backup-Recovery/GB Day 0.002 0.002 0.003 0.002 0.002
21 WAS per Image per Month 45.48 42.46 1,131.55 1,136.99 1,968.82
23 SQL per Base Unit per Month 28.37 28.48 27.34
23 SQL Memory per GB per Month 4.77 4.30 5.51
23 SQL Overage per GB per Month 0.87 0.98 0.98
23 SQL License per License per Month 98.64 106.76 108.30
26 Remote Server Support per Server per Month 167.84 120.97 92.77 85.83 67.07
27 VDI-Virtual Desktop per Month w/Thin Client 43.64 32.84 26.54 26.31 21.26
27 VDI-Virtual Desktop per Month 40.59
27 RDP Pool Users VDI per Month 10.91 8.21 6.64 6.58 -
28 sFTP Units 1.60 - 4.64 2.54 -
29 SharePoint 1,753.78 1,931.20 300.69 937.04 -
31 TFS - 640.73 367.39 431.25
32 Enterprise Fax Services 0.06 0.07 0.03 0.03 0.03
33 SSRS 67.07 107.71 992.68 1,202.78
34 JIRA 4.16 5.46 1.52 1.50
35 AIX Hosted Services 35.14 38.04 50.78
42 OnBase ECM 12.39 22.57
43 Web Utility (Web Combined in FY17) 9.08 27.04
44 MySQL Base 39.24 31.72
44 MySQL Memory 3.44 3.15
44 MySQL Overage 1.38 0.75
44 MySQL License 286.57 315.28
45 Web Hosting 5.08
47 Tableau 92.39 87.47
48 DB2LUW Base 65.5648 DB2LUW Memory 5.50 48 DB2LUW Overage 1.2448 DB2LUW License 745.0149 BOX 20.38
Five Year Rate Summary
43 of 47

SDC Agency Comparison
Rate 0.007$ 0.006$ 0.001$ 0.001$ 0.016$ 0.021$ 0.046$ 0.086$ 0.002$ 0.003$ 0.004$ 0.003$ 42.45$ 45.49$
CPU CPU CICS CICS All Fusion All Fusion Z Data Strg Z Data Strg ZOS DB2 ZOS DB2 ZOS Data BU ZOS Data BU WAS WAS
Agency FY17 FY18 FY17 FY18 FY17 FY18 FY17 FY18 FY17 FY18 FY17 FY18 FY17 FY18
Senate 516 427 59 54 - - - 264 182 - - - -
House of Rep 412 583 112 115 - - - 215 320 - - - -
Legis Rsrch 12 10 11 11 - - - 7 4 - - - -
SOS 1,682 1,354 402 367 - 9 6 912 687 6 5 - -
Auditor 453 474 72 57 - 40 20 137 104 386 276 - -
Treasurer 191 174 83 75 - 1 1 47 47 6 6 - -
AGO 547 453 244 174 - - - 291 166 - - - -
OA 539,910 551,813 34,307 101,406 8,253 9,157 156,709 160,000 167,736 134,788 60,901 21,330 11,565 15,647
Agriculture 937 871 590 417 - - - - 435 305 - - - -
Insurance 2,157 1,994 214 323 - - 3 2 609 1,012 17 14 - -
Conservation 2,105 1,964 895 764 - - - - 693 475 - - - -
DED 12,698 10,050 1,138 683 - - 2,477 1,726 2,285 1,457 996 755 - -
DESE 6,537 5,635 2,182 1,744 - - - - 3,331 2,621 - - - -
Higher Ed 1,216 1,017 124 151 - - - - 438 391 - - 23,129 27,292
DHSS 88,702 82,640 26,084 22,681 - - 1,374 763 18,329 16,630 3,174 2,815 - -
MODOT 23,830 20,478 6,927 6,000 - - 24 18 9,629 6,414 3 2 - -
DOLIR 464,066 247,419 101,567 8,216 16 - 77,960 59,369 12,066 1,512 76,534 47,308 231,295 212,240
DMH 121,202 99,806 7,503 5,976 - - 5,547 4,459 45,508 49,038 3,172 3,493 - -
DNR 20,414 23,297 2,970 2,548 - - 1,164 854 8,377 10,116 2,565 2,278 57,824 57,313
DPS/MSHP 95,573 107,023 274,668 289,561 1 1,211 739 9,854 13,955 271 125
Revenue 2,059,831 1,609,659 234,183 137,346 - - 170,473 137,277 427,576 374,161 115,160 99,286 40,477 43,895
DSS 4,639,354 4,165,186 1,468,858 1,269,996 90,646 29,255 551,046 433,242 1,998,263 1,964,141 157,143 163,911 - -
Corrections 13,670 16,151 9,152 8,471 - - - - 6,964 6,333 - - 213,948 234,938
Other 5,812 5,905 2,955 2,525 - - - 4,084 - 2 -
Total 8,101,828 6,954,384 2,175,299 1,859,661 98,916 38,413 968,039 798,477 2,713,965 2,588,944 420,334 341,605 578,237 591,325
44 of 47

SDC Agency Comparison
Rate
Agency
Senate
House of Rep
Legis Rsrch
SOS
Auditor
Treasurer
AGO
OA
Agriculture
Insurance
Conservation
DED
DESE
Higher Ed
DHSS
MODOT
DOLIR
DMH
DNR
DPS/MSHP
Revenue
DSS
Corrections
Other
Total
0.004$ 0.004$ 0.029$ 0.030$ 0.002$ 0.002$ 4.75$ 5.72$ 0.24$ 0.25$ 149.28$ 86.03$ 105.33$ 103.41$
ZOS IDMS ZOS IDMS Print Print BackUp Rec BackUp Rec AD-Exchange AD-Exchange SAN SAN Phy Srvr Phy Srvr VM VM
FY17 FY18 FY17 FY18 FY17 FY18 FY17 FY18 FY17 FY18 FY17 FY18 FY17 FY18
- - - - - 49 31 - - - - - -
- - - - - 65 62 - - - - - -
- - - - - 79 46 - - - - - -
- - - 15 15 49 55 - - - - - -
- - 29 35 209 162 151 1,041 152 218 - - 2,783 3,723
97 86 - 9,139 8,184 533 397 15,220 12,915 - - 19,328 17,373
- - - - - 3,652 3,225 105 93 - - 2,783 2,482
6 16,298 19,587 129,640 210,419 134,910 275,907 161,060 222,434 6,816 2,648 352,696 410,004
- - - 13,024 12,741 28,616 32,777 30,256 16,981 - - 12,061 8,190
12 26 - 6,974 22,927 15,382 52,770 12,231 39,940 - - 8,504 46,410
615 888 9 15 511 332 114 123 5,373 4,773 - - 1,392 1,241
109 171 1,261 1,365 47,517 21,992 88,310 72,830 65,968 28,698 2,272 1,032 85,043 47,155
- - - 77,923 67,956 97,132 91,422 59,999 54,565 - - 68,962 64,031
- - 3 2,907 34,446 5,713 7,155 4,045 3,522 - - 6,494 4,715
63,691 59,521 868 10,244 115,054 111,018 172,040 232,313 98,389 119,735 2,272 602 193,279 160,575
175 196 1 627 109 1,235 1,312 5,995 1,151 - - 2,629 1,985
1,692 1,170 195,591 120,655 39,629 115,973 71,364 61,912 244,267 251,537 - - 134,522 121,114
227 242 13 185,103 121,959 503,173 597,656 161,717 137,945 4,291 - 204,567 181,174
- - - 205,315 177,754 122,890 146,368 190,318 185,079 9,088 4,129 87,671 88,602
68,265 118,759 14,710 10,286 63,174 98,731 40,205 37,231 37,419 35,586
803,816 793,344 437,954 395,500 352,788 326,303 118,682 141,471 140,606 153,423 6,816 3,097 226,987 324,128
597,194 543,319 1,021,287 1,165,738 283,202 211,546 572,038 660,709 490,133 691,153 34,079 24,776 183,229 181,919
- - - 28,263 26,647 780,492 861,987 73,810 72,971 4,544 2,065 44,995 41,447
1,451 1,307 1,127 2,405 - 6,209 1,212 2,152 - 93,069
1,537,349 1,519,029 1,674,441 1,715,544 1,512,551 1,480,770 2,786,055 3,341,512 1,799,849 2,036,514 70,178 38,350 1,675,343 1,834,924
45 of 47

SDC Agency Comparison
Rate
Agency
Senate
House of Rep
Legis Rsrch
SOS
Auditor
Treasurer
AGO
OA
Agriculture
Insurance
Conservation
DED
DESE
Higher Ed
DHSS
MODOT
DOLIR
DMH
DNR
DPS/MSHP
Revenue
DSS
Corrections
Other
Total
120.97$ 167.85$ 43.64$ 28.48$ 28.37$ 1,931.20$ 1,753.89$ 0.068$ 0.062$ 107.71$ 67.07$ 5.46$ 4.16$ 35.14$
RSS RSS VDI SQL Total SQL Total Share PT Share PT FAX FAX SSRS SSRS JIRA JIRA AIX
FY17 FY18 FY18 FY17 FY18 FY17 FY18 FY17 FY18 FY17 FY18 FY17 FY18 FY17
- - - - - - - - - - - - - -
- - - - - - - - - - - - - -
- - - - - - - - - - - - - -
- - - 367 58 - - - - - - - - -
- - - - - - - - - - - - - -
- - - - - - - - - - - - - -
- - 305 - - - - - - - - - - -
8,161 10,136 480,599 336,187 456,087 21,629 42,093 26,376 19,360 42,620 49,542 2,387 4,769 1,252
1,545 2,014 16,114 32,907 48,096 21,629 21,047 365 98 26,324 28,840 205 208 -
- - 77,659 34,922 53,162 21,629 21,047 6,827 3,901 - - - - -
- - - - - - - - - - - - - -
34,229 40,621 65,134 125,527 116,388 21,629 21,047 171 - 10,028 10,597 646 769 -
12,985 11,582 47,001 255,634 213,476 43,259 42,093 79 41 6,268 18,377 4,500 6,379 -
- - 1,178 8,076 3,272 21,629 21,047 133 29 - - 684 541 -
11,327 15,610 201,009 167,854 134,484 21,629 21,047 6,642 4,730 5,014 5,164 - - 5,231
- - - 405 81 - - - - - - - - -
5,592 7,292 36,975 83,549 96,967 21,629 21,047 79,887 35,655 5,014 5,164 9,417 6,645 -
48,490 52,706 55,500 818,320 739,869 21,629 21,047 457 227 10,028 12,207 - - -
12,615 15,107 52,391 44,805 39,426 21,629 21,047 235 170 - - 14,198 10,579 -
8,581 7,960 25,041 33,240 31,003 21,629 - 367 98 1,254 958
2,749 3,525 61,632 295,504 449,981 21,629 21,047 55,383 32,322 56,409 55,064 - - -
160,134 203,942 997,648 195,705 180,366 21,629 21,047 3,654 61,755 10,028 9,993 33,466 32,484 78,689
94,466 118,169 37,989 19,826 18,133 - - - - - - - - -
73 2,007 653 - - 44,183 - -
400,874 488,737 2,158,182 2,452,830 2,581,501 302,811 294,653 180,576 202,570 172,988 195,905 65,503 62,373 85,172
46 of 47

SDC Agency Comparison
Rate
Agency
Senate
House of Rep
Legis Rsrch
SOS
Auditor
Treasurer
AGO
OA
Agriculture
Insurance
Conservation
DED
DESE
Higher Ed
DHSS
MODOT
DOLIR
DMH
DNR
DPS/MSHP
Revenue
DSS
Corrections
Other
Total
22.57$ 12.39$ 31.72$ 39.24$ 31.10$ 87.47$ 96.17$ 27.04$ 9.08$ 5.08$ 1.60$ 20.38
OnBase ECM OnBase ECM MySQL MySQL DB2LUW Tableau Tableau Web Comb Web Utility WebHost sFTP BOX Annual Annual
FY17 FY18 FY17 FY18 FY18 FY17 FY18 FY17 FY18 FY18 FY18 FY18 FY17 Total FY18 Total
- - - - - - - - - - - - 889 694
- - - - - - - - - - - - 804 1,080
- - - - - - - - - - - - 109 70
- - - - - - - - - - 19 - 3,443 2,566
- - - - - - - - - - 96 - 4,412 6,206
- - - - - - - - - - - - 44,645 39,258
- - - - - - - - - - 77 - 7,622 6,974
32,777 30,777 125,851 160,983 3,359 27,292 77,992 104,598 70,597 20,469 44 - 2,789,180 3,561,951
- - 5,764 99 1,973 - - 34,560 9,043 4,691 2,442 978 226,169 207,925
2,980 1,784 - - - - - 9,167 2,070 1,157 2,365 978 187,677 329,540
- - - - - - - - - - 135 - 11,707 10,710
- 4,312 5,391 6,725 - - - 9,167 32,684 487 2,269 9,539 558,736 498,485
1,084 8,773 - - 70,000 10,497 - 9,167 4,467 1,036 1,096 245 673,073 712,540
13,544 5,353 - - 5,225 - - 1,839 3,050 - 1,211 489 90,642 120,084
- - 115,123 151,624 - - - 3,380 223,666 - 2,538 6,359 1,288,049 1,585,769
- - - - - - - - - - 250 2,935 51,480 40,932
- - 9,136 8,672 423,946 - - 2,136 15,252 670 2,500 489 1,889,168 1,909,699
18,962 24,980 46,820 4,306 - - - 54,436 20,918 12,001 769 489 2,289,278 2,146,766
10,564 8,029 1,813 2,278 256,356 - - 15,603 12,747 2,985 5,884 1,223 877,368 1,126,559
2,379 2,665 - 15,279 5,883 3,351 2,090 3,669 736,285 794,428
284,426 9,665 1,523 1,884 - 52,484 13,944 68,822 68,309 19,616 22,420 734 6,016,759 5,299,032
406,323 454,095 5,329 0 105,945 46,186 44,525 3,380 68,200 366 12,441 734 13,638,880 13,698,430
- - 6,266 7,327 205,536 - - 3,353 7,844 - 1,711 4,403 1,319,147 1,672,121
- 52,656 - - - - - - 1,223 85,080 160,801
770,660 550,146 378,336 343,900 1,072,340 136,458 136,461 334,888 544,730 66,828 60,358 34,487 32,790,602 33,932,623
47 of 47