STATE CHILD CARE ASSISTANCE POLICIES 2011: REDUCED ...
36
OCTOBER 2011 STATE CHILD CARE ASSISTANCE POLICIES 2011: REDUCED SUPPORT FOR FAMILIES IN CHALLENGING TIMES by Karen Schulman, Senior Policy Analyst Helen Blank, Director of Leadership and Public Policy Child care helps children, families, and communities prosper. It gives children the opportunity to learn and develop skills they need to succeed in school and in life. 1 It gives parents the support and peace of mind they need to be productive at work. And, by strengthening the current and future workforce, it helps our nation stay competitive.Yet many families, especially in today’s economy, have great difficulty paying for child care. The average fee for full-time care ranges from $3,600 to $18,200 annually, depending on where the family lives, the type of care, and the age of the child. 2 Child care assistance can help families with the high cost of care, particularly low-income families 3 who are struggling to meet their basic expenses and stay employed in a challenging time. Despite the importance of child care assistance, families in thirty-seven states were worse off in February 2011 than in February 2010 under one or more of the child care assistance policies covered in this report and families in only eleven states were better off under one or more of these policies. 4 The policies covered are critical ones—income eligibility limits to qualify for child care assistance, waiting lists for child care assistance, copayments required of parents receiving child care assistance, reimbursement rates for child care providers serving families receiving child care assistance, and eligibility for child care assistance for parents searching for a job. The trend in state child care assistance policies between February 2010 and February 2011 contrasts with that between February 2009 and February 2010. Families in fifteen states were worse off in 2010 than they were in 2009 under one or more of the policies covered in this report and families in thirty-four states were better off under one or more policies. 5 Families made progress under these child care assistance policies between February 2009 and February 2010, despite strains on state budgets, in large part due to $2 billion in additional funding for the Child Care and Development Block Grant (CCDBG) for FY 2009 and FY 2010 provided by the American Recovery and Reinvestment Act (ARRA). 6 The negative trends since February 2010 are likely due in part to the exhaustion of these funds—states had to obligate all of the funds by September 2010, 7 and although they had until September 2011 to expend those funds, they had spent 84 percent of the funds as of the end of 2010. 8 In addition, as of February 2011, states were still uncertain about the FY 2011 CCDBG funding level because the FY 2011 appropriations bill had not yet passed; when it finally passed in April 2011, it provided an amount for CCDBG that replaced only a small portion of the expiring ARRA funds. In addition, families were worse off in 2011 than they were in 2001 in more states than they were better off under each of the four policies for which there are comparison data for 2001. 9
Transcript of STATE CHILD CARE ASSISTANCE POLICIES 2011: REDUCED ...
OctOber 2011
STATE CHILD CARE ASSISTANCE POLICIES 2011: REDUCED SUPPORT FOR FAMILIES IN CHALLENGING TIMES
by Karen Schulman, Senior Policy Analyst
Helen Blank, Director of Leadership and Public Policy
Child care helps children, families, and communities prosper. It gives children the opportunity to learn and develop skills they need to succeed in school and in life.1 It gives parents the support and peace of mind they need to be productive at work. And, by strengthening the current and future workforce, it helps our nation stay competitive. Yet many families, especially in today’s economy, have great difficulty paying for child care. The average fee for full-time care ranges from $3,600 to $18,200 annually, depending on where the family lives, the type of care, and the age of the child.2 Child care assistance can help families with the high cost of care, particularly low-income families3 who are struggling to meet their basic expenses and stay employed in a challenging time.
Despite the importance of child care assistance, families in thirty-seven states were worse off in February 2011 than in February 2010 under one or more of the child care assistance policies covered in this report and families in only eleven states were better off under one or more of these policies.4 The policies covered are critical ones—income eligibility limits to qualify for child care assistance, waiting lists for child care assistance, copayments required of parents receiving child care assistance, reimbursement rates for child care providers serving families receiving child care assistance, and eligibility for child care assistance for parents searching for a job.
The trend in state child care assistance policies between February 2010 and February 2011 contrasts with that between February 2009 and February 2010. Families in fifteen states were worse off in 2010 than they were in 2009 under one or more of the policies covered in this report and families in thirty-four states were better off under one or more policies.5 Families made progress under these child care assistance policies between February 2009 and February 2010, despite strains on state budgets, in large part due to $2 billion in additional funding for the Child Care and Development Block Grant (CCDBG) for FY 2009 and FY 2010 provided by the American Recovery and Reinvestment Act (ARRA).6 The negative trends since February 2010 are likely due in part to the exhaustion of these funds—states had to obligate all of the funds by September 2010,7 and although they had until September 2011 to expend those funds, they had spent 84 percent of the funds as of the end of 2010.8 In addition, as of February 2011, states were still uncertain about the FY 2011 CCDBG funding level because the FY 2011 appropriations bill had not yet passed; when it finally passed in April 2011, it provided an amount for CCDBG that replaced only a small portion of the expiring ARRA funds.
In addition, families were worse off in 2011 than they were in 2001 in more states than they were better off under each of the four policies for which there are comparison data for 2001.9
NatiONal WOmeN’s laW ceNter
2 state child care assistaNce POlicies 2011
Changes between February 2010 and February 2011 and between 2001 and February 2011 are described in more detail below, but to summarize:
♦♦ Four states lowered their income eligibility limits as a dollar amount between 2010 and 2011. Only one state increased its income limits sufficiently to surpass inflation as measured against the change in the federal poverty level.10 The remaining states increased their income limits enough to adjust for the updated federal poverty level or state median income (seven states) or kept their income limits the same as a dollar amount (thirty-nine states). In twenty-one states, the income limits in 2011 were lower as a percentage of the federal poverty level than in 2001.11
♦♦ The number of states with waiting lists for child care assistance in 2011—twenty-two—was higher than the number of states with waiting lists in 2010, when nineteen states had waiting lists, or in 2001, when twenty-one states had waiting lists. Among the sixteen states that had waiting lists in both years and for which comparable data were available, the number of children on the waiting list increased in twelve states and decreased in four between 2010 and 2011. Among the eleven states that had waiting lists in both years and for which there were comparable data, the number of children on the waiting list increased in eight states and decreased in three between 2001 and 2011.
♦♦ In nearly one-quarter to over two-fifths of the states, depending on income, families paid a higher percentage of their income in copayments in 2011 than in 2010, and in most of the remaining states, families paid the same percentage of their income in copayments in 2011 as in 2010. In approximately two-fifths to three-fifths of the states, families paid a higher percentage of their income in 2011 than in 2001. In addition, in over one-third to over half of the states, a family was required to pay more in copayments than the nationwide average amount that families who pay for child care spend on child care.
♦♦ Only three states had reimbursement rates at the federally recommended level for providers who serve families receiving child care assistance in 2011, half the number of states—six—in 2010, and significantly lower than the number of states—twenty-two—in 2001. Approximately three-fifths of the states had higher reimbursement rates for higher-quality providers in 2011, but in approximately four-fifths of these states, even the higher rates were below the federally recommended level.
♦♦ Forty-six states allowed families receiving child care assistance to continue receiving it while a parent searched for a job in 2011, which was slightly lower than the number of states—forty-seven—in 2010. Seventeen states allowed families not receiving child care assistance to qualify for assistance while a parent searched for a job in 2011, which was also slightly lower than the number of states—twenty—in 2010.12
LOOKING AHEAD: DEVELOPMENTS SINCE FEBRUARY 2011
Although this report primarily focuses on changes between February 2010 and February 2011, states reported on some changes they made or expected to make after February 2011. While a few states reported modest improvements in one or more of the policies covered in this report, fifteen states reported cutbacks in these policies that had been or would be made after February 2011 as they continue to deal with budget shortfalls13 and a challenging economic environment. In some cases, states specifically attributed the cutbacks to the expiration of their ARRA funds.

NatiONal WOmeN’s laW ceNter
state child care assistaNce POlicies 2011 3
♦♦ Five states reduced or planned to reduce their income eligibility limits for child care assistance after February 2011.
% California reduced its income limit from 75 percent of the 2007 state median income ($45,228 a year for a family of three) to 70 percent of the 2007 state median income ($42,216 a year for a family of three), as of July 2011.
% Illinois reduced its income limit from 200 percent of the 2010 federal poverty level ($36,624 a year for a family of three) to 185 percent of the 2010 federal poverty level ($33,876 a year for a family of three), as of April 2011.14
% Louisiana reduced its income limit from 75 percent of the 2009 state median income ($37,896 a year for a family of three) to 65 percent of the 2011 state median income ($35,868 a year for a family of three), as of June 2011.
% Ohio reduced its income limit from 150 percent of the 2010 federal poverty level ($27,468 a year for a family of three) to 125 percent of the 2011 federal poverty level ($23,172 a year for a family of three), as of July 2011.
% South Dakota reduced its income limit from 200 percent of the 2011 federal poverty level ($37,068 a year for a family of three) to 175 percent of the 2011 federal poverty level ($32,428 a year for a family of three), as of July 2011.15
♦♦ Four states—Colorado, Florida, Maryland, and North Carolina—had or expected to have increases in their waiting lists for child care assistance and one state—New Hampshire—expected to start a waiting list after February 2011. In addition, one state—South Carolina—reported it may stop serving new applicants for assistance within the next year.
♦♦ Two states increased or planned to increase their copayments after February 2011.
% Illinois increased its copayments as of April 2011. For example, the monthly copayment for a family of three with an income of $27,795 (150 percent of the 2011 federal poverty level) increased from $85 to $147, and the monthly copayment for a family of three with an income of $18,530 (100 percent of the 2011 federal poverty level) increased from $34 to $59.16
% Utah, which had lowered its copayments by 20 percent using ARRA funds, planned to revert to its previous copayment levels as of October 2011.
♦♦ Five states reduced some or all of their reimbursement rates after February 2011. In all of these states, rates were below the federally recommended level before the reductions.
% Minnesota and Ohio reduced reimbursement rates across the board for all child care providers. % California reduced reimbursement rates for license-exempt child care providers, but not
licensed child care providers. % Some Colorado counties—which determine their own reimbursement rates—reduced rates. % Maine reduced the amount of the differential between the higher rates paid to higher-quality
providers and the base rate. Only the highest rate will continue to exceed the federally recommended level.
♦♦ Three states that had used ARRA funds to expand the length of time parents could receive child care assistance to search for a job or to allow parents to qualify for child care assistance while searching for a job reverted or will revert to their previous time limits after February 2011 due to the expiration of ARRA funds.

NatiONal WOmeN’s laW ceNter
4 state child care assistaNce POlicies 2011
% Colorado reduced the maximum time parents could receive child care assistance to search for a job from 180 days to 30 days, as of July 2011.
% Illinois planned to reduce the maximum time parents can continue to receive child care assistance to search for a job from 90 days to 30 days, as of October 2011.
% Missouri planned to stop allowing parents (other than those receiving Temporary Assistance for Needy Families) to qualify for child care assistance while searching for a job once ARRA funding was no longer available or as of September 30, 2011, whichever occurred first.
METHODOLOGY
The data in this report were collected by the National Women’s Law Center from state child care administrators in the fifty states and the District of Columbia (counted as a state in this report). The state child care administrators were sent a survey in the spring of 2011 requesting data on policies as of February 2011 in five key areas—income eligibility limits, waiting lists, parent copayments, reimbursement rates, and eligibility for child care assistance for parents searching for a job. States were also asked to report any policy changes in each of the five areas, as well as any other major policy changes, they anticipated within the coming year. In addition to these questions, which were largely the same as in the previous year’s survey, states were asked to report any changes in policies resulting from the expiration of ARRA funds. The state administrators were contacted by Center staff for follow-up information as necessary. Additional information about states’ policies was obtained from documents available on state agencies’ websites.
The 2010 data used in this report for comparison purposes were collected by the Center through a similar process and published in the Center’s September 2010 report, State Child Care Assistance Policies 2010: New Federal Funds Help States Weather the Storm. The 2001 data used in this report were collected by the Children’s Defense Fund (CDF) and published in CDF’s report, State Developments in Child Care, Early Education and School-Age Care 2001. CDF staff collected the data through surveys and interviews with state child care advocates and verified the data with state child care administrators. The CDF data reflect policies in effect as of June 1, 2001, unless otherwise indicated. The Center uses 2001 as a basis for comparison because it was the year between the peak year for TANF funding for child care, FY 2000, and what was the peak year for CCDBG funding, FY 2002, until FY 2010, when ARRA provided a temporary boost in child care funding (see the section below on funding for child care assistance).
The Center chose to examine the policy areas covered in this report because they are critical in determining whether low-income families can receive child care assistance and the extent of assistance they can receive. Income eligibility limits reveal how generous a state is in determining families who qualify for child care assistance,17 and waiting lists help reveal whether families who qualify for assistance actually receive it. Parent copayment levels reveal whether low-income parents receiving child care assistance are left with significant out-of-pocket costs for care. Reimbursement rates reveal the extent to which families receiving assistance may be limited in both their choice of child care providers and the quality of care those providers offer. Eligibility policies for parents searching for work reveal whether parents can receive child care assistance while seeking employment without disrupting their child’s child care arrangement.

NatiONal WOmeN’s laW ceNter
state child care assistaNce POlicies 2011 5
FUNDING FOR CHILD CARE ASSISTANCE FOR LOW-INCOME FAMILIES
The primary source of funding for child care assistance is the federal Child Care and Development Block Grant (CCDBG) program. CCDBG funding was $5.140 billion in FY 2011.18 This was a decrease from CCDBG funding for FY 2010 even before adjusting for inflation—$6.044 billion, including the additional $2 billion in CCDBG funding for states to obligate in FY 2009 and FY 2010 provided through the American Recovery and Reinvestment Act (assuming $1 billion of ARRA funds each year for FY 2009 and FY 2010).19 The FY 2010 level represented a peak for CCDBG, in real terms, exceeding the previous peak for CCDBG funding ($4.817 billion20 before adjusting for inflation, or $5.899 billion in FY 2010 dollars21), which occurred in FY 2002. However, the ARRA funding that contributed to the FY 2010 peak funding level was temporary.
Another important source of child care funding is the Temporary Assistance for Needy Families (TANF) block grant. States may transfer up to 30 percent of their TANF block grant funds to CCDBG, or use TANF funds directly for child care without first transferring the money. States’ use of TANF dollars for child care (including both transfers and direct funding) was $3.514 billion in FY 2009 (the most recent year for which data are available).22 Even without adjusting for inflation, the amount of TANF funds used for child care in FY 2009 was below its high of $3.966 billion in FY 200023 ($5.150 billion in FY 2010 dollars24).
As a result, while CCDBG funding (including ARRA funding) peaked in FY 2010, total federal funding from CCDBG, ARRA, and TANF in FY 2010—$9.558 billion (assuming TANF funding for child care in FY 2010, a figure not yet available, was the same as in FY 2009)—remained below total federal child care funding in FY 2001 (just after the peak in TANF funding and just before the last peak in CCDBG funding) after adjusting for inflation—$10.178 billion in FY 2010 dollars.25
INCOME ELIGIBILITY LIMITS
A family’s ability to obtain child care assistance depends on a state’s income eligibility limit. Analyzing this policy area involves consideration of not only a state’s limit in a given year, but also whether the state adjusts the limit for inflation each year so that a family does not become ineligible for assistance because its income simply keeps pace with inflation.
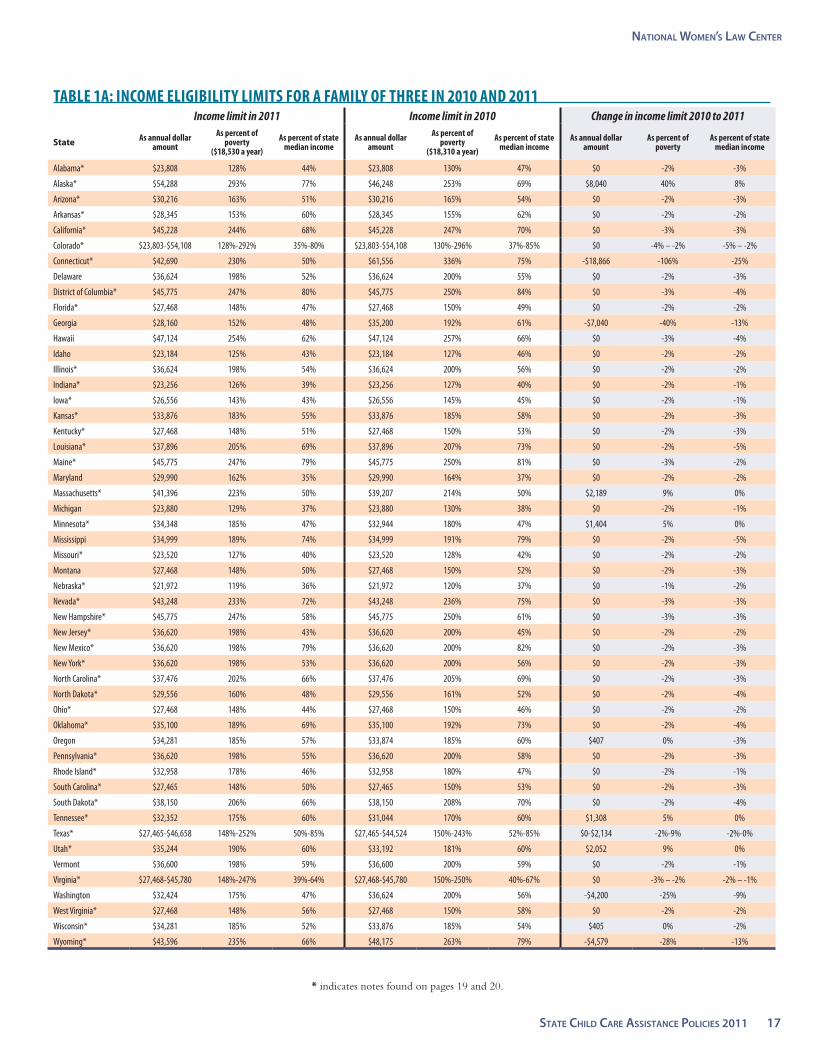
Between 2010 and 2011, less than one-fifth of the states increased their income eligibility limits as a dollar amount, and four states decreased their income limits as a dollar amount.26 Between 2010 and 2011, only one state increased its income limit sufficiently to surpass inflation, as measured against the change in the federal poverty level or state median income, depending on which benchmark each state used. Between 2001 and 2011, over four-fifths of the states increased their income limits as a dollar amount. However, between 2001 and 2011, only about one-quarter of the states increased their income limits sufficiently to surpass inflation, as measured against the change in the federal poverty level.27 Moreover, over two-thirds of the states had income limits at or below 200 percent of poverty in 2011.
♦♦ Eight states increased their income eligibility limits as a dollar amount between 2010 and 2011 (see Table 1a). One of these states increased its income limit beyond the amount needed to adjust for inflation and seven of these states increased their income limits sufficiently to keep pace with inflation.28
NatiONal WOmeN’s laW ceNter
6 state child care assistaNce POlicies 2011
♦♦ Thirty-nine states left their income eligibility limits at the same level as a dollar amount between 2010 and 2011.29
♦♦ Four states decreased their income eligibility limits as a dollar amount between 2010 and 2011.
♦♦ Forty-four states increased their income eligibility limits as a dollar amount between 2001 and 2011 (see Table 1b). In fourteen of these states, the increase was great enough that the income limit was higher as a percentage of the federal poverty level in 2011 than in 2001. In sixteen of these states, the increase was great enough that the income limit stayed the same, or nearly the same, as a percentage of the federal poverty level.30 However, in fourteen of these states, the increase was not sufficient to keep pace with the federal poverty level, so the income limit was lower as a percentage of the federal poverty level in 2011 than in 2001.
♦♦ In six states, the income eligibility limit was lower as a dollar amount in 2011 than in 2001. In one state, the income limit stayed the same as a dollar amount. In all of these states, the income limit decreased as a percentage of the federal poverty level, bringing to twenty-one the total number of states in which the income limit failed to keep pace with the increase in the federal poverty level between 2001 and 2011.
♦♦ The income eligibility limit was above 100 percent of the federal poverty level ($18,530 a year for a family of three in 2011) in all states in 2011. However, a family with an income above 150 percent of poverty ($27,795 a year for a family of three in 2011) could not qualify for child care assistance in thirteen states. A family with an income above 200 percent of poverty ($37,060 a year for a family of three in 2011) could not qualify for assistance in thirty-five states. Yet, in the majority of communities across the country, a family needs an income equal to at least 200 percent of poverty to meet its basic needs, including housing, food, child care, transportation, health care, and other necessities, based on a study by the Economic Policy Institute.31
WAITING LISTS
Even families who are eligible for child care assistance may not necessarily receive it. Instead, a state may place eligible families on a waiting list or may freeze intake (turn away families without adding their names to a waiting list). Families on the waiting list may not receive child care assistance for months, or may not receive it at all. Families on the waiting list are left with difficult choices, as demonstrated by several studies.32 Many of these families struggle to pay for stable, good-quality child care on their own along with other basic expenses, or use low-cost—and frequently low-quality—care because they cannot afford better-quality care. Some families may not be able to pay for child care at all, making it difficult or impossible for them to hold onto employment.
In 2011, nearly three-fifths of the states were able to serve eligible families who applied for child care assistance without placing any on waiting lists or freezing intake. Yet over two-fifths of the states had waiting lists or frozen intake for at least some families applying for assistance. The number of states with waiting lists or frozen intake in 2011 was greater than in 2010, and more states’ waiting lists increased than decreased between 2010 and 2011. Similarly, the number of states with waiting lists in 2011 was greater than the number of states with waiting lists in 2001, and more states’ waiting lists increased than decreased between 2001 and 2011.33

NatiONal WOmeN’s laW ceNter
state child care assistaNce POlicies 2011 7
♦♦ Twenty-two states had waiting lists or frozen intake in 2011, compared to nineteen states with waiting lists or frozen intake in 2010, and twenty-one states with waiting lists or frozen intake in 2001 (see Table 2).
♦♦ Twelve states had longer waiting lists in 2011 than in 2010, and four states had shorter waiting lists. In the remaining two states with waiting lists or frozen intake in both 2010 and 2011, it was not possible to compare the length of waiting lists based on the available data.
♦♦ Eight states had longer waiting lists in 2011 than in 2001, and three states had shorter waiting lists. In the remaining six states with waiting lists or frozen intake in both 2001 and 2011, it was not possible to compare the length of waiting lists based on the available data.
COPAYMENTS
Most states require families receiving child care assistance to contribute toward their child care costs based on a sliding fee scale that is designed to charge progressively higher copayments to families at progressively higher income levels. Some states also take into account the cost of care used by a family in determining the amount of the family’s copayment. If states set copayments at levels that are so high they strain the budgets of low-income families receiving child care assistance, families may be unable to cover their copayments, forcing their child care providers to absorb the lost income, or may be discouraged from participating in the child care assistance program altogether.
This study examines state copayment policies by considering two hypothetical families: a family of three with an income at 100 percent of the federal poverty level and a family of three with an income at 150 percent of the federal poverty level.34 In nearly one-quarter to over two-fifths of the states, depending on income, families paid a higher percentage of their income in copayments in 2011 than in 2010, and in most of the remaining states, copayments remained the same in 2011 as in 2010. In over two-fifths to approximately three-fifths of the states, depending on income, families also paid a higher percentage of their income in copayments in 2011 than in 2001.
Many states had relatively high copayments in 2011. In over one-third to over half of the states, depending on income, a family was required to pay more in copayments than the nationwide average amount that families who pay for child care (including those who receive child care assistance and those who do not) spent on child care—7.0 percent of income.35
♦♦ In twelve states, copayments for a family of three at 150 percent of poverty36 increased as a percentage of income between 2010 and 2011 (see Table 3a). In thirty states, copayments remained the same as a percentage of income. In two states, copayments decreased as a percentage of income. In two states, a family at 150 percent of poverty was eligible for child care assistance in 2010 but not 2011, and in five states, a family at 150 percent of poverty was not eligible in either 2010 or 2011.37
♦♦ In twenty-two states, copayments for a family of three at 150 percent of poverty38 increased as a percentage of income between 2001 and 2011. In nine states, copayments remained the same as a percentage of income. In thirteen states, copayments decreased as a percentage of income. In four states, a family at 150 percent of poverty was eligible for child care assistance in 2001 but not 2011, and in three states, a family at 150 percent of poverty was not eligible in either 2001 or 2011.
NatiONal WOmeN’s laW ceNter
8 state child care assistaNce POlicies 2011
♦♦ In twenty-one states, copayments for a family of three at 100 percent of poverty increased as a percentage of income between 2010 and 2011 (see Table 3b). In twenty-seven states, copayments remained the same as a percentage of income. In three states, copayments decreased as a percentage of income.
♦♦ In twenty-nine states, copayments for a family of three at 100 percent of poverty increased as a percentage of income between 2001 and 2011. In fifteen states, copayments remained the same as a percentage of income. In seven states, copayments decreased as a percentage of income.
♦♦ In twenty-eight states, the copayment for a family of three at 150 percent of poverty was above $162 per month (7.0 percent of income) in 2011. In an additional seven states, a family at this income level was not eligible for child care assistance.
♦♦ In eighteen states, the copayment for a family of three at 100 percent of poverty was above $108 per month (7.0 percent of income) in 2011.
REIMBURSEMENT RATES
States determine reimbursement rates for child care providers who care for children receiving child care assistance. States set a maximum level up to which they will reimburse providers, and a provider must charge private-paying parents a fee that is equal to or greater than this level to receive the maximum rate. Reimbursement rates may vary by geographic region, age of the child, type of care, and other factors. Reimbursement rates affect the resources child care providers have to sustain their businesses, offer sufficient salaries to attract and retain qualified staff, maintain low child-staff ratios, afford facilities, and purchase materials and supplies for activities that promote children’s learning. Low reimbursement rates deprive child care providers of the resources needed to offer high-quality care and may discourage high-quality providers from serving families who receive child care assistance.
States are required to conduct surveys of child care providers’ market rates every two years, but are not required to set their rates at any particular level or update their rates regularly. Federal regulations recommend, but do not mandate, that rates be set at the 75th percentile of current market rates,39 a rate that is designed to allow families access to 75 percent of the providers in their communities. In 2011, just three states set their reimbursement rates at the 75th percentile of current market rates, lower than in 2010, and far lower than in 2001, when over two-fifths of the states set their reimbursement rates at this recommended level.40 In 2011, many states’ reimbursement rates were significantly below the 75th percentile of current market rates. In addition, less than half of the states had updated their reimbursement rates in the previous two years. When reimbursement rates are not regularly updated, they increasingly lag behind the 75th percentile of market rates.
When the state reimbursement rate falls short of the fee a child care provider charges private-paying parents, over three-quarters of the states allow child care providers to ask parents receiving child care assistance to cover the difference (beyond any required copayment). This approach may be intended to help child care providers avoid lost income, but it places a financial burden on low-income families whose very eligibility for child care assistance demonstrates that they cannot afford this additional charge.
♦♦ Only three states set their reimbursement rates at the 75th percentile of current market rates (rates from 2009 or 2010) in 2011 (see Table 4a). This was half the number of states—six—that set their
NatiONal WOmeN’s laW ceNter
state child care assistaNce POlicies 2011 9
reimbursement rates at this level in 2010 (see Table 4b). It was also significantly lower than the number of states—twenty-two—that set their reimbursement rates at this level in 2001.
♦♦ One state reduced its reimbursement rates between 2010 and 2011. Only three states increased their reimbursement rates between 2010 and 2011,41 and only twenty-one states increased at least some of their reimbursement rates between 2009 and 2011.42 The remaining twenty-nine states did not update their reimbursement rates between 2009 and 2011. All states except one updated their reimbursement rates between 2001 and 2011.
♦♦ In twenty-five states, reimbursement rates for center-based care for a four-year-old in 2011 were at least 20 percent below the 75th percentile of market rates (based on the state’s most recent market survey) for this type of care (see Table 4c).43
♦♦ In twenty-four states, reimbursement rates for center-based care for a one-year-old in 2011 were at least 20 percent below the 75th percentile of market rates (based on the state’s most recent market survey) for this type of care.44
♦♦ Thirty-nine states allowed child care providers to charge parents receiving child care assistance the difference between the state reimbursement rate and the fee that the provider charged private-paying parents if the state reimbursement rate was lower in 2011—the same number of states as in 2010.45
Approximately three-fifths of the states reimbursed child care providers that met higher-quality standards at higher reimbursement rates (tiered rates) in 2011.46 Some states had a single higher reimbursement rate; other states had progressively higher reimbursement rates for progressively higher levels of quality. Tiered reimbursement rates can offer child care providers encouragement and resources to improve the quality of their care. However, a minimal rate differential may not be sufficient to cover the additional costs entailed in meeting the criteria required to qualify for a higher rate, such as costs for additional staff in order to reduce child-staff ratios, recruiting and retaining staff with advanced education in early childhood development, training staff, upgrading facilities, and/or purchasing new equipment and materials. Yet, in about four-fifths of states with tiered rates, the highest rate fell below the 75th percentile of current market rates. In slightly over half of the states with tiered rates, the highest reimbursement rate was also less than 20 percent above the basic rate.
♦♦ Thirty-one states paid higher reimbursement rates for higher-quality care in 2011, the same number as in 2010 (see Table 4d).47
♦♦ Fourteen of the thirty-one states with tiered rates in 2011 had two rate levels (including the base level),48 two states had three levels, seven states had four levels, six states had five levels, and two states had six levels.
♦♦ In approximately four-fifths of the thirty-one states with tiered rates in 2011, the reimbursement rate for center-based care for a four-year-old at the highest quality level was still below the 75th percentile of current market rates (which includes providers at all levels of quality).
% In twenty-five of the thirty-one states, the reimbursement rate at the highest quality level was below the 75th percentile of current market rates.49 This includes eight states in which the reimbursement rate at the highest quality level was more than 20 percent below the 75th percentile.

NatiONal WOmeN’s laW ceNter
10 state child care assistaNce POlicies 2011
% In six of the thirty-one states, the reimbursement rate at the highest quality level was higher than the 75th percentile of current market rates. This includes four states in which the reimbursement rate at the highest quality level was at least 10 percent above the 75th percentile.
♦♦ The difference between the states’ lowest and highest reimbursement rates for center-based care for a four-year-old ranged from 5 percent to 67 percent in 2011. There was no consistent relationship between the percentage difference and whether the highest rate was below or above the 75th percentile of current market rates.
% In six of the thirty-one states, the highest rate was less than 10 percent greater than the lowest rate. In five of these six states, the highest rate was below the 75th percentile of current market rates.
% In ten of the thirty-one states, the highest rate was 10 percent to 19 percent greater than the lowest rate. In eight of these ten states, the highest rate was below the 75th percentile of current market rates.
% In eight of the thirty-one states, the highest rate was 20 percent to 29 percent greater than the lowest rate. In six of these eight states, the highest rate was below the 75th percentile of current market rates.
% In seven of the thirty-one states, the highest rate was at least 30 percent greater than the lowest rate. In six of these seven states, the highest rate was below the 75th percentile of current market rates.
ELIGIBILITY FOR PARENTS SEARCHING FOR A JOB
Child care assistance provided to parents searching for work can help parents who lose a job hold onto their child care until they find a new job. Parents looking for work often need child care so that they have time and availability for job interviews and other activities related to seeking a new job. Parents may also want to retain their child care while they are searching for work so it is available as soon as they find a new job, and so that their children have continuity in their care. Child care assistance for parents searching for a job is particularly important given the challenge of obtaining and maintaining employment in today’s economy.
All but five of the states allowed families receiving child care assistance to continue receiving it while a parent searched for a job for at least some amount of time in 2011. Yet only one-third of the states (seventeen) allowed families to qualify for and begin receiving child care assistance while a parent searched for a job.50 Among states setting a limit by the number of days, weeks, or months, the amount of time parents could receive child care assistance while searching for a job ranged from two weeks to 180 days.
♦♦ Forty-six states allowed families receiving child care assistance to continue receiving it while a parent searched for a job in 2011 (see Table 5).
% Four states allowed families to continue receiving child care assistance until the end of the month in which the parent lost his or her job, and one state allowed families to continue receiving child care assistance until the end of the month following the month in which the parent lost his or her job. In these states, the amount of time a parent had to search for a new job depended on when during the month s/he lost a job.
NatiONal WOmeN’s laW ceNter
state child care assistaNce POlicies 2011 11
% Three states allowed families to continue receiving child care assistance while a parent searched for a job for up to a certain number of hours, including one state with a limit of 80 hours, one state with a limit of 150 hours, and one state with a limit of 240 hours.
% One state allowed families to continue receiving child care assistance while a parent searched for a job for up to two weeks.
% One state allowed families to continue receiving child care assistance while a parent searched for a job for up to twenty-one days.
% Eighteen states allowed families to continue receiving child care assistance while a parent searched for a job for up to either thirty days, four weeks, or one month.
% Three states allowed families to continue receiving child care assistance while a parent searched for a job for up to either forty days, forty-five days, or fifty-six days.
% Nine states allowed families to continue receiving child care assistance while a parent searched for a job for up to either sixty days, eight weeks, or two months.
% Five states allowed families to continue receiving child care assistance while a parent searched for a job for up to either ninety days, thirteen weeks, or three months.
% One state allowed families to continue receiving child care assistance while a parent searched for a job for up to 180 days.
♦♦ Five states did not allow families receiving child care assistance to continue receiving it while a parent searched for a job in 2011.
♦♦ The number of states that allowed families receiving child care assistance to continue receiving it while a parent searched for a job in 2011 (forty-six) was slightly lower than the number of states in 2010 (forty-seven). In addition, three states reduced the length of time families receiving child care assistance could continue to receive it while a parent searched for a job between 2010 and 2011.51
% One state reduced the length of time families receiving child care assistance could continue to receive it from six months to thirty days.
% One state reduced the length of time families receiving child care assistance could continue to receive it from twelve weeks to six weeks.
% One state reduced the length of time families receiving child care assistance could continue to receive it from two months to thirty days.
♦♦ Seventeen states allowed families not receiving child care assistance to qualify for assistance while a parent searched for a job in 2011.
% Three states allowed families to receive child care assistance while a parent searched for a job for up to a certain number of hours, including one state with a limit of 80 hours, one state with a limit of 150 hours, and one state with a limit of 240 hours.
% One state allowed families to receive child care assistance while a parent searched for a job for up to two weeks.
% Four states allowed families to receive child care assistance while a parent searched for a job for up to either thirty days or one month.
% Two states allowed families to receive child care assistance while a parent searched for a job for up to either forty days or forty-five days.
% Six states allowed families to receive child care assistance while a parent searched for a job for up to either sixty days, eight weeks, or two months.

NatiONal WOmeN’s laW ceNter
12 state child care assistaNce POlicies 2011
% One state allowed families to receive child care assistance while a parent searched for a job for up to 180 days.
♦♦ One state permitted localities to allow families not receiving child care assistance to qualify for assistance while a parent searched for a job for up to six months (if funds were available) in 2011.
♦♦ Thirty-three states did not allow families not receiving child care assistance to qualify for assistance while a parent searched for a job in 2011.
♦♦ The number of states that allowed families not receiving child care assistance to qualify for assistance while a parent searched for a job in 2011 (seventeen) was lower than the number of states in 2010 (twenty).52 The sixteen states that allowed families not receiving child care assistance to qualify for assistance while a parent searched for a job in both 2010 and 2011 did not change the length of time these families were allowed to receive assistance.
CONCLUSION
Families experienced some progress under key child care assistance policies between February 2009 and February 2010, but since that time, they have lost considerable ground. Because families saw little if any improvement in the previous decade, this left many of them behind where they had been in 2001. As a result, far too many families are unable to receive any child care assistance, or are provided insufficient assistance to gain access to good-quality child care options.
The picture is likely to become even worse in the coming years as states confront the loss of federal funds for child care and for their overall budgets, placing increased financial strain on already stressed state budgets. As more families are deprived of help paying for reliable child care, parents will find it more difficult to work, children will be less likely to receive the nurturing care that encourages their growth and learning, and the nation will be more likely to lack the strong workforce required for its current and future prosperity.

NatiONal WOmeN’s laW ceNter
state child care assistaNce POlicies 2011 13
ENDNOTES1 Research demonstrates the important role that high-quality child care plays in giving children a strong start. Suzanne Helburn, Mary
L. Culkin, Carollee Howes, Donna Bryant, Richard Clifford, Debby Cryer, Ellen Peisner-Feinberg, and Sharon Lynn Kagan, Cost, Quality, and Child Outcomes in Child Care Centers (Denver, CO: University of Colorado, 1995); Ellen S. Peisner-Feinberg, Richard M. Clifford, Mary L. Culkin, Carollee Howes, Sharon Lynn Kagan, et al., The Children of the Cost, Quality, and Outcomes Study Go to School (Chapel Hill, NC: University of North Carolina, Frank Porter Graham Child Development Center, 1999); Eric Dearing, Kathleen McCartney, and Beck A. Taylor, Does Higher Quality Early Child Care Promote Low-Income Children’s Math and Reading Achievement in Middle Childhood?, Child Development, 80 (5), 2009, 1329-1349; National Research Council and the Institute of Medicine, From Neurons to Neighborhoods: The Science of Early Childhood Development (Washington, DC: National Academy Press, 2000).
2 National Association of Child Care Resource and Referral Agencies, Parents and the High Cost of Child Care: 2011 Report (Washington, DC: NACCRRA, 2011), 7, available at http://www.naccrra.org/publications/naccrra-publications/publications/12330810_Cost%20Report%202011%20v02.pdf.
3 The number of families with children under age six that have incomes under 200 percent of poverty has increased from 6.99 million in 2007 to 7.64 million in 2010 (the most recent year for which data are available). U.S. Census Bureau, Current Population Survey, 2008 Annual Social and Economic Supplement, Detailed Table POV08: Families With Related Children Under 6 by Number of Working Family Members and Family Structure: 2007, available at http://www.census.gov/hhes/www/macro/032008/pov/new08_200_01.htm; U.S. Census Bureau, Current Population Survey, 2011 Annual Social and Economic Supplement, Detailed Table POV08: Families With Related Children Under 6 by Number of Working Family Members and Family Structure: 2010, available at http://www.census.gov/hhes/www/cpstables/032011/pov/new08_200_01.htm.
4 These counts include seven states in which families were worse off under some policies and better off under others.
5 Analysis of data in Karen Schulman and Helen Blank, State Child Care Assistance Policies 2010: New Federal Funds Help States Weather the Storm (Washington, DC: National Women’s Law Center, 2010). These counts include nine states in which families were worse off under some policies and better off under others. Also note that although data on states’ policies on eligibility for child care assistance while a parent searched for a job were not collected in 2009, states were asked about changes in their policies over the previous two years when the data were collected in 2010; the information provided was used for this analysis.
6 American Recovery and Reinvestment Act, Pub. L. No. 111–8, 123 Stat. 524 (2009).
7 Program Instruction (CCDF-ACF-PI-2009-03), Issued April 9, 2009, available at http://www.acf.hhs.gov/programs/ccb/law/guidance/current/pi2009-03/pi2009-03.htm.
8 U.S. Department of Health and Human Services, Administration for Children and Families, Office of Child Care, American Recovery and Reinvestment Act (ARRA) of 2009: Recovery Act Funds for Child Care – Data Summary as of 12/31/2010, available at http://www.acf.hhs.gov/programs/ccb/initiatives/arra/arra_data/summary_101231.htm.
9 This report uses 2001 policies as the basis for comparison because, until 2010, it was the year between the peak year for Child Care and Development Block Grant (CCDBG) funding, 2002, and the peak year for Temporary Assistance for Needy Families (TANF) funding used for child care, 2000. See section on funding for child care assistance.
10 The federal poverty level for a family of three was $18,530 in 2011. U.S. Department of Health and Human Services, The 2011 HHS Poverty Guidelines, available at http://aspe.hhs.gov/poverty/11poverty.shtml. The federal poverty level for a family of three was $18,310 in 2010. U.S. Department of Health and Human Services, The HHS Poverty Guidelines for the Remainder of 2010 (August 2010), available at http://aspe.hhs.gov/poverty/10poverty.shtml.
11 The federal poverty level for a family of three was $14,630 in 2001. U.S. Department of Health and Human Services, The 2001 HHS Poverty Guidelines, available at http://aspe.hhs.gov/poverty/01poverty.htm.
12 Comparable data were not collected for 2001.
13 Elizabeth McNichol, Phil Oliff, and Nicholas Johnson, States Continue to Feel Recession’s Impact (Updated June 17, 2011) (Washington, DC: Center on Budget and Policy Priorities, 2011), available at http://www.cbpp.org/files/9-8-08sfp.pdf; Erica Williams, Michael Leachman and Nicholas Johnson, State Budget Cuts in the New Fiscal Year Are Unnecessarily Harmful: Cuts Are Hitting Hard at Education, Health Care, and State Economies (Updated July 28, 2011) (Washington, DC: Center on Budget and Policy Priorities, 2011), available at http://www.cbpp.org/files/7-26-11sfp.pdf.
14 Illinois updated its income limit to 185 percent of the 2011 federal poverty level ($34,284 a year for a family of three) as of July 1, 2011.
15 Taking into account that South Dakota deducts 4 percent of income in determining eligibility, the effective annual income limit for a family of three was reduced from $38,613 to $33,779.
16 The monthly copayment for a family of three with an annual income of $27,795 was revised to $126 and the monthly copayment for a family of three with an annual income of $18,530 was revised to $46 when Illinois adjusted its income eligibility limit and copayment schedule for the 2011 federal poverty level as of July 1, 2011.
NatiONal WOmeN’s laW ceNter
14 state child care assistaNce POlicies 2011
17 This study focuses on the income criteria used to determine a family’s eligibility when it first applies for assistance, because this traditionally has been used as the measure of access to benefit programs and determines whether a family can enter the program. However, some states allow families to continue to receive assistance up to a higher income level than the initial eligibility cutoff. Information about states that have different entrance and exit eligibility criteria is provided in the notes to Tables 1a and 1b.
18 U.S. Department of Health and Human Services, Administration for Children and Families, Office of Child Care, FY 2011 CCDF Allocations (Based on Appropriation), available at http://www.acf.hhs.gov/programs/ccb/law/allocations/current/state2011/est_fin_all_2011.htm. This amount includes $2.223 billion in discretionary funding and $2.917 billion in mandatory (entitlement) funding.
19 U.S. Department of Health and Human Services, Fiscal Year 2011 Budget in Brief (Washington, DC: U.S. Department of Health and Human Services, 2010), 75, 79, available at http://dhhs.gov/asfr/ob/docbudget/2011budgetinbrief.pdf. In addition to the $1 billion in ARRA funding, this total of $6.044 billion in CCDBG funding includes $2.127 billion in discretionary funding and $2.917 billion in mandatory (entitlement) funding.
20 U.S. Department of Health and Human Services, FY 2003 President’s Budget for HHS (Washington, DC: U.S. Department of Health and Human Services, 2002), 83, 92, available at http://www.hhs.gov/budget/pdf/hhs2003bib.pdf. This amount includes $2.1 billion in discretionary funding and $2.717 billion in mandatory (entitlement) funding.
21 Email from Hannah Matthews, CLASP, to Karen Schulman, National Women’s Law Center, July 29, 2010. Inflation adjustment by CLASP based on the Employment Cost Index (ECI) and Consumer Price Index (CPI) for FY 2003-2009 provided to CLASP by the Congressional Budget Office (CBO), and on CBO economic projections for the ECI and CPI in FY 2010, Congressional Budget Office, The Budget and Economic Outlook: Fiscal Years 2010 to 2020 (January 2010) (Washington, DC: Congressional Budget Office, 2010), 123.
22 National Women’s Law Center analysis of data from U.S. Department of Health and Human Services, Administration for Children and Families, Fiscal Year 2009 TANF Financial Data, Table A. Combined Federal Funds Spent in FY 2009, available at http://www.acf.hhs.gov/programs/ofs/data/2009/tanf_2009.html. Total includes $1.727 billion transferred to CCDBG, $343 million spent on child care categorized as “assistance,” and $1.444 billion spent on child care categorized as “non-assistance.”
23 National Women’s Law Center analysis of data from U.S. Department of Health and Human Services, Administration for Children and Families, Fiscal Year 2000 TANF Financial Data, Table A. Combined Federal Funds Spent in FY 2000 Through the Fourth Quarter, available at http://www.acf.hhs.gov/programs/ofs/data/tanf_2000.html. Total includes $2.413 billion transferred to CCDBG, $353 million spent on child care categorized as “assistance,” and $1.200 billion spent on child care categorized as “non-assistance.”
24 Email from Hannah Matthews, CLASP, to Karen Schulman, National Women’s Law Center, Aug. 18, 2010. Inflation adjustment by CLASP based on the Employment Cost Index (ECI) and Consumer Price Index (CPI) for FY 2001-2009 provided to CLASP by the Congressional Budget Office (CBO), and on CBO economic projections for the ECI and CPI in FY 2010, Congressional Budget Office, The Budget and Economic Outlook: Fiscal Years 2010 to 2020 (January 2010) (Washington, DC: Congressional Budget Office, 2010), 123.
25 In FY 2001, CCDBG funding was $4.567 billion ($5.733 billion in FY 2010 dollars) and TANF funding used for child care was $3.541 billion ($4.445 billion in FY 2010 dollars). The CCDBG funding amount includes $2.0 billion in discretionary funding and $2.567 billion in mandatory (entitlement) funding. U.S. Department of Health and Human Services, FY 2002 President’s Budget for HHS (Washington, DC: U.S. Department of Health and Human Services, 2001), 89-90, available at http://archive.hhs.gov/budget/pdf/hhs2002.pdf. The TANF funding amount includes $1.899 billion transferred to CCDBG, $285 million spent on child care categorized as “assistance,” and $1.357 billion spent on child care categorized as “non-assistance.” National Women’s Law Center analysis of data from U.S. Department of Health and Human Services, Administration for Children and Families, Fiscal Year 2001 TANF Financial Data, Table A. Combined Federal Funds Spent in FY 2001 Through the Fourth Quarter, available at http://www.acf.hhs.gov/programs/ofs/data/tanf_2001.html. CCDBG and TANF amounts in FY 2010 dollars provided in email from Hannah Matthews, CLASP, to Karen Schulman, National Women’s Law Center, Aug. 18, 2010. Inflation adjustment by CLASP based on the Employment Cost Index (ECI) and Consumer Price Index (CPI) for FY 2002-2009 provided to CLASP by the Congressional Budget Office (CBO), and on CBO economic projections for the ECI and CPI in FY 2010, Congressional Budget Office, The Budget and Economic Outlook: Fiscal Years 2010 to 2020 (January 2010) (Washington, DC: Congressional Budget Office, 2010), 123.
26 In states that allow localities to set their income limits within a state-specified range, the maximum of that range was used for the analysis in this section.
27 State median income is not used to measure inflation between 2001 and 2011 because variations among states in state median income adjustments and in which benchmark states use to set their income eligibility limits are more difficult to track than changes in the federal poverty level over a long-term period.
28 These seven states include two that set their income limits based on the federal poverty level and adjusted their income limits for the 2011 federal poverty level between February 2010 and February 2011 and five that set their income limits based on the state median income level and adjusted their income limits for the updated state median income estimate between February 2010 and February 2011.
29 In these thirty-nine states, the income limit as a percentage of poverty declined by four percentage points or fewer. Of these thirty-nine states, at least nineteen increased or planned to increase their income limits to adjust for the 2011 federal poverty level and at least four increased or planned to increase their income limits to adjust for an updated state median income estimate between February 2011 and February 2012. States that set their income limits based on the federal poverty level typically adjust them at the same time each year, but

NatiONal WOmeN’s laW ceNter
state child care assistaNce POlicies 2011 15
2010 differed because the U.S. Department of Health and Human Services delayed the update of the federal poverty level, usually issued each February, until August, and at that time, kept it at the same level as the 2009 federal poverty level ($18,310 a year for a family of three). See Delayed Update of the HHS Poverty Guidelines for the Remainder of 2010, 75 Fed. Reg. 45,628 (Aug. 3, 2010). Therefore, states that had their income limits based on 2009 federal poverty levels as of February 2010 and planned to adjust them for 2010 federal poverty levels later in the year, effectively already had them based on 2010 federal poverty level as of February 2010.
30 These sixteen states include one state where the income limit as a percentage of poverty decreased by four percentage points, one state where the income limit decreased by three percentage points, six states where the income limit decreased by two percentage points, three states where the income limit stayed the same, one state where the income limit increased by two percentage points, two states where the income limit increased by three percentage points, and two states where the income limit increased by four percentage points.
31 National Women’s Law Center analysis of data from Economic Policy Institute, Basic Family Budget Spreadsheets (2007), available at http://www.epi.org/pages/budget_calculator_intro/; and from James Lin and Jared Bernstein, What We Need to Get By (Washington, DC: Economic Policy Institute, 2008), available at http://www.epi.org/publications/entry/bp224/; Sylvia Allegretto, Basic Family Budgets: Working Families’ Incomes Often Fail to Meet Living Expenses Around the U.S. (Washington, DC: Economic Policy Institute, 2005), available at http://www.epi.org/page/-/old/briefingpapers/165/bp165.pdf.
32 See, e.g., Karen Schulman and Helen Blank, In Their Own Voices: Parents and Providers Struggling with Child Care Cuts (Washington, DC: National Women’s Law Center, 2005), 10; Children’s Action Alliance, The Real Reality of Arizona’s Working Families—Child Care Survey Highlights (Phoenix, AZ: Children’s Action Alliance, 2004); Deborah Schlick, Mary Daly, and Lee Bradford, Faces on the Waiting List: Waiting for Child Care Assistance in Ramsey County (Ramsey County, MN: Ramsey County Human Services, 1999) (Survey conducted by the Minnesota Center for Survey Research at the University of Minnesota); Philip Coltoff, Myrna Torres, and Natasha Lifton, The Human Cost of Waiting for Child Care: A Study (New York, NY: Children’s Aid Society, 1999); Jennifer Gulley and Ann Hilbig, Waiting List Survey: Gulf Coast Workforce Development Area (Houston, TX: Neighborhood Centers, Inc., 1999); Jeffrey D. Lyons, Susan D. Russell, Christina Gilgor, and Amy H. Staples, Child Care Subsidy: The Costs of Waiting (Chapel Hill, NC: Day Care Services Association, 1998); Casey Coonerty and Tamsin Levy, Waiting for Child Care: How Do Parents Adjust to Scarce Options in Santa Clara County? (Berkeley, CA: Policy Analysis for California Education, 1998); Philadelphia Citizens for Children and Youth, et al., Use of Subsidized Child Care by Philadelphia Families (Philadelphia, PA: Philadelphia Citizens for Children and Youth, 1997); Greater Minneapolis Day Care Association, Valuing Families: The High Cost of Waiting for Child Care Sliding Fee Assistance (Minneapolis, MN: Greater Minneapolis Day Care Association, 1995).
33 Waiting lists are not a perfect measure of unmet need, however. For example, waiting lists may increase due to expanded outreach efforts that make more families aware of child care assistance programs, and may decrease due to a state’s adoption of more restrictive eligibility criteria.
34 If a state determined its copayment based on the cost of care, this study assumes that the family had a four-year-old in a licensed, non-accredited center charging the state’s maximum reimbursement rate.
35 U.S. Census Bureau, Who’s Minding the Kids? Child Care Arrangements: Summer 2006, Detailed Tables, Table 6: Average Weekly Child Care Expenditures of Families with Employed Mothers that Make Payments, by Age Groups and Selected Characteristics: Summer 2006 (2009), available at http://www.census.gov/population/socdemo/child/table-2006/tab06.xls.
36 For a family of three, 150 percent of the federal poverty level was equal to an income of $27,465 in 2010 and $27,795 in 2011.
37 These seven states do not include states that had income eligibility limits to initially qualify for assistance below 150 percent of poverty but allowed families already receiving assistance to remain eligible with incomes above 150 percent of poverty.
38 For a family of three, 150 percent of the federal poverty level was equal to an income of $21,945 in 2001.
39 Child Care and Development Fund (Preamble to Final Rule), 63 Fed. Reg. 142 (July 24, 1998), available at http://www.acf.hhs.gov/programs/ccb/law/finalrul/fr072498.pdf.
40 For this analysis, a state’s reimbursement rates in a given year are considered up-to-date if based on a market survey conducted no more than two years prior to that year. Also note that for this analysis, a state’s reimbursement rates are not considered to be at the 75th percentile of market rates if only some of its rates—for example, for certain regions, age groups, or higher-quality care—are at the 75th percentile.
41 The one state that reduced its reimbursement rates is New Mexico. The three states that increased their reimbursement rates are Alaska, Illinois, and Texas. (These three states do not include Maryland or Vermont, which increased their rates in January 2010 and whose increased rates were reflected in the State Child Care Assistance Policies 2010 report.) Any other differences between rates shown in Table 4c of this report and rates shown in Table 4c of the State Child Care Assistance Policies 2010 report are due to revisions or recalculations of the data rather than policy changes.
42 These twenty-one states include Texas because it reported that a majority of its localities—which determine when to update rates—had updated at least some of their rates within the past two years. However, these twenty-one states do not include Colorado because it did not report that any of its localities—which also determine when to update rates—had updated their rates within the past two years. These twenty-one states also do not include Hawaii, which only updated its rates for license-exempt care in 2010.

NatiONal WOmeN’s laW ceNter
16 state child care assistaNce POlicies 2011
43 States were asked to report data from their most recent market rate survey, and most states reported data from 2009 or more recent surveys. However, three states—California, Idaho, and North Dakota—reported data from 2008 or earlier. These three states are not included in the twenty-five states because their reimbursement rates were less than 20 percent below the 75th percentile of market rates based on their outdated surveys, and thus it is not possible to calculate whether their reimbursement rates were 20 percent or more below the 75th percentile of current market rates.
44 California, Idaho, and North Dakota are not included in the twenty-four states because their reimbursement rates were less than 20 percent below the 75th percentile of market rates based on their outdated surveys, and thus it is not possible to calculate whether their reimbursement rates were 20 percent or more below the 75th percentile of current market rates.
45 Comparable data were not collected for 2001. However, comparable data were collected for 2000 and 2005. In each of these years, thirty-seven states permitted child care providers to charge parents the difference between the state reimbursement rate and the provider’s private fee. Karen Schulman and Helen Blank, Child Care Assistance Policies 2005: States Fail to Make Up Lost Ground, Families Continue to Lack Critical Supports (Washington, DC: National Women’s Law Center, 2005), 5 and 18; Karen Schulman, Helen Blank, and Danielle Ewen, A Fragile Foundation: State Child Care Assistance Policies (Washington, DC: Children’s Defense Fund, 2001), 103.
46 This analysis is based on tiered rates in each state’s most populous city, county, or region. Within each state, the use and structure of tiered rates may vary across cities, counties, or regions.
47 Comparable data on tiered rates were not collected for 2001.
48 These fourteen states include Nevada, which plans to have four tier levels, but so far has only implemented Tier 1 and Tier 4.
49 These twenty-five states include New Mexico and North Carolina, which determined a separate 75th percentile of current market rates for child care providers at each quality level. In both states, the reimbursement rate at the highest quality level was lower than even the 75th percentile for the lowest-priced level.
50 This analysis is based on policies for families not connected to the TANF program. Additional states allow families receiving or transitioning from TANF to qualify for child care assistance while searching for a job.
51 The data in this report on the length of time each state allowed parents to receive child care assistance while searching for a job are not comparable to the data in the 2010 State Child Care Assistance Policies report due to changes in the survey question wording and changes in the way some states reported information about their policies. Actual changes in policy are indicated in the notes for Table 5.
52 The number of states that allowed families not receiving child care assistance to qualify for assistance while a parent searched for a job in 2010 reported here (twenty) differs from the number reported in the 2010 State Child Care Assistance Policies report (eighteen) because two states provided revised information.
NatiONal WOmeN’s laW ceNter
state child care assistaNce POlicies 2011 17
* indicates notes found on pages 19 and 20.
TABLE 1A: INCOME ELIGIBILITY LIMITS FOR A FAMILY OF THREE IN 2010 AND 2011 Income limit in 2011 Income limit in 2010 Change in income limit 2010 to 2011
State As annual dollar amount
As percent of poverty
($18,530 a year)As percent of state
median incomeAs annual dollar
amountAs percent of
poverty ($18,310 a year)
As percent of state median income
As annual dollar amount
As percent of poverty
As percent of state median income
Alabama* $23,808 128% 44% $23,808 130% 47% $0 -2% -3%
Alaska* $54,288 293% 77% $46,248 253% 69% $8,040 40% 8%
Arizona* $30,216 163% 51% $30,216 165% 54% $0 -2% -3%
Arkansas* $28,345 153% 60% $28,345 155% 62% $0 -2% -2%
California* $45,228 244% 68% $45,228 247% 70% $0 -3% -3%
Colorado* $23,803-$54,108 128%-292% 35%-80% $23,803-$54,108 130%-296% 37%-85% $0 -4% – -2% -5% – -2%
Connecticut* $42,690 230% 50% $61,556 336% 75% -$18,866 -106% -25%
Delaware $36,624 198% 52% $36,624 200% 55% $0 -2% -3%
District of Columbia* $45,775 247% 80% $45,775 250% 84% $0 -3% -4%
Florida* $27,468 148% 47% $27,468 150% 49% $0 -2% -2%
Georgia $28,160 152% 48% $35,200 192% 61% -$7,040 -40% -13%
Hawaii $47,124 254% 62% $47,124 257% 66% $0 -3% -4%
Idaho $23,184 125% 43% $23,184 127% 46% $0 -2% -2%
Illinois* $36,624 198% 54% $36,624 200% 56% $0 -2% -2%
Indiana* $23,256 126% 39% $23,256 127% 40% $0 -2% -1%
Iowa* $26,556 143% 43% $26,556 145% 45% $0 -2% -1%
Kansas* $33,876 183% 55% $33,876 185% 58% $0 -2% -3%
Kentucky* $27,468 148% 51% $27,468 150% 53% $0 -2% -3%
Louisiana* $37,896 205% 69% $37,896 207% 73% $0 -2% -5%
Maine* $45,775 247% 79% $45,775 250% 81% $0 -3% -2%
Maryland $29,990 162% 35% $29,990 164% 37% $0 -2% -2%
Massachusetts* $41,396 223% 50% $39,207 214% 50% $2,189 9% 0%
Michigan $23,880 129% 37% $23,880 130% 38% $0 -2% -1%
Minnesota* $34,348 185% 47% $32,944 180% 47% $1,404 5% 0%
Mississippi $34,999 189% 74% $34,999 191% 79% $0 -2% -5%
Missouri* $23,520 127% 40% $23,520 128% 42% $0 -2% -2%
Montana $27,468 148% 50% $27,468 150% 52% $0 -2% -3%
Nebraska* $21,972 119% 36% $21,972 120% 37% $0 -1% -2%
Nevada* $43,248 233% 72% $43,248 236% 75% $0 -3% -3%
New Hampshire* $45,775 247% 58% $45,775 250% 61% $0 -3% -3%
New Jersey* $36,620 198% 43% $36,620 200% 45% $0 -2% -2%
New Mexico* $36,620 198% 79% $36,620 200% 82% $0 -2% -3%
New York* $36,620 198% 53% $36,620 200% 56% $0 -2% -3%
North Carolina* $37,476 202% 66% $37,476 205% 69% $0 -2% -3%
North Dakota* $29,556 160% 48% $29,556 161% 52% $0 -2% -4%
Ohio* $27,468 148% 44% $27,468 150% 46% $0 -2% -2%
Oklahoma* $35,100 189% 69% $35,100 192% 73% $0 -2% -4%
Oregon $34,281 185% 57% $33,874 185% 60% $407 0% -3%
Pennsylvania* $36,620 198% 55% $36,620 200% 58% $0 -2% -3%
Rhode Island* $32,958 178% 46% $32,958 180% 47% $0 -2% -1%
South Carolina* $27,465 148% 50% $27,465 150% 53% $0 -2% -3%
South Dakota* $38,150 206% 66% $38,150 208% 70% $0 -2% -4%
Tennessee* $32,352 175% 60% $31,044 170% 60% $1,308 5% 0%
Texas* $27,465-$46,658 148%-252% 50%-85% $27,465-$44,524 150%-243% 52%-85% $0-$2,134 -2%-9% -2%-0%
Utah* $35,244 190% 60% $33,192 181% 60% $2,052 9% 0%
Vermont $36,600 198% 59% $36,600 200% 59% $0 -2% -1%
Virginia* $27,468-$45,780 148%-247% 39%-64% $27,468-$45,780 150%-250% 40%-67% $0 -3% – -2% -2% – -1%
Washington $32,424 175% 47% $36,624 200% 56% -$4,200 -25% -9%
West Virginia* $27,468 148% 56% $27,468 150% 58% $0 -2% -2%
Wisconsin* $34,281 185% 52% $33,876 185% 54% $405 0% -2%
Wyoming* $43,596 235% 66% $48,175 263% 79% -$4,579 -28% -13%

NatiONal WOmeN’s laW ceNter
18 state child care assistaNce POlicies 2011
TABLE 1B: INCOME ELIGIBILITY LIMITS FOR A FAMILY OF THREE IN 2001 AND 2011 Income limit in 2011 Income limit in 2001 Change in income limit 2001 to 2011
State As annual dollar amount
As percent of poverty
($18,530 a year)As percent of state
median incomeAs annual dollar
amountAs percent of
poverty ($14,630 a year)
As percent of state median income
As annual dollar amount
As percent of poverty
As percent of state median income
Alabama* $23,808 128% 44% $18,048 123% 41% $5,760 5% 3%
Alaska* $54,288 293% 77% $44,328 303% 75% $9,960 -10% 2%
Arizona* $30,216 163% 51% $23,364 160% 52% $6,852 3% -1%
Arkansas* $28,345 153% 60% $23,523 161% 60% $4,822 -8% 0%
California* $45,228 244% 68% $35,100 240% 66% $10,128 4% 1%
Colorado* $23,803-$54,108 128%-292% 35%-80% $19,020-$32,000 130%-219% 36%-61% $4,783-$22,108 -2%-73% -1%-19%
Connecticut* $42,690 230% 50% $47,586 325% 75% -$4,896 -95% -25%
Delaware $36,624 198% 52% $29,260 200% 53% $7,364 -2% -1%
District of Columbia* $45,775 247% 80% $34,700 237% 66% $11,075 10% 13%
Florida* $27,468 148% 47% $20,820 142% 45% $6,648 6% 2%
Georgia $28,160 152% 48% $24,278 166% 50% $3,882 -14% -2%
Hawaii* $47,124 254% 62% $46,035 315% 83% $1,089 -60% -20%
Idaho $23,184 125% 43% $20,472 140% 51% $2,712 -15% -8%
Illinois* $36,624 198% 54% $24,243 166% 43% $12,381 32% 10%
Indiana* $23,256 126% 39% $20,232 138% 41% $3,024 -13% -2%
Iowa* $26,556 143% 43% $19,812 135% 41% $6,744 8% 2%
Kansas* $33,876 183% 55% $27,060 185% 56% $6,816 -2% -1%
Kentucky* $27,468 148% 51% $24,140 165% 55% $3,328 -17% -4%
Louisiana* $37,896 205% 69% $29,040 205% 75% $8,856 0% -6%
Maine* $45,775 247% 79% $36,452 249% 75% $9,323 -2% 4%
Maryland $29,990 162% 35% $25,140 172% 40% $4,850 -10% -5%
Massachusetts* $41,396 223% 50% $28,968 198% 48% $12,428 25% 2%
Michigan $23,880 129% 37% $26,064 178% 47% -$2,184 -49% -10%
Minnesota* $34,348 185% 47% $42,304 289% 76% -$7,956 -104% -29%
Mississippi $34,999 189% 74% $30,999 212% 77% $4,000 -23% -3%
Missouri* $23,520 127% 40% $17,784 122% 37% $5,736 5% 3%
Montana $27,468 148% 50% $21,948 150% 51% $5,520 -2% -1%
Nebraska* $21,972 119% 36% $25,260 173% 54% -$3,288 -54% -18%
Nevada* $43,248 233% 72% $33,420 228% 67% $9,828 5% 5%
New Hampshire* $45,775 247% 58% $27,797 190% 50% $17,978 57% 8%
New Jersey* $36,620 198% 43% $29,260 200% 46% $7,360 -2% -4%
New Mexico* $36,620 198% 79% $28,300 193% 75% $8,320 4% 4%
New York* $36,620 198% 53% $28,644 202% 61% $7,976 -4% -8%
North Carolina* $37,476 202% 66% $32,628 223% 69% $4,848 -21% -3%
North Dakota* $29,556 160% 48% $29,556 202% 69% $0 -43% -21%
Ohio* $27,468 148% 44% $27,066 185% 57% $402 -37% -13%
Oklahoma* $35,100 189% 69% $29,040 198% 66% $6,060 -9% 3%
Oregon $34,281 185% 57% $27,060 185% 60% $7,221 0% -3%
Pennsylvania* $36,620 198% 55% $29,260 200% 58% $7,360 -2% -3%
Rhode Island* $32,958 178% 46% $32,918 225% 61% $40 -47% -15%
South Carolina* $27,465 148% 50% $21,225 145% 45% $6,240 3% 5%
South Dakota* $38,150 206% 66% $22,826 156% 52% $15,324 50% 14%
Tennessee* $32,352 175% 60% $24,324 166% 56% $8,028 8% 4%
Texas* $27,465-$46,658 148%-252% 50%-85% $21,228-$36,516 145%-250% 47%-82% $6,237-$10,142 2%-3% 3%
Utah* $35,244 190% 60% $28,248 193% 59% $6,996 -3% 1%
Vermont $36,600 198% 59% $31,032 212% 64% $5,568 -15% -5%
Virginia* $27,468-$45,780 148%-247% 39%-64% $21,948-$27,060 150%-185% 41%-50% $5,520-$18,720 -2%-62% -2%-14%
Washington $32,424 175% 47% $32,916 225% 63% -$492 -50% -15%
West Virginia* $27,468 148% 56% $28,296 193% 75% -$828 -45% -19%
Wisconsin* $34,281 185% 52% $27,060 185% 51% $7,221 0% 1%
Wyoming* $43,596 235% 66% $21,948 150% 47% $21,648 85% 19%
* indicates notes found on pages 19 and 20.

NatiONal WOmeN’s laW ceNter
state child care assistaNce POlicies 2011 19
NOTES FOR TABLES 1A AND 1B: INCOME ELIGIBILITY LIMITS
The income eligibility limits shown in the table represent the maximum income families can have when they apply for child care assistance. Some states allow families, once receiving assistance, to continue receiving assistance up to a higher income level than that initial limit. These higher exit eligibility limits are reported below for states that have them.
Changes in income limits were calculated using raw data, rather than the rounded numbers shown in the table.
Alabama: In 2001, families already receiving assistance could continue doing so until their income reached $27,756. In 2010 and 2011, the exit eligibility limit was $27,468. As of October 2011, the income limit to qualify for assistance was expected to increase to $24,084 (130 percent of poverty) to adjust for the 2011 federal poverty level.
Alaska: The Alaska Permanent Fund Dividend (PFD) payment, which the majority of families in the state receive, is not counted when determining eligibility.
Arizona: As of July 2011, the income limit was increased to $30,600 (165 percent of poverty) to adjust for the 2011 federal poverty level.
Arkansas: The income limits shown in the table take into account a deduction of $100 per month ($1,200 a year) that is allowed for an adult household member who works at least 30 hours per week. It is assumed there is one working parent. The stated income limits, in policy, were $22,323 in 2001 and $27,145 in 2010 and 2011. As of October 2011, the stated income limit was expected to increase to $29,760 (60 percent of state median income) to adjust for the updated state median income estimate.
California: Under policies in effect in 2001, families who had been receiving assistance as of January 1, 1998 could continue doing so until their income reached $46,800 since they were subject to higher income guidelines previously in effect. Also note that two pilot counties (San Mateo and San Francisco) allowed families already receiving assistance to continue to receive it up to an income of $54,096 in 2010 and 2011. As of July 2011, the state’s income limit was reduced to $42,216 (70 percent of the 2007 state median income).
Colorado: Counties set their income limits within state guidelines. Also note that counties may allow families already receiving assistance to continue doing so after their income exceeds the county’s initial income limit for up to six months, if their income remains below 85 percent of state median income ($54,108 in 2010 and 2011).
Connecticut: In 2011, families already receiving assistance could continue doing so until their income reached $64,035. In 2010, the state did not have a separate exit eligibility limit. As of July 2011, the income limit to qualify for assistance was increased to $42,893 (50 percent of state median income), and the exit eligibility limit was increased to $64,340 (75 percent of state median income) to adjust for the 2011 state median income estimate.
District of Columbia: In 2001, families already receiving assistance could continue doing so until their income reached $41,640. In 2010 and 2011, the exit eligibility limit was $51,101.
Florida: In 2010 and 2011, families already receiving assistance could continue doing so until their income reached $36,620. As of July 2011, the income limit to qualify for assistance was increased to $27,795 (150 percent of poverty), and the exit eligibility limit was increased to $37,060 (200 percent of poverty) to adjust for the 2011 federal poverty level.
Hawaii: In 2001, the state allowed a 20 percent deduction of all countable income in determining eligibility, which is taken into account in the figure shown here. The stated income limit, in policy, was $36,828. The state no longer used the deduction in 2010 or 2011.
Illinois: In 2001, the state allowed a 10 percent earned income deduction in determining eligibility, which is taken into account in the figure shown here. The stated income limit, in policy, was $21,819. The state no longer used the deduction in 2010 or 2011. As of April 2011, the income limit was reduced to $33,876 (185 percent of the 2010 federal poverty level). As of July 2011, the income limit was increased to $34,284 to adjust for the 2011 federal poverty level.
Indiana: In 2010 and 2011, families already receiving assistance could continue doing so until their income reached $31,128. As of April 2011, the income limit to qualify for assistance was increased to $23,532 (127 percent of poverty), and the exit eligibility limit was increased to $31,500 (170 percent of poverty) to adjust for the 2011 federal poverty level.
Iowa: For special needs care, the income limit was $36,624 in 2010 and 2011. As of July 2011, the income limit for standard care was increased to $26,880 (145 percent of poverty), and the income limit for special needs care was increased to $37,080 (200 percent of poverty) to adjust for the 2011 federal poverty level. Also note that in some areas of the state a separate ARRA-funded scholarship program in effect from July 2009 through June 2011 helped families with incomes between $26,556 and $33,874 pay for infant and toddler care offered by providers that were accredited by the National Association for the Education of Young Children (NAEYC) or the National Association for Family Child Care (NAFCC) or that had a rating of a level three or higher under the state’s child care quality rating and improvement system.
Kansas: As of May 2011, the income limit was increased to $34,272 (185 percent of poverty) to adjust for the 2011 federal poverty level.
Kentucky: In 2010 and 2011, families already receiving assistance could continue doing so until their income reached $30,216. As of April 2011, the income limit to qualify for assistance was increased to $27,795 (150 percent of poverty), and the exit eligibility limit was increased to $30,575 (165 percent of poverty) to adjust for the 2011 federal poverty level.
Louisiana: As of June 2011, the income limit was reduced to $35,868 (65 percent of the 2011 state median income). Also note that data on the state’s policies as of 2001 are not available, so data on policies as of March 15, 2000 are used instead.
Maine: As of April 2011, the income limit was increased to $46,325 (250 percent of poverty) to adjust for the 2011 federal poverty level.
Massachusetts: In 2001, families already receiving assistance could continue doing so until their income reached $49,248. In 2010, the exit eligibility limit was $64,103 and in 2011, it was $70,372. Also note that, for special needs care, the income limit to qualify for assistance was $64,103 in 2010 and $70,372 in 2011, and the exit eligibility limit was $78,415 in 2010 and $82,791 in 2011. As of July 2011, for standard care, the income limit to qualify for assistance was increased to $42,025 (50 percent of state median income), and the exit eligibility limit was increased to $71,441 (85 percent of state median income) to adjust for the updated state median income estimate.
Minnesota: In 2010, families already receiving assistance could continue doing so until their income reached $46,962. In 2011, the exit eligibility limit was $48,964.
Missouri: In 2010 and 2011, families already receiving assistance could continue doing so until their income reached $25,740.

NatiONal WOmeN’s laW ceNter
20 state child care assistaNce POlicies 2011
Nebraska: For families transitioning from TANF, the income limit was $33,876 in 2010 and 2011. As of July 2011, the income limit was increased to $34,296 (185 percent of poverty) for families transitioning from TANF and to $22,248 (120 percent of poverty) for all other families to adjust for the 2011 federal poverty level.
Nevada: As of October 2011, the income limit was expected to increase to $44,880 (75 percent of state median income) to adjust for the updated state median income estimate.
New Hampshire: As of July 2011, the income limit was increased to $46,325 (250 percent of poverty) to adjust for the 2011 federal poverty level.
New Jersey: In 2001, families already receiving assistance could continue doing so until their income reached $36,575. In 2010 and 2011, the exit eligibility limit was $45,775. As of October 2011, the income limit to qualify for assistance was expected to increase to $37,060 (200 percent of poverty), and the exit eligibility limit was expected to increase to $46,325 (250 percent of poverty) to adjust for the 2011 federal poverty level.
New Mexico: As of April 2011, the income limit was increased to $37,060 (200 percent of poverty) to adjust for the 2011 federal poverty level.
New York: A few small demonstration projects set the income limit at $46,691 in 2010 and 2011. Also note that data on the state’s policies as of 2001 are not available, so data on policies as of March 15, 2000 are used instead. As of June 2011, the state’s income limit was increased to $37,060 (200 percent of poverty) to adjust for the 2011 federal poverty level.
North Carolina: As of August 2011, the income limit was increased to $42,816 (75 percent of state median income) to adjust for the 2011 state median income estimate.
North Dakota: As of October 2011, the income limit was expected to increase to $30,576 (45 percent of state median income) to adjust for the updated state median income estimate.
Ohio: In 2010 and 2011, families already receiving assistance could continue doing so until their income reached $36,620. The state did not have a separate exit eligibility limit in 2001. As of July 2011, the income limit to qualify for assistance was reduced to $23,172 (125 percent of poverty); however, families already receiving assistance can continue to receive it up to the higher exit eligibility limit, which was increased to $37,080 (200 percent of poverty) to adjust for the 2011 federal poverty level.
Oklahoma: The income limit depends on how many children are in child care. The income limits shown in the table assume that the family had two children in subsidized care. The income limit for a family of three with only one child in subsidized care was $29,100 in 2010 and 2011.
Pennsylvania: In 2001, families already receiving assistance could continue doing so until their income reached $34,381. In 2010 and 2011, the exit eligibility limit was $43,029. As of May 2011, the income limit to qualify for assistance was increased to $37,060 (200 percent of poverty), and the exit eligibility limit was increased to $43,546 (235 percent of poverty) to adjust for the 2011 federal poverty level.
Rhode Island: As of April 2011, the income limit was increased to $33,354 (180 percent of poverty) to adjust for the 2011 federal poverty level.
South Carolina: In 2001, families already receiving assistance could continue doing so until their income reached $24,763. In 2010 and 2011, the exit eligibility limit was $32,043. As of October 2011, the income limit to qualify for assistance was expected to increase to $27,795 (150 percent of poverty), and the exit eligibility limit was expected to increase to $32,428 (175 percent of poverty) to adjust for the 2011 federal poverty level.
South Dakota: The income limits shown in the table take into account that the state disregards 4 percent of earned income in determining eligibility. The stated income limits, in policy, were $21,913 in 2001 and $36,624 in 2010 and 2011. As of March 2011, the stated income limit was increased to $37,068 (200 percent of poverty) to adjust for the 2011 federal poverty level. As of July 2011, the stated income limit was reduced to $32,428 (175 percent of poverty).
Tennessee: The state had a separate ARRA-funded child care scholarship program that provided assistance to low-income, working parents who had incomes up to $43,968, who were not receiving child care benefits through any other state program, and who were referred to the program by their child care provider, from April 1, 2009 to September 30, 2010; the state did not accept new children into the program after April 1, 2010.
Texas: Local workforce development boards set their own income limits within state guidelines. Some local boards allow families an extended year of child care assistance up to a higher income than the initial eligibility limit; however, this exit eligibility limit cannot exceed 85 percent of state median income. As of October 2011, the maximum income at which local boards can set their eligibility limits was expected to increase to $46,773 (85 percent of state median income) to adjust for the 2011 state median income estimate.
Utah: The income limits shown in the table take into account a standard deduction of $100 per month ($1,200 a year) for each working parent, assuming there is one working parent in the family, and a standard deduction of $100 per month ($1,200 a year) for all families to help cover any medical expenses. The stated income limits, in policy, were $25,848 in 2001, $30,792 in 2010, and $32,844 in 2011. Also note that in 2010, families already receiving assistance could remain eligible up to a stated income limit of $38,496. In 2011, the stated exit eligibility limit was $41,052. As of October 2011, the stated income limit to qualify for assistance was expected to increase to $33,079 (56 percent of state median income), and the stated exit eligibility limit was expected to increase to $41,349 (70 percent of state median income) to adjust for the 2012 state median income estimate. The stated income limit to qualify for special needs care was $46,740 in 2010 and $49,848 in 2011.
Virginia: The state has different income limits for different regions of the state. In 2001, the state had three separate regional income limits, which for a family of three were: $21,948, $23,400, and $27,060. In 2010 and 2011, the state had four separate regional income limits: $27,468, $29,304, $33,876, and $45,780. As of October 2011, the income limits were expected to increase to $27,804 (150 percent of poverty), $29,652 (160 percent of poverty), $34,284 (185 percent of poverty), and $46,332 (250 percent of poverty) to adjust for the 2011 federal poverty level.
West Virginia: In 2010 and 2011, families already receiving assistance could continue doing so until their income reached $33,876. As of August 2011, the income limit to qualify for assistance was increased to $27,792 (150 percent of poverty), and the exit eligibility limit was increased to $34,284 (185 percent of poverty) to adjust for the 2011 federal poverty level.
Wisconsin: In 2001, families already receiving assistance could continue doing so until their income reached $29,256. In 2010, the exit eligibility limit was $36,624 and in 2011, it was $37,060.
Wyoming: The income limits shown in the table for 2010 and 2011 take into account a standard deduction of $200 per month ($2,400 a year) for each working parent, assuming there is one working parent in the family. The stated income limits, in policy, were $45,775 in 2010 and $41,196 in 2011. As of April 2011, the stated income limit was increased to $41,688 (225 percent of poverty) to adjust for the 2011 federal poverty level. Also note that, in 2001, families already receiving assistance could continue doing so until their income reached $27,060. The state did not have a separate exit eligibility limit in 2010 or 2011.

NatiONal WOmeN’s laW ceNter
state child care assistaNce POlicies 2011 21
TABLE 2: WAITING LISTS FOR CHILD CARE ASSISTANCE State Number of children or families
on waiting lists as of early 2011Number of children or families
on waiting lists as of early 2010Number of children or families
on waiting lists as of December 2001
Alabama* 7,602 children 6,682 children 5,089 children
Alaska No waiting list No waiting list 588 children
Arizona* 4,626 children 11,391 children No waiting list
Arkansas 14,000 children 2,727 children 8,000 children
California* 187,516 children 194,460 children 280,000 children (estimated)
Colorado* 5,205 children 1,455 children Waiting lists at county level
Connecticut No waiting list No waiting list No waiting list
Delaware No waiting list No waiting list No waiting list
District of Columbia* No waiting list No waiting list 9,124 children
Florida* 67,988 children 66,947 children 46,800 children
Georgia* Frozen intake No waiting list 16,099 children
Hawaii No waiting list No waiting list No waiting list
Idaho No waiting list No waiting list No waiting list
Illinois No waiting list No waiting list No waiting list
Indiana* 12,689 children 11,622 children 11,958 children
Iowa No waiting list No waiting list No waiting list
Kansas No waiting list No waiting list No waiting list
Kentucky No waiting list No waiting list No waiting list
Louisiana No waiting list No waiting list No waiting list
Maine No waiting list No waiting list 2,000 children
Maryland* 2,854 children No waiting list No waiting list
Massachusetts 19,451 children 22,426 children 18,000 children
Michigan No waiting list No waiting list No waiting list
Minnesota* 4,572 families 3,728 families 4,735 children
Mississippi* 9,652 children No waiting list 10,422 children
Missouri No waiting list No waiting list No waiting list
Montana No waiting list No waiting list Varies by resource and referral district
Nebraska No waiting list No waiting list No waiting list
Nevada* 1,749 children 2,545 children No waiting list
New Hampshire* No waiting list 1,845 children No waiting list
New Jersey* 8,559 children 2,931 children 9,800 children
New Mexico* 5,092 children 1,216 children No waiting list
New York* Waiting lists at local level Waiting lists at local level Waiting lists at local level
North Carolina 46,749 children 37,929 children 25,363 children
North Dakota No waiting list No waiting list No waiting list
Ohio No waiting list No waiting list No waiting list
Oklahoma No waiting list No waiting list No waiting list
Oregon* No waiting list No waiting list No waiting list
Pennsylvania* 11,726 children 5,022 children 540 children
Rhode Island No waiting list No waiting list No waiting list
South Carolina No waiting list No waiting list No waiting list
South Dakota No waiting list No waiting list No waiting list
Tennessee* Frozen intake Frozen intake 9,388 children (and frozen intake)
Texas* 22,845 children 11,572 children 36,799 children
Utah No waiting list No waiting list No waiting list
Vermont No waiting list No waiting list No waiting list
Virginia* 11,018 children 9,670 children 4,255 children
Washington* 3,455 families No waiting list No waiting list
West Virginia No waiting list No waiting list No waiting list
Wisconsin No waiting list No waiting list No waiting list
Wyoming No waiting list No waiting list No waiting list
* indicates notes found on page 22.

NatiONal WOmeN’s laW ceNter
22 state child care assistaNce POlicies 2011
NOTES FOR TABLE 2: WAITING LISTS FOR CHILD CARE ASSISTANCE
Alabama: Data for December 2001 are not available so data from November of that year are used instead.
Arizona: The waiting list total for 2011 is from April 15, 2011.
California: The waiting list total for 2001 is an estimated figure. The waiting list totals for 2010 and 2011 are from June of each year.
Colorado: Waiting lists are kept at the county level, rather than at the state level. Four counties had waiting lists in 2001, but data on the total number of children on waiting lists in counties that had them are not available. In addition, four counties had frozen intake in 2001. The waiting list totals for 2010 and 2011 are the totals of reported county waiting lists.
District of Columbia: The waiting list total for 2001 may include some children living in the wider metropolitan area that encompasses parts of Maryland and Virginia.
Florida: The waiting list total for 2010 is from March 31, 2010.
Georgia: The state froze intake as of May 2011 for all families other than minor parents enrolled full time in school, grandparents over the age of 60 or receiving Supplemental Security Income (SSI) who are raising children under five, protective services cases, TANF applicants and recipients, and children with special needs.
Indiana: In addition to the waiting list, some counties froze intake in 2001.
Maryland: The waiting list was implemented on February 28, 2011.
Minnesota: The waiting list totals for 2010 and 2011 are from March of each year.
Mississippi: Families with incomes at or below 50 percent of state median income are not placed on the waiting list.
Nevada: Families with incomes below 130 percent of poverty are not placed on the waiting list.
New Hampshire: The waiting list total for 2010 is from April 19, 2010.
New Jersey: Data for 2001 are not available, so data from March 2002 are used instead. The waiting list total for 2010 is from April 22, 2010. The waiting list total for 2011 is from May 2011.
New Mexico: The waiting list total for 2011 is from March 2011. Families with incomes at or below 100 percent of poverty are not placed on the waiting list.
New York: Waiting lists are kept at the local district level and statewide data are not available. Each local district also has the authority to freeze intake and stop adding names to its waiting list.
Oregon: A waiting list was implemented in October 2010, but in January 2011 the state began serving all families on the waiting list each month, and in March 2011 the state stopped placing families on the waiting list.
Pennsylvania: The waiting list total for 2011 is from January 2011.
Tennessee: When the state reported its data in 2001, the state had frozen intake for families not in the TANF or Transitional Child Care programs. The waiting list total for 2001 represents the number of children on the waiting list when intake was closed. The state did not provide a similar number for 2010 or 2011, when intake was also frozen. TANF families, families transitioning from TANF, teen parents in high school, and children in foster care are exempt from the freeze.
Texas: Local workforce development boards maintain waiting lists. The totals in the table represent the aggregate number of children on waiting lists across all boards. The waiting list totals for 2010 and 2011 are from March of each year. In addition, some boards have frozen intake.
Virginia: Data for December 2001 are not available, so data from January of that year are used instead.
Washington: The state implemented a waiting list effective March 1, 2011. The waiting list total is from May 2011.

NatiONal WOmeN’s laW ceNter
state child care assistaNce POlicies 2011 23
TABLE 3A: PARENT COPAYMENTS FOR A FAMILY OF THREE WITH AN INCOME AT 150 PERCENT OF POVERTY AND ONE CHILD IN CARE
Monthly fee in 2011 Monthly fee in 2010 Monthly fee in 2001 Change 2010 to 2011 Change 2001 to 2011State As a dollar
amountAs a percent
of incomeAs a dollar
amountAs a percent of
incomeAs a dollar
amountAs a percent of
incomeIn dollar amount
In percent of income
In dollar amount
In percent of income
Alabama Not eligible Not eligible $197 9% $215 12% N/A N/A N/A N/A
Alaska $115 5% $67 3% $71 4% $48 2% $44 1%
Arizona $152 7% $152 7% $217 12% $0 0% -$65 -5%
Arkansas $365 16% $365 16% $224 12% $0 0% $141 4%
California $87 4% $87 4% $0 0% $0 0% $87 4%
Colorado $259 11% $253 11% $185 10% $6 0% $74 1%
Connecticut $139 6% $137 6% $110 6% $2 0% $29 0%
Delaware $220 9% $208 9% $159 9% $12 0% $61 1%
District of Columbia $102 4% $88 4% $91 5% $14 1% $11 -1%
Florida* $173 7% $173 8% $104 6% $0 0% $69 2%
Georgia $191 8% $190 8% $139 8% $1 0% $52 1%
Hawaii $405 17% $405 18% $38 2% $0 0% $367 15%
Idaho Not eligible Not eligible Not eligible Not eligible Not eligible Not eligible N/A N/A N/A N/A
Illinois $85 4% $186 8% $134 7% -$101 -4% -$49 -4%
Indiana* $208 9% $170 7% $154 8% $38 2% $54 1%
Iowa* Not eligible Not eligible Not eligible Not eligible Not eligible Not eligible N/A N/A N/A N/A
Kansas $207 9% $88 4% $162 9% $119 5% $45 0%
Kentucky $286 12% $242 11% $177 10% $44 2% $109 3%
Louisiana* $152 7% $152 7% $114 6% $0 0% $38 0%
Maine $231 10% $227 10% $183 10% $4 0% $48 0%
Maryland* $313 13% $313 14% $236 13% $0 0% $77 1%
Massachusetts $195 8% $195 9% $160 9% $0 0% $35 0%
Michigan Not eligible Not eligible Not eligible Not eligible $24 1% N/A N/A N/A N/A
Minnesota $76 3% $74 3% $53 3% $2 0% $23 0%
Mississippi* $155 7% $155 7% $105 6% $0 0% $50 1%
Missouri Not eligible Not eligible Not eligible Not eligible Not eligible Not eligible N/A N/A N/A N/A
Montana Not eligible Not eligible $227 10% $256 14% N/A N/A N/A N/A
Nebraska* Not eligible Not eligible Not eligible Not eligible $129 7% N/A N/A N/A N/A
Nevada $199 9% $149 7% $281 15% $50 2% -$82 -7%
New Hampshire $313 14% $309 13% $2 <1% $4 0% $311 13%
New Jersey $106 5% $51 2% $133 7% $55 2% -$27 -3%
New Mexico $159 7% $138 6% $115 6% $21 1% $44 1%
New York* $276 12% $267 12% $191 10% $9 0% $85 1%
North Carolina $232 10% $229 10% $159 9% $3 0% $73 1%
North Dakota $344 15% $336 15% $293 16% $8 0% $51 -1%
Ohio $207 9% $200 9% $88 5% $7 0% $119 4%
Oklahoma $189 8% $189 8% $146 8% $0 0% $43 0%
Oregon $343 15% $334 15% $319 17% $9 0% $24 -3%
Pennsylvania $173 7% $173 8% $152 8% $0 0% $21 -1%
Rhode Island $185 8% $113 5% $19 1% $73 3% $166 7%
South Carolina $87 4% $74 3% $77 4% $13 1% $10 0%
South Dakota $334 14% $165 7% $365 20% $169 7% -$31 -6%
Tennessee $160 7% $189 8% $112 6% -$29 -1% $48 1%
Texas* $116-$301 5%-13% $114-$251 5%-11% $165-$256 9%-14% $2-$50 0%-2% -$49-$45 -4% – -1%
Utah $172 7% $172 8% $220 12% $0 0% -$48 -5%
Vermont $224 10% $224 10% $123 7% $0 0% $101 3%
Virginia $231 10% $228 10% $183 10% $3 0% $48 0%
Washington $146 6% $134 6% $87 5% $12 0% $59 2%
West Virginia $54 2% $54 2% $54 3% $0 0% $0 -1%
Wisconsin $217 9% $204 9% $160 9% $13 0% $57 1%
Wyoming $39 2% $39 2% $98 5% $0 0% -$59 -4%
* indicates notes found on page 25.

NatiONal WOmeN’s laW ceNter
24 state child care assistaNce POlicies 2011
TABLE 3B: PARENT COPAYMENTS FOR A FAMILY OF THREE WITH AN INCOME AT 100 PERCENT OF POVERTY AND ONE CHILD IN CARE
Monthly fee in 2011 Monthly fee in 2010 Monthly fee in 2001 Change 2010 to 2011 Change 2001 to 2011State As a dollar
amountAs a percent of
incomeAs a dollar
amountAs a percent of
incomeAs a dollar
amountAs a percent of
incomeIn dollar amount
In percent of income
In dollar amount
In percent of income
Alabama $78 5% $78 5% $65 5% $0 0% $13 0%
Alaska $45 3% $15 1% $14 1% $30 2% $31 2%
Arizona $65 4% $43 3% $65 5% $22 1% $0 -1%
Arkansas $0 0% $0 0% $0 0% $0 0% $0 0%
California $0 0% $0 0% $0 0% $0 0% $0 0%
Colorado $155 10% $155 10% $113 9% $0 0% $42 1%
Connecticut $62 4% $61 4% $49 4% $1 0% $13 0%
Delaware $100 7% $113 7% $55 5% -$13 -1% $45 2%
District of Columbia $44 3% $35 2% $32 3% $9 1% $12 0%
Florida* $106 7% $106 7% $69 6% $0 0% $37 1%
Georgia $130 8% $129 8% $21 2% $1 0% $109 7%
Hawaii $203 13% $203 13% $0 0% $0 0% $203 13%
Idaho $177 11% $153 10% $65 5% $24 1% $112 6%
Illinois $34 2% $87 6% $65 5% -$53 -3% -$31 -3%
Indiana* $77 5% $0 0% $0 0% $77 5% $77 5%
Iowa* $9 1% $9 1% $22 2% $0 0% -$13 -1%
Kansas $58 4% $0 0% $22 2% $58 4% $36 2%
Kentucky $176 11% $132 9% $97 8% $44 3% $79 3%
Louisiana* $152 10% $77 5% $49 4% $75 5% $103 6%
Maine $123 8% $121 8% $97 8% $2 0% $26 0%
Maryland* $200 13% $200 13% $90 7% $0 0% $110 6%
Massachusetts $141 9% $119 8% $40 3% $22 1% $101 6%
Michigan $24 2% $24 2% $24 2% $0 0% $0 0%
Minnesota $43 3% $42 3% $5 <1% $1 0% $38 2%
Mississippi* $80 5% $80 5% $47 4% $0 0% $33 1%
Missouri $110 7% $110 7% $43 4% $0 0% $67 4%
Montana $62 4% $42 3% $49 4% $20 1% $13 0%
Nebraska $61 4% $0 0% $30 2% $61 4% $31 1%
Nevada $50 3% $25 2% $0 0% $25 2% $50 3%
New Hampshire $122 8% $80 5% $0 0% $42 3% $122 8%
New Jersey $77 5% $0 0% $71 6% $77 5% $6 -1%
New Mexico $68 4% $62 4% $47 4% $6 0% $21 1%
New York* $6 <1% $4 <1% $4 <1% $2 0% $2 0%
North Carolina $154 10% $153 10% $106 9% $1 0% $48 1%
North Dakota $258 17% $252 17% $158 13% $6 0% $100 4%
Ohio $112 7% $101 7% $43 4% $11 1% $69 4%
Oklahoma $120 8% $120 8% $54 4% $0 0% $66 3%
Oregon $129 8% $125 8% $90 7% $4 0% $39 1%
Pennsylvania $87 6% $65 4% $65 5% $22 1% $22 0%
Rhode Island $31 2% $0 0% $0 0% $31 2% $31 2%
South Carolina $61 4% $48 3% $43 4% $13 1% $18 0%
South Dakota $0 0% $0 0% $0 0% $0 0% $0 0%
Tennessee $108 7% $90 6% $39 3% $18 1% $69 4%
Texas* $77-$201 5%-13% $76-$167 5%-11% $109-$170 9%-14% $1-$34 0%-2% -$32-$31 -4% – -1%
Utah $1 <1% $1 <1% $36 3% $0 0% -$35 -3%
Vermont $0 0% $0 0% $0 0% $0 0% $0 0%
Virginia $154 10% $152 10% $122 10% $2 0% $32 0%
Washington $50 3% $50 3% $20 2% $0 0% $30 2%
West Virginia $38 2% $38 2% $27 2% $0 0% $11 0%
Wisconsin $87 6% $78 5% $61 5% $9 1% $26 1%
Wyoming $0 0% $10 1% $10 1% -$10 -1% -$10 -1%
* indicates notes found on page 25.

NatiONal WOmeN’s laW ceNter
state child care assistaNce POlicies 2011 25
NOTES FOR TABLES 3A AND 3B: PARENT COPAYMENTS
For a family of three, an income at 100 percent of poverty was equal to $14,630 a year in 2001, $18,310 a year in 2010, and $18,530 a year in 2011.
For a family of three, an income at 150 percent of poverty was equal to $21,945 a year in 2001, $27,465 a year in 2010, and $27,795 a year in 2011.
For states that calculate their fees as a percentage of the cost of care, it is assumed that the family was purchasing care at the state’s maximum reimbursement rate for licensed, non-accredited center care for a four-year-old. Monthly fees were calculated from hourly, daily, and weekly fees assuming the child was in care 9 hours a day, 5 days a week, 4.33 weeks a month. Copayments for states with standard income deductions were determined based on adjusted income.
Changes in copayments were calculated using raw data, rather than the rounded numbers shown in the table.
Florida: Local coalitions have flexibility in setting copayments; the copayments in the table reflect the maximum copayment levels allowed under state policy and used by a local coalition.
Indiana: Copayments vary depending on how long the family has been receiving child care assistance, with families paying a higher percentage of income the longer they receive assistance. The copayments shown in the table assume it is the first year the family is receiving assistance.
Iowa: A family with an income at 150 percent of poverty would be eligible for assistance if the family were using special needs care. For this family, the copayment would have been $174 per month in 2010 and $152 per month in 2011. A family with an income at 100 percent of poverty that is using special needs care would have the same copayment as a family using standard care.
Louisiana: Data are not available for June 2001, so data from March 2000 are used instead.
Maryland: The state determines copayments based on maximum state reimbursement rates in the region where the family lives.
Mississippi: For children in foster care or protective services and children receiving SSI benefits, the copayment is $10 per month.
Nebraska: A family with an income at 150 percent of poverty would be eligible if the family were transitioning from TANF. This family’s copayment would have been $160 per month in 2010 and $183 per month in 2011.
New York: Local social services districts set copayments within a state-specified range; the copayments in the table reflect the maximum amount allowed in that range. Also note that data are not available for June 2001, so data from March 2000 are used instead.
Texas: Local workforce development boards set their own copayments within state guidelines. Also note that parents participating in the TANF work program (Choices) and the Food Stamp Employment and Training program are exempt from the copayment.

NatiONal WOmeN’s laW ceNter
26 state child care assistaNce POlicies 2011
TABLE 4A: STATE REIMBURSEMENT RATES IN 2011State State reimbursement rates compared to market rates Year when rates
last updated If state rate is lower than rate provider charges, is provider allowed to charge
parents the difference?
Alabama 12th-51st percentile of 2009 rates 2009 Yes
Alaska* 50th/75th percentile of 2009 rates 2010 Yes
Arizona* 75th percentile of 2000 rates 2006 Yes
Arkansas* 75th percentile of 2006 rates 2006 Yes, for quality approved
California 85th percentile of 2005 rates 2006 Yes
Colorado* Locally determined Varies by locality No
Connecticut 60th percentile of 2001 rates 2002 Yes
Delaware* 52%-75% of the 75th percentile of 2009 rates 2006 Yes
District of Columbia 75th percentile of 2001 rates 2006 No
Florida* Locally determined 2009 Yes
Georgia 50th percentile of 2005 rates 2006 Yes
Hawaii* At or below the 75th percentile of 2009 rates 2008 Yes
Idaho* 75th percentile of 2001 rates 2001 Yes
Illinois* 25th-100th percentile of 2010 rates 2011 Yes, unless contracted
Indiana 72nd percentile of 2007 rates 2007 Yes
Iowa 2% above the 75th percentile of 2004 rates 2008 No
Kansas 65th percentile of 2000 rates 2002 Yes
Kentucky 68th percentile of 2005 rates 2006 Yes
Louisiana* Below the 50th percentile of 2010 rates 2007 Yes
Maine 75th percentile of 2008 rates 2009 No
Maryland 51st percentile of 2005 rates 2010 Yes
Massachusetts* 3rd-43rd percentile of 2011 rates 2009 No
Michigan Below the 75th percentile of 2011 rates 2009 Yes
Minnesota* 30th-41st percentile of 2010 rates 2006 Yes
Mississippi* 36th-75th percentile of 2009 rates 2007 Yes
Missouri* 33rd percentile of 2008 rates 2008 Yes
Montana 75th percentile of 2009 rates 2009 Yes
Nebraska 60th percentile of 2008 rates 2009 No
Nevada 15th-65th of 2010 rates 2004 Yes
New Hampshire 50th percentile of 2007 rates 2009 Yes
New Jersey* Below the 75th percentile of 2010 rates 2009 Yes, unless contracted
New Mexico* Above or below the 75th percentile of 2009 rates 2007 No
New York 75th percentile of 2009 rates 2009 Yes
North Carolina* Below the 75th percentile of 2007 rates 2007 Yes
North Dakota 85% of the 75th percentile of 2008 rates 2009 Yes
Ohio* 35th percentile of 2008 rates 2009 No
Oklahoma* 23rd-72nd percent of 2010 rates 2009 No
Oregon 75th percentile of 2006 rates 2007 Yes
Pennsylvania* 40th-72nd percentile of 2007 rates 2007 Yes
Rhode Island 75th percentile of 2002/2004 rates 2008 No
South Carolina 50th-75th percentile of 2009 rates 2007 Yes
South Dakota 75th percentile of 2009 rates 2009 Yes
Tennessee* 45th-60th percentile of 2006 rates 2008 Yes
Texas* 23rd-88th percentile 2009 rates Varies by locality Yes
Utah 30th-70th percentile of 2009 rates 2007 Yes
Vermont* At or below the 75th percentile of 2008 rates 2010 Yes
Virginia* 20th-35th of 2009-2010 rates 2004/2009 Yes
Washington* 10th-84th percentile of 2010 rates 2008 No
West Virginia* 35th-85th percentile of 2011 rates 2009 No
Wisconsin 75th percentile of 2005 rates 2006 Yes
Wyoming 75th percentile of 2007 rates 2007 Yes
* indicates notes found on pages 30 and 31.
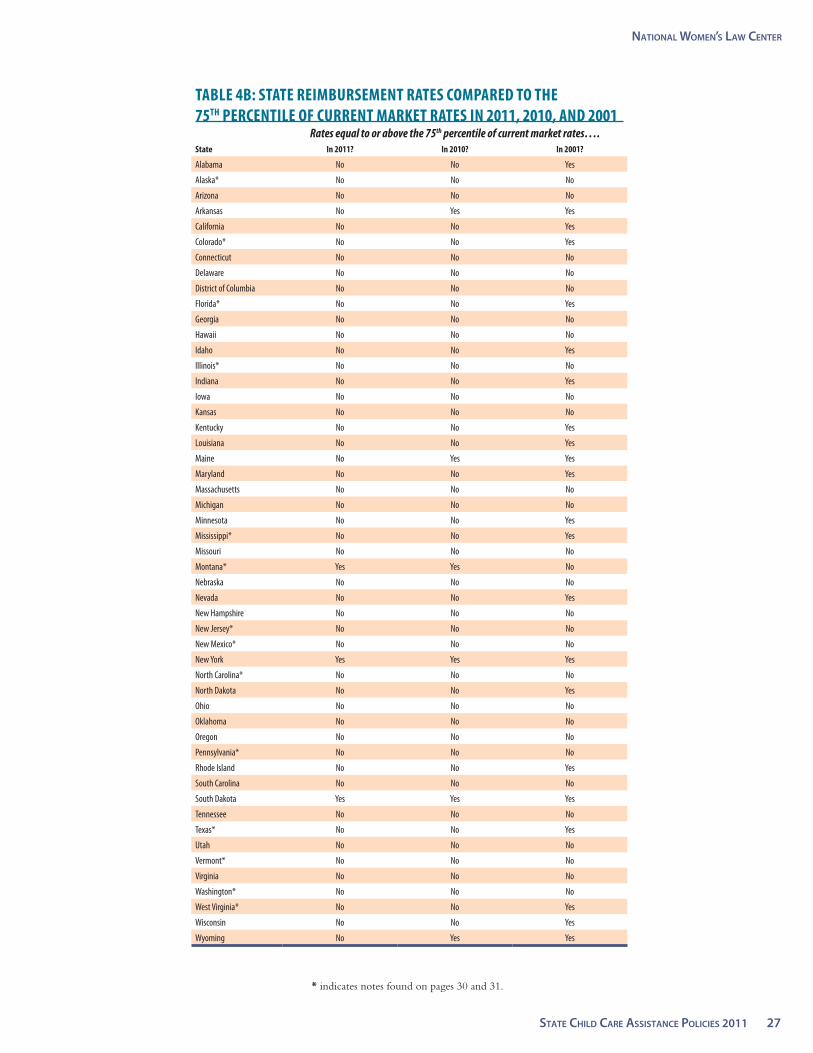
NatiONal WOmeN’s laW ceNter
state child care assistaNce POlicies 2011 27
TABLE 4B: STATE REIMBURSEMENT RATES COMPARED TO THE 75TH PERCENTILE OF CURRENT MARKET RATES IN 2011, 2010, AND 2001
Rates equal to or above the 75th percentile of current market rates….State In 2011? In 2010? In 2001?
Alabama No No Yes
Alaska* No No No
Arizona No No No
Arkansas No Yes Yes
California No No Yes
Colorado* No No Yes
Connecticut No No No
Delaware No No No
District of Columbia No No No
Florida* No No Yes
Georgia No No No
Hawaii No No No
Idaho No No Yes
Illinois* No No No
Indiana No No Yes
Iowa No No No
Kansas No No No
Kentucky No No Yes
Louisiana No No Yes
Maine No Yes Yes
Maryland No No Yes
Massachusetts No No No
Michigan No No No
Minnesota No No Yes
Mississippi* No No Yes
Missouri No No No
Montana* Yes Yes No
Nebraska No No No
Nevada No No Yes
New Hampshire No No No
New Jersey* No No No
New Mexico* No No No
New York Yes Yes Yes
North Carolina* No No No
North Dakota No No Yes
Ohio No No No
Oklahoma No No No
Oregon No No No
Pennsylvania* No No No
Rhode Island No No Yes
South Carolina No No No
South Dakota Yes Yes Yes
Tennessee No No No
Texas* No No Yes
Utah No No No
Vermont* No No No
Virginia No No No
Washington* No No No
West Virginia* No No Yes
Wisconsin No No Yes
Wyoming No Yes Yes
* indicates notes found on pages 30 and 31.

NatiONal WOmeN’s laW ceNter
28 state child care assistaNce POlicies 2011
TABLE 4C: STATE REIMBURSEMENT RATE AMOUNT IN 2011 COMPARED TO MARKET RATE AMOUNT FOR CHILD CARE CENTERSCenter care for a four-year-old Center care for a one-year-old
State City/county/region* Monthly state
reimbursement rate
75th percentile of market rate
Year of market rate
Difference between state rate and 75th
percentile
Percentage difference
between state rate and 75th
percentile
Monthly state reimbursement
rate
75th percentile of market rate
Year of market rate
Difference between state rate and 75th
percentile
Percentage difference
between state rate and 75th
percentile
Alabama Birmingham Region $442 $559 2009 -$117 -21% $481 $615 2009 -$134 -22%
Alaska Anchorage $650 $690 2009 -$40 -6% $850 $850 2009 $0 0%
Arizona Maricopa County (Phoenix) $515 $836 2010 -$320 -38% $576 $974 2010 -$398 -41%
Arkansas Pulaski County $457 $468 2011 -$11 -2% $552 $552 2011 $0 0%
California Los Angeles County $744 $787 2007 -$44 -6% $1,029 $1,228 2007 -$199 -16%
Colorado Denver $578 $953 2009 -$375 -39% $721 $1,097 2009 -$376 -34%
Connecticut North Central Region $650 $1,078 2011 -$429 -40% $818 $1,277 2011 -$459 -36%
Delaware New Castle County $478 $782 2009 -$304 -39% $539 $888 2009 -$349 -39%
District of Columbia Citywide $632 $1,170 2010 -$538 -46% $862 $1,460 2010 -$598 -41%
Florida Miami-Dade County $403 $541 2009 -$139 -26% $442 $585 2009 -$143 -24%
Georgia Zone 1 $494 $715 2009 -$221 -31% $602 $815 2009 -$212 -26%
Hawaii Statewide $675 $675 2009 $0 0% $1,395 $1,425 2009 -$30 -2%
Idaho* Boise Metro Area (Region IV) $492 $602 2006 -$110 -18% $594 $667 2006 -$73 -11%
Illinois* Metropolitan Region (Group 1A) $768 $963 2010 -$196 -20% $1,091 $1,245 2010 -$154 -12%
Indiana Marion County $693 $792 2011 -$99 -13% $814 $905 2011 -$91 -10%
Iowa* Statewide $561 $686 2010 -$125 -18% $696 $814 2010 -$118 -15%
Kansas Sedgwick County $444 $695 2010 -$251 -36% $661 $823 2010 -$162 -20%
Kentucky Central Region $473 $550 2009 -$77 -14% $540 $616 2009 -$76 -12%
Louisiana Statewide $379 $487 2010 -$108 -22% $401 $541 2010 -$141 -26%
Maine Cumberland County $805 $868 2010 -$63 -7% $996 $1,050 2010 -$54 -5%
Maryland* Region W $532 $780 2009-2011 -$247 -32% $844 $1,084 2009-2011 -$240 -22%
Massachusetts Metro Boston Region $795 $1,299 2011 -$504 -39% $1,181 $1,710 2011 -$529 -31%
Michigan Statewide $487 $975 2010-2011 -$488 -50% $731 $1,000 2010-2011 -$269 -27%
Minnesota Hennepin County $859 $1,052 2010 -$193 -18% $1,154 $1,403 2010 -$249 -18%
Mississippi Statewide $312 $390 2011 -$78 -20% $339 $433 2011 -$94 -22%
Missouri St. Louis Area $348 $840 2010 -$492 -59% $596 $1,124 2010 -$528 -47%
Montana Billings Region $624 $624 2009 $0 0% $714 $714 2009 $0 0%
Nebraska Urban Counties $671 $758 2010 -$87 -11% $812 $866 2010 -$54 -6%
Nevada Clark County $498 $749 2010 -$251 -34% $606 $844 2010 -$238 -28%
New Hampshire Statewide $680 $801 2009 -$121 -15% $810 $985 2009 -$175 -18%
New Jersey Statewide $573 $974 2010 -$401 -41% $695 $1,127 2010 -$432 -38%
New Mexico* Metropolitan Counties $422 $607 2009 -$184 -30% $501 $694 2009 -$194 -28%
New York New York City $940 $940 2009 $0 0% $1,464 $1,464 2009 $0 0%
North Carolina* Mecklenburg County $702 $853 2008-2009 -$151 -18% $737 $988 2008-2009 -$251 -25%
North Dakota Statewide $430 $506 2007 -$76 -15% $480 $565 2007 -$85 -15%
Ohio* Cuyahoga County (Cleveland) $603 $766 2010 -$163 -21% $746 $949 2010 -$203 -21%
Oklahoma* Enhanced Area Counties $438 $510 2010 -$72 -14% $601 $671 2010 -$70 -10%
Oregon* Region A $705 $840 2010 -$135 -16% $894 $1,038 2010 -$144 -14%
Pennsylvania Philadelphia $714 $823 2010 -$108 -13% $909 $1,023 2010 -$114 -11%
Rhode Island Statewide $680 $862 2009 -$182 -21% $814 $989 2009 -$175 -18%
South Carolina Statewide Urban Counties $476 $554 2011 -$78 -14% $528 $624 2011 -$96 -15%
South Dakota Minnehaha County/Sioux Falls $614 $614 2009 $0 0% $722 $722 2009 $0 0%
Tennessee* Top Tier Counties $515 $590 2010 -$75 -13% $598 $654 2010 -$56 -9%
Texas Gulf Coast Workforce Development Area $507 $676 2009 -$169 -25% $713 $921 2009 -$209 -23%
Utah Statewide $450 $516 2009 -$66 -13% $564 $710 2009 -$146 -21%
Vermont Statewide $561 $822 2010 -$261 -32% $594 $898 2010 -$304 -34%
Virginia Fairfax County $844 $1,212 2009-2010 -$368 -30% $1,212 $1,416 2009-2010 -$204 -14%
Washington King County (Region 4) $673 $1,053 2010 -$380 -36% $802 $1,255 2010 -$452 -36%
West Virginia Statewide $498 $541 2011 -$43 -8% $606 $628 2011 -$22 -3%
Wisconsin* Zone D $779 $914 2010 -$134 -15% $1,005 $1,156 2010 -$152 -13%
Wyoming Statewide $542 $625 2010 -$84 -13% $606 $694 2010 -$88 -13%
* indicates notes found on pages 30 and 31. * indicates notes found on pages 30 and 31.

NatiONal WOmeN’s laW ceNter
state child care assistaNce POlicies 2011 29
TABLE 4D: STATE TIERED REIMBURSEMENT RATES FOR CENTER CARE FOR A FOUR-YEAR-OLD IN 2011
State City/county/region*
Number of tier levels
(including base rate)
Reimbursement rate for lowest
tier
Reimbursement rate for highest
tier
Reimbursement rates between highest and
lowest tiers
Difference between
highest and lowest tiers
Percentage difference between
highest and lowest tiers
75th percentile of market rate
Difference between rate
at highest tier and 75th
percentile
Percentage difference
between rate at highest
tier and 75th percentile
Alabama
Alaska
Arizona Maricopa County (Phoenix) 2 $515 $567 N/A $52 10% $836 -$269 -32%
Arkansas
California
Colorado* Denver 6 $578 $773 $619, $643, $706, $740 $196 34% $953 -$179 -19%
Connecticut North Central Region 2 $650 $682 N/A $32 5% $1,078 -$396 -37%
Delaware
District of Columbia Citywide 3 $632 $909 $771 $277 44% $1,170 -$261 -22%
Florida* Miami-Dade County 2 $403 $483 N/A $81 20% $541 -$58 -11%
Georgia
Hawaii* Statewide 2 $675 $710 N/A $35 5% $675 $35 5%
Idaho
Illinois* Metropolitan Region (Group 1A) 5 $668 $801 $701, $734, $768 $134 20% $963 -$162 -17%
Indiana Marion County 2 $693 $762 N/A $69 10% $792 -$30 -4%
Iowa
Kansas
Kentucky* Central Region 4 $462 $523 See notes $61 13% $550 -$27 -5%
Louisiana* Statewide 5 $379 $455 $390, $409, $430 $76 20% $487 -$33 -7%
Maine* Cumberland County 4 $805 $1,007 $846, $886 $201 25% $868 $139 16%
Maryland* Region W 4 $532 $671 $585, $633 $139 26% $780 -$109 -14%
Massachusetts
Michigan
Minnesota Hennepin County 2 $859 $988 N/A $129 15% $1,052 -$64 -6%
Mississippi Statewide 2 $312 $339 N/A $27 9% $390 -$51 -13%
Missouri St. Louis Area 2 $348 $417 N/A $70 20% $840 -$423 -50%
Montana Billings Region 5 $624 $748 $655, $686, $717 $125 20% $624 $125 20%
Nebraska Urban Counties 2 $671 $736 N/A $65 10% $758 -$22 -3%
Nevada* Clark County 2 $498 $573 N/A $75 15% $749 -$176 -24%
New Hampshire
New Jersey Statewide 2 $573 $604 N/A $31 5% $974 -$370 -38%
New Mexico* Metropolitan Counties 5 $379 $506 $422, $446, $480 $127 33% $687 -$181 -26%
New York* New York City 2 $940 $1,081 N/A $141 15% $940 $141 15%
North Carolina* Mecklenburg County 5 $477 $702 $501, $641, $670 $225 47% $853 -$151 -18%
North Dakota
Ohio Cuyahoga County (Cleveland) 4 $603 $693 $633, $663 $90 15% $766 -$73 -9%
Oklahoma* Enhanced Area Counties 4 $292 $487 $373, $438 $195 67% $510 -$23 -5%
Oregon
Pennsylvania Philadelphia 4 $714 $779 $730, $762 $65 9% $823 -$43 -5%
Rhode Island
South Carolina Statewide Urban Counties 5 $390 $624 $455, $476, $580 $234 60% $554 $70 13%
South Dakota
Tennessee* Top Tier Counties 4 $429 $515 $450, $494 $87 20% $590 -$75 -13%
Texas Gulf Coast Workforce Development Area 2 $507 $533 N/A $25 5% $676 -$144 -21%
Utah
Vermont Statewide 6 $561 $786 $589, $617, $673, $730 $224 40% $822 -$37 -4%
Virginia
Washington
West Virginia Statewide 3 $498 $585 $541 $87 17% $541 $43 8%
Wisconsin* Zone D 2 $779 $857 N/A $78 10% $914 -$56 -6%
Wyoming
* indicates notes found on pages 30 and 31.

NatiONal WOmeN’s laW ceNter
30 state child care assistaNce POlicies 2011
NOTES FOR TABLES 4A, 4B, 4C AND 4D: REIMBURSEMENT RATES
State reimbursement rates are compared to the 75th percentile of market rates (the rate designed to allow families access to 75 percent of providers in their community) because federal regulations recommend that rates be set at this level.
A state is considered to have rates that were based on current market prices if the market survey used to set its rates was conducted no more than two years earlier (so, for example, rates used in 2011 are considered current if set at the 75th percentile of 2009 or more recent market rates).
States were asked to report reimbursement rates and the 75th percentile of market rates for their most populous city, county, or region. Monthly rates were calculated from hourly, daily, and weekly rates assuming the child was in care 9 hours a day, 5 days a week, 4.33 weeks a month. Differences between state reimbursement rates and the 75th percentile were calculated using raw data, rather than the rounded numbers shown in the table.
For states that pay higher rates for higher-quality care, the most common rate level (the level representing the greatest number of providers) for each state is used for the data analysis in Tables 4a, 4b, and 4c, unless otherwise indicated. The rates analyzed in the tables do not reflect other types of higher rates or rate enhancements, such as higher rates paid for care for children with special needs or care during non-traditional hours.
Alaska: Reimbursement rates are set at the 75th percentile of market rates for infant and toddler care and at the 50th percentile for all other categories of care.
Arizona: Reimbursement rates were set at the 75th percentile of 2000 market rates in 2006. On July 1, 2007, the state implemented a 5 percent increase in rates. On April 1, 2009, the state reversed this 5 percent increase and rates reverted to the level at which they had been set in 2006.
Arkansas: Only providers with state quality approval are allowed to charge parents the difference between the state reimbursement rate and the rate charged to private-paying parents.
Colorado: Each county determines its own reimbursement rates and whether to offer higher rates for higher-quality care.
Delaware: Providers are allowed to charge parents the difference between the state reimbursement rate and the private-pay rate under the Purchase of Care Plus option.
Florida: Reimbursement rates vary by local coalition. In addition, local coalitions may pay rates that are up to 20 percent higher than the basic rate for Gold Seal providers, a designation authorized by the legislature indicating higher-quality care and tied to accreditation. Miami-Dade reimburses Gold Seal providers at a rate that is 20 percent higher than the basic rate.
Hawaii: Reimbursement rates were last updated for licensed care in 2008 and for license-exempt care in 2010. Also note that the state has higher reimbursement rates for accredited center-based care for children over age 24 months through the time the children are eligible to enroll in kindergarten or junior kindergarten (usually age five by the end of the calendar year, depending on the child’s birth date). The state does not have accredited rates for care for infants and toddlers or for family child care.
Idaho: Compared to 2008 market rates, reimbursement rates are at the 52nd percentile for child care centers and family child care homes and at the 48th percentile for group child care. Also note that Region IV includes Ada, Boise, Elmore, and Valley Counties.
Illinois: Reimbursement rates are not based on a percentile of market rates. Rates vary by age of child, type of care, and region of the state. Rates generally range from below the 25th percentile to above the 50th percentile of market rates, and in some areas of the state, exceed the 100th percentile. Reimbursement rates are reported for the Metropolitan Region (referred to as Group 1A), which includes Cook, DeKalb, DuPage, Kane, Kendall, Lake, and McHenry Counties. Also note that a provider that has a contract with the state is not permitted to ask families to pay the difference between the state reimbursement rate and the rate charged to private-paying parents.
Iowa: The state calculates reimbursements based upon units of care. A unit is a 5-hour block of time. The rates shown in the table are calculated assuming that if a family is using 9 hours of care, 5 days per week, 4.33 weeks per month, this would translate into 2 units of care per day for 22 days per month, or 44 units per month.
Kentucky: The state has four star levels. The amount of the bonus at each star level—for four-year-olds, $7 to $11 per month for two-star providers, $11 to $15 per month for three-star providers, and $14 to $18 per month for four-star providers—depends on the percentage of children served by the provider who are receiving child care assistance. For all levels, a licensed or certified provider may receive, to the extent funds are available, $2 per day beyond the maximum rate if the provider is accredited. The highest rate shown in Table 4d assumes that the provider receives the maximum allowable bonus at the four-star level and is accredited.
Louisiana: Reimbursement rates are below the 50th percentile of market rates for most age groups and types of care; reimbursement rates for center care for infants, toddlers, and preschoolers are at the 15th percentile. Rates were last updated as of January 2007, except for the addition of rates for military providers on October 30, 2009. Also note that bonuses for higher-quality care are paid quarterly.
Maine: The tiered rates shown in the table reflect a temporary increase in differential rates that went into effect as of July 2010—from 2 percent to 5 percent above the base rate for Step 2, from 5 percent to 10 percent above the base rate for Step 3, and from 10 percent to 25 percent above the base rate for Step 4. The tiered rates reverted to their previous, lower levels as of July 30, 2011.
Maryland: The market rate survey was conducted at various points in time during the two years prior to January 2011. Also note that Region W includes Anne Arundel, Calvert, Carroll, Charles, and Prince George’s Counties.
Massachusetts: Reimbursement rates are between the 3rd and 31st percentile of market rates for center-based care and between the 3rd and 43rd percentile for family child care.
Minnesota: Reimbursement rates for licensed centers are at approximately the 33rd percentile of market rates statewide (30th percentile in rural counties and 34th percentile in urban counties). Reimbursement rates for licensed family child care are at approximately the 38th percentile of market rates statewide (41st percentile in rural counties and 34th percentile in urban counties).
NatiONal WOmeN’s laW ceNter
state child care assistaNce POlicies 2011 31
Mississippi: Reimbursement rates for licensed centers are at the 51st percentile of market rates for infants, 49th percentile for toddlers, 56th percentile for preschoolers, 62nd percentile for school-age care during the summer, and 75th percentile for special needs care. Reimbursement rates for family child care are at the 36th percentile for infants, 65th percentile for toddlers, 64th percentile for preschoolers, 75th percentile for school-age care during the summer, and 42nd percentile for special needs care.
Missouri: The state does not allow parents involved in the protective services system to be asked to pay the difference between the state reimbursement rate and the rate providers charge private-paying parents.
Montana: Data on policies as of 2001 are not available, so policies as of March 2000 are used instead.
Nevada: The state has established four levels in its tiered reimbursement system, but only two are currently in effect. The first level is for all licensed centers and family child care homes. The fourth level is for all accredited centers and family child care homes, which receive a reimbursement rate that is 15 percent above the rate for licensed care. The second and third levels, which will pay 5 percent and 10 percent, respectively, above the rate for licensed care, have not been implemented yet.
New Jersey: The percentile of the market rate at which reimbursement rates are set depends on the age of the child and category of care. Also note that centers that have direct contracts with the state are not permitted to ask families receiving child care assistance to pay the difference between the state reimbursement rate and the rate charged to private-paying parents. Data on policies as of 2001 are not available, so policies as of March 2000 are used instead.
New Mexico: Reimbursement rates range from 25 percent below the 75th percentile of market rates (for five-star school-age centers in metropolitan counties) to 11 percent above the 75th percentile (for five-star school-age group child care homes in rural counties). In August 2007, base reimbursement rates were increased for all licensed centers and group child care homes, and differential rates for four-star and five-star providers were increased as well. Reimbursement rates were decreased slightly in November 2010. Also note that the state’s market rate survey differentiates between quality levels and the 75th percentile of market rates is obtained for providers at each quality level; in Table 4c, the reimbursement rate for the most common rate level is compared to the 75th percentile for that same quality level, and in Table 4d, the reimbursement rate for the highest quality level is compared to the 75th percentile for that quality level.
New York: Local social services districts may set reimbursement rates for accredited programs that are up to 15 percent higher than base reimbursement rates.
North Carolina: The state’s market rate survey differentiates between quality levels and the 75th percentile of market rates is obtained for providers at each quality level. Reimbursement rates were increased on October 1, 2007, for three-, four-, and five-star licensed facilities if the market rate survey data supported a change, but were not brought up to the 75th percentile of 2007 market rates. Rates for one- and two-star licensed facilities are based on 2003 market rate survey data. In Table 4c, the reimbursement rate for the most common rate level is compared to the 75th percentile for that same quality level. In Table 4d, the reimbursement rate for the highest quality level is compared to the 75th percentile for that quality level.
Ohio: The state reduced its reimbursement rates to the 26th percentile of 2008 market rates as of July 31, 2011.
Oklahoma: Most reimbursement rates are between the 23rd and 72nd percentile of market rates, depending on the type of care, age of child, geographic region, and quality rating of the provider. Enhanced Area Rates apply to 19 out of 77 counties in the state (Caddo, Canadian, Cherokee, Cleveland, Comanche, Creek, Garfield, Kay, Logan, McCurtain, Oklahoma, Ottawa, Payne, Pittsburg, Pottawatomie, Tulsa, Wagoner, Washington, and Woods).
Oregon: Region A includes the Ashland, Bend, Corvallis, Eugene, Monmouth, and Portland areas.
Pennsylvania: Reimbursement rates for center care for infants, toddlers, and preschoolers are set at least at the 62nd percentile of market rates for full-time care and the 58th percentile for part-time care. Rates for center care in counties with a concentration of young children in poverty are set at least at the 72nd percentile for full-time care and the 60th percentile for part-time care. Rates for group or family child care for infants, toddlers, and preschoolers are set at least at the 55th percentile for full-time care and the 50th percentile for part-time care. Rates for center, group, or family child care for school-age children are set at least at the 40th percentile.
Tennessee: Reimbursement rates are at the 60th percentile of market rates for infants, 50th percentile for toddlers, and 45th percentile and above for all others. The rates shown in the table apply to the 21 counties that met the criteria for being paid the higher reimbursement rate (counties that were among the top 15 in average population in 2004 and/or among the top 15 in per capita income in 2002-2004). There is a separate set of reimbursement rates that apply to the remaining counties.
Texas: Local workforce development boards determine and update reimbursement rates at their own discretion. Average rates across board areas range from the 23rd to 88th percentile of market rates. Twenty-two of the 28 boards have updated reimbursement rates in at least one category of care within the last two years; the Gulf Coast Workforce Development Area updated its reimbursement rates in 2010. Also note that providers are allowed to ask parents to pay the difference between the state reimbursement rate and the private-pay rate, unless specifically prohibited by the local board or when the parent is exempt from having to pay a copayment or the parent’s copayment is calculated to be zero.
Vermont: Reimbursement rates are below the 75th percentile of market rates for one- to three-star providers, at the 75th percentile for four-star providers, and above the 75th percentile for five-star providers.
Virginia: Reimbursement rates, depending on age group, are between the 20th and 35th percentile of market rates for licensed centers and between the 20th and 30th percentile for regulated family child care providers. Also note that infant rates were last increased in 2009 based on the 2008 market rate survey, and all other reimbursement rates were last increased in 2004.
Washington: Reimbursement rates for center care range from the 10th percentile of market rates for preschoolers in Region 4 to the 73rd percentile for school-age care in Region 4. Rates for family child care range from the 24th percentile for toddlers in Region 5 to the 84th percentile for school-age care in Region 1. Also note that rates were last updated in 2008, with the exception of the addition of an enhanced toddler rate for licensed family child care as of July 1, 2009.
West Virginia: The percentile of the market rate for reimbursement rates varies by the type of care, age of child, and quality tier. Also note that policies as of 2001 are not available, so policies as of March 2000 are used instead.
Wisconsin: Zone D is the most urban of the state’s four zones and includes Madison and Milwaukee. The state groups its rates into four zones based on level of urbanization using Census data.

NatiONal WOmeN’s laW ceNter
32 state child care assistaNce POlicies 2011
TABLE 5: ELIGIBILITY FOR CHILD CARE ASSISTANCE WHILE PARENTS SEARCH FOR A JOB IN 2011 Parents receiving child care assistance
when they lose a job Parents applying for child care assistance
while searching for a job
State Can they continue receiving assistance? For how much time? Can they qualify for assistance? For how much time?
Alabama No N/A No N/A
Alaska* Yes 80 hours Yes 80 hours
Arizona* Yes 60 days No N/A
Arkansas* Yes 45 days Yes 45 days
California* Yes 60 days Yes 60 days
Colorado* Yes 180 days Yes 180 days
Connecticut* Yes Until end of following month No N/A
Delaware Yes 3 months No N/A
District of Columbia* Yes 3 months No N/A
Florida* Yes 30 days No N/A
Georgia* Yes 8 weeks No N/A
Hawaii* Yes 30 days Yes 30 days
Idaho* Yes Until end of month No N/A
Illinois* Yes 90 days No N/A
Indiana* Yes 13 weeks No N/A
Iowa* Yes 30 days Yes 30 days
Kansas* Yes Until end of month No N/A
Kentucky Yes 4 weeks No N/A
Louisiana No N/A No N/A
Maine* Yes 8 weeks No N/A
Maryland* Yes 30 days No N/A
Massachusetts* Yes 8 weeks Yes 8 weeks
Michigan No N/A No N/A
Minnesota* Yes 240 hours Yes 240 hours
Mississippi* Yes 60 days Yes 60 days
Missouri* Yes 4 weeks Yes 8 weeks
Montana* Yes 30 days No N/A
Nebraska* Yes 2 months Yes 2 months
Nevada* Yes 2 weeks Yes 2 weeks
New Hampshire* Yes 40 days Yes 40 days
New Jersey* Yes 90 days No N/A
New Mexico* Yes 30 days No N/A
New York* Yes 4 weeks Locally determined See notes
North Carolina* Yes 30 days No N/A
North Dakota* Yes 8 weeks Yes 8 weeks
Ohio* Yes 30 days No N/A
Oklahoma* Yes 30 days No N/A
Oregon* Yes Until end of month No N/A
Pennsylvania* Yes 60 days No N/A
Rhode Island* Yes 21 days No N/A
South Carolina Yes 30 days No N/A
South Dakota* Yes 30 days No N/A
Tennessee* Yes 30 days Yes 30 days
Texas* Yes 4 weeks No N/A
Utah* Yes 150 hours Yes 150 hours
Vermont* Yes 1 month Yes 1 month
Virginia No N/A No N/A
Washington* Yes 56 days No N/A
West Virginia Yes 30 days No N/A
Wisconsin Yes Until end of month No N/A
Wyoming* No N/A No N/A
* indicates notes found on pages 33 and 34.

NatiONal WOmeN’s laW ceNter
state child care assistaNce POlicies 2011 33
NOTES FOR TABLE 5: ELIGIBILITY FOR CHILD CARE ASSISTANCE WHILE PARENTS SEARCH FOR A JOB
The table reflects policies that apply to families not receiving TANF; policies may differ for families receiving TANF.
Alaska: Parents can receive child care assistance while searching for a job for up to 80 hours in a 12-month period.
Arizona: Each parent in a family receiving child care assistance can continue to receive it while searching for a job for up to two 30-day periods or one 60-day period in each 12-month period.
Arkansas: In addition to the 45 days parents may receive child care assistance while searching for a job, a one-time extension of 15 consecutive calendar days may be granted if needed to secure employment. A handwritten statement listing job contacts or documentation of the job search must be provided in order to receive the extension.
California: Parents can receive child care assistance while searching for a job for up to 60 working days during the contract period; child care assistance is provided for no more than 5 days per week and less than 30 hours per week.
Colorado: The amount of time parents could receive child care assistance while searching for a job was expanded from 30 days to 180 days (in a 12-month period) as of April 2009 using ARRA funds. The state reverted to the previous policy as of July 2011.
Connecticut: Parents receiving child care assistance can continue to receive it until the end of month following the month of a job loss if they are actively seeking another job and payment is needed to prevent the loss of a slot in a school-based or licensed child care program and the child continues to attend care.
District of Columbia: Parents receiving child care assistance can continue to receive it for up to 3 months from the effective date of employment termination if they lost a job due to a reduction in force by the employer and through no fault of the employee.
Florida: Local early learning coalitions, which administer the child care assistance program, may seek a waiver to the 30-day time limit and allow parents to continue to receive child care assistance while searching for a job for up to 60 or 90 days. Parents who qualified for unemployment compensation could receive child care assistance for up to 6 months until the expiration of ARRA funds.
Georgia: Parents receiving child care assistance who lose a job due to a company closing or layoffs may continue to receive child care assistance while searching for a job for up to 8 weeks. After the 8-week time period, a parent’s case may be suspended for up to 12 weeks. Under a separate ARRA-funded program that started in 2009 and ended in September 2010, parents could qualify or continue to receive child care assistance while searching for a job for up to 12 weeks.
Hawaii: Parents can receive child care assistance for up to 30 consecutive days within a 12-month period from the date that they lose a job.
Idaho: Parents searching for a new job can continue to receive child care assistance only during the month in which they lost their previous job.
Illinois: The state used ARRA funds to increase the amount of time parents could continue to receive child care assistance while searching for a job from 30 days to 90 days, as of November 1, 2009. The state planned to revert to its previous policy of limiting the time parents can continue to receive child care assistance while searching for a job to 30 consecutive days, with a maximum of three job searches allowed in a 12-month period, as of October 2011.
Indiana: Parents receiving child care assistance can continue to receive it while searching for a job for up to 13 weeks per year.
Iowa: Parents can receive child care assistance while searching for a job for up to 30 consecutive days, once within a 12-month period.
Kansas: Parents receiving child care assistance must report the loss of a job within 10 days, and the caseworker must provide 10 days notice that the case will be closed. Cases always close the last day of the month.
Maine: Parents receiving child care assistance can continue to receive it while searching for a job for up to 8 weeks within a 6-month period.
Maryland: Parents receiving child care assistance can continue to receive it while searching for a job for up to 30 consecutive days.
Massachusetts: Parents receiving child care assistance can continue to receive it while searching for a job for an additional 4 weeks (on top of the initial 8 weeks allowed) within a 52-week period if they were laid off or there are other extraordinary circumstances.
Minnesota: Parents can receive child care assistance while searching for a job for up to 240 hours per calendar year.
Mississippi: Parents can receive child care assistance while searching for a job for up to 60 days from the last date of employment.
Missouri: As of May 1, 2010, parents applying for child care assistance could receive assistance while searching for a job for up to 8 weeks. This policy was expected to be in effect while ARRA funding was available or until September 30, 2011, whichever occurred first.
Montana: Parents receiving child care assistance can continue to receive it for up to 30 calendar days following the loss of a job. Parents must report a change in employment status within 10 days.
Nebraska: Parents can receive child care assistance while searching for a job for up to 2 calendar months, with a possible extension.
Nevada: Parents can receive child care assistance while searching for a job for up to 2 weeks in a 12-month calendar year.
New Hampshire: Parents can receive child care assistance while searching for a job for part time (16 to 30 hours per week) for up to 40 days in a 6-month period.
New Jersey: Parents receiving child care assistance can continue to receive it after losing a job for up to 90 days from the date of a layoff notice. Parents cannot receive child care assistance while searching for a job if they voluntarily quit employment.
New Mexico: Parents receiving child care assistance can continue to receive it while searching for a job for up to 30 calendar days immediately following the loss of employment, or graduation from high school or undergraduate school.
New York: Local social services districts may allow parents receiving assistance to continue to receive it while searching for a job for up to 2 weeks, or 4 weeks if child care arrangements would be lost if child care assistance was not continued. Local districts may also choose to allow parents to qualify or continue to receive child care assistance while searching for a job for up to 6 months if the district has funds available. Child care assistance is only provided for the portion of the day a parent documents as directly related to seeking employment. Local districts may impose additional limitations on child care assistance for parents to search for a job.

NatiONal WOmeN’s laW ceNter
34 state child care assistaNce POlicies 2011
North Carolina: From July 1, 2009 until June 30, 2010, parents could qualify or continue to receive child care assistance while searching for a job for up to 6 months. As of July 1, 2010, this policy ended for all new applicants and the state reverted to its previous policy. Under this policy, currently in effect, parents receiving child care assistance can continue to receive it while searching for a job for up to 30 days, and can request a 30-day extension; parents cannot qualify for child care assistance while searching for a job.
North Dakota: Parents can receive child care assistance while searching for a job for up to 8 weeks in a calendar year for 20 hours a week.
Ohio: Parents receiving child care assistance can continue to receive it while searching for a job for up to 30 days if they are scheduled to return to work, school, or training within that timeframe.
Oklahoma: Parents can continue to receive child care assistance for up to 30 calendar days while searching for a job if they had been receiving child care assistance for at least 30 days prior to losing a job or completing an education program. Parents may be approved to receive child care assistance while searching for a job no more than twice per calendar year, and must have been employed or going to school for at least 90 calendar days between approval periods.
Oregon: Parents receiving child care assistance can continue to receive it while searching for a job until the end of the month in which the case closes after being given a 10-day notice of closure. Depending on when a parent reports losing a job, this could be the end of the same month in which the job was lost or the following month.
Pennsylvania: Parents who voluntarily leave a job can continue to receive child care assistance during a 13-day notification period. Parents who involuntarily lose a job can continue to receive child care assistance for up to 60 days, in addition to the 13-day notification period.
Rhode Island: Parents receiving child care assistance can continue to receive it for up to 21 consecutive days from the beginning of a period of temporary unemployment resulting from a job loss or transition between jobs.
South Dakota: Parents receiving child care assistance can continue to receive it while searching for a job for up to 30 days from the last date of employment. From June 2009 until September 30, 2010, the state used ARRA funds to allow parents to qualify or continue to receive child care assistance while searching for a job for up to 2 months.
Tennessee: Parents receiving child care assistance can continue to receive it while searching for a job for up to 30 consecutive calendar days beginning with the day following the last day of employment. Parents applying for child care assistance while searching for a job can receive assistance for up to 30 calendar days from the date of application.
Texas: Parents receiving child care assistance can continue to receive it while searching for a job for up to 4 weeks in a federal fiscal year.
Utah: Parents can receive child care assistance for up to 150 hours while searching for a job under the Kids-In-Care Program.
Vermont: Parents can request two additional one-month extensions in a 12-month period to receive child care assistance while searching for a job. These extensions may be granted when certain conditions are met, such as a diligent and good faith effort to obtain paid work.
Washington: Parents receiving child care assistance can continue to receive it while searching for a job for a period of up to 28 days twice per year or a period of up to 56 days once per year.
Wyoming: From June 2009 through June 2010, the state used ARRA funds to allow parents to qualify or continue to receive child care assistance while searching for a job for up to 60 days.

The National Women’s Law Center is a nonprofit organization that has been working since 1972 to advance and protect women’s legal rights. The Center focuses on major policy areas of importance to women and their families, including employment, education, health and reproductive rights, and family economic security. The Center is grateful for the continued assistance of the state child care administrators who provided the information included in this report. The authors also thank Nancy Duff Campbell, Co-President, and Joan Entmacher, Vice President for Family Economic Security, for their comments.
This report would not have been possible without the generous support for the Center’s child care and early education work provided by the Birth to Five Policy Alliance, Annie E. Casey Foundation, Ford Foundation, George Gund Foundation, John D. and Catherine T. MacArthur Foundation, A.L. Mailman Foundation, McKnight Foundation, Moriah Fund, Ms. Foundation for Women, New Directions Foundation, William Penn Foundation, Scherman Foundation, Service Employees International Union, Stoneman Family Foundation, and an anonymous donor.
The findings and conclusions of this report are those of the authors alone, and do not necessarily reflect the opinions of these funders.
©2011 National Women’s Law Center

11 Dupont Circle, NW Suite 800Washington, DC 20036
202.588.5180 ▪ 202.588.5185www.nwlc.org