State and Regional Demonstration in Health Information ...
111
Final Contract Report State and Regional Demonstration in Health Information Technology: Tennessee HEALTH IT
Transcript of State and Regional Demonstration in Health Information ...

Final Contract Report
State and Regional Demonstration in Health Information Technology: Tennessee
HEALTH IT
Final Contract Report State and Regional Demonstration in Health Information Technology: Tennessee
Prepared for: Agency for Healthcare Research and Quality Department of Health and Human Services 5600 Fishers Lane Rockville, MD 20857 www.ahrq.gov Contract No. 290-2004-0006 Prepared by: The Vanderbilt Regional Informatics Team Mark Frisse Janet King Will Rice Lianhong Tang Vicki Estrin Ashlea Lifsey AHRQ Publication No. 15(16)-0075-EF March 2016
Kim Unertl Kevin Johnson Kevin Yang Tim Coffman Jameson Porter Monroe Wesley Michael Assink

The content of this document may be used and reprinted without permission except for the following: Federal Government logos, items noted with specific restrictions, and those copyrighted materials that are clearly noted in the document. Further reproduction of those copyrighted materials is prohibited without the specific permission of copyright holders. Suggested Citation: Frisse M, King J, Rice W, et al. State and Regional Demonstration in Health Information Technology: Tennessee. Tennessee Final Report. (Prepared by the Vanderbilt Regional Informatics Team under Contract No. 290-2004-0006). AHRQ Publication No. 15(16)-0075-EF. Rockville, MD: Agency for Healthcare Research and Quality. March 2016.
None of the investigators has any affiliations or financial involvement that conflicts with the material presented in this report.
This project was funded by the Agency for Healthcare Research and Quality (AHRQ), U.S. Department of Health and Human Services. The opinions expressed in this report are those of the authors and do not reflect the official position of AHRQ or the Department of Health and Human Services.
ii
Preface
This project was one of six State and Regional Demonstrations in Health Information Technology (IT) contracts funded by the AHRQ Health IT Portfolio. The goals of the projects were to identify and support data sharing and interoperability activities aimed at improving health care for patients and populations on a discrete State or regional level. These States and their respective health information organizations (HIOs) are listed below.
• Colorado: Colorado Regional Health Information Organization (CORHIO) • Delaware: Delaware Health Information Network (DHIN) • Indiana: Indiana Network for Patient Care (INPC) • Rhode Island: currentcare • Tennessee: Mid-South e-Health Alliance (MSeHA) • Utah: Utah Health Information Network (UHIN)
For more information about these projects, including a cross-project summary of lessons
learned, please visit http://healthit.ahrq.gov/stateandregionalhie.
iii

Acknowledgments Any attempt to acknowledge the contributions of every key contributor to this effort will be
incomplete. Over the course of a 6-year period, this effort literally helped transform a community—and many in the community were central to this transformation. At the Federal level, the Investigators wish to thank those from AHRQ most involved with the effort—Jon White, Erin Grace, Angela Nunley—as well as Scott Young and Susan Christensen; these individuals worked at AHRQ and supported the project during critical stages. Farzad Mostashari, Claudia Williams, Doug Fridsma, Chuck Friedman, Melinda Beeuwkes Buntin, and others from ONC also provided valuable perspectives over the years. Janet Marchibroda, Jennifer Covich Bordenick, and others from the eHealth Initiative fostered a community in which our efforts advanced. Carol Diamond and her associates at the Markle Foundation provided us both the opportunity of developing and using important parts of the Markle Connecting for Health Framework. Jerry Hinkley and Alan Brisken were authors of key portions of the Markle documents agreements. Our National Technical Advisory Panel provided advice to our team, the community, and the State throughout the project.
Leadership from the State of Tennessee was essential. Will Pinkston, working at the time as an aide to Governor Bredesen, was perhaps the most important direct contact during the formative early months. As we have stated throughout our report, our effort could not have succeeded without the commitment and sustained efforts of both Governor Phil Bredesen and Commissioner David Goetz. Antoine Agassi, Melissa Hargiss, Brent Anthony, and many other leaders and staff in the State played an equally important supportive role.
Only a few universities would have been up to the task of envisioning, planning, and executing on this ambitious agenda. Vanderbilt clearly was. The technical aspects and the broader vision are very much the result of Dr. William W. Stead’s vision and leadership. Dr. Ed Hammond contributed greatly to this vision and to the early days of the Technical Advisory Panel. Diane Seloff played a vital early role in planning this effort. Carol Aronson, Marinea White, and many others supported the legal and administrative activities through the life of the project. Julia Faber was responsible for much of the legal support. The Vanderbilt Informatics Center team also made significant contributions. These leaders include Dr. Dario Giuse, Randy Bates, and Dr. Ed Shultz. Vanderbilt’s highest leadership—in particular Dr. Harry Jacobson—shared in this vision, spoke often on its behalf, and ensured a remarkable degree of support. Dr. Jeff Balser—first as Dean and later as Vice Chancellor—has also been a constant advocate. Few universities would have exhibited a devotion to a cause and an assurance in their technologies sufficient to contribute to and support this effort for many years.
Most of all, the investigators wish to thank the many individuals in Memphis Tennessee who continue to sustain and grow this activity. These include the many clinicians who used the system and advised us on its improvement, the administrators who supported these clinical efforts, the many members of the Operations Committee who created and maintained the data sharing, and our Board. Rodney Holmes deserves our special thanks.
Finally, we acknowledge the almost 2 million individuals who sought care in the course of this project and who trusted their providers and systems of support to a degree sufficient for us to explore ways of improving their care. Since each of us and everyone we know and love are at one time or another potential beneficiaries of our care system, as future beneficiaries of the systems we build, we thank those who believed in us enough to get us to this point.
iv

Contents
Chapter 1: Executive Summary .......................................................................................................1 Findings ........................................................................................................................................2
The State of the Exchange ........................................................................................................2 Planning ....................................................................................................................................2 Governance ...............................................................................................................................3 Finance......................................................................................................................................4 Legal Policy ..............................................................................................................................4 Technical Infrastructure ............................................................................................................4 Evaluation and Impact ..............................................................................................................5 Summary ...................................................................................................................................6 Recommendations for Policy Development and Future AHRQ Research ...............................7
Chapter 2: Planning........................................................................................................................10 The AHRQ Request for Proposals .............................................................................................10 The 6-Month Accelerated Planning Process ..............................................................................11
Background .............................................................................................................................11 Planning Work Products .........................................................................................................12 Planning Assumptions ............................................................................................................14 Planning Summary Findings ..................................................................................................17 Initial Planning Recommendations .........................................................................................18
The AHRQ-Funded Exchange ...................................................................................................19 A Snapshot of Current Operations .............................................................................................19
The Data .................................................................................................................................19 The Clinical and Administrative Users ..................................................................................19 The Participating Institutions..................................................................................................20 The Role of the Kotter Framework .........................................................................................20
Stages of Exchange Formation ...................................................................................................24
Chapter 3: Governance ..................................................................................................................27 Principles ....................................................................................................................................27 The Technical Advisory Panel ...................................................................................................28 The MidSouth eHealth Alliance .................................................................................................30
Board Responsibilities in the Era of HITECH .......................................................................30
Chapter 4: Business and Technical Operations .............................................................................32 Staffing .......................................................................................................................................32 Distribution of Work ..................................................................................................................33
Required Expertise .................................................................................................................34 Skill Mix .................................................................................................................................35
Programmatic Linkages..............................................................................................................36 Design Shops ..............................................................................................................................37
Design Shops Directly Related to the AHRQ Contract ..........................................................37 Design Shops Related to or Derived from the AHRQ Project ...............................................39
Chapter 5: Finance .........................................................................................................................40
Overview ....................................................................................................................................40 Original Budgets ........................................................................................................................41 Actual Budgets ...........................................................................................................................41 Summary Lessons ......................................................................................................................42
Chapter 6: Legal/Policy .................................................................................................................44 Background ................................................................................................................................44 Formation of the Exchange as a Legal Organization .................................................................44 Creation of Data Sharing agreements.........................................................................................44
Policy Documents ...................................................................................................................46 Legal and Policy: Timeline and Dates ....................................................................................46
Conclusions ................................................................................................................................47
Chapter 7: Technical Infrastructure ...............................................................................................48 Four Approaches to Exchange ...................................................................................................48 Vanderbilt’s Implementation in Memphis .................................................................................50 Standards ....................................................................................................................................52 The Baptist Web Portal “Single Sign On” .................................................................................54 Transition of the Infrastructure to a Commercial Vendor ..........................................................55 A Medication History Service ....................................................................................................56
Chapter 8: Evaluation and Impact..................................................................................................59 Developing the Evaluation Plan .................................................................................................59 The Initial Evaluation Plan .........................................................................................................59 System Use .................................................................................................................................61
Findings ..................................................................................................................................61 Usability .....................................................................................................................................63
Findings ..................................................................................................................................65 Workflow Analyses ....................................................................................................................65
Findings ..................................................................................................................................66 Disease-Specific Conditions ......................................................................................................68
Headache: General Impact .....................................................................................................69 Headache: Adherence with guidelines ...................................................................................69 Back Pain: Imaging ................................................................................................................69 Back Pain: Duplicate Imaging ................................................................................................69 Chest Pain: Imaging................................................................................................................70
The Medication History Service ................................................................................................70 Implications ............................................................................................................................72
Financial Impact .........................................................................................................................72 Study Design...........................................................................................................................73 Results ....................................................................................................................................74
Chapter 9: Sustainability ................................................................................................................78 The Medical Solution Shop ........................................................................................................79 Organizational Value-Added Process Businesses ......................................................................79 Facilitated User Networks ..........................................................................................................79 HIE and the Three Value Chains................................................................................................80 A Framework for HIE Value Creation .......................................................................................81
People: The Real Key to HIE Sustainability ..........................................................................82
i

Chapter 10: Concluding Comments ...............................................................................................84 Meeting AHRQ’s Requirements ................................................................................................84
Milestones ...............................................................................................................................84 Technologies ...........................................................................................................................84 Leveraging Existing Efforts ....................................................................................................84 Evaluation ...............................................................................................................................84 Governance .............................................................................................................................84 Legal .......................................................................................................................................84 Sustainability ..........................................................................................................................84 Widespread Adoption .............................................................................................................85
Application to Federal and State Policies ..................................................................................85 ONC Programs Prior to HITECH ...........................................................................................85 Meaningful Use ......................................................................................................................86 State Health Information Exchange ........................................................................................87 Beacon Communities ..............................................................................................................88 Privacy and Security ...............................................................................................................89 Usability..................................................................................................................................92 Other Observations and Recommendations ...........................................................................92
References ......................................................................................................................................95
Tables Table 1. Initial core entities and data elements ..............................................................................13 Table 2. Planning matrix ................................................................................................................16 Table 3. A Comparison of proposed and actual personnel ............................................................36 Table 4. Original budgets for the contract .....................................................................................41 Table 5. Actual expenditures during the contract period ...............................................................42 Table 6. Metrics .............................................................................................................................60 Table 7. Summary of system usage—all sites ...............................................................................62 Table 8. User feedback ..................................................................................................................63 Table 9. Comparison of Hospital A with Hospital B group, no. (%) participants .........................75 Table 10. Hospital Group A, case-control analysis, no. (%) participants ......................................75 Table 11. Hospital Group B, case-control analysis, no. (%) participants ......................................76 Table 12. Estimated savings realized in the study population .......................................................76 Figures Figure 1. Early illustration of our incremental approach ...............................................................15 Figure 2. Planning summary slide .................................................................................................17 Figure 3. Original organizational infrastructure in context ...........................................................27 Figure 4. Proposed organizational structure ..................................................................................32 Figure 5. Final project organizational structure .............................................................................33 Figure 6. Architecture ....................................................................................................................51 Figure 7. Example of the interface used in clinical settings ..........................................................52 Figure 8. Example LOINC Mapping Table for White Blood Cell Count .....................................53 Figure 9. Data flows .......................................................................................................................57
ii

Figure 10. Display of the prescription drug history .......................................................................58 Figure 11. Usage ............................................................................................................................62 Figure 12. Usage over time ............................................................................................................70 Figure 13. MSeHA query hit rate ..................................................................................................71 Figure 14. Sources of prescription drug histories delivered through the Memphis Exchange (February 2010) ............................................................................. Error! Bookmark not defined. Figure 15. Potential savings estimated from our original planning workError! Bookmark not defined. Figure 16. Study design ................................................................. Error! Bookmark not defined. Figure 17.Three value chains supported by health information technology ..................................80
Appendixes Appendix A. Timeline ...................................................................................................................97 Appendix B. Participating Organizations ....................................................................................100 Appendix C. Technical Advisory Panel Members ......................................................................101 Appendix D. MidSouth eHealth Alliance Board .........................................................................102
iii
Chapter 1: Executive Summary This document summarizes Vanderbilt University’s 6-year effort to establish, operate, and
evaluate one of the Nation’s earliest and largest health information exchanges (HIEs). It serves as the final impact report for the Agency for Healthcare Research and Quality (AHRQ) contract awarded to the State of Tennessee and its sole subcontractor Vanderbilt University. The report contains an executive summary that includes all tasks as well as background information that incorporates findings and literature reviews, methodologies, results, limitations, and implications for stakeholders (rural and urban). Recommendations for future research are provided as well as some discussion of the impact of our program’s findings on health care policymaking.
This report is divided into 10 chapters. To a significant extent, the report’s organization is modeled after the guidance for State HIEs funded through the Office of the National Coordinator for Health IT (ONC).
• Chapter 1 provides an overview and executive summary. It is our best attempt at how
scores of concerned individuals worked together to create a novel approach to health care delivery that has saved lives and saved money.
• Chapter 2 describes the extensive planning process that both preceded and overlapped the initiation of the AHRQ-funded effort. We attempt to provide some lessons learned using a widely known planning framework.
• Chapter 3 describes the governance model that built and maintained the trust necessary to create and maintain our approach to care. We describe differences between the governance we thought we needed in 2004 and the governance model that proved effective both as the project matured and as the Memphis effort was more tightly integrated into a statewide approach to HIE.
• Chapter 4 describes the business and technical operations central to ongoing operations. We outline the types of professionals we found necessary to create and support the work and we outline how these requirements changed over time.
• Chapter 5 presents a brief overview of the project finances. The project received financing from AHRQ, the State of Tennessee, and Vanderbilt University. We describe variances in our budgets due to the uncertainties in exchange formation.
• Chapter 6 describes the legal and policy issues surrounding our exchange effort. We emphasize the key role played both by the Markle Connecting for Health Common Framework and the vital and ongoing participation of a broad array of stakeholders in Memphis.
• Chapter 7 describes the technical infrastructure. Based on Vanderbilt-developed systems in use in our medical center for over 15 years, we describe how exchange can be accomplished to great scale at a cost of approximately $1 per patient per year.
• Chapter 8 describes at length our evaluation and impact studies. Evaluation was a major component of our effort from the earliest days of the product. We describe our planning approach and our study of usability, use, workflow, test ordering, hospital admissions decisions, impact on specific disorders, and our estimated financial impact.
• Chapter 9 addresses our current views on sustainability based on our economic analysis, our experience in Memphis, and findings from across the United States.
1
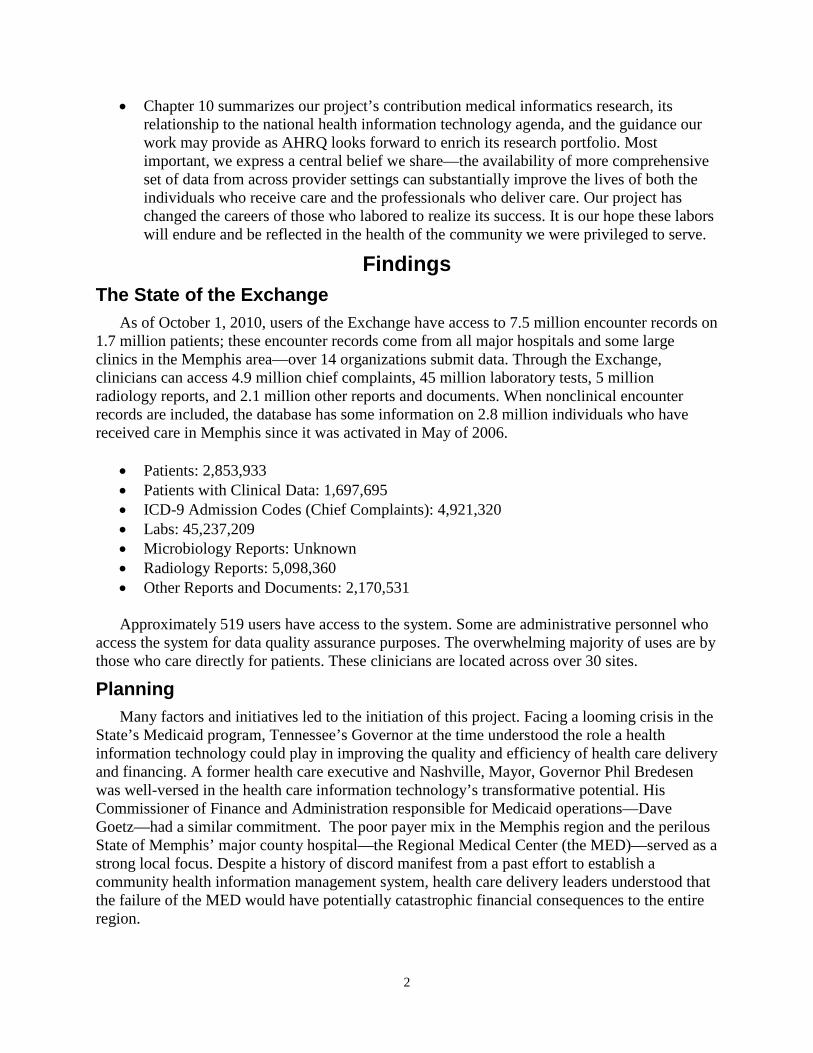
• Chapter 10 summarizes our project’s contribution medical informatics research, its relationship to the national health information technology agenda, and the guidance our work may provide as AHRQ looks forward to enrich its research portfolio. Most important, we express a central belief we share—the availability of more comprehensive set of data from across provider settings can substantially improve the lives of both the individuals who receive care and the professionals who deliver care. Our project has changed the careers of those who labored to realize its success. It is our hope these labors will endure and be reflected in the health of the community we were privileged to serve.
Findings The State of the Exchange
As of October 1, 2010, users of the Exchange have access to 7.5 million encounter records on 1.7 million patients; these encounter records come from all major hospitals and some large clinics in the Memphis area—over 14 organizations submit data. Through the Exchange, clinicians can access 4.9 million chief complaints, 45 million laboratory tests, 5 million radiology reports, and 2.1 million other reports and documents. When nonclinical encounter records are included, the database has some information on 2.8 million individuals who have received care in Memphis since it was activated in May of 2006.
• Patients: 2,853,933 • Patients with Clinical Data: 1,697,695 • ICD-9 Admission Codes (Chief Complaints): 4,921,320 • Labs: 45,237,209 • Microbiology Reports: Unknown • Radiology Reports: 5,098,360 • Other Reports and Documents: 2,170,531
Approximately 519 users have access to the system. Some are administrative personnel who
access the system for data quality assurance purposes. The overwhelming majority of uses are by those who care directly for patients. These clinicians are located across over 30 sites.
Planning Many factors and initiatives led to the initiation of this project. Facing a looming crisis in the
State’s Medicaid program, Tennessee’s Governor at the time understood the role a health information technology could play in improving the quality and efficiency of health care delivery and financing. A former health care executive and Nashville, Mayor, Governor Phil Bredesen was well-versed in the health care information technology’s transformative potential. His Commissioner of Finance and Administration responsible for Medicaid operations—Dave Goetz—had a similar commitment. The poor payer mix in the Memphis region and the perilous State of Memphis’ major county hospital—the Regional Medical Center (the MED)—served as a strong local focus. Despite a history of discord manifest from a past effort to establish a community health information management system, health care delivery leaders understood that the failure of the MED would have potentially catastrophic financial consequences to the entire region.
2

To respond to these events, the State commissioned a 6-month study led by Vanderbilt University. Coincident with this process the State requested Vanderbilt to respond on its behalf for a regional demonstration program funded through the AHRQ. The planning initiative began formally in July of 2004. The AHRQ contract was awarded to the State and to Vanderbilt as a sole subcontractor in October of 2004.
The planning exercise led to the definition of core entities and core data required by AHRQ. It outlined a governance model, a financial model, potential factors for evaluation, and savings estimates that could be used as a basis for sustainability. John Kotter’s work on large-scale projects served as one guide to the overall effort.1
The planning exercise led to the initial guiding coalition and its decision to focus on bringing to bear in emergency room care settings as much information as possible from in-patient and ambulatory clinical encounters. The Vanderbilt architecture was endorsed because Vanderbilt offered to host this architecture and because the architecture placed minimal burdens on Memphis participants; no changes to their data standards were required. The exercise suggested some of the legal and policy issues that had to be addressed both for the overall organizational framework and the data-sharing agreements vital to maintaining transparency, trust, and privacy.
The planning exercise also suggested areas of focus for studying the economic and clinical impact of the Exchange. It further endorsed and used an accelerated planning technique routinely employed at the Vanderbilt Center for Better Health. This technique is called a Design Shop; it combines consensus-building sessions with breakout group work focused on specific tasks. Finally, the planning exercise suggested ways to manage both governance and project management. A governing board was suggested; it was composed of a leader from every data contributor and many of the safety net clinic users (who would later contribute data). Although AHRQ and State funding flowed from the State through Vanderbilt, control of all activities was very much in the hands of the community whose commitment and effort were essential to realizing benefit.
Planning and pilot studies continued throughout the 6-year period. Numerous Design Shops were conducted both directly to support the project and to use the lessons learned to advance efforts in other regions and States. These contributions are described at greater length in Chapter 4.
Governance Governance efforts were guided by a few simple principles. First, local control and trust is
the most essential prerequisite for successful adoption and improved care. Second, such trust can be enhanced by a low-profile project management office from Vanderbilt that brought best national practices into the Memphis area and allowed these practices to be personalized and modified in ways that enhanced ownership but did not lead to actions that were fundamentally contradictory to national views. Third, State (and County) government roles were crucial to provide a broader layer of trust among the Memphis participants and the Vanderbilt project management team. This trust was in part imposed and in part simply supported through the State’s role as policymakers and funders of health care services in the region. Also, since Vanderbilt is itself a health care provider, the State’s strong guiding hand assured the Memphis provider communities that there were no “hidden agendas” among the Vanderbilt team supporting this project.
As required by AHRQ, a Technical Advisory Panel was created as an active and participatory group of national experts who could both ensure the project remained leading edge
3

and reassure both Memphis and State leadership that their investments were sound. The Panel’s oversight and reports very much influenced support from both the community and the State.
Finance Capital for the project was provided through AHRQ and State funding and pro bono services from Vanderbilt. Vanderbilt used AHRQ funding according to the contract budget and expended all allocated funds. Vanderbilt was able to return over $1 million to the State of Tennessee. This was largely the result of Vanderbilt’s contribution of computing infrastructure without charge to support the Memphis project for approximately 4 years.
Our operational experience suggests that an exchange based primarily on hospitals can be provided for approximately 1.5 million people at a cost of approximately one dollar per person per year. Marginal costs to expand the exchange will very much depend on the extent to which ambulatory care systems are standardized. Our experience in connecting with a number of large providers using a common ASP platform (NextGen) suggests that ASP-based approaches allow for expansion at little technical cost. The cost of contracting and data-sharing agreements, however, is significant.
Our experience provides some important lessons: to the extent that ambulatory systems are standardized and data-sharing policies are the result of wide-spread consensus among providers and the public, effective data-sharing will become a low-cost and commonplace occurrence. We believe exchanges such as ours will become a basic “infrastructure” upon which value can be created, much as a network confers value by the services it supports. To the extent that barriers are thrown in the way of such consensus, costs will increase and net benefit will decrease. State, Federal, and community leadership therefore are essential.
Legal Policy Our legal and policy efforts were extensive and the difficulty, time, and true value of these efforts were not understood completely at the outset. In contrast to the challenges faced by other exchanges in that early period, we found incorporation as a nonprofit relative straightforward; we do not believe we took any efforts to achieve this success but rather attribute it to the relative inexperience at the time among those who grant nonprofit status. The organization is called the MidSouth eHealth Alliance. At the conclusion of the grant, this organization is responsible for all aspects of Exchange operation.
Our primary contribution to the region and to the national dialogue was in our early application to Memphis of the Markle Foundation’s Connecting for Health policies.2 The documents provided a foundation for the creation of a legal framework that maintained trust among the organizations. Of equal importance, the process in which patient advocates and care providers participated over the initial 6-9 month initial effort proved to create a community of supporters whose primary interest was in patient care and not simply high-level organizational objectives. This group served as the basis for a standing committee of the Board that modified policies and provides other guidance to the Memphis Exchange on an ongoing basis.
Technical Infrastructure The technical infrastructure was based on the informatics architecture in use at Vanderbilt
Medical Center for over 15 years. In comparison to most other exchanges, it employed a novel system in which data can be submitted in almost any format. These data are parsed by a common set of software engineers supporting the Exchange. Parsing includes ensuring the data are
4

complete and syntactically correct. Each data element is “tagged” with a specific high-level descriptor (e.g., “x-ray report,” “white blood cell count”). Demographic data are stored in a record locator service (a relational database) and actual clinical data are stored in a variant of Vanderbilt’s StarChart database. Each organization has a specific partition in this database we called a “vault.” Within the constraints imposed by the data-sharing agreements, each participating organization controls its own vault until another institution accesses data. At that juncture, accessed data are retained in logs so that they can be referenced independent of future contributing organizational decisions. Hence, data nonrepudiation is present both at the vault level and at the institutional use level.
The core StarChart database was but a platform for use. Access through secure Web browsers was ensured through a simplified version of the Vanderbilt StarPanel interface. This interface was a passive Web browser with no two-way messaging other than simple query functions and display options. Web access required two-factor authentication. Print reports were also created and used extensively by one large institution.
Where standards were concerned, our system was capable of “standardizing” message on the “outbound” prior to display. We LOINC-encoded over 50 common laboratories to demonstrate the feasibility. Although some of the display features of LOINC were rarely used, the demonstration of this capability will be critical for two-way interoperability between the Exchange and other clinical systems.
We also demonstrated the capability of displaying prescription medication histories by sending registration messages to both SureScripts (via Regenstrief’s system) and to the NextGen ASP. We were capable of displaying these messages through our Web interface and during the limited trial of this system were able to draw some conclusions about the importance of this capability. Our initial position was—and remains—that most medication history can be obtained directly from SureScripts and a requesting electronic health record (EHR) or clinical system. We suspect that most medication histories will be complemented with patient-provided comments through patient portals or personal health record systems, and the Exchange may prove to be a valuable intermediary under these circumstances.
Evaluation and Impact Our evaluation showed consistent use for approximately 7 percent of emergency department
(ED) visits. Use by safety net clinics and hospitalists grew over time. The primary retrieved document was the dictated discharge summary (94 percent of usages included a request for these documents). Suggestion boxes and formal surveys were employed to assess usability and to make improvements. Extensive efforts were made to study the impact of the Exchange on workflow. Workflow documentation of each site showed two distinct patterns of use. At one institution, nurses or clinical assistants queried the Exchange, printed documents, and attached them to the clipboard holding the ED encounter form. Sixty-eight percent of usage over a 2-year period was due to this approach. In the second use pattern, clinicians accessed the data directly through a Web browser. In restricted areas, this access was simplified by the use of a “whiteboard” Web display that listed all admissions taking place within the last 24 hours. Each row in the display listed the patient’s name, identifiers, the number of encounters from the current institution, and the number of encounter records available from other care settings. Simply selecting a row displayed the entire Exchange record. In safety net clinics and among hospitalists, access was direct and focused on one patient.
5

Our medication history pilot showed both the potential and challenges of obtaining a prescription medication history through the Exchange. We found that connectivity was encumbered more by contractual than by technical means. We demonstrated the feasibility of passing messages through a second Exchange (the Indiana Health Information Exchange) to and from SureScripts. We noted the significant rise in results when retail pharmacy histories were included in the SureScripts service. We also demonstrated the feasibility of obtaining medication histories from a NextGen ASP serving many Memphis providers. Where e-Prescribing is concerned, we also planned and completed a small e-prescribing trial in Memphis in the early days of the new Centers for Medicare & Medicaid Services regulations. In these early days, we found the value of the service incomplete largely because many safety net pharmacies were not yet capable of receiving prescription orders in electronic form.
Our financial impact analysis was striking. Although ED usage was low and no incentives were provided either for Exchange use or clinical behaviors, a case-control study of approximately 15,000 patients in each arm demonstrated significant decreases in admissions from the emergency department and, in some settings, decrease utilization of head and body CTs. Savings due to the 3-4 percent reduction in admissions from the ED accounted for the vast majority of estimated societal savings. Although the ED admission savings were consistent with our own highly conservative models, a decrease in test ordering was far lower than published predictions.
Summary We accomplished the following in the 6-year course of the AHRQ contract:
• Conducted an extensive planning exercise. • Formed a guiding coalition and governance structure. • Established industry-level business and technical operations. • Developed and maintained rigorous finance management. • Developed and implemented a wide range of legal and policy agreements to maintain
trust, protect privacy, and govern Exchange operations. • Implemented a comprehensive HIE serving every major hospital, several safety net
clinics, and one major county-run clinic, including one hospital in the State of Mississippi.
• Transferred operations and control from Vanderbilt University to a local governing Board and a commercial exchange technology firm. Because of our work, this region has a mechanism to sustain the exchange through ongoing operational support.
• Proposed and implemented an extensive evaluation program that provided guidance for future efforts and demonstrated a significant financial impact.
• Disseminated lessons learned and findings to numerous State, regional, and national bodies.
• Held numerous workshops to explore issues, develop plans, and to disseminate lessons learned.
• Developed, implemented, and evaluated a pilot service to provide prescription medication histories through the Exchange.
• Conducted a brief e-prescribing pilot; this pilot ultimately become part of statewide e-prescribing efforts
6

In retrospect, we identified at least 12 overlapping stages in Exchange formation. The project was initiated as a result of State leadership. It was initially guided by planning and clarified through the AHRQ proposal; the guiding coalition of State and local leaders was a crucial early step; an awareness of common need arose as providers understood how stronger clinical oversight could help them control their own futures. An aggressive technical and policy effort led to early introduction and “quick wins” through anecdotes of a live saved and care improved. Local control and Exchange extension reinforced new wins. Finally, the dissemination of the model appears to be instrumental in charting a long-term course for the State of Tennessee.
Our experience suggests that both our process model and our technical model can make substantial contributions to our national exchange. Our process models documented the time and effort required to create and maintain an accountable level of trust. Our Vanderbilt-based architecture was shown to be a robust, scalable, and very inexpensive model for health information exchange. With widespread convergence on issues central to data standardization and privacy considerations, and data-sharing provisions, we believe future efforts will realize even greater benefit as costs to integrate across a wider array of ambulatory-based EHRs, laboratory devices, and other technologies decrease. This broader integration will foster more effective care coordination and allow for demonstration of care impact across entire populations and not just those who seek hospital or emergency department care.
Recommendations for Policy Development and Future AHRQ Research
As our project evolved, we noted the growing presence of exchange services that complemented exchange organizations. From the outset, we realized that some services (e.g., medication histories) could be provided directly to caregivers independent of any health information organization supporting exchange. Information could also be exchanged between data providers and patients. In the course of our work, we estimate that a small number of patients (we estimate fewer than 5 percent) are beginning to incorporate their health information in personal health records. Finally, providers sharing a common ASP model are beginning to exchange messages among one another independent of the exchange. Health plans as well are very much involved in exchange. In Tennessee, a separate exchange service (Shared Health), funded by Blue Cross Blue Shield of Tennessee, continues to play a role across the State. We believe current market forces, data-sharing impediments, and other factors will only accelerate the trend to “exchange” data within a region through a variety of means. The purely hierarchical model of provider through regional exchange through State exchange through national networks is too simplistic. Indeed, an analysis of messaging traffic among providers and other health care entities would suggest that such a model is applicable only to a very limited set of data and purposes.
What are the implications of these observations? First and foremost, the architect Louis Sullivan’s “form follows function” rule is quite applicable. People and organizations exchange data with one another for a range of purposes. Each organization supporting exchange for an individual purpose generally has other reasons to support its technical infrastructure and hence can expand exchange activities within restricted parameters at a marginal cost. It is possible, therefore, that the focus of regional exchanges will be largely restricted to unique regional issues among participants. Quality indicators, readmission rates, and care coordination programs are candidates. If this model is correct, then regional exchanges will closely resemble their Community Health Management Information Systems (CHMIS) precursors achieving the
7

aspirations of these earlier efforts at lower cost, a climate conducive to secure sharing, and an environment that provides economic incentives for sharing activities. States, too, will play a role in light of their responsibility to support public health activities, support care facilities, and manage their Medicaid programs.
From a policy perspective, community activism will focus attention on the necessity for a patient-centric approach to care. State governments can use their considerable regulatory power to demand exchange capabilities as part of their procurements and funding. They can also use fees from health care transactions to provide oversight and key infrastructure that would be hard to maintain solely on market principles. The Federal Government’s role is primarily to adopt standards and policies that encourage exchange both across the nation and within the Department of Defense, Veterans Affairs, and other Federal providers. Federal guidance on secondary data use policies will also be welcome. Many of the current privacy recommendations and policies are confusing and potentially inhibitory to secondary uses in the public interest that are widely accepted by the public. Where public acceptance is concerned, privacy approaches may be advanced if the “contextual integrity” of public expectation is assured through policies and technologies that ensure the use of data is consistent with social and public norms and traditions.
Work in health information exchange will also have a significant impact on the AHRQ agenda. For example, in September of 2010, AHRQ awarded $473 million in grants and contracts to support patient-centered outcomes research. Of this amount, at least $50 million has been awarded to create all-payer claims databases and similar resources. Clinical data available through exchange can both complement such databases and arguably shift the focus from databases designed primarily to adjudicate payment to a data-rich environment based on clinical labs, medications, problem lists, complications, and other expressions in coded or natural language programs. This shift in data types may be accompanied with a shift in control. At present, use of these databases has been dictated in conformity with law to health plans and government agencies. In the future, projects such as Memphis suggest the potential for a far greater degree of control over data. Acting on behalf of individuals who seek care in these institutions, community-based exchanges presage a more economically successful era of CHMIS. Additionally, consumer-driven databases like the popular PatientsLikeMe site will add another perspective onto our use of clinical data to advance research. As all of these initiatives progress, our research environment may emerge with a range of overlapping data resources, each designed for different purposes and each working in complement with others to drive local and national results.
Our effort also emphasizes the importance of a wide range of biomedical informatics research efforts funded through institutions, nonprofit foundations, for-profit companies, and government. The wide range of programs funded through ONC is but one example. The impact of our work on both the State Health Information Exchange (State HIE) Cooperative Agreement Program and the Beacon Community Program is self-evident; the technologies, policies, and evaluation also make significant contributions.
The importance of additional research in the four research areas mandated through the Strategic Health IT Advanced Research Projects (SHARP) Program is also emphasized by our findings. SHARP research in security of health information technology is motivated by the constraints imposed by our limited capabilities to ensure patient and public expectations are met consistently through our current health information technology infrastructure; despite extraordinary effort and focus, and a degree of operation far above general applications of the Health Insurance Portability and Accountability Act (HIPAA), the relative inflexibility of our
8

capability to promote accountable care and to advance secondary use demonstrates the enormity of the work ahead. Technology must work in concert with policy and not simply be focused on implementation of such policy. Similarly, the potential for secondary use of clinical data for appropriate purposes has not been realized; even after 6 years of operation, our project lacked the organizational commitment, the consent infrastructure, the high-level analysis tools, and the policy infrastructure to leverage the potential of exchange. Although our technology is inexpensive, easy to implement, and capable of great scale it must interact with a range of applications through standard interfaces along the lines exemplified by the SHARP health care applications and network platform research.
Finally, our work very much emphasizes the need for far more extensive means of supporting the knowledge management and cognitive effort required to enhance patient care. Current health IT initiatives will not be sufficient to manage the growing and overwhelming complexity of data and information. Indeed, rigid automation of the status quo may even delay our ability to achieve the vision of 21st century health care consistent with societal need. Future systems will require a far greater capacity to integrate weak signals from disparate resources and migrate clinical use of health care information technology from the manipulation of transactions to the management of knowledge. Our approach to HIE provides a unique and critical foundation for pursuing such research.
To a certain degree, one can argue that the past 6 years presage a greater divergence between “exchange” as a verb and “exchange” as a noun. The former, we believe, will be commonplace; it will be achieved technically through a range of means and services; it will be sustained by immediate value to care; and it will be governed by generic provisions to Federal and State privacy laws and policies. The latter, we believe, will accelerate more extensive secondary use of data locally and in advance of the slower national consensus. Our experience suggests that the Memphis exchange and similar architectures in Nashville and other communities are examples of the platforms upon which AHRQ and other groups can support vital health care quality and care delivery research.
9

Chapter 2: Planning
In this section, we briefly describe the environment, the objectives set forth by the Agency for Healthcare Research and Quality (AHRQ) contract, our planning findings, and the recommendations we made in pursuing exchange.
The origins of this project are to be found in the turbulent era of health care crises both in Memphis, Tennessee and across the State of Tennessee. Encountering a failing county hospital and a Medicaid program that was threatening to bankrupt the State of Tennessee, the newly elected governor—Phil Bredesen—embarked on a comprehensive approach to improve the health care of all Tennesseans. As a health care entrepreneur whose own health information technology experience began in the 1970s, Governor Bredesen addressed the role health care information technology could play in his “Saving TennCare” speech of February 2004. In his speech, the Governor suggested that Vanderbilt’s informatics expertise could impact both the county hospital and perhaps the entire community.
Governor Bredesen, Shelby County Mayor A.C. Wharton, Vanderbilt University, and the health care leaders in Memphis began extensive planning efforts directed towards improving health care through better use of health information technology. Focused initially on hospital delivery and pressing financial crises in the region’s large county hospital, the planning effort demonstrated that pressing health care issues were not restricted to one hospital or neighborhood but instead encompassed every neighborhood, every payer class, and every health care delivery organization. Emergency department (ED) care was identified as a focused means by which trust could be obtained among participants who were used to competing in every area—including the stewardships and use of clinical data. Our planning efforts projected significant financial savings and argued for the power an exchange of clinical data could have on clinicians and patients. Although directed primarily at the Memphis Region, statewide planning was also incorporated into the process and over the 6-year period of the award, numerous statewide meetings were included in the overall process.
At about the same time planning was underway, AHRQ solicited proposals for 5-year projects to demonstrate the impact health information exchange (HIE) could have on care quality, patient outcomes, health care expenditures, public health, and research. Vanderbilt University responded to this solicitation on behalf of the Commissioner of Finance and Administration, David Goetz and the TennCare agency under his jurisdiction. Vanderbilt was the sole and exclusive subcontractor to the State for this effort. AHRQ awarded a contract to the State that began October 1, 2004.
The AHRQ Request for Proposals AHRQ’s request made explicit demands of award recipients. Specifically, we were required
to do the following:
• Develop a plan for State-based, regional data sharing and interoperability services designed to scale up to statewide use
• Involve a variety of care settings, major purchasers, and significant payers in the region. Include urban and rural settings
• Identify the Core Healthcare Entities needed to get geographic coverage for the region’s patient population
10

• Identify Core Clinical Data Elements that need to be shared among Core Healthcare Entities to affect health care quality, patient safety and health care cost. Laboratory results and medications must be included
• Achieve scale by leveraging provider and payer based IT initiatives and existing regional collaborative efforts
• Reduce risk by building on proven experience • Establish programmatic linkages with State, Federal and hospital preparedness programs
within 8 weeks • Achieve data sharing among the Core Healthcare Entities for 25 percent of the Core
Clinical Data Elements in 12 months, 50 percent in 24 months, 100 percent in 36 months • Develop a detailed assessment of the potential impact on Medicaid within 12 months • Develop a draft evaluation plan by 18 months and finalize by 36 months • Learn and document what is required to achieve regional data sharing including
governance, technology, and costs • Assess impact of data sharing on quality, safety and cost to document the business case
for patients, hospitals, physicians, and payers • Develop a plan for sustainable funding of the regional data sharing and interoperability
services by 48 months and transfer to sustained funding by the conclusion of the project.
Next, we describe how our planning process aligned with these objectives. We describe how we complied with each objective in other sections of this report.
The 6-Month Accelerated Planning Process Background
As part of his February 2004 TennCare Medicaid reform speech to the Tennessee General Assembly, Governor Phil Bredesen called for increased long-term focus on medical informatics technology to improve patient care and to reduce costs to providers and the TennCare program. The Governor asked Vanderbilt University to take the lead by working with the Regional Medical Center at Memphis (the MED), a major TennCare provider, to help establish an evidence-based medicine initiative.
By late May 2004, the Governor decided that a broader medical informatics initiative involving multiple health care providers and stakeholders, and multiple communities, could also benefit the broader patient population in the greater Memphis area and throughout the State. He mobilized leaders throughout the State—and health care leaders in the three-county Memphis area, in particular (Fayette, Tipton, and Shelby Counties)—to embark on two key initiatives to improve health care in Tennessee. The first was an accelerated State-funded, 6-month heath care information and infrastructure planning effort. The second effort was the 5-year regional demonstration project submitted to AHRQ and led by the Governor and his Commissioner of Finance and Administration under subcontract to Vanderbilt University.
The State supported an accelerated 6-month assessment and planning process to begin August 1, 2004—after notification of award but prior to AHRQ funding. The planning process was intended to provide both a high-level statewide assessment and a more detailed analysis of TennCare and issues confronting the three-county region proposed for as the AHRQ Demonstration Region. This overlap was to ensure that the AHRQ demonstration contract was
11

developed in the context of other initiatives, both within the State of Tennessee and in bordering States.
The Accelerated Plan, as well as the proposed AHRQ work, was managed through a single Project Management Office located at The Vanderbilt Center for Better Health and a single Project Director. For the statewide planning process, Vanderbilt was to engage Accenture to augment the Project Management Office for a 6-month period of framework refinement, information gathering, and analysis. Although focusing on the three-county region in Southwest Tennessee, the planning approach was inclusive of all regions within the State and would involve multiple stakeholders, including providers, payers, public health agencies, pharmacies, commercial laboratories, and suppliers. Although TennCare was the driving force, the plan attempted to encompass needs of the full Tennessee population, rather than simply those enrolled in TennCare. The majority of our effort was focused on the Region—comprising approximately 17 percent of the population. Some aspects—notably assessment, infrastructure, role of government, and overall exchange objectives—also had a statewide focus. A key component of the plan was to gain broad physician adoption of information technology that may be improved because of HIE designed to provide to the practitioner at the time of decisionmaking all relevant information—whatever its source.
The primary objective of the statewide effort was to create a high-level framework for a self-sustaining and evolutionary development of a statewide health information infrastructure. This framework was to be the result of a process of analyzing and prioritizing information infrastructure initiatives based on desired clinical outcomes and integrated with regional capabilities. This process in turn depended on the use of an evaluation framework (including the current state of health, the opportunities to improve health, and the readiness of regions to address these opportunities), an intervention framework (the types of common technical and procedural changes that will realize better outcomes), and an examination of national best practices, regional initiatives, and regional readiness.
The planning process incorporated three main phases: 1. Assessment and Valuation. We developed a common framework for understanding
current and future initiatives, defining principles and governance, assessing current efforts in Tennessee and throughout the country, and quantifying the value of technology-enabled change and interventions for TennCare and the State of Tennessee.
2. Planning. We developed and refined our frameworks and tested their applicability to both the three-county demonstration area, and more generally, their applicability to the rest of the State.
3. Summaries and Recommendation. We created and presented to leadership groups a detailed intervention framework in the Memphis test area and demonstrating how this framework can advance other regional efforts while applying a common set of principles to ensure that the State’s investments are used to their best potential.
Planning Work Products The products of this statewide effort included the following:
• A formal intervention framework for analyzing and prioritizing health care outcomes and information interventions likely to affect these outcomes
• A listing of prioritized outcomes based on this framework • A balance between regional (Memphis) considerations and statewide considerations
12
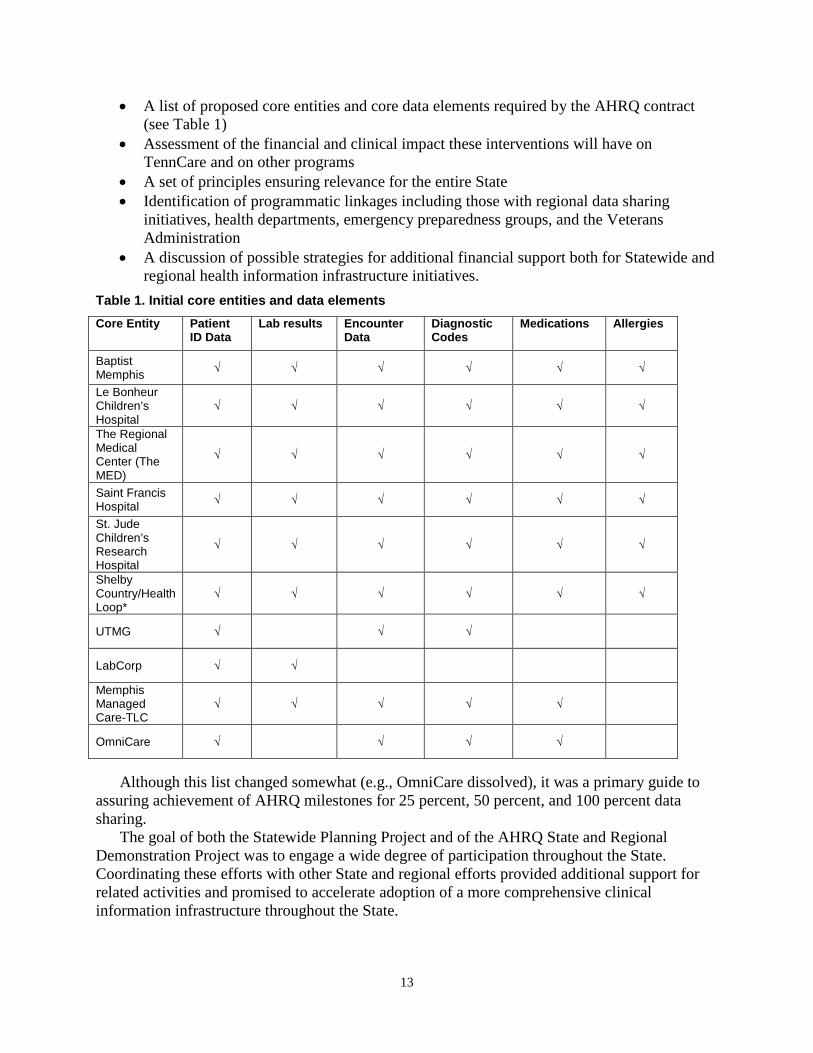
• A list of proposed core entities and core data elements required by the AHRQ contract (see Table 1)
• Assessment of the financial and clinical impact these interventions will have on TennCare and on other programs
• A set of principles ensuring relevance for the entire State • Identification of programmatic linkages including those with regional data sharing
initiatives, health departments, emergency preparedness groups, and the Veterans Administration
• A discussion of possible strategies for additional financial support both for Statewide and regional health information infrastructure initiatives.
Table 1. Initial core entities and data elements Core Entity Patient
ID Data Lab results Encounter
Data Diagnostic Codes
Medications Allergies
Baptist Memphis √ √ √ √ √ √
Le Bonheur Children’s Hospital
√ √ √ √ √ √
The Regional Medical Center (The MED)
√ √ √ √ √ √
Saint Francis Hospital √ √ √ √ √ √
St. Jude Children’s Research Hospital
√ √ √ √ √ √
Shelby Country/Health Loop*
√ √ √ √ √ √
UTMG √ √ √
LabCorp √ √
Memphis Managed Care-TLC
√ √ √ √ √
OmniCare √ √ √ √
Although this list changed somewhat (e.g., OmniCare dissolved), it was a primary guide to
assuring achievement of AHRQ milestones for 25 percent, 50 percent, and 100 percent data sharing.
The goal of both the Statewide Planning Project and of the AHRQ State and Regional Demonstration Project was to engage a wide degree of participation throughout the State. Coordinating these efforts with other State and regional efforts provided additional support for related activities and promised to accelerate adoption of a more comprehensive clinical information infrastructure throughout the State.
13
Planning Assumptions Entities would participate as data contributors and end-users for a 5-year period and
participate in planning efforts around sustaining the Clinical Data Exchange for the long-term. • Governance would be a neutral organization at a neutral site determined by agreement of
the board. • The proposed architecture would impose minimal data exchange requirements upon the
entities publishing data to a vault. • Participating entities would own and maintain the data stored in their individual data
vault. • Vanderbilt University would be responsible for aggregating data published by the
participating entities and implementing the aggregation algorithms, data display, and reports.
• Participating entities would take part in a testing effort to validate data aggregation and algorithms.
• Early deployment would be focused on select care settings where value is self-evident. • The Clinical Data Exchange would not replace existing clinical systems but rather would
complement these systems. In the long-term, exchanged data would be integrated directly into host systems.
• Application training materials (e.g., login and basic navigation) would be provided by the Vanderbilt project management team; this team would in conjunction with local participants who in turn would “own” the final process. This approach was considered best to ensure consistency across the deployed care settings.
• Entities would be responsible for incorporating process changes and delivering training to support adoption and utilization of the Clinical Data Exchange into the clinical workflow.
• Long-term operational support needs from participating entities were not clear; these needs would be proposed through the planning process and would be changed as circumstances warranted.
• Although the long-term goal will be to incorporate data into participating entities’ current systems, the initial goal would be on developing trust and consistent use of information so that individual entities would support the costs of data integration after they developed a clearer understanding of the value of exchanged data.
• The planning effort also anticipated the gradual evolution of breadth and depth to the project over the 5-year period. This trajectory would start with very specific tasks and expand.
14

Figure 1. Early illustration of our incremental approach
Our approach very much was focused on establishing trust early and growing incrementally
as new needs for clinical information became consensus and as new sources of data became available.
The effort also presented through a matrix an estimate of how key activities would evolve over time.
15

Table 2. Planning matrix Component Year 1 Year 2 Year 3 Years 4 & 5 Governance Establish governing
bodies as indicated in proposed structure.
Entities Implement data exchange among Core Entities.
Enhance core entities. Target extended health care entities.*
Enhance core entities. Target extended health care entities.*
Enhance core entities. Target extended health care entities.*
Data Elements Implement patient demographics Implement lab results. Implement encounter data.
Implement diagnostic codes. Target additional elements*
Implement allergies Implement medications. Target additional elements.*
Target additional elements*
Technology Architecture
Establish core entity vaults. Deploy record locator and record access service. Establish connectivity. Establish security.
Establish vaults as needed. Enhance architecture.
Establish vaults as needed. Enhance architecture.
Establish vaults as needed. Enhance architecture. Enhance based on RHIO business model.
Training, Deployment & Evaluation
Deploy to selected ED users. Develop training. Train super users. Develop evaluation plan.
Deploy to ED users and target L&D. Determine readiness for primary care. Enhance training as needed. Train super users.
Define further deployments. Enhance training as needed. Train super users. Execute evaluation.
Enhance training as needed. Train super users. Execute evaluation.
This initial matrix was used to guide early planning. It defined the major tasks associated with governance, technology, and use. It was modified over the course of the project.
This matrix was accurate with a few exceptions. First, we found it easier to take data elements whenever an institution was able to send them; we did not say “data elements x, y, and z this year” and “data elements a, b, and, c next year.” Instead, we found it easier to take some “advanced data types” (e.g., discharge summaries) immediately from some institutions and later from others as their capabilities to deliver them were enhanced. Second, training and deployment was not a formalized ongoing process. Although we identified champions and supported their efforts both on-site and remotely, with only one or two exceptions, we did not witness strong and consistent leadership at the local level to examine use. Throughout the years usage has been stable and within the last year, we have seen growing interest in use now that we have some insights into the magnitude of impact this effort can have on patient care delivery and health care costs. Finally, with the exception of a close partnership with a single NextGen ASP vendor supporting many facilities, we had little success in engaging ambulatory care providers. We hypothesize that the Health Information Technology for Economic and Clinical Health (HITECH) Act, enacted as part of the American Recovery and Reinvestment Act (ARRA) of 2009, paradoxically, “froze” participants who were considering engaging. Because they suddenly saw incentives and disincentives to exchange data but they did not know exactly how
16

these incentives would be provided and what role a State will have relative to a regional exchange, they were reluctant to make exchange through this effort a priority. With the clear governance and plans at the State level as well as the strong encouragement for certified EHRs using standard data types, we think the overall pace of integration will be far greater than it would have been without HITECH. Now that the air is clearing, exchange efforts are accelerating both at the State and at the private-sector level.
Planning Summary Findings The 6-month planning exercise set the foundation for the ensuing research. During the
intense process, our consulting team validated many of our hypotheses and framed our research themes. Among their conclusions are the following:
• There is a clear need for and financial benefit from health information exchange. • Overall 5-year savings from HIE were estimated to be $24.2 million. Of this, $5.6 million
was the result of decreased hospital admissions, $9.0 million was to be realized from decreases in duplicate radiology tests, $3.8 million was to be realized from duplicate laboratory tests, and $5.5 million was to be realized from lower ED expenditures. Annual decreases in hospital admissions were estimated to result in approximately $2 million in savings. The 5-year NPV was estimated to be $17 million with a 2.4-year payback period.
• The AHRQ project—combined with other activities in the State and nationally—would identify and surmount many obstacles to health information exchange.
• A scalable architecture for technology, policy, authentication, and use must be developed; this will evolve over time.
• Quick wins and low cost will be essential for early adoption. Figure 2. Planning summary slide
17

This slide was used to demonstrate the issues that had to be accessed to progress from a fragmented care system to a more coordinated system where care is improved through access to data across the continuum of care.
A number of critical community resources were also identified. These included the following: • Healthy Memphis Common Table. They were willing to assist in the identification of
patient populations to provide targeted interventions; provide the ability to track and measure the care, preventions, outcomes and interventions. Their efforts became central to ambulatory outreach and BEACON community application efforts in the final years of the project.
• Memphis BioWorks. This organization ultimately leveraged its current facilities and organizational support activities to become the home for the Executive Director and the MidSouth eHealth Alliance activities.
• Memphis Business Group on Health. This organization played a central role in early CHMIS efforts in the mid 1990s. Its executive director, Cristie Travis, was a vital link to both the local business community and through her national efforts, with the Leapfrog Group.
• QSource. Qsource’s Executive Director and staff became important partners in ambulatory connectivity, quality reporting, e-prescribing, and, later, as the regional extension center for the State.
Initial Planning Recommendations Through an extensive series of interviews, discussions, and presentations, the joint Vanderbilt / Accenture planning team reconciled the aims of the AHRQ SRD project with the needs of the community. Some of their recommendations follow:
• Governance Establish representative stakeholder steering committee or advisory board Establish decisionmaking process Establish roles and responsibility
• Privacy policies and processes Address regional policies for access and legal impact of use or nonuse by clinical
providers
• Benefits model Develop methods for measuring and evaluating benefits
• Financing and sustainability Determine financing and approaches for long-term sustainability
• Regulatory impact Understand regulatory requirements that must be incorporated into the approach Determine the areas where change in process or behavior may be required based on
outcome to be achieved
18
• Technical and operations architecture Develop a clear vision for the technical environment (hardware, software, network) Establish technical capabilities required to support the solution (data transformation
and storage, printing, reporting) Formalize operational procedures (help desk, back-up/recovery, service level
agreements)
These recommendations were reviewed and validated by State government, by the Memphis Leadership, by the Technical Advisory Panel, and by AHRQ.
The AHRQ-Funded Exchange We now describe the AHRQ-funded exchange. First, we give a snapshot of its current scope and level of activity. Then, we describe some early activities that led to the overall project organization. We frame the majority of our description through six activity areas: early project initiation, governance, business and technical operations, policy, technology, finance, and evaluation.
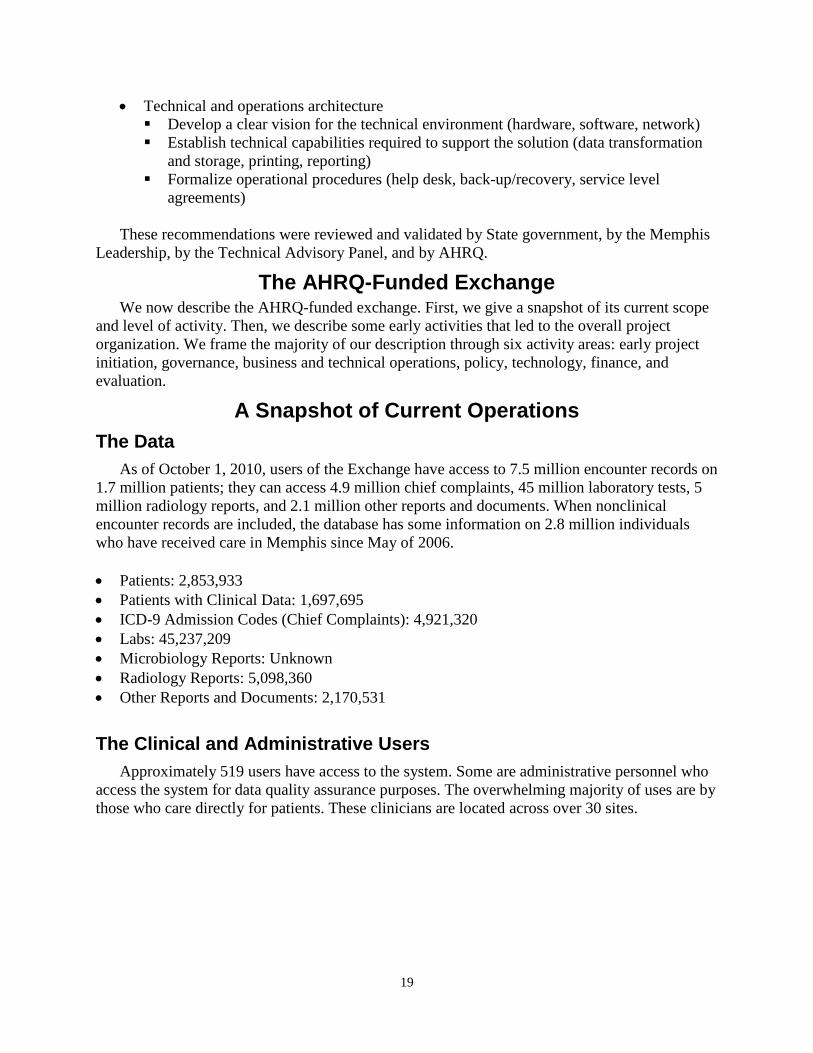
A Snapshot of Current Operations The Data
As of October 1, 2010, users of the Exchange have access to 7.5 million encounter records on 1.7 million patients; they can access 4.9 million chief complaints, 45 million laboratory tests, 5 million radiology reports, and 2.1 million other reports and documents. When nonclinical encounter records are included, the database has some information on 2.8 million individuals who have received care in Memphis since May of 2006.
• Patients: 2,853,933 • Patients with Clinical Data: 1,697,695 • ICD-9 Admission Codes (Chief Complaints): 4,921,320 • Labs: 45,237,209 • Microbiology Reports: Unknown • Radiology Reports: 5,098,360 • Other Reports and Documents: 2,170,531
The Clinical and Administrative Users Approximately 519 users have access to the system. Some are administrative personnel who
access the system for data quality assurance purposes. The overwhelming majority of uses are by those who care directly for patients. These clinicians are located across over 30 sites.
19

The Participating Institutions Baptist Memphis Hospital
Baptist Womens Hospital Baptist Collierville Baptist Tipton Hospital Baptist DeSoto Hospital (in MS) Methodist University Hospital Methodist South Hospital Methodist North Hospital Methodist Germantown Hospital Methodist Fayette Hospital
Methodist LeBonheur Childrens Hospital The Regional Medical Center (The MED) Saint Francis Hospital Saint Francis Bartlett Hospital St. Jude Children's Research Hospital Health Loop Clinics (Shelby Co) University of Tennessee Medical Group Christ Community Health Services (5 sites) Memphis Children's Clinic (6 sites) Memphis Health Clinics (2 sites)
The Role of the Kotter Framework
In our original proposal, we used a framework published by John Kotter as a set of guiding principles.1 We now recapitulate Exchange formation, operations, and growth from the perspective of Kotter’s framework. We may have been the first to use this framework in the context of HIE planning, but others have also adopted this approach. On June 2, 2010, Kotter’s framework was introduced by ONC at a State HIE meeting in Arlington.
Kotter identifies eight distinct stages of and risks associated with large project evolution. These stages transpire over the months or years between initial formulation and realization of measurable, sustained success or, in Kotter’s formulation, from the widespread sense of urgency to the complete integration with and transformation of a care delivery culture.
A sense of urgency. Kotter’s first stage addresses the early phases of a transformation effort. Most successful efforts begin when a powerful guiding coalition shares a strong and acute sense of either a timely opportunity or an impending crisis. The Santa Barbara Exchange was the result of a perceived opportunity and not a crisis. Santa Barbara County health care officials approached the California HealthCare Foundation with a range of proposals for health care as the Foundation was discussing health information technology opportunities with David Brailer, the CEO of Care Management Science (later CareScience). Brought together near the height of the "dot-com" boom, a guiding coalition believed that recent Web-based technologies could quickly enable a novel health information infrastructure supporting a diversity of settings.
The Memphis Exchange, in contrast, was the result of a widespread and deeply felt sense of urgency resulting from two major crises. First, the TennCare—Tennessee’s Medicaid program—was failing. Statewide, TennCare was projected to consume 91 percent of new tax revenue in 2008 unless dramatic changes were made. In Memphis, 25 percent of the population was TennCare beneficiaries and 12 percent had no insurance at all. Second, the region’s largest county hospital—the Regional Medical Center in Memphis—was on the brink of bankruptcy. Failure of the Regional Medical Center would have had dramatic effects on other hospitals and clinics in the region. Ambulatory care services were also deteriorating and ED use among all major hospitals was reaching a crisis point. State government was forced to act. Phil Bredesen—the Governor of Tennessee and a former health care executive—persuaded leaders in Memphis that the risks associated with change offset an untenable status quo.
Powerful guiding coalitions. Successful transformation efforts require the engagement of a leadership coalition committing resources and time required to make substantive change. The
20

Santa Barbara Exchange's guiding coalition included four separate "clusters"—a community hospital, an IPA, a coalition of provider groups and a hospital, and a county health department. Each grouping had very different needs and demonstrated varying levels of commitment over the course of the project. Management and oversight was provided primarily from afar through Care Science.
The Memphis coalition included representatives from hospitals, county government, safety net clinics, public health, and other delivery organizations highly focused on acute health care delivery needs. The Governor and his staff convened the coalition and participated personally in every major meeting during the formative early months.
The guiding coalition established governance structures that in turn developed by-laws and other policies. The guiding coalition served as an oversight body for a regional planning effort until a nonprofit corporation was formed for this task 18 months later. The initial coalition did not involve many commercial health plans, major employers, national commercial laboratories, or vendors serving large physician groups.
The Memphis coalition was not the only group to respond to the TennCare crisis. Virtually every region, provider, and interested party reacted to the impending crisis either by changing ongoing priorities or creating new initiatives. CareSpark, centered 500 miles away in the northeast corner of the State, had already begun efforts to organize, had sought technical advice from CareScience, and later participated in the national health information network pilot programs. Their multistate effort focused on ways in which the health of their community could be improved through a coalition of employers, providers, and civic leaders. CareSpark is funded by a combination of local contributions, State grants, and Federal contracts. Blue Cross Blue Shield of Tennessee formed a subsidiary—Shared Health—to address similar health care information technology needs. Coalitions of providers and vendors supporting various provider groups also responded with separate and at times overlapping approaches and faced the same business challenges.
Vision. Kotter recommends that the guiding coalition develop a picture of the future that is relatively easy to communicate and appeals to participants and the public. The Santa Barbara vision placed heavy reliance on technologies that did not deliver as expected. Significant external funding, dot-com euphoria, ambitious technology aims, and the broad ambitions of the guiding coalition led to an expansive “all-at-once” approach that failed to unify the community around any single core objective. In Memphis, the Governor presented a compelling vision for the Exchange. He viewed the Memphis project as but one effort in a broader and more long-term approach to meeting the care needs of all Tennesseans. In Memphis, he urged hospitals and health care delivery organizations to identify new ways of meeting their short-term objectives while at the same time creating a sustainable health care infrastructure supporting measurably higher quality care.
From the outset, the Exchange’s greatest immediate value would be to relieve over-taxed EDs; significant financial savings might be incurred if practitioners in EDs could access clinical results obtained at other institutions and in some instances avoid expensive redundant services. A study by the California HealthCare Foundation found that 2 percent of Californians visiting EDs three or more times on 1 year accounted for over 35 percent of ED visits during that time period. One in five ED visits could be considered "avoidable" and could have been managed by other means. Similar patterns of multiple use and avoidable ED visits were observed in Memphis. One-third of the patients seen in the Regional Medical Center's EDs had no health insurance coverage and another half were TennCare patients. Data from the Indianapolis Health
21

Information Exchange suggested that the Exchange could have a significant financial impact on uncompensated care costs.
Communication. Kotter describes the importance of engaging large numbers who are willing to help and possibly make sacrifices. Help will not come unless participants believe useful change is possible. Although the Santa Barbara effort convened numerous working groups, engaged a consulting firm, and disseminated publications widely, their vision seemed mired in technical difficulties, distrust, and privacy preoccupations. The hearts and minds of participants, it seems, were not captured for sustained periods.
In Memphis, the MidSouth eHealth Alliance Board was the initial communicator both within and among participating organizations. As one Board member stated, "When your CIO or CFO comes to you and asks 'do we really have to do this?' you've got to be ready to say yes. When they ask you again, you've got to emphatically say 'yes' again. It usually takes about three times before they understand this is important and needs to be done." CIOs were assured that their initial investments would be small; the technical approach adopted by Vanderbilt would not require organizations to map data elements; a secure Internet connection and data quality assurance practices were all that were required. Annual technical and quality assurance costs borne by organizations contributing data are less than $50,000 per institution. CFO's were engaged to validate potential financial savings by avoiding redundant radiology testing in this heavily underinsured region.
The Board did not issue press releases or emphasize public communications in the early periods for two reasons: first, over-promising an unproven solution to practitioners or to the public would erode trust if the system did not perform as promised; second, public attention was focused on anticipated reductions of benefits to TennCare beneficiaries. Although technology was envisioned as a positive contribution, it is not a panacea and may have suggested an unrealistic solution to a care delivery challenge with far deeper historical and financial roots.
Empowerment. Kotter claims organizations must identify and change systems or structures that seriously undermine their collective vision for change. The more people who adopt the vision as their own and become involved in the change effort, the better the outcome. Participants in the Santa Barbara Initiative did not seem to have this sense of empowerment.
Memphis participants were empowered through participation across a range of established and new activities. Established activities included HIPAA discussions led by the University of Tennessee, community health initiatives led by a nonprofit group, and ongoing meetings of health professionals and administrators. New activities included highly structured workshops. In the early months of the effort, workshops were used to develop an initial framework for program management and governance; set initial clinical priorities; validate financial projections; and established preliminary operating procedures. The workshop format was expanded over time to address state-level issues and privacy concerns. A national technical advisory panel meets every 6 months to review the progress of the effort.
Deliberations on privacy and confidentiality policies were perhaps most responsible for empowering others within the community. Over the course of 9 months, up to 30 middle-level managers met regularly to address how each institution would individually and collectively address privacy concerns. In these prolonged meetings, leaders from across traditionally competing organizations were united by a common goal—improving the care of patients without interfering with traditional medical confidentiality relationships. Through this process the group developed a uniform position on informing the public and agreed that different institutions would inform patients differently; the group set in place a set of principles and saw to it that each
22

institution implemented these principles in an acceptable way. The group creating the data sharing agreements has become a standing subcommittee of the Board; they meet regularly to modify policies as use is extended to ambulatory and public health settings. In Memphis, technology and policy work hand-in-hand.
Short-term wins. Kotter emphasizes the visible demonstration of performance improvements and recognition of those responsible for these improvements. Santa Barbara was unable to create short-term wins. Even after 7 years, Santa Barbara still had not achieved a compelling short-term financial value proposition or a clear vision of favorable long-term value. Changing their technology architecture three times, Santa Barbara was continually grappling with complexities that postponed initial use.
The Memphis Board, in contrast, designed their technology and policy framework to accelerate use in EDs while ensuring these frameworks would also address their vision for care transformation across far more diverse settings. The Board reasoned that if the system was adopted and valued in EDs, trust among institutions would grow and the value of using these same approaches across a wider range of organizations would be more apparent to patients and to the public.
Powerful anecdotes about the system's positive impact on care quickly spread among EDs and into the community. Complex diagnostic testing often was no longer required because past test results from other institutions were now available. Triage decisions did not have to wait for new evaluations; often decisions could be based on laboratory tests, radiology reports, and other clinical information recently recorded at other sites. Some anecdotes were dramatic. One ED physician treating a patient for a minor laceration noted that recent tests documented an active, untreated tuberculosis infection. Rather than be sent in the general waiting room, the patient was immediately isolated, the results confirmed, and tuberculosis therapy initiated.
Consolidating improvements to produce still more change. Kotter warns that "declaring victory too soon" can be "catastrophic." Leaders must use the "credibility afforded by short-term wins to tackle even bigger problems." Santa Barbara's inability to realize short-term wins frustrated its ability to satisfy their ambitious long-term vision. After 5 years, only two Santa Barbara providers were making data available for exchange; delays and limited services diminished what little enthusiasm remained. The participants, in the words of one observer, suffered from "community fatigue."
In Memphis, clinician expectations lead to peer pressure and drive system improvements and data sharing. Our early findings suggest that peer pressure and community-wide organization can lead to more standardization in practice and data representation. At the Board level, community-wide clinical enthusiasm drives priorities; anecdotes of lives saved and costs avoided sustain commitment while more formal evaluation is taking place. For example, representatives from all clinical organizations now recognize the value of discharge summaries and related transcribed reports and are making exchange of these items a priority.
Memphis now faces new challenges that will tax the energies of its leadership. While focusing intensely on adoption within the emergency room and enhancement of services to this market, collaborations with ambulatory vendor systems and other critical data sources have only recently moved from discussion to pilot demonstration planning. User "champions" from the EDs, hospitals, and clinics have not been engaged systematically to develop a comprehensive plan to integrate the Exchange across transitions of care and to leverage its potential to reach ambulatory practices. As the Exchange pursues new initiatives in public health reporting, connectivity with community physicians, outreach to employers, negotiations with health plans,
23

and communication with the public, issues of trust and benefit already addressed among the guiding coalition must be raised again with these new groups. The months or years necessary to produce statistically valid financial and quality data, force participants to rely primarily on preliminary data, anecdote, intuition, common sense, and mutual self-interest. A new sense of urgency and an expanded vision will be required. Strong and sustained leadership—at both the State and community level—will again be essential.
Institutionalizing new approaches. Kotter suggests that success is only realized when new and innovative practices become ingrained in the culture of the community. Victory can be declared when what was once an often unwelcome change becomes "the way we do things around here." The Santa Barbara Exchange was not successful in producing widespread cultural change; instead, cultural change was the result of efforts by providers, clinical laboratories, and others groups to find alternative means of providing some of the services initially promised from the health information exchange. In Memphis, early evidence for institutionalization has been suggested by sustained use in established settings and requests by other clinicians for extension to new care settings. Use by key ED personnel is low but stable. Hospitalists began coming to the ED to access the system through their colleagues; formal access has since been granted to this group but use is episodic. ED physicians practicing in multiple institutions have urged administrators to extend access to other hospitals; the same system used in Memphis is now available in a Mississippi hospital affiliated with one of the Memphis health systems.
Even a resounding success within the ED and within a select group of ambulatory settings will not be sufficient to ensure widespread institutionalization and sustainability. To transform care of an individual requires consensual availability of information from a wide range of ambulatory settings and, ultimately, the home. The Memphis Exchange must seamlessly interact with small medical practice electronic medical record systems, with large practice systems supported by established vendors, personal health records, and with resources and organizations serving as agents for Medicaid, clinical laboratories, statewide, or national data resources
Stages of Exchange Formation There were several overlapping stages to the effort. One informal method of describing these
phases follows: State leadership. The initial stages of this effort (primarily in the year 2004) were the result
of a Governor and an administration that wanted to address cost issues at the same time it was undergoing transformation of the State’s Medicaid Program. This intent was included in Governor Bredesen’s “Saving TennCare” speech of February 17, 2004. In it he mentioned an effort to use Vanderbilt Technology to address some of the issues facing the Regional Medical Center in Memphis. Leadership was assertive; on June 4 the Governor convened health care leaders in Memphis and asked them to participate in the 6-month Accenture planning effort. One non-Memphis external observer said the effort by the State bordered on “coercion.”
The planning and staffing stage. Discussion between Dr. Bill Stead and other State leaders took place in early 2004. The planning effort—funded externally and supported by the consulting firm Accenture—was proposed. Dr. Stead and Dr. Ed Hammond spent extensive time working on a technical approach to HIE technology based on Vanderbilt technology.
The guiding coalition stage. During the fall and winter of 2004 and 2005, extensive discussions were held between the State, Vanderbilt, and the Memphis leadership. On January 19, 2005, the parties convened in Memphis. A senior staff from the Governor’s Office led the discussion concerning leadership of the effort. By this time, notification of award from AHRQ
24

had taken place and funding had begun. The consensus from the group was they wanted to form a health information organization (HIO) and agreed that whoever was interested in continuing with the project would attend a meeting on February 2, 2005. On the latter date, Commissioner Goetz proposed a slate of candidates. The first official board meeting was on February 23, 2005. Legal counsel was a primary topic of discussion. Discussion among the parties delayed administrative issues through June of 2005, but the technology, clinical, and policy planning continued. Initial distrust was minimal in light of a focus on a common problem—ED care and the relative poor payer mix. Emergency care with the payer mix in Memphis was not as profitable as it would be in a community with a larger proportion of Medicare and commercially insured patients. The historical tension among providers was documented in a Paul Starr Health Affairs paper in a May/June 1997 article entitled “Smart Technology, Stunted Policy: Developing Health Information Networks.”3 His paper detailed the tensions resulting from one hospital systems withdrawal from the urban core and how these tensions were exacerbated during a CHMIS effort in the mid-1990s.
Unified through a common concern. Early in the project, Blue Cross Blue Shield of Tennessee began an aggressive push to extend their claims-based system (the Shared Health Community Connection) from Medicaid (where they had a contract) to the broader health care delivery community within the State. Shared Health—a for-profit subsidiary of Blue Cross—had significant financing and political support, but many health care delivery organizations could be characterized as distrustful of the process because of its health plan corporate parent and its failure to exclude secondary data use. This led to serious discussions among Board members and the State. Some agreement among the parties was documented during a meeting on October 25, 2005. Subsequently, some meetings were held to arrive at common technical standards. These efforts did not lead to substantive collaboration largely because the Memphis project was accelerating and Shared Health was redefining its role in the State.
Unification through a common focus—the patient. The early guiding coalition from Memphis and State leadership was bolstered through the intense discussion about patient consent, data use, and privacy. The height of these discussions took place between June of 2005 and May of 2006. These discussions ultimately involved over 30 individuals; many individuals were “front line” employees and others were administrators or legal counsel. The tone of these meetings was not adversarial but instead collaborative. Their only focus was on patient expectations; institutional competitive instincts were absent from the discussion. This enthusiasm was transmitted upward to the Board and arguably sustained the effort between the early formative stages and the period of actual use.
Early wins. Although the system was not made available to providers until May of 2006, early clinical enthusiasm and early anecdotes of impact bolstered the Board’s confidence. Additionally, it can be argued that the MidSouth eHealth Alliance Board provided “neutral territory” to discuss issues of common concern. Much of the discussion was educational and focused on how HIT broadly could improve patient care. Formal clinical and financial involvement was slight, but the technical teams developed a close collaboration.
Local control. Local control was challenging. An initial director developed a terminal illness. A half-time employee who found difficulty in navigating the environment replaced him. After a hiatus, Rodney Holmes—formerly of the Vanderbilt project team—assumed a full-time position as executive director and continues to serve in this capacity.
Extending the Exchange. At both VU and in Memphis, extension of the project to widespread community adoption proved difficult. Great progress was achieved through a single
25

firm providing EHR services across the community through an ASP model. This firm provided data, exchange access, and even medication histories. But this effort came to a halt near the time of the passage of HITECH. Arguably, anticipated changes in HIE both in terms of Meaningful Use and State HIEs delayed commitment from ARRA’s passage until recent weeks.
Successful efforts in project expansion. During the course of the contract, the Vanderbilt group supported a statewide quality initiative, an e-prescribing pilot in Memphis, and development in collaboration with the Regenstrief Institute and Indiana Health Information Exchange (IHIE) of a successful medication history service. A statewide sustainability workshop was also held. All of these projects contributed to the common perception across the State of Tennessee. Lessons learned arguably led to the Governor’s appointment of an eHealth Committee.
Expansion across the State. Some expansion of this approach to HIE was anticipated in the initial proposal through the “penetration framework” concept. The Vanderbilt team’s national and statewide presence, the leadership of key executives in Memphis, and the sustained leadership of the Commissioner of Finance and Administration, and the support of the Governor leveraged statewide planning sessions into a Governor-appointed eHealth Council and a post-HITECH public-private Health Information Partnership for Tennessee (HIP-TN). When the AHRQ contract was extended, the State was forced to withdraw the several million dollars in remaining State funds to support HITECH-related activities. These funds were available because Vanderbilt never charged the project for hosting the entire Memphis exchange for almost 4 years. The basic approach and the final vendor—Informatics Corporation of America (ICA)—have recently been adopted by Nashville and Chattanooga. These local efforts are expected to complement a prominent HIE vendor’s efforts under contract through HIP-TN using HITECH funds. The role of Shared Health, ASP-based exchanges, regional efforts in other parts of the State, and other exchange models remain undefined; no doubt there will be many “exchange” services that will have to be harmonized in the months and years to come.
26

Chapter 3: Governance Principles
Governance efforts were guided by a few simple principles. First, local control and trust is the most essential prerequisite for successful adoption and improved care. Second, such trust can be enhanced by a low-profile project management office from Vanderbilt that brought best national practices into the Memphis area and allowed these practices to be personalized and modified in ways that enhanced ownership but did not lead to actions that were fundamentally contradictory to national views. Third, State (and County) Government roles were crucial to provide a broader layer of trust among the Memphis participants and the Vanderbilt project management team. This trust was in part imposed and in part simply supported through the State’s role as policymakers and funders of health care services in the region. Also, since Vanderbilt is itself a health care provider the State’s strong guiding hand assured the Memphis provider communities that there was no “hidden agenda” among the Vanderbilt team supporting this project.
To realize the aims of the work, a contractually required Technical Advisory Panel (TAP) was created as an active and participatory group of national organizations who could both ensure the project remained leading edge and reassure both Memphis and State leadership that their investments were sound. An executive oversight group composed of all who contributed data was established quickly and soon evolved into a formal nonprofit corporation with informal “veto power” over use of Vanderbilt funds. Upon termination of the contract, the oversight group was charged with the ongoing complete management of exchange efforts conducted through the completed work.
The original governance structure anticipated a State-level group that was indeed later formed. The latter group was originally an eHealth advisory council but was transformed into a public-private partnership to respond to HITECH State HIE and other statewide initiatives. Figure 3. Original organizational infrastructure in context
27

From the outset, our proposal identified the need for a State-level coordinating group, a Memphis governing board, advisory groups to the Board, work groups, and a project management office.
This structure changed in subtle ways from the original plan. First, although the TAP and the evaluation team did indeed have a significant impact on the directions taken by the State, formal reporting remained to the Memphis Project Team through the AHRQ contract but it met and responded to all needs and requests of the Memphis Governing Board. This governing board, however, was appropriately more concerned with their visibility at the State level and their communications with State government than they were with advancing informatics at the research or policy level. Second, the other governing boards—formal and informal—did have participation when the eHealth Advisory Committee was formed. Some of these boards were not geographic; Shared Health, for example, was a for-profit concern seeking a national market. An officer from their parent corporation—Blue Cross Blue Shield of Tennessee—currently serves as the Chair of the Health Information Partnership of TN (HIP-TN) in support of the State HIE efforts.
The Technical Advisory Panel The purpose of the TAP was to assist and advise the project leaders during the life of the
project. The TAP was to provide formal governance through votes on policy on technical issues and design. The TAP was to be responsible for all technical decisions made by the project at the State level including data models, data standards, and data interchange standards. Since the technology was designed primarily to enable the clinical quality objectives set forth by the Clinical Advisory Panel and the Regional CEO Oversight Group, formal paths of communication need to be established between these groups.
The TAP should be selected to represent the broad spectrum of required expertise and represent critical areas that might influence outcome. These areas include business, technical, clinical, reimbursement, policy, consumer, government, financial, institutional, and others. Members were to be national experts in their domains.
The TAP was to have the responsibility to make sure the Project used approaches consistent with scope; that tests of alternative approaches are clearly defined according to the framework and prioritized appropriately; that decision options are looked at from a broad perspective; and that plans to document cost and benefit are appropriate. The TAP was to provide suggestions about how to overcome technical and organizational barriers.
Suggestions for the 10 members of the group include representation from the following:
• AHRQ • National Library of Medicine • Standards • Security • Industry • Clinical • Consumer • Economics/business • Computer/Network Technology • Informatics
28

Dr. W. Ed Hammond from Duke University was chair of TAP. Dr. Hammond has experience in health data standards and in electronic health records. Dr. George Hripcsak succeeded him in the third year.
The Request for Proposal (RFP) required the first meeting of the TAP within the first 6 months of the project and was to meet twice annually. We accelerated the timing of our first meeting of this group to coincide with an initial planning meeting designed to finalize decisions regarding Core Healthcare Entities, Core Clinical Data Elements and to make a first cut at evaluation metrics. We planned to schedule all TAP meetings to occur during these DesignShop events.
Other TAP candidate topics included the following: • Critique the governance and planning processes • Approval of Core Healthcare Entities, and Core Clinical Data Elements • Approval of the Information Infrastructure Framework • Approval of initial approach for data architecture for data interchange • Recommendation on use of StarChart or an alternate solution for storing patient data in
the Regional Databank • Approval of security and privacy provisions • Critique of Information Intervention Framework in terms of outcomes, interventions and
priorities • Recommendation on standards to be employed with suggestions on priority of
implementation and strategies to ensure core entity collaboration • Strategies that might help in migrating the Project throughout other parts of Tennessee • Potential sharing opportunities with public health, State government, and other authorized
groups.
Our TAP was an active and stable group. Although few were unable to meet the time commitments, a core group was active both on-site and remotely to support the project. The Chairs—first Dr. Hammond and later Dr. Hripcsak—submitted formal letters to the Commissioner of Finance and Administration, David Goetz, summarizing their findings. TAP Members included the following:
• George Hripcsak, M.D., Columbia Presbyterian, TAP Chair • W. Ed Hammond, Ph.D., Duke University, Past TAP Chair • Betsy Humphreys, Ph.D., National Library of Medicine • Bill Stead, M.D., Vanderbilt University Medical Center • Cristie Upshaw Travis, Memphis Business Group on Health, The Leapfrog Group Board • Tom Rindfleisch, MS, Stanford University • John Quinn, Accenture • Chelle Woolley, formerly with eHI, SureScripts (2005—2007) • Brenda Motheral, Express Scripts and Healthways (2005) • Susan Christensen, Baker, Donelson, Bearman, Caldwell & Berkowitz, PC, former
AHRQ project officer • William Bernstein, Esp., Manatt, Phelps & Phillips, LLP (2004, 2005)
29

• Representatives from the State of Tennessee, included Commissioner Dave Goetz, Will Pinkston, Antoine Agassi, and Melinda Hargiss.
Charles Kilo (Greenfield Health, Oregon), Kevin Schulman (Duke University), and Jonathan Zimmerman (Siemens) agreed to serve and provided initial advice but were unable to reconcile this commitment with their other responsibilities.
The MidSouth eHealth Alliance The formation of this critical governing body has been described in detail in the chapter on
planning. Since its inception, the Midsouth eHealth Alliance Board’s role has changed from one of
high-level oversight of the Vanderbilt Project team to the group solely responsible for all business and technical operations in their region and in connection with the efforts of the State and other communities. A full-time executive director now manages the complete operation. A research team from the University of Memphis continues to study the impact of exchange on health care delivery and outcomes.
Board composition was extremely stable throughout the 6-year period. This was both indicative of the high degree of community support and of the perceived importance of this project.
Board Members were as follows: • Bob Gordon (Baptist) Chair, 2005-2006 • Dave Archer (St. Francis) Chair, 2006-2007 • Donna Abney (Methodist) Chair, 2007-2008 • Steve Burkett (UTMG) Chair, 2008-2010 • Burt Waller (Christ Community) Chair, 2010 (Current) • Nancy Lawhead (Mayor’s office) • John Nash (St. Jude)—past member • Jerry Shenep (St. Jude) • Al King (MMCC-TLC)—past member • Elizabeth Bradshaw (Health Loop Clinics) • Yvonne Madlock (Public Health) • Bruce Steinhauer (The MED)—past member • Reginald Coopwood (The MED) • Laurie Lee (State)—past member • Antoine Agassi (State)—past member • Melissa Hargiss (State)—past member • Will Rice (State)
Board Responsibilities in the Era of HITECH The HITECH Act presented both opportunities and roles for the Vanderbilt project team and
the MidSouth eHealth Alliance Board. The majority of the Vanderbilt project managers and administrators who created the AHRQ-funded exchange now play critical roles in the acceleration of exchange within multiple regions and the State. Memphis Board members, retaining their primary organizational affiliations, have played an essential role in the formation
30
of the public-private partnership Health Information Partnership for Tennessee (HIP-TN). To a certain extent, the Memphis experience has “anchored” thought into what is commonly called “the Memphis model” and much of the early statewide consent and technology debate largely paralleled the formation of the Memphis Exchange. But there is evidence that at the State-level a broader definition of HIE as services may be emerging. The selection of another nationally known HIE services vendor rather than Informatics Corporation of America , ICA, suggests a recognition of the heterogeneity of exchange models. Reformulation of the State proposal to recognize the “HIE as services” approach articulated by ONC in their July 6, 2010, PIN suggests an evolution.
Within Memphis, three additional aspects emerged providing additional evidence of growth and sustainability. First, the hospitals and the State have agreed to a funding formula defined by the Tennessee hospital exchange. This funding formula is consistent with a progressive “dues model” often employed in what some management theorists call “facilitated user networks.” Second, investigators from the University of Tennessee have been leaders in the evaluation of HIE on management of specific disorders in the ED. Their local ownership advances the cause and does not seem to have created significant tensions between the urban-based University and the suburban-based hospitals. Finally, the Memphis community spent many months submitting a BEACON proposal to ONC. This proposal was entirely the product of the Memphis community working with State leaders and their vendors. Vanderbilt played no role in this effort. The perception that results could be obtained without Vanderbilt’s expertise is arguably the strongest example of the ongoing progress in Memphis.
31

Chapter 4: Business and Technical Operations Staffing
In our proposal, we proposed a context in which business and technical operations would be conducted. This model was largely correct, but the emphasis on each part and the evolution of roles over time merits consideration. Figure 4. Proposed organizational structure
This organizational structure was correct in the overall roles and components, but the reporting relationships quickly changed and both the reporting and the responsibilities migrated over time. Where the latter is concerned, project management was migrated to Memphis as the migration toward a freestanding IT vendor took place.
32

Figure 5. Final project organizational structure
This figure depicts the major and persistent role of the Vanderbilt project management team until end of the project.
Distribution of Work The Vanderbilt Project Management Office (PMO) performed the majority of the work until the last year. During the last year, all components but the evaluation team, the Principal Investigator and the technical oversight for migration were moved to a commercial vendor. Project leaders were phased out over the final year. At the time this report was developed, only the Principal Investigator and his administrative associate remain the Center for Better Health. All software engineers are playing other important roles in the VUMC informatics center. The privacy officer holds a similar position for the Medical Center, and remaining team members are holding leadership positions throughout the State. The TAP worked with both Memphis and Vanderbilt staff, but its primary role was to advise Vanderbilt and, through written summaries, the Commissioner of Finance and Administration, David Goetz. The TAP served primarily to advise the Vanderbilt team, although approximately half of its meetings were in Memphis with
33

the working groups and Board members. Operations Committee (focused on data sharing) became the dominant standing Memphis body; other groups met on an ad hoc basis. With the exception of one full-time equivalent (FTE) Executive Director in the final years (and a 0.5 FTE earlier), Memphis played little formal operational role until responsibilities were migrated to Memphis and to an independent vendor (Informatics Corporation of America). At least one member of the evaluation team was from the University of Tennessee.
The evolution of the security and privacy group—renamed the “operations committee”—was the result of the 9-month process to develop data sharing agreements and the realization that ongoing policymaking was going to be central to growth and ongoing operations. This group reported directly to the Board. A Vanderbilt Project Team Member (Vicki Estrin) played an early leadership role and was succeeded by Janet King in the final year. Other working groups seldom met. Informal “on the ground” engagement proved more successful. The informal collaboration was extensive; often one or two teams from Nashville were in Memphis during any given week at the height of the project.
Required Expertise Our initial proposal anticipated a staffing mix heavily weighted on technical design and
project management in the initial years. Over time, the weighting for the evaluation component would proportionately grow both through increased time and effort from the evaluation team as well as a shift of the core administration team away from building and managing the exchange towards measuring value and sustainability.
We anticipated eight different types of expertise. State executives and administrators. These individuals oversee the overall subcontract to
Vanderbilt University both for statewide information infrastructure planning and on the long-term demonstration contract described in this document. These individuals have committed time to the project and will not seek funding from AHRQ or other sources.
PMO administrative personnel. These individuals were Vanderbilt employees and were housed out of the Vanderbilt Center for Better Health. They included all of the core administrative and policy team (e.g., Estrin, Frisse, Rice) other than Janet King. Although Ms. King was very much an administrator, her time and effort is included in the “technical personnel” category. Monroe Wesley also joined the team and moved from St. Jude hospital to Vanderbilt. Ms. Ashlea Lifsey played a critical role in managing user IDs and tokens. Some of her budget is not accounted for. He served as the chief security officer. Technical subcontracts to explore options for alternative MPI approaches are not included in the personnel list but are included in the final report of subcontract budgets.
PMO technical personnel. These individuals were responsible for software development and technical operations. Initially, we estimated one programmer for the regional patient index and two to modify the Vanderbilt technology to serve as a regional patient database. The number of individuals were not expected to decline until the final year because of our need to create or transition to an “industrial,” self-sustaining technology platform.
Evaluation faculty and staff. These individuals are either employees of Vanderbilt University or of the University of Tennessee in Memphis. Kevin Johnson led the team; it included part-time efforts of three other Vanderbilt faculty as well as two UT faculty. Most evaluation was funded through the State component of the budgets to ease Federal reporting requirements.
34
Bioinformatics faculty and staff. A number of individuals contributed time and effort in the early stages of this work. Stead, Giuse, and Bates participated in technical development. Initially, we estimate one programmer for the regional patient index and two to modify the Vanderbilt technology to serve as a regional patient database. In subsequent years, the number of individuals working on the regional patient index will reach a maximum of two and the number of individuals working full-time on the regional patient database will increase to four. The number of individuals will not decline because our State funding is envisioned in the later years to disseminate the technology to other regions and to refine it to become a more “industrial,” self-sustaining technology platform. They will provide their broad experience to large-scale informatics projects from a technical, research, and organizational behavior perspectives.
Regional participants. Regional participation was achieved through design and operations of the exchange as well as through leadership in local operations and participation in State-wide DesignShops. These individuals contributed their time and effort to the project.
National Technology Advisory Panel. Complementing the other governance structures, this Panel—required by the contract and described in our proposal—will be approved at AHRQ’s earliest convenience and will be paid only travel expenses and honoraria according to AHRQ guidelines
The Accenture consulting team. This team worked under Dr. Frisse and the Vanderbilt PMO through a subcontract to Vanderbilt funded by the State of Tennessee. They were involved in the planning of regional efforts within the State from July 1, 2004, through January 2005. Their budgets are not included in this report.
Skill Mix We anticipated an early emphasis on administrative and technical effort with a slight decline
in both in the latter 2 years. This decline was to be offset by increases in evaluation activity. Qualitatively, our estimates were sound. Quantitatively, it required more administrative staff and technical staff. In the last year, many technical activities were shifted to subcontracting expenses and the effort of the ICA technology subcontractor is not included on our personnel listings.
35

Table 3. A Comparison of proposed and actual personnel
Y1 Y2 Y3 Y4 Y5
PMO - proposed 3.4 (44 %) 2.3 (24%) 2.3 (22%) 2.3 (22%) 2.3 (22%)
PMO - actual 1.0 (30%) 1.8 (30%) 2.7 (31%) 4.7 (37%) 5.7 (41%) Tech - proposed 3.0 (39.3%) 5.7 (61%) 6.2 (61%) 4.2 (42%) 4.2 (42 %)
Tech - actual 2.0 (61%) 3.8 (62%) 5.2 (60%) 5.9 (46%) 6.0 (43%)
Eval - proposed 1.3 (16%) 1.3 (14%) 1.6 (16%) 3.5 (35%) 3.5 (35%)
Eval - actual .3 (9%) .5 (8%) .8 (9%) 2.1 (17%) 2.2 (16%)
Total - proposed 7.7 9.3 10.1 10.1 10
Total - Actual 3.3 6.1 8.7 12.7 13.9 Table Key: PMO—includes the Memphis executive director as well; Tech—Includes only the FTEs funded through the State or grant-contract. Does not include the smaller contributions from Vanderbilt software engineers heavily involved in the early design of the project; Eval—this includes only the Vanderbilt evaluation team; Approximately one additional individual was a subcontractor. The personnel involved with the MPI subcontract to TN Tech are also not included in this table.
In general, we found that more personnel were required for each aspect of the project. This
was the result of additional scope to include deeper data-sharing work, broader technical development and integration to the commercial vendor, additional subcontractors for evaluation and record-locator service development, and administrative support for contracts, audits, and reporting both to the State and to AHRQ.
Programmatic Linkages In the course of our project, we had a wide range of linkages with related work. Among the
many parties in which serious discussions or knowledge sharing took place are the following:
• Medicaid/TennCare • State Children’s Health Insurance Program • State Department of Health—potential linkages currently being investigated • Tennessee Hospital Association • Key State-centric and Memphis Region Industry and Consumer Groups: • Hospital Alliance of Tennessee • Tennessee Healthcare Information Management Association • Healthy Memphis Common Table • Leapfrog Group • Memphis Biotech Foundation • Memphis Business Group on Health • Memphis Tomorrow • QSource (State QIO and Regional Extension Center) • Information Technology Initiatives of Federally funded Community Health Centers:
Improving Quality of Care for Children with Special Needs, Improving Quality and Safety of Regional Surgical Patient Care, and Technology Exchange for Cancer Health Network
• Centers for Disease Control and Prevention • Indian Health Services • Veterans Health Services
36

• Department of Defense • Entities funded via the National Bioterrorism Hospital Preparedness Programs • Other data-sharing initiatives in the State:
o Tri-Cities TN VA Data Exchange o Blue Cross Blue Shield of Tennessee and Cerner joint initiative o East Tennessee Healthcare Improvement for Health
• Other national data sharing initiatives (Regenstrief, other SRDs, eHealth Initiative participants)
• Other local and regional initiatives that will benefit from the linkage through a data exchange o Healthcare entities and systems in Tennessee that are considering regional and data-
sharing initiatives o Vendors who are interested in better understanding their customers’ future needs o Ongoing initiatives such as the Vanderbilt University Medical Center and Regional
Medical Center (the MED) efforts in evidence-based medicine o Initiatives in bordering States, (e.g., Mississippi and Arkansas) to discuss the issues
related to patients who cross State lines for care
Design Shops We proposed a minimum of five design shops both to refine the Memphis project and to
ensure its impact across the State and Nation. Design Shops are Vanderbilt’s method of accelerating change and forging consensus. In our proposal, our agenda were defined to move from early design considerations through validation and toward final evaluation. As our work progressed, we found that some objectives were best met through TAP meetings and other activities.
Our first Design Shop was to be organizational to validate the core data elements and entities. Our second Design Shop was intended to focus on strategic interventions through exchange. Our third and fourth were to take place in year 2 and were to designed to ensure data sharing capabilities were sufficient and to extend and intensify the impact of the exchange. A fifth design shop was to focus on evaluation and a sixth—funded through a contract addendum, was to focus on quality. In reality, we held at least 9 Design Shops that were directly related to exchange or its collateral implications in the State of Tennessee. We held at least another 10 Design Shops for related health IT planning for other regions and States. AHRQ and State funds were used only for a restricted number of Design Shops directly related to this project.
Design Shops Directly Related to the AHRQ Contract Memphis Organizational Workshop (September 1, 2004). This workshop was focused on
raising awareness of the potential of HIE to the Memphis Stakeholders. Dr. Clement MacDonald provided a keynote. The context—escalated tensions over TennCare cuts—provided additional focus to the members. In this meeting, the Executives and Stakeholders reached consensus of focus and organizational approaches.
Working Towards a Connected State (October 18-19, 2004). Our initial statewide Design Shop had four key objectives. First, we wanted to inform session participants of past and current HIE efforts in Tennessee and nationwide. Our list of initiatives was to include successes and failures to ensure future work builds off lessons learned and best practices. Second, we sought to define the framework for any Tennessee-wide plan for implementing HIE. The purpose of the
37

framework was to provide a common way for Tennessee health care organizations to understand, contribute to, and evolve their regions specific plans. Third, we sought to create an opportunity for participants to address common State-level challenges facing those organizations seeking wider HIE. Challenges included legal and policy issues, privacy concerns, clinical value, participation, technology, operations, financing, and collaboration across regions and the Nation. Fourth, we sought to find concrete means of moving forward. The focus was on incremental advance and collaboration—not a top-down, coerced approach. In particular, we wished to ensure participants understood that the AHRQ funding was not going to coerce regions into adopting the Vanderbilt solution under development in Memphis. Nor was it designed to find all solutions to every problem.
Statewide Privacy and Security Design Shop (December 13-14, 2005). This workshop brought together stakeholders from across the State and reviewed the Markle Connecting for Health principles, State policies, and actions various groups were taking to achieve a positive outcome. Dr. Carol Diamond from the Markle Foundation was the keynote speaker.
National Privacy and Confidentiality Design Shop (September 13, 2006). This Design Shop was supported through the eHealth Initiative and involved paying participants from 20 States. The participants used the Markle Connecting for Health Framework and derivative documents used for the Memphis Data Sharing agreements to develop their own approaches to data sharing in their communities.
e-Prescribing Design Shops. The Regional Informatics Team held two workshops on e-prescribing April 10, 2007, and May 23, 2007. These workshops were held to accelerate an e-prescribing pilot funded through AHRQ and statewide efforts.
Memphis Technical Advisory Panel Design Shop (September 27, 2007). This effort combined on-site observation of the Exchange with focused discussion among the Memphis participants and the National Technical Advisory Panel Members. Topics included usability, project extension, deeper interactions with local initiatives, and communication/public relations. A similar Design Shop was held in Nashville a year later (September 23, 2008).
Tennessee Statewide Information Exchange Planning (June 23, 2008). This workshop explored models for organizing eHealth activities and aligning various efforts.
Statewide HIE Sustainability Design Shop (August 15, 2008). Commissioner Dave Goetz, Mr. Antoine Agassi (Director of eHealth), and Dr. William Stead led this workshop. Its goal was to identify new and innovative means of creating economic value through HIE. Forty-five entrepreneurs, policymakers, HIE providers, and other innovators from across the State and Nation assembled to create ideas for business products and services that could be created if low-cost and comprehensive HIE was available in the State. The group arrived at three core business opportunities: “Adherence Management,” a “Caregiver Portal,” and “Health Intelligence services.” The results generated from the group paralleled ongoing national discussions on medication history, consumer access to health data, and secondary data use. Findings were presented to the Governor’s eHealth Council on September 18, 2008. Although no concrete plans for products were developed, the workshop and reporting helped a broad range of business leaders and entrepreneurs better understand the opportunities in a more fully connected, patient-centered health care delivery system.
Statewide Health Care Quality Design Shop (October 21, 2008). This workshop brought together experts from across the State to identify statewide quality metrics and means by which HIE can advance measurement of these metrics.
38

Design Shops Related to or Derived From the AHRQ Project • Alabama Medicaid Transformation Grant planning (March 8, 2007) • HIE planning session for the State of Mississippi (March 12, 2007) • Price and quality transparency for the State of Florida (September 26, 2007) • Informatics Research and HIE in Spokane (September 2008) • Security and Privacy DesignShop, (December 14, 2005) • Privacy and Confidentiality Workshop, (September 13, 2006)
Our work also had a significant impact on the State of Louisiana (both through project work
and Design Shops) and the Gulf States. This work began the week after Hurricane Katrina made landfall when the Vanderbilt Team helped State officials develop a revised HIE strategic plan. Later, Louisiana officials came to Nashville for a workshop devoted to executing their HIE plan on March 2, 2006. In 2006 and 2007, the Vanderbilt Center for Better Health (VCBH) team played an important role in developing two Design Shops to accelerate Louisiana’s funding for the ONC-funded Southern Governor’s Association HIE program. In 2008, VCBH held two Design Shops to plan for the State of Louisiana’s response to the ONC/HITECH—funded State HIE program. Frisse subsequently participated in the planning and design of the State of Louisiana’s submission to ONC.
39

Chapter 5: Finance Overview
This project was financed by AHRQ, the State of Tennessee, and Vanderbilt University. The budgets and figures included in this report are approximations and summaries and do not represent the formal budgets for the contract, They are provided as groundwork to understand what funds we thought we would require to reach our objectives and funds we actually required to realize these objectives.
Our effort began in June of 2004. Salaries for Vanderbilt personnel (e.g., Frisse) were paid through Vanderbilt funds. The 6-month planning beginning July 1, 2004, engaged Accenture working under the direction of Dr. Frisse and was paid for with State funds prior to notification of an AHRQ award. The 6-month assessment and planning focused primarily on Memphis from a perspective of statewide applicability. It provided an assessment of opportunities to improve health care through information access and readiness to execute on those opportunities. The effort concurrently addressed all planning deliverables required during Year 1 of the AHRQ SRD Project. The State of Tennessee and Vanderbilt paid for this planning engagement; it did not involve AHRQ expenditures. The Accenture planning session (funded by the State) cost approximately $760,000.
The overall project budget was a combination of approximately $5 million in AHRQ funds and up to $7 million in State funds over the 5-year period. Our proposed expenditures were $12 million. Our actual expenditures were $19.8 million. State funds were used for evaluation, subcontracts, some personnel, Memphis-based activities, and subcontracts to other State institutions through Vanderbilt. AHRQ funded most of the remaining expenses associated with the project. Memphis participants did not make financial contributions to the project during the course of this contract but contributed time and effort from IT, clinical staff, and executives. We estimated this time and effort at approximately $10,000—$50,000 per institution for a total annual estimated time and effort from Memphis participants of approximately $250,000. This is a crude estimate and does not reflect the high priority and absolute commitment the Memphis community gave to realizing the Project’s success. Where HIE is concerned, such commitment is almost priceless.
The State government is committing substantial time and effort to this project. State personnel—in particular the Commissioner of Finance and Administration, his staff, and, later, the eHealth office, spent many hours on the project. In addition to the salaries of some staff and salaries above the NIH cap, Vanderbilt committed to and expended approximately $500,000 in cost sharing and made Vanderbilt’s patient index, communication, and clinical repository software available to support the Demonstration Region without charge through a technology sharing agreement. Finally, Vanderbilt Medical Center hosted the Exchange for over 4 years at no charge. We estimate the cost of these services (had they been hosted commercially) in excess of $3.5 million.
Vanderbilt was the sole subcontractor to the State. Over time numerous individuals and organizations became subcontractors to Vanderbilt. These include TN Tech (for MPI evaluation), the University of TN (for clinical evaluation), ICA (for Exchange operations beginning in 2010), and Memphis BioWorks (for project management). During the project Memphis BioWorks also received additional direct funding from the State to support its Executive Director.
40

Original Budgets Our original budgets estimated relatively minimal hardware and software costs relative to personnel. The latter were expected to comprise approximately 50 percent of the budget. Vanderbilt technology was to be leveraged heavily and ultimately supported on separate servers. Our initial vision assumed hardware and software expenses of approximately $2 million. Subcontractors were envisioned primarily for evaluation and support in Memphis. Our personnel budget focused on attention to development and maintenance in the first 4 years and using a commercial vendor and support of evaluation in the final 2 to 3 years. Neither AHRQ nor the State paid Vanderbilt for its intellectual property, its software, or its core hardware services. The cost of the latter is difficult to estimate because the Memphis exchange was essentially run across the same 10 server clusters in multiple sites that supported Vanderbilt Medical Center. Our estimate of these expenses is $3.5 billion. Budgeting was very complicated because of the different fiscal years employed by the State, Vanderbilt, and the Federal Government. Table 4. Original budgets for the grant-contract
Expenditures Year 1: 9/04-9/05
Year 2: 10/05-9/06
Year 3: 10/06–9/07
Year 4: 10/07–9/08
Year 5: 10/08–9/09
Year 6: 10/09-9/10
Total
Personel $900,668 (29%)
$1,214,155 (55%)
$1,330,032 (49%)
$1,167,898 (58%)
$1,291,631 (67%) $0 (0%) $5,904,384
(49%
Meetings $120,000 (4%)
$124,800 (6%)
$129,792 (5%)
$67,492 (3%) $0 (0%) $0 (0%) $442,084
(4%)
Software $424,125 (14%)
$382,025 (17%)
$524,775 (19%)
$406,900 (20%)
$315,175 (16%) $0 (0%) $2,053,000
(17%)
Subcontract $770,800 (25%)
$10,300 (0%)
$10,609 (0%)
$10,927 (1%)
$11,255 (1%) $0 (0%) $813,891
(7%)
Legal $0 (0%) $0 (0%) $0 (0%) $0 (0%) $0 (0%) $0 (0%) $0 (0%)
Other Direct Costs
$575,380 (19%)
$196,370 (9%)
$431,370 (16%)
$66,370 (3%)
$54,310 (5%) $0 (0%) $1,323,800
(11%)
Indirect Costs $311,598 (10%)
$290,775 (13%)
$295,313 (11%)
$294,986 (15%)
$267,171 (14%) $0 (0%) $1,459,843
(12%)
Total $3,102,571 (100%)
$2,218,425 (100%)
$2,721,891 (100%)
$2,014,573 (100%)
$1,939,542 (100%) $0 (100%) $11,997,002
(100%)
These figures represent a combination of State and AHRQ contributions. Detailed reports have been submitted regularly to the AHRQ project management office.
Actual Budgets Our actual expenditures were $1 million less than the original budget. Because we received
several contract addenda totaling around an estimated $500,000 extra, approximately $1.5 million of State funds were not spent. These funds were essentially reallocated to support statewide HIE planning in response to HITECH. Given the centrality in State deliberations of the “Memphis model” and the findings from our many statewide Design Shops, one can argue that using these remaining funds was not just consistent with the 2004 intent, but was the ideal use of funding in light of HITECH. Expenses for the commercial vendor began in Year 5 and extended through Year 6. These expenditures accounted for approximately $900,000 of the subcontract expenses in each year. Our personnel expenditures and subcontract expenditures were also high because of the growing interest and desire to transition the system to a robust commercial platform.
41

Table 5. Actual expenditures during the contract period Expenditures Year 1:
9/04-9/05 Year 2: 10/05-9/06
Year 3: 10/06–9/07
Year 4: 10/07–9/08
Year 5: 10/08–9/09
Year 6: 10/09-9/10
Total
Personnel $269,688 (49%)
$873,236 (54%)
$967,138 (64%)
$1,315,312 (56%)
$1,473,024 (46%)
$462,784 (29%)
$5,361,162 (49%)
Meetings $47,059 (9%)
$69,280 (4%)
$63,903 (4%)
$39,982 (2%)
$72,315 (2%) $0 (0%) $292,539
(3%)
Software $0 (0%) $107,165 (7%)
$109,232 (7%)
$45,740 (2%)
$7,875 (0%) $150 (0%) $270,162
(2%)
Subcontract $0 (0%) $0 (0%) $152,200 (10%)
$445,355 (19%)
$1,390,619 (43%)
$1,035,271 (64%)
$3,023,445 (28%)
Legal $0 (0%) $81,874 (5%)
$14,627 (1%) $0 (0%) $0 (0%) $0 (0%) $96,501
(1%)
Other Direct Costs
$127,784 (23%)
$145,455 (9%)
$110,134 (7%)
$288,930 (12%)
$50,669 (2%)
$3,419 (0%)
$726,391 (7%)
Indirect Costs $101,994 (19%)
$335,990 (21%)
$95,630 (6%)
$197,200 (8%)
$236,491 (7%)
$108,885 (7%)
$1,076,190 (10%)
Total $546,505 (100%)
$1,613,000 (100%)
$1,512,864 (100%)
$2,332,519 (100%)
$3,230,993 (100%)
$1,610,509 (100%)
$10,846,390 (100%)
These numbers are approximate and the categories for the final expenditures cannot be completely mapped to the same categories of the original project.
In summary, our proposed expenditures were $12 million. Our actual expenditures were $19.8 million. This does not include the Accenture planning session (funded by the State). The cost of this engagement was approximately $760,000.
Summary Lessons The final year of the contract period (Year 6) may be the best indicator of annual operating
expenses with the Exchange’s current hospital-based operating plan. Costs to integrate more ambulatory care providers will add to these costs, but such integration should be far less expensive now (in light of HITECH and the Medicare and Medicaid EHR Incentive Programs) than it would have been earlier. Assuming a 50-percent increase, operating costs would still be under $2.5 million. This is far less than many other exchange models, is less than projected savings from hospital admissions under current usage, and represents less than $2.5 dollars per person per year. This number should be measured against annual expenditure estimates of over $7,500 per person per year.
In retrospect, we grossly underestimated the administrative costs for contracting, for reporting, and—most critically—for establishing and maintaining a climate of trust through our data sharing agreements and our client-centered approach. The central question for future efforts is whether or not the cost of creating such agreements and a climate will be far less in light of overall increased awareness and the results of the enormous Federal efforts over the past several years. We believe these costs will be lower, but that extensive involvement of skilled people working on a full-time basis is absolutely essential for exchange at the local or regional level. Much of this work cannot be outsourced to vendors; none of the ownership can be relegated through an appeal to Federal or State law. Exchange must be owned and very much integrated in the fabric of the institution along the lines of the cultural transitions we discussed in the Kotter planning framework.
42

What is the central lesson learned where sustainability is concerned? Return on Investment (ROI) is far easier to demonstrate if one keeps the “Investment” as low as possible. If one keeps “I” low, it is far easier to realize a net return. Our intense focus on a few measurable areas of activity and our inexpensive yet elegant model for exchange certainly seems viable for regional initiatives and scalable to larger environs. Although we demonstrate financial returns, this infrastructure should be considered “core” foundation work for far greater value than we were able to measure.
43
Chapter 6: Legal/Policy Background
Health information exchange is more about trust than technology. As a result, the project team and Memphis participants arguably spent more time addressing these concerns collectively (in person hours) than the smaller team devoted to technology and implementation.
Policies are of two types. The first type addresses the organizational policies and contracts required to bind the participants with one another and to ensure that public trust was maintained. The second type addresses the many explicit relationships that have to be defined between the Exchange and the public; these relationships are concerned with use and with privacy.
Our approach was unique in that we made heavy but focused use of legal counsel for the initial relationships forming the Exchange but relatively little use of legal counsel until the latter stages of formulation of our data sharing agreements. Where the latter were concerned, our effort began with a “sense of urgency” inculcated by our December 2004 statewide meeting on HIE. Armed with early access to the Connecting for Health Common Framework draft data-sharing agreements, a small team of eight individuals spent approximately 3 months adapting these policies to accommodate Memphis needs. Over the ensuing 6 months, the team of individuals was expanded to approximately 30. These individuals were from a wide array of roles within participating organizations. Many were on the “front lines” of care and, in essence, served as patient advocates rather than as institutional advocates. This, perhaps, is another relatively unique and controversial aspect of our approach. We did not employ “consumer advocates” but rather used compassionate caregivers as proxies for consumer preferences.
On an ancillary note, the tight and customer-focused relationship among the 30 participants was arguably the real “glue” that helped hold the project together. Executive sponsorship and top-down leadership can only go so far. The group focusing on data sharing agreements maintained and grew enthusiasm in the many months between project initiation in the summer of 2004 and widely recognizable impact in the summer of 2006.
Formation of the Exchange as a Legal Organization Our efforts to establish a legal organization began in February of 2005. The Memphis
participants circulated a memorandum of understanding (MOU) and agreed to continue their commitment to the Governor to participate in the effort. All participants signed this MOU by May 2005. The Board incorporated as the MidSouth eHealth Alliance at about that time. They submitted an application for 501(c)(3) status at about that time. The Board received 501(c)(3) status in March 2006. At that time, receiving nonprofit status was erratic across the country. CareSpark, in the northeastern part of the State, was pursuing a parallel path but did not receive notification until long after Memphis. It was our sense that by 2008 recognition of health information organizations through this mechanism was more commonplace.
Subsequent to formation, the Alliance obtained liability insurance both for its operations and for its Board. It was somewhat difficult to find coverage in 2006 because of the lack of actuarial experience in the market. Ultimately, liability coverage was found for a relatively nominal price.
Creation of Data Sharing agreements Privacy and security issues related to HIPAA and beyond were a topic of controversy and
passion during the December 2004 2-day planning workshop in Nashville. The issues were
44

contentious; emotions were high. After many months of subsequent work and study, a work group was formed and began meeting in June of 2005.
Beginning on June 14, 2005, the Privacy and Security Work Group began monthly meetings that lasting 2-3 hours. Conference calls of 1-2 hour duration were held between meetings. The work group was comprised of all of the organizations participating in the Exchange as well as individuals who were passionate about the topic but that did not represent a specific participant. At the initial meeting the following list was created and became the basis for the agenda and moving the project forward:
• Defining relationships among the organizations • Context (e.g., care settings) • Data use (TPO, 512 exceptions) • HIPAA—agreement on implications • State laws (HIV, behavioral health, correctional facilities, substance abuse) • Auditing requirements • Patient consent • Audit access and policies • Patient knowledge of data sharing and use • Patient legal rights • Access rights • Patient rights over and above legal rights In the summer of 2005, the Markle Foundation’s Connecting for Health Common
Framework on Policy had been drafted.2 The Exchange was given access to the model contracts and policies several months prior to its public release. The Model Contract and policies became the basis for the Alliance’s approach to privacy and security.
In September 2005 a small subgroup of the Privacy and Security Work Group (eight people representing six different organizations) began reviewing the Model Contract and making recommendations to the larger work group for an Alliance “Data Sharing” Agreement. As the contract was discussed and iterated the group involved in reviewing the document grew to 30+ people by the end of the year. These individuals represented all of the organizations that would eventually sign the agreement as Participants. The Alliance hired an attorney in March 2006 and in approximately 6 weeks the final contract was signed by all organizations.
Again borrowing from the Connecting for Health Common Framework on Policy,2 the Alliance began writing policies in March 2006 and completed all of the policies including internal review by all participating organizations shortly after the Data Sharing Agreement was executed.
It was and continues to be the policy of the Exchange that all patients must be notified that their data will be shared and under what terms and for what purposes. For the purpose of treatment and coordination of care, a patient can choose not to share data through the Alliance. The commitment to the patient’s right to control who sees their data was so strong, that all data that was submitted prior to April 30, 2005 was purged. All organizations began notifying patients about the Alliance in April. By the first week in May all participants could attest that all patients seen in their facilities were being notified of the policies and had been given the right to “opt out.”
45

Policy Documents An appendix to this document lists all policy documents with a brief description of each.
Over 17 formal documents were developed by the Operations Committee, approved by the Board, and put into action. A listing of the documents is as follows:
• MidSouth eHealth Alliance Fact Sheet • E1: Policy on Authorized User Setup. • E3: Terms of Use. • E2: User Access request form. • E4: User Setup Sheet. • E5: Vanderbilt Confidentiality Agreement. • G01: Policy on Policies. • G02: Coordination of Alliance and Participant Policies. • G03: Privacy Policy. • G04: Conditions to New Data Use • G05: Roles and Responsibilities • G06: User Access. • G07: Auditing and Reporting. • G08: Mitigation. • G10: System Demo with Patient Info. • G11: Conditions for Trusted Network Access.
Legal and Policy: Timeline and Dates
November 2004: Privacy and Security Work Group participates in 2-day planning session and identifies concerns and issues to be addressed.
• May 2005–April 2006: Participants send data to Vanderbilt to “build” the system. • June 14, 2005: Privacy and Security Work Group and revises list of issues, concerns, and
questions. This work group continues to meet face to face once a month with conference calls in between.
• September 15, 2005: A draft of the Markle Foundation Connecting for Health Policy Framework and Model Contracts is released to Memphis. A small group of eight people representing six different organizations start meeting to develop a set of data sharing agreements following the Connecting for Health framework.
• December 31, 2005: The group working on the data sharing agreements has grown to 30+ and includes all organizations that will sign the contracts. A redline is completed and sent to each organization for additional internal review.
• March 8, 2006: MidSouth eHealth Alliance is 501 (c)(3) status by the IRS. • March 15, 2006: The Alliance hires an attorney to draft the final version of the contract
and present it to each Participant’s legal counsel. • March 23, 2008: The Privacy and Security Work Group meets bi-weekly for 4 to 8 hours
at a time to complete the policies for the Alliance.
46

• April 2006: All Participants begin notifying patients that their data may be shared with through the Alliance. Procedures are in place at each Participant that is submitting data to allow a patient to “opt out.”
• April 2006: Because there was no method to notify patients whose data were represented in the database—all data published to the Alliance prior to the Participants’ official notification data was purged.
• May 3, 2006: Began building patient data in the Alliance system with the assurance that all patients represented in the databases had been notified their data would be shared including for what purpose and given the opportunity to “opt out.”
• May 10, 2006: Policies are approved by the Board. All Participants are “registered” and have signed the Participation Agreement.
• May 26, 2006: System was accessed for the first time by users at the Regional Medical Center (The MED)
Conclusions We underestimated the time and effort required for creating data-sharing policies—and we
also underestimated its impact in binding the community together. The central question for future efforts is whether or not the cost of creating such agreements and a climate will be far less in light of overall increased awareness and the results of the enormous Federal efforts over the past several years. We believe these costs will be lower, but that both active participation “on the ground” and ongoing standing committees and full-time oversight is absolutely essential for exchange at the local or regional level. Policies and public expectations will evolve over time. Although it is possible that “point-to-point” communications will change the form in which these discussion and policies take place, they are, nonetheless, essential.
47

Chapter 7: Technical Infrastructure Four Approaches to Exchange
In recent years, four specific approaches have emerged to address patient-centered information access.
Consolidations. The first model attempts to consolidate all care into a single care delivery and financing system. This model—prevalent in many European countries—is to some degree extant at Kaiser-Permanente and other integrated care and financing systems. Such models present “one-stop shopping” for managing health information, coordinating care, communicating with providers and support groups, and ensuring both payment and accountability. Health plans and some safety net coalitions can arguably pursue this model. However, most care is not delivered within such restricted networks but rather across a small number of organizations that do not benefit from a common care plan and supporting information management systems.
• Point-to-point Internet-based services. The second model is based on a series of services, each contributing specific elements to an EHR or related system. Such services include e-prescribing and prescription drug history services, laboratory data services, master patient index systems, record locator services, and disease registries. In such a model, services are brought to the point of care as needed without a central coordinating intermediary. NHIN Direct is an example of such a model.
• Consumer-centered approaches. The third model focuses on the management of care through personal control and access to medical data. This approach, embodied both in personal health record systems and “medical banking” models, circumvents many thorny access and privacy concerns by ensuring that consumers have primary control over their own data, and it gives individuals the means to complement traditional medical data with specific detailed or highly personal interpretations they find meaningful in promoting their own health. In this model, the individual gains access to all data required for his or her care and controls its access or use either directly or through proxies.
• Market-based models based on legislation and policies. The fourth model is based on the role of State government and its potential roles in light of HIECH funding. State government may choose to coordinate exchange rather than provide new services. According to the Department of Human Services (July 2010), “there are no requirements mandating that States create stand-alone entities….. The primary focus of sustainability should be on sustaining information sharing efforts, and not necessarily the persistence of government-sponsored health information exchange entities.”4 In this model State government leverages its investments in and control of Medicaid and public health services to set a foundation for exchange in concordance with other public- and private sector initiatives. States ensure that all parties requiring exchange have access to these services. States can authorize levies to support other groups to support exchange and they can mandate participation through regional or statewide structures.
• Traditional Regional Health Information Organizations. The fifth model attempts to make available on an incremental and local basis comprehensive patient-centered information access where care is needed. This model—often called a health information exchange—differs from others in that the collection of health information exchange services commonly is managed through a designated legal entity and data may be
48

accessed from a highly secure set of services that provides the performance and simplicity.
In 2004, the only model that we saw as viable was to create a Regional Health Information Organization based on a technology that provided the benefits of a centralized repository with the assurances of a decentralized system. In 1991, Vanderbilt University Medical Center (VUMC) specified an enterprise information architecture to separate the management of corporate information assets, such as data definitions, business rules and patient data, from the transaction processing systems that support operations within the facilities that make up the medical center and support its affiliated practices. Through this architectural approach, VUMC had by 2004 been able to evolve to an electronic patient chart, that now includes over 1 million patients, over 39 million tagged documents, over 300 GB of scanned images and PDFs, and direct links to images in the picture archiving and communication systems (PACS) repository.
The purpose of the VUMC enterprise information architecture is to decouple the management of content from the applications or tools that provide functionality for users. A key tenet of the architecture is to represent meaningful VUMC content outside of the various application systems, and to align the applications by importing and using this externally defined content in a standard manner throughout. Information, such as metadata and organizational knowledge that might otherwise be entered into application-specific master files, is externalized in generalized tables. This information is structured to make its meaning explicit and accessible; for example: external tables store the identity of medical center personnel and a mapping to their roles; clinically meaningful orders and results are stored externally, with mapping to the administrative equivalents in individual ancillary systems; and, the set of clinical concepts that can be measured in the laboratory is stored externally, with mappings to the various billing codes associated with each concept in ancillary systems. Certain applications use these externalized tables directly. It is often necessary to manually copy the information into the profiles of legacy systems. In either case, each new application reuses prior definitional work. Only newly required information needs to be added to the generalized tables, and the relation of such new information to existing information can be made explicit as it is added. This approach saves implementation time while pre-aligning meaning across otherwise disparate applications.
Similarly, data that are captured or managed by an application, but which are used by more than one application, are externalized into generalized repositories. A set of disparate repositories exploits the strengths of their respective technologies. For example, highly structured, coded clinical data is represented in relational tables, and in contrast, an indexed text repository, organized according to a document paradigm, provides a single logical source for all clinical reports about a patient, be they binary data, images, or text. Some reports are stored in this repository as symbolic links (e.g., links from textual radiology reports to their corresponding images in the PACS while others are copied directly from primary sources and stored directly in the repository, as in the case of EKGs.
The Vanderbilt indexed text repository is a nonrelational, hyper-indexed database implemented in Perl on a distributed processing system. The lowest tier, known as the Star layer, implements distributed processing, queue-based transaction processing, process control and monitoring, and inter-process communication. The database layer, known as StarChart, implements permanent data storage, automatic replication across servers in different geographical locations, and conversion of clinical data from all sources into a common internal representation. Common views such as the assembly of documents and data related to a patient into an easily read electronic chart are cached to reduce search demands. The application layer
49

implements transaction and business logic, such as the handling of corrections and updates in stored documents, and the handling of different evolving stages of individual data items (from pending to preliminary to final to corrected report, for example). This layer is shared by all applications that use the repository, and hence provides the single place where transaction and business logic is maintained and applied. It provides request broker functionality to support application interface services, report distribution services, and a number of Web-based interfaces.
One of the VUMC repositories is the Enterprise Patient Index, a table of identifying numbers (e.g., medical record number, social security number, etc.), a table of names (e.g., current, maiden, married, etc.) and linkages of those numbers and names to instantiate people. As mistakes are made and corrected, linkages are updated. An SQL query is all that is needed to assemble all record “fragments” for a patient. This approach avoids the complicated processes related to reconciling and merging records characteristic of classic enterprise master patient index systems. This technology, like the rest of the system, was adapted for use by the Exchange. Although we pursued more elegant probabilistic matching techniques through our collaboration with Tennessee Tech University (Talbert and team), we found no improvement in performance over the deterministic approach adapted from VUMC.
Web based interfaces to StarChart provided access to the electronic patient chart and support for related workflow. Vanderbilt’s Web-based interfaces were created by reducing the Vanderbilt StarChart interface to the minimal requirements necessary to perform the task of retrieval in clinical settings. Two-factor authentication through SecureID technologies was mandatory for initial use, but in isolated emergency department (ED) settings, the system would remain “live” for a short period to obviate the need for repeated logins.
Although Vanderbilt’s EHR efforts had been focused on one geographically distributed integrated delivery system, we believed that the general approach would be scalable to support regional data sharing. The evidence makes this hypothesis unassailable. We created an entirely new group, the Regional Informatics Group led by Mark Frisse, to implement the project. This group heavily leveraged the experience and successful Vanderbilt team.
Vanderbilt’s Implementation in Memphis The Memphis implementation was largely a collection of StarChart databases—one for each
organizational entity. These were called “vaults” and essentially were “owned” by the participating facility in that data could be retracted until data were used by another entity. For example, after a testing period data from individual institutions were “flushed” so that the system could begin on the “go-live” date in which patient consent was elicited.
Data were transmitted from each participant through SSL to its own logically separate “vault.” These data are maintained in their original format and technically remain under the control of the participant. Once data are used by another site, records of use and the values resident at that time are retained in audit logs. Data are also tagged in according to type and source so that they can be accessed in a uniform way across disparate sources. The clinical database is modeled after the system in use daily at Vanderbilt Medical Center. Admissions, discharge, and transfer (ADT) data, as well as some other demographic and claims data elements are stored in a separate relational database. In essence, the system has the control properties of a distributed model with the performance and flexibility of a centralized model.
50
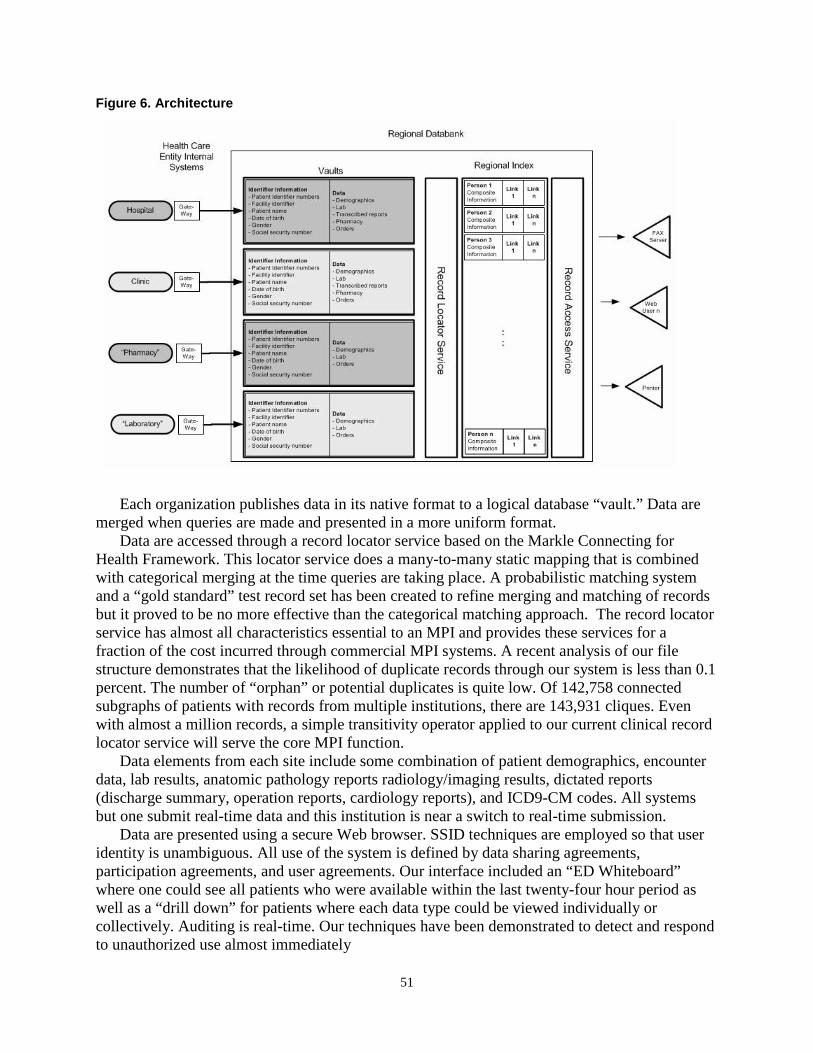
Figure 6. Architecture
Each organization publishes data in its native format to a logical database “vault.” Data are
merged when queries are made and presented in a more uniform format. Data are accessed through a record locator service based on the Markle Connecting for
Health Framework. This locator service does a many-to-many static mapping that is combined with categorical merging at the time queries are taking place. A probabilistic matching system and a “gold standard” test record set has been created to refine merging and matching of records but it proved to be no more effective than the categorical matching approach. The record locator service has almost all characteristics essential to an MPI and provides these services for a fraction of the cost incurred through commercial MPI systems. A recent analysis of our file structure demonstrates that the likelihood of duplicate records through our system is less than 0.1 percent. The number of “orphan” or potential duplicates is quite low. Of 142,758 connected subgraphs of patients with records from multiple institutions, there are 143,931 cliques. Even with almost a million records, a simple transitivity operator applied to our current clinical record locator service will serve the core MPI function.
Data elements from each site include some combination of patient demographics, encounter data, lab results, anatomic pathology reports radiology/imaging results, dictated reports (discharge summary, operation reports, cardiology reports), and ICD9-CM codes. All systems but one submit real-time data and this institution is near a switch to real-time submission.
Data are presented using a secure Web browser. SSID techniques are employed so that user identity is unambiguous. All use of the system is defined by data sharing agreements, participation agreements, and user agreements. Our interface included an “ED Whiteboard” where one could see all patients who were available within the last twenty-four hour period as well as a “drill down” for patients where each data type could be viewed individually or collectively. Auditing is real-time. Our techniques have been demonstrated to detect and respond to unauthorized use almost immediately
51

Figure 7. Example of the interface used in clinical settings
The left side of the screen shows both means by which a patient can be located as well as
additional criteria that can restrict data to specific institutional sources. The top of the data screen shows some representative tabs that allowed for selective display of elements. The bottom shows a tabular list of blood count data from across institutions. The “pop out” graph in the upper right corner shows a draft of these elements highlighting the means by which data from different sources could be combined. These lab data are represented in LOINC. In reality, lab data alone were not sought for frequently and the “pop up” graph was rarely used.
Standards We believe a key attribute of our success was in our decision to take data in whatever format
it was available rather than force compliance with standards. In taking this approach, we removed many barriers to entry and allowed busy CIOs and their staff to focus only on the quality of data transmitted and used. We were then able to “tag” data elements with high-level labels and context. We retained at all times both the original data element, its association with a unique individual, and its source. If there was ambiguity, the data were not incorporated into the vault repository.
This approach placed a great burden on the Vanderbilt team. They had to create parsers for every data feed (over 30 parsers), ensure the integrity of these parsers as minor changes were made from contributing organizations, and ensure that data providers could access the data easily for quality assurance. These changes often were due to subtle changes to systems, but in other situations, they involved accommodating complete replacement of a laboratory system and, in another instance, a major upgrade to clinical systems capabilities.
52

Among the data elements we accommodated were the following:
• HL7 (multiple versions) • XML • ICD-9 • Delimited text files
We also developed familiarity with LOINC, NDC, and RxNORM in the course of our work
with laboratory data and medication histories. Some data—such as key outbound messages—are represented in LOINC and vastly improve display, comparison, and potential for alerts and other features consistent with interoperable systems. Figure 8. Example LOINC Mapping Table for White Blood Cell Count
This figure shows how various inbound messages containing white blood cell count
measurements were mapped to LOINC as they were retrieved and displayed. The following data standards were used by data contributors to represent some of the
messages sent to Exchange vaults: • Patient demographic data • HL7 message types: A01 A04 A08 A28 A31 A35 • Laboratory test results • Radiology results • Cardiac Care treatment/results • Pharmacy orders and admin records • Diagnosis codes • Institutional codes and Professional billing codes • Encounter data: Date of Service, Reason for visit, location, Encounter Type • Transcribed reports such as Discharge Summaries, Cardiac reports, History and
Physicals, and Operating Notes • Allergies (in test) • Medication lists (claims from a managed care organization, medication histories from a
NextGen ASP, and medication histories through SureScripts via Indiana Health Information Exchange [IHIE])
53
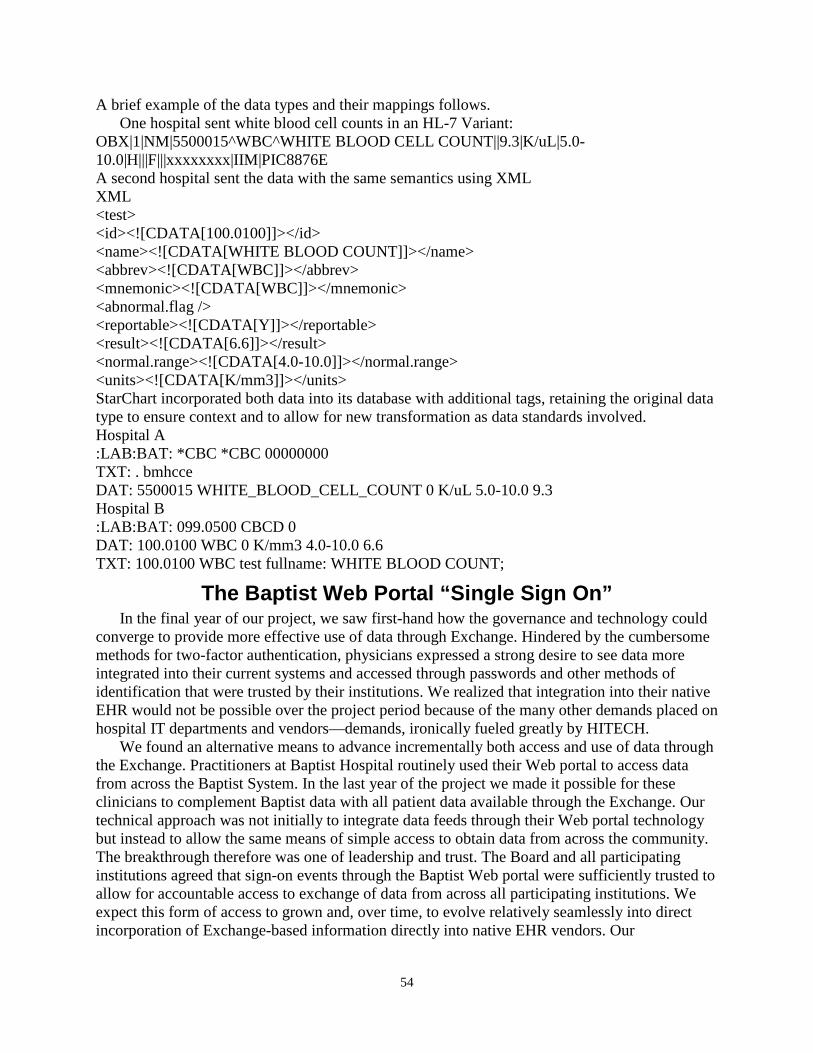
A brief example of the data types and their mappings follows. One hospital sent white blood cell counts in an HL-7 Variant:
OBX|1|NM|5500015^WBC^WHITE BLOOD CELL COUNT||9.3|K/uL|5.0-10.0|H|||F|||xxxxxxxx|IIM|PIC8876E A second hospital sent the data with the same semantics using XML XML <test> <id><![CDATA[100.0100]]></id> <name><![CDATA[WHITE BLOOD COUNT]]></name> <abbrev><![CDATA[WBC]]></abbrev> <mnemonic><![CDATA[WBC]]></mnemonic> <abnormal.flag /> <reportable><![CDATA[Y]]></reportable> <result><![CDATA[6.6]]></result> <normal.range><![CDATA[4.0-10.0]]></normal.range> <units><![CDATA[K/mm3]]></units> StarChart incorporated both data into its database with additional tags, retaining the original data type to ensure context and to allow for new transformation as data standards involved. Hospital A :LAB:BAT: *CBC *CBC 00000000 TXT: . bmhcce DAT: 5500015 WHITE_BLOOD_CELL_COUNT 0 K/uL 5.0-10.0 9.3 Hospital B :LAB:BAT: 099.0500 CBCD 0 DAT: 100.0100 WBC 0 K/mm3 4.0-10.0 6.6 TXT: 100.0100 WBC test fullname: WHITE BLOOD COUNT;
The Baptist Web Portal “Single Sign On” In the final year of our project, we saw first-hand how the governance and technology could
converge to provide more effective use of data through Exchange. Hindered by the cumbersome methods for two-factor authentication, physicians expressed a strong desire to see data more integrated into their current systems and accessed through passwords and other methods of identification that were trusted by their institutions. We realized that integration into their native EHR would not be possible over the project period because of the many other demands placed on hospital IT departments and vendors—demands, ironically fueled greatly by HITECH.
We found an alternative means to advance incrementally both access and use of data through the Exchange. Practitioners at Baptist Hospital routinely used their Web portal to access data from across the Baptist System. In the last year of the project we made it possible for these clinicians to complement Baptist data with all patient data available through the Exchange. Our technical approach was not initially to integrate data feeds through their Web portal technology but instead to allow the same means of simple access to obtain data from across the community. The breakthrough therefore was one of leadership and trust. The Board and all participating institutions agreed that sign-on events through the Baptist Web portal were sufficiently trusted to allow for accountable access to exchange of data from across all participating institutions. We expect this form of access to grown and, over time, to evolve relatively seamlessly into direct incorporation of Exchange-based information directly into native EHR vendors. Our
54

recommendation would be to maintain a clear source of the original information much as native EHRs currently maintain a source for labs or correspondence obtained from other organizations.
Transition of the Infrastructure to a Commercial Vendor Striving for a sustainable stand-alone infrastructure completely under Memphis, the
Vanderbilt research team and the Memphis Board understood that a secure, independent, commercial vendor was required. Security and clear responsibility were paramount for the HIE to expand beyond the contract participants and provide a path for long-term sustainability. Supporting and hosting data exchange from within the confines of the Vanderbilt architecture for an indefinite period was neither politically nor financially sustainable.
This was accomplished by migrating the system to that of a company that licensed the Vanderbilt software: Informatics Corporation of America (ICA). ICA enhanced the community-based database architecture, incorporated bi-directional interoperability functions and made significant changes to the user interface and functional components.
The transition took place over a 2-year period. Among the activities were creating the selection criteria, communication, contracting, transition management, technology migration, governance, communication, and training. Each was associated with specific milestones, plans, role assignments, and assessments.
The decision to migrate to ICA was not made in haste; other candidates were considered. Selection criteria were generic at the highest level but heavily influenced both by the need to maintain momentum, sustain and grow the Exchange and support the ongoing research and evaluation efforts. Among the criteria most important were the following:
• Identifying a financially stable vendor whose primary obligation is to deliver a full-range
of HIE services • Ensuring that costs were low through the ongoing research contract period so that most
resources could be devoted towards growth and evaluation • Assurances that the architecture would not diverge significantly from the operational
model so that attention could remain focused on the research activities • Consideration that over time exchange models will evolve and that either the selected
vendor or a new vendor could support new needs at the end of the AHRQ contract period.
The Memphis Board and Exchange users had to maintain trust in the Vanderbilt team during the migration while also being assured that the new vendor could maintain or improve both service levels and features over and above those delivered over many years by the Vanderbilt team and the Vanderbilt technologies.
The migration would require deep cooperation from the Memphis-based Operations Committee responsible for privacy, security, and other policies. This group is most heavily involved in feature development, usage, and policies. They had to be persuaded that the transition would improve care and support stable, long-term growth.
A transition team from Vanderbilt and ICA collaborated closely and met weekly to review the status of the project. Developers collaborated daily and decisions were made on which of the two teams would add new functionality in light of the expected transition schedule. The Memphis Board and funding agencies were informed on a monthly basis. ICA performed a comprehensive security audit to reassure Vanderbilt, the State, and the Memphis leadership.
55
Transition occurred in phases. First the data repository was migrated to a secure, stand-alone platform managed by ICA running the ICA version of the system. This initial move accomplished a key objective of the transition (moving to a secure, independently supported platform) while maintaining momentum and minimizing impact to HIE participants. Migration of the record locator service closely followed the transition to the new data repository. Data interface migration occurred sequentially. Introduction of the new user interface and additional functional components was the last transition phase. Data quality assurance processes were required throughout the transition.
Both the Vanderbilt Exchange in Memphis and the ICA architecture made different design decisions over the course of their existence. These decisions had to be reconciled. Parsers had to be modified and a different approach to the record locator service was employed so that the Memphis system would be
Transition from the Vanderbilt user interface to the ICA user interface was given close attention. The original Vanderbilt user interface is a simple, secure, passive interface. The ICA browser has the capability for secure messaging and clinical decision support, and other features desirable both for care and to support Meaningful User HITECH provisions. Security and access mechanisms were also re-examined during this period. The Vanderbilt system was evolving in Memphis from a pure two-factor authentication approach to single sign-on pilot projects within hospitals. The entire technical policies had to be re-examined by all participants. The data sharing agreements and access policies were not affected other than changes to language about responsible parties, roles, and obligations.
Roles and identities are particularly challenging through a period of transition. The Memphis community and local management had to establish stronger relationships with the vendor even during early phases when the bulk of the effort remained the responsibility of the Vanderbilt Team. The Vanderbilt developers and researchers had to maintain their system as it was phased out while at the same time pursuing new research and administrative activities.
The migration has been successful. The Exchange today continues operations independent of a Vanderbilt role. All contracting is done through the MidSouth eHealth Alliance Board directly with vendors and other parties.
A Medication History Service In the fall of 2007, we proposed to extend the regional demonstration contract in order to
collaborate with Regenstrief / IHIE to develop a medication history hub for use within the Exchange. We believed this effort would serve a model for interoperability for other initiatives. We called this effort the ("Medication Hub Project").5
The medication hub work required us to transmit queries from our Exchange through the IHIE Exchange. The latter Exchange was to serve as a gateway to RxHub and SureScripts. Results returned from these queries would be integrated and presented through our Exchange's secure Web browser. (Outside of this contract, we proposed and implemented an extension of this effort to incorporate the prescribed medication histories from the NextGen systems used by the Loop Clinics and several pediatric clinics.
Late in 2007, AHRQ commissioned Vanderbilt to extend the Exchange’s functionality in order to explore the barriers to and benefits of incorporating a prescription medication history into clinical settings where clinicians did not have access to e-prescribing systems but did have access to the Exchange. Recognizing the challenges and costs encountered in creating a de novo medication history service contract from SureScripts, Vanderbilt chose instead to create an
56

interoperable system with a robust service already in use by the Regenstrief Institute and IHIE). Regenstrief was allowed contractually to expand its services to support Memphis on a trial basis. Even with this expedited process, a final contract to allow medication histories was not signed until October 28, 2008.
To establish the service, we had to extend Vanderbilt architecture to transmit necessary demographic information to Regenstrief. Because demographic information on a single individual at times differed because of data entry errors or name changes, choices had to be made on which demographic record to submit. Figure 9. Data flows
Data flow among Memphis clinical systems, the Memphis HIE, IHIE, and prescription
history sources. With the exception of medication histories obtained from a local EHR system, all prescription medication history information was received through IHIE.
Because prescription medication history transactions incurred a charge from SureScripts, the Vanderbilt technologies in Memphis incorporated a query cache of queries requested and results obtained within the past 13 hours so that one request would not be made repeatedly and the service charged multiple times. Generally, requests to Regenstrief are based on the demographic information recorded by the institution in which the patient was currently seeking care. The HL7 messages are sent to Regenstrief are then sent to SureScripts. The SureScripts system in turn routes requests to record locator systems resident in member PBMs, pharmacies, and SureScripts core services.
57

Figure 10. Display of the prescription drug history
The initial drug history display was simplistic, but integrated data from multiple sources. Most effort was directed towards data integrity and not towards the many areas essential to knowledge management.
Response messages were of three message types: (1) “no patient identified”; (2) “patient identified but no prescription history available”; and (3) “prescription history available.” When a history was available it was returned to Regenstrief and returned to the Exchange. Although the Regenstrief medication hub had the capability to link medication histories to RxNorm and to resolve some duplicates, the Vanderbilt architecture did not take advantage of these services. Data were incorporated into displays similar to those used at the Vanderbilt Medical center (Figure 10). Some data sorting and associating features were available but comprehensive integration based on RxNorm and other lexicons was not attempted during the trial period.
Later, data recorded in medication histories recorded in the NextGen systems used by many of Memphis’ large clinics were also incorporated into the service.
58

Chapter 8: Evaluation and Impact Developing the Evaluation Plan
AHRQ required Vanderbilt to undertake in the fourth and fifth year of the program a “rigorous evaluation for the data exchange program” to “assure that measurable improvements in the quality, safety, efficiency and/or effectiveness of care have resulted from the proposed data sharing and interoperability measures.” The evaluation was to assess the “nature and extent of the healthcare data exchange”6 and its impact on safety and quality, and outcomes. Organizational benefits could include improvements in effectiveness, enhanced communication, increased satisfaction among stakeholders, and risk mitigation. Provider benefits measurement could care process transformation, improved patient outcomes, improvements in safety and quality, and more effective monitoring of health conditions. Financial benefits could include cost reduction, revenue enhancement and productivity gains. Cost-savings resulting from redundant test ordering and greater use of lower cost medications were emphasized. The contract also required a delineation of clinical-exchange costs associated with state-based clinical data exchange including equipment, personnel, training, hardware, software, networks, use of clinical data standards, or other costs incurred to realized project objectives.
The evaluation was to provide new knowledge and lessons learned about financial, technical, organizational, personnel, cultural and procedural barriers; means to overcome these barriers were to be described or proposed. A more generalized description of these issues that would be applicable to others was encouraged.
Because of the broad nature of these objectives, specific objectives, processes, and techniques were to be submitted in proposal form to AHRQ and acted upon. Our proposal included approaches to study what we felt to be the most important and realistic aspirations. Our evaluation plan was submitted within 18 months of the award and approved prior to the 36 month milestone. After additional project planning, an operational evaluation plan was presented to and approved by the Exchange Board on August 9, 2006—20 months after the date of award and 2 months after the system was first used in patient care settings.
The Initial Evaluation Plan The project team recognized that a successful, sustainable, and worthwhile data exchange program should improve health care in the region. From our many interviews and discussions, we concluded that the Memphis stakeholders held the following common beliefs:
• Incomplete information increases admission rate and ED LOS • Poor communication impacts ED efficiency • Less patient data at the point of care impacts the rate of test ordering • Less patient data at the point of care impacts clinical outcomes
In concert with our Memphis inquiries, our own analyses of the literature and our claims data analysis suggested that data exchange could result in significant overall savings from reduced inpatient hospitalizations, improved distribution of ED encounter summaries, reductions in duplicate laboratory and radiology tests, and reductions in ED expenditures. These considerations served as the basis for our initial evaluation strategy.7
As a result of these findings, our initial evaluation hypotheses were as follows: In light of our extensive planning and analysis, our initial evaluation hypotheses were as follows:
59

• HIE would improve the efficiency of care in all care settings, as manifest by o Lower rates of testing (expenses per encounter) o Lower rates of admission o Shorter time spent per encounter in the ED
• HIE would change the case mix of the ED, as demonstrated by o Decreased repeat ED visits over 30 days o Decreased poly-pharmacy and chronic pain patients
• HIE would alter the workflow of the environments in which it used, by changing o Time spent seeking information o Time spent using computer technology during patient care o Who is responsible for information seeking
• HIE would improve the outcomes of specific clinical conditions (to be determined) We further proposed the following metrics (Table 6): Table 6. Evaluation Plan Metrics
Measure Timeframe Design Analysis Plan Power/Sample Size
ED Demographics T—1 month Site-based survey Values will be used as co-variates
One survey per site.
Usability T + 1 month, 6 months, 1 year post implementation
Survey, administered to pre-defined cohort at each site. If necessary, survey results will target focus group meetings for clarification. HELP desk use logs.
Scores for each of six axes, used formatively during implementation, and later as a co-variate for use, disease-specific outcomes
30% sample with replacement until cohort is established. Expect 15 participants per site.
Use (functional, Annually Audit data (logins, access duration, data elements viewed, patients viewed)
Reported / month , averaged over the year.
All sites involved with data exchange
Functional utility Continuous reporting
Feedback cards per site
Descriptive N/A
Testing frequency Annually starting year 3
Audit data Reported / site/ 100 patients
N/A
Costs Annually Logging of costs Annual cost calculated deterministically
N/A
Time per encounter Quarterly after implementation
internal audits of data in exchange
N/A
Admission/re-admission rates
Quarterly Claims data Reported per site per month
ED repeat visits Quarterly Audit data Reported per site per month
ED Casemix Quarterly Audit data Reported per site per month
Workflow efficiency 1 year post implementation (tool development underway)
Direct observation + survey
descriptive All sites involved with data exchange
60
Our approach included a study of costs and usability as well as benefits. • Overall costs (personnel, training, equipment, meetings, software development,
customizations) • System usability • System use • System utility
We placed our work in the context of many other early efforts to evaluate HIE. In the earlier years, we worked particularly closely with colleagues from New York to develop common approaches.8 We placed heavy emphasis on use, usability/workflow, and financial impact.
System Use We assessed usage trends and patterns for the Exchange using multiple sources of
quantitative data. We extracted login and logout data from audit logs. We also determined which data were reviewed by which providers using data extracted from exchange logs and by linking specific data elements with data access logs. The available usage data combined metrics from ambulatory clinic organizations, rather than reporting each ambulatory site separately. We excluded from this analysis any review of registration data (which provide a dashboard of patients in the setting and whether they have data from other participating exchange sites) because of the challenges associated with understanding how this screen was used for decision making.
Monthly usage data included the number of patient visits for each clinic site, overall amount of use per site, the number of people with access at each site, roles of each user, and overall number of uses per user.
One year after achieving a consistent system usage pattern across sites, we collected data from system log files to characterize patterns of use. These data recorded access to demographic information, encounter information, clinical information, claims information, and other views of clinical or administrative data. In addition to noting how often each primary section was reviewed, we examined which components were of value in two populations, emergency departments (EDs), and ambulatory clinics.
We also collected feedback from system users on comment cards and using a feedback system integrated into the software over a 1-month period approximately 1 year after the system was in stable use. We received 569 total responses, which we reviewed and categorized.9
Findings Exchange usage increased uniformly as the amount of data available through the system
increased, stabilizing after approximately 12 months. At that juncture, data from the Exchange were accessed on average in 6.7 percent of patient encounters across all participating sites. Usage rates varied among sites, ranging from < 1 percent to 16 percent. Usage increased for return visits (defined as a previous ED or clinic visit within 30 days.)
61

Table 7. Summary of system usage—all sites Site Visits Reviewed (%) Return (30 d) visits Reviewed (%) A 3115 487 (16) 451 123 (27) B 4089 454 (11) 757 119 (15) C 4244 94 (2) 540 27 (5) D 3646 66 (2) 536 32 (5) E 3280 2 (0) 428 1 (0) F 3445 115 (3) 413 35 (8) G 586 0 (0) 50 0 (0) H 1689 159 (9) 359 74 (20) I 497 0 (0) 79 3 (3) J 1528 6 (0) 102 0 (0) K 4241 545 (13) 673 184 (27) L 4420 424 (10) 270 66 (24) M 1329 6 (0) 168 3 (1) N 2319 283 (12) 282 78 (27) Clinic 1 8553 584 (7) 1551 313 (20) Clinic 2 4220 161 (4) 660 100 (15)
Usage rates varied among sites, ranging from < 1 percent to 16 percent. The usage rate
differed significantly between ED sites and clinic sites (6.9 versus 5.8 percent, z = 4.098, p < 0.001.) Specific characteristics of the patient encounter also impacted Exchange usage, with increased use for cases where a previous visit or hospital discharge occurred within 30 days. These usage patterns occurred in both ambulatory and ED environments. Usage was relatively stable over time, although sites fluctuated; one great difference was observed when a major hospital transitioned from print summaries to Web access. (Details and data have been submitted for publication.) Figure 11. Usage
Usage stabilized after approximately 12 months at a rate of 6.7 percent of patient encounters across all participating sites. HIE data were accessed in 7.1 percent of ED visits.
System usage varied by site and directly related to roles of people with Exchange access and site policies governing use. For example, during initial system implementation at one hospital, the site gave access to personnel other than physicians. During patient check-in at this site, the registrar searched the Exchange system for each patient and printed out a sheet showing if any records were available. Nurses, nurse practitioners, and physicians could then choose to look
62

patients up based on this information. As more functionality became available, this site determined that nonproviders no longer needed access; use shifted to nurses, nurse practitioners, and physicians, radically decreasing use at this site.
User feedback gathered through surveys identified multiple drivers for system use, including: issues with patient-provider communication; patient-disclosed visits to other sites; concerns about patient’s willingness to share information; following up on referrals; medication reconciliation; and identifying the preferred site of care. Table 8. Reasons for Use
Reason for Exchange Use Responses (n = 569)
Allowed a followup visit to be scheduled faster 15
Allowed this patient to be seen faster 22
Avoided an admission 11
Avoided communication to obtain info (phone, email, etc.) 46
Changed treatment plan 18
Detected a public health risk 3
Easy to use 121
Hard to use 1
I did not find what I needed for this case 14
Information is not reliable 1
It helped to have a comparison lab value from previous visit 36
It helped to understand a social component of the history 19
Missing information 28
Other comment 33
Prevented repeat test or procedure 73
Provided additional history 107
Provided fast access to referral summaries 7
Provided health maintenance info (flu, tetanus, screening) 12
Takes too long to review 1
The system is too slow 1
Users provided significant feedback at the point of care regarding their reasons for accessing the Exchange data.
Usability The specific aim of this task was to assess trends in usability of a Web-based tool for clinical
data review. To accomplish this aim, the research team purchased a site license to use the Questionnaire for User Interface Satisfaction, developed by Norman and colleagues at the University of Maryland’s Human Computer Interaction Laboratory. Subscales from this tool that addressed usability dimensions not as relevant to this project (training, user manuals) were removed, and additional dimensions based on an initial review of the Exchange user interface (addressing searching for patients and scrolling through results) were added, and then pilot tested for face and content validity in the Vanderbilt Emergency Department.
63

The study was conducted using faculty and staff from the following clinical sites in the southwest Tennessee region:
• Methodist University Hospital • Baptist Memorial Hospital • The Regional Medical Center • Methodist Hospital • Methodist LeBonheur Hospital • Other sites as they are included as active participants Each of these sites has agreed to participate in the data-exchange project and in this usability
assessment. For each site, we defined an initial cohort of users who would provide usability data. Using
our access logs, we emailed a request to each of these people asking them to participate in a usability study that will involve completing a usability survey at least three times each year. Each user replied with their willingness to participate. Once this cohort was defined, each member of the usability cohort was assigned a study ID. Each study ID was linked to a mailing address, to which surveys were mailed. Each survey was distributed with a sheet of paper that identifies its recipient by study ID. The sheet was removed before analysis. This allowed us to send additional surveys to nonrespondents while at the same time protecting the identity of the cohort member. We distribute a maximum of three surveys to each cohort member during each phase of the usability assessment.
Because usability is related to use, and use in turn is related to other factors, we asked each site’s physician and nursing directors to complete two brief questionnaires designed to assess the site’s readiness for health care information technology and to gather site-specific demographic data important for subsequent analyses. These data were collected at the beginning of the study only.
A total of 345 health care professionals (including physicians, nurse practitioners, registered nurses, physician’s assistants and other medical staff) from 12 of the participating facilities were initially contacted in May of 2009 via email to inform candidates of the study. A total of 76 candidates could not be located (i.e., workplace relocation, invalid email address) and were excluded. Investigators disseminated periodic emails to the remaining 269 prospective participants during the period between June and November of 2009 to remind participants about the survey. Recruitment efforts ceased at the end of the 6 months when our sample was large enough to achieve sufficient statistical power.
Out of the 237 surveys that were distributed, we received 165 responses yielding an overall response rate of 70 percent. Three surveys were excluded because critical data were missing. Of the remaining 162 completed surveys, 151 respondents identified themselves as system users and 11 identified themselves as nonusers.
To evaluate the system, we used selected items from the Questionnaire for User Interaction Satisfaction (QUIS 7.0), a validated survey instrument that assesses the user’s perception of technological systems and tools. In the first section of the survey, we collected information about the respondent’s demographics (e.g., participant’s age, professional role, gender) and duration and frequency of system usage. The second part of the survey included items to assess the respondent’s familiarity with technology. The final part of the survey collected users’ perceptions about aspects of the system across the following six scales: Overall Reactions,
64

Screen, Terminology and System Information, Learning, System Capabilities, System Functionality. An additional Trust scale was developed by one of the coauthors (KBJ) and two other study researchers (CD and CMC) and was included in the survey. Subscale items in the Trust scale were validated beforehand by other members of the study’s evaluation team. Responses to the items in each scale, except Trust, were collected on an ordinance scale from 1 to 9 anchored by a positive term on the right end and the opposite negative term on the left end. The Trust items were Likert items scaled from 1 to 5 with verbal descriptions for each level: 1=strongly disagree, 2=disagree, 3=neutral, 4=agree, 5=strongly agree. In addition to the numeric response for each survey item, participants were also given the option to leave comments in each section.
Findings Although all aspects of Exchange usability were scored positively, some aspects were scored
even more favorably than others. With regards to Overall Reactions, the system received overall highest scores for information contribution (51 out of 151 users rated the system a 9 out of 9 on the subscale “unhelpful-informative”). Similarly, most users felt that characters on the computer screen are “easy to read” (47/151); 38 out of 151 users felt that the use of terminology throughout the system is “consistent” (Terminology and System Information); 42 out of 151 users felt that learning to operate the system is “easy” (Learning); and 44 out of 151 users felt that the log-on process is “easy” (System Capabilities).
A total of 98 comments were collected from the survey for the QUIS scales and Trust scale (number of comments per scale is indicated in parentheses): Overall Reactions (29), Screen (13), Terminology & System Information (6), Learning (10), System Capabilities (7), System Functionality (21), and Trust (12).
Most respondents believed that the system was informative; characters on the computer screen are easy to read, terminology used throughout the system is consistent, learning to operate the system is easy, and the log-on process is easy. We found that the average time per week that a user accesses the system is predictive of overall reactions towards the system and other dimensions of usability such as the ability to learn how to use the system, and the system’s capabilities and functionality. The duration of time that a user has had access to the system is negatively predictive of learning-related aspects of the system. This is an important observation, that is corroborated by qualitative comments about training and the need for “just in time” tutorials. Low levels of use may simply be insufficient to reinforce earlier training experiences, and may result in less willingness to seek information, or reliance on a few to obtain information for everyone. A more detailed analysis has been published.10
Workflow Analyses Dr. Kim Unertl conducted an ethnographic study of workflow and information flow across
multiple sites participating in the project. Her ethnographic study applied direct observation, semistructured interviews, and development of workflow models to understand the rationale for use of HIE technology and barriers and facilitators to use.11-13
Data were collected from March through November 2009. Dr.Unertl’s study can be categorized into sequential stages:
65

1. Preparatory work (January, 2009) 2. Collection and analysis of preliminary data 3. Development of purposive sampling plan 4. Direct observation at research sites (8 trips of 2 days each) 5. Analysis of direct observation data 6. Development of workflow models for each research site 7. Semi-structured interviews with key informants at research sites 8. Telephone interviews 9. Analysis of interview data Study sites included six EDs and three ambulatory clinic groups, covering a range of
Exchange usage, organizations, and geographic locations. She conducted more than 180 hours of direct observation across six EDs and eight ambulatory clinics, including 121 hours in the ED environment and 66 hours in ambulatory clinics. During observation, the Exchange was used 130 times. She conducted interviews with 9 providers and other staff to add detail to observations and confirm data analysis.
Data analysis emphasized intra- and inter-site similarities and differences in HIE-related workflow, patterns of Exchange use, and barriers impeding greater use of Exchange. She developed models of HIE-related workflow showing timing of HIE use within a patient visit as well as actors involved in information retrieval and information use for each ED site. Patterns of workflow across each ambulatory clinic group were consistent across clinic sites within each ambulatory clinic group, so a consolidated model of HIE-related workflow was developed for each ambulatory clinic group. She analyzed the workflow models for common patterns of HIE-related workflow and classified Exchange usage according to role-based models.
Findings Dr. Unertl developed a workflow diagram for each of the sites, focusing on use of the HIE
technology but also including other related aspects of work to ground the technology use in overall clinical workflow. Based on the site-specific workflow diagrams, she identified two main HIE-related workflow patterns in common across sites. The first pattern was a nurse-based model, where nurses or medical assistants retrieved data from the Exchange for physicians or nurse practitioners. The second pattern was a physician-based model, where physicians logged into the Exchange to retrieve data.
Several factors differentiated the two workflow patterns in addition to roles including timing of Exchange use, types of data retrieved from the Exchange, and information transfer modalities. Both workflow patterns shared one common element: the information consumer. Regardless of who was responsible for retrieving information from the Exchange or the process they followed to retrieve data, the individual who reviewed the information and applied it to patient care was a nurse practitioner or physician.
Based on observation and interview data, she identified five main categories of reasons that clinicians used the HIE technology:
66
• Communication challenges with the patient • Patient mentions a visit to another hospital • Not trusting the patient’s narrative • Getting around site technology problems • Facilitating referrals and consultations
Because Exchange use was optional, these categories provided insight into what motivated clinicians to access the technology.
From a clinician perspective, Dr. Unertl identified seven categories of outcomes of using HIE technology:
1. No data of interest is found 2. Disclosing information the patient has not shared 3. Saving time and speeding up care 4. Facilitating treatment decisions 5. Avoiding duplicate tests 6. Identifying drug seeking behavior 7. Helping patients understand details of previous care Dr. Unertl also applied the Information Ecology framework to the Memphis region to
develop a map of the regional health information ecology.14 This map identified what organizations provide health care services in the region, how these organizations relate to each other, health information exchange processes both with the Exchange and with manual approaches, and organizational facilitators and barriers to cross-organizational collaboration.
Dr. Unertl studied the paradox of highly favorable ratings but low use. She then studied overall HIE adoption and based on the percentage of active users and their perceived value, she characterized sites along a spectrum from active dislike to an “enthusiastic majority.” Her adoption matrix can be applied to future HIE efforts both in early development and during implementation to identify and refine useful implementation strategies.
67

Disease-Specific Conditions The University of Tennessee Health Science Center, Healthy Memphis Data Center
(HMDC), under the direction of James E. Bailey, M.D., M.P.H., was responsible for evaluating the effect of the MidSouth eHealth Alliance health information exchange (“the Exchange”) on condition-specific outcomes. The HMDC focused on clinical conditions whose diagnostic workup routinely involves clinical testing, procedures and often hospital admissions that are potentially avoidable with timely provision of data from other institutions at the point of care. The HMDC specifically assessed whether Exchange use by emergency department (ED) personnel reduces unnecessary testing, hospitalization and overall health care costs for evaluation and treatment of headache, chest pain, back pain, and abdominal pain, and for patients with high utilization levels. The HMDC team consisted of Dr. Bailey (PI), a research associate/health economist (Rebecca Pope, M.S.), and a technical writer (Catherine Lewis). These individuals worked in close collaboration with researchers at Vanderbilt University including Mark Frisse, M.D., Kevin Johnson, M.D., Kevin Yang, Ph.D., Coda Davison, Janet King, Cynthia Gadd, Ph.D., and Qingxia Chen, Ph.D.. Volunteer contributors to this research have also included Lisa Mabry, Jim Wan, PhD (statistician), Steve Landy, M.D. (neurology), Laura Sprabery, M.D., Chantay Smart, M.D., Teresa Waters, Ph.D. (health economics), Sudhir Aggarwal, M.D., Chanchai McDonald, Ph.D., Teeradache Viangteeravat, Ph.D., and Ying Vuthipadadon, Ph.D.
The HMDC team began work to identify key variables and research methods starting in March 2008. It completed its work plan and obtained IRB approval in late 2008. Following preliminary analysis of test data the HMDC submitted its first formal data requests to Vanderbilt in early 2009, and received its first data from Vanderbilt for headache in the late spring of 2009. Following the first receipt of data from the Exchange and the Vanderbilt team, the HMDC began an iterative process of data cleaning and re-specification of key variables based on data availability within the Exchange. For each specified variable this iterative process commonly involved multiple telephone and in-person meetings, analysis of initial data provided, and then repeated specification using new data definitions and algorithms to assure the provision of accurate data. Based on preliminary analysis of the headache data, data requests were specified for the other conditions, and all data required for the five condition-specific sub-studies had been requested by early 2010. Despite this highly rigorous and iterative process HMDC investigators continued to find major data problems requiring repeated revisions of the specifications and revised internal database processes at Vanderbilt to insure data accuracy.
Since early 2010, HMDC investigators have implemented protocols for data migration, cleaning, and transfer resulting in the creation of a prototype Exchange-derived research database. Complete data was provided for all five sub-studies plus data for an additional sub-study on congestive heart failure by late spring/early summer 2010. They have imported and are now housing six major extracts, including 2007–2009 ED and hospital admission data for all patients seen in all 13 major regional hospital EDs with diagnoses related to headache, back pain, abdominal pain, chest pain, and congestive heart failure, as well as for all patients with three or more tri-county ED visits. The extracts include information on diagnoses, demographic variables, length of stay, as well as tests, procedures, and selected results. These data are linked to Medicare cost information and are being used by our team at UTHSC to evaluate effects of Exchanage access on disease-specific outcomes and cost of care. Data for all six sub-studies was cleaned using automated and manual processes, preliminary frequencies obtained, and detailed
68

cross-sectional analyses controlling for demographic, comorbidity, and hospital variables. Simultaneously, mapping files were created for every visit type and procedure in order to map visit and procedural information to uniform Medicare cost data to assist in estimating cost savings or losses.
Condition specific studies are ongoing and will continue with other funding after the contract period. Indeed, these studies demonstrate the value of the Exchange on outcomes research.
Headache: General Impact 15 • There were 15,322 visits from 7/07—8/09 by 13,040 patients in area EDs for headache • HIE use in the study population was low at 10 percent • The overall rate of neuro imaging by CT scan was 85 percent ranging from 61 percent to
99 percent, depending on hospital • Number of head CTs per person ranged from 0 to 12 during the 2-year period • HIE use was associated with a substantial decrease in multivariate odds [OR = 0.28
(0.16—0.50)] of neuro imaging by CT scan • Potential to avoid 21.4 percent of repeat CTs with more HIE use
Headache: Adherence with guidelines • The HIE was accessed for 21.2 percent of ED visits for headache overall • Over two-thirds of patient visits (71.4 percent) received some sort of imaging (CT, CT
angiography, MRI, or MR angiography) • Use of HIE by ED staff is strongly associated with increased adherence with EBGs for
neuro imaging of headache patients in the ED. Any HIE use in interaction with number of previous visits was associated with a 2.35 times increased odds of EBG adherence
• Headache: Effect of HIE access on repeat CT scans • After controlling for patient characteristics and treating hospital, three out of every four
cases without HIE access included a head CT • When the HIE was used, CT use fell to about one out of every two cases for similar
patients (OR=0.29; 95% CI: 0.15 to 0.58) • Cost savings were small due to low rates of HIE use. Costs for head CTs were reduced
by 5.5 percent due to HIE access
Back Pain: Imaging • 23,046 patients were seen in area EDs during the 2-year study period for back pain • HIE use in the study population was low at 8.7 percent • 15 percent of back pain patients received some sort of radiologic imaging • No effect of HIE access was seen on use of radiologic imaging (X-ray, CT, or MRI)
Back Pain: Duplicate Imaging • HIE use in the study population was also low at 12.2 percent but higher than the overall
use of HIE for back pain (8.7 percent) • 16.8 percent (98) of the 582 repeat back pain visits resulted in duplicate lumbar sacral x-
rays that met the duplicate definition in the study population • None of the repeat back pain visits in which HIE was used resulted in duplicate lumbar x-
rays suggesting that HIE use may be protective.
69
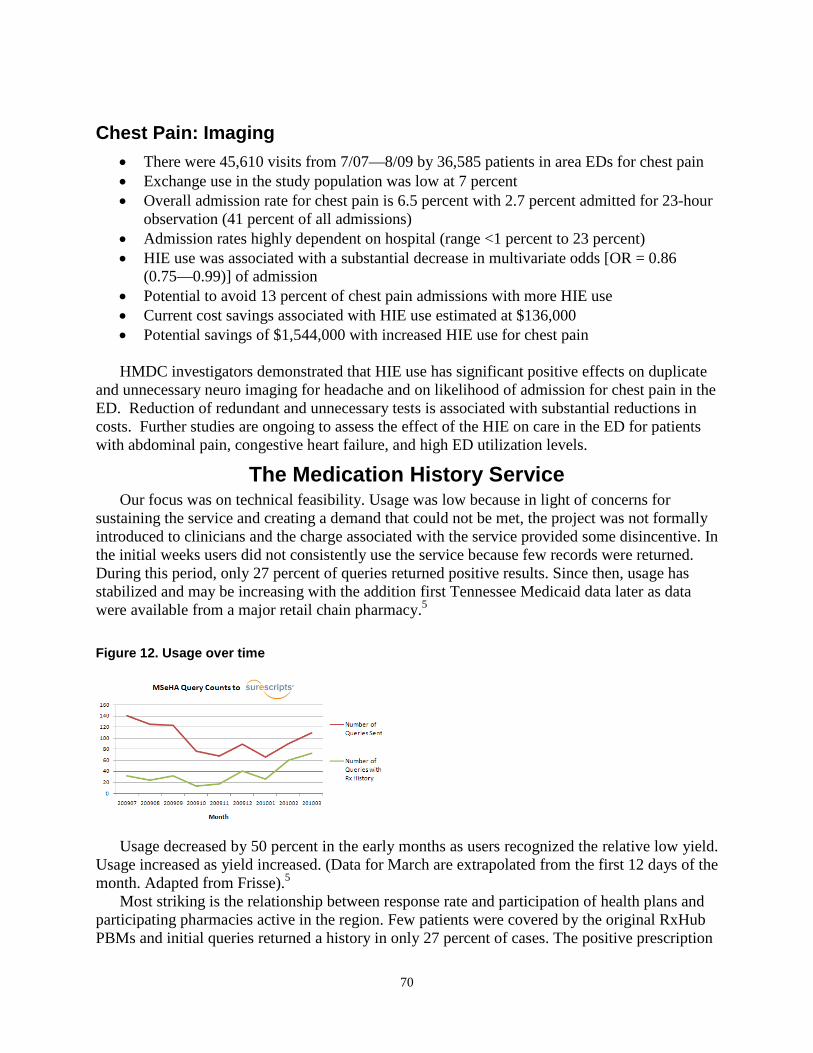
Chest Pain: Imaging • There were 45,610 visits from 7/07—8/09 by 36,585 patients in area EDs for chest pain • Exchange use in the study population was low at 7 percent • Overall admission rate for chest pain is 6.5 percent with 2.7 percent admitted for 23-hour
observation (41 percent of all admissions) • Admission rates highly dependent on hospital (range <1 percent to 23 percent) • HIE use was associated with a substantial decrease in multivariate odds [OR = 0.86
(0.75—0.99)] of admission • Potential to avoid 13 percent of chest pain admissions with more HIE use • Current cost savings associated with HIE use estimated at $136,000 • Potential savings of $1,544,000 with increased HIE use for chest pain
HMDC investigators demonstrated that HIE use has significant positive effects on duplicate
and unnecessary neuro imaging for headache and on likelihood of admission for chest pain in the ED. Reduction of redundant and unnecessary tests is associated with substantial reductions in costs. Further studies are ongoing to assess the effect of the HIE on care in the ED for patients with abdominal pain, congestive heart failure, and high ED utilization levels.
The Medication History Service Our focus was on technical feasibility. Usage was low because in light of concerns for
sustaining the service and creating a demand that could not be met, the project was not formally introduced to clinicians and the charge associated with the service provided some disincentive. In the initial weeks users did not consistently use the service because few records were returned. During this period, only 27 percent of queries returned positive results. Since then, usage has stabilized and may be increasing with the addition first Tennessee Medicaid data later as data were available from a major retail chain pharmacy.5 Figure 12. Usage over time
Usage decreased by 50 percent in the early months as users recognized the relative low yield. Usage increased as yield increased. (Data for March are extrapolated from the first 12 days of the month. Adapted from Frisse).5
Most striking is the relationship between response rate and participation of health plans and participating pharmacies active in the region. Few patients were covered by the original RxHub PBMs and initial queries returned a history in only 27 percent of cases. The positive prescription
70

history response rate predictably increased to almost 50 percent when Tennessee Medicaid (TennCare) data became available. The positive response rate increased to 70 percent as data from just one dominant chain pharmacy was made available through SureScripts. Figure 13. MSeHA query hit rate
The relationship between positive prescription history response and the availability of additional relevant prescription data sources. Use trended upward as the positive query response rate has grown from 27 to almost 70 percent. (Adapted from Frisse, 2010).5
A compelling argument can be made that retail pharmacy data is the most crucial contributor to a comprehensive prescription drug history. Prescription drug history based on administrative claims may be incomplete because claims for inexpensive drugs are not always submitted. Furthermore, many individuals do not have pharmacy benefit manager (PBM) or health plan coverage and pay for their own medications. But retail pharmacies can make prescription medication history available through SureScripts and through these means address this deficiency. Some independent pharmacies may not have the resources available to contribute data to these services. Figure 14. Sources of prescription drug histories delivered through the Memphis Exchange (February 2010)
The majority of the dispensed medication history data came from Walgreens and the majority
of the claims data came from CVS / Caremark. Although these data are in part the result of levels of participation among retail pharmacies, the retail pharmacy and PBM sources are relatively
71

consistent with usage patterns and plan coverage among participating entities in Memphis. (Adapted from Frisse, 2010).5
Implications In August of 2007 (prior to our pilot), the Regenstrief Institute reported only a 5 percent
positive response rate from RxHub. Our results in the spring of 2010 showed a 70 percent positive response rate because of the inclusion of a major retail pharmacy chain in the SureScripts service. We believe the cost of approximately $1 per successful transaction may be considered prohibitive in high-volume emergency room setting but may be cost-effective in a formal medication reconciliation process. Indeed, the MidSouth eHealth Alliance Board chose to discontinue the pilot temporarily in mid-2010 until they could finalize their overall sustainability model. We believe the service will resume through some vehicle (SureScripts or Indiana Health Information Exchange). As the industry matures, so will the economics.
Our experience with a prescription medication history service suggests that the availability of a standardized prescription medication history will be of great clinical value. The research and application focus will necessarily shift from acquisition to effective use and informed clinical action. Because of their significant clinical and financial impact, formal evaluation of these systems is strongly recommended.
Financial Impact We estimated financial savings both in the planning phase of this project and around the time
that the Exchange was to be used. During the planning phase, we calculated an incremental, annual benefit based on high use levels and results reported from the literature. In the fifth year, we estimated savings from hospitalizations of approximately $2 million. This was fairly on the mark. We did not measure ED expenditures so we could not report on any costs or savings. We over-estimated savings from laboratory testing and radiographic testing. Such levels of savings may very well be possible with appropriate incentives within a fully-interoperable and connected system of ambulatory and in-patient care, but our failure to achieve widespread ambulatory connectivity and the absence of incentives to reduce testing did not allow us to realize these benefits. Figure 15. Potential savings estimated from our original planning work
The table to the right of Figure 15 summarizes savings over the entire 5-year period.
We subsequently published more conservative numbers.16 Using a 1-year hospitalization cost of $1,000, we estimated that 3,783 hospital admissions would be avoided annually with resultant
72

savings of $3.7 million. Our excessive estimates were still based on those published by investigators at First Consulting Group; they estimated that one out of seven admissions from EDs is due to missing information. The initial Memphis economic model estimated 30 percent of the 235,430 hospitalizations followed ED visits; 14 percent if these were estimated to be due to missing information; by the fifth year of operations 37.5 percent of these would be avoided by use of the health information exchange. When we conducted a case-control study over a 2-year period, we found 578 fewer admissions—fewer than 300 per year. This is one-tenth the number of reduced admissions we predicted. But our original estimates were based on a far more pervasive technology infrastructure and incentive system than is extant today.
From the outset, we were committed to analyzing financial savings more formally. We did so and have encouraging results that we will submit to peer-review publication. We examined in ED settings the correlation between the use of data from HIE with both hospital admissions and test-ordering frequency; we performed a case-control study of 20,285 patients seen in the EDs during the 2-year period of January 1, 2007 through December 31, 2008. 15,798 eligible patients for whom data were accessed through HIE in the ED were compared with a control group of 15,798 patients matched for age, gender, race, site of emergency care, presenting diagnosis, and primary payer source. Case and control groups were also compared for co-morbidities. HIE data were accessed by one hospital (Hospital A) primarily through printed summaries retrieved by support staff. In the remaining 11 hospitals (Hospital B group) data were accessed by physicians through a secure Web browser. The two cohorts were analyzed separately.
We studied associations between use of HIE with a number of outcome measures: hospital admission from the ED, laboratory test ordering, head imaging tests (CT and MRI), Body CT imaging, admissions for less than 23 hours, ankle radiographs, chest radiograph ordering, and echocardiogram use.
Study Design Our study used a case-control design using patient visits from 12 hospitals from four
different hospital systems in the Memphis area. We included data from every hospital that employed HIE when seeing patients through the 2-year study period. We created a sampling frame consisting of all such visits occurring between January 1, 2007 and December 31, 2008. We used our access logs to identify 20,285 individuals for whom HIE was employed and for whom we could match their visit with discharge data obtained from the Tennessee Hospital Association. Controls were matched for site of care, age, gender, race, primary discharge diagnostic code, and health plan status. From the 20,285 records, 932 case records were excluded because the case and control patient were the same individual. Another 3,555 case records were excluded because HIE use for these individuals took place in nonemergency department settings. Controls matching the excluded cases were also eliminated. Our final study was composed of 15,798 cases matched with an identical number of controls patients. Case and control comorbidities were compared using the Charlson index and no significant differences were found.
73

Figure 16. Study design
Patient selection, exclusion, distribution, and comparison were performed according to the experimental design and criteria. After exclusions, patients were separated into the “print hospital” and the “Web hospitals” and matched along numerous criteria.
Controls were required to be matched for site of care delivery, age, gender, race, insurance coverage, and primary discharge code. We compared the characteristics of the case and control populations using the Pearson chi-square test.
For each variable in both the exchange and control groups, we calculated the difference between case and controls for each variable. For each statistically significant difference, we separately multiplied the observed difference times an estimate of cost for the hospital admission or test. The sum of these savings or expenses was reported for the study group over the entire 2-year period. Because the case-control method yielded a smaller percentage of patients than the estimated 6.8 percent of patients for whom HIE was used, we took the 2-year study savings and extrapolated to the 6.8 percent use and calculated estimated annual overall savings at the current levels of use.
Results Hospital A had a significant difference in payer mix with a far higher percentage of
commercially insured and Medicare patients. When comparing Hospital A with Hospital B group, we also observed significant differences in the percentage of hospital admissions, and in decisions to order laboratory tests chest radiographs, head CT scans, and body CT scans.
74

Table 9. Comparison of Hospital A with Hospital B group, no. (%) participants Characteristics Hospital A (n=15,798) Hospital B group
(n=15,798) P Value for Differences
Insurance coverage Commercial 3009 (27.8%) 3009 (27.8%) Medicare 2998 (27.7%) 2998 (27.7%) Medicaid and State 3493 (32.3%) 3493 (32.3%) Self-pay/indigent 1056 (9.8%) 1056 (9.8%) All other 259 (2.4%) 259 (2.4%)
Outcome variables Hospitalized 5056 (23.4%) 1702 (17.1%) Laboratory tests 7068 (32.7%) 2604 (26.1%) Chest x-ray 8787 (40.6%) 1395 (14%) P = 0.00 Body CT 4645 (21.5%) 405 (4.1%) P = 0.00 Head CT 2820 (13%) 97 (1%) P = 0.00 Brain MRI 0 (0%) 6 (0.1%) P = 0.00 24-hour admission 949 (4.4%) 335 (3.4%) P = 0.00 Outpatient surgery 1086 (5%) 207 (2.1%) P = 0.00 Echocardiogram 67 (0.3%) 6 (0.1%) P = 0.00 Ankle x-ray 170 (0.8%) 62 (0.6%) P = 0.00
Pearson chi-square test
Because of differences both in populations and HIE use, our financial analysis divided
institutions into two separate cohorts. In the first, HIE data were accessed through print summaries first. In the second, they were accessed immediately through the Web browser.
In Hospital A, we found use of the exchange data to be associated with statistically significant decreases in hospital admissions (3.4 percent), body CT scans (3.0 percent), head CT scans (1.1 percent), and the decision to order laboratory tests (3.0 percent). We found no statistically significant change in use of chest X-rays, outpatient surgeries, 23-hour admissions, echocardiogram use, or ankle x-ray use. A conditional logistic regression analysis controlled for admission type, age, length of stay, and Charlson index supports the chi-square analysis. Table 10. Hospital Group A, case-control analysis, no. (%) participants Characteristics Case (n = 10,815) Control (n = 10,815) P Value for Differences Hospitalized 2342 (22%) 2714 (25%) P < 0.001 Laboratory tests 3369 (31%) 3699 (34%) P < 0.001 Chest x-ray 4351 (40.2%) 4436 (41%) P = 0.239 Body CT 2196 (20%) 2449 (23%) P < 0.001 Head CT 1349 (12%) 1471 (13%) P = 0.014 Brain MRI 0 (0%) 0 (0%) 24-hour admission 493 (5%) 456 (4%) P = 0.219 Outpatient surgery 523 (5%) 563 (5%) P = 0.213 Echocardiogram 35 (0%) 32 (0%) P = 0.714 Ankle x-ray 82 (1%) 88 (1%) P = 0.644 Pearson chi-square test
HIE use was associated with decreases in hospitalizations from the ED, laboratory test
ordering decisions, head CT, and body CT. Similar results were obtained through logistic regression analysis.
In the 11 hospitals constituting the Hospital B group, we found HIE use to be correlated with significant decreases in hospital admissions (4.1 percent). We found HIE use to be correlated with significant increases in use of chest x-rays (17.2 percent) and head CT scans (1.4 percent).
75

In contrast to the larger Hospital A group, we did not find statistically significant differences between cases and controls for laboratory test decisions. As was the case for Hospital A, we did not find statistically significant differences in outpatient surgeries, 23-hour admissions, echocardiogram use, or ankle x-ray use. A conditional logistic regression analysis controlled for admission type, age, length of stay, and Charlson index supports the chi-square analysis. Table 11. Hospital Group B, case-control analysis, no. (%) participants Characteristics Case (n = 4,990) Control (n = 4,990) P Value for Differences Hospitalized 748 (15%) 954 (19.1%) P < 0.001 Laboratory tests 1318 (26.4%) 1286 (25.8%) P = 0.466 Chest x-ray 1125 (22.6%) 270 (5.4%) P < 0.001 Body CT 203 (4.1%) 202 (4%) P = 0.960 Head CT 84 (1.7%) 13 (0.3%) P < 0.001 Brain MRI 6 (0.1%) 0 (0%) P = 0.014 24-hour admission 165 (3.3%) 170 (3%) P = 0.738 Outpatient surgery 98 (2%) 109 (2%) P = 0.438 Echocardiogram 4 (0.1%) 2 (0%) P = 0.414 Ankle x-ray 30 (1%) 32 (1%) P = 0.799 Pearson chi-square test
HIE use was associated with fewer admissions from the ED, fewer head CT, brain MRI, and
body CT. This group had more chest radiographs. In both the Hospital A and the Hospital B group, use of HIE was associated with a
statistically significant decrease in hospital admissions from the ED of 3.4 percent and 4.1 percent respectively. In Hospital A use of HIE was also associated with a statistically significant decreases in numbers of patients who received laboratory tests (3.0 percent decrease), body CT scans (3.0 percent decrease), and head CT scans (1.1 percent decrease). In addition to a decrease in hospital admissions, use of HIE in the Hospital B group was associated with a statistically significant increase in patients who received head CT scans (1.4 percent increase) and chest x-rays (17.2 percent increase). Using a median hospitalization cost of $4,999 for Memphis hospitals (provided by the Tennessee Hospitalization) and similar numbers for other tests, total savings among the study population attributed to admissions and test ordering were $2.9 million over the 2-year period (approximately $1.5 million annually). Annual savings extrapolated to overall current HIE usage (6.8 percent of ED visits) were $1.9 million. Decreased admissions accounted for 98 percent of these savings. Table 12. Estimated savings realized in the study population
Hospital A # between case and control
Hospital B Group # between case and control
Total
Admissions (372) ($1,859,628) (206) ($1,014,756) (578) ($2,847,228) Lab (330) ($9,158) 0 $0 (330) ($9,158) CXR 0 $0 855 $65,835 855 $65,835 Head-CT (122) ($50,752) 71 $29,536 (51) ($21,216) Body-CT (253) ($122,705) 0 $0 (253) ($122,705) Total (savings)
($2,042,243) ($919,385) ($2,934,472)
76

Savings were calculated by multiplying the cost estimates by the increases or decreases in each variable between case and control.
Our analysis should not be viewed as a final and definitive impact study but rather as a conservative early study showing that exchange of data need not have deleterious financial implications. Our primary initial goal was to demonstrate that inexpensive exchange of health information data could be realized and sustained across a large and diverse metropolitan region. No systematic efforts were made to encourage specific aspects of use; providers did not receive any incentives for incorporating data from other institutions into their decisions to admit patients or to perform diagnostic tests. Given that the infrastructure can be supported at relatively low cost, a far greater net benefit to providers and society could be realized if appropriate incentives were created and if exchanged data were incorporated into both an institution’s native EHR and clinician workflow patterns.
Our work provides several lessons. First, creating and sustaining an infrastructure supporting health information does not require great expenditure. Second, even with access primarily through separate, secure, passive Web browsers, use by clinicians in ED settings was relatively low (6.8 percent) but constant. Third, even in the absence of incentives, use of HIE data in EDs was associated in all groups with a significant decrease in hospital admissions and some significant differences in test ordering behavior. Fourth, demonstrating economic impact conclusively is far more challenging than modeling economic impact. We identified a method that relied heavily on data routinely reported to the Tennessee Hospital Association. Although this approach was arduous and addressed fewer variables than published economic models, it provides guidance for monitoring HIE performance over time. Finally, we demonstrate that overall savings incurred in EDs can exceed exchange operational costs if these costs are low.
77

Chapter 9: Sustainability Our approach to sustainability is inspired by the distinction between the sustainability of
services and the sustainability of organizations that provide these services. ONC’s guidance on sustainable health information exchange (HIE) seem consistent with our approach. The July 6, 2010 ONC program information notice4 emphasizes that “the primary focus of sustainability should be on sustaining information sharing efforts, and not necessarily the persistence of government-sponsored HIE entities. ONC anticipates that annual updates to the State plans will provide further developed approaches and activities for long-term HIE sustainability.”
To understand sustainability, we believe one must have a clear vision of the different “businesses” that a health care provider is in and understand the four components of a business model.17
1. Value proposition—A product that helps customers do a job more effectively,
conveniently, and affordably. 2. Profit formula—Assets and fixed cost structure, and margins and velocity required to
cover them. 3. Processes—Ways of working together to address recurrent tasks in a consistent way;
training, development, manufacturing, budgeting, planning, etc. 4. Resources—People, technology, products, facilities, equipment, brands, and cash
required to deliver this value proposition to the targeted customers. We base our framework on this simple notion of a business model and combine this with
Value Chain formulations and extensions. Porter uses the term Value Chain to represent general characteristic of each business.18 A Value Chain separates activities of a firm to understand true costs, the impact of improvements on buyer perception of value, and as a tool to focus strategy and improvement in areas that matter. Each significant activity in a value chain:
• Has different economics • Has a high potential for value (i.e., differentiation) • Can be analyzed separately as a significant cost and area where improvements may
greatly impact the final offering The value chain is usually depicted as a figure with five columns representing primary
activities that are directly involved in creating extrinsic value to customers. Overlying the primary activities is a set of common supporting activities. Supporting activities enable and improve the performance of the primary activity and their value to customers should be measured through the extent to which they enable better performance of the primary activities.
This value chain must be modified to accommodate the three different businesses a health care organization is in. Our extension is based on the work of Stabell19 and extensions provided in Hwang and Christensen.17
The key insight is that a provider (e.g., a hospital) is in three complementary businesses. Each depends on HIT and increasingly, each relies on HIE to some extent.
78

The Medical Solution Shop This is the activity most people think about when they think of medical care and in particular
visits to a physician. You go to the physician, you present your problems, and your physician works with you to find a solution. These are knowledge-intensive processes: the more relevant information one has and the better one processes this information, the better and more efficient the solution. The primary value driver of this process is the reputation of the provider (“she is a great specialist”) and reimbursement (more activity means more charging).
The EHR enables decisionmaking and is the primary means for clinicians to retain a record of the decisionmaking process and, subsequently, maintain control over the execution of clinical care plans.
Organizational Value-Added Process Businesses These processes are usually associated with care delivery quality in hospitals. These
processes are amenable to Porter’s classical model; some have to do with materials and supplies as inputs and delivery of services as an output. Some are more concerned with knowledge as an input and measurable quality improvement as an output. An EHR plays a vital role through informing caregivers what they must do, and through the data collected and retained in the EHR, these systems simplify the task of monitoring quality at an individual and population level.
The returns on Organizational Value-added Process Businesses are measured by the efficiency (cost savings) and quality realized when inputs are transformed into products or services. Technologies are tightly linked within the organization. Multiple services and care processes are logically separated but are tightly coordinated through the EHR and through a small number of workers (e.g., nurses, respiratory therapists, physicians) who collaborate on consistent task execution. These interlinked chains of collaboration represent the value structure. The primary cost drivers for these processes are capacity utilization (occupancy) and scale (both through enhanced throughput and higher levels of worker efficiency.)
In light of the Federal Government’s shift from fee-for-service to capitated and outcome-based payments based on care delivered across all settings, Organizational Value-added Process Businesses will have become Regional Value-added Process Business. They will have to extend the role of each EHR from an instrument tightly coupled to a specific organization to an instrument coupled with any organization participating in the care of an individual. At least where information management is concerned, competitors will have to become collaborators. In the words of Porter, they will have to compete over value and not over data possession.
Some services required for regional care will be available directly from third parties (e.g., e-prescribing, medication history systems, laboratory ordering and reporting services). The strategies these service providers employ can be framed using the traditional Organizational Value-added Process Business framework. These data provisioning services that distinguish sources from users (i.e. buyers from sellers) are often called “Health Data Intermediaries.”
Facilitated User Networks Facilitated User Networks are activities where many participants are both buyer and seller.
EHR users and patients benefit from these networks to the extent that extrinsic data and value are converted to intrinsic actions of greater value to the EHR user. The power of the problem-solver in the Medical Solution Shop is only as good as the information at her disposal. Since patients seek care in multiple locations, often information in the possession of one practitioner (Practitioner A) will be of great value to a potentially competing practitioner (Practitioner B)
79
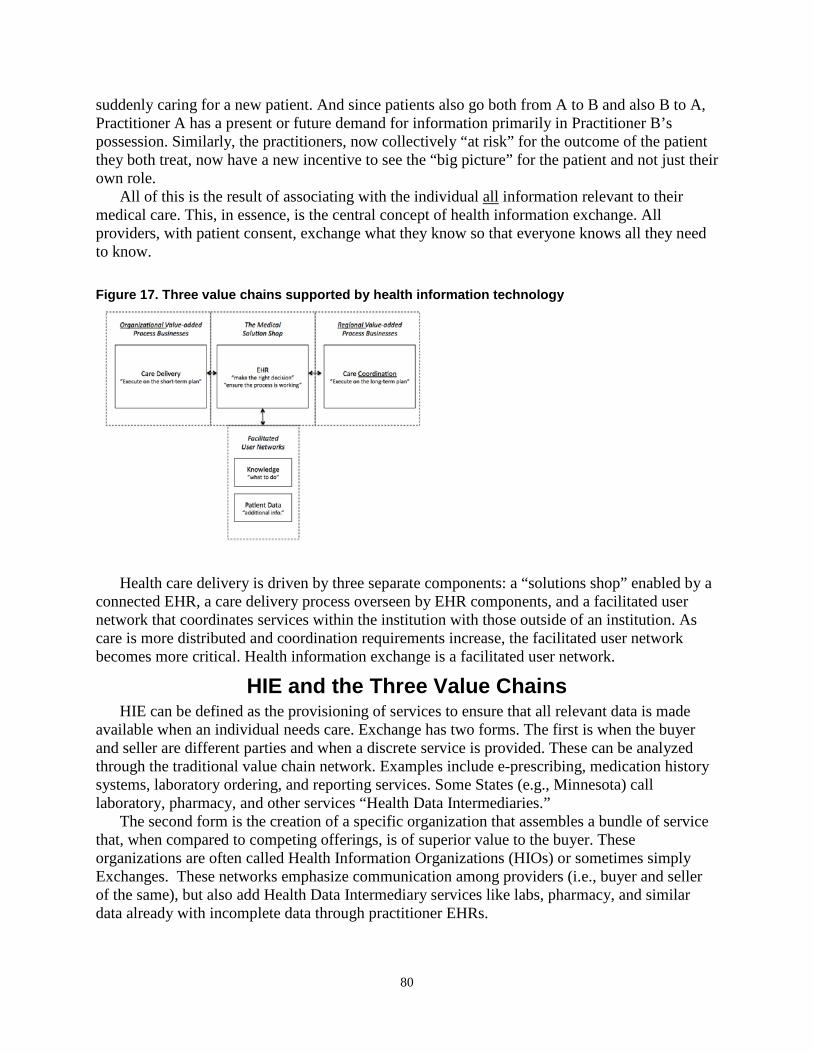
suddenly caring for a new patient. And since patients also go both from A to B and also B to A, Practitioner A has a present or future demand for information primarily in Practitioner B’s possession. Similarly, the practitioners, now collectively “at risk” for the outcome of the patient they both treat, now have a new incentive to see the “big picture” for the patient and not just their own role.
All of this is the result of associating with the individual all information relevant to their medical care. This, in essence, is the central concept of health information exchange. All providers, with patient consent, exchange what they know so that everyone knows all they need to know. Figure 17. Three value chains supported by health information technology
Health care delivery is driven by three separate components: a “solutions shop” enabled by a connected EHR, a care delivery process overseen by EHR components, and a facilitated user network that coordinates services within the institution with those outside of an institution. As care is more distributed and coordination requirements increase, the facilitated user network becomes more critical. Health information exchange is a facilitated user network.
HIE and the Three Value Chains HIE can be defined as the provisioning of services to ensure that all relevant data is made
available when an individual needs care. Exchange has two forms. The first is when the buyer and seller are different parties and when a discrete service is provided. These can be analyzed through the traditional value chain network. Examples include e-prescribing, medication history systems, laboratory ordering, and reporting services. Some States (e.g., Minnesota) call laboratory, pharmacy, and other services “Health Data Intermediaries.”
The second form is the creation of a specific organization that assembles a bundle of service that, when compared to competing offerings, is of superior value to the buyer. These organizations are often called Health Information Organizations (HIOs) or sometimes simply Exchanges. These networks emphasize communication among providers (i.e., buyer and seller of the same), but also add Health Data Intermediary services like labs, pharmacy, and similar data already with incomplete data through practitioner EHRs.
80

Health Information Organization strategy and value measurement are Facilitated User Networks. Many of the participants are both buyers and sellers of data. These data are used to increase the efficiency and effectiveness of the problem-solver in the Medical Solution Shop. The value of a Facilitated User Network is realized through effective linking of service providers with one another. Each service that is a part of the Facilitated User Network can be provided “stand alone.” Each service has incumbents and challengers. A range of bundled services (i.e. competitors to an “exchange”) can result if an organization can create a stable coalition of service providers to an extent that an EHR vendor (supporting a “Medical Solution Shop”) has sufficient incentive to incorporate these services into its customer’s offerings.
A Framework for HIE Value Creation Stabell’s19 and later Hwang and Christensen17 extended on the Porter Value Chain model to
represent the three interaction value chains in health care delivery and technology support: the Organizational Value-added Business model for operations, the Medical Solution Shop to solve problems and oversee care, and the Facilitated User Network to support connectivity required to allow the other models to achieve their true potential.
Health Information Organizations are Facilitated User Networks. Their value is a function of the linkages they create among users (buyers and sellers are often the same people and organizations). Processes are simultaneous and parallel rather than sequential. Cost drivers include the costs of operating the organization and the stability of connections among participants.
HIE Facilitated User Networks face many threats. First, these markets are very immature—neither buyer nor seller understands the true value of the goods offered (i.e., additional patient data). Second, trust and security are essential; these networks must be governed closely so that information is used only in authorized ways either through mutual agreement or through legislative mandate. (Imagine an exchange as a social network where secrets are very selectively shared.) Third, an organization must have a sufficient service breadth (e.g., the organization has access to relevant information from all care delivery sites). Fourth, an offering must have sufficient client coverage breadth (e.g., the organization can make information available to all major hospitals and providers value the service). Fifth, some competitors may be able to offer similar services “on the margin” either because they already provide many of the same connections and services for other purposes or because their costs are subsidized from other operations deemed vital to the clients seeking exchange services. Health plans and claims clearinghouse coalitions have some of these characteristics. Finally, the more “liquid” data are, the lower the barrier to entry for other freestanding organizations offering similar service bundles. The more “liquid” an arrangement is, the lower the barrier of entry to competitors and the greater the likelihood that an exchange business model will not be sustainable. A competitive advantage in these cases will require pre-existing and vital linkages, strong trust relationships, and, in the case of State and Federal Government, legislative mandates.
We now look more closely at how a Facilitated User Network achieves a viable business model. This model can be composed of four components:17
1. Value proposition—The value of exchange is both to increase the amount of critical
information available to care and to facilitate the coordination of care. 2. Profit formula—Profit is achieved by gaining revenues based on demonstrable cost
savings or quality improvements.
81

3. Processes—Using HIE changes the way people work together. It provides the opportunity to coordinate care more effectively by affording immediate access to information gathered across disparate sources.
4. Resources—The costs for people, technology, products, facilities, equipment, brands, and cash are very low in comparison to overall health care IT expenditures and per capita expenditures on health care.
We believe that the core of any facilitated user network is to maintain trust and to develop
sufficient value to allow each and every major member to support the core Exchange services solely on the basis of membership fees. Among the members are State government (especially Medicaid) as well as the major providers. In Memphis, such a model was created by the Tennessee Hospital Association based on hospital admissions and net revenues. This formula was progressive in that larger and more profitable hospitals paid more than public hospitals. Ambulatory providers and safety net clinics do not contribute at this time.
People: The Real Key to HIE Sustainability HIE will become a vital component of our health care technology infrastructure. We suspect
that in only few years such exchange of data will be an expectation rather than an exception, much as modern scholarship could not be contemplated without assuming many information resources are obtained from remote sites through the Internet.
Like the story of Internet-based industries, current HIT vendors and organizations can be expected to change dramatically. As was the case for many other early e-business models in other sectors, many eHealth initiatives are not expected to survive the turbulent market ahead. But the people will prosper and organize in new ways until some sort of stability emerges. In other words, although the pioneering organizations may not always survive, the pioneers and their descendants will not only survive, they will prosper.
We have seen this with the dissolution of the organization that built the Memphis Exchange. The organization, like a movie production company, disbanded and members of the team went in different directions in search of even greater accomplishments. We mention a few of these pioneers here. Vicki Estrin, the second member of the team after Mark Frisse, is now a senior leader at a consulting firm organizing the State of Tennessee’s public-private partnership. She is joined by Sarah Stewart, a later addition to the team. Janet King, the technology leader, has recently become the executive director of the health information organization for the Greater Nashville Area; she will begin with the “Memphis Model” and vendor and address a more ambitious agenda along the lines of ONC’s BEACON community initiatives. Will Rice, another early member of the team, is now eHealth Director for the State of Tennessee. Monroe Wesley, a security professional who moved from St. Jude in Memphis to Vanderbilt to play a larger role, is now the director of the IT Risk Program/Informatics Security for Vanderbilt Medical Center. Rodney Holmes, an early co-author of some of the financial models used in Memphis, is now executive director of the MidSouth eHealth Alliance. Our software engineering team—Tim Coffman, Michael Assink, Kevin Yang, Lianhong Tang and Jameson Porter—all play critical roles in Vanderbilt’s growing informatics agenda. Mr. Porter is a participant with Dr. Frisse on ONC’s SHARP grant for privacy and security. Vanderbilt’s original visionary and architect of this work, Dr. William Stead, continues to play a leading regional and national role in the definition of Medical Informatics. Dr. Frisse remains at Vanderbilt studying the economics of
82

HIE and pursuing the topic along several research and consulting lines both locally and nationally.
With the introduction of HITECH and the growing need for capital-intensive services of great scale, the creation and study of HIE can no longer be the province of a university-based group but instead must be based in larger enterprises. But the role of a university has not diminished; it has simply changed in emphasis.
83

Chapter 10: Concluding Comments Meeting AHRQ’s Requirements
Vanderbilt has met the AHRQ requirements.
Milestones Vanderbilt met all milestones for both for definition of core entities and core data elements as
well as for demonstration of 25 percent, 50 percent, and 100 percent exchange of data elements among these core entities.
Technologies Vanderbilt’s derivative technologies (e.g., ICA) have been adopted in other regions within
the State (and country), the design principles developed in the project have been adopted in defining Tennessee’s statewide plan, and the personnel have assumed leadership in statewide efforts. These technologies were very much the result of AHRQ’s requirement to “reduce risk by building on proven experience.”
Leveraging Existing Efforts Vanderbilt was successful in leveraging provider based IT initiatives and, to a more limited
degree, leveraging the expertise of one managed care organization and one health plan in the region. Vanderbilt’s Medicaid impact statement was delivered on time and the integration of Medicaid into statewide plans has been largely achieved.
Evaluation Vanderbilt developed and delivered a comprehensive evaluation plan. It has studied impact
on workflow, satisfaction, and financial impact. Although we were unable to demonstrate quality improvement in a systematic way, our qualitative work did record anecdotes of dramatic care improvement in some instances.
Governance Vanderbilt’s governance model was similar to many others. It can be differentiated in only a
few ways: we used care delivery professionals to advocate for consumers; we required minimal involvement of formal clinical and financial work groups; and we stayed very focused on specific ED activities to realize quick wins and build trust.
Legal Arguably, our early adoption of the Markle Connecting for Health Framework had great
national impact. Our data-sharing agreements have been shared with many other HIEs and a national workshop held in 2005 brought paying participants from 20 States to learn from our experience.
Sustainability Vanderbilt’s HIE sustainability plan for Memphis became far simpler because of our
emphasis on fundamental, universal services and not value-added services. Using a model of what economists called “facilitated user networks,” we concluded that the keys to sustainability
84
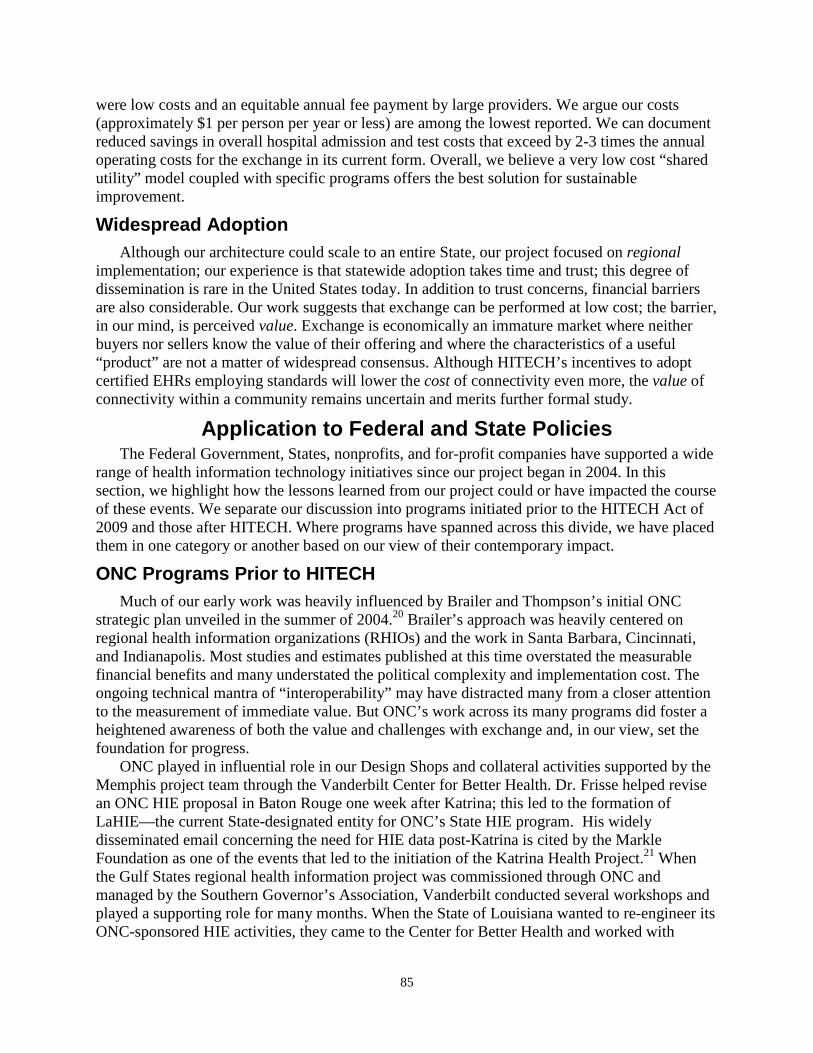
were low costs and an equitable annual fee payment by large providers. We argue our costs (approximately $1 per person per year or less) are among the lowest reported. We can document reduced savings in overall hospital admission and test costs that exceed by 2-3 times the annual operating costs for the exchange in its current form. Overall, we believe a very low cost “shared utility” model coupled with specific programs offers the best solution for sustainable improvement.
Widespread Adoption Although our architecture could scale to an entire State, our project focused on regional
implementation; our experience is that statewide adoption takes time and trust; this degree of dissemination is rare in the United States today. In addition to trust concerns, financial barriers are also considerable. Our work suggests that exchange can be performed at low cost; the barrier, in our mind, is perceived value. Exchange is economically an immature market where neither buyers nor sellers know the value of their offering and where the characteristics of a useful “product” are not a matter of widespread consensus. Although HITECH’s incentives to adopt certified EHRs employing standards will lower the cost of connectivity even more, the value of connectivity within a community remains uncertain and merits further formal study.
Application to Federal and State Policies The Federal Government, States, nonprofits, and for-profit companies have supported a wide
range of health information technology initiatives since our project began in 2004. In this section, we highlight how the lessons learned from our project could or have impacted the course of these events. We separate our discussion into programs initiated prior to the HITECH Act of 2009 and those after HITECH. Where programs have spanned across this divide, we have placed them in one category or another based on our view of their contemporary impact.
ONC Programs Prior to HITECH Much of our early work was heavily influenced by Brailer and Thompson’s initial ONC
strategic plan unveiled in the summer of 2004.20 Brailer’s approach was heavily centered on regional health information organizations (RHIOs) and the work in Santa Barbara, Cincinnati, and Indianapolis. Most studies and estimates published at this time overstated the measurable financial benefits and many understated the political complexity and implementation cost. The ongoing technical mantra of “interoperability” may have distracted many from a closer attention to the measurement of immediate value. But ONC’s work across its many programs did foster a heightened awareness of both the value and challenges with exchange and, in our view, set the foundation for progress.
ONC played in influential role in our Design Shops and collateral activities supported by the Memphis project team through the Vanderbilt Center for Better Health. Dr. Frisse helped revise an ONC HIE proposal in Baton Rouge one week after Katrina; this led to the formation of LaHIE—the current State-designated entity for ONC’s State HIE program. His widely disseminated email concerning the need for HIE data post-Katrina is cited by the Markle Foundation as one of the events that led to the initiation of the Katrina Health Project.21 When the Gulf States regional health information project was commissioned through ONC and managed by the Southern Governor’s Association, Vanderbilt conducted several workshops and played a supporting role for many months. When the State of Louisiana wanted to re-engineer its ONC-sponsored HIE activities, they came to the Center for Better Health and worked with
85

Vanderbilt Staff. This relationship continues to this day. The Vanderbilt Center for Better Health conducted two workshops to help prepare for their Statewide HIE application and Dr. Frisse advised on and contributed to the preparation of the Louisiana’s State HIE proposal. Vanderbilt’s Design Shop methods and the Vanderbilt team were also central to initial HIE planning for Mississippi, for Medicaid Transformation Grant planning in Alabama, for an initial workshop on large-scale government management held in Washington and sponsored by David Blumenthal, an AHRQ Design Shop on clinical decision-support, and a later ONC-sponsored workshop that led to the creation of some of ONC’s education initiatives.
Working through AHRQ, Mark Frisse and Vicki Estrin applied to the program preparation their expertise in data-sharing agreements and the results of their workshops in privacy and security. Although the Tennessee application was not selected in the initial phases of Health Information Security and Privacy Collaboration (HISPC), both Frisse and Estrin spoke at and participated in regional and national HISPC meetings.22 Workshops on long-term care in New York State and on health care reform in Puerto Rico also were impacted by our Memphis experience.
Dr. William Stead played a major role in the Commission for Systemic Interoperability23 Their report was mandated by Congress and largely preceded ONC’s formation. Dr. Stead was a primary driver for the report section emphasizing the need for a prescription medication history resource. The spirit of this work was carried through into our medication history service collaboration with the Regenstrief Instituted.
Neither Vanderbilt nor Memphis formally participated in the Nationwide Health Information Network. In our view, the 1 year period for both the NHIN I and the NHIN II efforts was too short to achieve the intended results. In NHIN I, we believed that the scope of activity was too broad and “industrial” in light of the state of technology. In preparation for an unsuccessful application to CDC, we studied the specifications and use cases associated with NHIN II and found them too complex, too detailed, and possibly self-contradictory. Like many others, we nonetheless learned from these pilots and were able to incorporate some of their lessons into our work.
Meaningful Use The Medicare and Medicaid Electronic Health Record (EHR) Incentive Program (i.e., the
Meaningful Use (MU) program) mandated under the 2009 American Recovery and Reinvestment Act was intended to broaden the use of EHRs to advance patient quality, safety, and health care affordability across the United States. Following the finalization of Stage 1 (2011) and Stage 2 (2014) objectives and metrics, proposed Stage 3 objectives are being considered in important areas such as care coordination and patient and family engagement.24 The criteria that must be met to demonstrate adoption under Meaningful Use provisions are a subset of the functions required to use EHRs effectively. These criteria were mandated as an effort to ensure EHRs would be employed through a network of technologies in support of a broader system of care. EHR adoption is essential for exchange and, through Meaningful Use provisions, exchange is conversely an essential prerequisite for EHR adoption. Much of the exchange of data required to demonstrate Meaningful Use does not require the type of Exchange we created in Memphis, but such an exchange can be used to support these needs.
HITECH calls on the Secretary of Health and Human Services to develop specific meaningful use objectives. The Meaningful Use provisions address three stages of EHR adoption. The first stage (2011-12) focused on primary EHR features and demonstration of capabilities. These regulations have been published. The second stage (2013-14) focuses on
86

demonstrating use. The third stage is expected to focus on measurable outcomes. The first stage requirements have been “divided into two groups: a set of core objectives that constitute an essential starting point for meaningful use of EHRs and a separate menu of additional important activities from which providers will choose several to implement in the first 2 years.” 25
The core objectives and metrics are based on the use of EHRs in health care. These objectives include tasks essential to creating a medical record: patients’ vital signs and demographics, active medications and allergies, up-to-date problem lists of current and active diagnoses, and smoking status. Other core functions address safety and quality and are designed to support a number of clinical decision support functions, clinician order entry, e-prescribing and the capability to connect to external entities (e.g., pharmacies, health plans, and other providers). Many of these functions are already available in commercial EHRs. A second group of criteria offers clinicians a choice of adopting any 5 of 10 additional tasks. These choices include the capability to perform drug formulary checks, incorporate clinical laboratory results into EHRs, provide reminders to patients for needed care, identify and provide patient-specific health education resources, and employ EHRs to support the patient’s transitions between care settings or personnel.
Our belief is that much exchange of communication among EHRs in Memphis and elsewhere will be the result of point-to-point messaging or supported through secure “private” networks of single vendors or broader vendor coalitions. This is particularly true where eligibility determination, formulary status, e-prescription transmission, laboratory testing, and medication history services are concerned. 26 We believe the NHIN Direct specifications will unite these various “exchanges” to allow for interactions among them.
We believe the Exchange we have created in Memphis will play a central—but not exclusive—role in supporting Meaningful Use. It can leverage its existing communications, record locator services, and exchange capabilities to expand the regional participant base at a low marginal cost. Although “exchange” of messages is a given and will be very inexpensive, we suspect the most vital role our repository-based Exchange model may play will be in the effective measurement of quality and in real-time or post-hoc support for and measurement of factors vital in care transitions. In the former instance, our Exchange was able to track influenza complaints and encounters in “real time” and is capable of alerting all participants to any hospital re-admission. In the latter instance, our Exchange is capable identifying discharged patients and supporting staff to ensure they receive adequate followup.
In light of the critical role the Exchange may play in regional quality metrics, we suggest with some irony that the Memphis Exchange may very well become a successful instance of the failed Memphis CHMIS that Paul Starr wrote about in his 1999 Health Affairs article on technology and policy.3
State Health Information Exchange The State Health Information Exchange Cooperative Agreement Program is the product of
the “American Recovery and Reinvestment Act of 2009, Title XIII - Health Information Technology, Subtitle B—Incentives for the Use of Health Information Technology, Section 3013, State Grants to Promote Health Information Technology.” The initial funding opportunity announcement and a subsequent July 6, 2010, program information notice (PIN)4 suggest how our AHRQ-funded project experience can inform the ongoing interest in the role of States in HIE. ONC requires States to do the following:
87

• Initiate transparent, multistakeholder processes to address exchange needs. • Monitor and track meaningful use capabilities • Assure trust of information sharing • Set strategy to meet gaps in HIE capabilities for Meaningful Use including policies, core
service provision, and broad connectivity • Facilitate reporting to public health and Centers for Medicare & Medicaid Services • Address five primary domains: (1) governance; (2) finance; (3) technology; (4) business
and technical operations; (5) legal and policy.
Where transparency, stakeholder inclusion, and trust are concerned, our experience identified many common barriers and suggests approaches to surmounting these barriers. Much of our early success was due to highly visible and sustained leadership directed towards a focused objective of common concern. Although our work emphasizes the accomplishments and demonstrates the potential to achieve a far higher degree of connectivity both in scope and depth, at present, the Exchange lacks widespread ambulatory connectivity. Although much of this connectivity could be achieved through our model, it is possible that a hybrid effort involving our “vault” model and ancillary exchange services can and will provide an alternative; time will tell. Although we did not submit test results directly to public health agencies, we worked for many months on an effort to receive CDC funding to accomplish this and, in our effort, developed an approach that can be implemented easily. The tight relationships between our project and the many other efforts in the State have led to a focused State-level plan that will achieve many of the desired outcomes motivating the State Grants program. Rather than summarize how our work impacts each of the five domains, we have instead reported our contributions through the previous separate chapters for each of the five domains.
Beacon Communities The Memphis HIE has played an important role in Memphis’ February 2010 application to
the ONC-sponsored Beacon Community Cooperative Agreement Program. The Memphis BEACON application proposed to extend the AHRQ-funded HIE with countywide diabetes registry operated as part of the ongoing technology infrastructure. It was designed to address the need of all of the estimated 77,000 individuals living within the Shelby County, Tennessee area. This registry was to be enriched with EHR records from primary care providers and endocrinologists. Enhanced care coordination enabled by the diabetes registry and expanded EHR adoption was to shift the point of access for diabetes care toward the ambulatory care setting.
The Memphis BEACON project proposed to (1) improve diabetes care for all individuals with diabetes throughout the county as measured by a composite of four diabetes care indicators (i.e., A1c testing, LDL-C testing, clinical foot exams, and retinal eye exams); (2) improve diabetic control and reduce complications among high-risk diabetic patients as measured by clinical values (e.g., HGb A1c, LDL-C and blood pressure, rate of potentially avoidable ED visits, rate of uncontrolled diabetes preventable hospitalizations, and rate of lower extremity amputations); and (3) reduce health disparities in diabetes care delivery.
Although this program was not funded by ONC, it does reflect a sea change within the Memphis Community in at least two ways. First, the proposal exemplifies a shift in leadership attitude from the necessary “building” stages to subsequent “applying” stages. Health
88

information exchange is no longer the primary question in Memphis. Rather, it is how the exchange of health information can improve health by creating upon the low-cost infrastructure capabilities that improve care and lower cost. Second, a far broader group of constituents was mobilized toward the common aim of diabetes control. This broader community involvement—in care delivery, in philanthropy, and in research—is emblematic of the transformations set forth by the original AHRQ-funded program reported herein.
Privacy and Security Our work emphasized the importance of additional research in the four research areas
mandated through the Strategic Health IT Advanced Research Projects (SHARP) Program. SHARP research in security of health information technology is motivated by the constraints imposed by our limited capabilities to ensure patient and public expectations are met consistently through our current health information technology infrastructure; despite extraordinary effort and focus, and a degree of operation far above general applications of HIPAA, the relative inflexibility of our capability to promote accountable care and to advance secondary use demonstrates the enormity of the work ahead. Technology must work in concert with policy and not simply be focused on implementation of such policy.
The same issues inhibiting exchange in clinical care settings—privacy, data sharing, security, and trust—are also central barriers to legitimate “secondary use” of clinical data. In Memphis, the potential for secondary use of clinical data for appropriate purposes is not yet taking place; The Exchange has only in the waning days begun to address the organizational objectives, the consent infrastructure, the high-level analysis tools, and the policy infrastructure required to leverage the Exchange to explore systematically the application of data to populations. (Evaluation work on specific disease outcomes based on Exchange data and led by the University of Tennessee provides much-needed awareness of the Exchange’s repositories as an analytic tool.)
Our observations strongly suggest the need for additional research in a number of related domains:
• Policy. Our work demonstrated the value of the Markle Connecting for Health Framework and the benefit of heightened community awareness due in large part to a the importance HITECH has placed on these issues. The leadership shown by ONC, RTI, and others involved with HISPC has also prepared communities to foster exchange. Still, a concerted Federal effort is essential. Alignment among health and consumer privacy laws will be of equal importance. Clear guidance emerging from ONC, coupled with resources available from ONC, AHRQ, and other groups will be required to accelerate compliance with the many complex privacy regulations. In the final analysis, change in privacy practices and community trust is the result of efforts “on the ground” within communities. Support for these efforts is critical. One hopes that with time each community will not of necessity “reinvent the wheel,” but instead build on the experience of others and focus more on the need to “institutionalize” new privacy practices in the activities of every individual who managed personal health information. Trust takes time and effort; it will not happen uniformly or quickly.
• Access and Directory Services. Like early NHIN pilots and most other HIE initiatives, our work did not employ a federated network of directory service to access practitioners but instead employs a “hard wired” directory service. This approach will not scale easily if at all. Additional research in this area will be required to find robust models. In the
89
interim, StateHIE efforts can be immediate beneficiaries and provide one option for developing persistent directory coordinating services. Firms that already have extensive directory services may play a vital role. These include claims processing firms (e.g., Emdeon), eligibility organizations (e.g., CAQH), e-prescribing intermediaries (e.g., SureScripts). Their current approach was summarized in their testimony to the NHIN Workgroup of the HIT Policy Committee on December 16, 2009.27-29
• Authentication. Our work employed only relatively simplistic but cumbersome two-factor authentication methods. These approaches are expensive to support and do not easily scale. Our choice to employ two-factor authentication and to set a higher barrier for access was the result of the absolute need to reduce risk of unauthorized breach while trust was being built (and while Medicaid budgets were being cut). Our approach was more or less “all or none” in that access to the system would allow access to all records within the system as is the case for many organizations using EHRs. Audits and real-time IP address checks were our primary enforcement vehicles. There is a very real need for authentication methods that are easier to use, less expensive to maintain, and more aligned with native systems in health care settings. Our “single sign-on” project accessing Exchange data through the Baptist Hospital Web portal is one approach, but more generalized approaches are essential.
• Authorization. Our authorization approach was equally simplistic. If one sent a registration event from a known site and a user from that site accessed the data from a known IP address with two-factor credentials, one assumed the individual was authorized to access the record. Our approach did not distinguish among care setting context, roles, or data needs and hence were far coarser than would be required in generalized, nationwide settings. Ultimately, one can imagine systems where authorized individuals are given keys to decrypt only certain parts of a medical record or transition. These approaches are being evaluated at Hopkins and Vanderbilt by studying attribute-based encryption as part of a larger SHARP-funded effort to advance security and privacy research.
• Anonymous data. Our experience at Vanderbilt suggests that data can be made anonymous to a prescribed degree of probability. Vanderbilt employs this approach in its CTSA work (http://www.mc.vanderbilt.edu/pub/). Such approaches will be of growing importance as the need for community and public health monitoring systems grows. Assuring the anonymity of these databases will require ongoing monitoring and research.
• Representation—data. Our system sufficiently tagged data to identify the nature of its content. Some data—labs, encounter codes, and pharmacy records in particular, are specific enough that their implications are inherent in the type of data. For example, a psychiatric drug may indicate psychosis and a lithium lab level may indicate bi-polar disorder. It is therefore simple to block telegraphing a specific disorder by blocking all messages of this type. But when dictated reports are involved (even radiographic reports), all bets are off. Accordingly, we believe it will require much more structure of data or stronger natural language techniques to allow one to transmit dictated reports under situations that preclude disseminating information about specific medical conditions. Over time, attribute-based encryption technique may provide additional assurances, but at present, our means of representing data are not sufficiently robust to accommodate some privacy concerns without eliminating a very large body of information necessary for optimal care.
90

• Representation—users of data. Identifying who is requesting information also becomes more essential as exchange becomes more commonplace. Clear understanding of roles is an important aspect of classifying users in context. Role classifications and declarations are extremely complex in that they are at times transient (Dr. X covers for Dr. Y this weekend only), they are not reflexive (X may see Y’s data but Y may not see X’s data), and they aren’t consistent (when in the role of a doctor, X may see Y’s data, but when in the role of a patient, X may not see Y’s data). Incremental approaches to role standardization are essential both at the institutional and later at the national level. Current research efforts among standards bodies and other groups has advanced our ability to represent roles and relationships, but an overall consensus model for HIE has not yet emerged.
• Context. Many of the policy and representation issues raised by our work arguably may be better understood through a framework of contextual integrity.30 Nissenbaum posits contextual integrity as an “alternative benchmark for privacy, to capture the nature of challenges posed by information technologies.” Contextual integrity ties adequate protection for privacy to norms of specific contexts, demanding that information gathering and dissemination be appropriate to that context and obey the governing norms of distribution within it. In other words, one must model expectation for use and demonstrate that any use is consistent with expectation. Traditionally, one can trace information flow through the three states of collection, aggregation, and use. Collection limitation—a principle of the Markle Foundation and EU work—is perhaps an unnecessarily low barrier since it’s primarily goal is to prevent inappropriate data use by not collecting data in the first place. Contextual integrity—if properly explored and modeled may afford more exchange of data while still remaining consistent with personal preferences and social norms.
• Encryption. Our Exchange efforts recognized that encrypting all data would be an ideal approach to ensure unauthorized breach and, in the course of our work, Federal policies moved towards this encryption. But if one encrypts data, one may find more value in encrypting it in such a way that sensitive components of a record require different keys than more generic components. Under a totally encrypted approach, one could keep the data “open” and rather than grant access, instead grant keys to decrypt specific records or portions. We believe this approach merits investigation as our SHARP security work applies attribute-based encryption to exchange. In addition, Vanderbilt researchers are also exploring means by which similar encryption techniques can be applied to patient matching algorithms.
• Audit logs. We designed our system to accommodate large-scale audits. We view provable and demonstrable audit capabilities and practices as essential prerequisites to maintaining trust. But much more can be done. As messages become transitive (going from A to B to C to D), there are times where some assurances must be made that the use of data among all parties conforms with expectations. Means of tracing data across audit logs must be found. Although this issue was mentioned in Gartner/ONC’s NHIN I summary report,31 little attention has been paid to this requirement. As a second line of inquiry, audit logs themselves may provide insights into users and patters that are not explicit through formal roles. Evidence-based access management (EBAM) is an approach used by some researchers to understand how audit logs may provide insight into authorized access policies. The work on the Memphis Exchange (and some of the team
91

members) will be applied to this line of inquiry as EBAM is studied in the context of HIE through the ONC-funded SHARPS security grant.
• Mobile health. We do not believe that policymaking processes can possibly stay ahead of technology and data demand. New devices—particularly in mobile monitoring and in personal health records—will require different social conventions and different technology and policy means to assure data are secure and private in conformance with individual expectations. Reconciling these myriad devices within a highly restrictive policy framework is neither possible nor in the interest of innovation. On the other hand, failing to attempt to reconcile use of current and future devices with current paradigms and policies is equally hazardous. Clear dialogue between the “bleeding edge” PHR / mobile health community and the more conservative “national health infrastructure” community must be fostered and maintained. In reconciling approaches, a far richer set of experiential data will become available to help understand factors that influence our health.
Usability With the introduction of data from many other institutions, providers using the Exchange
were forced to contend with far more information than was available from a single system or a single care encounter. They naturally expressed their frustration in finding information and in separating “signal” from “noise.” Our effort validated the need for far more extensive means of supporting the knowledge management and cognitive effort required to enhance patient care. In an era of distributed care coordinated through information exchange, rigid automation of the status quo may retard our ability to achieve the vision of 21st century health care consistent with societal need. Future systems will require a far greater capacity to integrate weak signals from disparate resources and migrate clinical use of health care information technology from the manipulation of transactions to the management of knowledge.32 Although our technology is inexpensive, easy to implement, and capable of great scale it must ultimately manage data from an ever-widening array of devices and applications. Our approach to health information exchange provides a unique and critical foundation for pursuing research aimed toward standard approaches and for studying the provision of care in a data-rich environment of overwhelming complexity.
Other Observations and Recommendations As our project evolved, we noted the growing presence of exchange services that
complemented exchange organizations. First, some services (e.g., medication histories) could be provided directly to caregivers independent of any health information organization supporting exchange. Second, information could also be exchanged between data providers and patients. In the course of our work, we estimate that a small number of patients (under 5 percent) were beginning to incorporate their health information in personal health records. Third, providers sharing a common ASP model are beginning to exchange messages among one another independent of the exchange. Finally, health plans as well are very much involved in exchange. In Tennessee, a separate exchange service (Shared Health), funded by Blue Cross Blue Shield of Tennessee, continues to play a role across the State.
We believe current market forces, data-sharing impediments, and other factors will only accelerate the trend to exchange data within a region through a variety of means. This suggests the insufficiency of any approach base on a strictly hierarchical exchange model. In these
92

models, providers communicate through only regional exchanges, which in turn communicate through State exchange and ultimately through national networks. Although such hierarchical models may be applicable to a limited set of data accessed for specific purposes, more complete and connected models are likely to be more pervasive and robust.
What are the implications of this perspective on exchange? First and foremost, the architect Louis Sullivan’s “form follows function” rule is applicable. People and organizations exchange data with one and other for many different reasons. Each organization supporting exchange for specific purpose generally has developed a technical infrastructure for an array of business needs. Hence, these organizations can expand exchange activities within restricted parameters at a marginal cost. It is possible, therefore, that the focus of regional exchanges will be largely restricted to unique regional issues among participants. Quality indicators, readmission rates, and care coordination programs are candidates. If this model is correct, then regional exchanges will closely resemble their CHMIS precursors achieving the aspirations of these earlier efforts at lower cost, a climate conducive to secure sharing, and an environment that provides economic incentives for sharing activities.33 States, too, will play a role in light of their responsibility to support public health activities, support care facilities, and manage their Medicaid programs.
From a policy perspective, community activism will focus attention on the necessity for a patient-centric approach to care. State governments can use their considerable regulatory power to demand exchange capabilities as part of their procurements and funding. They can also use fees from health care transactions to provide oversight and key infrastructure that would be hard to maintain solely on market principles. The Federal Government’s role is primarily to adopt standards and policies that encourage exchange both across the Nation and within the Department of Defense, Veterans Affairs, and other Federal providers. Federal guidance on secondary data use policies will also be welcome. Many of the current privacy recommendations and policies are confusing and potentially inhibitory to secondary uses in the public interest that are widely accepted by the public. Where public acceptance is concerned, privacy approaches may be advanced if the “contextual integrity” of public expectation is assured through policies and technologies that ensure the use of data is consistent with social and public norms and traditions.
Work in health information exchange will also have a significant impact on the AHRQ agenda. For example, in September of 2010, AHRQ awarded $473 million in grants and contracts to support patient-centered outcomes research. Of this amount, at least $50 million has been awarded to create all-payer claims databases and similar resources. Clinical data available through exchange can both complement such databases and arguably shift the focus from databases designed primarily to adjudicate payment to a data-rich environment based on clinical labs, medications, problem lists, complications, and other expressions in coded or natural language programs.
This shift in data types may be accompanied with a shift in control. At present, use of these databases has been dictated in conformity with law to health plans and government agencies. In the future, projects such as Memphis suggest the potential for a far greater degree of provider access to data covering all aspects of an individual’s care—not just those aspects delivered by any one provider. Acting on behalf of these individuals, community-based exchanges presage a more economically successful era of Community Health Management Information Systems (CHMIS). Additionally, consumer-driven databases like the popular PatientsLikeMe site will add another perspective onto our use of clinical data to advance research. As all of these initiatives progress, our research environment may emerge with a range of overlapping data resources, each
93

designed for different purposes and each working in complement with others to drive local and national results.
To a certain degree, one can argue that our experience over the past 6 years presage a greater divergence between “exchange” as a verb and “exchange” as a noun. The former, we believe, will be commonplace; it will be achieved technically through a range of means and services; it will be sustained by immediate value to care; and it will be governed by generic provisions to Federal and State privacy laws and policies. The latter, we believe, will accelerate more extensive secondary use of data locally and in advance of the slower national consensus. Our experience suggests that the Memphis exchange and replicates in Nashville and other communities are examples of the platforms upon which AHRQ and other groups can support vital health care quality and care delivery research.
94

References 1. Kotter JP. Why transformation efforts fail. Harv
Bus Rev 1995 (March–April): 59–67. 2. Markle Foundation. The Connecting for Health
Common Framework. 2006 http://www.connectingforhealth.org/. Retrieved February 23, 2007.
3. Starr P. Smart technology, stunted policy: developing health information networks. Health Aff (Millwood) 1997;16(3): 91–105.
4. Department of Health and Human Services. Program Information Notice. Requirements and Recommendations for the State Health Information Exchange Cooperative Agreement Program. Document Number ONC-HIE-PIN-001. July 6th, 2010. https://www.healthit.gov/sites/default/files/hie-interoperability/state-hie-program-information-notice-final.pdf.
5. Frisse ME, Tang L, Belsito A, et al. Development and use of a medication history service associated with a health information exchange: architecture and preliminary findings. AMIA Annu Symp Proc 2010 Nov 13;2010:242-5.
6. Agency for Healthcare Research and Quality. Request For Proposal: AHRQ-04-0015, State and Regional Demonstrations in Health Information Technology (Issued April 13, 2004). archive.ahrq.gov/downloads/pub/contract/40015am1.doc.
7. Johnson KB, Gadd C. Playing smallball: approaches to evaluating pilot health information exchange systems. J Biomed Inform 2007;40(6, Supplement 1): S21–S26.
8. Hripcsak G, Kaushal R, Johnson KB, et al. The United Hospital Fund meeting on evaluating health information exchange. J Biomed Inform. 2007 Dec;40(6 Suppl):S3-10. Epub 2007 Aug 30.
9. Johnson KB, Gadd CS, Aronsky D, et al. The MidSouth eHealth Alliance: Use and Impact In the First Year. AMIA Annu Symp Proc. 2008 Nov 6:333-7.
10. Gadd CS, Ho YX, Cala CM, et al. User perspectives on the usability of a regional health information exchange. J Am Med Inform Assoc 2011 Sep-Oct;18(5):711-6.
11. Unertl KM. Understanding the impact of health information exchange technology:
workflow elements, patterns of use, and information ecologies [dissertation]. Nashville, TN: Vanderbilt University; 2009. http://gradworks.umi.com/35/01/3501213.html.
12. Unertl KM, Johnson KB, Lorenzi NM. Health information exchange technology on the front lines of healthcare: workflow factors and patterns of use. J Am Med Inform Assoc 2012 May-Jun;19(3):392–400.
13. Unertl KM, Johnson K, Lorenzi N. Understanding the impact of health information exchange technology: lessons from the MidSouth Ehealth Alliance. Paper presented at the 7th Annual Public Health Informatics Conference 2014 Centers for Disease Control and Prevention. August 2009.
14. Unertl KM, Johnson KB, Gadd CS, Lorenzi NM. Bridging organizational divides in health care: an ecological view of health information exchange. JMIR Med Inform 2013 Oct 29;1(1):e3. doi: 10.2196/medinform.2510.
15. Bailey JE, Wan JY, Mabry LM, et al. Does health information exchange reduce unnecessary neuroimaging and improve quality of headache care in the emergency department? J Gen Intern Med 2013 Feb;28(2):176-83.
16. Frisse ME, Holmes RL.Estimated financial savings associated with health information exchange and ambulatory care referral. J Biomed Inform. 2007 Dec;40(6 Suppl):S27-32. Epub 2007 Aug 31.
17. Hwang J, Christensen CM. Disruptive innovation in health care delivery: A framework for business–model innovation. Health Aff (Millwood). 2008 Sep-Oct;27(5):1329-35. doi: 10.1377/hlthaff.27.5.1329.
18. Porter ME. On Competition. Updated and Expanded Ed. Boston: Harvard Business School Publishing, 2008.
19. Stabell CB. Fjeldstad ØD. Configuring value for competitive advantage: chains, shops, and networks. Strategic Management Journal 1998;19(5): 413–37.
20. Thompson TG, Brailer DJ. The Decade of Health Information Technology: Delivering Consumer–centric and Information–rich Health Care Framework for Strategic Action. Washington, DC: Department of Health and Human Services; 2004:178.
95

21. Markle Foundation. Lessons from Katrina Health. New York: Markle Foundation; 2006.
22. Dimitropoulos LL. Privacy and Security Solutions for Interoperable Health Information Exchange. Washington, DC: Office of the National Coordinator for Health IT; 2007
23. Commission on Systemic Interoperability. Ending the Document Game. Washington, DC: U.S. Government Printing Office; 2005.
24. Wald JS, Haque S, Treiman K, et al. Evaluation of Stage 3 Meaningful Use Objectives: North Carolina and Tennessee. (Prepared by RTI International under Contract No. HHSA 290-201000024I). AHRQ Publication No.15-0022-EF. Rockville, MD: Agency for Healthcare Research and Quality. February 2015.
25. Blumenthal D, Tavenner M. The "meaningful use" regulation for electronic health records. N Engl J Med. 2010 Aug 5;363(6):501-4. doi: 10.1056/NEJMp1006114. Epub 2010 Jul 13.
26. Surescripts. Surescripts' New Clinical Interoperability Services." http://www.surescripts.com/news--‐and--‐events/clinical--‐interoperability.aspx. Accessed October 26, 2010.
27. Council for Affordable Quality in Healthcare. Testimony from the Council for Affordable Quality in Healthcare: NHIN Working Group, December 16, 2009. Washington, DC:2009.
28. Emdeon. Testimony from Emdeon: NHIN Working Group, December 16, 2009. Washington, DC: 2009.
29. Surescripts. Testimony from SureScripts: NHIN Working Group, December 16, 2009. Washington, DC: 2009.
30. Nissenbaum HF. Privacy in context : technology, policy, and the integrity of social life. Stanford, CA: Stanford Law Books; 2010.
31. Rishel W, Riehl V, Blanton C. Summary of the NHIN prototype architecture contracts: a report for the Office of the National Coordinator for Health IT. Washington, DC; 2007.
32. Stead WW, Lin HS, eds. Computational Technology for Effective Health Care: Intermediate Steps and Strategic Directions. Washington, DC: National Research Council of the National Academies; 2009.
33. Rubin RD. The Community Health Information Movement: Where It’s Been, Where It’s Going. In: O’Carroll, PW, Yasnoff, WA, Ward ML, et al. Public Health Informatics and Information Systems. Springer–Verlag, 2002: 595–616.
96

Appendix 1: Timeline Year 1
17 February, 2004 Governor Bredesen's "Saving TennCare" speech 24 May, 2005 Organizational meeting with Governor Bredesen 4 June, 2004 Governor Bredesen initiates 6—month planning
process 1 September, 2004 Memphis CEO Workshop 14 September, 2004 First clinical work group meeting 5 October, 2004 First technical work group meeting 18 October, 2004 State—wide planning meeting (Nashville) 15 October, 2004 Initial regional assessment completed 29 November, 2004
Core entities, data elements, programmatic linkages
15 November, 2004 Privacy and security group — two—day planning session (approximate)
1 December, 2004 Test connectivity with the Regional Medical Centers; BAAs in the works process
19 January, 2005 CEOs in Memphis review results of formal planning 2 February, 2005 First formal CEO meeting to establish Board
(Memphis) 9 February, 2005 First meeting of the Technical Advisory Panel 23 February, 2005 First eHealth Board meeting (Memphis) — MOU
promulgated 5 April, 2005 Began incorporation as Mid—South eHealth Alliance
(approximate) 9 May, 2005 MOU signed by all participants. 5 of 11 initial
institutions are connected 13 June, 2005 Monthly Board meeting — chartered privacy working
group 14 June, 2005 Security working group has second meeting and
revises action items 28 August, 2005 Technical Advisory Panel meeting (Memphis) 15 September, 2005 Working group gets access to draft Markle policy
documents (8 people) 28 September, 2005 25% data exchange achieved
Year 2 20 October, 2005 Joint meeting of Privacy / security group with
technical design group 1 November, 2005 Finalized emergency department briefings and
needs assessments 1 December, 2005 Didn’t we have a workshop around then? 1 December, 2005 Privacy and security group now consists of 30
experts and advocates 13 December, 2005 TN State—wide privacy and security meeting (2—
days, Nashville) 13 February, 2006 First MidSouth Board Chair elected 27 February, 2006 Board meeting (Memphis) Two–day Technical
Advisory 1 March, 2006 eRX pilot addendum (approximate) 15 March, 2006 MidSouth eHealth Alliance is 501 (c)(3) status by the
IRS 10 March, 2006 RLS under way; LOINC mapping in progress; 15 March, 2006 Attorney hired to draft final version of data sharing
agreements
97

17 March, 2006 MidSouth eHealth Alliance granted non—profit status
23 March, 2006 Privacy and security group begins bi—weekly meetings facing deadline
16 April, 2006 Markle Connecting for Health documents released 2 May, 2006 All past data purged so that all data is from
consenting patients 3 May, 2006 Began obtaining consent & storing production
patient data in system 10 May, 2006 All participation and user agreements signed 23 May, 2006 The exchange is "live" in the Regional Medical
Center ED 26 June, 2006 First statewide Governor's eHealth Council meeting 12 July, 2006 TAP meeting (2 days) 9 August, 2006 Evaluation plan presented to Board; Operations
Committee chartered 22 August, 2006 St. Francis Hospital go live (second emergency
department)
Year 3 13 November, 2006 Documentation of 50% data exchange 13 December, 2006 Third emergency department (Baptist Hospital)
operational 1 January, 2007 Statewide eHealth Council formed? 1 January, 2007 Beginning of two—year formal financial analysis
study 10 January, 2007 Memphis Board houses Executive Director in
Memphis Bioworks 16 January, 2007 Financial working group meets to review ROI (4
hours, Memphis) 5 March, 2007 Presentations to National HISPC 7 March, 2007 TAP meeting (Memphis, 2 days) 8 March, 2007 Montgomery Alabama Medicaid Transformation
Grant workshop 12 March, 2007 Mississippi HIE Design Shop ( approximate date) 14 March, 2007 MidSouth eHealth Alliance enters second year 19 March, 2007 Initial pilots for eRX through the Health Loop Clinic
signed 11 April, 2007 Board Strategic Planning 1 March, 2007 Approximate date of unsuccessful AHRQ Medical
Home application 19 June, 2007 State of Florida Design Shop on transparency in
quality and pricing 27 September, 2007 TAP meeting (Nashville)
Year 4 1 October, 2007 Approximate date of presentation to the NGA 1 October, 2007 Contract Extension to conduct a medication history
pilot (approximate) 4 October, 2007 Initial technical and operational meetings for transfer
to ICA 1 October, 2007 Middle Tennessee discussions begin this month 8 November, 2007 100% data sharing document submitted to AHRQ 1 January, 2008 Use in 9 emergency departments, 4 safety net
clinics, 4 other sites 31 December, 2007 1.3 million records on 880,000 patients 4 March, 2008 TAP meeting (2 days)
98

1 April, 2008 Discharge summaries made available from last participating hospital
1 June, 2008 All 14 emergency department are live and using the system
1 June, 2008 ICA contract signing (approximate date) 1 May, 2008 Middle TN actively pursuing similar (ICA) model for
exchange 22 June, 2008 ICA transition day—long planning meeting 15 August, 2008 Sustainability meeting (State) — August 11 September, 2008 Spokane Washington Design Shop on HIE and
research 23 September, 2008 TAP meeting (Nashville)
Years 5 and 6 21 October, 2008 Statewide Quality DesignShop (2 days) 28 October, 2008 Contract signed with Regenstrief to conduct
Medication History Pilot 31 December, 2008 Final day of two—year financial impact study 1 January, 2009 Data migrated to ICA. Running VU Web front end 1 March, 2009 Work flow studies begin 25 March, 2009 Board Retreat 24 August, 2009 Health Information Partnership for Tennessee
(HIP—TN) formed Robert Gordon (first Chair of MSeHA) is first chair of HIP—TN
1 August, 2009 Baptist Hospital initiates single sign—on pilot allowing HIE through their Web portal
15 June, 2009 Medication Hub pilot introduced (20% of requests produce results)
12 August, 2009 UT faculty present preliminary work on disease—specific outcomes to the Board
29 October, 2009 Work flow studies conclude 1 January, 2010 Full move to ICA system — including Web Browser
(approximate) 1 August, 2010 Contract signed to migrate payment ICA from
Vanderbilt effective 10/1 28 April, 2010 Final TAP meeting (conference call) 8 June, 2010 Louisiana HIE planning meeting
99

Appendix 2: Participating Organizations Baptist Memphis Hospital Baptist Women’s Hospital Baptist Collierville Baptist Tipton Hospital Baptist DeSoto Hospital (in MS) Methodist University Hospital Methodist South Hospital Methodist North Hospital Methodist Germantown Hospital Methodist Fayette Hospital Methodist LeBonheur Childrens Hospital The Regional Medical Center (The MED) Saint Francis Hospital Saint Francis Bartlett Hospital St. Jude Children's Research Hospital Health Loop Clinics (Shelby Co) University of Tennessee Medical Group Christ Community Health Services (5 sites) Memphis Children's Clinic (6 sites) Memphis Health Clinics (2 sites)
100

Appendix 3: Technical Advisory Panel Members George Hripcsak, M.D. Columbia Presbyterian, TAP Chair W. Ed Hammond, Ph.D. Duke University Betsy Humphreys, Ph.D. National Library of Medicine Bill Stead, M.D. Vanderbilt University Medical Center Chelle Woolley Woolley & Associates John Quinn Accenture Tom Rindfleisch, M.S. Stanford University Cristie Upshaw Travis Memphis Business Group on Health The Leapfrog Group Board Susan Christensen Baker, Donelson, Bearman, Caldwell & Berkowitz, PC William Bernstein, Esp. Manatt, Phelps & Phillips, LLP Brenda Motheral Express Scripts Will Pinkston State of Tennessee Antoine Agassi State of Tennessee Melissa Hargiss State of Tennessee
101

Appendix 4: MidSouth eHealth Alliance Board Bob Gordon (Baptist) Chair, 2005—2006 Dave Archer (St. Francis) Chair, 2006—2007 Donna Abney (Methodist) Chair, 2007—2008 Steve Burkett (UTMG) Chair, 2008—2010 Burt Waller (Christ Community) Chair, 2010 (Current) Nancy Lawhead (Mayor’s office) John Nash (St. Jude) Jerry Shenep (St. Jude) Current member Al King (MMCC—TLC) Elizabeth Bradshaw (Health Loop Clinics) Yvonne Madlock (Public Health) Bruce Steinhauer (The MED) Reginald Coopwood (The MED) Current Member Laurie Lee (State) Antoine Agassi (State) Melissa Hargiss (State) Will Rice (State) Current Member
102