
STARENT NETWORKS - IIS Windows Serverlibrary.corporate-ir.net/library/20/209/209953/items/...STARENT...
106
EXPANDING THE BOUNDARIES OF MOBILE COMMUNICATIONS 2007 Annual Report
Transcript of STARENT NETWORKS - IIS Windows Serverlibrary.corporate-ir.net/library/20/209/209953/items/...STARENT...

EXPANDING THE BOUNDARIES OF MOBILE COMMUNICATIONS
2007 Annual Report
STA
REN
T N
ETW
OR
KS
2007 An
nual Report
CORPOR ATE HEADQUARTERS
30 International Place
Tewksbury, MA 01876
+1 978 851 1100
+1 978 640 6825 Fax
MASSACHUSETTS OFFICES
Operations Facility200 Ames Pond Drive, Suite 104
Tewksbury, MA 01876
+1 978 851 1100
+1 978 640 6825 Fax
243 Main Street, 2nd Floor
Buzzards Bay, MA 02532
+1 508 743 0382
+1 508 743 0687 Fax
ILLINOIS OFFICE
1101 Perimeter Drive, Suite 875
Schaumburg, IL 60173
+1 847 330 0900
+1 847 995 1975 Fax
K ANSAS OFFICE
9393 West 110th Street
51 Corporate Woods, Suite 500
Overland Park, KS 66210
+1 913 451 6700
+1 913 451 6750 Fax
WASHINGTON OFFICE
Bear Creek Business Center
18300 NE Union Hill Road, Suite 210
Redmond, WA 98052
+1 425 882 6935
+1 425 882 1860 Fax
VIRGINIA OFFICE
11951 Freedom Drive, 13th Floor
Reston, VA 20190
+1 703 251 4400
+1 703 251 4733 Fax
BR AZIL OFFICE
Starent Do Brasil LTDA
Av. Cidade Jarim, 400
7 andar
Cep. 01454-902
Sao Paulo
Brazil
+55 11 3818 0976
+55 11 3818 0977 Fax
CANADA OFFICE
Starent Networks Canada Limited
The Airway Centre
5925 Airport Road, Suite 200
Mississauga Ontario L4V 1W1
Canada
+1 905 405 6248
+1 905 672 8630 Fax
CHINA OFFICE
Unit 5 Level 3, Tower E1
The Towers, Oriental Plaza
No.1 East Chang An Avenue
Dong Cheng District
Beijing, 100738
China
+86 10 85180050
+86 10 85188155 Fax
EMEA OFFICE
16th Floor, Portland House
Stag Place
London, SW1E 5RS
United Kingdom
+44 (0) 20 7869 8025
+44 (0) 20 7869 8225 Fax
KOREA OFFICE
1907 Suite Dossise VIT 2
Seocho-dong, Seocho-gu
Seoul 137-070
Korea
+82 2 3471 3074
+82 2 3473 6825 Fax
INDIA OFFICES
Starent Networks (India) Pvt. Ltd.
P-17, Phase I, Rajiv Gandhi Infotech Park
Hinjewadi
Pune 411057
India
+91 20 22930100
+91 20 22934723 Fax
5th Floor, Surya Chambers
124, Airport Road, Murugeshpalya
Bangalore-560 017
India
+91 080 40109400
+91 080 41256200 Fax
JAPAN OFFICE
1-12-32 22F Ark Mori Building
Akasaka, Minato-ku
Tokyo, 107-6022
Japan
+81 3 55498660
+81 3 55498661 Fax
Starent®, ST16 ® and ST40TM are trademarks
of Starent Networks, Corp. All other
trademarks, service marks, registered
trademarks, or registered service marks may
be the property of their respective owners.
Copyright © 2008 Starent Networks, Corp.
All rights reserved. Printed in the U.S.A.

STARENT NETWORKS
IS AT THE CENTER OF
THIS COMMUNICATIONS
REVOLUTION PLAYING
A PIVOTAL ROLE IN
MAKING THE INTERNET
TRULY MOBILE.
MANAGEMENT TEAM
Ashraf M. Dahod
Chairman, President
and Chief Executive Offi cer
Pierre G. Kahhale
Vice President of Worldwide Field Operations
Vijay Kathuria
Vice President
and General Manager, India
Robert J. Kelly
Vice President of Manufacturing Operations
Thierry Maupilé
Vice President of Global Marketing
and Business Development
Paul J. Milbury
Vice President of Operations
and Chief Financial Offi cer
Kevin F. Newman
Vice President and General Counsel
Anthony P. Schoener
Vice President of Engineering
Gennady H. Sirota
Vice President of Product Management
BOARD OF DIRECTORS
Ashraf M. Dahod
Chairman, President
and Chief Executive Offi cer
Edward T. Anderson
Managing Partner
North Bridge Venture Partners
Timothy A. Barrows
Matrix Partners
Sean M. Dalton
Managing General Partner
Highland Capital Partners
Matthew J. Desch
Chief Executive Offi cer
Iridium Satellite LLC
James A. Dolce, Jr.
Chief Executive Offi cer
VeriVue, Inc.
Kenneth A. Goldman
Chief Financial Offi cer
Fortinet, Inc.
ANNUAL MEETING
Starent Networks will conduct its
annual meeting of stockholders
on Thursday, May 22, 2008, 10:00 AM
at Wilmer Cutler Pickering Hale and
Dorr, 60 State Street, Boston, MA 02109
LEGAL COUNSEL
Wilmer Cutler Pickering Hale and Dorr
60 State Street
Boston, MA 02109
INDEPENDENT ACCOUNTANTS
PricewaterhouseCoopers LLP
125 High Street
Boston, MA 02110
COMMON STOCK DATA
Listed: NASDAQ Global Market
Symbol: STAR
TR ANSFER AGENT AND REGISTR AR
Computershare
250 Royall Street
Canton, MA 02021
DIVIDENDS
Starent Networks has never paid or
declared cash dividends on its Common
Stock and does not expect to pay any
cash dividends on its Common Stock
in the foreseeable future.
INVESTOR RELATIONS
For additional copies of this report or
other fi nancial information, contact:
Starent Networks, Corp.
Investor Relations
30 International Place
Tewksbury, MA 01876
+1 978 863 3743
Other fi nancial information is available
on the Starent Networks website at
www.starentnetworks.com
This annual report, including the enclosed
Letter to Shareholders, contains, in addition
to historical information, forward-looking
statements within the meaning of Section
27A of the Securities Act of 1933 and Section
21E of the Securities Exchange Act of 1934.
These forward-looking statements are based
on our current expectations, assumptions,
estimates and projections regarding our
business and industry, and we do not
undertake an obligation to update our
forward-looking statements to refl ect future
events or circumstances. We may, in some
cases, use words such as project, believe,
anticipate, plan, expect, estimate, intend,
continue, should, would, could, potentially,
will, may or similar words and expressions
that convey uncertainty of future events
or outcomes to identify these forward-
looking statements. The outcome of the
events described in these forward-looking
statements is subject to known and unknown
risks, uncertainties and other factors,
including the factors set forth in Item 1A Risk
Factors in the Annual Report on Form 10-K
included in this annual report, that could
cause actual results to differ materially from
the results anticipated by these forward-
looking statements. You should read these
factors and the risks described in other
documents that we fi le from time to time
with the Securities and Exchange Commission
in conjunction with the audited consolidated
fi nancial statements and related notes
included elsewhere in this annual report.
DES
IGN
: M
ON
DER
ER D
ESIG
N
”
“
Managing Partner

While the Internet created a world wide web through which we are connected, the mobile phone allowed us to communicate anytime, anywhere. Now, the two are converging. With this convergence, millions of people around the globe are likely to fi rst experience the Internet through the mobile phone.
Starent Networks is at the center of this communications revolution playing a pivotal role in making the Internet truly mobile. While this next generation of communications is in its early stages, key elements are beginning to appear, including broadband speeds over mobile networks, handsets that provide an exciting multimedia experience, services that are adapting to the mobile environment and pricing from mobile operators designed to promote greater usage.
As this market continues to expand, Starent Networks is taking the lead in helping our customers, mobile operators around the world, expand the mobile Internet and deliver multimedia services more rapidly to their customers.
Mobile Multimedia Networking LeadershipThis past year we achieved several noteworthy milestones. We generated record revenues, increased our penetration of the mobile multimedia networking market, introduced innovative products and successfully completed our initial public offering.
Starting with our fi nancial achievements, Starent Networks produced record revenues of $145.8 million, representing growth of approximately 55 percent over 2006 revenues. Our net income for 2007 was $11.5 million, representing growth of approximately 215 percent over 2006 net income.
This success is a result of increased sales to existing customers, growth of our customer base and introduction of innovative products. Today, more than 65 mobile operators around the globe have deployed our solutions. Our customers continue to see signifi cant growth in data subscribers and multimedia service usage. And while an increasing subscriber base drives the need for additional capacity, operators also continue to upgrade networks with next generation radio technologies for increased bandwidth, performance-enhancing features, high-value service offerings and redundancy features for high availability. These dynamics
provide the opportunity for Starent Networks to deliver value through its technological leadership.
Since we entered this market, customers have looked to Starent Networks to provide innovative solutions and we continue to be committed to exceeding this expectation. From our inception, it has been our goal to ensure that our offerings provide a signifi cant performance improvement over existing solutions while providing the network intelligence required to shape the subscriber experience. This combination of intelligence and performance is a defi ning characteristic of Starent Networks. To this end we expanded our high performance product offerings with the introduction of the ST40 multimedia core platform. Customers have responded enthusiastically to the ST40. We have booked signifi cant orders for the ST40 which started shipping in 2007.
During the past year, we expanded our In-line Services with new solutions such as Intelligent Traffi c Control to provide operators with the tools they need to improve subscriber and traffi c management. Additionally, we extended our product portfolio to address emerging markets and 4G radio networks. This included adding to our WiMAX offering a Home Agent to provide the subscriber anchoring point
DEAR STOCKHOLDER,
Th e past decade has transformed the way we communicate, stay informed and are entertained. We have become the Internet generation with high expectations for speed and ease of connectivity. We access video of breaking news, receive updates on global markets, easily send business documents and communicate instantly with our friends both near and far. We expect this experience both at our desks and while on the go, giving rise to the mobile Internet.

as they roam through the network. This solution is also designed to provide seamless roaming between 3G cellular and Mobile WiMAX networks.
The demand for mobile multimedia services increased through the past year and we believe this growth will continue to accelerate. Mobile operators have responded to this increasing demand by adding service options and improving their networks. It has been and will continue to be our mission to help mobile operators achieve their goal to enhance their subscribers’ experience.
In June 2007, we successfully completed an initial public offering, with a follow-on public offering in November 2007. These offerings strengthened our fi nancial position, as we raised approximately $204 million in net proceeds.
Path for SuccessWhile we are very pleased with the progress we made in 2007, we intend to build upon that success and deliver increased long-term value to our customers, our shareholders and our employees. We believe we are well-positioned in the marketplace to take advantage of present and future opportunities.
Our strategy is to remain focused on building on our position of strength by delivering solutions that lead the industry and offer increased value for our customers. Our approach is to be fl exible and agile so we may adapt to changing customer requirements and market trends with speed and decisiveness. As we move forward, we will continue to support our core technologies and invest in advanced technologies to generate new revenues.
As mobile operators extend their reach into the home and enterprise, we will provide solutions they need to address the convergence of fi xed and mobile communications. Technologies such as Femtocell and WiFi will play a key role in this fi xed-mobile convergence as mobile devices are increasingly used in a home or enterprise environment driving down mobile operator capital expenditures and operating expenses.
Providing high-quality solutions is vital to our customers and critical to our technology leadership. We understand that the mobile operator’s business is based on the availability of their network. As a result, high quality is paramount. We have invested considerable resources in testing and quality assurance and will continue to do so to address customer expectations. This dedication enables our customers to trust Starent as a partner in their success.
Building a team of talented, dedicated individuals is essential to successfully take advantage of our market opportunities. We look for individuals who want to make a difference in the market and help us continue to build an exciting company. By the end of 2007, we had 610 full-time employees, of whom 379 were in research and development. Our team members are based in 15 countries, allowing us to work more closely with our customers.
Being customer centric has always been a company core value. Our customers appreciate our dedication to their needs and our fl exibility in responding to their challenges. Maintaining an utmost sense of urgency in addressing customer requirements is imperative as they go through rapid growth. To this end, we are relentless in our focus on serving the customer.
Th ank YouIn August 2008, we will celebrate our eighth anniversary. It has been an exciting experience. On behalf of the entire company, I thank our customers, partners and shareholders for their support and trust as we have become a leader in the mobile multimedia networking market. We believe the way we communicate will continue to transform and mobile communications powered by Starent Networks’ technology will be at the center of this transformation.
Starent Networks is strongly positioned to continue its leadership in this fast growing and changing market, and thus build a strong, long-lasting enterprise. We are inspired by the future of mobile communications. Please join us in this incredible expedition.
Ashraf M. DahodChairman, President and Chief Executive Offi cer

UNITED STATESSECURITIES AND EXCHANGE COMMISSION
Washington, D.C. 20549
FORM 10-K(Mark One)
� ANNUAL REPORT PURSUANT TO SECTION 13 OR 15(d) OF THE SECURITIESEXCHANGE ACT OF 1934
For the fiscal year ended December 31, 2007or
� TRANSITION REPORT PURSUANT TO SECTION 13 OR 15(d) OF THE SECURITIESEXCHANGE ACT OF 1934
For the transition period from to Commission File Number: 001-33511
STARENT NETWORKS, CORP.(Exact name of registrant as specified in its charter)
Delaware 04-3527533(State or other jurisdiction (I.R.S. Employer
of incorporation or organization) Identification No.)30 International PlaceTewksbury, MA 01876
(Address of principal executive offices) (zip code)
(978) 851-1100(Registrant’s telephone number, including area code)
Securities registered pursuant to Section 12(b) of the Exchange Act:
Title of Each Class Name of Each Exchange on Which Registered
Common Stock, $0.001 par value per share The Nasdaq Global Market
Securities registered pursuant to Section 12(g) of the Exchange Act: None
Indicate by check mark if the registrant is a well-known seasoned issuer, as defined in Rule 405 of the SecuritiesAct. Yes � No �
Indicate by check mark if the registrant is not required to file reports pursuant to Section 13 or Section 15(d) of theExchange Act. Yes � No �
Indicate by check mark whether the registrant: (1) has filed all reports required to be filed by Section 13 or 15(d)of the Securities Exchange Act of 1934 during the preceding 12 months (or for such shorter period that the registrantwas required to file such reports), and (2) has been subject to such filing requirements for the past 90 days.Yes � No �
Indicate by check mark if disclosure of delinquent filers pursuant to Item 405 of Regulation S-K is not containedherein, and will not be contained, to the best of the registrant’s knowledge, in definitive proxy or information statementsincorporated by reference in Part III of this Form 10-K or any amendment to this Form 10-K. �
Indicate by check mark whether the registrant is a large accelerated filer, an accelerated filer, a non-acceleratedfiler, or a smaller reporting company. See definitions of ‘‘large accelerated filer,’’ ‘‘accelerated filer’’ and ‘‘smallerreporting company’’ in Rule 12b-2 of the Exchange Act. (Check one):
Large accelerated filer � Accelerated filer � Non-accelerated filer � Smaller reporting company �(Do not check if a smaller
reporting company)
Indicate by check mark whether the registrant is a shell company (as defined in Rule 12b-2 of the Exchange Act).Yes � No �
The aggregate market value of the registrant’s common stock held by non-affiliates of the registrant (withoutadmitting that any person whose shares are not included in such calculation is an affiliate) based on the last reportedsale price of the common stock on June 29, 2007 (the last trading day of the registrant’s second fiscal quarter of 2007)was $324.0 million.
As of February 22, 2008, there were 69,327,256 shares of the registrant’s $0.001 par value per share common stockoutstanding.
DOCUMENTS INCORPORATED BY REFERENCEThe registrant intends to file a definitive Proxy Statement pursuant to Regulation 14A within 120 days of the end
of the fiscal year ended December 31, 2007. Portions of such Proxy Statement are incorporated by reference into Part IIIof this Annual Report on Form 10-K.

STARENT NETWORKS, CORP.YEAR ENDED DECEMBER 31, 2007
ANNUAL REPORT
Table of ContentsPage
PART I.
Item 1. Business . . . . . . . . . . . . . . . . . . . . . . . . . . . . . . . . . . . . . . . . . . . . . . . . . . . . . . . . 4Item 1A. Risk Factors . . . . . . . . . . . . . . . . . . . . . . . . . . . . . . . . . . . . . . . . . . . . . . . . . . . . . 20Item 1B. Unresolved Staff Comments . . . . . . . . . . . . . . . . . . . . . . . . . . . . . . . . . . . . . . . . . 35Item 2. Properties . . . . . . . . . . . . . . . . . . . . . . . . . . . . . . . . . . . . . . . . . . . . . . . . . . . . . . 35Item 3. Legal Proceedings . . . . . . . . . . . . . . . . . . . . . . . . . . . . . . . . . . . . . . . . . . . . . . . . 35Item 4. Submission of Matters to a Vote of Security Holders . . . . . . . . . . . . . . . . . . . . . . . 36
PART II.
Item 5. Market for Registrant’s Common Equity, Related Stockholder Matters and IssuerPurchases of Equity Securities . . . . . . . . . . . . . . . . . . . . . . . . . . . . . . . . . . . . . . 37
Item 6. Selected Financial Data . . . . . . . . . . . . . . . . . . . . . . . . . . . . . . . . . . . . . . . . . . . . 39Item 7. Management’s Discussion and Analysis of Financial Condition and Results . . . . . . . 40Item 7A. Quantitative and Qualitative Disclosure About Market Risk . . . . . . . . . . . . . . . . . . 57Item 8. Financial Statements and Supplementary Data . . . . . . . . . . . . . . . . . . . . . . . . . . . . 60Item 9. Changes in and Disagreements with Accountants on Accounting and Financial
Disclosure . . . . . . . . . . . . . . . . . . . . . . . . . . . . . . . . . . . . . . . . . . . . . . . . . . . . 89Item 9A. Controls and Procedures . . . . . . . . . . . . . . . . . . . . . . . . . . . . . . . . . . . . . . . . . . . . 89Item 9B. Other Information . . . . . . . . . . . . . . . . . . . . . . . . . . . . . . . . . . . . . . . . . . . . . . . . 89
PART III.
Item 10. Directors, Executive Officers and Corporate Governance . . . . . . . . . . . . . . . . . . . . 90Item 11. Executive Compensation . . . . . . . . . . . . . . . . . . . . . . . . . . . . . . . . . . . . . . . . . . . . 90Item 12. Security Ownership of Certain Beneficial Owners and Management and Related
Stockholder Matters . . . . . . . . . . . . . . . . . . . . . . . . . . . . . . . . . . . . . . . . . . . . . 90Item 13. Certain Relationships and Related Transactions, and Director Independence . . . . . . 90Item 14. Principal Accountant Fees and Services . . . . . . . . . . . . . . . . . . . . . . . . . . . . . . . . . 90
PART IV
Item 15. Exhibits and Financial Statement Schedules . . . . . . . . . . . . . . . . . . . . . . . . . . . . . . 91SIGNATURES . . . . . . . . . . . . . . . . . . . . . . . . . . . . . . . . . . . . . . . . . . . . . . . . . . . 93
2

SPECIAL NOTE REGARDING FORWARD-LOOKING STATEMENTS
This Annual Report on Form 10-K, including the information incorporated by reference herein,contains, in addition to historical information, forward-looking statements within the meaning ofSection 27A of the Securities Act of 1933 and Section 21E of the Securities Exchange Act of 1934. Theseforward-looking statements are based on our current expectations, assumptions, estimates and projectionsregarding our business and industry, and we do not undertake an obligation to update our forward-lookingstatements to reflect future events or circumstances. We may, in some cases, use words such as ‘‘project,’’‘‘believe,’’ ‘‘anticipate,’’ ‘‘plan,’’ ‘‘expect,’’ ‘‘estimate,’’ ‘‘intend,’’ ‘‘continue,’’ ‘‘should,’’ ‘‘would,’’ ‘‘could,’’‘‘potentially,’’ ‘‘will,’’ ‘‘may’’ or similar words and expressions that convey uncertainty of future events oroutcomes to identify these forward-looking statements. Forward-looking statements in this Annual Report onForm 10-K may include statements about:
• our ability to attract and retain customers;
• our financial performance;
• our development activities;
• the advantages of our technology as compared to that of others;
• our ability to establish and maintain intellectual property rights;
• our ability to retain and hire necessary employees and appropriately staff our operations;
• the spending of our proceeds from public offerings of our common stock; and
• our cash needs.
The outcome of the events described in these forward-looking statements is subject to known andunknown risks, uncertainties and other factors, including the factors set forth in Item 1A ‘‘Risk Factors’’ inthis Annual Report on Form 10-K, that could cause actual results to differ materially from the resultsanticipated by these forward-looking statements. You should read these factors and the risks described inother documents that we file from time to time with the Securities and Exchange Commission, or SEC, inconjunction with the audited consolidated financial statements and related notes included elsewhere in thisAnnual Report on Form 10-K.
3

PART I
Item 1. Business
Overview
Starent Networks is a leading provider of infrastructure hardware and software products andservices that enable mobile operators to deliver multimedia services to their subscribers. We havecreated hardware and software products that provide core network functions and services, includingaccess from a wide range of radio networks to the operator’s packet core network. Our products andservices also provide management of subscriber sessions moving between networks and application ofbilling and other session policies. Our products and services provide high performance and systemintelligence by combining significant computing power, memory and traffic handling capabilities with aflexible, high availability operating system and other proprietary software. Our products integratemultiple network functions and services needed for the delivery of advanced multimedia services, suchas video, Internet access, voice-over-IP, e-mail, mobile TV, photo sharing and gaming.
Consumers and professionals are increasingly using mobile phones and other multimedia handhelddevices to stay connected to each other, to access the Internet, to utilize business applications and forentertainment. At the same time, mobile operators are experiencing declining profits from voiceservices and increasing competitive pressures. To address these changes, mobile operators are deployingnext-generation wireless networks, such as third generation, or 3G, networks, that are capable ofdelivering high quality, mobile multimedia services to subscribers. In deploying these new networks,mobile operators are seeking packet core network products and services that can deliver higherperformance and functionality than has been available from products repurposed from wirelineapplications.
We have developed our multimedia core network platforms, the ST16 and the ST40, and ourproprietary software specifically to address the needs of packet-based mobile networks. Our productsare designed to provide mobile operators with new revenue opportunities while also reducing theircosts. Our products possess a high degree of system intelligence that allows a mobile operator tounderstand the details of each subscriber session, enabling individual subscriber management andnetwork traffic flow control. Our products also offer high performance capabilities, such as highcapacity, significant data processing rates and high transaction rates, which increase the efficiency of thenetwork and enhance the mobile subscriber’s experience. To increase reliability, our platforms employhardware redundancy and high-availability software techniques. By integrating several network functionsinto a single element, we allow mobile operators to simplify their networks. We designed our productsto be access independent so they can function across a range of 2.5G, 3G and 4G mobile and wirelessradio access networks.
We sell our hardware and software products to leading mobile operators around the world bothdirectly and through OEMs, system integrators and distributors. We were founded in 2000 and ourproducts were first used commercially by a mobile operator in the first quarter of 2003. Since 2003, ourproducts have been deployed by over 65 mobile operators in 25 countries.
Our principal executive offices are located at 30 International Place, Tewksbury, MA 01876. Ourtelephone number is (978) 851-1100. Our website address is www.starentnetworks.com. Through a linkon the Investors section of our website, we make available the following filings after they areelectronically filed with or furnished to the SEC: our Annual Report on Form 10-K, Quarterly Reportson Form 10-Q, Current Reports on Form 8-K, and any amendments to those reports filed or furnishedpursuant to Section 13 or 15(d) of the Exchange Act. All such filings are available free of charge.
4

Industry Background
Mobile operators today are experiencing some of the most dramatic changes to their businessmodels since the advent of mobile communications. These changes are the result of increasedcompetition among mobile operators, the decline in average revenue per subscriber from voicecommunications and the rapid increase in mobile subscriber demand for a wide range of multimediaservices. To address each of these trends, mobile operators are increasing the data services providedthrough their networks. For example, for 2007 Verizon Wireless reported that total data revenues of$7.4 billion were up 65% over 2006, and in the fourth quarter data revenues represented 21.3% of allservice revenues. This trend is expected to continue. Strategy Analytics, an independent research firm,forecasts that data services will account for 24% of subscriber revenue by 2011. According to StrategyAnalytics, global mobile data services revenue is expected to grow 15% annually over the next fiveyears from $106 billion in 2006 to $200 billion in 2011.
Several factors are accelerating the growth of data-rich multimedia traffic on mobile wirelessnetworks. The number of mobile subscribers worldwide continues to grow as established marketsexperience increases in subscriber penetration and developing countries adopt mobile communicationsmore rapidly. For example, according to Wireless Intelligence, an independent research firm, thenumber of worldwide mobile connections is expected to grow 45% from 3.3 billion in 2007 to4.8 billion in 2011. Another factor is our increasingly mobile and interconnected society in whichinformation is accessible and communications are available all the time regardless of location.Moreover, as individuals and enterprises become accustomed to increased access to multimedia serviceson the Internet, including video, music downloads, multimedia messaging and continuous informationand news, there is an increasing desire to have mobile access to these services. Also contributing to thegrowth in traffic is the proliferation of mobile devices designed for multimedia services, such as smartphones, personal digital assistants, laptop computers and other handheld devices.
The Evolution of Mobile Voice and Data Networks
Mobile operators have been aggressively upgrading their networks in response to the demandscreated by the growth in voice and multimedia services. IDC, an independent research firm, estimatesthat capital expenditures in the global wireless infrastructure market in 2006 were more than$46.5 billion. In particular, mobile operators have made significant investments in upgrading from 2Gto 3G radio access technologies that can provide greater bandwidth needed to increase voice capacityand deliver high bandwidth data services.
The two principal radio access interfaces in use today are Code Division Multiple Access, orCDMA, which is used primarily in the United States and Asia, and Global System for MobileCommunications/Universal Mobile Telecommunications System, or GSM/UMTS, which is used in mostmarkets around the world. CDMA mobile operators are currently upgrading to CDMA2000 1X,1xEV-DO Rev. 0 and 1xEV-DO Rev. A, while GSM/UMTS operators are migrating to High SpeedPacket Access, or HSPA. Additionally, many operators are exploring more advanced fourth generation,or 4G, access technologies, such as Mobile WiMax and Long Term Evolution/System ArchitectureEvolution, or LTE/SAE.
In addition to upgrading the radio access portion of their networks, mobile operators are deployingpacket-based technology to supplement or replace circuit-based technology. Traditional circuit networks,which were developed for voice communications, establish a dedicated circuit for each call. Circuitnetworks are relatively inefficient and do not allow for high-bandwidth multimedia services. Packetnetworks split traffic into multiple pieces of data, or packets, that are routed over an Internet Protocol,or IP, network, eliminating the need to establish a dedicated circuit for each call or session. The use ofa packet core network increases network efficiency and lowers operating costs, while enabling anoperator to deliver multimedia services. As more multimedia services are deployed, more traffic will
5

flow over the packet network. Over time, we expect mobile operators will convert entirely to packetnetworks not only for data services but also for all voice communications.
As mobile operators implement more multimedia services on their packet networks, they arelooking to further standardize the delivery of these services. New core network architecture standardsare being developed, such as IP Multimedia Subsystem, or IMS, and Multimedia Domain, or MMD.These standards will also be implemented by wireline operators. The implementation of these newdelivery architecture standards by both mobile and wireline operators will provide an opportunity forfixed-mobile convergence, which is the ability of a subscriber to have a uniform service experience asthey move between a mobile network, such as a 3G network, and a wireline or a fixed wireless network,such as WiFi. With the convergence of mobile and wireline networks, telecommunications operatorswill be able to provide services to users irrespective of their location, access technology andcommunications device.
The Need for Intelligent and Robust Network Products and Services
As mobile networks transition to next-generation access technologies and become increasinglypacket-based, many mobile operators want their networks to be ‘‘intelligent.’’ An intelligent networkprovides mobile operators with the ability to inspect data packets from individual transactions in detail.This deep packet inspection allows the mobile operator to shape each subscriber session using qualityof service, bandwidth allocation and traffic flow control. This ability to actively manage network trafficflows allows mobile operators to deliver a consistent experience as subscribers roam through a mobilenetwork or move across different types of networks. In order to offer reliable and intelligent mobilenetworks that provide a high quality subscriber experience and are able to handle increasing amountsof network traffic, operators require infrastructure products and services that:
• Identify and manage individual communications sessions. The network needs to be able toidentify, manage and manipulate each subscriber session by applying policy and chargingdecisions based on the mobile operator’s business model or subscriber policies.
• Handle significant traffic. As multimedia services dramatically increase the volume of networktraffic, networks must be capable of handling this traffic without diminishing the subscriberexperience. This capability will require significant computing power and data processing rates.
• Simplify the network. As mobile operators provide an increasing number of services andcapabilities, they will need to simplify their networks so they can limit the deployment of costlynew equipment each time a new service or capability is added.
• Deliver quality of service, reliability and availability. As mobile subscribers pay a premium foradvanced multimedia services, they will demand that these advanced services be of high quality,reliable and available whenever the subscriber wants to access them.
• Support multiple radio access technologies and subscriber management. As mobile networks evolveto include different access technologies, mobile operators need the ability to provide the sameservices regardless of access mode and to apply common subscriber management tools, such asbilling and subscriber authentication, across multiple access networks.
• Are easy to upgrade. As networks continue to evolve rapidly, operators must be able to easily andcost effectively integrate new access technologies and services with their existing networks andincrease capacity.
Historically, mobile operators deploying packet networks have been required to retrofit networkinfrastructure hardware and software originally designed for wireline networks. These products haveincluded repurposed network switches, routers and off-the-shelf enterprise servers, none of which are
6

able to sufficiently satisfy the needs of mobile operators to deliver efficient and reliable multimediaservices.
While routers and network switches are capable of forwarding packets of information, they lackthe integrated processing power, memory and software needed to examine individual packets and applydefined business policies and subscriber services to them. To overcome these shortcomings, mobileoperators typically connect the repurposed switches and routers with numerous enterprise servers inorder to provide services such as deep packet inspection, virtual private networks and firewalls. Thesemulti-element configurations require network traffic to make multiple hops through different networksand equipment for the additional services. This can cause network traffic delays and limit subscriberand network visibility. These delays result in slower transmission speeds, a lower quality experience forthe subscriber and potentially lower service use. These delays also have a negative impact on real-timeservices, such as voice and streaming video.
These multi-element configurations can increase network complexity, resulting in a product that isdifficult and expensive to scale and often costly to operate. This complexity makes the deployment ofnew network functions and the addition of new subscriber services time-consuming and expensivebecause it often requires a new configuration. Additionally, the need for redundancy to improve servicereliability further increases both the complexity and the cost of these multi-element configurations.Even with additional redundancy, the complexity of these systems creates multiple potential points offailure, and engineering a multi-element product that can handle the large volumes of traffic on atypical mobile operator’s network can be difficult.
Our Solutions
We have introduced new, ‘‘purpose-built’’ network infrastructure products comprised of bothhigh-performance hardware and software that address the specific challenges faced by mobile operatorsin offering multimedia services. Our products fulfill a number of network functions that enable carriersto deliver multimedia services across a range of network architectures. Unlike repurposed multi-element configurations, our integrated products and services were designed specifically to provide thehigh capacity, data processing rates, computer processing capability and software required to meet theneeds of mobile operators in offering packet-based multimedia services.
Our hardware and software products and services provide six key, integrated capabilities thatcreate enhanced revenue opportunities and facilitate reduced costs for mobile operators:
• Intelligence to shape the subscriber experience. Our products’ system intelligence allows mobileoperators to manage each subscriber session, which is critical for creating, delivering andcharging for differentiated services, while enhancing the subscriber experience. Our productscombine custom software with significant processing power and memory to conduct a detailedinspection of each subscriber session and to associate that session with a subscriber need,operator service requirement or operator business policy.
• High performance. Our products improve the performance of a mobile operator’s network byenhancing the network’s capabilities and efficiencies. Our products are able to handle increasingamounts of network traffic to support a large number of subscribers on one platform. They alsoprovide high bandwidth and data processing rates for improved traffic capacity and flow, whichincreases network efficiency and performance. In addition, the high call transaction ratesprovided by our products enhance the ability of our products to handle increasing amounts ofnetwork traffic, reduce unwanted delays in network traffic and allow the subscriber to have quickaccess to network services.
• Simple and flexible network architecture. Our products allow mobile operators to integrate anumber of network functions and enhanced services into a single hardware platform. In addition
7

to providing network functions such as access, management of subscriber sessions movingbetween networks and application of billing and other session policies, our platforms are capableof integrating advanced services, such as enhanced charging and billing, firewall protection,security and content filtering. We refer to these services as in-line services. Traditionally suchservices would be deployed out of line from the session stream in a server farm elsewhere in thenetwork. By integrating both network functions and in-line services, mobile operators cansimplify the design of their networks, more rapidly deploy services and improve the flow ofnetwork traffic, while also reducing costs.
• Reliability and redundancy. Our system architecture provides a high level of resiliency andprotects the subscriber’s experience. All of our platforms’ system resources, including those usedfor redundancy, can be shared. Our platforms employ hardware redundancy as well ashigh-availability software techniques, such as session recovery, fault containment and statereplication, to maximize network uptime, maintain subscriber sessions and retain billinginformation. The self-healing attributes of our software architecture protect the system byanticipating failures and creating mirror processes. Also, our product allows mobile operators toimplement geographic redundancy.
• Support multiple radio access technologies. Our products are capable of supporting multiple radioaccess technologies, including CDMA, GSM/UMTS and WiMax. This capability allows mobileoperators to deliver a uniform service experience to subscribers from a single platform,simplifying the network and limiting operator costs.
• Well positioned for future technology upgrades. While designed for use in today’s mobile networks,our products are also readily upgradeable to respond to evolving mobile operator environmentsor requirements, such as IMS and MMD. Our platforms can typically provide new networkfunctions or enhanced services through a software upgrade. This simplifies service deploymentand network operations, while reducing potentially costly upgrades resulting from the investmentin new network elements each time a new technology is introduced.
Our Strategy
Our objective is to strengthen our leadership in the mobile network infrastructure market byenabling mobile operators to enhance the subscribers’ experience, playing a key role in the migration toan all-packet core network and providing products and services that offer new and increased revenueopportunities for mobile operators. Principal elements of our strategy include the following:
• Extend our technological leadership. We believe we have market leading products and servicestoday, and we will continue to invest in research and development to maintain our leadershipposition through the introduction of new products and enhancements to existing products. Weare focusing our research and development efforts on improvements to capacity, data processingrates and service flexibility, as well as capabilities to add new network functions and enhancedservices. We will also use new technologies, such as advanced processing chips, as they becomeavailable to increase the performance, capacity and functionality of our products. For example,we recently introduced our ST40 platform, which became generally available in the third quarterof 2007.
• Increase market penetration. Mobile operators continue to increase network coverage andcapacity, as well as their service offerings. These changes offer new and expanded salesopportunities both to our existing customers and potential new customers. Given the fastertransition to high-bandwidth networks by CDMA2000 mobile operators, we have achieved ourhighest number of deployments in this market, but also have deployments in the GSM/UMTSmarket. However, significantly more operators worldwide currently utilize GSM/UMTS thanCDMA technologies. We believe a significant opportunity for growth is from sales to the GSM/
8

UMTS operators as they continue to transition to high-bandwidth networks. We intend toincrease our penetration of both CDMA and GSM/UMTS operators.
• Expand into evolving markets. To maintain our leadership in the mobile infrastructure market, weplan to address new radio access network architectures and technologies, such as Mobile WiMax,LTE/SAE, IMS and MMD. Because one of the key features of our platforms is accessindependence—the flexibility and power to deploy a single hardware platform across multipleaccess architectures and technologies—we will continue to invest in preserving our products’ability to support new technologies. Additionally, we will continue to participate in industrystandards development organizations to contribute to the development of new network standardsand architectures.
• Increase the number of features. We plan to continue to develop new features based on specificcustomer requests and anticipated market needs. For example, we recently introduced ageographic redundancy feature. We charge our customers for additional standard and customfeatures.
• Expand our sales channels. We have developed direct relationships with many leading mobileoperators, including those serviced by our OEMs, system integrators and distributors. We intendto continue to expand these relationships and pursue new mobile operator relationships to sellour products. At the same time, our OEM, system integrator and distributor relationships haveallowed us to reach a broad mobile operator market. We intend to continue to pursue newOEM, system integrator and distributor relationships and expand our direct sales force.
• Continue to offer a high level of support. We believe that one critical factor of our success hasbeen our willingness to respond to specific customer requirements and offer a rapid andthorough resolution of mobile operator issues. We focus exclusively on the mobile multimediacore network and, as a result, are able to provide focused support and technical expertise. Weintend to continue to offer a high level of support to our customers.
Our Products
Our products consist of the ST16 and ST40 hardware platforms, proprietary software that allowsthe ST16 and ST40 to be configured for specific network functions, software that enables operators toprovide in-line services and the Starent Web EMS, a web-based element management system thatallows a mobile operator to monitor and operate the ST16 and ST40 through a graphical user interface.
ST16 and ST40 Multimedia Core Platforms
The ST16 has been deployed since 2003 and the ST40 was introduced in the second quarter of2007 and became generally available in the third quarter of 2007. The ST16 and ST40 are robusthardware platforms that combine high capacity, availability and performance with subscriber andnetwork intelligence. The ST16 and ST40 are radio access-independent and can be deployed in multiplemobile network environments, including CDMA2000 1X, 1xEV-DO Rev. 0 and Rev. A, GPRS, UMTSand Mobile WiMax networks.
The ST16 and ST40 each consists of a chassis, application or processing cards and line cards. Theapplication or processing cards provide system management and process all network functions andservices. The line cards provide the physical connection to the network.
9

The ST16 platform is well suited to meet the needs of most multimedia networks. The ST40platform offers increased performance capabilities and capacity required by mobile operators for highdemand, high capacity, multimedia networks.
Call Completions Total Subscriber Data Session CapacityPlatform Per Second* Transmission Speed* (single chassis)*
ST16 . . . . . . . . . . . . . . . . . . . . . . . . . . . . . . . . Up to 6,000 4.2 Gbps Up to 1,500,000ST40 . . . . . . . . . . . . . . . . . . . . . . . . . . . . . . . . Up to 15,000 10 Gbps Up to 3,000,000
* Depending upon configuration.
The ST16 and ST40 are capable of providing multiple network functions and in-line services.
Network Functions
The ST16 and ST40 can be configured with software packages to provide each of, or acombination of, the following network functions:
• GGSN. The Gateway GPRS Support Node, or GGSN, is the network element on a GSM/GPRSor UMTS/HSPA packet core network that performs multimedia session establishment andtermination, accounting and traffic routing.
• Home Agent. The Home Agent is the network element on the subscriber’s home network thateffectively allows the subscriber to be reachable at its home address even when the subscriber isnot attached to its home network. The Home Agent enables multimedia service mobilitybetween multiple networks.
• PDSN/FA. The Packet Data Serving Node/Foreign Agent, or PDSN/FA, is the network elementon a CDMA2000 packet core network that performs multimedia session establishment andtermination, accounting and traffic routing. When enabled, PDSN/FA can also providere-direction to the subscriber’s home network through communications with the Home Agent.
• Starent Session Control Manager. The Starent Session Control Manager is an integrated networkelement that enables multimedia services such as voice-over-IP and IP television. The StarentSession Control Manager integrates a Session Initiation Protocol Proxy/Registrar, Proxy-CallSession Control Function and Policy Agent to perform voice-over-IP routing, translation andmobility, admission control, authentication and registration.
• Additional Functionality Configuration for ST40. Our ST40 platform offers the followingadditional functionality:
• SGSN. The Serving GPRS Support Node, or SGSN, is the network element that will trackthe location of mobile devices on a GPRS or UMTS network and route packet traffic tothat location.
• PDIF and PDG. The Packet Data Interworking Function, or PDIF, and the Packet DataGateway, or PDG, are network elements on CDMA2000 and UMTS packet core networks,respectively, that will perform multimedia session establishment and termination,accounting, secure tunneling and traffic routing from a WiFi network.
• IPSG. The Internet Protocol Services Gateway, or IPSG, is the network element that willbe capable of implementing services, such as enhanced charging and billing, intelligenttraffic control or content filtering, in the packet core network behind a PDSN, GGSN, ASNGateway or other elements.
10

• Future Functionality. We currently plan to introduce additional functionality for our ST16 andST40 platforms, including:
• ASN Gateway. We have announced the Access Service Network, or ASN, Gateway, which isthe network element in a Mobile WiMAX packet data network that performs multimediasession establishment and termination, authentication, accounting and traffic or servicesrouting between radio access and packet core network.
Each of the ST16 and the ST40 is able to support one or more of these functions—as required bythe mobile operator—in a single piece of equipment by enabling appropriate software features. As aresult, the ST16 and the ST40 provide converged, universal services to multiple access technologies,which can be more cost effective and easier to manage than the deployment of many single-purposeaccess gateways.
‘‘In-line’’ Services
The ST16’s and ST40’s processing power and abundant memory are designed to enable mobileoperators to integrate multiple in-line service capabilities into the core network. In-line services that wecurrently offer or plan to offer in the future include enhanced charging and billing, intelligent trafficcontrol, peer-to-peer detection and control, stateful firewall and content filtering. Mobile operators candeploy in-line services along with required core network functions such as a PDSN, GGSN, HomeAgent or ASN Gateway. Deploying these service functions in-line with the core network can providemore efficient network traffic flows and a more secure and satisfying subscriber experience.Additionally, in-line services allow a mobile operator more flexibility and greater simplicity in designingtheir networks because they have fewer network elements, such as servers, load balancers, firewalls androuters to deploy and support. This can lead to a higher degree of network optimization, loweroperating costs and a higher level of service assurance.
Starent Web EMS
The Starent Web Element Management System, or EMS, is a centralized service and networkelement management product that controls the ST16 and ST40. Starent Web EMS is a multi-serviceelement manager, which provides fault, configuration, accounting, performance and security functionsthrough a graphical user interface. Starent Web EMS enables mobile operators to monitor, manage andcontrol the performance of the ST16 and ST40, as well as integrate and interoperate with othercomponents and network management systems. The Starent Web EMS also provides a variety ofperformance and operation records based on mobile operator defined parameters.
Our Technology
We have spent over seven years developing and seek to constantly improve our technology andproducts. This development includes our custom hardware platforms, our operating system, eachnetwork function we support, in-line service capabilities, our element management system and manycustomer-required features. Our technology integrates system intelligence, service flexibility, highavailability and high-performance within products that can distribute all service tasks across the entireplatform. In addition, as we have deployed our products with many of the world’s largest mobileoperators, we have been tasked to address operator specific requirements. These requirements, such asgeographic redundancy and custom accounting and protocol development, have required significantdevelopment.
Platform Architecture
Each of the ST16 and ST40 uses a distributed architecture that allows it to allocate tasks or systemactions across the entire platform. This distributed architecture provides for simplicity, ability to handle
11

increasing amounts of network traffic and improved reliability, manageability and performance overalternative bladed architectures. A bladed architecture, where each processing card, or blade, has adistinct functionality, requires the addition of new blades for new services and each service wouldrequire a unique blade for redundancy. We believe the distributed architecture of our products enablesmore efficient hardware usage with enhanced performance characteristics. Additionally, the applicationof billing and other session policies control and packet forwarding paths are separated on differentprocessing resources. This separation of processes improves the ability to handle increasing amounts ofnetwork traffic and traffic flow efficiencies while diminishing latency, or delay, within the session, andensuring faster session setup and handoff. As a result, mobile operators can deploy more efficientmobile networks that can handle a greater number of concurrent sessions with less hardware.
System Intelligence
Our products and services provide mobile operators with the ability to inspect data packets fromindividual transactions in great detail. This deep packet inspection allows the ST16 and the ST40 tointelligently shape each subscriber session using quality of service, bandwidth allocation and traffic flowcontrol, which in turn allows mobile operators to actively manage network traffic flows to improve thesubscriber’s experience.
The ST16 and ST40 also offer service steering, which allows mobile operators to efficiently steer orroute each session through appropriate services based on key policies for that particular session orsubscriber.
The ST16’s and ST40’s system intelligence provides mobile operators with the following keycapabilities:
• increased information granularity and flexibility for billing, network planning and usage trendanalysis;
• information sharing with external application servers that perform value-added processing;
• use of subscriber-specific attributes to launch unique applications on a per-subscriber basis;
• extension of management of session information as subscribers move between networks toapplications that are not mobility aware; and
• enabling policy, charging and Quality of Service and similar features.
Service Assurance
The ST16 and ST40 employ hardware redundancy as well as high-availability software techniques,such as session recovery, fault containment, and state replication, to maximize network uptime,maintain the subscriber session and retain billing information. In addition to the high-availabilitysoftware techniques, the following service availability features are included with the ST16 and ST40:
• task checkpoint and migration;
• M:N or 1:1 redundancy for all hardware elements;
• geographic redundancy;
• on-line software upgrades; and
• dynamic hardware removal and additions while the product is operating, or hot swapability.
12

Multi-access Technologies
The use of multiple radio access technologies by mobile operators should be invisible to thesubscriber. This seamless mobility between different access technologies enables mobile services to bemaintained as the subscriber moves from one access technology to another. For example, as asubscriber using their mobile device on a 3G network enters an airport, they can be seamlesslyconnected to a higher-bandwidth WiFi network, if available. The architecture of our platforms isdesigned to support multiple radio access networks, and is capable of doing so in a single platform.
Starent Operating System
Our operating system software is based on a Linux software kernel, which provides a robust,proven software environment offering design flexibility. We have implemented significant customizationand other elements to the Linux software kernel to design the operating system for high availability,service flexibility and high-performance.
Our operating system has the following key features:
• Scalable control and data operations. System resources can be allocated separately for applicationof billing and other session policies and packet forwarding paths. For example, resources couldbe dedicated to performing routing or security control functions while other resources arededicated to processing subscriber session traffic. As network or service requirements grow andcall models change, hardware resources can be easily added to provide more processing power.This method of being able to handle increased network traffic, known as scalability, simplifiesservice deployment and network expansion.
• Fault containment. The system isolates faults at a low level. In addition, processing tasks aredistributed, so if an unrecoverable software fault occurs the entire processing capabilities for thattask are not lost. Subscriber session processes can be sub-grouped into collections of sessions, sothat if a problem is encountered in one sub-group, subscribers in another sub-group will not beaffected by that problem.
• Self healing. The self-healing attributes of the software architecture protects the system byanticipating failures and creating mirror processes locally or across resource card boundaries tocontinue the operation with little or no disruption of service. This architecture allows the systemto perform at a high level of resiliency and protect subscriber data sessions while also ensuringaccounting data integrity for the mobile operator.
• Process distribution. All system tasks or processes can be distributed across the platformprocessing cards to fit the needs of the network model or specific processing requirements.Because tasks or processes are not required to be assigned to a specific card, system scalabilityand redundancy is significantly simplified.
• Leverages third party software components. The use of the Linux operating system kernel enablesthe reuse of many well-tested, stable, core software elements such as protocol stacks,management services and application programs.
• Supports dynamic hardware removal/additions. By migrating tasks from one resource card toanother using software controls, application cards can be removed or replaced while our productis operating, or hot swapped, to dynamically add capacity or perform maintenance operationswithout service interruption.
• Multiple context support. The system can be fully virtualized to support multiple logical instancesof each service. This eliminates the possibility of any one domain disrupting operations for allsubscribers in the event of a failure.
13

Customer Support and Services
We provide wide-ranging and highly interactive support, including pre-sales consultation, networktesting and trialing, network design, installation, operation, post-sales maintenance and training. Oursupport organization provides 24x7 operational support. This support team consists of resources locatedthroughout the world which provides our customers timely access to our support technicians andengineers.
Our system engineering organization provides our customers with network testing and trialing,network design and installation assistance, third party product integration, as well as support withconfiguration and operation. This group focuses on interoperability testing with other networkcomponents and large or complex support requirements and acts as an escalation point for the supportorganization.
We provide our customers with a variety of training courses on the deployment, operation andmaintenance of our products. Training is performed in our Technical Education Center located inTewksbury, Massachusetts or at the customer’s location. These courses generally range from two to fivedays and cover a variety of topics from product overview and installation through configuration andmaintenance.
Sales and Marketing
We market and sell our products to mobile operators through our direct sales organization andindirectly through our OEMs, system integrators and distributors. In 2007, 69% of our revenues werefrom direct sales and 31% were from sales through OEMs, system integrators and distributors and in2006, 50% of our revenues were from direct sales and 50% were from sales through OEMs, systemintegrators and distributors.
Direct Sales
Our direct sales organization focuses on selling to leading mobile operators throughout the world.We have sales personnel in a number of markets throughout the world, including the United States,Brazil, Canada, China, Germany, France, Japan, Korea, Mexico, Spain and the United Kingdom.
OEM, System Integrator and Distributor Relationships
We have developed relationships with a number of OEMs, system integrators and distributors,including Alcatel-Lucent, Samsung Electronics and ITOCHU Techno-Solutions Corporation, alsoknown as CTC. In some cases, these relationships have allowed us to reach a broader mobile operatormarket than was possible through our direct sales efforts. We believe that OEMs benefit from theserelationships by leveraging our research and development expertise, reducing the time-to-market fornew products and realizing incremental revenues from the sale of complementary hardware, softwareand services resulting from the incorporation of our technology into their product offerings. The systemintegrators and distributors with whom we have relationships specialize in building integrated productsfor mobile operators by putting together components from different vendors. Typically, when an OEM,system integrator or distributor services a large mobile operator, we also maintain a direct relationshipwith the operator. Maintaining a direct relationship with mobile operator customers from our indirectsales channel facilitates offering our customer support and services program.
While our indirect sales channel continues to be an important part of our overall business, directrelationships with certain mobile operators may offer better opportunities for increasing sales andmaintaining a high-level of customer support. Accordingly, we terminated our OEM relationship withNortel Networks for products in the GSM/UMTS market effective December 2006 because we were nolonger strategically aligned with Nortel Networks on future packet core products for mobile operators
14

and because there had been no sales of our products through that indirect channel. We also terminatedour OEM relationship with Nortel Networks for products in the CDMA market effective March 2007because we were no longer strategically aligned with Nortel Networks on future packet core productsfor mobile operators and to allow specific major mobile operators to purchase directly from us. Wehave established direct relationships with some of the CDMA operators formerly serviced by NortelNetworks, and we are continuing to seek additional direct sales relationships with other CDMAoperators formerly serviced by Nortel Networks. We are also in discussions to establish a new resellerrelationship with Nortel Networks to continue to service other mobile operator customers indirectly.
Marketing and Product Management
Our marketing and product management organizations focus on defining our productrequirements, educating our mobile operator customers and our OEMs, system integrators anddistributors, media and analysts on our technology, building brand awareness and supporting the effortsof the sales organization. We market our products through industry events, public relations efforts,collateral materials and on our Internet site. We participate in industry events, including managementpresentations on the topics of 3G mobile wireless network technologies and the efficient delivery ofmultimedia services. We believe the combination of these efforts creates awareness of us and ourproducts and technologies.
Customers
Our primary customers are mobile operators located throughout the world that are deploying orseeking to deploy packet-based multimedia services over next generation networks. We also sell ourproducts to OEMs and system integrators.
Over 65 mobile operators in 25 countries, including leading mobile operators using the CDMAand the GSM/UMTS networks, have deployed our products.
In each of years ended December 31, 2007, 2006 and 2005, we derived more than 90% of ourrevenues from our top five customers. In 2007, we had three customers, CTC, Sprint/Nextel andVerizon Wireless, that each represented more than 10% of our revenues. In 2006, Nortel Networks andVerizon Wireless each represented more than 10% of our revenues and in 2005, CTC, Samsung andVerizon Wireless each represented more than 10% of our revenues. We terminated our OEMrelationships with Nortel Networks in December 2006 and March 2007.
Information with respect to the percentage of our revenues based on customers’ geographicallocations is set forth below:
Year EndedDecember 31,
2007 2006 2005
United States and Canada . . . . . . . . . . . . . . . . . . . . . . . . . . . . . 76% 87% 48%Japan . . . . . . . . . . . . . . . . . . . . . . . . . . . . . . . . . . . . . . . . . . . . 13 4 31Korea . . . . . . . . . . . . . . . . . . . . . . . . . . . . . . . . . . . . . . . . . . . . 9 1 20Rest of world . . . . . . . . . . . . . . . . . . . . . . . . . . . . . . . . . . . . . . . 2 8 1
Total . . . . . . . . . . . . . . . . . . . . . . . . . . . . . . . . . . . . . . . . . . . 100% 100% 100%
15

Information with respect to our long-lived assets by geographic location is set forth below:
At December 31,
2007 2006
(in thousands)
United States . . . . . . . . . . . . . . . . . . . . . . . . . . . . . . . . . . . . . . $15,614 $ 7,853India . . . . . . . . . . . . . . . . . . . . . . . . . . . . . . . . . . . . . . . . . . . . 4,676 2,231Rest of world . . . . . . . . . . . . . . . . . . . . . . . . . . . . . . . . . . . . . . 162 212
Total . . . . . . . . . . . . . . . . . . . . . . . . . . . . . . . . . . . . . . . . . . $20,452 $10,296
In December 2003, we entered into a general purchase agreement with Cellco Partnership, alsoknown as Verizon Wireless, pursuant to which we supply our products to Verizon Wireless and itsaffiliates. Verizon Wireless is not under any obligation to purchase products from us under theagreement. The agreement provides that the prices, terms, conditions, warranties and other benefitsthat we offer to Verizon Wireless be no less favorable than those that we offer to any other customerin the United States that has equal or greater volume purchases and/or purchase commitments to us.
Under the terms of the agreement, we generally provide Verizon Wireless with licenses to thesoftware embedded in our hardware products solely for use in connection with the product in whichsuch software is embedded. In addition, we grant Verizon Wireless a separate, enterprise-wide,perpetual license to use, copy and modify our Starent Web EMS software. In exchange for up-frontlicense fees, we also grant Verizon Wireless non-exclusive, non-transferable, perpetual, worldwidelicenses to several software features in our products for use in connection with an unlimited number ofour products. For all software licensed to Verizon Wireless, we agree to place the source code andrelated documentation for such software into escrow with a third party escrow agent to be released ifwe are acquired by a competitor of Verizon Wireless, we fail to provide maintenance and supportservices as specified in the agreement, or we become insolvent or bankrupt.
The agreement specifies that we provide Verizon Wireless with 24x7 technical support in exchangefor annual maintenance and support fees. These annual maintenance and support fees are determinedas a percentage of the price of all products that Verizon Wireless has purchased from us. VerizonWireless is entitled to service credits, in amounts not to exceed the support fees paid in each quarter, ifwe fail to meet the support performance standards set forth in the agreement. We also make softwaredevelopment services available to Verizon Wireless from time to time for the development ofcustomizations specific to Verizon Wireless systems in exchange for time and materials based fees.Unless otherwise agreed on a case-by-case basis, Verizon Wireless owns any software customizations wesupply under the agreement.
Pursuant to the agreement, we agree to indemnify, defend and hold harmless Verizon Wireless andits affiliates from any claims of infringement or misappropriation of intellectual property rights arisingfrom or in connection with the products and services provided by us or any claims arising from ourproducts or the actions of our employees.
The agreement renews annually unless either Verizon Wireless or we provide notice of terminationat least sixty days prior to the end of the then-current term. Verizon Wireless may terminate theagreement at any time with or without cause.
Research and Development
Our technology requires continued investment to maintain our leadership position. Accordingly, webelieve that a strong research and development program is critical to our business. Our research anddevelopment organization focuses on designing, developing and enhancing our products as well as the
16

technology underlying our products, investigating new technologies, performing testing and qualityassurance activities and integrating our products with third-party products, if necessary.
As of December 31, 2007, we had 90 research and development personnel in the United Statesand 289 research and development personnel in India. Our research and development organization hasextensive industry experience that provides us with the core competencies required to deliver productssuitable for global mobile operator networks. Our employees’ expertise includes:
• carrier-class equipment design and manufacturing;
• IP networking;
• mobile networking;
• voice and multimedia services;
• element management; and
• wireless access.
We have made substantial investments in product and technology development since we werefounded in 2000. Research and development expenses totaled $38.9 million in 2007, $26.0 million in2006 and $18.1 million in 2005.
Manufacturing
We outsource the manufacturing of our ST16 and ST40 products to Plexus Corp., a global providerof subcontracting services. Plexus fulfills our manufacturing requirements in Boise, Idaho, and has otherlocations across the United States at which our requirements also may be fulfilled. Once products aremanufactured, they are sent to our headquarters in Tewksbury, Massachusetts, where we perform finalassembly and quality control testing to ensure reliability. We believe that outsourcing ourmanufacturing enables us to conserve working capital, better adjust to fluctuations in demand andprovide for timely delivery to our customers.
Although there are multiple sources for most of the component parts of our products, somecomponents are sourced from single or, in some cases, limited sources. For example, Plexus purchasesthrough electronics distributors various types of central processors, network processors, switch fabrics,oscillators and memory devices from various component manufacturers, including BroadcomCorporation, Intel Corporation, Viking Interworks, a division of Sanmina-SCI, and VitesseSemiconductor Corporation, which are presently Plexus’ sole sources for these particular components.We typically do not have a written agreement with any of these component manufacturers to guaranteethe supply of the key components used in our products, and we do not require Plexus to have a writtenagreement with these component manufacturers. We regularly monitor the supply of the componentparts and the availability of alternative sources. We provide forecasts to Plexus so that it can source thekey components in advance of their anticipated use, with the objective of maintaining an adequatesupply of these key components for use in the manufacture of our products. In addition, we maintain asmall inventory of key components that we believe are most critical to the manufacturing process.
Competition
The market for mobile network infrastructure products is highly competitive and rapidly evolving.The market is subject to changing technology trends, shifting customer needs and expectations andfrequent introduction of new products. With the growth and adoption of mobile multimedia services,we expect competition to continue and intensify for all our products and in all our target markets.
17

We believe there are a number of important factors to compete effectively in our market,including:
• products and services that are highly reliable and provide high performance;
• scalability and service integration capabilities;
• system intelligence;
• breadth of network interoperability, access independence and standards support;
• high level of customer support and customer interaction; and
• competitive pricing.
Our primary competitors consist of major network infrastructure providers, including CiscoSystems, Inc. and UTStarcom, Inc. in the CDMA2000 market and Cisco Systems, HuaweiTechnologies Co., Ltd., LM Ericsson Telephone Co. and Nokia Siemens Networks B.V. in the GSM/UMTS market. As next-generation technologies such as Mobile WiMax, IMS and MMD develop, weexpect to compete in those new markets with some of these existing competitors as well as with newcompetitors. In our sales to OEM customers, we face the competitive risk that OEMs might seek todevelop in-house alternative products to those currently provided by us. Additionally, OEMs mightelect to source technology from our competitors.
Our current and potential competitors may have significantly greater financial, technical, marketingand other resources than we do and may be able to devote greater resources to the development,promotion, sale and support of their products. Our competitors may have more extensive customerbases and broader customer relationships than we do, including relationships with our potentialcustomers. In addition, these competitors may have longer operating histories and greater namerecognition than we do. Our competitors may be in a stronger position to respond quickly to newtechnologies and may be able to market and sell their products more effectively. Moreover, if one ormore of our competitors were to merge or partner with another of our competitors, the change in thecompetitive landscape could adversely affect our customer relationships and competitive position orotherwise affect our ability to compete effectively.
Intellectual Property
Our success depends in part upon our ability to obtain and maintain proprietary protection for ourproducts, technology and know-how, to operate without infringing the proprietary rights of others andto prevent others from infringing our proprietary rights. Our policy is to seek to protect our proprietaryposition by, among other methods, filing United States and foreign patent applications related to ourproprietary technology, inventions and improvements that are important to the development of ourbusiness. We also rely on trade secrets, know-how, continuing technological innovation and in-licensingopportunities to develop and maintain our proprietary position.
As of December 31, 2007, we owned a total of 3 United States patents and 41 United States utilitypatent applications, as well as foreign counterparts to 39 of these patent applications and patents.
The expiration date for each of our issued United States patents is 2023. The patent positions ofcompanies like ours are generally uncertain and involve complex legal and factual questions. Our abilityto maintain and solidify our proprietary position for our technology will depend on our success inobtaining effective patent claims and enforcing those claims once granted. We do not know whetherany of our patent applications or those patent applications that we license will result in the issuance ofany patents. Our issued patents and those that may issue in the future, or those licensed to us, may bechallenged, invalidated or circumvented, which could limit our ability to stop competitors frommarketing related products or shorten the term of patent protection that we may have for our products.
18

In addition, the rights granted under any issued patents may not provide us with competitiveadvantages against competitors with similar technology. Furthermore, our competitors mayindependently develop similar technologies or duplicate any technology developed by us. Because of theextensive time required for development, testing and regulatory review of a potential product, it ispossible that, before any of our products under development can be commercialized, any related patentmay expire or remain in force for only a short period following commercialization, thereby reducingany advantage of the patent.
We rely, in some circumstances, on trade secrets to protect our technology. Trade secrets, however,are difficult to protect. We seek to protect our proprietary technology and processes, in part, byconfidentiality agreements with our employees, consultants, scientific advisors and other contractors.These agreements may be breached, and we may not have adequate remedies for any breach. Inaddition, our trade secrets may otherwise become known or be independently discovered bycompetitors. To the extent that our employees, consultants or contractors use intellectual propertyowned by others in their work for us, disputes may arise as to the rights in related or resultingknow-how and inventions.
We use trademarks on some of our products and believe that having distinctive marks may be animportant factor in marketing our products. We have registered our Starent� and ST16� marks in theUnited States. Our other trademarks include the Starent Networks logo ST40� and VIM�. We havealso registered some of our marks in a number of foreign countries. Although we have a foreigntrademark registration program for selected marks, we may not be able to register or use such marks ineach foreign country in which we seek registration.
Employees
As of December 31, 2007, we had 610 full-time employees. Of our employees, 233 are located inthe United States and 377 are located in other geographical regions of the world. We consider ourcurrent relationship with our employees to be good. None of our employees is represented by laborunions or has collective bargaining agreements.
19

Item 1A. Risk Factors
These are risks and uncertainties that could cause actual results to differ materially from the resultscontemplated by the forward-looking statements contained in this Annual Report on Form 10-K. Because ofthe these factors, as well as other variables affecting our operating results, past financial performance shouldnot be considered as a reliable indicator of future performance and investors should not use historical trendsto anticipate results or trends in future periods. These risks are not the only ones facing the Company.Please also see ‘‘SPECIAL NOTE REGARDING FORWARD-LOOKING STATEMENTS’’ earlier in thisAnnual Report on Form 10-K.
Risks Related to Our Business and Industry
We compete in new and rapidly evolving markets and have a limited operating history, which makes it difficultto predict our future operating results.
We were incorporated in August 2000, and deployed our first commercial product in the firstquarter of 2003. We have a limited operating history in an industry characterized by rapid technologicalchange, changing customer needs, evolving industry standards and frequent introductions of newproducts and services. We believe our limited operating history and the characteristics of our industrymake it difficult to forecast our future operating results. You should consider and evaluate ourprospects in light of risks faced by companies such as ours, which include challenges in accuratefinancial planning as a result of limited historical data and the uncertainties resulting from a relativelylimited time period in which to implement and evaluate our business strategies, as compared tocompanies with longer operating histories.
Our past operating results have fluctuated significantly, and likely will continue to fluctuate significantly,which makes it difficult to predict our operating results and could cause our operating results to fall belowexpectations.
Our operating results have historically fluctuated significantly from period to period and we expectour operating results to continue to fluctuate due to a variety of factors, many of which are outside ofour control. As a result, comparing our operating results on a period-to-period basis may not bemeaningful. You should not rely on our past results as an indication of our future performance. If ourrevenues or operating results fall below the expectations of investors or securities analysts or below anyguidance we may provide to the market, the price of our common stock could decline.
In addition to other risk factors listed in this ‘‘Risk Factors’’ section, factors that may affect ouroperating results include:
• fluctuations in demand, sales cycles and prices for our products and services;
• reductions in customers’ budgets for mobile network infrastructure purchases and delays in theirpurchasing decisions;
• the timing of recognizing revenue in any given period as a result of software revenue recognitionrules;
• the sale of our products in the timeframes we anticipate, including the number and size oforders in each period;
• the level of our customer concentration and our ability to generate purchases in any particularperiod from large customers;
• our ability to develop, introduce and ship in a timely manner new products and productenhancements that meet customer requirements;
• the timing of product releases or upgrades by us or by our competitors;
20

• any significant changes in the competitive dynamics of our markets, including new entrants orsubstantial discounting of products;
• our ability to control costs, including our operating expenses and the costs of the components wepurchase; and
• general economic conditions in our domestic and international markets.
We depend on a limited number of customers for a substantial portion of our revenues. The loss of a keycustomer or any significant adverse change in the size or terms of orders from a key customer couldsignificantly reduce our revenues.
We derive a substantial portion of our revenues from a limited number of customers partly due tothe nature of the mobile communications industry. During any given fiscal period, a small number ofcustomers may account for a significant percentage of our revenues. For example, in 2007, we hadthree customers that each accounted for more than 10% of our revenues and in the aggregaterepresented 75% of our revenues and in 2006 we had two customers that each generated more than10% of our revenues and in the aggregate represented 83% of our revenues. In addition, we do nothave long-term volume purchase contracts with our customers or other commitments that ensure futuresales of our products to existing customers. The loss of any key customer, or our inability to generateanticipated revenue from them, would significantly and adversely affect our business, financial conditionand results of operations. In addition, a change in the timing or size of a purchase by any one of ourkey customers can result in significant variations in our revenue and operating results from period toperiod. Our operating results for the foreseeable future will continue to depend on our ability to effectsales to a small number of customers. Any revenue growth will depend on our success selling additionalproducts to our large customers and expanding our customer base to include additional customers thatdeploy our products in large-scale networks serving significant numbers of subscribers.
Moreover, many of our key customers are large mobile operators that have substantial purchasingpower and leverage in negotiating contractual arrangements with us. These customers may require us toagree to terms and conditions that could result in increased costs and decreased revenues that couldadversely affect our operating results.
We rely on a single line of products focused on a single market. If the market for those products does notdevelop as we anticipate, our revenues may decline or fail to grow, which would adversely affect our operatingresults.
We derive, and expect to continue to derive, all of our revenues from a single line of products thatprovide network functions and services to mobile operators’ packet core networks. The market for ourproducts is relatively new and still evolving, and it is uncertain whether our products will achieve andsustain high levels of demand and market acceptance. Our success will depend to a substantial extenton the willingness of mobile operators to continue to implement packet-based, multimedia networkinfrastructure. Factors that could impair the rate of growth of multimedia networks include:
• lower than anticipated demand by subscribers for multimedia services;
• budgetary constraints of mobile operators;
• uncertainties on the part of mobile operators as to the particular 3G or 4G access technologiesthey select for deployment in their networks; and
• delays in the development or availability of all the network elements necessary for the mobileoperator to deploy its next-generation multimedia network.
21

If mobile operators do not continue to implement packet core networks, the market for our productsmay not continue to develop or may develop more slowly than we expect, either of which wouldsignificantly adversely affect our revenues and profitability.
If our new platform, the ST40, does not achieve widespread market acceptance, our operating results willsuffer.
In April 2007, we announced our ST40 platform, which became generally available for customershipments in the third quarter of 2007 and we began recording revenues from these shipments in thefourth quarter of 2007. A significant portion of our future revenues is expected to be generated fromsales of the ST40. The current deployments of the ST40 by our customers are in their initial stages, andwe cannot assure you that the ST40 will achieve its performance specifications or meet our customers’expectations. In order to achieve additional market penetration for the ST40, we may be required toincur additional expenses in marketing and sales in advance of the realization of actual sales. There canbe no assurance that the ST40 will achieve widespread acceptance in the market. If we incur delays inthe manufacture and shipment of the ST40 or customer testing and verification takes longer thananticipated we may not achieve our planned levels of sales or if the ST40 does not achieveperformance specifications, our operating results will suffer and our competitive position could beimpaired.
The market in which we compete is highly competitive and competitive pressures from existing and newcompanies may have a material adverse effect on our business, revenues, growth rates and market share.
We compete in a highly competitive industry that is influenced by many factors, including customerdemands for:
• reliable, high performance products;
• system ability to handle increasing amounts of network traffic and service integrationcapabilities;
• system intelligence;
• breadth of network interoperability, access independence and standards support;
• high levels of customer support and customer interaction; and
• competitive pricing.
We expect competition in the mobile network infrastructure industry to intensify significantly in thefuture. Other companies may introduce new products in the same markets we serve or intend to enter.This competition could result in increased pricing pressure, reduced profit margins, increased sales andmarketing expenses and failure to increase, or the loss of, market share, any of which would likelyseriously harm our business, operating results or financial condition.
Competitive products may in the future have better performance, lower prices and broaderacceptance than our products. Our primary competitors include Cisco Systems, Inc., HuaweiTechnologies Co., Ltd., LM Ericsson Telephone Co., Nokia Siemens Networks B.V. andUTStarcom, Inc., each of which has a longer operating history, greater name recognition, a largercustomer base and significantly greater financial, technical, sales, marketing and other resources thanwe do. Potential customers may prefer to purchase from their existing suppliers rather than a newsupplier regardless of product performance or features. In addition, many of our competitors have abroader range of products and may be able to offer concessions to potential customers on bundledpurchases that we are not able to match because we currently offer only a single line of products. Wealso face competition from a number of companies with more limited market share either generally orby geography and newer market entrants.
22

If our market continues to develop and expand, we could face increased competition from otherestablished companies, as well as emerging companies. For example, OEMs, system integrators anddistributors currently selling our products could market products and services that compete with ourproducts and services. In addition, some of our competitors have made acquisitions or entered intopartnerships or other strategic relationships with one another to offer a more comprehensive solutionthan they individually had offered. We expect this trend to continue as companies attempt tostrengthen or maintain their market positions in an evolving industry and as companies enter intopartnerships, or are acquired. Many of the companies driving this consolidation trend have significantlygreater financial, technical and other resources than we do and are better positioned to acquire andoffer complementary products and technologies. The companies resulting from these possibleconsolidations may create more compelling product offerings and be able to offer greater pricingflexibility, making it more difficult for us to compete effectively, including on the basis of price, salesand marketing programs, technology or product functionality. Continued industry consolidation mayadversely impact customers’ perceptions of the viability of smaller and even medium-sized technologycompanies and consequently customers’ willingness to purchase from such companies. These pressurescould materially adversely affect our business, operating results and financial condition.
Our sales cycles can be long and unpredictable, and our sales efforts require considerable time and expense.
Our sales cycles typically are long and unpredictable, and our sales efforts require considerabletime and expense. Our sales efforts involve educating our customers about the use and benefit of ourproducts, including their technical capabilities and potential cost savings. Customers typically undertakea significant evaluation process before making a purchase, in some cases over twelve months. We spendsubstantial time and resources in our sales efforts without any assurance that our efforts will produceany sales. In addition, product purchases are frequently subject to budget constraints, multipleapprovals, and unplanned administrative, processing and other delays. Our long sales cycle may causeour revenues and operating results to fluctuate significantly.
Demand for our products depends on the rate that mobile operators expand and enhance their mobilenetworks in order to provide multimedia services.
Our future success as a provider of network infrastructure products and services for mobileoperators ultimately depends on the continued growth of the mobile communications industry and, inparticular, the continued deployment and expansion of mobile multimedia services. Increased demandby mobile subscribers for voice communications and multimedia services delivered over mobile networksystems will be necessary to justify capital expenditure commitments by mobile operators to invest inthe improvement and expansion of their networks. Demand for multimedia services might not continueto increase if there is limited availability or market acceptance of mobile devices designed for suchservices, the multimedia content offered through mobile networks does not attract widespread interestor the quality of service available through mobile networks does not meet customer expectations. Iflong-term expectations for mobile multimedia services are not realized or do not support a sustainablebusiness model, operators may not commit significant capital expenditures to upgrade their networks toprovide these services, the demand for our products and services will decrease, and we may not be ableto sustain or increase our levels of revenues or profitability in the future.
A significant portion of our future revenues depends on our ability to further penetrate the GSM/UMTSmarket and our failure to do so could significantly interfere with our future growth.
The two principal radio access interfaces in use today for mobile communications are CodeDivision Multiple Access, or CDMA, and Global System for Mobile Communications/Universal MobileTelecommunications System, or GSM/UMTS. To date, we have achieved our highest number ofdeployments in the CDMA market, which has transitioned faster to high-bandwidth networks. However,
23

significantly more operators worldwide currently utilize GSM/UMTS than CDMA technologies. Inorder to continue our growth, we believe it is important that we continue to expand into the GSM/UMTS market. To date, we have established a relationship with a major GSM/UMTS operator, and weintend to devote significant sales and marketing resources to further penetrate the GSM/UMTS market.If GSM/UMTS operators do not transition or delay their transition to high-bandwidth networks, or ifwe are unable to establish relationships with additional GSM/UMTS operators, we may not be able togrow our business as expected and our results of operations will be adversely affected.
We rely on OEMs, system integrators and distributors to sell some of our products, and our failure to developand manage our distribution channels could adversely affect our business.
For our sales to mobile operators, we rely in part on establishing and maintaining successfulrelationships with original equipment manufacturers, or OEMs, system integrators and distributors. Asignificant amount of our revenues is derived through these indirect sales. Accordingly, our revenuesdepend in part on the effective performance of these distribution relationships. By utilizing theseindirect sales channels we may have less contact with the end users of our products, thereby potentiallymaking it more difficult for us to establish brand awareness, ensure proper delivery and installation ofour products, service ongoing customer requirements and respond to evolving customer needs.Developing relationships with qualified OEMs, system integrators and distributors and training them inour technology and product offerings requires significant time and resources. In order to develop andexpand our distribution channels, we must continue to scale and improve our processes and proceduresthat support our OEM, system integrator and distributor relationships, including investment in systemsand training. We have no minimum purchase commitments with any of our OEMs, system integratorsor distributors, and our contracts with them do not prohibit them from offering products or servicesthat compete with ours. Our competitors may be effective in providing incentives to existing andpotential OEMs, system integrators and distributors to favor their products or to prevent or reducesales of our products. Our OEMs, system integrators and distributors may choose not to offer ourproducts exclusively or at all. Our failure to establish and maintain successful relationships with ourOEMs, system integrators and distributors would likely materially adversely affect our business,operating results and financial condition.
We have a significant accumulated deficit, and we may not be able to maintain profitability.
Although we were profitable in 2007, 2006 and 2005, we incurred net losses for the precedingthree years. Our net losses were approximately $14.0 million in 2004, $26.4 million in 2003 and$25.8 million in 2002. As a result of our net losses, we had an accumulated deficit of $94.0 million as ofDecember 31, 2007. We will need to generate significant revenues and control our operating expensesand other expenditures to maintain profitability. If we are unable to remain profitable, the market priceof our common stock could decline.
If network functions and services similar to those offered by our products are incorporated into existing ornew mobile network infrastructure products, demand by mobile operators for our products may diminish.
Mobile network infrastructures are continually evolving with changing industry standards and theintroduction of new technologies and network elements. Network functions and services provided byour products located on the packet core network may be provided by different network elements withinthese networks. Other providers of mobile network infrastructure products may add network functionsand services provided by our products to their existing products or offer new products with similarcharacteristics for different parts of the network infrastructure.
The inclusion of, or the announcement of an intent to include, functionality and services perceivedto be similar to those offered by our products in competitor products within or outside the packet corenetwork could have an adverse effect on our ability to market and sell our products. Furthermore, even
24

if the network functions and services offered by our competitors are more limited than those providedby our products, a significant number of customers may elect to accept limited functionality or servicesin lieu of adding our products to their network. The adoption of these competitive products ordifferent approaches to their network infrastructure by mobile operators could have an adverse effecton our business, operating results and financial condition.
The applications of existing or future accounting standards could result in significant fluctuations in ouroperating results.
We recognize our product software license revenue in accordance with AICPA Statement ofPosition, or SOP, 97-2, Software Revenue Recognition, and related amendments and interpretations andSOP 98-9, Modification of SOP 97-2, Software Revenue Recognition with Respect to Certain Transactions.Under these accounting standards, even if we deliver products to, and collect cash from, a customer ina given fiscal period, we may be required to defer recognizing revenue from the sale of such productuntil a future period when all the conditions necessary for revenue recognition have been satisfied.Conditions that can cause delays in revenue recognition include software arrangements that haveundelivered elements for which we have not yet established vendor specific objective evidence of fairvalue; requirements that we deliver services for significant enhancements or modifications to customizeour software for a particular customer; or material customer acceptance criteria. Our customercontracts typically include one or more of these types of conditions. Therefore, we often must deferrevenue recognition for a period of time after our products are delivered and billed to a customer, andsuch deferral may extend over one or more fiscal quarters. The period of deferral, if any, depends onthe specific terms and conditions of each customer contract, and therefore it is difficult for us topredict with accuracy at the beginning of any fiscal period the amount of revenues that we will be ableto recognize from anticipated customer shipments in that period. Moreover, any changes ininterpretations and guidance as to SOP 97-2 could have a significant effect on our reported financialresults.
We may have difficulty acquiring new customers due to the high costs of switching mobile networkinfrastructure providers or equipment.
Mobile network operators typically make substantial investments when deploying a mobile networkinfrastructure. Once a mobile network operator has deployed a mobile network infrastructure for aparticular portion of their network, it is often difficult and costly to switch to another vendor’sinfrastructure. Unless we are able to persuasively demonstrate that our products offer performance,functionality or cost advantages that materially outweigh a customer’s expense of switching from acompetitor’s product, it will be difficult for us to generate sales once that competitor’s equipment hasbeen deployed. Accordingly, if a customer has already deployed a competitor’s product for theirnetwork infrastructure, it may be difficult for us to sell our products to that customer.
Our ability to sell our products is highly dependent on the quality of our support and services offerings, andour failure to offer high quality support and services would have a material adverse effect on our sales andresults of operations.
Once our products are deployed within our customers’ networks, our customers depend on oursupport organization to resolve issues relating to our products. A high level of support is critical for thesuccessful marketing and sale of our products and future enhancements. If we, or our OEMs, systemintegrators or distributors, do not effectively assist our customers in deploying our products, help ourcustomers quickly resolve post-deployment issues, and provide effective ongoing support, it wouldadversely affect our ability to sell our products to existing customers and could harm our reputationwith potential customers. In addition, as we expand our operations internationally, our supportorganization will face additional challenges, including those associated with delivering support, training
25

and documentation in languages other than English. As a result, our failure to maintain high qualitysupport and services could have a material adverse effect on our business, operating results andfinancial condition.
The mobile network infrastructure industry is, and likely will continue to be, characterized by rapidtechnological changes in networks and standards, which will require us to develop new products and productenhancements, and could render our existing products obsolete.
Mobile operators have been aggressively upgrading their networks, and new industry standards foraccess technologies, such as third generation, or 3G, and more advanced fourth generation, or 4G,technologies continue to evolve. Continuing technological changes in the mobile communicationsindustry and in the mobile network infrastructure industry could undermine our competitive position ormake our products obsolete, either generally or for particular types of services. Our future success willdepend upon our ability to accurately predict and respond to new technology standards. We mustdevelop and introduce a variety of new capabilities and enhancements to our existing product offerings,as well as introduce new product offerings, to address the changing standards and technological needsof the network infrastructure market. A failure to accurately predict and respond to evolvingtechnologies, to introduce on a timely basis new products and enhancements in response to evolvingtechnologies and standards, or to address changing needs in our current markets or expand into newmarkets may cause existing and potential customers to forego purchases of our products or purchasefrom our competitors. The introduction of new products embodying new technologies or the emergenceof new industry standards could render our existing products uncompetitive from a pricing standpoint,obsolete or unmarketable.
Our products are complex and may take longer to develop than anticipated and we may not recognizerevenues from new products or product enhancements until after we have incurred significant developmentcosts.
Some of our products must be tailored to meet customer specifications. As a result, we oftendevelop new features and enhancements to our products. These product enhancements often takesubstantial time to develop because of their complexity and because customer specifications sometimeschange during the development cycle. We often do not recognize revenue from our new products orenhancements until we have incurred significant development costs, and our operating results will sufferif sales of new products or enhancements fail to meet our expectations.
There is no assurance that our research and development investments will lead to successful new products orenhancements.
We will continue to invest in research and development for the introduction of new products andenhancements to existing products designed to improve the capacity, data processing rates and featuresof our products and services. We must also continue to develop new features and functionality for ourproducts based on specific customer requests and anticipated market needs. However, research anddevelopment in the mobile network infrastructure industry is complex, expensive and subject touncertainty. In 2007, our research and development expenses were $38.9 million, or approximately 27%of our total revenues and in 2006, these expenses were $26.0 million, or approximately 28% of our totalrevenues. We believe that we must continue to dedicate a significant amount of resources to ourresearch and development efforts to maintain our competitive position. If we continue to expend asignificant amount of resources on research and development and our efforts do not lead to thesuccessful introduction of products or product enhancements that are competitive in the marketplace,there could be a material adverse effect on our business, operating results, financial condition andmarket share. We may not be able to anticipate market needs and develop products and productenhancements that meet those needs, and any new products or product enhancements that weintroduce may not achieve any significant degree of market acceptance.
26

If our products do not interoperate with our customers’ networks, installations will be delayed or cancelled,which would harm our business.
Our products must interoperate with our customers’ existing networks, which often have differentspecifications, utilize multiple protocol standards and products from multiple vendors and containmultiple generations of products that have been added over time. If we find errors in the existingsoftware or defects in the hardware used in our customers’ networks or problematic networkconfigurations or settings, as we have in the past, we may have to modify our software or hardware sothat our products will interoperate with our customers’ networks. This could cause longer installationtimes for our products or order cancellations and could harm our relationship with existing and futurecustomers, any of which would adversely affect our business, operating results and financial condition.
In addition, our customers may require that we demonstrate that our products interoperate withnetwork elements offered by our competitors, and we may need our competitors’ cooperation toconduct such testing and validation. Any unwillingness of our competitors to cooperate with us inperforming these interoperability tests or our inability to demonstrate interoperability would likely havean adverse effect on our ability to market our products.
Our products are highly technical and may contain undetected software or hardware errors, which couldcause harm to our reputation and adversely affect our business.
Our products are highly technical and complex. When deployed, they are critical to the mobileoperator networks. Our products have contained and may contain undetected errors, defects or securityvulnerabilities. Some errors in our products may only be discovered after a product has been installedand used by mobile operators. Any errors, defects or security vulnerabilities discovered in our productsafter commercial release could result in loss of revenues or delay in revenue recognition, loss ofcustomers and increased service cost, any of which could adversely affect our business, operating resultsand financial condition. In addition, we could face claims for product liability, tort or breach ofwarranty, including claims relating to changes to our products made by our OEMs, system integratorsor distributors. Our contracts with customers generally contain provisions relating to warrantydisclaimers and liability limitations, which may be ineffective. Defending a lawsuit, regardless of itsmerit, is costly and may divert management’s attention away from the business and adversely affect themarket’s perception of us and our products. In addition, if our business liability insurance coverage isinadequate or future coverage is unavailable on acceptable terms or at all, our operating results andfinancial condition could be adversely impacted.
We are susceptible to shortages or price fluctuations in our supply chain. Any shortages or price fluctuationsin components used in our products could delay shipment of our products, which could materially adverselyaffect our business.
Shortages in components that we use in our products are possible and our ability to predict theavailability of such components may be limited. Some of these components are available only fromsingle or limited sources of supply. The process of qualifying alternate sources for components, ifavailable at all, may be time consuming, difficult and costly. In addition, the lead times associated withcertain components are lengthy and preclude rapid changes in quantity requirements and deliveryschedules. Any growth in our business or the economy is likely to create greater pressures on us andour suppliers to project overall component demand accurately and to establish appropriate componentinventory levels. In addition, increased demand by third parties for the components we use in ourproducts may lead to decreased availability and higher prices for those components. We carry very littleinventory of our products and product components, and we rely on our suppliers to deliver necessarycomponents to our contract manufacturer in a timely manner based on forecasts we provide. Wegenerally rely on purchase orders rather than long-term contracts with our suppliers. As a result, evenif available, we may not be able to secure sufficient components at reasonable prices or of acceptable
27

quality to build products in a timely manner, which would seriously impact our ability to deliverproducts to our customers, and our business, operating results and financial condition would beadversely affected.
We depend on a single contract manufacturer with whom we do not have a long-term supply contract, andchanges to this relationship may result in delays or disruptions that could harm our business.
We depend on Plexus Corp., an independent contract manufacturer, to manufacture and assembleour products. We rely on purchase orders with our contract manufacturer and do not have long-termsupply arrangements in place. As a result, our contract manufacturer is not obligated to supplyproducts to us for any specific period, quantity or price. Our orders may represent a relatively smallpercentage of the overall orders received by our contract manufacturer from its customers. As a result,fulfilling our orders may not be considered a priority by our contract manufacturer in the event thecontract manufacturer is constrained in its ability to fulfill all of its customer obligations in a timelymanner.
It is time consuming and costly to qualify and implement a contract manufacturer relationship.Therefore, if our contract manufacturer suffers an interruption in its business, or experiences delays,disruptions or quality control problems in its manufacturing operations, or we have to change or addadditional contract manufacturers, our ability to ship products to our customers would be delayed andour business, operating results and financial condition would be adversely affected.
If we fail to predict accurately our manufacturing requirements, we could incur additional costs or experiencemanufacturing delays that could harm our business.
We provide demand forecasts to our contract manufacturer. If we overestimate our requirements,our contract manufacturer may assess charges or we may have liabilities for excess inventory, each ofwhich could negatively affect our gross margins. Conversely, because lead times for required materialsand components vary significantly and depend on factors such as the specific supplier, contract termsand the demand for each component at a given time, if we underestimate our requirements, ourcontract manufacturer may have inadequate materials and components required to produce ourproducts, which could interrupt manufacturing of our products and result in delays in shipments anddeferral or loss of revenues.
If we fail to retain our key personnel, we may not be able to achieve our anticipated level of growth and ourbusiness could suffer.
Our future depends, in part, on our ability to attract and retain key personnel, including thecontinued contributions of our executive officers and other key technical personnel, each of whomwould be difficult to replace. In particular, Ashraf M. Dahod, our president, chief executive officer andchairman is critical to the management of our business and operations, as well as the development ofour strategic direction. The loss of services of Mr. Dahod or other executive officers or key personnelor the inability to continue to attract qualified personnel could have a material adverse effect on ourbusiness. Mr. Dahod is not a party to an employment agreement with us and, therefore, may terminatehis employment with us at any time, with no advance notice. The replacement of Mr. Dahod wouldinvolve significant time and expense and may significantly delay or prevent the achievement of ourbusiness objectives.
Competition for our employees is intense, and we may not be able to attract and retain the highly skilledemployees that we need to support our business.
Competition for highly skilled technical personnel is extremely intense and we continue to facedifficulty identifying and hiring qualified personnel in many areas of our business. In particular, we face
28

significant challenges hiring and retaining personnel in India for research and development activitiesbecause the market for such personnel is increasingly competitive. We may not be able to hire andretain such personnel at compensation levels consistent with our existing compensation and salarystructure. Many of the companies with which we compete for hiring experienced employees havegreater resources than we have and may be able to offer more attractive terms of employment. Inaddition, we invest significant time and expense in training our employees, which increases their valueto competitors who may seek to recruit them. If we fail to retain our employees, we could incursignificant expenses replacing employees and the quality of our products and services and our ability toprovide such products and services could diminish, resulting in a material adverse affect on ourbusiness. Furthermore, in making employment decisions, particularly in high-technology industries,candidates often consider the value of the equity they are to receive in connection with theiremployment. Therefore, significant volatility in the price of our stock may adversely affect our ability toattract or retain personnel.
Our international sales and operations subject us to additional risks that may adversely affect our operatingresults.
Over the last several years, we derived a significant portion of our revenues from customersoutside the United States, and we continue to expand our international operations. As of December 31,2007, approximately 62% of our employees were located abroad, including 330 employees located inIndia. In addition, we have sales and technical support personnel in numerous countries worldwide. Weexpect to continue to add personnel in additional countries. Any continued expansion into internationalmarkets will require significant resources and management attention and will subject us to newregulatory, economic and political risks, and we cannot be sure that any further international expansionwill be successful. Among the risks we believe are most likely to affect us with respect to ourinternational operations are:
• the difficulty of managing and staffing international offices and the increased travel,infrastructure and legal compliance costs associated with multiple international locations;
• difficulties in enforcing contracts and collecting accounts receivable and longer payment cycles,especially in emerging markets;
• our ability to comply with differing technical standards and certification requirements outsideNorth America;
• unexpected changes in regulatory requirements;
• reduced protection for intellectual property rights in some countries;
• new and different sources of competition;
• fluctuations in exchange rates; and
• tariffs and trade barriers, import/export controls and other regulatory or contractual limitationson our ability to sell or develop our products in certain foreign markets.
As we continue to expand our business globally, our success will depend, in large part, on ourability to anticipate and effectively manage these and other risks associated with our internationaloperations. Our failure to manage any of these risks successfully could harm our internationaloperations and reduce our international sales, adversely affecting our business, operating results andfinancial condition.
29

We may need additional capital in the future, which may not be available to us on favorable terms, or at all,and may dilute your ownership of our common stock.
We have historically relied on outside financing and cash from operations to fund our operations,capital expenditures and expansion. We may require additional capital from equity or debt financing inthe future to:
• take advantage of strategic opportunities including more rapid expansion of our business or theacquisition of complementary products, technologies or businesses; and
• develop new products or enhancements to existing products.
We may not be able to secure timely additional financing on favorable terms, or at all. The termsof any additional financing may place limits on our financial and operating flexibility. If we raiseadditional funds through further issuances of equity, convertible debt securities or other securitiesconvertible into equity, our existing stockholders could suffer significant dilution in their percentageownership of our company, and any new securities we issue could have rights, preferences andprivileges senior to those of holders of our common stock. If we are unable to obtain adequatefinancing or financing on terms satisfactory to us, if and when we require it, our ability to grow orsupport our business and to respond to business challenges could be significantly limited.
We may engage in future acquisitions that could disrupt our business, cause dilution to our stockholders andharm our business, operating results or financial condition.
While we currently have no acquisitions of other businesses pending or planned, we have, fromtime to time, evaluated acquisition opportunities and may pursue acquisition opportunities in thefuture. We have very little experience consummating acquisitions, and therefore our ability as anorganization to make acquisitions is unproven. We may not be able to find suitable acquisitioncandidates and we may not be able to complete acquisitions on favorable terms, if at all. If we docomplete acquisitions, we may not ultimately strengthen our competitive position or achieve our goals,or such acquisitions may be viewed negatively by customers, financial markets or investors. In addition,any acquisitions that we make could lead to difficulties in integrating personnel and operations fromthe acquired businesses and in retaining and motivating key personnel from these businesses.Acquisitions may disrupt our ongoing operations, divert management from day-to-day responsibilities,increase our expenses or adversely impact our business, operating results and financial condition.Future acquisitions may reduce our cash available for operations and other uses and could result in anincrease in amortization expense related to identifiable assets acquired, potentially dilutive issuances ofequity securities or the incurrence of debt, which could harm our business, operating results andfinancial condition.
If we fail to manage future growth effectively, our business could be harmed.
We have expanded our operations significantly since inception and anticipate that furthersignificant expansion will be required. For example, our revenues increased from $59.7 million in 2005to $145.8 million in 2007 and the number of our employees increased from 200 at the beginning of2005 to 610 as of December 31, 2007. This growth has placed significant demands on our management,as well as our financial and operational resources. If we do not effectively manage our future growth,the efficiency of our operations and the quality of our products could suffer, which could adverselyaffect our business and operating results. To effectively manage this growth, we will need to continueto:
• implement appropriate operational, financial and management controls, systems and procedures,including continued implementation of our enterprise-wide financial system;
• expand our manufacturing capacity and scale of production;
30

• expand our sales, marketing and distribution infrastructure and capabilities; and
• provide adequate training and supervision to maintain high quality standards.
We have incurred, and will continue to incur, significant increased costs as a result of operating as a publiccompany, and our management will be required to devote substantial time to new compliance initiatives.
As a public company, we have incurred, and will continue to incur, significant legal, accountingand other expenses that we did not incur as a private company. In addition, the Sarbanes-Oxley Act of2002, and rules subsequently implemented by the Securities and Exchange Commission and the NasdaqStock Market, impose additional requirements on public companies, including requiring changes incorporate governance practices. Our management and other personnel will need to devote a substantialamount of time to these compliance initiatives. Moreover, these rules and regulations will increase ourlegal and financial compliance costs and will make some activities more time-consuming and costly. Forexample, we expect these rules and regulations to make it more difficult and more expensive for us toobtain director and officer liability insurance, and we may be required to accept reduced policy limitsand coverage or incur substantial additional costs to maintain the same or similar coverage. These rulesand regulations could also make it more difficult for us to attract and retain qualified persons to serveon our board of directors, our board committees or as executive officers.
In addition, the Sarbanes-Oxley Act requires, among other things, that we maintain effectiveinternal control over financial reporting and disclosure controls and procedures. In particular, for theyear ending December 31, 2008, we must perform system and process evaluation and testing of ourinternal control over financial reporting to allow management and our independent registered publicaccounting firm to report on the effectiveness of our internal control over financial reporting, asrequired by Section 404 of the Sarbanes-Oxley Act. Our testing, or the subsequent testing by ourindependent registered public accounting firm, may reveal deficiencies in our internal control overfinancial reporting that are deemed to be material weaknesses. Our compliance with Section 404 willrequire that we incur substantial expense and expend significant management time on compliance-related issues. We will need to hire additional accounting and financial staff with appropriate publiccompany experience and technical accounting knowledge. Moreover, if we are not able to comply withthe requirements of Section 404 in a timely manner, or if we or our independent registered publicaccounting firm identify deficiencies in our internal control over financial reporting that are deemed tobe material weaknesses, the market price of our stock could decline and we could be subject tosanctions or investigations by the Nasdaq Stock Market, the Securities and Exchange Commission orother regulatory authorities, which would require additional financial and management resources.
We are subject to governmental export and import controls that could subject us to liability or impair ourability to compete in international markets.
Our products are subject to United States export controls and may be exported outside the UnitedStates only with the required level of export license or through an export license exception, because weincorporate encryption technology into our products. In addition, various countries regulate the importof certain encryption technology and have enacted laws that could limit our ability to distribute ourproducts or could limit our customers’ ability to implement our products in those countries. Changes inour products or changes in export and import regulations may create delays in the introduction of ourproducts in international markets, prevent our customers with international operations from deployingour products throughout their networks or, in some cases, prevent the export or import of our productsto certain countries altogether. Any change in export or import laws and regulations, shifts in approachto the enforcement or scope of existing laws and regulations, or change in the countries, persons ortechnologies targeted by such regulations, could result in decreased use of our products by, or in ourdecreased ability to export or sell our products to, existing or potential customers with international
31

operations. Any decreased use of our products or limitation on our ability to export or sell ourproducts would likely adversely affect our business, operating results and financial condition.
Compliance with environmental matters and worker health and safety laws could be costly, and noncompliancewith these laws could have a material adverse effect on our results of operations, expenses and financialcondition.
Some of our operations use substances regulated under various federal, state, local andinternational laws governing the environment and worker health and safety, including those governingthe discharge of pollutants into the ground, air and water, the management and disposal of hazardoussubstances and wastes, and the cleanup of contaminated sites. Some of our products are subject tovarious federal, state, local and international laws governing chemical substances in electronic products.We could be subject to increased costs, fines, civil or criminal sanctions, third-party property damage orpersonal injury claims if we violate or become liable under environmental and/or worker health andsafety laws.
In January 2003, the European Union, or EU, issued two directives relating to chemical substancesin electronic products. The Waste Electrical and Electronic Equipment Directive, referred to as WEEE,requires producers of electrical goods to pay for specified collection, recycling, treatment and disposalof past and future covered products. The deadline for enacting and implementing the WEEE directivewas August 13, 2004, although extensions were granted in some countries. Producers became financiallyresponsible under WEEE related legislation beginning in August 2005. The other directive, theRestriction on the use of certain Hazardous Substances, referred to as RoHS, restricts lead and otherhazardous substances in electronic equipment placed on the EU market after July 1, 2006. If we fail tocomply with these directives, we may suffer a loss of revenues, be unable to sell our products in certainmarkets and countries, be subject to penalties and fines or suffer a competitive disadvantage. Similarlegislation could be enacted in other jurisdictions, including in China, Japan or the United States, andthe scope of new legislation with respect to currently unregulated substances is uncertain. Costs tocomply with WEEE or RoHS related legislation or similar future legislation, if applicable, could includecosts associated with modifying our products, recycling and other waste processing costs, legal andregulatory costs and insurance costs. We are currently in compliance with these directives; however, wehave incurred significant costs related to compliance with current requirements. The costs to complywith current and future environmental and worker health and safety laws may have a material adverseeffect on our results of operations, expenses and financial condition.
Risks Related to our Intellectual Property
Our ability to compete and the success of our business could be jeopardized if we are unable to rely on ourpatent rights.
Our success and ability to compete depends in part upon our ability to obtain protection in theUnited States and other countries for our products by establishing and maintaining intellectual propertyrights relating to or incorporated into our technology and products. We own a variety of patents andpatent applications in the United States and corresponding patents and patent applications in foreignjurisdictions. However, we have not obtained patent protection in each market in which we plan tocompete. To date, our patent portfolio has not prevented other companies from competing against us,and we do not know how successful we would be if we sought to enforce our patent rights againstsuspected infringers. Our pending and future patent applications may not issue as patents or, if issued,may not issue in a form that will be advantageous to us. Even if issued, patents may be challenged,narrowed, invalidated or circumvented, which could limit our ability to stop competitors frommarketing similar products or limit the length of term of patent protection we may have for ourproducts. Changes in either patent laws or in interpretations of patent laws in the United States andother countries may diminish the value of our intellectual property or narrow the scope of our patent
32
protection. Any circumstance or change that results in patent protection not being available for ourproducts could adversely affect our business, financial condition and results of operations.
If we are unable to protect the confidentiality of our unpatented proprietary information and know-how, thevalue of our technology and products could be adversely affected.
In addition to patented technology, we rely upon unpatented proprietary technology, processes andknow-how. We generally seek to protect this information in part by confidentiality agreements with ouremployees, consultants and third parties. These agreements may be breached, and we may not haveadequate remedies for any such breach. In addition, our trade secrets may otherwise become known orbe independently developed by competitors. If we are unable to protect the confidentiality of ourproprietary information and know-how, the value of our technology and products could be adverselyaffected, which could in turn adversely affect our business, financial condition and results of operations.
Claims by others that we infringe their proprietary technology could force us to incur significant costs.
Third parties have asserted, and may assert in the future, claims that our products infringe patentsor patent applications under which we do not hold licenses or other rights. Third parties may own orcontrol these patents and patent applications in the United States and abroad. These third parties havebrought, and could in the future bring, claims against us that would cause us to incur substantialexpenses and, if successfully asserted against us, could cause us to pay substantial damages. Further, if apatent infringement suit were brought against us, we could be forced to stop or delay manufacturing orsales of the product that is the subject of the suit. In addition, we could be forced to redesign theproduct that uses any allegedly infringing technology.
We are presently defending two patent infringement lawsuits brought by UTStarcom, Inc. InFebruary 2005, UTStarcom filed a lawsuit asserting infringement of a patent in the United StatesDistrict Court for the Northern District of California relating to a prepaid billing function we providedto one of our customers. This patent lawsuit by UTStarcom has been stayed pending a reissueproceeding of the patent asserted in the case. Such a reissue proceeding may take a year or longer tocomplete. After the reissue proceeding, the stay of the lawsuit likely will be lifted and the lawsuit mayproceed. If this occurs, we will continue to defend ourselves in this litigation, which will require asignificant investment of time and financial resources. A finding that we have infringed this patent mayrequire us to pay damages based on our past sale of the prepaid billing function and, in addition, mayforce us to limit or cease development, manufacturing and sales of the prepaid billing function. Thiscould adversely affect our business, financial condition and results of operations.
In May 2007, UTStarcom filed a lawsuit against us and a number of our employees and formeremployees in the United States District Court for the Northern District of Illinois alleging violations ofthe Illinois trade secrets act, infringement of five patents assigned to UTStarcom, intentionalinterference with UTStarcom’s business relations and declarations of ownership relating to one of ourpatents and three of our patent applications. The complaint contains allegations, among others, that anumber of former employees of a business unit UTStarcom acquired, who subsequently worked for us,took UTStarcom’s trade secrets with them and improperly used those trade secrets to develop,manufacture and market our 3G wireless products, and that such products incorporate UTStarcomconfidential technical information, including UTStarcom’s proprietary virtual private network andEV-DO features. UTStarcom further alleges that we have disclosed UTStarcom’s trade secrets in oneof our patents and three of our patent applications, and that this patent and these patent applicationslegally belong to UTStarcom based on the inventors’ previous work at the business unit acquired byUTStarcom. In December 2007, UTStarcom filed an amendment to the complaint, which added newclaims for declaration of ownership of four more of our patent applications, copyright infringement,breach of restrictive covenants against the employee and former employee defendants, and aiding andabetting the employee and former employee defendants’ breaches of the duty of loyalty and the
33

employment agreements. The amendment to the complaint also added another employee as adefendant. In this lawsuit, UTStarcom seeks unspecified monetary damages, punitive damages,injunctive relief, declarations of ownership relating to the specified patent and patent applicationsowned by us, findings of misappropriation of trade secrets, patent infringement and copyrightinfringement, costs and attorneys fees. We will vigorously defend ourselves in this litigation and wehave filed counterclaims. The defense of this lawsuit and the prosecution of our counterclaims willrequire significant investment of time and financial resources. A finding in UTStarcom’s favor in thislawsuit may require us to pay substantial damages based on the past sales of our ST16 product, mayforce us to limit or cease development, manufacturing and sales of the ST16 and ST40, which are ouronly product platforms, may require that key employees be transferred to other positions or functions,or temporarily prohibited from working for us, and may result in the loss or assignment of ownershipof a specified patent and seven patent applications owned by us. This could adversely affect ourbusiness, financial condition and results of operations.
As a result of patent infringement claims, or in order to avoid potential claims, we may choose orbe required to seek a license from the third party and be required to pay license fees or royalties orboth. These licenses may not be available on acceptable terms, or at all. Even if we were able to obtaina license, the rights may be nonexclusive, which could result in our competitors gaining access to thesame intellectual property. Ultimately, we could be forced to cease some aspect of our businessoperations if, as a result of actual or threatened patent infringement claims, we are unable to enter intolicenses on acceptable terms. This could significantly and adversely affect our business, financialcondition and results of operations.
In addition to infringement claims against us, we may become a party to other types of patentlitigation and other proceedings, including interference proceedings declared by the United StatesPatent and Trademark Office and opposition proceedings in the European Patent Office, regardingintellectual property rights with respect to our products and technology. The cost to us of any patentlitigation or other proceeding, even if resolved in our favor, could be substantial. Some of ourcompetitors may be able to sustain the costs of such litigation or proceedings more effectively than wecan because of their greater financial resources. Uncertainties resulting from the initiation andcontinuation of patent litigation or other proceedings could have a material adverse effect on ourability to compete in the marketplace. Patent litigation and other proceedings may also requiresignificant commitments of time by our management.
Our use of open source could impose limitations on our ability to commercialize our products.
We incorporate open source software into our products. Although we monitor our use of opensource software closely, the terms of many open source licenses to which we are subject have not beeninterpreted by United States or foreign courts, and there is a risk that such licenses could be construedin a manner that imposes unanticipated conditions or restrictions on our ability to commercialize ourproducts. In such event, we could be required to seek licenses from third parties in order to continueoffering our products, to re-engineer our products or to discontinue sales of our products, any of whichcould materially adversely affect our business.
We rely on the availability of licenses for intellectual property from third parties, and if these licenses are notavailable to us on commercially reasonable terms, product sales and development may be delayed.
We incorporate certain third-party technologies, including software programs, into our productsand may need to utilize additional third-party technologies in the future. However, licenses to relevantthird-party technology may not continue to be available to us on commercially reasonable terms, or atall. Therefore, we could face delays in product releases until alternative technology can be identified,licensed or developed, and integrated into our current products. These delays, if they occur, couldmaterially adversely affect our business.
34

Item 1B. Unresolved Staff Comments
Not applicable.
Item 2. Properties
Our corporate headquarters is located in Tewksbury, Massachusetts, where we occupy anapproximately 55,000 square foot facility under a lease expiring in February 2011. We use thesefacilities for administration, research and development, as well as for quality control, testing andshipping of our products. We also own a building in Pune, India and lease a facility in Bangalore, Indiathat we use for research and development activities.
We also lease sales and development offices in Buzzards Bay, Massachusetts; Chicago, Illinois;Overland Park, Kansas; Reston, Virginia; Redmond, Washington; Sao Paulo, Brazil; Toronto, Canada;Beijing, China; Tokyo, Japan; Mexico City, Mexico; Seoul, South Korea and London, United Kingdom.We believe that our current facilities are sufficient for our current needs. We intend to add newfacilities or expand existing facilities as we add employees or expand our markets, and we believe thatsuitable additional or substitute space will be available as needed to accommodate any such expansionof our operations.
Item 3. Legal Proceedings
We are presently defending two patent infringement lawsuits brought against us byUTStarcom, Inc. In February 2005, UTStarcom filed a complaint against us in the United StatesDistrict Court for the Northern District of California seeking unspecified damages and injunctive relief.The complaint alleges infringement by us of UTStarcom’s U.S. Patent No. 6,829,473, entitled ‘‘Roamingand Hand-Off Support for Prepaid Billing for Wireless Data Networks,’’ which we refer to as the ‘473patent. In May 2005, we answered the complaint, denied the infringement allegations contained in thecomplaint, and filed counterclaims against UTStarcom seeking a declaratory judgment that we did notinfringe the ‘473 patent and that the ‘473 patent was invalid and unenforceable. In July 2005, we filedan amended answer and counterclaims to the ‘473 patent complaint. In December 2006, UTStarcomfiled a reissue patent application relating to the ‘473 patent. In January 2007, by agreement of theparties, the District Court stayed the case pending the outcome of UTStarcom’s reissue applicationrelating to the ‘473 patent. In June 2007, we filed a request for inter partes re-examination of all claimsof the ‘473 patent with the United States Patent and Trademark Office on sixteen different grounds. InAugust 2007, the Patent and Trademark Office granted our request for inter partes reexamination of allclaims on all sixteen grounds. In November 2007, the Patent and Trademark Office merged the reissueand re-examination proceedings. A first office action has not yet issued. We believe that we havemeritorious defenses against any resulting reissued patent, and we are prepared to vigorously defendthe ‘473 patent case through trial.
In May 2007, UTStarcom filed an additional complaint against us and a number of our employeesand former employees in the United States District Court for the Northern District of Illinois allegingviolations of the Illinois trade secrets act, infringement of five patents assigned to UTStarcom,intentional interference with UTStarcom’s business relations and declarations of ownership relating toone of our patents and three of our patent applications. The complaint contains allegations, amongothers, that a number of former employees of a business unit UTStarcom acquired, who subsequentlyworked for us, took UTStarcom’s trade secrets with them and improperly used those trade secrets todevelop, manufacture and market our 3G wireless products, and that such products incorporate variousUTStarcom confidential technical information, including UTStarcom’s proprietary virtual privatenetwork and EV-DO features. UTStarcom further alleges that we have disclosed UTStarcom’s tradesecrets in one of our patents and three of our patent applications, and that this patent and these patentapplications legally belong to UTStarcom based on the inventors’ previous work at the business unit
35

acquired by UTStarcom. In August 2007, we and the current and former employee defendants filed ouranswers to the complaint. We also filed counterclaims for tortious interference with prospectiveeconomic advantage, malicious prosecution, a declaration that the patents-in-suit are invalid and notinfringed, and a declaration that one of the patents-in-suit is unenforceable due to inequitable conduct.In December 2007, UTStarcom filed an amendment to the complaint, which added new claims fordeclaration of ownership of four more of our patent applications, copyright infringement, breach ofrestrictive covenants against the employee and former employee defendants, and aiding and abettingthe employee and former employee defendants’ breaches of the duty of loyalty and the employmentagreements. The amendment to the complaint also added another employee as a defendant. OnJanuary 4, 2008, we filed a motion to dismiss, or in the alternative for a more definite statementregarding, the trade secret, copyright, breaches of restrictive covenants, and aiding and abetting claimsof the amendment to the complaint. UTStarcom filed its opposition to our motion on January 22, 2008,and we filed our reply on January 29, 2008. The Court is expected to rule on this motion in April 2008.Discovery is proceeding. No trial date has been set. In this lawsuit, UTStarcom seeks unspecifiedmonetary damages, punitive damages, injunctive relief, declarations of ownership relating to thespecified patent and patent applications owned by us, findings of misappropriation of trade secrets,patent infringement and copyright infringement, costs and attorneys fees. We believe we havemeritorious defenses to each of UTStarcom’s claims in this lawsuit and we are prepared to vigorouslydefend the lawsuit.
In addition, we are subject to other legal proceedings, claims and litigation arising in the ordinarycourse of business. Defending lawsuits requires significant management attention and financialresources and the outcome of any litigation, including the matters described above, is inherentlyuncertain. We do not, however, currently expect that the ultimate costs to resolve pending matters willhave a material adverse effect on our consolidated financial position, results of operations or cashflows.
Item 4. Submission of Matters to a Vote of Security Holders
None.
36

PART II
Item 5. Market for Registrant’s Common Equity, Related Stockholder Matters and Issuer Purchasesof Equity Securities.
Market Information for Common Stock
Our common stock commenced trading on the Nasdaq Global Market under the symbol ‘‘STAR’’on June 6, 2007. The following table sets forth, for the periods indicated, the high and low reportedsales prices of our common stock as reported on the Nasdaq Global Market:
High Low
2007Second quarter (from June 6, 2007) . . . . . . . . . . . . . . . . . . . . . . . $17.00 $13.29Third quarter . . . . . . . . . . . . . . . . . . . . . . . . . . . . . . . . . . . . . . . $24.11 $13.55Fourth quarter . . . . . . . . . . . . . . . . . . . . . . . . . . . . . . . . . . . . . . . $31.67 $16.02
Dividend Policy
We have never paid or declared any cash dividends on our common stock. We currently intend toretain earnings, if any, to finance the growth and development of our business, and we do not expect topay any cash dividends on our common stock in the foreseeable future. Payment of future dividends, ifany, will be at the discretion of the board of directors and will depend on our financial condition,results of operations, capital requirements, restrictions contained in current or future financinginstruments, and other factors the board deems relevant.
Stockholders
As of February 19, 2008, there were 294 holders of record of our common stock.
Equity Compensation Information
Information regarding our equity compensation plans and the securities authorized for issuancethereunder is set forth in Part III, Item 12 below.
Use of Proceeds from Registered Securities
In June 2007, we completed an initial public offering of common stock pursuant to a RegistrationStatement on Form S-1 (Registration No. 333-141092) which the SEC declared effective on June 5,2007. Pursuant to the registration statement, we registered the offering and sale of an aggregate of12,115,067 shares of our common stock, of which 10,580,226 shares were sold by us including 1,580,226shares sold in connection with the underwriters’ option described below, and 1,534,841 shares were soldby certain stockholders, at a price of $12.00 per share. The underwriters exercised their option topurchase the additional 1,580,226 shares of our common stock at the initial public offering price of$12.00 per share on June 8, 2007 and the offering closed on June 11, 2007. The underwriters for theoffering were Goldman, Sachs & Co., Lehman Brothers, JPMorgan and Thomas Weisel Partners LLC.
We raised a total of $127.0 million in gross proceeds from the initial public offering, orapproximately $116.0 million in net proceeds after deducting underwriting discounts and commissionsof $8.9 million and other estimated offering costs of approximately $2.1 million. The sellingstockholders received a total of approximately $18.4 million in gross proceeds from the initial publicoffering or approximately $17.1 million of net proceeds after deducting the underwriting discounts. Wehave invested the remaining net proceeds in cash and cash equivalents, primarily money-market mutual
37

funds. None of the remaining net proceeds were paid, directly or indirectly, to directors, officers,persons owning ten percent or more of our equity securities, or any of our other affiliates.
In October 2007, we completed a public offering of common stock pursuant to a RegistrationStatement on Form S-1 (Registration No. 333-146717) which the SEC declared effective on October 31,2007. Pursuant to the registration statement, we registered the offering and sale of an aggregate of8,000,000 shares of our common stock, of which 3,880,000 shares were sold by us and 4,120,000 shareswere sold by certain stockholders, at a price of $24.00 per share. The underwriters for the offering wereGoldman, Sachs & Co., Lehman Brothers, JPMorgan and Thomas Weisel Partners LLC.
We raised a total of $93.1 million in gross proceeds from the public offering, or approximately$88.1 million in net proceeds after deducting underwriting discounts and commissions of $4.4 millionand other estimated offering costs. The selling stockholders received a total of approximately$98.9 million in gross proceeds from the public offering or approximately $94.2 million of net proceedsafter deducting the underwriting discounts. We have invested the remaining net proceeds in cash andcash equivalents, primarily money-market mutual funds. None of the remaining net proceeds were paid,directly or indirectly, to directors, officers, persons owning ten percent or more of our equity securities,or any of our other affiliates.
38

Item 6. Selected Consolidated Financial Data
The following tables summarize our consolidated financial data for the periods presented. Youshould read the following selected consolidated financial data in conjunction with our consolidatedfinancial statements and the related notes thereto and the ‘‘Management’s Discussion and Analysis ofFinancial Condition and Results of Operations’’ section of this Annual Report.
We have derived the statement of operations data below for the years ended December 31, 2007,2006 and 2005 and the balance sheet data as of December 31, 2007 and 2006 from our auditedconsolidated financial statements included in this Annual Report. We derived the consolidated financialdata for the years ended December 31, 2004 and 2003 and as of December 31, 2005, 2004 and 2003from our audited financial statements which are not included in this Annual Report. Our historicalresults for any prior period are not necessarily indicative of results to be expected for any futureperiod.
Year Ended December 31,
2007 2006 2005 2004 2003
(in thousands, except per share data)
Statement of Operations Data:Revenues . . . . . . . . . . . . . . . . . . . . . . . . . . . $145,797 $ 94,350 $ 59,660 $ 34,395 $ 182Cost of revenues . . . . . . . . . . . . . . . . . . . . . 38,363 27,726 13,643 13,445 1,109Gross profit . . . . . . . . . . . . . . . . . . . . . . . . . 107,434 66,624 46,017 20,950 (927)Operating expenses:
Research and development . . . . . . . . . . . . 38,868 25,980 18,107 13,303 14,748Sales and marketing . . . . . . . . . . . . . . . . . 46,434 30,311 19,785 18,445 8,289General and administrative . . . . . . . . . . . . 15,340 8,515 7,352 3,185 2,470Total operating expenses . . . . . . . . . . . . . . 100,642 64,806 45,244 34,933 25,507
Income (loss) from operations . . . . . . . . . . . . 6,792 1,818 773 (13,983) (26,434)Other income (expense), net . . . . . . . . . . . . . 6,090 2,237 644 95 (8)Income (loss) before income tax expense . . . . 12,882 4,055 1,417 (13,888) (26,442)Income tax expense . . . . . . . . . . . . . . . . . . . (1,413) (413) (513) (160) —Net income (loss) . . . . . . . . . . . . . . . . . . . . . $ 11,469 $ 3,642 $ 904 $(14,048) $(26,442)
Net income (loss) per share applicable tocommon stockholders:Basic . . . . . . . . . . . . . . . . . . . . . . . . . . . . $ 0.13 $ (0.62) $ (0.97) $ (3.28) $ (6.39)
Diluted . . . . . . . . . . . . . . . . . . . . . . . . . . . $ 0.12 $ (0.62) $ (0.97) $ (3.28) $ (6.39)
Weighted average shares used in computingnet income (loss) per share applicable tocommon shareholders:Basic . . . . . . . . . . . . . . . . . . . . . . . . . . . . 40,901 7,026 6,642 6,197 4,825
Diluted . . . . . . . . . . . . . . . . . . . . . . . . . . . 47,044 7,026 6,642 6,197 4,825
As of December 31,
2007 2006 2005 2004 2003
(in thousands)
Balance Sheet Data:Cash, cash equivalents and short-term
investments . . . . . . . . . . . . . . . . . . . . . . . . $233,599 $ 60,154 $ 37,489 $ 20,819 $ 2,036Working capital . . . . . . . . . . . . . . . . . . . . . . 243,269 19,848 41,490 10,002 1,889Total assets . . . . . . . . . . . . . . . . . . . . . . . . . 349,379 104,267 84,353 63,892 17,262Indebtedness . . . . . . . . . . . . . . . . . . . . . . . . — — 33 197 —Redeemable convertible preferred stock . . . . . — 130,270 122,282 97,043 64,153Total stockholders’ equity (deficit) . . . . . . . . . 254,939 (105,511) (103,202) (97,092) (77,091)
39

Item 7. Management’s Discussion and Analysis of Financial Condition and Results Of Operations
Overview
Starent Networks is a leading provider of infrastructure hardware and software products andservices that enable mobile operators to deliver multimedia services to their subscribers. We havecreated hardware and software products that provide network functions and services, including accessfrom a wide range of radio networks to the operator’s packet core network. Our products and servicesalso provide management of subscriber sessions moving between networks and application of billingand other session policies. Our products and services provide high performance and system intelligenceby combining significant computing power, memory and traffic handling capabilities with a flexible, highavailability operating system and other proprietary software. Our products integrate multiple networkfunctions and services needed for the delivery of advanced multimedia services, such as video, Internetaccess, voice-over-IP, e-mail, mobile TV, photo sharing and gaming.
Our products consist of both hardware and software and can be configured to meet a number ofcustomer needs. We sell our products and services to mobile operators around the world both directlyand indirectly through our relationships with original equipment manufacturers, or OEMs, systemintegrators and distributors.
In June 2007, we completed an initial public offering of our common stock in which we sold andissued 10,580,226 shares of our common stock, including 1,580,226 shares sold by us pursuant to theunderwriters’ full exercise of their over-allotment option, at a price of $12.00 per share. We raised atotal of $127.0 million in gross proceeds from the initial public offering, or $116.0 million in netproceeds after deducting underwriting discounts and commissions and other offering expenses. Inconnection with the initial public offering, all outstanding shares of our convertible preferred stockautomatically converted into an aggregate of 44,287,985 shares of our common stock.
In November 2007, we completed an underwritten public offering of 8,000,000 shares of ourcommon stock at a price to the public of $24.00 per share. Of the shares sold in the offering, 3,880,000shares were sold by us and 4,120,000 shares were sold by certain selling stockholders. We received totalnet proceeds from the November 2007 public offering of approximately $88.1 million, after deductingunderwriting discounts and commissions and estimated offering expenses. We did not receive anyproceeds from the sale of shares by the selling stockholders.
We maintain our corporate headquarters in Tewksbury, Massachusetts, and have sales anddevelopment offices in various locations worldwide. We conduct our research and developmentactivities at two locations in India and two locations in the United States. As of December 31, 2007, wehad 610 employees worldwide. Our revenues for the years ended December 31, 2007 and 2006 were$145.8 million and $94.4 million, respectively. Our net income for the years ended December 31, 2007and 2006 was $11.5 million and $3.6 million, respectively.
Revenues
Our revenues consist of both product revenues and service revenues. We derive product revenuesfrom the sale of our hardware products and the licensing of our software. Service revenues aregenerated from:
• maintenance and technical support associated with our software;
• hardware repair and maintenance services; and
• implementation, training and professional services.
We recognize revenue in accordance with Statement of Position, or SOP, 97-2, Software RevenueRecognition and SOP 98-9, Modification of SOP 97-2, Software Revenue Recognition, With Respect to
40

Certain Transactions. Accordingly, revenue is recognized when persuasive evidence of an arrangementexists, delivery has occurred, the price is fixed or determinable and collection is probable.
Mobile operators can purchase our products and license our software in various configurations,depending on their requirements for capacity, features and protocols. Typically, a mobile operatorpurchases a small amount of equipment for testing and trial purposes and, once testing is complete,purchases the necessary products to meet their initial capacity and feature requirements. As theircapacity requirements increase, operators may purchase additional hardware or license additionalsoftware. The level of our sales is significantly influenced by the extent to which mobile operators makecapital investments to enhance and expand their networks to provide multimedia services. Mobileoperators’ capital investments will be influenced by the demand for multimedia services by theircustomers.
We offer our products and services through our direct sales force to mobile operators andindirectly through relationships with OEMs, system integrators and distributors. The OEMs, systemintegrators and distributors generally purchase our products after they have received a purchase orderfrom their customers and do not maintain an inventory of our products in anticipation of sales to theircustomers.
In 2004, we entered into OEM agreements with Nortel Networks relating to the CDMA and GSM/UMTS markets. Sales to Nortel Networks, all of which were made under the CDMA agreement,accounted for more than 40% of our revenues in 2006. In December 2006, we terminated both OEMagreements. Under the terms of the CDMA agreement, Nortel Networks has exercised its right tocontinue to purchase our CDMA products for delivery through December 2008. Although thetermination of the CDMA agreement could disrupt our relationships with CDMA mobile operatorsformerly serviced by Nortel Networks, we have established and will continue to seek to establishadditional direct sales relationships with some of the CDMA operators formerly serviced by NortelNetworks. In addition, we are currently in discussions to establish a new reseller relationship withNortel Networks. As a result, we do not believe that the termination of the Nortel Networks OEMagreements will significantly impact our revenues.
We believe our revenues may vary significantly from period to period as a result of the following:
• Fluctuations in the timing of customer orders. Mobile operators require significant lead times toincorporate changes and enhancements into their networks to ensure the various networkcomponents are interoperable. These lead times and interoperability testing requirements resultin an extended sales cycle and can lead to uneven purchasing patterns. In addition, our relianceon a relatively small number of customers contributes to the variability of our revenues.
• The timing of revenue recognition in relation to the shipment of products. Our products containsoftware which is not incidental to our products. Therefore, we recognize revenue pursuant tothe requirements of SOP 97-2. Due to these requirements, certain features of our customerarrangements, such as customer acceptance terms in many of our customer contracts and theneed for us to establish fair values of our products and services based on facts specific to ouroperations, often require us to defer recognition of revenue for a significant period of time aftershipment.
The variability of our revenues directly impacts our operating performance in any particular periodsince a significant portion of our operating costs, such as payroll and related expenses and salescommissions, are either fixed in the short-term or may not vary proportionately with recorded revenues.
41

Cost of Revenues
Cost of revenues consists of costs of products sold and services provided. Cost of products consistsprimarily of payments to a third party manufacturer for purchased materials and services and internalcosts, such as personnel costs, provision for inventory obsolescence and related overhead. The use of anoutsourced manufacturer enables us to conserve working capital, adjust to fluctuations in demand andprovide for timely delivery to our customers. Cost of services consists primarily of personnel costsrelated to professional services and technical support personnel, product repair costs, depreciation andrelated overhead.
Gross Profit
Our gross profit has been, and will be, affected by many factors, including the demand for ourproducts and services, the average selling price of our products, which in turn depends on the mix ofproduct configurations sold, new product introductions, the region of the world in which our customersare located and the volume and costs of manufacturing our hardware products.
Operating Expenses
Our operating expenses consist primarily of personnel costs, including salaries, commissions,bonuses, share-based compensation and related benefits and taxes; prototype costs related to the designand development of new products and enhancement of existing products; and consulting, travel anddepreciation expenses. The expenses are classified into the following categories for reporting purposes:research and development, sales and marketing and general and administrative. Following is a briefdescription of the key types of expenses in each of these categories.
• Research and development expense consists primarily of personnel costs, prototype costs,consulting services and depreciation. Research and development activities, including hardwareand software development and quality assurance testing, primarily occur at two locations in theUnited States and two locations in India.
• Sales and marketing expense consists primarily of personnel costs, travel and marketingprograms, such as trade shows. Sales commissions are a significant component of our salespersonnel costs and are recorded as expense when earned, which is not necessarily directlyproportionate to the amount of revenues recorded since commissions are generally earned at thetime we accept customer orders and revenue is recorded once all revenue recognition criteriahave been met.
• General and administrative expense consists primarily of personnel costs related to ourexecutive, finance, human resource and information technology organizations, professional fees,insurance and other related overhead.
Other Income (Expense)
Other income (expense) primarily consists of interest income earned on cash and short-terminvestments. We have historically invested our cash in money market funds and other short-term,high-grade investments.
Other income (expense) also includes gains (losses) from foreign currency transactions of ourforeign subsidiaries. The functional currency of our foreign operations is the U.S. dollar. Accordingly,all assets and liabilities, except certain long-term assets, of these international subsidiaries areremeasured into U.S. dollars using the exchange rates in effect at the balance sheet date. Revenues andexpenses of these international subsidiaries are generally remeasured into U.S. dollars at the averagerates in effect during the year.
42

Application of Critical Accounting Policies and Use of Estimates
Our financial statements are prepared in accordance with accounting principles generally acceptedin the United States of America. The preparation of these financial statements and related disclosuresrequire us to make estimates, assumptions and judgments that affect the reported amounts of assetsand liabilities and disclosure of contingent assets and liabilities at the date of the financial statementsand the reported amounts of revenues and expenses during the reporting period. We base our estimateson historical experience and on various other assumptions that we believe to be reasonable under thecircumstances. We evaluate our estimates and assumptions on an ongoing basis. Our actual results maydiffer significantly from these estimates under different assumptions or conditions.
We believe that of our significant accounting policies, which are described in note 2 to theconsolidated financial statements included in this Annual Report, the following accounting policiesinvolve a greater degree of judgment and complexity. Accordingly, we believe these are the mostcritical to fully understand and evaluate our financial condition and results of operations.
Revenue Recognition
Generally, our revenues are generated through fulfillment of contractual arrangements that containmultiple elements, including equipment with embedded software and services, such as installation,training, consulting and maintenance and support, or M&S. We recognize revenue in accordance withSOP 97-2 and SOP 98-9. Accordingly, revenue is recognized when persuasive evidence of anarrangement exists, delivery has occurred, the price is fixed or determinable and collection is probable.Certain of these requirements, most notably the customer acceptance terms generally included in ourcontracts and our need to establish fair values of our products and services based on facts specific toour operations, are critical to the timing and extent of our revenue recognition. As a result of thesefactors, a significant majority of our contractual arrangements result in the deferral of revenue and thetime period for deferral may be significant. In addition, in certain circumstances, pricing considerationsmust be assessed to determine whether the price is fixed or determinable.
Product revenues consist of revenues from sales of our hardware and licensing of our software.Product sales generally include a perpetual license to our software. Product revenues are generallyrecognized at shipment or upon customer acceptance, if contractually required, assuming all otherrevenue recognition criteria are met. Substantially all of our products have been sold in conjunctionwith product support services, which consist of software updates and product support. Software updatesprovide customers with rights to unspecified software product upgrades and to maintenance releasesand patches released during the term of the support period. Revenues for support services arerecognized on a straight-line basis over the service contract term.
Pursuant to SOP 97-2, revenue is allocated to deliverables based on vendor specific objectiveevidence of fair value, or VSOE, when VSOE exists. Generally, all revenue for an arrangement isinitially deferred when VSOE does not exist for any undelivered element and is subsequentlyrecognized ratably over the contractual M&S period when M&S is the only undelivered element. IfVSOE exists for the undelivered elements, but not the delivered elements, revenue is recognized underthe residual method set forth in SOP 98-9, which provides that revenue for the delivered elements isrecognized based on the difference between the total arrangement fee and the VSOE of theundelivered elements. Revenue for the undelivered elements is then recorded as those elements aredelivered. When we defer revenue in an arrangement, the related product costs are also deferred,subject to their realizability, and recognized in or over the same period as the related revenue.
The determination of VSOE is highly judgmental and is a key factor in determining whetherrevenue may be recognized or must be deferred and the extent to which it may be recognized once thevarious elements of an arrangement are delivered. We assess VSOE based on previous sales ofproducts and services, the type and size of customer, renewal rates in contracts and the geographic
43

location of the customer. We monitor VSOE on an ongoing basis. As noted above, most of ourarrangements include multiple elements, some of which are delivered in or over future periods.Therefore, a change in our assessment of, or our inability to establish, VSOE for products or servicesmay result in significant variation in our revenues and operating results.
Share-Based Compensation
Prior to January 1, 2006, we accounted for our stock-based awards to employees using the intrinsicvalue method prescribed in Accounting Principles Board, or APB, Opinion 25, Accounting for StockIssued to Employees, and related interpretations. Under the intrinsic value method, compensationexpense is measured on the date of the grant as the difference between the deemed fair value of ourcommon stock and the exercise or purchase price multiplied by the number of stock options orrestricted stock awards granted. In addition, through December 31, 2005, we accounted for share-basedcompensation expense for non-employees using the fair value method prescribed by Statement ofFinancial Accounting Standards, or SFAS, 123, Accounting for Stock-Based Compensation, applying theBlack-Scholes option-pricing model, and recorded the fair value, for financial reporting purposes, ofnonemployee stock options as an expense over the service period.
In December 2004, the Financial Accounting Standards Board, or FASB, issued SFAS 123R, Share-Based Payment, which requires companies to expense the fair value of employee stock options andother forms of share-based compensation. We adopted SFAS 123R effective January 1, 2006.SFAS 123R requires nonpublic companies that used the minimum value method in SFAS 123 for eitherrecognition or pro forma disclosures to apply SFAS 123R using the prospective-transition method. Assuch, we will continue to apply APB Opinion 25 in future periods to equity awards outstanding prior tothe date of our adoption of SFAS 123R. In accordance with SFAS 123R, we recognize thecompensation cost of stock-based awards on a graded-vesting basis over the vesting period of theaward. Effective with the adoption of SFAS 123R, we elected to use the Black-Scholes option pricingmodel for awards without market conditions to determine the weighted average fair value of stockoptions granted or modified.
Since January 1, 2006, we account for equity instruments issued to nonemployees in accordancewith the provisions of SFAS 123R (the requirements of which are consistent with those previouslyutilized under SFAS 123) and EITF Issue 96-18, Accounting for Equity Instruments That Are Issued toOther Than Employees for Acquiring, or in Conjunction with Selling, Goods or Services.
Several key assumptions are made in determining the grant date fair value of our stock options,including: the grant date market value of our common stock, the rate of volatility, the risk-free interestrate and the rate of expected forfeitures. As there was no public market for our common stock prior toour initial public offering, the determination of the fair market value of our common stock wasdetermined by our board of directors. Due to the limited trading history of our common stock, we havedetermined the volatility for options granted after January 1, 2006 based on an analysis of reporteddata for a peer group of companies that issued options with substantially similar terms. The expectedvolatility of options granted has been determined using an average of the historical volatility measuresof this peer group of companies. The expected life of options has been determined utilizing the‘‘simplified’’ method as prescribed by the SEC’s Staff Accounting Bulletin No. 107, Share-BasedPayment, resulting in an expected life for the years ended December 31, 2007 and 2006 of 6.25 years.The risk-free interest rate is based on a U.S. treasury instrument whose term is consistent with theexpected life of the stock options. We have not paid, and do not anticipate paying, cash dividends onour shares of common stock; therefore, the expected dividend yield was assumed to be zero. Inaddition, SFAS 123R requires companies to utilize an estimated forfeiture rate when calculating theexpense for the period. As a result, we applied an estimated forfeiture rate of 3%, based on a review ofour historical forfeitures, to determine the expense recorded in our consolidated statements of
44

operations. Significant changes in these assumptions, especially the expected life of options, forfeiturerate and volatility could have a significant impact on our results of operations.
For the year ended December 31, 2007, we recorded expense of $12.8 million in connection withshare-based awards. As of December 31, 2007, we had $16.3 million of unrecognized expense related tonon-vested options that is expected to be recognized over a weighted average period of 1.6 years.
Inventory
We carry our inventory at the lower of cost or net realizable value assuming inventory items areconsumed on a first-in, first-out basis. We recognize inventory losses based on obsolescence and levelsin excess of forecasted demand. In these cases, inventory is written down to estimated realizable valuebased on historical usage and expected demand. Inherent in our estimates of market value indetermining inventory valuation are estimates related to economic trends, future demand for ourproducts and technical obsolescence of our products. If future demand or market conditions are lessfavorable than our projections, additional inventory write-downs could be required and would bereflected in the cost of revenues in the period the revision is made. To date, we have not been requiredto revise any of our assumptions or estimates used to determine our inventory valuations.
When products have been delivered to customers, but the product revenues associated with thearrangement have been deferred as a result of not meeting the revenue recognition criteria required bySOP 97-2, we defer the related inventory costs for the delivered items.
Income Taxes
We are subject to income taxes in both the United States and foreign jurisdictions and we useestimates in determining our provisions for income taxes. We account for income taxes in accordancewith SFAS 109, Accounting for Income Taxes, which is the asset and liability method for accounting andreporting for income taxes. Under SFAS 109, deferred tax assets and liabilities are recognized based ontemporary differences between the financial reporting and income tax bases of assets and liabilitiesusing statutory rates.
As of December 31, 2007, we had U.S. federal net operating loss carryforwards for income taxpurposes of $27.6 million that expire beginning in 2023 and state net operating loss carryforwards of$28.0 million that expire beginning in 2008. We also had U.S. federal tax credits of $4.4 million thatexpire beginning in 2020 and state research and development credits of $619,000 that expire beginningin 2018. The Internal Revenue Code contains provisions that limit the net operating loss and tax creditcarryforwards available to be used in any given year in the event of certain circumstances, includingsignificant changes in ownership interests, as defined.
Our income tax expense consists primarily of provisions associated with various state and foreignjurisdictions as well as federal alternative minimum tax. Income tax expense related to our internationalsubsidiaries generally results from taxable income generated by the subsidiary pursuant to intercompanyservice agreements. We believe the compensation associated with these service agreements isreasonable in light of the level and nature of services performed by our subsidiaries. However, if aforeign tax jurisdiction or the Internal Revenue Service were to challenge these arrangements, we couldbe subject to additional income tax expense either in the United States or the foreign jurisdiction.
Due to the uncertainty surrounding the realization of our deferred tax assets, based principally onour significant historical operating losses, we have provided a full valuation allowance against ourvarious tax attributes. We will assess the level of valuation allowance required in future periods. Shouldmore positive than negative evidence regarding the realizability of tax attributes exist at a future pointin time, the valuation allowance may be reduced or eliminated altogether. Reduction of the valuation
45

allowance, in whole or in part, would result in a non-cash reduction in income tax expense during theperiod of reduction.
On January 1, 2007, we adopted the provisions of FASB Interpretation, or FIN, No. 48, Accountingfor Uncertainty in Income Taxes, an interpretation of SFAS 109. The new standard defines the thresholdfor recognizing the benefits of tax return positions in the financial statements as ‘‘more-likely-than-not’’to be sustained by the taxing authorities based solely on the technical merits of the position. If therecognition threshold is met, the tax benefit is measured and recognized as the largest amount of taxbenefit, in our judgment, which is greater than 50% likely to be realized. We did not recognize anychange in our reserves for uncertain tax positions as a result of the adoption of this standard. At theadoption date of January 1, 2007, we had approximately $134,000 of unrecognized tax benefits, thebenefit of which, if recognized, would favorably affect the income tax rate in future periods. AtDecember 31, 2007, we had a liability of approximately $219,000 related to unrecognized tax benefits.
We recognize interest and penalties related to uncertain tax positions in income tax expense. Uponour adoption of FIN 48 and at December 31, 2007, we had an immaterial amount of accrued interestand penalties associated with our uncertain tax positions.
We have accumulated significant losses from our inception in August 2000. Since the net operatinglosses may potentially be utilized in future years to reduce taxable income, all of our tax years remainopen to examination by the major taxing jurisdictions to which we are subject.
Research and Development Expense
Research and development expense includes costs incurred to develop intellectual property.Research and development costs are charged to operations as incurred. The costs to develop newsoftware and substantial enhancements to existing software are expensed as incurred until technologicalfeasibility has been established, at which time any additional costs would be capitalized. We havedetermined technological feasibility is established at the time a working model of software iscompleted. The time period during which costs could be capitalized, from the point of reachingtechnological feasibility until the time of general product release, is short. Consequently, the amountsthat could be capitalized are not material to our financial position or results of operations andtherefore have been charged to expense as incurred.
46

Results of Operations
Revenues
The following table sets forth our revenues by type and geographic location of our customers.
Period-to-PeriodYear Ended December 31, Change
2007 2006
% of % ofAmount Revenues Amount Revenues Amount Percentage
(dollars in thousands)
Revenues:Product . . . . . . . . . . . . . . . . . . . . . . $125,251 86% $81,061 86% $44,190 55%Service . . . . . . . . . . . . . . . . . . . . . . 20,546 14 13,289 14 7,257 55
Total revenues . . . . . . . . . . . . . . . $145,797 100% $94,350 100% $51,447 55%
Revenues by Customer Type:Direct . . . . . . . . . . . . . . . . . . . . . . . $101,111 69% $46,964 50% $54,147 115%Indirect . . . . . . . . . . . . . . . . . . . . . . 44,686 31 47,386 50 (2,700) (6)
Total revenues . . . . . . . . . . . . . . . $145,797 100% $94,350 100% $51,447 55%
Revenues by Geography:United States and Canada . . . . . . . . $110,137 76% $81,687 87% $28,450 35%Japan . . . . . . . . . . . . . . . . . . . . . . . 19,395 13 4,227 4 15,168 359Korea . . . . . . . . . . . . . . . . . . . . . . . 13,171 9 662 1 12,509 1,890Rest of world . . . . . . . . . . . . . . . . . . 3,094 2 7,774 8 (4,680) (60)
Total revenues . . . . . . . . . . . . . . . $145,797 100% $94,350 100% $51,447 55%
Revenues increased $51.4 million, or 55%, in the year ended December 31, 2007 compared to2006, due to an increase in product revenues of $44.2 million and an increase in service revenues of$7.3 million. Product revenues, which include hardware and software, increased due to sales to existingcustomers and to increased sales in Japan and Korea discussed below. Direct revenues increasedprimarily due to increased sales to existing customers and to the transition of certain customersformerly serviced through Nortel Networks to a direct relationship with us. The increase in revenuesfrom Japan was due primarily to the recognition of revenue deferred in prior periods since wedelivered previously committed software functionality during the quarter ended June 30, 2007. Theincrease in revenues from Korea was due to increased sales to existing customers and the recognitionof approximately $5.5 million that was deferred at December 31, 2006 due to the delivery of specificsoftware functionality during the first quarter of 2007. The $7.3 million increase in service revenues for
47

2007 compared to 2006 was due to an increase in the amount of our products installed at mobileoperators, which is generally the basis of maintenance and service fees.
Year Ended December 31, Period-to-Period Change
2006 2005
% of % ofAmount Revenues Amount Revenues Amount Percentage
(dollars in thousands)
Revenues:Product . . . . . . . . . . . . . . . . . . . . . . . $81,061 86% $51,819 87% $ 29,242 56%Service . . . . . . . . . . . . . . . . . . . . . . . 13,289 14 7,841 13 5,448 70
Total revenues . . . . . . . . . . . . . . . . $94,350 100% $59,660 100% $ 34,690 58%
Revenues by Customer Type:Direct . . . . . . . . . . . . . . . . . . . . . . . . $46,964 50% $27,446 46% $ 19,518 71%Indirect . . . . . . . . . . . . . . . . . . . . . . . 47,386 50 32,214 54 15,172 47
Total revenues . . . . . . . . . . . . . . . . $94,350 100% $59,660 100% $ 34,690 58%
Revenues by Geography:United States and Canada . . . . . . . . . $81,687 87% $28,691 48% $ 52,996 185%Japan . . . . . . . . . . . . . . . . . . . . . . . . 4,227 4 18,718 31 (14,491) (77)Korea . . . . . . . . . . . . . . . . . . . . . . . . 662 1 11,731 20 (11,070) (94)Rest of world . . . . . . . . . . . . . . . . . . 7,774 8 520 1 7,255 1,395
Total revenues . . . . . . . . . . . . . . . . $94,350 100% $59,660 100% $ 34,690 58%
Revenues increased $34.7 million, or 58%, in the year ended December 31, 2006 as compared tothe same period in 2005, primarily due to increased product sales to existing customers. Productrevenues, which include hardware and software sales, increased $29.2 million in 2006 due primarily toincreased sales to major mobile operators in the United States and Canada. The decrease in revenuesin Japan and Korea was due primarily to the incremental deferral of approximately $8.4 million relatedto Japan and $5.5 million related to Korea, as compared to the deferral at December 31, 2005. Thesedeferred balances were recognized during 2007. In addition, a portion of the decrease in revenues inKorea was due to 2005 being the final period in which revenues were recognized on a subscriptionbasis on a contract that expired on December 31, 2005. In 2006, $14.0 million of our indirect revenuethat had been deferred at December 31, 2005 was recognized based upon us establishing VSOE formaintenance and support services for a type of customer.
The $5.4 million increase in service revenues in 2006 compared to the same period in 2005 wasdue to an increased amount of our products installed at mobile operators, which is generally the basisof maintenance and service fees.
48

Cost of Revenues and Gross Profit
Period-to-PeriodYear Ended December 31, Change
2007 2006
% of % ofRelated Related
Amount Revenues Amount Revenues Amount Percentage
(dollars in thousands)
Cost of revenues:Product . . . . . . . . . . . . . . . . . . . . . . $ 29,064 23% $25,640 32% $ 3,424 13%Services . . . . . . . . . . . . . . . . . . . . . . 9,299 45 2,086 16 7,213 346
Total cost of revenues . . . . . . . . . . $ 38,363 26% $27,726 29% $10,637 38%
Gross Profit:Product . . . . . . . . . . . . . . . . . . . . . . $ 96,187 77% $55,421 68% $40,766 74%Services . . . . . . . . . . . . . . . . . . . . . . 11,247 55 11,203 84 44 —
Total gross profit . . . . . . . . . . . . . . $107,434 74% $66,624 71% $40,810 61%
Product gross margin increased nine percentage points in 2007 as compared to 2006. As describedabove, the 2006 period included revenues that we recognized upon establishing VSOE for maintenanceand support for a type of customer; however, the cost of products associated with this revenue washigher because the arrangement obligated us to provide certain products free of charge. This cost inconjunction with lower average selling price for this OEM arrangement resulted in lower gross marginpercentage in 2006. In addition, in 2007, we transitioned certain mobile operators that were formerlyserviced by a reseller to direct relationships, which resulted in higher average selling prices to us.
During 2007, the $7.2 million increase in cost of services was primarily due to higher personnelcosts, depreciation expense and overhead costs associated with additional customer support and trainingpersonnel that were added during late 2006 and in 2007. We anticipate cost of services will increase infuture periods as we continue to expand our customer support organization geographically and tosupport our higher amount of installed equipment at existing customers, however we believe the rate ofgrowth will be slower than that experienced in 2007.
Period-to-PeriodYear Ended December 31, Change
2006 2005
% of % ofRelated Related
Amount Revenues Amount Revenues Amount Percentage
(dollars in thousands)
Cost of revenues:Product . . . . . . . . . . . . . . . . . . . . . . . $25,640 32% $12,285 24% $13,355 109%Services . . . . . . . . . . . . . . . . . . . . . . . 2,086 16 1,358 17 728 54
Total cost of revenues . . . . . . . . . . . $27,726 29% $13,643 23% $14,083 103%
Gross Profit:Product . . . . . . . . . . . . . . . . . . . . . . . $55,421 68% $39,534 76% $15,887 40%Services . . . . . . . . . . . . . . . . . . . . . . . 11,203 84 6,483 83 4,720 73
Total gross profit . . . . . . . . . . . . . . . $66,624 71% $46,017 77% $20,607 45%
The $14.1 million increase in cost of revenues from 2005 to 2006 was attributable to the increasein hardware and software products sold during 2006 or delivered in previous periods but recognized inrevenues during 2006, and higher cost of services.
49

Product gross margin percentage decreased eight percentage points from 2005 to 2006 dueprimarily to the increase in the cost of products sold related to us establishing VSOE for maintenanceand support for a type of customer. As described above, we recorded additional revenues in 2006 as aresult of the establishment of VSOE; however, the cost of products associated with this revenue washigher because the arrangement obligated us to provide certain products free of charge. We recognized$7.3 million of costs associated with the $14.0 million of revenue that was recognized upon theestablishment of VSOE in 2006. This cost in conjunction with lower average selling price for this OEMarrangement resulted in lower gross margin percentage.
During 2006, the $728,000 increase in cost of services was primarily due to higher salaries,incentives and benefits, depreciation expense and overhead costs associated with additional customersupport and training personnel that were added during 2006.
Gross profit on services increased 73% as a result of a substantial increase in maintenance, supportand service revenues associated with the growth in our installed product base without a correspondingproportionate increase in costs.
Operating Expenses
Period-to-PeriodYear Ended December 31, Change
2007 2006
% of % ofAmount Revenues Amount Revenues Amount Percentage
(dollars in thousands)
Research and development . . . . . . . . . . $ 38,868 27% $25,980 28% $12,888 50%Sales and marketing . . . . . . . . . . . . . . . 46,434 32 30,311 32 16,123 53General and administrative . . . . . . . . . . 15,340 11 8,515 9 6,825 80
Total operating expenses . . . . . . . . . . $100,642 69% $64,806 69% $35,836 55%
Period-to-PeriodYear Ended December 31, Change
2006 2005
% of % ofAmount Revenues Amount Revenues Amount Percentage
(dollars in thousands)
Research and development . . . . . . . . . . . $25,980 28% $18,107 30% $ 7,873 43%Sales and marketing . . . . . . . . . . . . . . . . 30,311 32 19,785 33 10,526 53General and administrative . . . . . . . . . . . 8,515 9 7,352 12 1,163 16
Total operating expenses . . . . . . . . . . . $64,806 69% $45,244 76% $19,562 43%
Personnel Costs. Personnel costs are our largest expense totaling $68.5 million, or 68% of ourtotal operating expenses, for the year ended December 31, 2007 and $39.5 million, or 61% of totaloperating expenses, for the year ended December 31, 2006. These costs consist of cash and stockcomponents.
50

The cash component of compensation included in each expense category is set forth below.
Year Ended December 31, Year Ended December 31,
2007 2006 Change 2006 2005 Change
(dollars in thousands)
Research and development . . . . . . . . . . . . $20,480 $13,702 $ 6,778 $13,702 $ 9,938 $ 3,764Sales and marketing . . . . . . . . . . . . . . . . . 31,218 21,082 10,136 21,082 11,601 9,481General and administrative . . . . . . . . . . . . 4,821 3,120 1,701 3,120 2,123 997
Total cash-based compensation inoperating expenses . . . . . . . . . . . . . . $56,519 $37,904 $18,615 $37,904 $23,662 $14,242
Cash compensation increased $18.6 million in 2007 as compared to 2006 due primarily to a highernumber of employees. In the year ended December 31, 2007, we added 199 employees: 133 in researchand development, 19 in sales and marketing, 24 in support, 19 in general and administrative and theremainder in operations, resulting in total employees of 610 at December 31, 2007. In addition to theincrease in the number of employees, sales and marketing expenses included sales commissions of$16.1 million in 2007, which was $5.9 million higher than the same period in 2006 due to higher ordersreceived in 2007. We anticipate the absolute amount of our sales commissions to be somewhat higherin 2008, but to decrease somewhat as a percentage of revenues.
Cash compensation totaled $37.9 million in 2006, $14.2 million higher than in 2005 primarily dueto the addition of 120 employees during 2006. In addition, $6.9 million of the increase in sales andmarketing expenses was due to higher sales commissions in 2006 as compared to the prior year. Thisincrease was primarily due to significantly higher orders received in 2006 than in 2005.
In addition to cash compensation, we grant equity to our employees and nonemployees resulting inthe recognition of share-based compensation in accordance with SFAS 123R, which is a significantportion of our personnel costs. The share-based compensation included in each expense category is setforth below.
Year Ended December 31, Year Ended December 31,
2007 2006 Change 2006 2005 Change
(dollars in thousands)
Research and development . . . . . . . . . . . . . . . . $ 5,864 $ 708 $ 5,156 $ 708 $230 $ 478Sales and marketing . . . . . . . . . . . . . . . . . . . . . 2,883 385 2,498 385 28 357General and administrative . . . . . . . . . . . . . . . . 3,245 504 2,741 504 — 504
Total share-based compensation in operatingexpenses . . . . . . . . . . . . . . . . . . . . . . . . . . $11,992 $1,597 $10,395 $1,597 $258 $1,339
These charges amounted to $12.0 million, or 8% of revenues, for the year ended December 31,2007 and $1.6 million, or 2% of revenues, for the year ended December 31, 2006. The increase in 2007as compared to 2006 was primarily due to the increase in the fair value of our common stock at thetime the share-based awards were granted and our higher number of employees. The increase in thesecharges in 2006 as compared to 2005 was due to the adoption of SFAS 123R as of January 1, 2006.Prior to January 1, 2006, we accounted for stock-based compensation under APB 25, which generallyresulted in no stock-based compensation charges as we granted options at fair value on the date ofgrant.
Research and development. Research and development expenses increased $12.9 million, or 50%,in 2007 compared to 2006. The increase was due to the increases in cash compensation of $6.8 millionand stock-based compensation of $5.2 million, discussed above, and higher depreciation expense of
51

$1.1 million related to significant additions of quality assurance testing equipment, partially offset bylower amounts of various other expenses.
Research and development expenses increased $7.9 million, or 43%, in 2006 compared to 2005.The increase was primarily due to the increases in cash compensation of $3.8 million and share-basedcompensation of $478,000, discussed above, higher prototype and related equipment expenses of$1.2 million and depreciation expense of $618,000. The increase in prototype and related equipmentexpenses was due the timing of our development activities surrounding our ST40 platform.
We intend to continue to invest significantly in our research and development efforts, which webelieve are essential to maintaining our competitive position. Accordingly, we anticipate personnel costsand depreciation expense to increase during 2008 as we continue to add quality assurance personneland increase our test lab facilities. Although we expect research and development expenses will increasein absolute amount in 2008, we believe they will decrease somewhat as a percentage of revenues.
Sales and marketing. Sales and marketing expenses increased $16.1 million, or 53%, in 2007compared to 2006, but remained consistent at 32% of revenues. This spending increase was primarilydue to the higher cash compensation of $10.1 million and share-based compensation of $2.5 million,discussed above, and $893,000 higher consulting expenses and increased travel expenses of $1.7 million.Consulting expenses increased primarily due to arrangements we have with third party consultantswhose fees are earned as we receive orders from specific customers. The increase in travel expenseswas due to our employee additions. All of these expense increases are due to the expansion of ourdirect sales force into additional geographic areas and at significant customer accounts to addressmarket opportunities.
Sales and marketing expenses increased $10.5 million, or 53%, in 2006 compared to 2005, butdecreased slightly as a percentage of revenues to 32%. This spending increase was primarily due to thehigher cash compensation of $9.5 million and share-based compensation of $357,000, discussed above,and $527,000 higher consulting expenses. Consulting expenses increased primarily due to arrangementswe have with third party consultants whose fees are earned as we receive orders from specificcustomers.
We anticipate continuing to increase the number of sales and marketing personnel we employ infuture periods to expand our geographic presence, to address specific customer opportunities and toincrease our revenues. The sales commission portion of sales and marketing personnel costs may varysignificantly if our customer orders differ materially from the quotas established for our salespersonnel.
General and administrative. General and administrative expenses increased $6.8 million, or 80%,in 2007 compared to the prior year, primarily due to the higher cash and share-based compensationcosts of $1.7 million and $2.7 million, respectively, discussed above and higher professional fees of$1.3 million, consulting fees of $861,000 and insurance of $482,000. The increase in professional feeswas primarily due to costs associated with our defense in the UTStarcom litigation. Consulting feesincreased primarily due to enhancements of our enterprise financial and support systems. The increasein insurance expense was due primarily to coverage changes associated with us becoming a publicly-traded company in June 2007.
General and administrative expenses increased $1.2 million, or 16%, in 2006 compared to 2005primarily due to the higher cash and share-based compensation costs discussed above.
We expect general and administrative expense to increase in future periods as we invest ininfrastructure to support continued growth and incur additional costs related to operating as a publicly-traded company, including increased audit and legal fees, costs of compliance with securities and otherregulations and investor relations. In addition, we expect to continue to incur costs associated withpatent litigation discussed in Part I—Item 3 ‘‘Legal Proceedings’’.
52

Interest income. Interest income consists of income generated from the investment of our cashbalances and short-term investments. Interest income increased $3.8 million in 2007 compared to 2006due to higher average balances and higher rates of return compared to 2006. In June 2007, our cashand short-term investment balance increased approximately $116.0 million due to the receipt of the netproceeds of our initial public offering and in November 2007 our cash and short-term investmentbalance increased approximately $88.1 million due to the net proceeds of our follow-on public offering.
Interest income increased $1.5 million in 2006 compared to 2005 due to higher average balancescompared to 2005.
Income tax expense. For the year ended December 31, 2007, we recorded income tax expense of$1.4 million compared to $413,000 for 2006. The increase in 2007 was primarily due to us being subjectto federal alternative minimum tax in 2007 and not in 2006. We anticipate that we will be subject tostate and foreign income taxes and federal alternative minimum tax in future years. We have significantnet operating loss carryforwards and other net deferred tax assets. As of December 31, 2007, we haverecorded a full valuation allowance to reduce the value of these assets to zero in the accompanyingconsolidated financial statements due to the uncertainty surrounding the timing and extent ofrealization of these tax attributes.
Net income. Net income increased $7.8 million for the year ended December 31, 2007 comparedto 2006 and increased $2.7 million for the year ended December 31, 2006 compared to 2005 due to theitems discussed above.
Quarterly Results of Operations
The following table sets forth our unaudited quarterly consolidated statement of operations datafor each of the eight quarters ended December 31, 2007. In our opinion, the information presented hasbeen prepared on the same basis as the audited consolidated financial statements included in thisAnnual Report, and reflects all necessary adjustments, consisting only of normal recurring adjustments,
53

necessary for a fair statement of this data. The results of historical periods are not necessarily indicativeof the results of operations for a full year or any future period.
For the Three Months Ended
December 31, September 30, June 30, March 31, December 31, September 30, June 30, March 31,2007 2007 2007 2007 2006 2006 2006 2006
(dollars in thousands)Revenues:
Product . . . . . . . . . $44,090 $31,588 $25,121 $24,452 $19,952 $31,642 $17,744 $11,722Services . . . . . . . . . 6,520 5,103 5,733 3,190 4,337 3,596 2,645 2,712
50,610 36,691 30,854 27,642 24,289 35,238 20,389 14,434Cost of revenues:
Product . . . . . . . . . 10,888 7,422 6,316 4,438 5,106 13,240 3,401 3,893Services . . . . . . . . . 3,247 2,723 1,942 1,387 953 429 363 341
14,135 10,145 8,258 5,825 6,059 13,669 3,764 4,234
Gross profit . . . . . . . 36,475 26,546 22,596 21,817 18,230 21,569 16,625 10,200Operating expenses:
Research anddevelopment . . . . 10,605 10,612 7,585 10,066 8,853 7,421 6,064 3,642
Sales and marketing . 18,558 11,940 8,867 7,069 8,584 8,983 7,584 5,160General and
administrative . . . 4,934 4,164 3,398 2,844 2,699 2,317 1,983 1,516
Total operatingexpenses . . . . . 34,097 26,716 19,850 19,979 20,136 18,721 15,631 10,318
Income (loss) fromoperations . . . . . . . 2,378 (170) 2,746 1,838 (1,906) 2,848 994 (118)
Other income(expense), net . . . . . 2,459 2,122 799 710 744 645 428 420
Income (loss) beforeincome tax expense . 4,837 1,952 3,545 2,548 (1,162) 3,493 1,422 302
Income tax expense . . . (677) (329) (164) (243) (27) (243) (92) (50)
Net income (loss) . . . . $ 4,160 $ 1,623 $ 3,381 $ 2,305 $(1,189) $ 3,250 $ 1,330 $ 252
Net income (loss) pershare:
Basic . . . . . . . . . $ 0.06 $ 0.03 $ 0.03 $ 0.01 $ (0.44) $ 0.02 $ (0.10) $ (0.26)
Diluted . . . . . . . $ 0.06 $ 0.02 $ 0.03 $ 0.00 $ (0.44) $ 0.02 $ (0.10) $ (0.26)
Our operating results may fluctuate due to a variety of factors, many of which are outside of ourcontrol. As a result, comparing our operating results on a period-to-period basis may not bemeaningful. Most notably, we believe our revenues will vary significantly from period to period as aresult of the following:
• Fluctuations in the timing of customer orders. Mobile operators require significant lead times toincorporate changes and enhancements into their networks to ensure the various networkcomponents are interoperable. These lead times and interoperability testing requirements resultin an extended sales cycle and can lead to uneven purchasing patterns. In addition, our relianceon a relatively limited number of customers contributes to the variability of revenues.
• The timing of revenue recognition in relation to the shipment of products. Our products containsoftware which is not incidental to our products. Therefore we recognize revenue pursuant tothe requirements of SOP 97-2 as discussed above. Due to these requirements, certain features ofour customer arrangements, such as customer acceptance terms in many of our customercontracts and the need for us to establish fair values of our products and services based on factsspecific to our operations, often require us to defer recognition of revenue for a significantperiod of time after shipment.
54

The variability in our revenues directly impacts our operating performance in any particular periodsince a significant portion of our operating costs, such as prototype and related equipment, share-basedcompensation and sales commissions, are either fixed in the short-term or may not vary proportionatelywith recorded revenues. Commissions are generally recorded at the point in time we receive a customerorder and revenue is recorded at the point in time all of the criteria for revenue recognition have beenmet. Revenue recognition often occurs in a period subsequent to receipt of the order. In certaincircumstances, commissions are not earned until the revenue associated with an order is recognized.The cost for prototype and related equipment may vary based on the number of products beingdeveloped.
Liquidity and Capital Resources
Resources
We funded our operations from 2000 through 2004 primarily with net proceeds of issuances ofconvertible preferred stock of approximately $100.0 million. Since 2005, we have funded our operationsprincipally with cash provided by operating activities, which was driven mainly by our revenue growth.
Cash, cash equivalents and short-term investments. Our cash, cash equivalents and short-terminvestments at December 31, 2007 of $233.6 million were held for working capital purposes and wereinvested primarily in money market funds. We do not enter into investments for trading or speculativepurposes. Restricted cash, which totaled $716,000 and $1.0 million at December 31, 2007 and 2006,respectively, was not included in cash and cash equivalents and was held as collateral for letters ofcredit related to vendor and lease agreements.
In June 2007, we completed an initial public offering of common stock pursuant to a RegistrationStatement on Form S-1 (Registration No. 333-141092) which the SEC declared effective on June 5,2007. Pursuant to the registration statement, we registered the offering and sale of an aggregate of12,115,067 shares of our common stock, of which 10,580,226 shares were sold by us including 1,580,226shares sold in connection with the underwriters’ option described below, and 1,534,841 shares were soldby certain stockholders, at a price of $12.00 per share. The underwriters exercised their option topurchase the additional 1,580,226 shares of our common stock at the initial public offering price of$12.00 per share on June 8, 2007 and the offering closed on June 11, 2007.
On November 6, 2007, we completed an underwritten public offering of 8,000,000 shares of ourcommon stock at a price to the public of $24.00 per share. Of the shares sold in the offering, 3,880,000shares were sold by us and 4,120,000 shares were sold by certain selling stockholders. We received totalnet proceeds from the November 2007 public offering of approximately $88.1 million, after deductingunderwriting discounts and commissions and estimated offering expenses. We did not receive anyproceeds from the sale of shares by the selling stockholders.
Our net cash flows from operating, investing and financing activities for the years indicated in thetable below were as follows:
Year Ended December 31,
2007 2006 2005
(dollars in thousands)
Net cash provided by (used in) operating activities . $(15,693) $ 30,049 $ 2,015Net cash provided by (used in) investing activities . . $ 9,441 $(27,123) $(20,488)Net cash provided by financing activities . . . . . . . . . $206,010 $ 987 $ 17,780
Operating activities. Cash from operating activities consists of significant components of thestatements of operations adjusted for changes in various working capital items including deferred
55

revenues, accounts receivable, inventories, accounts payable, prepaid expenses and various accruedexpenses.
2007 compared to 2006.
For the year ended December 31, 2007, net cash used in operating activities was $15.7 million ascompared to cash provided by operating activities of $30.0 million in 2006. Cash received fromcustomers decreased $7.1 million in 2007 to $105.0 million from $112.1 million in 2006. This reductionwas due primarily to the timing of billing and collections, which resulted in lower accounts receivable atthe beginning of 2007 and a higher accounts receivable balance at December 31, 2007. In addition, cashpaid for payroll and related expenses increased $20.0 million (totaling $55.5 million) in 2007 comparedto 2006, and cash paid for inventories was approximately $23.0 million higher in 2007 as compared to2006. The increase in payroll and related expenses was due primarily to our increased headcount andsales commissions as discussed above. The increase in cash paid for inventories was primarily due toour purchases of components related to our higher shipments due largely to the introduction of ourST40 platform.
2006 compared to 2005.
For the year ended December 31, 2006, net cash provided by operating activities was $30.0 millioncompared to $2.0 million in 2005. Cash received from customers increased $45.0 million in 2006 to$112.1 million from $67.1 million in 2005 primarily due to higher shipments combined with a reductionin accounts receivable of $4.0 million. The increase in cash receipts from customers was partially offsetby an increase in payments for payroll and related expenses of $8.9 million, which totaled $35.5 millionin 2006. The increase in cash paid for payroll and related expenses was primarily due to our increasedheadcount and sales commissions as discussed above. Cash paid for inventories was $17.8 million in2006, which was relatively consistent to 2005. In addition to these significant receipts and payments,amounts paid for prototypes and related equipment, consulting, professional fees, travel and otheritems increased during 2006 due primarily to our higher number of personnel, increased number oflocations and continued investment in infrastructure to support our growth.
Investing activities. Cash from investing activities consisted primarily of capital expenditures andpurchases and sales of short-term investments associated with our investment balances. The $9.4 millionof cash provided by investing activities for the year ended December 31, 2007 consisted primarily ofmaturities of short-term investments partially offset by $16.6 million of capital expenditures andpurchases of short-term investments of $20.4 million.
Net cash used in investing activities increased $6.6 million for the year ended December 31, 2006compared to 2005 primarily due to $5.2 million higher capital expenditures in 2006.
Financing activities. Cash from financing activities for 2007 consisted primarily of $204.1 million ofcash received from the issuance of our common stock in two public offerings during 2007 discussedabove. In addition, we received approximately $1.9 million associated with the exercise of options topurchase our common stock and purchases of our restricted common stock.
At December 31, 2007 and 2006, we had no long-term debt outstanding and our restricted cashwas our only asset pledged as collateral.
We believe our existing cash and cash equivalents, short-term investments and cash flows fromoperating activities will be sufficient to finance our planned growth, enhance our products and fundanticipated capital expenditures for the foreseeable future.
We may use the net proceeds from our public offerings for working capital and other generalcorporate purposes, to finance accelerated growth, develop new product lines and fund acquisitions andstrategic investments. These future working capital requirements will depend on many factors, including
56

the rate of our revenue growth, our introduction of new products and enhancements and our expansionof sales and marketing and product development activities. To the extent our existing resources areinsufficient to fund these activities we may need to raise additional funds through bank creditarrangements or public or private equity or debt financings. We also may need to raise additional fundsin the event we determine in the future to effect one or more acquisitions of businesses, technologiesand products that complement our existing operations. In the event additional funding is required, wemay not be able to obtain bank credit arrangements or complete an equity or debt financing on termsacceptable to us or at all.
Requirements
Capital expenditures. We have made capital expenditures primarily for testing and evaluationsystems and equipment to support product development and customer service, as well as for leaseholdimprovements and other general purposes to support our growth. Our capital expenditures totaled$16.6 million, $8.6 million and $3.4 million for the years ended December 31, 2007, 2006 and 2005,respectively. We expect capital expenditures to be approximately $20-25 million for 2008, primarilyrelated to purchases of test equipment, equipment to support product development and customerservice, leasehold improvements and other general purposes to support our growth.
Contractual obligations and requirements. As of December 31, 2007, our commitments underoperating leases and purchase obligations were as set forth below. For purposes of the table below,purchase obligations are defined as agreements to purchase goods or services that are enforceable andlegally binding and that specify all significant terms, including fixed or minimum quantities to bepurchased, fixed, minimum or variable pricing provisions, and the approximate timing of transactions.
2-3 4-5 More thanTotal 2008 Years Years 5 Years
(dollars in thousands)
Operating leases . . . . . . . . . . . . . . . . . . . . . . . . . . . . $ 7,056 $ 2,448 $3,589 $1,006 $13Purchase obligations . . . . . . . . . . . . . . . . . . . . . . . . . 18,075 17,687 388 — —
Total . . . . . . . . . . . . . . . . . . . . . . . . . . . . . . . . . . $25,131 $20,135 $3,977 $1,006 $13
The table above does not reflect unrecognized tax benefits of $219,000, the timing of which isuncertain. Refer to Note 7 to our consolidated financial statements for additional discussion onunrecognized tax benefits.
Off-Balance-Sheet Arrangements
We do not engage in any off balance sheet financing activities. We do not have any interest inentities referred to as variable interest entities, which includes special purpose entities and otherstructured finance entities.
Item 7A. Quantitative and Qualitative Disclosures About Market Risk
Market risk represents the risk of loss that may impact our financial position due to adversechanges in financial market prices and rates. Our market risk exposure is primarily a result offluctuations in foreign exchange rates and interest rates. We do not hold or issue financial instrumentsfor trading purposes.
Foreign Currency Exchange Risk
To date, substantially all of our international customer transactions have been denominated in U.S.dollars. Accordingly, we have limited exposure to foreign currency exchange rates and do not enter into
57
foreign currency hedging transactions. The functional currency of our foreign operations in Europe,Asia and South America is the U.S. dollar. Accordingly, all assets and liabilities of these foreignsubsidiaries are remeasured into U.S. dollars using the exchange rates in effect at the balance sheetdate. Revenues and expenses of these foreign subsidiaries are remeasured into U.S. dollars at theaverage rates in effect during the year. Any differences resulting from the remeasurement of assets,liabilities and operations of these subsidiaries are recorded within other income (expense) in ourconsolidated statements of operations. If the foreign currency exchange rates fluctuated by 10% as ofDecember 31, 2007, our foreign exchange gain or loss would have fluctuated by approximately$169,000.
Interest Rate Risk
At December 31, 2007, we had unrestricted cash and cash equivalents and short-term investmentstotaling $233.6 million. These amounts were invested primarily in money market funds and high qualitycorporate and government securities. The unrestricted cash and cash equivalents were held for workingcapital purposes. We do not enter into investments for trading or speculative purposes. Due to theshort-term nature of these investments, we believe that we do not have any material exposure tochanges in the fair value of our investment portfolio as a result of changes in interest rates. Declines ininterest rates, however, would reduce future investment income.
Recent Accounting Pronouncements
In September 2006, the FASB issued SFAS 157, Fair Value Measurement, which provides guidancefor using fair value to measure assets and liabilities. In addition, SFAS 157 also provides guidance forexpanded information about the extent to which companies measure assets and liabilities at fair value,the information used to measure fair value and the effect of fair value measurements on earnings.SFAS 157 applies whenever other standards require (or permit) assets or liabilities to be measured atfair value, but does not expand the use of fair value in any new circumstances. The provisions ofSFAS 157 will be effective beginning January 1, 2008, except for the provisions related to the valuationof nonfinancial assets and liabilities which will be effective on January 1, 2009 in accordance with theFASB’s announcement to delay these certain provisions of SFAS 157. We are in the process ofdetermining the effect, if any, that the adoption of SFAS 157 will have on our consolidated financialstatements.
In February 2007, the FASB issued SFAS 159, The Fair Value Option for Financial Assets andFinancial Liabilities, Including an Amendment of FASB Statement No. 115. SFAS 159 allows entities tomeasure many financial instruments and certain other assets and liabilities at fair value on aninstrument-by-instrument basis (the fair value option). The fair value option represents a step in theevolution of financial reporting because it considerably expands the ability of entities to select themeasurement attribute for certain assets and liabilities. We will be required to adopt the provisions ofSFAS 159 on January 1, 2008. We are in the process of determining the effect, if any, the adoption ofSFAS 159 will have on our consolidated financial statements.
In December 2007, the FASB released SFAS 141 (revised 2007), Business Combinations. Thisstatement will significantly change the accounting for business combinations in a number of areasincluding the treatment of contingent consideration, contingencies, acquisition costs, in process researchand development and restructuring costs. In addition, under this statement, changes in deferred taxasset valuation allowances and acquired income tax uncertainties in a business combination after themeasurement period will impact income tax expense. This statement will be effective on January 1,2009 and we will change the change our accounting treatment for business combinations on aprospective basis.
58

In December 2007, the FASB released SFAS 160, Noncontrolling Interests in Consolidated FinancialStatements—an amendment of ARB No. 51. This statement will change the accounting and reporting forminority interests, which will be recharacterized as noncontrolling interests and classified as acomponent of equity. This new consolidation method will significantly change the accounting fortransactions with minority interest holders. The provisions of this statement will be effective for us onJanuary 1, 2009. We have not yet determined the impact, if any, this statement will have on ourconsolidated financial statements.
59

Item 8. Financial Statement and Supplementary Data
STARENT NETWORKS, CORP.
INDEX TO CONSOLIDATED FINANCIAL STATEMENTS
Report of Independent Registered Public Accounting Firm . . . . . . . . . . . . . . . . . . . . . . . . . . . . 61
Consolidated Balance Sheets as of December 31, 2007 and 2006 . . . . . . . . . . . . . . . . . . . . . . . . 62
Consolidated Statements of Operations for the Years Ended December 31, 2007, 2006 and 2005 . 63
Consolidated Statements of Stockholders’ Equity (Deficit) and Comprehensive Income for theYears Ended December 31, 2007, 2006 and 2005 . . . . . . . . . . . . . . . . . . . . . . . . . . . . . . . . . . 64
Consolidated Statements of Cash Flows for the Years Ended December 31, 2007, 2006 and 2005 . . 65
Notes to Consolidated Financial Statements . . . . . . . . . . . . . . . . . . . . . . . . . . . . . . . . . . . . . . . 66
60

REPORT OF INDEPENDENT REGISTERED PUBLIC ACCOUNTING FIRM
To the Board of Directors and Stockholders ofStarent Networks, Corp.
In our opinion, the accompanying consolidated balance sheets and the related consolidatedstatements of operations, of stockholders’ equity (deficit) and comprehensive income and of cash flowspresent fairly, in all material respects, the financial position of Starent Networks, Corp. and itssubsidiaries at December 31, 2007 and 2006, and the results of their operations and their cash flows foreach of the three years in the period ended December 31, 2007 in conformity with accountingprinciples generally accepted in the United States of America. These financial statements are theresponsibility of the Company’s management. Our responsibility is to express an opinion on thesefinancial statements based on our audits. We conducted our audits of these statements in accordancewith the standards of the Public Company Accounting Oversight Board (United States). Thosestandards require that we plan and perform the audit to obtain reasonable assurance about whether thefinancial statements are free of material misstatement. An audit includes examining, on a test basis,evidence supporting the amounts and disclosures in the financial statements, assessing the accountingprinciples used and significant estimates made by management, and evaluating the overall financialstatement presentation. We believe that our audits provide a reasonable basis for our opinion.
As discussed in Note 2 to the consolidated financial statements, the Company changed the mannerin which it accounts for share-based compensation in 2006.
/s/ PricewaterhouseCoopers LLP
Boston, MassachusettsFebruary 29, 2008
61

STARENT NETWORKS, CORP.CONSOLIDATED BALANCE SHEETS
(in thousands, except share and per share data)
December 31,
2007 2006
AssetsCurrent assets:
Cash and cash equivalents . . . . . . . . . . . . . . . . . . . . . . . . . . . . . . . . . . . . . . $223,987 $ 24,010Short-term investments . . . . . . . . . . . . . . . . . . . . . . . . . . . . . . . . . . . . . . . . 9,612 36,144Accounts receivable . . . . . . . . . . . . . . . . . . . . . . . . . . . . . . . . . . . . . . . . . . . 56,363 13,619Inventories . . . . . . . . . . . . . . . . . . . . . . . . . . . . . . . . . . . . . . . . . . . . . . . . . 29,638 15,121Prepaid expenses and other current assets . . . . . . . . . . . . . . . . . . . . . . . . . . 6,656 3,193
Total current assets . . . . . . . . . . . . . . . . . . . . . . . . . . . . . . . . . . . . . . . . . 326,256 92,087Property and equipment, net . . . . . . . . . . . . . . . . . . . . . . . . . . . . . . . . . . . . . . 20,452 10,296Other assets . . . . . . . . . . . . . . . . . . . . . . . . . . . . . . . . . . . . . . . . . . . . . . . . . . 1,955 845Restricted cash . . . . . . . . . . . . . . . . . . . . . . . . . . . . . . . . . . . . . . . . . . . . . . . . 716 1,039
Total assets . . . . . . . . . . . . . . . . . . . . . . . . . . . . . . . . . . . . . . . . . . . . . . . $349,379 $ 104,267
Liabilities, redeemable convertible preferred stock and stockholders’ equity (deficit)Current liabilities:
Accounts payable . . . . . . . . . . . . . . . . . . . . . . . . . . . . . . . . . . . . . . . . . . . . $ 7,448 $ 4,249Accrued expenses . . . . . . . . . . . . . . . . . . . . . . . . . . . . . . . . . . . . . . . . . . . . 6,163 2,675Accrued payroll and related expenses . . . . . . . . . . . . . . . . . . . . . . . . . . . . . . 15,568 7,977Income taxes payable . . . . . . . . . . . . . . . . . . . . . . . . . . . . . . . . . . . . . . . . . 1,075 232Current portion of deferred revenue . . . . . . . . . . . . . . . . . . . . . . . . . . . . . . 52,733 57,106
Total current liabilities . . . . . . . . . . . . . . . . . . . . . . . . . . . . . . . . . . . . . . . 82,987 72,239Deferred revenue, net of current portion . . . . . . . . . . . . . . . . . . . . . . . . . . . . . 10,670 6,562Refundable exercise price of restricted common stock . . . . . . . . . . . . . . . . . . . . 783 707Commitments and contingencies (Note 11)Redeemable convertible preferred stock, $0.01 par value, no shares and
64,587,861 shares authorized, issued and outstanding at December 31, 2007and 2006, at liquidation preference . . . . . . . . . . . . . . . . . . . . . . . . . . . . . . . — 130,270
Stockholders’ equity (deficit):Preferred stock, $0.001 par value, 5,000,000 authorized and no shares
outstanding . . . . . . . . . . . . . . . . . . . . . . . . . . . . . . . . . . . . . . . . . . . . . . . — —Common stock, $0.001 par value, 250,000,000 and 120,000,000 shares
authorized, 68,252,858 and 7,456,672 shares issued and outstanding atDecember 31, 2007 and 2006, respectively . . . . . . . . . . . . . . . . . . . . . . . . . 68 7
Additional paid-in capital . . . . . . . . . . . . . . . . . . . . . . . . . . . . . . . . . . . . . . 348,917 —Accumulated other comprehensive income (loss) . . . . . . . . . . . . . . . . . . . . . . 2 (1)Accumulated deficit . . . . . . . . . . . . . . . . . . . . . . . . . . . . . . . . . . . . . . . . . . (94,048) (105,517)
Total stockholders’ equity (deficit) . . . . . . . . . . . . . . . . . . . . . . . . . . . . . . 254,939 (105,511)
Total liabilities, redeemable convertible preferred stock and stockholders’equity (deficit) . . . . . . . . . . . . . . . . . . . . . . . . . . . . . . . . . . . . . . . . . . . $349,379 $ 104,267
The accompanying notes are an integral part of these consolidated financial statements.
62

STARENT NETWORKS, CORP.CONSOLIDATED STATEMENTS OF OPERATIONS
(in thousands, except per share data)
Year Ended December 31,
2007 2006 2005
Revenues:Product . . . . . . . . . . . . . . . . . . . . . . . . . . . . . . . . . . . . . . . . . . . . . $125,251 $81,061 $51,819Services . . . . . . . . . . . . . . . . . . . . . . . . . . . . . . . . . . . . . . . . . . . . . 20,546 13,289 7,841
Total revenues . . . . . . . . . . . . . . . . . . . . . . . . . . . . . . . . . . . . . . . 145,797 94,350 59,660
Cost of revenues:Product . . . . . . . . . . . . . . . . . . . . . . . . . . . . . . . . . . . . . . . . . . . . . 29,064 25,640 12,285Services . . . . . . . . . . . . . . . . . . . . . . . . . . . . . . . . . . . . . . . . . . . . . 9,299 2,086 1,358
Total cost of revenues . . . . . . . . . . . . . . . . . . . . . . . . . . . . . . . . . 38,363 27,726 13,643
Gross profit . . . . . . . . . . . . . . . . . . . . . . . . . . . . . . . . . . . . . . . . . . . . 107,434 66,624 46,017
Operating expenses:Research and development . . . . . . . . . . . . . . . . . . . . . . . . . . . . . . . 38,868 25,980 18,107Sales and marketing . . . . . . . . . . . . . . . . . . . . . . . . . . . . . . . . . . . . 46,434 30,311 19,785General and administrative . . . . . . . . . . . . . . . . . . . . . . . . . . . . . . . 15,340 8,515 7,352
Total operating expenses . . . . . . . . . . . . . . . . . . . . . . . . . . . . . . . . 100,642 64,806 45,244
Income from operations . . . . . . . . . . . . . . . . . . . . . . . . . . . . . . . . . . . 6,792 1,818 773Interest income . . . . . . . . . . . . . . . . . . . . . . . . . . . . . . . . . . . . . . . . . 6,065 2,313 798Foreign currency exchange gain (loss) . . . . . . . . . . . . . . . . . . . . . . . . . 26 (73) (150)Other income (expense) . . . . . . . . . . . . . . . . . . . . . . . . . . . . . . . . . . . (1) (3) (4)
Income before income tax expense . . . . . . . . . . . . . . . . . . . . . . . . . . . 12,882 4,055 1,417Income tax expense . . . . . . . . . . . . . . . . . . . . . . . . . . . . . . . . . . . . . . (1,413) (413) (513)
Net income . . . . . . . . . . . . . . . . . . . . . . . . . . . . . . . . . . . . . . . . . . . . 11,469 3,642 904Accretion of redeemable convertible preferred stock . . . . . . . . . . . . . . . (3,445) (7,988) (7,349)Income allocated to preferred stockholders . . . . . . . . . . . . . . . . . . . . . (2,539) — —
Net income (loss) applicable to common stockholders . . . . . . . . . . . . . . $ 5,485 $(4,346) $(6,445)
Net income (loss) per share applicable to common stockholdersBasic . . . . . . . . . . . . . . . . . . . . . . . . . . . . . . . . . . . . . . . . . . . . . . . $ 0.13 $ (0.62) $ (0.97)
Diluted . . . . . . . . . . . . . . . . . . . . . . . . . . . . . . . . . . . . . . . . . . . . . . $ 0.12 $ (0.62) $ (0.97)
Weighted-average shares used in computing basic and diluted netincome (loss) per common share . . . . . . . . . . . . . . . . . . . . . . . . . . .Basic . . . . . . . . . . . . . . . . . . . . . . . . . . . . . . . . . . . . . . . . . . . . . . . 40,901 7,026 6,642
Diluted . . . . . . . . . . . . . . . . . . . . . . . . . . . . . . . . . . . . . . . . . . . . . . 47,044 7,026 6,642
The accompanying notes are an integral part of these consolidated financial statements.
63

STARENT NETWORKS, CORP.CONSOLIDATED STATEMENTS OF STOCKHOLDERS’ EQUITY (DEFICIT)
AND COMPREHENSIVE INCOME(in thousands)
AccumulatedAdditional Other TotalCommon Stock Paid-in Comprehensive Accumulated Stockholders’
Shares Amount Capital Income (Loss) Deficit Deficit
Balance at December 31, 2004 . . . . . . . . 6,318 $ 6 $ — $ — $ (97,098) $ (97,092)Accretion of redeemable convertible
preferred stock . . . . . . . . . . . . . . . . — — (357) — (6,992) (7,349)Vesting of restricted stock . . . . . . . . . . . 210 1 44 — — 45Issuance of restricted stock grants to
employees below fair market value andrelated stock-based compensationexpense . . . . . . . . . . . . . . . . . . . . . 3 — 4 — — 4
Exercise of stock options . . . . . . . . . . . 169 — 55 — — 55Compensation expense on nonemployee
option grants . . . . . . . . . . . . . . . . . — — 254 — — 254Comprehensive income:
Net income . . . . . . . . . . . . . . . . . . — — — — 904 904Unrealized loss on short-term
investments . . . . . . . . . . . . . . . . . — — — (23) — (23)
Total comprehensive income . . . . . . . . — — — — — 881
Balance at December 31, 2005 . . . . . . . . 6,700 7 — (23) (103,186) (103,202)Accretion of redeemable convertible
preferred stock . . . . . . . . . . . . . . . . — — (2,015) — (5,973) (7,988)Vesting of restricted stock . . . . . . . . . . . 26 — 15 — — 15Issuance of restricted stock grants to
employees below fair market value andrelated stock-based compensationexpense . . . . . . . . . . . . . . . . . . . . . 3 — 6 — — 6
Exercise of stock options . . . . . . . . . . . 728 — 336 — — 336Compensation expense on option grants . . — — 1,658 — — 1,658Comprehensive income:
Net income . . . . . . . . . . . . . . . . . . — — — — 3,642 3,642Change in unrealized loss on short-term
investments . . . . . . . . . . . . . . . . . — — — 22 — 22
Total comprehensive income . . . . . . . . — — — — — 3,664
Balance at December 31, 2006 . . . . . . . . 7,457 7 — (1) (105,517) (105,511)Accretion of redeemable convertible
preferred stock . . . . . . . . . . . . . . . . — — (3,445) — — (3,445)Redeemable convertible preferred stock
converted to common . . . . . . . . . . . . 44,288 44 133,671 — — 133,715Proceeds from public offerings, net of
expense . . . . . . . . . . . . . . . . . . . . . 14,460 15 204,117 204,132Vesting of restricted stock . . . . . . . . . . . 75 — 271 — — 271Issuance of restricted stock grants to
employees below fair market value andrelated stock-based compensationexpense . . . . . . . . . . . . . . . . . . . . . 3 — 54 — — 54
Exercise of stock options . . . . . . . . . . . 1,970 2 1,529 — — 1,531Compensation expense on option grants . . — — 12,720 — — 12,720Comprehensive income:
Net income . . . . . . . . . . . . . . . . . . — — — — 11,469 11,469Change in unrealized gain on short-term
investments . . . . . . . . . . . . . . . . . — — — 3 — 3
Total comprehensive income . . . . . . . . — — — — — 11,472
Balance at December 31, 2007 . . . . . . . . 68,253 $68 $348,917 $ 2 $ (94,048) $ 254,939
The accompanying notes are an integral part of these consolidated financial statements.
64
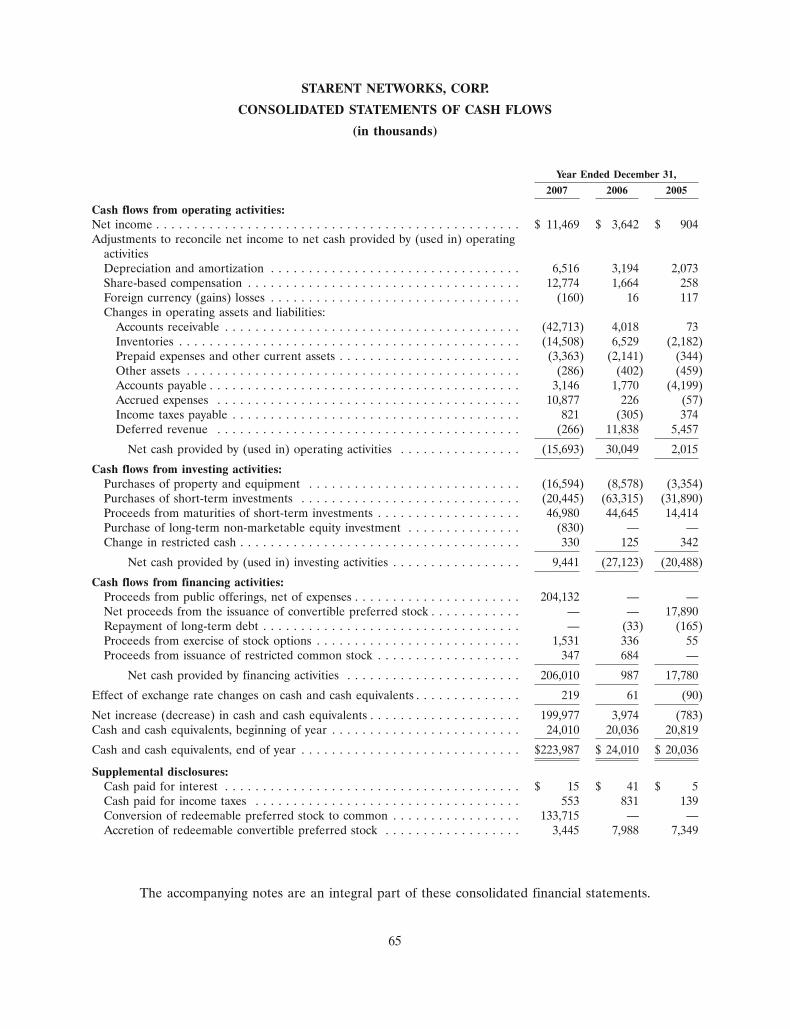
STARENT NETWORKS, CORP.
CONSOLIDATED STATEMENTS OF CASH FLOWS
(in thousands)
Year Ended December 31,
2007 2006 2005
Cash flows from operating activities:Net income . . . . . . . . . . . . . . . . . . . . . . . . . . . . . . . . . . . . . . . . . . . . . . . . $ 11,469 $ 3,642 $ 904Adjustments to reconcile net income to net cash provided by (used in) operating
activitiesDepreciation and amortization . . . . . . . . . . . . . . . . . . . . . . . . . . . . . . . . . 6,516 3,194 2,073Share-based compensation . . . . . . . . . . . . . . . . . . . . . . . . . . . . . . . . . . . . 12,774 1,664 258Foreign currency (gains) losses . . . . . . . . . . . . . . . . . . . . . . . . . . . . . . . . . (160) 16 117Changes in operating assets and liabilities:
Accounts receivable . . . . . . . . . . . . . . . . . . . . . . . . . . . . . . . . . . . . . . . (42,713) 4,018 73Inventories . . . . . . . . . . . . . . . . . . . . . . . . . . . . . . . . . . . . . . . . . . . . . (14,508) 6,529 (2,182)Prepaid expenses and other current assets . . . . . . . . . . . . . . . . . . . . . . . . (3,363) (2,141) (344)Other assets . . . . . . . . . . . . . . . . . . . . . . . . . . . . . . . . . . . . . . . . . . . . (286) (402) (459)Accounts payable . . . . . . . . . . . . . . . . . . . . . . . . . . . . . . . . . . . . . . . . . 3,146 1,770 (4,199)Accrued expenses . . . . . . . . . . . . . . . . . . . . . . . . . . . . . . . . . . . . . . . . 10,877 226 (57)Income taxes payable . . . . . . . . . . . . . . . . . . . . . . . . . . . . . . . . . . . . . . 821 (305) 374Deferred revenue . . . . . . . . . . . . . . . . . . . . . . . . . . . . . . . . . . . . . . . . (266) 11,838 5,457
Net cash provided by (used in) operating activities . . . . . . . . . . . . . . . . (15,693) 30,049 2,015
Cash flows from investing activities:Purchases of property and equipment . . . . . . . . . . . . . . . . . . . . . . . . . . . . (16,594) (8,578) (3,354)Purchases of short-term investments . . . . . . . . . . . . . . . . . . . . . . . . . . . . . (20,445) (63,315) (31,890)Proceeds from maturities of short-term investments . . . . . . . . . . . . . . . . . . . 46,980 44,645 14,414Purchase of long-term non-marketable equity investment . . . . . . . . . . . . . . . (830) — —Change in restricted cash . . . . . . . . . . . . . . . . . . . . . . . . . . . . . . . . . . . . . 330 125 342
Net cash provided by (used in) investing activities . . . . . . . . . . . . . . . . . 9,441 (27,123) (20,488)
Cash flows from financing activities:Proceeds from public offerings, net of expenses . . . . . . . . . . . . . . . . . . . . . . 204,132 — —Net proceeds from the issuance of convertible preferred stock . . . . . . . . . . . . — — 17,890Repayment of long-term debt . . . . . . . . . . . . . . . . . . . . . . . . . . . . . . . . . . — (33) (165)Proceeds from exercise of stock options . . . . . . . . . . . . . . . . . . . . . . . . . . . 1,531 336 55Proceeds from issuance of restricted common stock . . . . . . . . . . . . . . . . . . . 347 684 —
Net cash provided by financing activities . . . . . . . . . . . . . . . . . . . . . . . 206,010 987 17,780
Effect of exchange rate changes on cash and cash equivalents . . . . . . . . . . . . . . 219 61 (90)
Net increase (decrease) in cash and cash equivalents . . . . . . . . . . . . . . . . . . . . 199,977 3,974 (783)Cash and cash equivalents, beginning of year . . . . . . . . . . . . . . . . . . . . . . . . . 24,010 20,036 20,819
Cash and cash equivalents, end of year . . . . . . . . . . . . . . . . . . . . . . . . . . . . . $223,987 $ 24,010 $ 20,036
Supplemental disclosures:Cash paid for interest . . . . . . . . . . . . . . . . . . . . . . . . . . . . . . . . . . . . . . . $ 15 $ 41 $ 5Cash paid for income taxes . . . . . . . . . . . . . . . . . . . . . . . . . . . . . . . . . . . 553 831 139Conversion of redeemable preferred stock to common . . . . . . . . . . . . . . . . . 133,715 — —Accretion of redeemable convertible preferred stock . . . . . . . . . . . . . . . . . . 3,445 7,988 7,349
The accompanying notes are an integral part of these consolidated financial statements.
65

STARENT NETWORKS, CORP.NOTES TO CONSOLIDATED FINANCIAL STATEMENTS
1. Organization and Operations
Starent Networks, Corp. (the ‘‘Company’’) was incorporated in Delaware on August 11, 2000 andis a leading provider of infrastructure hardware and software products and services that enable mobilewireless operators to deliver multimedia services to their subscribers. The Company’s products andservices integrate multiple network functions and services needed for the delivery of advancedmultimedia services, such as video, Internet access, voice-over-IP, e-mail, mobile TV, photo sharing andgaming.
The accompanying consolidated financial statements include the accounts of the Company and itswholly-owned subsidiaries, Starent Networks Securities Corp. (a Massachusetts Securities Corporation),Starent International, Corp. (a Delaware Corporation), Starent Networks Japan, K.K. (a JapaneseCorporation), Starent do Brasil Ltda. (a Brazilian Corporation), Starent Networks (India) Pvt. Ltd. (anIndian Corporation), Starent Networks Beijing Co., Ltd. (a Chinese Corporation), Starent Networks(UK) Ltd. (a British Corporation), Starent Networks Spain, S.L. (a Spanish Corporation) and StarentNetworks Canada Limited (a Canadian Corporation).
2. Summary of Significant Accounting Policies
The accompanying financial statements reflect the application of certain significant accountingpolicies as described in this note and elsewhere in the footnotes.
Use of Estimates
The preparation of financial statements in conformity with accounting principles generally acceptedin the United States of America requires management to make estimates and assumptions that affectthe reported amounts of assets and liabilities and the disclosure of contingent assets and liabilities atthe dates of the financial statements and the reported amounts of revenue and expenses during thereporting periods. On an ongoing basis, the Company evaluates its estimates and judgments, includingthose related to revenue recognition, the realizable value of accounts receivable and inventories, valuingshare-based compensation instruments, evaluating loss contingencies and valuation allowances fordeferred tax assets. Actual amounts could differ from these estimates. Changes in estimates arerecorded in the period in which they become known.
Principles of Consolidation
The Company has determined the functional currency of its wholly-owned subsidiaries is the U. S.dollar. Monetary assets and liabilities denominated in currencies other than the functional currency areremeasured into the functional currency at the applicable rates of exchange in effect at the balancesheet date. Nonmonetary assets such as property and equipment are remeasured at historical rates.Income and expense items are remeasured at effective rates of exchange prevailing during the year,except that depreciation charged to operations is remeasured at historical rates. Exchange gains andlosses based upon these remeasurements are recorded in the consolidated statements of operations. Allintercompany accounts and transactions have been eliminated in consolidation.
Reclassification
To conform to the current year presentation, spare parts inventory at December 31, 2006 andrelated purchases made during 2006 were reclassified from property and equipment to inventory in the2006 consolidated balance sheet and consolidated statement of cash flows.
66

STARENT NETWORKS, CORP.NOTES TO CONSOLIDATED FINANCIAL STATEMENTS (Continued)
2. Summary of Significant Accounting Policies (Continued)
Cash, Cash Equivalents, Short-Term Investments and Restricted Cash
Cash and cash equivalents consist of cash held in bank deposit accounts and short-term, highlyliquid investments with remaining maturities of three months or less at the date of purchase. Cashequivalents are carried at amortized cost, which approximates fair value.
Short-term investments consist of high quality corporate and government securities with remainingmaturities of more than three months at the date of purchase and less than one year from the date ofthe balance sheet. The Company accounts for investments under the provisions of the FinancialAccounting Standards Board (‘‘FASB’’) Statement of Financial Accounting Standards (‘‘SFAS’’) 115,Accounting for Certain Investments in Debt and Equity Securities. As of December 31, 2007 and 2006, allof the Company’s investments are classified and accounted for as ‘‘available for sale.’’ Theseinvestments were carried at fair market value with unrealized gains and losses considered to betemporary in nature reported as a separate component of other comprehensive income (loss). Theamortized cost of debt securities in this category is adjusted for amortization of premiums andaccretion of discounts to maturity. Such amortization and accretion is included in interest or otherincome (expense).
As of December 31, 2007 and 2006, $716,000 and $1.0 million, respectively, was restricted as to usepursuant to certain agreements with vendors and facility lease agreements. These restricted balancesconsist primarily of investments in money market funds and certificates of deposit.
Concentrations of Risk and Off-Balance-Sheet Risk
The Company has no significant off-balance-sheet risk such as foreign exchange contracts, optioncontracts or other foreign hedging arrangements. Financial instruments that potentially subject theCompany to concentrations of credit risk are principally cash and cash equivalents, short-terminvestments, accounts receivable and inventories. The Company’s cash equivalents and its short-terminvestments are principally maintained with one commercial bank.
In 2007, the Company had three customers that each represented more than 10% of its revenues,one of which represented 45% and two additional customers, each of which represented approximately15% of revenues. In 2006, the Company had two customers that each presented more than 10% of itsrevenues, one of which represented more than 40% of revenues and the other which represented morethan 30% of revenues.
At December 31, 2007, the Company had two customers that accounted for 74% of accountsreceivable. At December 31, 2006, the Company had three customers that accounted for 76% ofaccounts receivable.
The Company relies on a single contract manufacturer to manufacture and assemble its products.The Company has no long-term supply arrangements with this manufacturer and accordingly noobligation exists for the manufacturer to supply products to the Company in specific quantities orwithin specific time frames.
In addition, certain of the components included in the Company’s products are sourced from asingle or limited sources and lead times for some of these components may be significant. TheCompany has no long-term contracts to purchase these components.
67

STARENT NETWORKS, CORP.NOTES TO CONSOLIDATED FINANCIAL STATEMENTS (Continued)
2. Summary of Significant Accounting Policies (Continued)
Fair Value of Financial Instruments
The Company’s financial instruments include cash and cash equivalents, accounts receivable,short-term investments and accounts payable. The carrying value of such financial instrumentsapproximates their estimated fair value due to their short-term duration.
Comprehensive Income
SFAS 130, Reporting Comprehensive Income, establishes standards for the reporting andpresentation of comprehensive income and its components. Comprehensive income, as defined, includesall changes in stockholders’ equity during a period from nonowner sources. Comprehensive income forthe years ended December 31, 2007, 2006 and 2005 was equal to net income adjusted for unrealizedgains and losses on short-term investments.
Allowance for Doubtful Accounts
We make judgments as to our ability to collect outstanding receivables and provide allowances forthe portion of receivables when collection becomes doubtful. Provisions are made based upon a specificreview of all significant outstanding invoices. No reserve was required at December 31, 2007 and 2006.
Inventories
Inventories are stated at the lower of cost (first-in, first-out) or market (net realizable value).
The Company provides for inventory losses based on obsolescence and levels of inventory on handin excess of forecasted demand. In these cases, inventory is reduced to estimated net realizable valuebased on historical usage and expected demand. Inherent in the Company’s estimates of market valuein determining inventory valuation are estimates related to economic trends, future demand for theCompany’s products and technical obsolescence of its products.
When products have been delivered to customers, but the product revenue associated with thearrangement has been deferred as a result of not meeting the criteria to recognize revenue, theCompany includes the costs for the delivered items in inventory until recognition of the related revenueoccurs.
Property and Equipment
Property and equipment are stated at cost, less accumulated depreciation and amortization.Repairs and maintenance costs are expensed as incurred. Depreciation and amortization are recordedusing the straight-line method over the estimated useful lives of the related assets as follows:
Asset Classification Estimated Useful Life
Equipment and software . . . . . . . . . . . . . . . . . . . 3 yearsFurniture and fixtures . . . . . . . . . . . . . . . . . . . . . 5 yearsBuildings . . . . . . . . . . . . . . . . . . . . . . . . . . . . . . . 20 yearsLeasehold improvements . . . . . . . . . . . . . . . . . . . Shorter of the remaining lease
term or estimated useful life
68

STARENT NETWORKS, CORP.NOTES TO CONSOLIDATED FINANCIAL STATEMENTS (Continued)
2. Summary of Significant Accounting Policies (Continued)
Long-Lived Assets
The Company evaluates the recoverability of long-lived assets whenever events and changes incircumstances indicate that the carrying amount of an asset may not be fully recoverable. This reviewmay result in an adjustment of estimated depreciable lives or an asset impairment. When indicators ofimpairment are present, the carrying values of the asset are evaluated in relation to their operatingperformance and the future undiscounted cash flows of the underlying business. If the futureundiscounted cash flows are less than the book value of the asset, an impairment exists. Theimpairment is measured as the difference between the book value and the fair value of the underlyingasset. Fair values are based on estimates of market prices and assumptions concerning the amount andtiming of estimated future cash flows and assumed discount rates, reflecting varying degrees ofperceived risk. To date, no such impairment adjustments have been required.
Research and Development and Software Development Costs
Research and development expense consists primarily of personnel costs, prototype costs,consulting services and depreciation. Research and development costs are charged to operations asincurred. The Company evaluates the establishment of technological feasibility of the softwarecomponent of its anticipated products in accordance with SFAS 86, Accounting for the Costs ofComputer Software to Be Sold, Leased or Otherwise Marketed. The Company sells its products in amarket that is subject to rapid technological change, new product development and changing customerneeds; accordingly, the Company has concluded that technological feasibility is not established until thecompletion of a working model. The time period during which costs could be capitalized, from thepoint of reaching technological feasibility until the time of general product release, is very short and,consequently, the amounts that could be capitalized are not material to the Company’s financialposition or results of operations. Therefore, the Company has charged all such costs to research anddevelopment in the period incurred.
Revenue Recognition
The Company’s revenue is generated through fulfillment of contractual arrangements that containmultiple elements, including equipment with embedded software and services, such as installation,training, consulting and maintenance and support (‘‘M&S’’). The Company recognizes revenue inaccordance with Statement of Position (‘‘SOP’’) 97-2, Software Revenue Recognition and SOP 98-9,Modification of SOP 97-2, Software Revenue Recognition, With Respect to Certain Transactions.Accordingly, revenue is recognized when persuasive evidence of an arrangement exists, delivery hasoccurred, the price is fixed or determinable and collection is probable. Product revenues consist ofrevenues from sales of hardware and licensing of software. Product sales generally include a perpetualsoftware license. Product revenues are generally recognized upon shipment or upon customeracceptance, if contractually required, assuming all other revenue recognition criteria are met. Theacceptance terms typically included in the Company’s contracts and the need to establish fair values ofthe Company’s products and services based on facts specific to its operations are critical to the timingand extent of revenue recognition. As a result of these factors, the majority of the Company’scontractual arrangements result in the deferral of revenue.
69

STARENT NETWORKS, CORP.
NOTES TO CONSOLIDATED FINANCIAL STATEMENTS (Continued)
2. Summary of Significant Accounting Policies (Continued)
Pursuant to SOP 97-2, revenue is allocated to deliverables based on vendor specific objectiveevidence of fair value (‘‘VSOE’’) when VSOE exists. Generally, revenue is initially deferred whenVSOE does not exist and is subsequently recognized ratably over the contractual M&S period whenM&S is the only undelivered element. If VSOE exists for the undelivered elements, but not thedelivered elements, revenue is recognized under the residual method set forth in SOP 98-9, whichprovides that revenue for the delivered elements is recognized based on the difference between thetotal arrangement fee and the VSOE of the undelivered elements. Revenue for the undeliveredelements is then recorded as those elements are delivered. If the Company is required to defer revenuein an arrangement, the related equipment costs are also deferred, subject to their realizability, andrecognized over the same period as the related revenue.
The determination of VSOE is highly judgmental and is a key factor in determining when and towhat extent revenue may be recognized. The Company assesses VSOE based on previous sales ofproducts and services, the type and size of customer, renewal rates in contracts and the geographiclocation of the customer.
Generally, the Company licenses its software on a non-enterprise basis and recognizes revenueusing the residual method as described above. Some of the Company’s arrangements includeenterprise-wide perpetual software licenses. These licenses are also accounted for under the residualmethod, assuming all other revenue recognition criteria have been met.
Generally, M&S services are recognized ratably over the contractual service period, which istypically 12 to 24 months. Generally, installation, training and consulting services are recognized upondelivery of service.
The Company is occasionally engaged to perform projects relating to the development of customfeatures for some of its customers. Under these arrangements, the Company retains the rights to theintellectual property developed and bears the financial risk associated with the arrangement as thecustomer is not obligated to pay until technological feasibility has been established. The Companybelieves that these funded development arrangements qualify under the guidance set forth in SFAS 68,Research and Development Agreements. As such, research costs are expensed as incurred and projectfees are billed to the customer upon project completion. The Company does not consider itself to be inthe business of selling and providing development services. Nor does the Company provide a fullypaid-up license on the output of the development. As a result, the proceeds from the customer aregenerally recorded as a credit to research and development expense. For the years ended December 31,2007, 2006 and 2005, the Company recorded reimbursements to research and development expense of$1.9 million, $2.0 million and $2.0 million, respectively, relative to these development projects.
The Company also provides a warranty service period on its products; however warranty servicecoverage is generally superseded by coverage provided under simultaneous M&S agreements. As M&Srevenues are deferred and recorded ratably over the service period, any costs of product replacementare incurred in the same period. No specific warranty reserve was required at December 31, 2007 and2006.
Income taxes
The Company records income taxes using the asset and liability method. Deferred income taxassets and liabilities are recognized for future tax consequences attributable to differences between the
70

STARENT NETWORKS, CORP.
NOTES TO CONSOLIDATED FINANCIAL STATEMENTS (Continued)
2. Summary of Significant Accounting Policies (Continued)
financial statement carrying amounts of existing assets and liabilities and their respective income taxbases, and operating loss and tax credit carryforwards. The Company’s consolidated financial statementscontain certain deferred tax assets which have arisen primarily as a result of operating losses, as well asother temporary differences between financial and tax accounting. SFAS 109, Accounting for IncomeTaxes, requires the Company to establish a valuation allowance if the likelihood of realization of thedeferred tax assets is reduced based on an evaluation of objective verifiable evidence. Significantmanagement judgment is required in determining the Company’s provision for income taxes, theCompany’s deferred tax assets and liabilities and any valuation allowance recorded against those netdeferred tax assets. The Company evaluates the weight of all available evidence to determine whether itis more likely than not that some portion or all of the net deferred income tax assets will not berealized.
Share-Based Compensation
Prior to January 1, 2006, the Company accounted for stock-based compensation for employeesunder the intrinsic value method of Accounting Principles Board (‘‘APB’’) Opinion 25 and Accountingfor Stock Issued to Employees, as interpreted by FASB Interpretation 44 (‘‘FIN 44’’), and elected thedisclosure-only requirements of SFAS 123, Accounting for Stock-Based Compensation and SFAS 148,Accounting for Stock-Based Compensation—Transition and Disclosure—an Amendment of FASB StatementNo. 123. Accordingly, compensation cost had been recognized in the accompanying financial statementsfor share-based awards to employees to the extent the instruments were granted at an exercise or saleprice that was less than the then current fair value.
In December 2004, the FASB issued SFAS 123(Revised), Share-Based Payment, which is a revisionof SFAS 123. SFAS 123R supersedes APB Opinion 25, SFAS 123 and amends SFAS 95, Statement ofCash Flows. Generally, the approach in SFAS 123R is similar to the approach described in SFAS 123.However, SFAS 123R requires all share-based payments to employees, including grants of employeestock options, to be recognized in the income statement based on their grant date fair value. Pro formadisclosure only is no longer an alternative.
The Company adopted SFAS 123R effective January 1, 2006. SFAS 123R requires nonpubliccompanies that utilized the minimum value method in SFAS 123, for either recognition or pro formadisclosures, to adopt SFAS 123R under the prospective transition method. This method requires theCompany to apply the provisions of SFAS 123R only to new awards granted, and to awards modified,repurchased or cancelled on of after January 1, 2006.
The Company accounts for equity instruments issued to nonemployees in accordance with theprovisions of SFAS 123R (the requirements of which are consistent with those previously utilized underSFAS 123) and EITF Issue 96-18, Accounting for Equity Instruments That Are Issued to Other ThanEmployees for Acquiring, or in Conjunction with Selling, Goods or Services. When applicable, alltransactions in which services are received for the issuance of equity instruments are accounted forbased on the fair value of the consideration received or the fair value of the equity instrument issued,whichever is more reliably measurable. The measurement date of the fair value of the equityinstrument issued is the earlier of the date on which the counterparty’s performance is complete or thedate on which there is a commitment to perform, as defined.
The Company has elected to use the Black-Scholes option pricing model to determine the grantdate fair value of its share-based awards, except in those situations where an alternative method is
71

STARENT NETWORKS, CORP.
NOTES TO CONSOLIDATED FINANCIAL STATEMENTS (Continued)
2. Summary of Significant Accounting Policies (Continued)
required. In accordance with SFAS 123R, the Company will recognize the compensation cost of share-based awards on a graded vesting basis over the requisite service period of each award, which isgenerally the vesting period.
For the Black-Scholes model, the expected life of options was calculated based on the simplifiedmethod as permitted by the Securities and Exchange Commission’s (‘‘SEC’’) Staff Accounting Bulletin(‘‘SAB’’) 107, Share-Based Payments. The computation of expected volatility was based on the historicalvolatility of comparable companies from a representative peer group selected based on industry andmarket capitalization. The risk-free interest rate was based on a U.S. Treasury instrument whose term isconsistent with the expected life of the stock options. As required under SFAS 123R, managementmade an estimate of expected forfeitures and is recognizing compensation costs only for those equityawards expected to vest. The fair value of options granted for the years ended December 31, 2007 and2006 was estimated at the date of grant using the following assumptions:
Year Ended December 31,
2007 2006
Risk-free interest rates . . . . . . . . . . . . . . . . . . . 3.82% - 4.76% 4.55% - 4.99%Expected dividend yield . . . . . . . . . . . . . . . . . . . 0% 0%Expected life . . . . . . . . . . . . . . . . . . . . . . . . . . . 6.25 years 6.25 yearsExpected volatility . . . . . . . . . . . . . . . . . . . . . . . 57-68% 68%
The Company’s results for the years below included share-based compensation expense classified inthe following expense categories of the consolidated statements of operations (in thousands):
Year EndedDecember 31,
2007 2006
Share-based compensation included in:Cost of revenues . . . . . . . . . . . . . . . . . . . . . . . . . . . . . . . . . . . $ 782 $ 67
Total share-based compensation in cost of revenues . . . . . . . . 782 67
Research and development . . . . . . . . . . . . . . . . . . . . . . . . . . . 5,864 708Sales and marketing . . . . . . . . . . . . . . . . . . . . . . . . . . . . . . . . 2,883 385General and administrative . . . . . . . . . . . . . . . . . . . . . . . . . . . 3,245 504
Total share-based compensation in operating expenses . . . . . . 11,992 1,597
Total share-based compensation . . . . . . . . . . . . . . . . . . . . . . . . . $12,774 $1,664
At December 31, 2007, there was $16.3 million of total unrecognized compensation cost related tonon-vested stock awards. The Company expects to recognize those costs over the weighted-averageperiod of approximately 1.6 years.
Net Income (Loss) per Share
Basic and diluted net income (loss) per share applicable to common stockholders is presented inconformity with SFAS 128, Earnings per Share and the related interpretation in Emerging Issues TaskForce 03-06, Participating Securities and the Two-Class Method under FASB Statement No. 128. Basic net
72

STARENT NETWORKS, CORP.
NOTES TO CONSOLIDATED FINANCIAL STATEMENTS (Continued)
2. Summary of Significant Accounting Policies (Continued)
income (loss) per share applicable to common stockholders is computed by dividing net income (loss)applicable to common stockholders by the weighted-average number of common shares outstandingduring the period, excluding the dilutive effects of common stock equivalents. Income applicable tocommon stockholders includes accretion of redeemable convertible preferred stock and earningsallocated to participating preferred stockholders. Common stock equivalents include stock options,restricted stock and, in certain circumstances, convertible securities such as the convertible preferredstock. Diluted net income (loss) per share assumes the conversion of the convertible preferred stockusing the ‘‘if converted’’ method, if dilutive, and includes the dilutive effect of stock options andrestricted stock under the treasury stock method. The following table presents the calculation of basicand diluted net income (loss) per share (in thousands, except per share data):
Year Ended December 31,
2007 2006 2005
Net income . . . . . . . . . . . . . . . . . . . . . . . . . . . . . . . . . . . . . . . . . . . . . . $11,469 $ 3,642 $ 904Accretion of redeemable convertible preferred stock . . . . . . . . . . . . . . . . (3,445) (7,988) (7,349)Income allocated to preferred stockholders . . . . . . . . . . . . . . . . . . . . . . . (2,539) — —
Net income (loss) applicable to common stockholders . . . . . . . . . . . . . . . $ 5,485 $(4,346) $(6,445)
Weighted-average common shares outstanding—basic . . . . . . . . . . . . . . . 40,901 7,026 6,642Dilutive effect of stock options and restricted stock . . . . . . . . . . . . . . . . . 6,143 — —
Weighted-average common shares outstanding—diluted . . . . . . . . . . . . . . 47,044 7,026 6,642
Net income (loss) per share:Basic . . . . . . . . . . . . . . . . . . . . . . . . . . . . . . . . . . . . . . . . . . . . . . . . $ 0.13 $ (0.62) $ (0.97)Diluted . . . . . . . . . . . . . . . . . . . . . . . . . . . . . . . . . . . . . . . . . . . . . . . $ 0.12 $ (0.62) $ (0.97)
The following outstanding options, restricted common stock subject to repurchase and convertiblepreferred stock were excluded from the computation of diluted net income (loss) per common shareapplicable to common stockholders for the periods presented as their effect would have beenantidilutive (in thousands):
Year Ended December 31,
2007 2006 2005
Options to purchase common stock and common stock subject torepurchase . . . . . . . . . . . . . . . . . . . . . . . . . . . . . . . . . . . . . . . . . . . . 393 3,810 5,222
Redeemable convertible preferred stock (as converted basis) . . . . . . . . . 18,929 44,288 44,288
Recent Accounting Pronouncements
In September 2006, the FASB issued SFAS 157, Fair Value Measurement, which provides guidancefor using fair value to measure assets and liabilities. In addition, SFAS 157 also provides guidance forexpanded information about the extent to which companies measure assets and liabilities at fair value,the information used to measure fair value and the effect of fair value measurements on earnings.SFAS 157 applies whenever other standards require (or permit) assets or liabilities to be measured atfair value, but does not expand the use of fair value in any new circumstances. The provisions ofSFAS 157 will be effective for the Company beginning January 1, 2008, except for the provisions related
73

STARENT NETWORKS, CORP.
NOTES TO CONSOLIDATED FINANCIAL STATEMENTS (Continued)
2. Summary of Significant Accounting Policies (Continued)
to the valuation of nonfinancial assets and liabilities which will be adopted on January 1, 2009 inaccordance with FSP 157-2, Partial Deferral of the Effective Date of Statement 157. The Company is inthe process of determining the effect, if any, the adoption of SFAS 157 will have on its consolidatedfinancial statements.
In February 2007, the FASB issued SFAS 159, The Fair Value Option for Financial Assets andFinancial Liabilities, Including an Amendment of FASB Statement No. 115. SFAS 159 allows entities tomeasure many financial instruments and certain other assets and liabilities at fair value on aninstrument-by-instrument basis (the fair value option). The fair value option represents a step in theevolution of financial reporting because it considerably expands the ability of entities to select themeasurement attribute for certain assets and liabilities. The Company will be required to adopt theprovisions of SFAS 159 on January 1, 2008. The Company is in the process of determining the effect, ifany, the adoption of SFAS 159 will have on its consolidated financial statements.
In December 2007, the FASB released SFAS 141 (revised 2007), Business Combinations. Thisstatement will significantly change the accounting for business combinations in a number of areasincluding the treatment of contingent consideration, contingencies, acquisition costs, in process researchand development and restructuring costs. In addition, under this statement, changes in deferred taxasset valuation allowances and acquired income tax uncertainties in a business combination after themeasurement period will impact income tax expense. This statement will be effective for the Companyon January 1, 2009 and will change the change its accounting treatment for business combinations on aprospective basis.
In December 2007, the FASB released SFAS 160, Noncontrolling Interests in Consolidated FinancialStatements—an amendment of ARB No. 51. This statement will change the accounting and reporting forminority interests, which will be recharacterized as noncontrolling interests and classified as acomponent of equity. This new consolidation method will significantly change the accounting fortransactions with minority interest holders. This statement will be effective for the Company onJanuary 1, 2009. The Company has not yet determined the impact, if any, of this statement on itsconsolidated financial statements.
3. Short-Term Investments
Short-term investments consist primarily of U.S. government agency and corporate bonds andcertificates of deposit. The Company manages its cash equivalents and short-term investments as asingle portfolio of highly marketable securities that is intended to be available to meet the Company’scurrent cash requirements.
For the years ended December 31, 2007 and 2006, net unrealized gains on short-term investmentsof $3,000 and $22,000, respectively, were recorded as an adjustment to accumulated othercomprehensive income.
74

STARENT NETWORKS, CORP.
NOTES TO CONSOLIDATED FINANCIAL STATEMENTS (Continued)
3. Short-Term Investments (Continued)
Short-term investments by security type at December 31, 2007 and 2006 were as follows (inthousands):
At December 31, 2007
Gross Gross EstimatedUnrealized Unrealized Fair
Cost Gains Losses Value
Corporate bonds . . . . . . . . . . . . . . . . . . . . . . . . . . . . . . . . $ 9,610 $2 $— $ 9,612
$ 9,610 $2 $— $ 9,612
At December 31, 2006
Gross Gross EstimatedUnrealized Unrealized Fair
Cost Gains Losses Value
Corporate bonds . . . . . . . . . . . . . . . . . . . . . . . . . . . . . . . . $27,480 $4 $(5) $27,479U.S. Government agency bonds . . . . . . . . . . . . . . . . . . . . . 4,465 1 — 4,466Certificates of deposit . . . . . . . . . . . . . . . . . . . . . . . . . . . . 4,200 — (1) 4,199
$36,145 $5 $(6) $36,144
As of December 31, 2007 and 2006, the Company’s short-term investments had an averagematurity of 58 days and 119 days, respectively.
4. Inventories
Inventories principally included the cost of raw materials, subassemblies, the cost of third-partycontract manufacturers and cost of sales deferred until such time as related revenue is recognized.Inventories consisted of the following (in thousands):
At December 31,
2007 2006
Raw materials . . . . . . . . . . . . . . . . . . . . . . . . . . . . . . . . . . . . . $ 4,632 $ 1,617Work in process . . . . . . . . . . . . . . . . . . . . . . . . . . . . . . . . . . . . 5,551 2,950Finished goods . . . . . . . . . . . . . . . . . . . . . . . . . . . . . . . . . . . . . 19,455 10,554
$29,638 $15,121
75

STARENT NETWORKS, CORP.
NOTES TO CONSOLIDATED FINANCIAL STATEMENTS (Continued)
5. Property and Equipment
Property and equipment, at cost, less accumulated depreciation and amortization, at December 31,2007 and 2006 were as follows (in thousands):
At December 31,
2007 2006
Equipment and software . . . . . . . . . . . . . . . . . . . . . . . . . . . . . $ 28,182 $15,473Furniture and fixtures . . . . . . . . . . . . . . . . . . . . . . . . . . . . . . . 888 758Leasehold improvements . . . . . . . . . . . . . . . . . . . . . . . . . . . . . 4,750 2,667Buildings . . . . . . . . . . . . . . . . . . . . . . . . . . . . . . . . . . . . . . . . 895 900Construction in progress . . . . . . . . . . . . . . . . . . . . . . . . . . . . . 1,958 314
36,673 20,112Less: accumulated depreciation and amortization . . . . . . . . . . . (16,221) (9,816)
$ 20,452 $10,296
Depreciation and amortization expense on property and equipment for the years endedDecember 31, 2007, 2006 and 2005 was $6.5 million, $3.2 million and $2.1 million, respectively.
6. Long-Term Debt
In June 2004, the Company financed the acquisition of certain software with $263,000 in newlong-term debt. The long-term debt had an interest rate of 3% and a maturity date of April 1, 2006. Asof December 31, 2005, the debt outstanding was $33,000. On April 1, 2006, the Company repaid thisdebt in accordance with the repayment schedules.
7. Income Taxes
Income (loss) before income tax expense consisted of the following (in thousands):
For the Year EndedDecember 31,
2007 2006 2005
Domestic . . . . . . . . . . . . . . . . . . . . . . . . . . . . . . . . . . . $11,427 $3,924 $1,312Foreign . . . . . . . . . . . . . . . . . . . . . . . . . . . . . . . . . . . . 1,455 131 105
$12,882 $4,055 $1,417
The provision for current income taxes consisted of the following (in thousands):
For the Year EndedDecember 31,
2007 2006 2005
Federal . . . . . . . . . . . . . . . . . . . . . . . . . . . . . . . . . . . . . . . . $ 590 $ — $294State . . . . . . . . . . . . . . . . . . . . . . . . . . . . . . . . . . . . . . . . . . 249 198 75Foreign . . . . . . . . . . . . . . . . . . . . . . . . . . . . . . . . . . . . . . . . 574 215 144
$1,413 $413 $513
76

STARENT NETWORKS, CORP.
NOTES TO CONSOLIDATED FINANCIAL STATEMENTS (Continued)
7. Income Taxes (Continued)
A reconciliation of the U.S. federal statutory rate to the Company’s effective tax rate is as follows:
For the Year EndedDecember 31,
2007 2006 2005
U.S. federal statutory rate . . . . . . . . . . . . . . . . . . . . . . . . . . . 34.0% 34.0% 34.0%State taxes . . . . . . . . . . . . . . . . . . . . . . . . . . . . . . . . . . . . . . 15.4 13.7 13.8Non-deductible share-based compensation and other
permanent differences . . . . . . . . . . . . . . . . . . . . . . . . . . . . 23.5 10.5 13.2Federal and state tax credits . . . . . . . . . . . . . . . . . . . . . . . . . (6.7) (11.8) (48.4)Change in valuation allowance . . . . . . . . . . . . . . . . . . . . . . . . (62.9) (40.6) 24.9Foreign rate differences . . . . . . . . . . . . . . . . . . . . . . . . . . . . 7.1 4.2 —Other . . . . . . . . . . . . . . . . . . . . . . . . . . . . . . . . . . . . . . . . . . 0.6 0.2 (1.3)
11.0% 10.2% 36.2%
The following is a summary of the significant components of the Company’s net deferred tax assetsas of December 31, 2007 and 2006 (in thousands):
At December 31,
2007 2006
Net operating loss carryforwards . . . . . . . . . . . . . . . . . . . . . . . $ 10,625 $ 25,041Deferred revenue . . . . . . . . . . . . . . . . . . . . . . . . . . . . . . . . . . 3,429 2,094Federal and state tax credits . . . . . . . . . . . . . . . . . . . . . . . . . . 4,804 3,412Compensation accruals . . . . . . . . . . . . . . . . . . . . . . . . . . . . . . 2,149 1,083Share-based compensation . . . . . . . . . . . . . . . . . . . . . . . . . . . 2,260 599Other temporary differences . . . . . . . . . . . . . . . . . . . . . . . . . . 1,873 559
25,140 32,788Valuation allowance . . . . . . . . . . . . . . . . . . . . . . . . . . . . . . . . (25,140) (32,788)
Net deferred tax assets . . . . . . . . . . . . . . . . . . . . . . . . . . . . . . $ — $ —
As of December 31, 2007, the Company had United States federal net operating loss carryforwardsfor income tax purposes of $27.6 million that expire beginning in 2023 and state net operating losscarryforwards of $28.0 million that expire beginning in 2008. As of December 31, 2007, the Companyhad United States federal tax credits of $4.4 million that expire beginning in 2020 and state tax creditsof $619,000 that expire beginning in 2018. The net operating loss carryforwards above do not include$6.2 million of excess stock deductions as of December 31, 2007. The Internal Revenue Code containsprovisions that may limit the net operating losses and tax credit carryforwards available to be used inany given year in the event of certain circumstances, including significant changes in ownershipinterests.
As a result of recognizing historical operating losses and uncertainties in future periods, theCompany has determined that it is more likely than not that its net deferred tax assets will not berealized and, accordingly, has maintained a full valuation allowance against its net deferred tax assets atDecember 31, 2007 and 2006. The amount of the deferred tax asset considered realizable is subject tochange based on future events, including generating significant operating income in future periods. The
77

STARENT NETWORKS, CORP.
NOTES TO CONSOLIDATED FINANCIAL STATEMENTS (Continued)
7. Income Taxes (Continued)
Company will continue to assess the need for the valuation allowance based on all available evidence.Therefore, it is possible that in a future period, facts and circumstances could support the reversal of asignificant portion or all of the valuation allowance. At that time, a tax benefit would be recorded inthe consolidated statements of operations.
On January 1, 2007, the Company adopted the provisions of FASB Interpretation No. 48,Accounting for Uncertainty in Income Taxes, an interpretation of SFAS 109 (‘‘FIN 48’’). The new standarddefines the threshold for recognizing the benefits of tax return positions in the financial statements as‘‘more-likely-than-not’’ to be sustained by the taxing authorities based solely on the technical merits ofthe position. If the recognition threshold is met, the tax benefit is measured and recognized as thelargest amount of tax benefit, in the Company’s judgment, which is greater than 50% likely to berealized. The Company did not recognize any change in its reserve for uncertain tax positions as aresult of the adoption of this standard. At the adoption date of January 1, 2007, the Company hadapproximately $134,000 of unrecognized tax benefits. A reconciliation of the beginning and endingamount of unrecognized tax benefits is as follows (in thousands).
Balance at January 1, 2007 . . . . . . . . . . . . . . . . . . . . . . . . . . . . . . . . . . . . . . $134Additions for tax positions of prior years . . . . . . . . . . . . . . . . . . . . . . . . . . . 85Reductions for tax positions of prior years . . . . . . . . . . . . . . . . . . . . . . . . . . —
Balance at December 31, 2007 . . . . . . . . . . . . . . . . . . . . . . . . . . . . . . . . . . . $219
At December 31, 2007, the entire balance related to unrecognized tax benefits that would, ifrecognized, favorably affect the income tax rate. The positions related to the unrecognized tax benefitsabove are not currently under review by the taxing authorities and therefore, it is unlikely that thisbalance will decrease within 12 months.
The Company recognizes interest and penalties related to uncertain tax positions in income taxexpense. Upon adoption and at December 31, 2007, the Company had an immaterial amount ofaccrued interest and penalties associated with its uncertain tax positions.
The Company has accumulated significant losses from its inception in August 2000. Since the netoperating losses may potentially be utilized in future years to reduce taxable income, all of theCompany’s tax years remain open to examination by the major taxing jurisdictions to which it is subject.
At December 31, 2007, the Company had net operating loss carryforwards and research anddevelopment credit carryforwards, as described above, that expire at various times beginning in 2020.Utilization of these carryforwards may be subject to a substantial annual limitation due to theownership change limitations that may have previously occurred or that could occur in the future, asprovided by Section 382 of the Internal Revenue Code of 1986, as well as similar state provisions. Anysuch ownership changes may limit the amount of the carryforwards that can be utilized annually tolower tax expense in future periods.
78

STARENT NETWORKS, CORP.
NOTES TO CONSOLIDATED FINANCIAL STATEMENTS (Continued)
8. Redeemable Convertible Preferred Stock
As of December 31, 2007, there were no shares of redeemable convertible preferred stock issued.The following table summarizes the redeemable convertible preferred stock authorized and issued as ofDecember 31, 2006 (in thousands, except share data):
AggregateShares Shares Net Liquidation
Date of Issuance Authorized Issued Proceeds Preference
Series A . . . . . . . . . . . . . . . . . Aug 2000 11,277,777 11,277,777 $10,100 $15,307Series B . . . . . . . . . . . . . . . . . . Jul 2001 11,768,968 11,768,968 22,000 31,591Series C . . . . . . . . . . . . . . . . . . Nov 2002 - Jan 2003 19,658,120 19,658,120 22,900 30,491Series D . . . . . . . . . . . . . . . . . Feb 2004 15,746,120 15,746,120 25,000 32,750Series E . . . . . . . . . . . . . . . . . . May - Sep 2005 6,136,876 6,136,876 18,000 20,131
On May 12, 2005, the Company amended its certificate of incorporation to increase the authorizedshares of common and redeemable convertible preferred stock to 120,000,000 and 63,565,049,respectively. The Company also designated 5,114,064 shares as Series E preferred stock and authorizedthe sale and issuance, pursuant to the terms and conditions of the Series E Preferred Stock PurchaseAgreement dated May 12, 2005, of 5,114,064 shares of its Series E redeemable convertible preferredstock, $.01 par value per share (the ‘‘Series E preferred stock’’) for a purchase price of $2.933088 pershare (the ‘‘Series E Purchase Price’’). In connection with the Series E Stock Purchase Agreement, theCompany received $15,000,000 upon issuance of 5,114,064 shares of the Series E preferred stock at theSeries E Purchase Price.
On September 15, 2005, the Company amended its certificate of incorporation to increase theauthorized shares of redeemable convertible preferred stock to 64,587,861 and also designated anadditional 1,022,812 shares as Series E preferred stock and authorized the sale and issuance, pursuantto the terms and conditions of Amendment No.1 to the Series E Preferred Stock Purchase Agreementdated September 16, 2005, of 1,022,812 shares of its Series E redeemable convertible preferred stock,$.01 par value per share, at the Series E Purchase Price. In connection with this amendment, theCompany received $2,999,998 upon the issuance of 1,022,812 shares of the Series E redeemablepreferred stock at the Series E Purchase Price.
79

STARENT NETWORKS, CORP.
NOTES TO CONSOLIDATED FINANCIAL STATEMENTS (Continued)
8. Redeemable Convertible Preferred Stock (Continued)
The changes in redeemable convertible preferred stock for the years ended December 31, 2007,2006 and 2005 were as follows (in thousands):
Series A Series B Series C Series D Series E Total
Balance at December 31, 2004 . . . . $ 13,683 $ 28,071 $ 26,811 $ 28,478 $ — $ 97,043Issuance of additional shares, net of
issuance costs . . . . . . . . . . . . . . . — — — — 17,890 17,890Accretion of redeemable convertible
preferred stock . . . . . . . . . . . . . . 812 1,760 1,840 2,136 801 7,349
Balance at December 31, 2005 . . . . 14,495 29,831 28,651 30,614 18,691 122,282Accretion of redeemable convertible
preferred stock . . . . . . . . . . . . . . 812 1,760 1,840 2,136 1,440 7,988
Balance at December 31, 2006 . . . . 15,307 31,591 30,491 32,750 20,131 130,270Accretion of redeemable convertible
preferred stock . . . . . . . . . . . . . . 350 759 794 921 621 3,445Conversion of preferred stock . . . . . (15,657) (32,350) (31,285) (33,671) (20,752) (133,715)
Balance at December 31, 2007 . . . . $ — $ — $ — $ — $ — $ —
In connection with the Company’s initial public offering, all outstanding shares of the Company’sredeemable convertible preferred stock automatically converted into an aggregate of 44,287,985 sharesof the Company’s common stock.
The holders of the Series A, Series B, Series C, Series D and Series E preferred stock (collectively,the ‘‘preferred stock’’) had the following rights and preferences:
Dividends
The holders of the Series B preferred stock, Series C preferred stock, Series D preferred stock andSeries E preferred stock were entitled to receive dividends, when and if declared by the Board ofDirectors. Dividends were cumulative and payable before any dividends on common stock and accruedfor redemption purposes whether or not earned or declared by the Board of Directors at a rate of 8%of the purchase price per share per annum.
Conversion
The preferred stock was convertible at the option of the holder, at any time, into common stock bymultiplying the number of shares of the preferred stock by the original purchase price per share andthen dividing by the conversion price, which is the original purchase price, unless adjusted. Due to theissuance of Series C preferred stock at a price lower than the price at which the Series B preferredstock was issued, the Series B preferred stock conversion price was $2.4241308 per share. As ofDecember 31, 2006, each share of Series A, Series C, Series D and Series E preferred stock wasconvertible into approximately 0.67 shares of common stock, and in the case of Series B preferredstock, into approximately 0.77 shares of common stock.
The Series A, Series B, Series C, Series D and Series E preferred stock was automaticallyconvertible into shares of common stock upon the closing of an initial public offering of the Company’s
80

STARENT NETWORKS, CORP.
NOTES TO CONSOLIDATED FINANCIAL STATEMENTS (Continued)
8. Redeemable Convertible Preferred Stock (Continued)
common stock at an offering price of not less than $8.81 per share and yielding aggregate grossproceeds to the Company of at least $10.0 million or written notice from the holders of at least 75% ofthe then outstanding shares of Series A preferred stock and at least a majority of the then outstandingshares of Series B, Series C, Series D and Series E preferred stock, respectively.
Voting
The holders of the preferred stock were entitled to the number of votes equal to the number ofshares of common stock into which they were convertible. The preferred stockholders voted togetherwith the common stockholders as a single class on all actions to be taken by the stockholders of theCompany.
The holders of the Series A preferred stock, voting as a separate class, were entitled to elect twodirectors to the Board, so long as at least 2,500,000 shares of Series A preferred stock wereoutstanding. The holders of Series B preferred stock, exclusively and as a separate class, were entitledto elect one director to the Board, so long as at least 1,150,000 shares of Series B preferred stock areoutstanding.
Liquidation
In the event of any voluntary or involuntary liquidation, dissolution or winding-up of the Company,the holders of the preferred stock were entitled to be paid an amount equal to the original purchaseprice per share plus an amount equal to all dividends declared for Series A preferred stock andaccrued for Series B, Series C, Series D and Series E preferred stock but unpaid thereon. If the assetsof the Company were insufficient to satisfy the full liquidation preference of the preferred stockholders,the assets were to be distributed ratably among the preferred shareholders in proportion to theiraggregate liquidation preference amounts. The Series A preferred stockholders did not have anypreferential rights if the aggregate value of the consideration to be distributed was more than$75 million. The Series B and Series C preferred stockholders did not have any preferential rights ifthe aggregate value of the consideration to be distributed was more than $195 million. The Series Epreferred stockholders did not have any preferential rights if the aggregate value of the considerationto be distributed was more than $275 million.
In addition, immediately after the holders of the preferred stock would have been paid theirliquidation preference in full, the remaining net assets of the Company available for distribution wouldhave been distributed ratably among all stockholders, including the holders of preferred stock on anas-converted basis.
Mandatory Redemption
If requested prior to the redemption dates specified below by holders of a majority of the thenoutstanding preferred stock, the Company would have been required to redeem such Series A,Series B, Series C, Series D and Series E preferred stock at $0.90, $1.64, $1.17, $1.69 and $2.93 per
81

STARENT NETWORKS, CORP.
NOTES TO CONSOLIDATED FINANCIAL STATEMENTS (Continued)
8. Redeemable Convertible Preferred Stock (Continued)
share, respectively, as adjusted in the event of future dilution, plus all declared but unpaid dividendsand an amount equal to 8% per annum from the date of issuance, as follows:
Percentage of Sharesof Preferred Stock to
Mandatory Redemption Date Be Redeemed
September 1, 2007 . . . . . . . . . . . . . . . . . . . . . . . . . . . . . . . . 33.33%September 1, 2008 . . . . . . . . . . . . . . . . . . . . . . . . . . . . . . . . 50.00%September 1, 2009 . . . . . . . . . . . . . . . . . . . . . . . . . . . . . . . . All shares then held
As the redemption feature was due to events beyond the control of the Company, the preferredstock was classified outside of the equity section of the balance sheet in accordance with ASR 268Presentation in Financial Statements of Redeemable Preferred Stocks.
9. Stockholders’ Equity (Deficit)
In June 2007, the Company completed an initial public offering of its common stock in which itsold and issued 10,580,226 shares of its common stock, including 1,580,226 shares pursuant to theunderwriters’ full exercise of their option to purchase additional shares at a price of $12.00 per share.The offering raised a total of $127.0 million in gross proceeds and $116.0 million in net proceeds afterdeducting underwriting discounts and commissions of $8.9 million and other offering expenses ofapproximately $2.1 million.
In November 2007, the Company completed a public offering of its common stock in which it soldand issued 3,880,000 shares of its common stock at a price of $24.00 per share. The offering raised atotal of $93.1 million in gross proceeds and $88.1 million in net proceeds after deducting underwritingdiscounts and commissions of $4.4 million and other offering expenses of approximately $500,000.
Reverse Stock Split
On April 26, 2007, the board of directors of the Company approved, and on April 30, 2007, thestockholders of the Company approved, a 2-for-3 reverse stock split of the Company’s common stock,which was effective on May 1, 2007. All share data shown in the accompanying consolidated financialstatements and related notes have been retroactively revised to reflect the reverse stock split.
10. Stock Incentive Plans
The Company adopted the 2000 Stock Incentive Plan (the ‘‘2000 Plan’’) for founders, employees,officers, directors and consultants. The 2000 Plan, which is administered by the Board of Directors,permits the Company to sell or award restricted common stock or to grant incentive and nonqualifiedstock options for the purchase of common stock, up to a maximum of 18,483,470 shares. Stock optionvesting typically occurs over four years and is at the discretion of the Board of Directors. Optionsgranted typically have a maximum term of ten years. After the effective date of the 2007 StockIncentive Plan (the ‘‘2007 Plan’’), no further awards may be granted under the 2000 Plan but anyoutstanding awards under the 2000 Plan will remain in effect. Any shares of common stock reserved forissuance under the 2000 Plan that remain available for issuance and any shares of common stocksubject to awards under the 2000 Plan that expire, terminate, or are otherwise surrendered, cancelled,
82

STARENT NETWORKS, CORP.
NOTES TO CONSOLIDATED FINANCIAL STATEMENTS (Continued)
10. Stock Incentive Plans (Continued)
forfeited or repurchased by the Company will be added to the number of shares available under the2007 Plan up to a specified number of shares.
The Company adopted the 2007 Plan for employees, officers, directors and consultants onApril 26, 2007 and the 2007 Plan became effective on June 5, 2007. The 2007 Plan, which isadministered by the Compensation Committee of the Board of Directors, permits the Company to sellor award restricted common stock or to grant incentive or nonqualified stock options for the purchaseof common stock, up to a maximum of 3,578,981 shares, which includes 70,601 shares forfeited thatrelated to grants or awards under the 2000 Plan. Stock option vesting typically occurs over four yearsand is at the discretion of the Board of Directors. Options granted typically have a maximum term often years. The 2007 Plan also allows for an annual increase in the number of shares available forissuance on the first day of each calendar year beginning in 2009 and ending on the second day of2017. The annual increase shall be equal to the lesser of 3,000,000 shares, 5% of the aggregate numberof shares of common stock outstanding on the first day of the calendar year or an amount determinedby the Company’s Board of Directors. As of December 31, 2007, 2,815,858 shares were available forfuture issuance under the 2007 Plan.
Restricted Common Stock
Unvested restricted shares may not be sold, transferred or assigned and are subject to forfeiture inthe event the employee ceases to be an employee of the Company. The price paid for restrictedcommon stock is considered a deposit or a prepayment that the Company has recognized as a liabilityto the extent the shares are subject to repurchase. Furthermore, the shares purchased by founders andemployees are not considered issued for accounting purposes until they are no longer subject torepurchase. The restriction generally lapses 25% upon the first anniversary of grant and 6.25%quarterly thereafter. As the restriction lapses, the liability associated with the restricted shares isreclassified to stockholders’ equity. The following table summarizes restricted common stock activity forthe year ended December 31, 2007 (in thousands, except per share amounts):
Shares Refundable Weighted-AverageSubject to Exercise Grant Date
Repurchase Price ($) Fair Value($)
Non-vested at December 31, 2006 . . . . . . . . 171 $ 707 $4.14Sale . . . . . . . . . . . . . . . . . . . . . . . . . . . . 464 347 7.22Vested . . . . . . . . . . . . . . . . . . . . . . . . . . (78) (271) 0.18
Non-vested at December 31, 2007 . . . . . . . . 557 $ 783 $5.99
Nonemployee Awards
At various times during 2000 to 2007, the Company issued equity instruments to nonemployees,including restricted common stock and nonqualified stock options. In accordance with EITF 96-18,Accounting for Equity Instruments that are Issued to Other than Employees for Acquiring, or inConjunction with Selling, Goods or Services, the Company measures and records the value of the sharesover the period of time services are provided. The Company recorded compensation expense related tostock options issued to nonemployees of $2.0 million, $320,000 and $254,000 for 2007, 2006 and 2005,respectively.
83

STARENT NETWORKS, CORP.
NOTES TO CONSOLIDATED FINANCIAL STATEMENTS (Continued)
10. Stock Incentive Plans (Continued)
Stock Options
The following table summarizes stock option activity for the year ended December 31, 2007,including nonqualified options issued to nonemployees (in thousands, except per share data):
AggregateWeighted-Average Intrinsic
Shares Exercise Price Value
Outstanding at December 31, 2006 . . . . . . . . . . . . . . . . . . . . . . . . 7,897 $ 1.42Granted . . . . . . . . . . . . . . . . . . . . . . . . . . . . . . . . . . . . . . . . . 3,156 10.40Exercised . . . . . . . . . . . . . . . . . . . . . . . . . . . . . . . . . . . . . . . . (1,970) 0.77Cancelled . . . . . . . . . . . . . . . . . . . . . . . . . . . . . . . . . . . . . . . . (477) 4.98
Outstanding at December 31, 2007 . . . . . . . . . . . . . . . . . . . . . . . . 8,606 $ 4.66 $118,895
Exercisable at December 31, 2007 . . . . . . . . . . . . . . . . . . . . . . . . 3,074 $ 1.51 $ 51,581
Vested and expected to vest at December 31, 2007 . . . . . . . . . . . . 8,442 $ 4.64 $116,841
The aggregate intrinsic value was calculated as the difference between the exercise price of thestock options and the fair value of the underlying common stock as of the balance sheet date. Theaggregate intrinsic value of options exercised for the years ended December 31, 2007, 2006 and 2005was $16.4 million, $1.1 million and $169,000, respectively.
The weighted-average fair value per share for options granted during the years endedDecember 31, 2007, 2006 and 2005 was $6.52, $2.09 and $1.62, respectively. The ranges of exerciseprices of options outstanding and exercisable at December 31, 2007 were as follows (in thousands,except contractual life data):
Weighted- Weighted-Average Average
Remaining RemainingOptions Contractual Options Contractual
Exercise Price Outstanding Life (in Years) Exercisable Life (in Years)
$ 0.05 - 1.50 . . . . . . . . . . . . . . . . . . . . . . . . . . . . 1,211 5.7 1,0031.65 . . . . . . . . . . . . . . . . . . . . . . . . . . . . . . . . 3,772 8.1 1,6191.82 - 5.87 . . . . . . . . . . . . . . . . . . . . . . . . . . . . 1,618 8.6 4428.25 - 12.00 . . . . . . . . . . . . . . . . . . . . . . . . . . . 1,321 9.3 —
16.55 - 21.23 . . . . . . . . . . . . . . . . . . . . . . . . . . . 506 9.3 —22.87 . . . . . . . . . . . . . . . . . . . . . . . . . . . . . . . . 95 9.8 —30.24 . . . . . . . . . . . . . . . . . . . . . . . . . . . . . . . . 83 9.8 10
8,606 8.2 3,074 7.2
Vested and expected to vest . . . . . . . . . . . . . . . . . 8,442 8.2
Reserved Common Stock
In connection with the initial public offering, the Company increased the number of authorizedshares of common stock to 250,000,000. The shares reserved for future issuance at December 31, 2007consisted of 11.4 million shares reserved for issuance under the 2007 stock incentive plan.
84

STARENT NETWORKS, CORP.
NOTES TO CONSOLIDATED FINANCIAL STATEMENTS (Continued)
11. Commitments and Contingencies
Commitments
The Company leases facilities under operating leases and/or subleases that expire on various datesthrough 2013. These commitments cover facilities in several locations in the United States andindividual facilities in India, China, Brazil, Canada and Japan. The Company recorded total rentexpense for the years ended December 31, 2007, 2006 and 2005 of $2.4 million, $1.8 million and$1.4 million, respectively.
At December 31, 2007, the future minimum lease payments under non-cancelable operating leasesare as follows (in thousands):
Year ending December 312008 . . . . . . . . . . . . . . . . . . . . . . . . . . . . . . . . . . . . . . . . . . . . . . . . . . . $2,4482009 . . . . . . . . . . . . . . . . . . . . . . . . . . . . . . . . . . . . . . . . . . . . . . . . . . . 1,9472010 . . . . . . . . . . . . . . . . . . . . . . . . . . . . . . . . . . . . . . . . . . . . . . . . . . . 1,6422011 . . . . . . . . . . . . . . . . . . . . . . . . . . . . . . . . . . . . . . . . . . . . . . . . . . . 6882012 . . . . . . . . . . . . . . . . . . . . . . . . . . . . . . . . . . . . . . . . . . . . . . . . . . . 318Thereafter . . . . . . . . . . . . . . . . . . . . . . . . . . . . . . . . . . . . . . . . . . . . . . . 13
Total lease payments . . . . . . . . . . . . . . . . . . . . . . . . . . . . . . . . . . . . . $7,056
The Company has issued standby letters of credit for $409,000 to its landlords. These letters ofcredit are collateralized by deposits in money market funds and certificates of deposit and are includedin restricted cash in the accompanying consolidated balance sheets. Certain of the Company’s facilityleases include rent escalation clauses. The Company normalizes rent expense on a straight-line basisover the term of the lease for known changes in lease payments over the life of the lease.
The Company has committed to purchase certain parts used in the manufacture of its productstotaling $1.1 million through December 31, 2008. These parts will be received on a scheduled quarterlybasis unless the requirements for these parts exceed the scheduled amounts, in which case, receipt maybe accelerated.
Contingencies
The Company has identified the guarantees described below as requiring disclosure in accordancewith FIN 45, Guarantor’s Accounting and Disclosure Requirements for Guarantees, Including IndirectGuarantees of Indebtedness of Others an interpretation of FASB Statements No. 5, 57, and 107 andrescission of FASB Interpretation No. 34. The Company evaluates estimated losses for guarantees underSFAS 5, Accounting for Contingencies. The Company considers such factors as the degree of probabilityof an unfavorable outcome and the ability to make a reasonable estimate of the amount of loss.
The Company enters into standard indemnification agreements in the ordinary course of business.Pursuant to these agreements, the Company agrees to indemnify, hold harmless, and reimburse theindemnified party for losses suffered or incurred by the indemnified party, generally the Company’sbusiness partners or customers, in connection with the Company’s provision of its services andproducts. Generally, these obligations are limited to claims relating to infringement of a U.S. patent, orany copyright or other intellectual property or the Company’s negligence, willful misconduct orviolation of the law (provided that there is not gross negligence or willful misconduct on the part of theother party). Subject to applicable statutes of limitation, the term of these indemnification agreements
85

STARENT NETWORKS, CORP.
NOTES TO CONSOLIDATED FINANCIAL STATEMENTS (Continued)
11. Commitments and Contingencies (Continued)
is generally perpetual from the time of execution of the agreement. The maximum potential amount offuture payments the Company could be required to make under these indemnification agreements isunlimited; however, the Company carries insurance that covers certain third party claims relating to itsservices and would limit the Company’s exposure.
The Company leases space in certain buildings, including a corporate headquarters building, underoperating leases. The Company has standard indemnification arrangements under those leases thatrequire it to indemnify the landlord against losses, liabilities, and claims incurred in connection with thepremises covered by the Company leases, its use of the premises, property damage or personal injury,and breach of the lease agreement, as well as occurrences arising from the Company’s negligence orwillful misconduct. Subject to applicable statutes of limitation, the term of these indemnificationagreements is generally perpetual from the time of execution of the agreement. The maximum potentialamount of future payments the Company could be required to make under these indemnificationagreements is unlimited. There are no claims pending as of December 31, 2007 related to theseindemnification agreements.
The Company licenses technology to certain third parties under license agreements that providefor the Company to indemnify the third parties against claims of patent and copyright infringement.This indemnity does not apply in the case where the licensed technology has been modified by the thirdparty or combined with other technology, hardware, or data that that the Company has not approved.Subject to applicable statutes of limitation, the term of these indemnification agreements is generallyperpetual from the time of execution of the agreement. The maximum potential amount of futurepayments the Company could be required to make under these indemnification agreements isunlimited; however, the Company has not accrued any amounts as of December 31, 2007.
The Company licenses technology from third parties under agreements that contain standardindemnification provisions that require the Company to indemnify the third party against losses,liabilities and claims arising from the Company’s unauthorized use or modification of the licensedtechnology. Subject to applicable statutes of limitation, the term of these indemnification agreements isgenerally perpetual from the time of execution of the agreement. The maximum potential amount offuture payments the Company could be required to make under these indemnification agreements isunlimited. There are no claims pending as of December 31, 2007 with respect to these indemnificationagreements.
Litigation
The Company is presently defending two patent infringement lawsuits brought against it byUTStarcom, Inc. In February 2005, UTStarcom filed a complaint against the Company in the UnitedStates District Court for the Northern District of California seeking unspecified damages and injunctiverelief. The complaint alleges infringement by the Company of UTStarcom’s U.S. Patent No. 6,829,473,entitled ‘‘Roaming and Hand-Off Support for Prepaid Billing for Wireless Data Networks,’’ which theCompany refers to as the ‘473 patent. In May 2005, the Company answered the complaint, denied theinfringement allegations contained in the complaint, and filed counterclaims against UTStarcom seekinga declaratory judgment that the Company did not infringe the ‘473 patent and that the ‘473 patent wasinvalid and unenforceable. In July 2005, the Company filed an amended answer and counterclaims tothe ‘473 patent complaint. In December 2006, UTStarcom filed a reissue patent application relating tothe ‘473 patent. In January 2007, by agreement of the parties, the District Court stayed the case
86

STARENT NETWORKS, CORP.
NOTES TO CONSOLIDATED FINANCIAL STATEMENTS (Continued)
11. Commitments and Contingencies (Continued)
pending the outcome of UTStarcom’s reissue application relating to the ‘473 patent. In June 2007, theCompany filed a request for inter partes re-examination of all claims of the ‘473 patent with the UnitedStates Patent and Trademark Office on sixteen different grounds. In August 2007, the Patent andTrademark Office granted the Company’s request for inter partes reexamination of all claims on allsixteen grounds. In November 2007, the Patent and Trademark Office merged the reissue andre-examination proceedings. A first office action has not yet issued. The Company believes that it hasmeritorious defenses against any resulting reissued patent, and the Company is prepared to vigorouslydefend the ‘473 patent case through trial.
In May 2007, UTStarcom filed an additional complaint against the Company and a number of itsemployees and former employees in the United States District Court for the Northern District ofIllinois alleging violations of the Illinois trade secrets act, infringement of five patents assigned toUTStarcom, intentional interference with UTStarcom’s business relations and declarations of ownershiprelating to one of the Company’s patents and three of its patent applications. The complaint containsallegations, among others, that a number of former employees of a business unit UTStarcom acquired,who subsequently worked for the Company, took UTStarcom’s trade secrets with them and improperlyused those trade secrets to develop, manufacture and market the Company’s 3G wireless products, andthat such products incorporate various UTStarcom confidential technical information, includingUTStarcom’s proprietary virtual private network and EV-DO features. UTStarcom further alleges thatthe Company has disclosed UTStarcom’s trade secrets in one of its patents and three of its patentapplications, and that this patent and these patent applications legally belong to UTStarcom based onthe inventors’ previous work at the business unit acquired by UTStarcom. In August 2007, theCompany and the current and former employee defendants filed their answers to the complaint. TheCompany also filed counterclaims for tortious interference with prospective economic advantage,malicious prosecution, a declaration that the patents-in-suit are invalid and not infringed, and adeclaration that one of the patents-in-suit is unenforceable due to inequitable conduct. In December2007, UTStarcom filed an amendment to the complaint, which added new claims for declaration ofownership of four more of the Company’s patent applications, copyright infringement, breach ofrestrictive covenants against the employee and former employee defendants, and aiding and abettingthe employee and former employee defendants’ breaches of the duty of loyalty and the employmentagreements. The amendment to the complaint also added another employee as a defendant. OnJanuary 4, 2008, the Company filed a motion to dismiss, or in the alternative for a more definitestatement regarding, the trade secret, copyright, breaches of restrictive covenants, and aiding andabetting claims of the amendment to the complaint. UTStarcom filed its opposition to this motion onJanuary 22, 2008, and the Company filed its reply on January 29, 2008. The Court is expected to ruleon this motion in April 2008. Discovery is proceeding. No trial date has been set. In this lawsuit,UTStarcom seeks unspecified monetary damages, punitive damages, injunctive relief, declarations ofownership relating to the specified patent and patent applications owned by the Company, findings ofmisappropriation of trade secrets, patent infringement and copyright infringement, costs and attorneysfees. The Company believes it has meritorious defenses to each of UTStarcom’s claims in this lawsuitand it is prepared to vigorously defend the lawsuit.
In addition, the Company is subject to other legal proceedings, claims and litigation arising in theordinary course of business. Defending lawsuits requires significant management attention and financialresources and the outcome of any litigation, including the matters described above, is inherentlyuncertain. The Company does not, however, currently expect that the ultimate costs to resolve pending
87

STARENT NETWORKS, CORP.
NOTES TO CONSOLIDATED FINANCIAL STATEMENTS (Continued)
11. Commitments and Contingencies (Continued)
matters will have a material adverse effect on its consolidated financial position, results of operationsor cash flows.
12. Business Segments
SFAS 131, Disclosures About Segments of an Enterprise and Related Information, establishesstandards for reporting information about operating segments in annual financial statements andrequires selected information of segments be presented in financial reports issued to stockholders.Operating segments are defined as components of an enterprise about which separate financialinformation is available and that is evaluated regularly by the chief operating decision maker, ordecision making group, in determining how to allocate resources and assess performance. TheCompany’s chief operating decision maker, as defined under SFAS 131, is the chief executive officer.The Company views its operations and manages its business as one operating segment.
Revenue by geography is based on the billing address of the customer. The following tables setforth revenue and long-lived assets by geographic area (in thousands).
Revenue
For the Year Ended December 31,
2007 2006 2005
United States and Canada . . . . . . . . . . . . . . . . . . . . $110,137 $81,687 $28,691Japan . . . . . . . . . . . . . . . . . . . . . . . . . . . . . . . . . . . 19,395 4,227 18,718Korea . . . . . . . . . . . . . . . . . . . . . . . . . . . . . . . . . . . 13,171 662 11,731Rest of world . . . . . . . . . . . . . . . . . . . . . . . . . . . . . 3,094 7,774 520
Total . . . . . . . . . . . . . . . . . . . . . . . . . . . . . . . . . . $145,797 $94,350 $59,660
Long-lived Assets
At December 31,
2007 2006
United States . . . . . . . . . . . . . . . . . . . . . . . . . . . . . . . . . . . . . . $15,614 $ 7,853India . . . . . . . . . . . . . . . . . . . . . . . . . . . . . . . . . . . . . . . . . . . . 4,676 2,231Rest of world . . . . . . . . . . . . . . . . . . . . . . . . . . . . . . . . . . . . . . 162 212
Total . . . . . . . . . . . . . . . . . . . . . . . . . . . . . . . . . . . . . . . . . . $20,452 $10,296
13. Related Party Transactions
An affiliate of one of the Company’s distribution partners is an investor in the Company withownership interests aggregating approximately 1% as of December 31, 2007. The affiliate of a seconddistribution partner was previously an investor in the Company but has no ownership interests as ofDecember 31, 2007. The shares were issued in 2002 and 2004 at fair value. For the years endedDecember 31, 2007, 2006 and 2005, these two distribution partners accounted for 22%, 5% and 49% ofthe Company’s revenues, respectively. At December 31, 2007 and 2006, the Company had outstandingaccounts receivable from these distribution partners of $6.3 million and $709,000, respectively, and forthe years ended December 31, 2007 and 2006 had recorded reimbursements to research anddevelopment expense from funded development projects performed for these distribution partners of$1.9 million and $2.0 million, respectively.
88

Item 9. Changes in and Disagreements with Accountants on Accounting and Financial Disclosure
None.
Item 9A. Controls and Procedures
Our management, with the participation of our chief executive officer and chief financial officer,evaluated the effectiveness of our disclosure controls and procedures as of December 31, 2007. Theterm ‘‘disclosure controls and procedures,’’ as defined in Rules 13a-15(e) and 15d-15(e) under theExchange Act, means controls and other procedures of a company that are designed to ensure thatinformation required to be disclosed by a company in the reports that it files or submits under theExchange Act is recorded, processed, summarized and reported, within the time periods specified in theSEC’s rules and forms. Disclosure controls and procedures include, without limitation, controls andprocedures designed to ensure that information required to be disclosed by a company in the reportsthat it files or submits under the Exchange Act is accumulated and communicated to the company’smanagement, including its principal executive and principal financial officers, as appropriate to allowtimely decisions regarding required disclosure. Management recognizes that any controls andprocedures, no matter how well designed and operated, can provide only reasonable assurance ofachieving their objectives and management necessarily applies its judgment in evaluating thecost-benefit relationship of possible controls and procedures. Based on the evaluation of our disclosurecontrols and procedures as of December 31, 2007, our chief executive officer and chief financial officerconcluded that, as of such date, our disclosure controls and procedures were effective at the reasonableassurance level.
No change in our internal control over financial reporting (as defined in Rules 13a-15(f) and15d-15(f) under the Exchange Act) occurred during the fiscal quarter ended December 31, 2007 thathas materially affected, or is reasonably likely to materially affect, our internal control over financialreporting.
Item 9B. Other Information
None.
89

PART III.
Item 10. Directors, Executive Officers and Corporate Governance
Information required by this item relating to our directors and nominees is contained in our 2008proxy statement under the caption ‘‘Proposal 1—Election of Directors’’ and is incorporated herein byreference. Information required by this item relating to our executive officers is contained in our 2008proxy statement and is incorporated herein by reference. Information required by this item relating tocompliance with Section 16(a) of the Securities Exchange Act of 1934 is contained in our 2008 proxystatement under the caption ‘‘Section 16(a) Beneficial Ownership Reporting Compliance’’ and isincorporated herein by reference.
We have adopted a written code of business conduct and ethics that applies to our principalexecutive officer, principal financial officer, principal accounting officer or controller, or personsperforming similar functions and have posted it in the Investors—Corporate Governance section of ourwebsite which is located at www.starentnetworks.com. We intend to satisfy any disclosure requirementunder Item 5.05 of Form 8-K regarding any amendments to, or waivers from, our code of businessconduct and ethics by posting such information on our website which is located atwww.starentnetworks.com.
Information required by this item relating to the audit committee of our Board of Directors iscontained in our 2008 proxy statement under the caption ‘‘Corporate Governance—Board of DirectorsMeetings and Committees—Audit Committee’’ and is incorporated herein by reference.
Item 11. Executive Compensation
Information required by this item is contained in our 2008 proxy statement under the captions‘‘Corporate Governance—Directors’ Compensation’’ and ‘‘Information About Executive Compensation’’and is incorporated herein by reference.
Item 12. Security Ownership of Certain Beneficial Owners and Management and Related StockholderMatters
Information required by this item relating to security ownership of certain beneficial owners andmanagement is contained in our 2008 proxy statement under the caption ‘‘Security Ownership ofCertain Beneficial Owners and Management’’ and is incorporated herein by reference. Informationrequired by this item relating to securities authorized for issuance under equity compensation plans iscontained in our 2008 proxy statement under the caption ‘‘Information About ExecutiveCompensation—Securities Authorized for Issuance Under Equity Compensation Plans’’ and isincorporated herein by reference.
Item 13. Certain Relationships and Related Transactions, and Director Independence
Information required by this item relating to transactions with related persons is contained in our2008 proxy statement under the caption ‘‘Corporate Governance—Certain Relationships and RelatedTransactions’’ and is incorporated herein by reference. Information required by this item relating todirector independence is contained in our 2008 proxy statement under the caption ‘‘CorporateGovernance—Determination of Independence’’ and is incorporated herein by reference.
Item 14. Principal Accountant Fees and Services
Information required by this item is contained in our 2008 proxy statement under the caption‘‘Corporate Governance—Independent Registered Public Accounting Firm Fees and Other Matters’’and is incorporated herein by reference.
90

PART IV.
Item 15. Exhibits and Financial Statement Schedules
The following in an index of the exhibits included in this report:
Exhibit No. Description
3.1(1) Restated Certificate of Incorporation of the Registrant
3.2(1) Amended and Restated Bylaws of the Registrant
4.1(2) Specimen Certificate evidencing shares of common stock
10.1(2) 2000 Stock Incentive Plan
10.2(2) Forms of Stock Option Agreements under the 2000 Stock Incentive Plan
10.3(2) Forms of Restricted Stock Agreements under the 2000 Stock incentive Plan
10.4(2) 2007 Stock Incentive Plan
10.5(2) Form of Incentive Stock Option Agreement under the 2007 Stock Incentive Plan
10.6(2) Form of Non-Qualified Stock Option Agreement under the 2007 Stock Incentive Plan
10.7(3) Form of Non-Employee Director Nonstatutory Stock Option Agreement under the 2007Stock Incentive Plan (Initial Grant)
10.8(3) Form of Non-Employee Director Nonstatutory Stock Option Agreement under the 2007Stock Incentive Plan (Annual Grant)
10.9(2) Fourth Amended and Restated Investor Rights Agreement, dated May 19, 2005, amongthe Registrant and the parties listed therein
10.10(2) Lease Agreement, dated as of October 24, 2000, as amended, between the Registrant andNorth Tewksbury Commons, L.L.C.
10.11(2) Sublease Agreement, dated as of March 29, 2002, as amended, between the Registrant andNetwork Appliance, Inc.
10.12(2) Form of Director and Executive Officer Indemnification Agreement
10.13(2) Letter Agreement, dated as of January 17, 2007, between the Registrant and Paul J.Milbury
10.14(2) Restricted Stock Agreement, dated as of February 8, 2007, between the Registrant andPaul J. Milbury
10.15(2) Incentive Stock Option Agreement, dated as of February 8, 2007, between the Registrantand Paul J. Milbury
10.16+(2) General Purchase Agreement, dated as of December 2, 2003, as amended, between theRegistrant and CELLCO PARTNERSHIP (doing business as Verizon Wireless)
21.1 Subsidiaries of Registrant
23.1 Consent of PricewaterhouseCoopers LLP
91

Exhibit No. Description
31.1 Certification of Chief Executive Officer, pursuant to Securities Exchange ActRules 13a-14(a) and 15d-14(a), as adopted pursuant to Section 302 of the Sarbanes-OxleyAct of 2002.
31.2 Certification of Chief Financial Officer, pursuant to Securities Exchange ActRules 13a-14(a) and 15d-14(a), as adopted pursuant to Section 302 of the Sarbanes-OxleyAct of 2002.
32.1 Certification of Chief Executive Officer and Chief Financial Officer pursuant to 18 U.S.C.Section 1350, as adopted pursuant to Section 906 of the Sarbanes-Oxley Act of 2002.
(1) Incorporated by reference to the Registrant’s Registration Statement on Form S-1, as amended(Reg. 333-146717).
(2) Incorporated by reference to the Registrant’s Registration Statement on Form S-1, as amended(Reg. 333-141092).
(3) Incorporated by reference to the Registrant’s Quarterly Report on Form 10-Q filed with theCommission on August 9, 2007.
+ Confidential treatment obtained as to certain portions, which portions have been omitted and filedseparately with the Securities and Exchange Commission.
92

SIGNATURES
Pursuant to the requirements of the Securities Exchange Act of 1934, the registrant has dulycaused this report to be signed on its behalf by the undersigned thereunto duly authorized.
STARENT NETWORKS, CORP.(Registrant)
Date: February 29, 2008 By: /s/ ASHRAF M. DAHOD
Ashraf M. DahodPresident and Chief Executive Officer
Pursuant to the requirements of the Securities Act of 1934, this report has been signed below bythe following persons in the capacities and dates indicated.
Signature Title Date
President and Chief Executive Officer;/s/ ASHRAF M. DAHODDirector (Principal Executive February 29, 2008
Ashraf M. Dahod Officer)
Vice President, Operations and Chief/s/ PAUL J. MILBURYFinancial Officer (Principal Financial February 29, 2008
Paul J. Milbury Officer)
Vice President, Finance and Corporate/s/ GEORGE W. HALEController (Principal Accounting February 29, 2008
George W. Hale Officer)
/s/ EDWARD T. ANDERSONDirector February 29, 2008
Edward T. Anderson
/s/ TIMOTHY A. BARROWSDirector February 29, 2008
Timothy A. Barrows
/s/ SEAN M. DALTONDirector February 29, 2008
Sean M. Dalton
/s/ MATTHEW J. DESCHDirector February 29, 2008
Matthew J. Desch
/s/ JAMES A. DOLCE, JR.Director February 29, 2008
James A. Dolce, Jr.
/s/ KENNETH A. GOLDMANDirector February 29, 2008
Kenneth A. Goldman
93

(This page has been left blank intentionally.)

Exhibit 21.1
Subsidiary Jurisdiction of Incorporation
Starent do Brasil Ltda. Brazil
Starent International, Corp. Delaware
Starent Networks Beijing Co., Ltd. China
Starent Networks Canada Limited Canada
Starent Networks (India) Pvt. Ltd. India
Starent Networks Japan, K.K. Japan
Starent Networks Securities Corp. Massachusetts
Starent Networks Spain, S.L. Spain
Starent Networks (UK) Ltd. United Kingdom

Exhibit 23.1
CONSENT OF INDEPENDENT REGISTERED PUBLIC ACCOUNTING FIRM
We hereby consent to the incorporation by reference in the Registration Statement on Form S-8(No. 333-143540) of Starent Networks, Corp. of our report dated February 29, 2008 relating to thefinancial statements, which appears in this Form 10-K.
/s/ PricewaterhouseCoopers LLP
Boston, MassachusettsFebruary 29, 2008

Exhibit 31.1
CERTIFICATION OF CHIEF EXECUTIVE OFFICER PURSUANT TOSECURITIES EXCHANGE ACT RULES 13a-14(a) AND 15d-14(a), AS ADOPTED PURSUANT TO
SECTION 302 OF THE SARBANES-OXLEY ACT OF 2002
I, Ashraf M. Dahod, certify that:
1. I have reviewed this Annual Report on Form 10-K of Starent Networks, Corp.;
2. Based on my knowledge, this report does not contain any untrue statement of a material factor omit to state a material fact necessary to make the statements made, in light of thecircumstances under which such statements were made, not misleading with respect to theperiod covered by this report;
3. Based on my knowledge, the financial statements, and other financial information included inthis report, fairly present in all material respects the financial condition, results of operationsand cash flows of the registrant as of, and for, the periods presented in this report;
4. The registrant’s other certifying officer and I are responsible for establishing and maintainingdisclosure controls and procedures (as defined in Exchange Act Rules 13a-15(e) and15d-15(e)) for the registrant and have:
(a) Designed such disclosure controls and procedures, or caused such disclosure controls andprocedures to be designed under our supervision, to ensure that material informationrelating to the registrant, including its consolidated subsidiaries, is made known to us byothers within those entities, particularly during the period in which this report is beingprepared;
(b) Evaluated the effectiveness of the registrant’s disclosure controls and procedures andpresented in this report our conclusions about the effectiveness of the disclosure controlsand procedures, as of the end of the period covered by this report based on suchevaluation; and
(c) Disclosed in this report any change in the registrant’s internal control over financialreporting that occurred during the registrant’s most recent fiscal quarter (the registrant’sfourth fiscal quarter in the case of an annual report) that has materially affected, or isreasonably likely to materially affect, the registrant’s internal control over financialreporting; and
5. The registrant’s other certifying officer and I have disclosed, based on our most recentevaluation of internal control over financial reporting, to the registrant’s auditors and theaudit committee of the registrant’s board of directors (or persons performing the equivalentfunctions):
(a) All significant deficiencies and material weaknesses in the design or operation of internalcontrol over financial reporting which are reasonably likely to adversely affect theregistrant’s ability to record, process, summarize and report financial information; and
(b) Any fraud, whether or not material, that involves management or other employees whohave a significant role in the registrant’s internal control over financial reporting.
Date: February 29, 2008 /s/ ASHRAF M. DAHOD
Ashraf M. DahodPresident and Chief Executive Officer

Exhibit 31.2
CERTIFICATION OF CHIEF FINANCIAL OFFICER PURSUANT TOSECURITIES EXCHANGE ACT RULES 13a-14(a) AND 15d-14(a), AS ADOPTED PURSUANT TO
SECTION 302 OF THE SARBANES-OXLEY ACT OF 2002
I, Paul J. Milbury, certify that:
1. I have reviewed this Annual Report on Form 10-K of Starent Networks, Corp.;
2. Based on my knowledge, this report does not contain any untrue statement of a material factor omit to state a material fact necessary to make the statements made, in light of thecircumstances under which such statements were made, not misleading with respect to theperiod covered by this report;
3. Based on my knowledge, the financial statements, and other financial information included inthis report, fairly present in all material respects the financial condition, results of operationsand cash flows of the registrant as of, and for, the periods presented in this report;
4. The registrant’s other certifying officer and I are responsible for establishing and maintainingdisclosure controls and procedures (as defined in Exchange Act Rules 13a-15(e) and15d-15(e)) for the registrant and have:
(a) Designed such disclosure controls and procedures, or caused such disclosure controls andprocedures to be designed under our supervision, to ensure that material informationrelating to the registrant, including its consolidated subsidiaries, is made known to us byothers within those entities, particularly during the period in which this report is beingprepared;
(b) Evaluated the effectiveness of the registrant’s disclosure controls and procedures andpresented in this report our conclusions about the effectiveness of the disclosure controlsand procedures, as of the end of the period covered by this report based on suchevaluation; and
(c) Disclosed in this report any change in the registrant’s internal control over financialreporting that occurred during the registrant’s most recent fiscal quarter (the registrant’sfourth fiscal quarter in the case of an annual report) that has materially affected, or isreasonably likely to materially affect, the registrant’s internal control over financialreporting; and
5. The registrant’s other certifying officer and I have disclosed, based on our most recentevaluation of internal control over financial reporting, to the registrant’s auditors and theaudit committee of the registrant’s board of directors (or persons performing the equivalentfunctions):
(a) All significant deficiencies and material weaknesses in the design or operation of internalcontrol over financial reporting which are reasonably likely to adversely affect theregistrant’s ability to record, process, summarize and report financial information; and
(b) Any fraud, whether or not material, that involves management or other employees whohave a significant role in the registrant’s internal control over financial reporting.
Date: February 29, 2008 /s/ PAUL J. MILBURY
Paul J. MilburyVice President, Operations and
Chief Financial Officer

Exhibit 32.1
CERTIFICATION OF CHIEF EXECUTIVE OFFICER ANDCHIEF FINANCIAL OFFICER PURSUANT TO
18 U.S.C. SECTION 1350, AS ADOPTED PURSUANT TOSECTION 906 OF THE SARBANES-OXLEY ACT OF 2002
Each of Ashraf M. Dahod and Paul J. Milbury hereby certifies, pursuant to 18 U.S.C.Section 1350, as adopted pursuant to Section 906 of the Sarbanes-Oxley Act of 2002, in his capacity asPresident and Chief Executive Officer and Vice President, Operations and Chief Financial Officer,respectively of Starent Networks, Corp. (the ‘‘Company’’), that, to his knowledge, the Annual Report ofthe Company on Form 10-K for the year ended December 31, 2007 as filed with the Securities andExchange Commission (the ‘‘Report’’) fully complies with the requirements of Section 13(a) or 15(d) ofthe Securities Exchange Act of 1934 and that the information contained in the Report fairly presents,in all material respects, the financial condition and results of operations of the Company.
Date: February 29, 2008 By: /s/ ASHRAF M. DAHOD
Ashraf M. DahodPresident and Chief Executive Officer
Date: February 29, 2008 By: /s/ PAUL J. MILBURY
Paul J. MilburyVice President, Operations and
Chief Financial Officer

Performance Graph
The following graph compares the cumulative total stockholder return on our common stock with the cumulative total return on The NASDAQ Composite Index and The NASDAQ Telecommunications Index for the period beginning June 6, 2007, the date our common stock commenced trading on the Nasdaq Global Market, and ending on the last day of our last completed fiscal year.
COMPARISON OF CUMULATIVE TOTAL RETURN (1)(2)(3)
Among Starent Networks, Corp., The NASDAQ Composite Index and The NASDAQ Telecommunications Index
(capitalization weighted)
$0
$20
$40
$60
$80
$100
$120
$140
$160
$180
$200
6/6/2007 6/30/2007 7/31/2007 8/31/2007 9/30/2007 10/31/2007 11/30/2007 12/31/2007
Starent Networks, Corp. NASDAQ Composite Index
NASDAQ Telecommunications Index
Company / Index Name
Base Period June 6,
2007 June 30,
2007 July 31,
2007 August 31,
2007 September
30, 2007 October 31, 2007
November 30, 2007
December 31, 2007
Starent Networks, Corp. $100.00 $104.93 $129.34 $148.25 $150.68 $176.87 $149.18 $130.26 NASDAQ Composite Index $100.00 $99.95 $97.78 $99.42 $104.14 $109.99 $102.17 $101.60 NASDAQ Telecommunications Index $100.00 $103.45 $103.39 $107.88 $113.49 $113.77 $99.98 $97.58 (1) Graph assumes $100 invested on June 6, 2007 (the date our common stock commenced trading on the Nasdaq
Global Market) in our common stock, The NASDAQ Composite Index and The Nasdaq Telecommunications Index (capitalization weighted).
(2) Total return assumes reinvestment of dividends.
(3) Year ended December 31.

STARENT NETWORKS
IS AT THE CENTER OF
THIS COMMUNICATIONS
REVOLUTION PLAYING
A PIVOTAL ROLE IN
MAKING THE INTERNET
TRULY MOBILE.
MANAGEMENT TEAM
Ashraf M. Dahod
Chairman, President
and Chief Executive Offi cer
Pierre G. Kahhale
Vice President of Worldwide Field Operations
Vijay Kathuria
Vice President
and General Manager, India
Robert J. Kelly
Vice President of Manufacturing Operations
Thierry Maupilé
Vice President of Global Marketing
and Business Development
Paul J. Milbury
Vice President of Operations
and Chief Financial Offi cer
Kevin F. Newman
Vice President and General Counsel
Anthony P. Schoener
Vice President of Engineering
Gennady H. Sirota
Vice President of Product Management
BOARD OF DIRECTORS
Ashraf M. Dahod
Chairman, President
and Chief Executive Offi cer
Edward T. Anderson
Managing Partner
North Bridge Venture Partners
Timothy A. Barrows
Matrix Partners
Sean M. Dalton
Managing General Partner
Highland Capital Partners
Matthew J. Desch
Chief Executive Offi cer
Iridium Satellite LLC
James A. Dolce, Jr.
Chief Executive Offi cer
VeriVue, Inc.
Kenneth A. Goldman
Chief Financial Offi cer
Fortinet, Inc.
ANNUAL MEETING
Starent Networks will conduct its
annual meeting of stockholders
on Thursday, May 22, 2008, 10:00 AM
at Wilmer Cutler Pickering Hale and
Dorr, 60 State Street, Boston, MA 02109
LEGAL COUNSEL
Wilmer Cutler Pickering Hale and Dorr
60 State Street
Boston, MA 02109
INDEPENDENT ACCOUNTANTS
PricewaterhouseCoopers LLP
125 High Street
Boston, MA 02110
COMMON STOCK DATA
Listed: NASDAQ Global Market
Symbol: STAR
TR ANSFER AGENT AND REGISTR AR
Computershare
250 Royall Street
Canton, MA 02021
DIVIDENDS
Starent Networks has never paid or
declared cash dividends on its Common
Stock and does not expect to pay any
cash dividends on its Common Stock
in the foreseeable future.
INVESTOR RELATIONS
For additional copies of this report or
other fi nancial information, contact:
Starent Networks, Corp.
Investor Relations
30 International Place
Tewksbury, MA 01876
+1 978 863 3743
Other fi nancial information is available
on the Starent Networks website at
www.starentnetworks.com
This annual report, including the enclosed
Letter to Shareholders, contains, in addition
to historical information, forward-looking
statements within the meaning of Section
27A of the Securities Act of 1933 and Section
21E of the Securities Exchange Act of 1934.
These forward-looking statements are based
on our current expectations, assumptions,
estimates and projections regarding our
business and industry, and we do not
undertake an obligation to update our
forward-looking statements to refl ect future
events or circumstances. We may, in some
cases, use words such as project, believe,
anticipate, plan, expect, estimate, intend,
continue, should, would, could, potentially,
will, may or similar words and expressions
that convey uncertainty of future events
or outcomes to identify these forward-
looking statements. The outcome of the
events described in these forward-looking
statements is subject to known and unknown
risks, uncertainties and other factors,
including the factors set forth in Item 1A Risk
Factors in the Annual Report on Form 10-K
included in this annual report, that could
cause actual results to differ materially from
the results anticipated by these forward-
looking statements. You should read these
factors and the risks described in other
documents that we fi le from time to time
with the Securities and Exchange Commission
in conjunction with the audited consolidated
fi nancial statements and related notes
included elsewhere in this annual report.
DES
IGN
: M
ON
DER
ER D
ESIG
N
”
“
Managing Partner
EXPANDING THE BOUNDARIES OF MOBILE COMMUNICATIONS
2007 Annual Report
STA
REN
T N
ETW
OR
KS
2007 An
nual Report
CORPOR ATE HEADQUARTERS
30 International Place
Tewksbury, MA 01876
+1 978 851 1100
+1 978 640 6825 Fax
MASSACHUSETTS OFFICES
Operations Facility200 Ames Pond Drive, Suite 104
Tewksbury, MA 01876
+1 978 851 1100
+1 978 640 6825 Fax
243 Main Street, 2nd Floor
Buzzards Bay, MA 02532
+1 508 743 0382
+1 508 743 0687 Fax
ILLINOIS OFFICE
1101 Perimeter Drive, Suite 875
Schaumburg, IL 60173
+1 847 330 0900
+1 847 995 1975 Fax
K ANSAS OFFICE
9393 West 110th Street
51 Corporate Woods, Suite 500
Overland Park, KS 66210
+1 913 451 6700
+1 913 451 6750 Fax
WASHINGTON OFFICE
Bear Creek Business Center
18300 NE Union Hill Road, Suite 210
Redmond, WA 98052
+1 425 882 6935
+1 425 882 1860 Fax
VIRGINIA OFFICE
11951 Freedom Drive, 13th Floor
Reston, VA 20190
+1 703 251 4400
+1 703 251 4733 Fax
BR AZIL OFFICE
Starent Do Brasil LTDA
Av. Cidade Jarim, 400
7 andar
Cep. 01454-902
Sao Paulo
Brazil
+55 11 3818 0976
+55 11 3818 0977 Fax
CANADA OFFICE
Starent Networks Canada Limited
The Airway Centre
5925 Airport Road, Suite 200
Mississauga Ontario L4V 1W1
Canada
+1 905 405 6248
+1 905 672 8630 Fax
CHINA OFFICE
Unit 5 Level 3, Tower E1
The Towers, Oriental Plaza
No.1 East Chang An Avenue
Dong Cheng District
Beijing, 100738
China
+86 10 85180050
+86 10 85188155 Fax
EMEA OFFICE
16th Floor, Portland House
Stag Place
London, SW1E 5RS
United Kingdom
+44 (0) 20 7869 8025
+44 (0) 20 7869 8225 Fax
KOREA OFFICE
1907 Suite Dossise VIT 2
Seocho-dong, Seocho-gu
Seoul 137-070
Korea
+82 2 3471 3074
+82 2 3473 6825 Fax
INDIA OFFICES
Starent Networks (India) Pvt. Ltd.
P-17, Phase I, Rajiv Gandhi Infotech Park
Hinjewadi
Pune 411057
India
+91 20 22930100
+91 20 22934723 Fax
5th Floor, Surya Chambers
124, Airport Road, Murugeshpalya
Bangalore-560 017
India
+91 080 40109400
+91 080 41256200 Fax
JAPAN OFFICE
1-12-32 22F Ark Mori Building
Akasaka, Minato-ku
Tokyo, 107-6022
Japan
+81 3 55498660
+81 3 55498661 Fax
Starent®, ST16 ® and ST40TM are trademarks
of Starent Networks, Corp. All other
trademarks, service marks, registered
trademarks, or registered service marks may
be the property of their respective owners.
Copyright © 2008 Starent Networks, Corp.
All rights reserved. Printed in the U.S.A.


