Star network analysis of sequence based identified ... · An alternating sequence indicates a walk...
9
http://www.TurkJBiochem.com ISSN 1303–829X (electronic) 0250–4685 (printed) 78 Star network analysis of sequence based identified Yarrowia lipolytica strains [Sekans temelli tanılanan Yarrowia lipolytica suşlarının yıldız ağ analizi] Research Article [Araştırma Makalesi] Yayın tarihi 30 Mart, 2014 © TurkJBiochem.com [Published online 30 March, 2014] Onur Akpınar 1 , Emir Haliki 2 , Füsun Bahriye Uçar 1 , Alev Haliki Uztan 1 Ege Üniversitesi, Fen Fakültesi, 1 Biyoloji Bölümü, Temel Ve Endüstriyel Mikrobiyoloji Ana Bilim Dalı, 2 Fizik Bölümü, İzmir, Türkiye Yazışma Adresi [Correspondence Address] Onur Akpınar Ege Üniversitesi Fen Fakültesi Biyoloji Bölümü Temel Ve Endüstriyel Mikrobiyoloji AD, Bornova Tel. +90 232 311 17 99 E-mail. [email protected] Registered: 2 April 2013; Accepted: 4 September 2013 [Kayıt Tarihi: 2 Nisan 2013; Kabul Tarihi: 4 Eylül 2013] ABSTRACT Aim: The objectives of this study are, first, to investigate a star network analysis of phylogenetic trees of identified Y. lipolytica strains with or without one out-group, and secondly, to show the redundancy of the out-groups in phylogenetic tree. Material and Methods: In this study we used 22 Yarrowia lipolytica strains which were identified with sequencing of D1/D2 domain of 26S rDNA region, two phylogenetic trees were reconstructed by the neighbor joining method including an out-group or not. The star- like weighted network analysis of these two phylogenetic trees was investigated. Results: The adjacency matrix formalism of our weighted phylogenetic network with the out- group looks like a directed star graph adjacency matrix. The lowest weight is the edge from the central node to Candida sake out-group (0.00008) corresponding to the narrowest edge. However, the edge going from central node to Yarrowia lipolytica TEM YL 19 has a weight of 0.0825 and the thickest structure. Conclusion: Thus network analysis show that phylogenetic relationship between close strain and subspecies can be confirmed and also the out-group in this phylogenetic tree is unnecessary due to the negligible change in the average weighted degree and its some statistical computations. Key Words: Phylogenetic tree, network analysis, star graph, average weighted degree, D1/ D2 domain. Conflict of Interest: The authors have declared that no conflict of interest exists. ÖZET Amaç: Bu çalışmanın amaçları, öncelikle dış-grup içeren ve içermeyen tanısı yapılmış Y. lipolytica suşlarının filogenetik ağaçlarının yıldız ağ analizidir. İkinci olarak filogenetik ağaçlardaki out-grupların önemsizliğinin gösterilmesidir. Materyal ve metotlar: Bu çalışmada 26S rDNA bölgesinin D1/D2 domainlerinin sekanslanmasıyla tanılanmış olan 22 Yarrowia lipolytica suşları kullanılmış ve dış-grup içeren ve içermeyen iki filogenetik ağaç neighbor joining yöntemi ile oluşturulmuştur. Bu iki filogenetik ağacın ağırlıklandırılmış yıldız ağ analizi incelenmiştir. Bulgular: Dış-grup içeren ağırlıklandırılmış filogenetik ağımızın bitişiklik matris ifadesi yönelimli bir yıldız şekilli bitişiklik matrisi ifadesine benzemektedir. En küçük ağırlık en ince hatta karşılık gelen, merkezi düğümden Candida sake dış-grubuna gelen hattır (0.00008). Bununla birlikte, merkezi düğümden Yarrowia lipolytica TEM YL 19 düğümüne giden hattın ağırlığı 0.0825 olup en kalın yapıyı teşkil eder. Sonuç: Ağ analizi, yakın suşlar ve alt türler arasındaki filogenetik ilişki doğrulanmıştır ve bu filogenetik ağaçlardaki dış-grup, ağırlıklandırılmış ortalama derecesinde göz ardı edilebilir değişiklikten ve bu nicelik üzerinden yapılan bazı istatistiksel hesaplamalardan dolayı gerekli değildir. Anahtar Kelimeler: Filogenetik ağaç, ağ analizi, yıldız diyagramı, ortalama ağırlıklandırılmış derece, D1/D2 domain. Çıkar Çatışması: Hiçbir çıkar çatışmamız olmadığını bildiririz. doi: 10.5505/tjb.2014.75768 Türk Biyokimya Dergisi [Turkish Journal of Biochemistry–Turk J Biochem] 2014; 39 (1) ; 78–86
Transcript of Star network analysis of sequence based identified ... · An alternating sequence indicates a walk...

http://www.TurkJBiochem.com ISSN 1303–829X (electronic) 0250–4685 (printed) 78
Star network analysis of sequence based identified Yarrowia lipolytica strains
[Sekans temelli tanılanan Yarrowia lipolytica suşlarının yıldız ağ analizi]
Research Article [Araştırma Makalesi] Yayın tarihi 30 Mart, 2014 © TurkJBiochem.com
[Published online 30 March, 2014]
TÜR
K BİY
OKİMYA DERNEĞİ DER
GİSİTÜ
RK
BİY
OKİMYA DERNEĞİ DER
GİSİ
1976
TÜR
K BİY
OKİMYA DERNEĞİ DER
GİSİTÜ
RK
BİY
O
KİMYA DERNEĞ
İ DER
GİSİ
1976
ORJİNAL
1. ÖRNEK 2. ÖRNEK
Onur Akpınar1, Emir Haliki2, Füsun Bahriye Uçar1, Alev Haliki Uztan1
Ege Üniversitesi, Fen Fakültesi, 1Biyoloji Bölümü, Temel Ve Endüstriyel Mikrobiyoloji Ana Bilim Dalı, 2Fizik Bölümü, İzmir, Türkiye
Yazışma Adresi[Correspondence Address]
Onur Akpınar
Ege Üniversitesi Fen Fakültesi Biyoloji Bölümü Temel Ve Endüstriyel Mikrobiyoloji AD, BornovaTel. +90 232 311 17 99E-mail. [email protected]
Registered: 2 April 2013; Accepted: 4 September 2013
[Kayıt Tarihi: 2 Nisan 2013; Kabul Tarihi: 4 Eylül 2013]
ABSTRACTAim: The objectives of this study are, first, to investigate a star network analysis of phylogenetic trees of identified Y. lipolytica strains with or without one out-group, and secondly, to show the redundancy of the out-groups in phylogenetic tree.Material and Methods: In this study we used 22 Yarrowia lipolytica strains which were identified with sequencing of D1/D2 domain of 26S rDNA region, two phylogenetic trees were reconstructed by the neighbor joining method including an out-group or not. The star-like weighted network analysis of these two phylogenetic trees was investigated.Results: The adjacency matrix formalism of our weighted phylogenetic network with the out-group looks like a directed star graph adjacency matrix. The lowest weight is the edge from the central node to Candida sake out-group (0.00008) corresponding to the narrowest edge. However, the edge going from central node to Yarrowia lipolytica TEM YL 19 has a weight of 0.0825 and the thickest structure.Conclusion: Thus network analysis show that phylogenetic relationship between close strain and subspecies can be confirmed and also the out-group in this phylogenetic tree is unnecessary due to the negligible change in the average weighted degree and its some statistical computations.Key Words: Phylogenetic tree, network analysis, star graph, average weighted degree, D1/D2 domain.Conflict of Interest: The authors have declared that no conflict of interest exists.
ÖZET Amaç: Bu çalışmanın amaçları, öncelikle dış-grup içeren ve içermeyen tanısı yapılmış Y. lipolytica suşlarının filogenetik ağaçlarının yıldız ağ analizidir. İkinci olarak filogenetik ağaçlardaki out-grupların önemsizliğinin gösterilmesidir.Materyal ve metotlar: Bu çalışmada 26S rDNA bölgesinin D1/D2 domainlerinin sekanslanmasıyla tanılanmış olan 22 Yarrowia lipolytica suşları kullanılmış ve dış-grup içeren ve içermeyen iki filogenetik ağaç neighbor joining yöntemi ile oluşturulmuştur. Bu iki filogenetik ağacın ağırlıklandırılmış yıldız ağ analizi incelenmiştir.Bulgular: Dış-grup içeren ağırlıklandırılmış filogenetik ağımızın bitişiklik matris ifadesi yönelimli bir yıldız şekilli bitişiklik matrisi ifadesine benzemektedir. En küçük ağırlık en ince hatta karşılık gelen, merkezi düğümden Candida sake dış-grubuna gelen hattır (0.00008). Bununla birlikte, merkezi düğümden Yarrowia lipolytica TEM YL 19 düğümüne giden hattın ağırlığı 0.0825 olup en kalın yapıyı teşkil eder.Sonuç: Ağ analizi, yakın suşlar ve alt türler arasındaki filogenetik ilişki doğrulanmıştır ve bu filogenetik ağaçlardaki dış-grup, ağırlıklandırılmış ortalama derecesinde göz ardı edilebilir değişiklikten ve bu nicelik üzerinden yapılan bazı istatistiksel hesaplamalardan dolayı gerekli değildir.Anahtar Kelimeler: Filogenetik ağaç, ağ analizi, yıldız diyagramı, ortalama ağırlıklandırılmış derece, D1/D2 domain.Çıkar Çatışması: Hiçbir çıkar çatışmamız olmadığını bildiririz.
doi: 10.5505/tjb.2014.75768Türk Biyokimya Dergisi [Turkish Journal of Biochemistry–Turk J Biochem] 2014; 39 (1) ; 78–86
Turk J Biochem, 2014; 39 (1) ; 78–86 Akpınar et al.79
Introduction
In phylogenetic studies, the similarities and differences in nucleotide sequences of single genes are determined and compared. Similarity is assumed to reflect common ancestry, whereas the degree of sequence divergence marks evolutionary distance. rDNA sequences are the most important characteristics used for identification, taxonomic, and phylogenetic studies. The advantages of the rDNAs are that they are present in all living organisms, have common evolutionary origin, occur in multiple copies, and have conserved and variable parts available both for delineating higher taxa and differentiating among strains belonging to a species. For taxonomic purpose and establishing phylogenetic relationships, two regions of rDNA are most commonly used, the partial and whole sequences of the 18S rDNA of the small ribosomal subunit and the D1/D2 sequences of all ascomycetous yeast species, and Fell et al. [1] published these sequences for all basidiomycetous yeasts. In two decades, sequencing has become the most reliable aid to identification of species. Complete and partial sequences of rRNA genes are most widely used in taxonomic studies and for establishing phylogenetic relations. Currently, the classification of yeasts is based on the analysis of rDNA sequences [2]. Following the legacy of Darwin’s Origin of Species [3], most current methods for phylogenetic reconstruction depict evolutionary history of organisms as a tree [4]. Phylogenetic tree data sets are biological complex data sets having natural representations as networks, providing a simple analysis of phylogenetic trees within the frame of some fundamental graph theory features. A network can be conceived as a set of items which are composed of vertices or nodes and which includes connections between them which are called arcs or edges. As it is well known a biological network is a network that applies to any biological systems, and provides mathematical analysis of connections found in evolutionary studies such as neural networks, metabolic networks and gene regulatory networks. Most biological networks display substantial non-trivial topological features adding them to the class of the complex networks [5]. On the other hand phylogenetic trees have a common usage in reconstructing the evolutionary past of species via molecular data composed of genomes. With this type of evolutionary tree, relationships between species may be approximated [6]. Our work includes a phylogenetic tree of Yarrowia clade and an out-group connected to a single central node. Equivalently, a star graph consists of a vertex designated center along with a set of leaves adjacent to it [7]. A comparative study of the Mycobacterial DNA promoter prediction using star-graph topological indices is originated from a prediction just like our phylogenetic tree topological features are obtained with
the in-house sequence to star networks [8]. Also in the manner of some epidemic spreading networks a more physical insight comes from the analysis of a star graph with one center connected to leaves [9]. Proteins can be transformed into a star graph, where the amino acids are the vertices (nodes), connected in a specific sequence by the peptide bonds (central node) [10, 11]. In our work, each of the branches of the star contains the sequences related to different species and the star center which is the central node is a non-species vertex. In our previous work, twenty two Yarrowia lipolytica strains were identified with sequencing of D1/D2 domain of 26S rDNA region. The phylogenetic tree was reconstructed by the neighbor joining method between twenty two Yarrowia lipolytica strains, Y. lipolytica CBS6124 reference strain and Candida sake KBP 3997 as the out-group [12]. The objectives of this study are, first, to investigate a star network analysis of phylogenetic trees of identified Y. lipolytica strains with or without one out-group, and secondly, to show the redundancy of the out-groups in phylogenetic tree.
Materials and Methods
Experimental sectionIn our former work, the D1/D2 domain of 26S rDNA region was amplified using the primers NL1 and NL4 and the partial DNA sequence of 26S rDNA region was examined using PCR primers described by Arias et al. [13]. Sequence comparisons were performed using the basic local alignment search tool (BLAST) program within the GenBank database. A strain was ascribed to the species showing the highest matched sequence identity. Neighbour joining tree method was used with Mega 5.05 software for phylogenetic trees which included or excluded Candida sake KBP 3997 as the out-group. Bootstrap values (expressed as percentages of 1000 replications) greater than 50% are shown at the branch points [12].
Definitions for network analysisSimilar to the notation in Huber and Moulton [6], a directed network is a finite directed graph with node and edge sets that are , . In the meaning of directed network edges point in one direction from one node to another node. Thus an edge goes from a node to another , and we call the tail of and the head of . If it is not a multigraph, no more than one edge between the same node pair is allowed which shows that there can only be one edge between the tail and head , denoted by
. Directed networks consist of nodes having two different degrees, the in-degree , which is the number of incoming edges, and the out-degree
, which is the number of outgoing edges. The
Turk J Biochem, 2014; 39 (1) ; 78–86 Akpınar et al.80
degree of is equal to . A node is a source if and sink if .
In a network representation of phylogenetic tree, strains are nodes and phylogenetic connections are edges.
An alternating sequence indicates a walk in such as , . Since phylogenetic trees can be counted as evolutionary directed networks they flow over time and there is a very low probability of genetically returning back to the ancestor (which is known as central node is a common sequence in phylogenetic tree and network), which is the former or tail node, in environmental conditions such as natural selection and adaptation.
Due to these circumstances the phylogenetic network is acyclic, , contains no cycles but sources and sinks. Besides that in an adjacency matrix formalism, in which the edges as may be transformed into , the diagonal of the matrix will be zero. The adjacency matrix formalism of such a
directed network:
(1)
where if there is an edge, 0 otherwise
Such biological networks show the small-world property which implies that the network has an average topological distance between the various nodes [14], at least accord the rule of six degrees of separation. However the small-world network which is sometimes sighted in cell biology seems not to be fitting exactly to network patterns of phylogenetic trees, because a phylogenetic tree, in the manner of topology, does not contain any closed triads required for those complex networks’ own specific clustering coefficient properties. Phylogenetic networks in our study topologically accord the star graph in the graph theory. A k-dimensional star graph is an edge and node symmetric graph in general [15]. Besides the star is the complete bipartite graph, a tree with one central node and k leaves having totally k+1 nodes. This structure is commonly found scale-free networks which is also a type of complex networks.
The inclusion of edge weights into the analysis of network properties allows a deeper insight into the modular structure of real-world webs. The most basic properties
of a node in a weighted network are its degree (number of neighbors), and its strength (sum of link weights) [16]. When a phylogenetic tree is identified as one of the real world webs, it should comply with the weighted network concept, because the sequence compatibility of the graph with the central node should give the connection strength.
In the meantime, since the phylogenetic network is based on the genetic sequence compatibility which adds weight to inter-species edges, it can also be considered as a weighted network, which constitutes the edge-weighted phylogenetic tree [17].
Therefore, due to the degree of this genetic sequence compatibility, our directed graph includes the path distances between the strain and the central node so as to exert a non- negative weight on each element of the edge set [18]. As the species get closer to the central node so the weight will be larger. In the manner of adjacency matrix every non-zero element equals to a positive real number proportional to their weight or distance as well.
Related to this empirical work, within the comparison of two weighted directed star networks like phylogenetic trees there are some basic parameters. The average degree of a directed network is the mean value of the number of both incoming and outgoing edges of nodes.
(2)
If we consider the contribution of the edge weights, the average weighted degree appears.
(3)
The average weighted degree can be considered as an expected value for the contributions of nodes on the weight in a given network. It also makes it possible to perform variance and standard deviation calculations. For our adjacency matrix, in terms of average weighted
(4)
And the standard deviation is σ.The maximum eccentricity of any node, by other means the distance of a node pair having maximum distance is

Turk J Biochem, 2014; 39 (1) ; 78–86 Akpınar et al.81
the network diameter. Graph density refers to the ratio of the number of edges to the possible maximum number of the edges in the network at a given time.
(5)
where is the number of edges.In the case of strongly connected components; each node within the component can be reached from every other node in the component by following directed links. In the case of weakly connected components; every node can be reached from every other node by following links in either direction. Star graph is a connected component itself having 1 weakly and strongly connected components. The characteristic path length of a network, also known as the geodesic average, is defined as the shortest path between two nodes.
(6)
Our phylogenetic weighted and directed networks were constructed and analyzed using Gephi 0.8.2 beta and NetworkX 1.7.
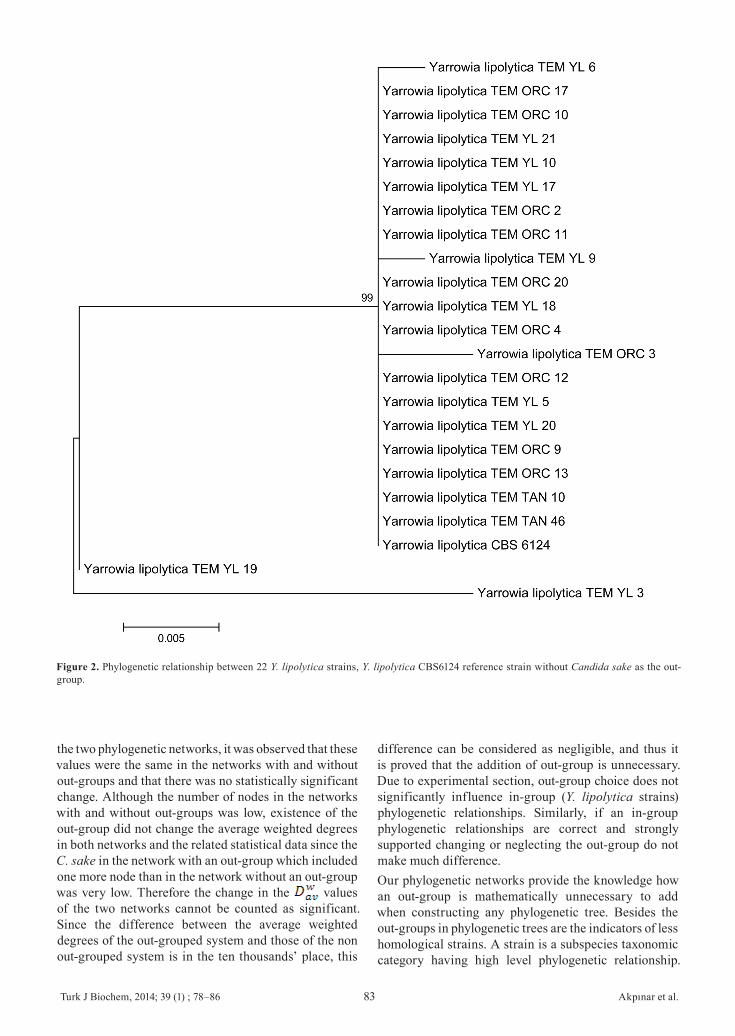
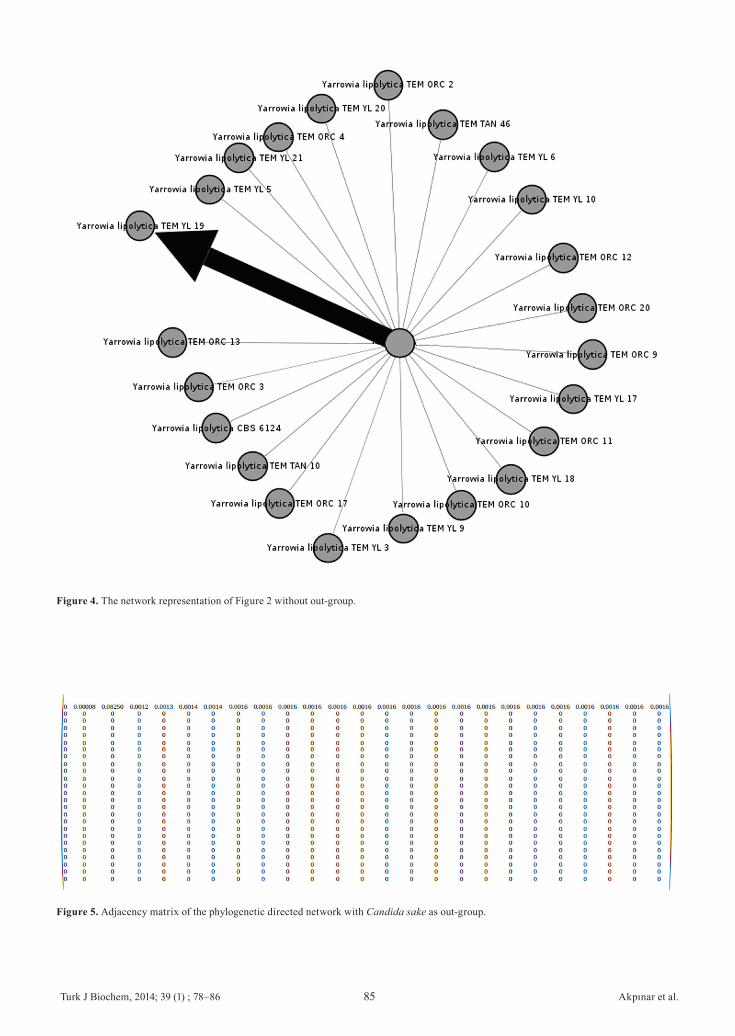
ResultsAs described in the experimental section, phylogenetic trees with or without Candida sake KBP 3997 as the out-group were drawn by using the sequence data obtained from the previous work. Figure 1 and 2 shows those phylogenetic relations. In Figure 1, Candida sake KBP3997 indicates an approximately 30% sequence difference from Y. lipolytica strains and Y. lipolytica reference strain. In Figure 2, high homology between Y. lipolytica strains and Y. lipolytica reference strain is in sight, although the phylogenetic tree does not contain Candida sake KBP3997 out-group.Returning to the network representation of two phylogenetic graphs arising from Figure 1 and Figure 2, the weighted networks are shown in Figure 3 and 4. Weights are included in the system due to the sequence compatibility, which means that the higher the number of the sequences of a node with high homology is, the greater the thickness of the edge between the central node and that node is. As seen from the phylogenetic trees there is a sequence compatibility scale with distances. Thus the weights are inverse proportional with that distance scale. In Figure 3 which includes the out-group, Y. lipolytica TEM YL 19 has the thickest edge because it has the highest homology with the central node. However the farthest C. sake KBP3997’s edge appears to be invisible. Other Yarrowia lipolytica strains and the reference strain have roughly the same edge thickness (weights). Their edges are thin related to the one that Y. lipolytica TEM YL 19 has, but visible. In
Figure 4, the network only contains Yarrowia lipolytica clades and resembles the overall topological structure in Figure 3 except the node Candida sake.The adjacency matrix formalism of our weighted phylogenetic network with the out-group, which looks like a directed star graph adjacency matrix, is shown in the Figure 5. In the first row the lowest weight is the edge from central node to Candida sake out-group (0.00008) corresponding to the narrowest edge in network in Figure 3. However, the edge going from central node to Yarrowia lipolytica TEM YL 19 has a weight of 0.0825 and thickest structure.In the comparison of two phylogenetic networks the network diameter, connected components, the average path length, variance and standard deviation of average weighted degree have the same results. Table 1 shows the comparison of two networks based on topological and statistical parameters described above. While the network with out-group has higher average degree, the one without the out-group has higher average weighted degree and graph density.
DiscussionPhylogenetic relationships are most commonly represented by rooted trees. The extant taxa correspond to leaves of the trees, while internal nodes correspond to ancestral species [19].Phylogenetic network representation can be considered to be useful. This is because different trees constructed from different datasets often contain parts that contradict each other and because many tree construction methods (e.g., bootstrapping) produce collections of trees rather than a single tree. Hence, development of reliable and efficient methods for constructing phylogenetic networks is crucial in the study of phylogenetics [20].After the construction of our two phylogenetic trees, star graphs are topologically obtained related to the central node. In a directed star graph or star network concept the network diameter, connected components and the average path length are always equal to 1 independent of the number of nodes. This is because the central node and its leaves make the diameter constant and leaves only connected to the central node, thus there is one connected component and average path length. Most of these measures like the diameter, the average path length, the graph density and connected components are same for any directed star-like graphs of a given size. Thus they can be count as trivial topological features of star-like networks. Additionally, the most common topological and statistical measures resulting are: diameter, edge weight variance, and average distance within the clusters or communities [21].However the other parameters show more significant quantities. The average degree is higher in the network with Candida sake out-group since any additional connected node increases the average

Turk J Biochem, 2014; 39 (1) ; 78–86 Akpınar et al.82
On the other hand, the average weighted degree indicates whether an out-group is necessary in phylogenetics or not. Our out-group Candida sake KBP3997 has a weight of 0.00008 which is a very low value because of very low sequence homology to the central node. While the central point of an average distribution is determined, it should be defined to what extent the variance values are important. The average weighted degree is the mean value of weight distribution in this phylogenetic tree. As a result of the variance and standard deviation calculations performed to determine each node’s weight contribution to the system through the average weighted degrees of
degree of the star graph or any network, regardless of the weight. Nevertheless the graph density behaves the opposite way. If there is an additional node, the graph density decreases. Therefore the network without an out-group has higher a graph density. Figure 5 shows the significant differences between these quantities of the networks. These quantities are the topological features present even in the absence of weights. However, the weighted structure which was created in order to add a biological meaning to the event indicates whether the out group is negligible or not when it is dealt with from the point of view of sequence homology.
Figure 1. The D1/D2 domain of 26S rDNA region sequence based phylogenetic analysis of Yarrowia lipolytica. Phylogenetic relationship between 22 Y. lipolytica strains, Y. lipolytica CBS6124 reference strain and Candida sake KBP3997 as the out-group.
Turk J Biochem, 2014; 39 (1) ; 78–86 Akpınar et al.83
the two phylogenetic networks, it was observed that these values were the same in the networks with and without out-groups and that there was no statistically significant change. Although the number of nodes in the networks with and without out-groups was low, existence of the out-group did not change the average weighted degrees in both networks and the related statistical data since the C. sake in the network with an out-group which included one more node than in the network without an out-group was very low. Therefore the change in the values of the two networks cannot be counted as significant. Since the difference between the average weighted degrees of the out-grouped system and those of the non out-grouped system is in the ten thousands’ place, this
difference can be considered as negligible, and thus it is proved that the addition of out-group is unnecessary. Due to experimental section, out-group choice does not significantly influence in-group (Y. lipolytica strains) phylogenetic relationships. Similarly, if an in-group phylogenetic relationships are correct and strongly supported changing or neglecting the out-group do not make much difference.Our phylogenetic networks provide the knowledge how an out-group is mathematically unnecessary to add when constructing any phylogenetic tree. Besides the out-groups in phylogenetic trees are the indicators of less homological strains. A strain is a subspecies taxonomic category having high level phylogenetic relationship.
Figure 2. Phylogenetic relationship between 22 Y. lipolytica strains, Y. lipolytica CBS6124 reference strain without Candida sake as the out-group.

Turk J Biochem, 2014; 39 (1) ; 78–86 Akpınar et al.84
Therefore, the phylogenetic relationship between close strains is mathematically confirmed using star graph analysis.
ConclusionAs a result the star network analysis in this work may be applied to the more complex phylogenetic trees including a great number of organisms and make contribution to the determination of the phylogenetic relationships between them.As is known, there are an extremely limited number of topological studies conducted on the network analysis of phylogenetic trees in the world. Therefore, it is
considered that this study will provide the basis for the researchers to work on the subject.
AcknowledgementsThis work was financially supported by the Scientific Research Unit of Ege University (Project Number: 11 FEN 012). We would like to extend our thanks to the Izmir Institute of Technology, Biotechnology and Bioengineering Central Research Laboratories (BIYOMER) for providing laboratory facilities for DNA sequencing studies.Conflict of Interest: The authors have declared that no conflict of interest exists.
Figure 3. The network representation of Figure 1 with out-group.
Turk J Biochem, 2014; 39 (1) ; 78–86 Akpınar et al.85
Figure 5. Adjacency matrix of the phylogenetic directed network with Candida sake as out-group.
Figure 4. The network representation of Figure 2 without out-group.

Turk J Biochem, 2014; 39 (1) ; 78–86 Akpınar et al.86
References[1] Fell JW, Boekhout T, Fonseca A, Scorzetti G, Statzell-Tallman
A. Biodiversity and systematics of basidiomyceteous yeasts as determined by large-subunit rDNA D1/D2 domain sequence analysis. Int J Syst Evol Microbiol 2000; 50:1351-1371.
[2] Deak T. Handbook of Food Spoilage Yeasts 2008; CRC Press, New York.
[3] Darwin C. On the Origin of Species by Means of Natural Selec-tion 1859; J. Murray, London.
[4] Kunin V, Goldovsky L, Darzentas N, Ouzounis CA. The net of life: Reconstructing the microbial phylogenetic network. Ge-nome Res 2005; 15:954-959.
[5] Newman MEJ. Networks an Introduction 2010; Oxford Univer-sity Press, New York.
[6] Huber KT, Moulton V. Phylogenetic networks from multi-la-belled trees. J Math Biol 2006; 52:613-632.
[7] Chen N, Engelberg R, Nguyen CT, Raghavendra P, Rudra A, Singh G. Approximation, Randomization, and Combinatorial Optimization 2007; Springer-Verlag, Berlin Heidelberg. 4627; 44-58.
[8] Bello AP, Munteanu CR, Ubeira FM, Magalhaes AL, Uriarte E, Diaz HG. Alignment-free prediction of mycobacterial DNA promoters based on pseudo-folding lattice network or star-graph topological indices. J Theor Biol 2009; 256:458-466.
[9] Castellano C, Satorras RP. Thresholds for epidemic spreading in networks. Phys Rev Lett 2010; 105:218701-218704.
[10] Munteanu CR, Magalhaes AL, Uriarte E, Diaz HG. Multi-target QPDR classification model for human breast and colon cancer-related proteins using star graph topological indices. J Theor Biol 2009; 257:303-311.
[11] Blanco EF, Pulido VA, Munteanu CR, Dorado J. Random forest classification based on star graph topological indices for antioxi-dant proteins. J Theor Biol 2013; 317:331-337.
[12] Akpınar O, Uçar FB. Molecular characterization of Yar-rowia lipolytica strains isolated from different environments and lipase profiling. Turk J Biol 2013; 37:249-258.
[13] Arias CR, Burns JK, Friedrich LM, Goodrich RM, Parish M.E. Yeast species associated with orange juice: evaluation of different identification methods. Appl Environ Microbiol 2002; 68:1955-1961.
[14] Barrat A, Barthélemy M, Pastor-Satorras R, Vespignani A. The architecture of complex weighted networks. Proc Natl Acad Sci USA 2004; 101:3747-3752.
[15] Wang L, Subramanian S, Latifi S, Srimani PK. Distance distribution of nodes in star graphs. Appl Math Lett 2006; 19:780-784.
[16] Farkas IJ, Abel D, Palla G, Vicsek T. Weighted network modules. New J Phys 2007; 9:180.
[17] Grünewald S, Huber KT, Moulton V, Semple C. Encoding phylogenetic trees in terms of weighted quartets. J Math Biol 2008; 56:465-477.
[18] Dress AWM, Huber KT, Steel M. ‘Lassoing’ a phylogenetic tree I: basic properties, shellings, and covers. J Math Biol 2012; 65:77-105.
[19] Willson SJ. Reconstruction of some hybrid phylogenetic networks with homoplasies from distances. B Math Biol 2007; 69:2561-2590.
[20] Huynh TND, Jansson J, Nguyen NB, Sung WK. Constructing a Smallest Refining Galled Phylogenetic Network 2005; Springer, Berlin.
[21] Brandes U, Erlebach T. Network Analysis: Methodological Foundations 2005; Springer-Verlag, Berlin Heidelberg.
Table 1. Topological data for the analysis of two phylogenetic networks. : average degree; : average weighted degree; : network diam-eter; : graph density; : number of connected components; : average path length; σ2: variance; σ: standard deviation.
Networks σ2 σ
with C. sake
1 1 1 0.0400 0.9600 0.0046 0.00027 0.0165
without C. sake
1 1 1 0.0417 0.9583 0.0048 0.00027 0.0165