
Universidade Eduardo Mondlane Eduardo Mondlane University UEM

STAR 2016
Eduardo Martin Moral
Page 1
Categorisation of bike share scheme user behaviour – Lessons from the London case
Eduardo Martin Moral, Transport Research Institute, Edinburgh Napier University
1 Introduction
The assessment of transportation users´ preferences and travel patterns are important for transport
operators whose decisions must take into account customer behaviour. If users´ travel patterns are
understood, the impact of decisions such as fare changes can be predicted more accurately. A better
understanding of user requirements and travel behaviours can be determined by analysing users’
journeys characteristics, such as travel frequency, duration, travel time preference, etc. The
widespread deployment of Intelligent Transport Systems has simplified journey data collection and
made it more accurate. This has expanded the scope and accuracy of behaviour analysis. Recorded
characteristics are often the same independent of the mode of transport studied (i.e. spatial
information such as origin and destination station, details of the mode and service such as for example
the bus number, cardholder information such as sort of membership, etc.). These data are stored in
large databases maintained by the operator and increasingly available to general public. However,
due to data protection policies not all the data can be disclosed (Bagchi et al 2003).
In this research, patterns of usage of the London´s public bike scheme are characterised based on the
time and spatial regularity of individual customers’ hires. Data are provided by Transport for London. A
combination of database processing techniques and cluster analysis is used to identify customers with
similar travel behaviours. This approach provides a dissection of the different categories of users
renting bikes in London as well as the size of these different categories, and their preferences and
main characteristics.
2 Literature review
The concept of bike sharing was quite innovative when the first scheme started with 15 public bikes
available to be hired (Amsterdam - 1964). The way these schemes operate is quite simple; they offer
bike rentals for short-term usage from bike stations not attended by any personnel (DeMaio, 2009).
The number of public bike schemes has increased worldwide during the last fifty years. Nowadays
more than 600 cities (Walker, 2014) have a public bike scheme as an alternative to classic modes of
transport.
Santander Cycles (SCS) is the public bike sharing scheme in London which has operated since 2010.
More than 10,000 bikes are offered for hire and the bike stations comprise a network with more than
750 nodes. To hire a bicycle placed at a docking point, users need to unlock the bicycle. To do this,
the vast majority of extant schemes require paying for the rental by a mode of payment (e.g. smart
card, credit card, etc.). Paying to use the system by these modes of payment has direct beneficial
consequences; reduction in the number of bicycle theft and provision of renter’s information to the
operator – however it also creates a barrier to use (Midgley, 2011). When designing a scheme, it is
important to consider the availability of bikes per station and also to ensure that the bike stations have
enough available docking points to allow the users to easily return the bikes. Bike activity usually
comprises the pickups and returns of the bikes. Vogel et al (2011) conducted research to study how
important the spatial distribution of bikes stations is, reaching the conclusion that the surroundings of a
bike station are an important factor to be considered. Population, commercial areas or the access to
stations of public transport are some of the factors that affect the usage of a determined bike station
Zhao et al (2014).Vogel et al (2011) introduce the difficulty these schemes have in provision of enough
bikes to satisfy the demand.
Smart ticketing systems enable operators and transport authorities to collect comprehensive data on
the users´ travel behaviour (Wilkie, 2010). Analysing this information, operators are able to respond

STAR 2016
Eduardo Martin Moral
Page 2
more effectively to changes in demand during different time periods and different areas. Subsequently,
the assessment of planning public transport services is highly simplified. The ability to plan service
provision around such comprehensive travel data is one of the most noticeable benefits of smartcard
ticketing for transport operators, as it allows them to provide services to specific needs in different
situations. Smart ticketing is useful to improve the public transport offer and it can provide benefits to
the public sector and transport operators. Data from smart ticketing increases the efficiency of existing
resources and might lead to new business opportunities (Doganaksoy and Hahn, 2009).
Therefore, taking into account all previous work that has been carried out about this topic it has been
found pertinent to determine regularity patterns of usage of the SCS users using data mining, using
spatial, temporal and other types of variables such as type of membership purchased. This study will
provide evidence to support the planning and design of a better service as due to the relative
modernity of public bikes schemes this sort of analysis has not been widely used to study this mode of
transport.
3 Santander Cycles Scheme (SCS) Data Analysis
3.1 Methodology
In this research it is possible to study the behaviour of the people who use the public bikes in London
through the analysis of a large dataset provided by the scheme´s owner Transport for London (TfL).
This dataset includes more information than the dataset available from the TfL website with open
access as the database studied includes the user’s identification number. The dataset studied
contains the records of all the rentals of public bikes made in London during 2014 (9,882,801
journeys) and it contains several features of each rental such as duration, origin, destination, user’s
type of membership, etc. Records in this dataset have been obtained from the debit or credit card
information collected in the bikes stations required from the users previous to unlock the bikes.
The principal travel characteristics studied in this research to understand the bike users’ behaviours
include those features that help to define users’ travel patterns and users’ profiles. A comparative
study between the rentals’ characteristics stated before is done to develop an interpretation of the
most remarkable characteristics of each group of users and to detect which are the most
representative variables. The spatial distribution of the different groups of users is analysed in order to
detect the most frequent used stations as starting and ending points of the journeys.
The relationship between travel behaviour and membership purchased is also analysed. Travel
patterns of registered users are compared to the behaviour the non-registered users have. How
registered users distribute their rentals within the network is studied looking for similarities and
differences with the non-registered user’s spatial distribution.
In order to carry out a more accurate study it was decided to remove several data from the dataset.
The database provided by TfL contains 9,882,801 records of rentals made by 812,005 different single
users. Nonetheless, those records with duration fewer than two minutes (120 seconds in the dataset)
and over 10 hours (36,000 seconds in the dataset) which corresponds approximately to the value of
30 times the average journey´s duration have been removed from the dataset. The reason to consider
those records redundant in this study is because they do not reflect the usage of public bikes schemes
(i.e. short-term bike rentals) (Shaheen et al 2010). Rentals with duration under 2 minutes can be
considered as bike trials. Bike trials are those rentals when a user unlocks a bike, tests it for a few
seconds and then the user decides the bike is not in a good condition for the purpose of the intended
journey. In addition to this dataset, the author of this research has been provided with spatial
information for all the bike stations in the network (i.e. longitude, latitude, postcode, etc.). After the
database provided by TfL was processed, the remaining database was comprised of 7,512,565
journeys made by 112,733 different users. This dataset was then used to classify the different types of
users as well as to compare the similarities and differences between groups through a cluster
analysis.

STAR 2016
Eduardo Martin Moral
Page 3
A cluster analysis can be defined as a class of techniques used to classify cases into groups that are
relatively homogeneous within themselves and heterogeneous between each other. These methods
are based on a defined set of variables and resulting groups are called clusters (Dell, 2015).
In this research in order to obtain the different clusters of users inside the dataset a two-step clustering
algorithm was utilised. The clustering algorithm chosen in this research was the SPSS (Statistical
Package for the Social Sciences) two-step Clustering Component which is a cluster analysis algorithm
designed to cluster large datasets. To perform the cluster analysis, the variables that are included in
the procedure must be selected. Thus, in the study of the rentals’ characteristics mentioned above it
was crucial to select the most representative variables, which in this case were:
1. Average rentals per year: number of bikes picked up by the user during the period of
time studied.
2. Average rentals´ duration: average duration of the total amount of rentals made by the
user during the period of time studied.
3. Average different stations used per year: total amount of different stations the user
chose to make at least one rental during the period of time studied.
4. % Rentals made during morning peak: amount of rentals made between 7-9 am
divided by the total amount of rentals made by the user during the period of time studied.
5. % Rentals made during afternoon peak: amount of rentals made between 4-6 pm
divided by the total amount of rentals made by the user during the period of time studied.
6. % Rentals made from preferred station: each user had a preferred station to pick up
bikes during the period of time studied. The user´s preferred origin station is the station from where
these users started the greatest amount of trips. This variable is then the result of dividing the amount
of rentals made from this station by the total amount of rentals the user made during the period of time
studied.
7. % Rentals ended in preferred destination station: each user also had a preferred
station to return bikes during the period of time studied. The user´s preferred destination station is the
station where this user returned the greatest amount of rented bikes. This variable then is the result of
dividing the amount of rentals ended in this station by the total amount of rentals the user made during
the period of time studied.
8. Registration: as explained previously in this research a user can be registered or non-
registered in the system. This variable has been set as 1 if the user is registered and 0 if the user is
non-registered.
To conclude, the analysis was validated using the IBM SPSS package as it permits checking the
impact the algorithm has had in the data clustering as well as checking the relevance the different
variables have in the analysis.
3.2 Santander Cycles Scheme (SCS) Patterns of Usage
The 7,512,565 journeys recorded in the dataset studied in this research were not made by 7,512,565
different users. During 2014, 112,733 different UniqueIDCustomerRecordNumber (i.e. identification
number associated to each single user) were recorded. The proportion of users that registered in the
system (33% of total users) is noticeably smaller than the non-registered users (67% of total users).
Nonetheless, registered users made 5.1 million journeys during 2014 (68% of total rentals) whereas
non-registered users made 2.4 million rentals (32% of total rentals). During the summer the amount of
single users clearly increases. The average number of single users per day during 2014 was 10,206
users. However, the day when the highest amount of single users was recorded was the 30th of April
when 16,542 rented at least one bike from the SCS. Conversely, the day when the scheme was used
by the fewest amount of single users (2,114 single users) was on the 1st of January.
During 2014 each single user made on average 67 rentals. This trend showed a standard deviation
equal to 102,059. The median of that data sample is equal to 27. This means that the 50% of the
STAR 2016
Eduardo Martin Moral
Page 4
sample (i.e. 56,367 single users) made more than 27 trips using SCS whereas the rest 50% of users
made less than 27 bike rentals during 2014. In addition to this, the single user who made most rentals
during 2014 made 2,473 rentals. However, this amount of rentals made per user was not typical
because the next highest user made 1,975 rentals (i.e. 20% less rentals). It is worth highlighting that
just 1% of the single users (1,127 single users) made more than 500 rentals per user and year.
Whereas a third of the sample (37,578 single users) made less than 18 rentals a year.
As it has been stated before, although the proportion of non-registered users is greater than registered
users during the period of time studied (i.e. 67% and 33% respectively), registered users made twice
the rentals non-registered users made. Each registered user made, on average, 137 rentals during
2014.
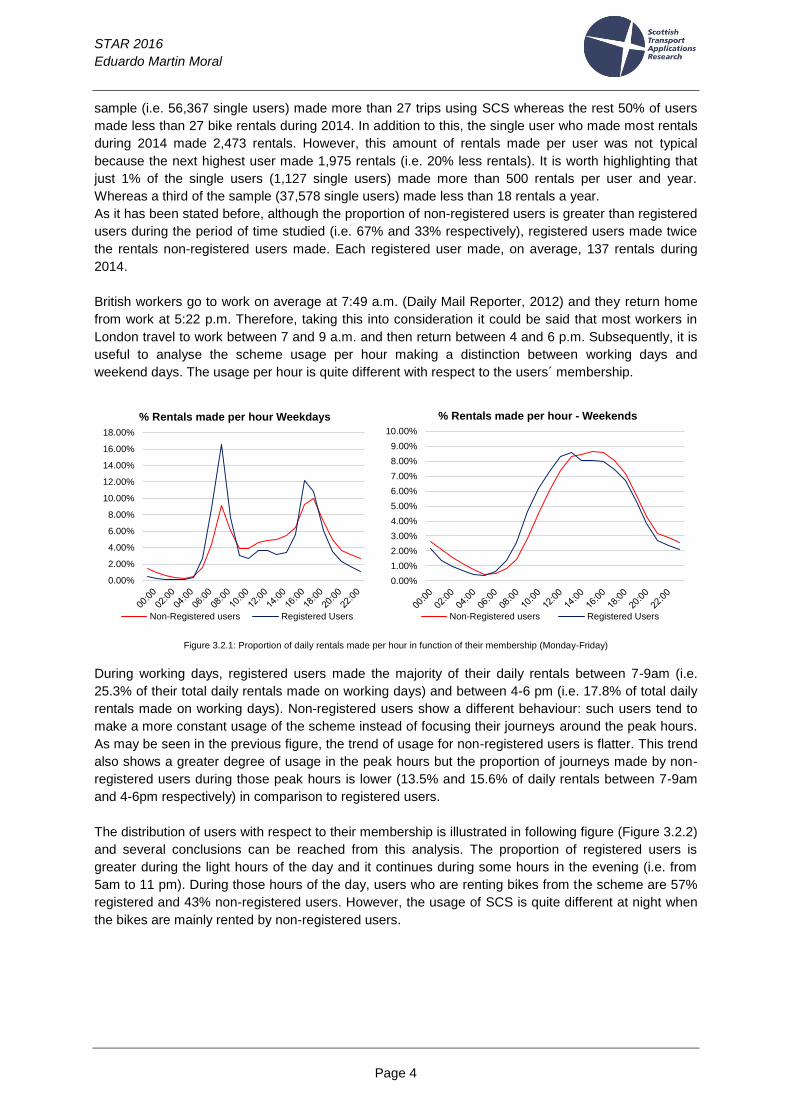
British workers go to work on average at 7:49 a.m. (Daily Mail Reporter, 2012) and they return home
from work at 5:22 p.m. Therefore, taking this into consideration it could be said that most workers in
London travel to work between 7 and 9 a.m. and then return between 4 and 6 p.m. Subsequently, it is
useful to analyse the scheme usage per hour making a distinction between working days and
weekend days. The usage per hour is quite different with respect to the users´ membership.
Figure 3.2.1: Proportion of daily rentals made per hour in function of their membership (Monday-Friday)
During working days, registered users made the majority of their daily rentals between 7-9am (i.e.
25.3% of their total daily rentals made on working days) and between 4-6 pm (i.e. 17.8% of total daily
rentals made on working days). Non-registered users show a different behaviour: such users tend to
make a more constant usage of the scheme instead of focusing their journeys around the peak hours.
As may be seen in the previous figure, the trend of usage for non-registered users is flatter. This trend
also shows a greater degree of usage in the peak hours but the proportion of journeys made by non-
registered users during those peak hours is lower (13.5% and 15.6% of daily rentals between 7-9am
and 4-6pm respectively) in comparison to registered users.
The distribution of users with respect to their membership is illustrated in following figure (Figure 3.2.2)
and several conclusions can be reached from this analysis. The proportion of registered users is
greater during the light hours of the day and it continues during some hours in the evening (i.e. from
5am to 11 pm). During those hours of the day, users who are renting bikes from the scheme are 57%
registered and 43% non-registered users. However, the usage of SCS is quite different at night when
the bikes are mainly rented by non-registered users.
0.00%
2.00%
4.00%
6.00%
8.00%
10.00%
12.00%
14.00%
16.00%
18.00%
% Rentals made per hour Weekdays
Non-Registered users Registered Users
0.00%
1.00%
2.00%
3.00%
4.00%
5.00%
6.00%
7.00%
8.00%
9.00%
10.00%
% Rentals made per hour - Weekends
Non-Registered users Registered Users

STAR 2016
Eduardo Martin Moral
Page 5
Figure 3.2.2: Users’ distribution per hour and membership (Monday – Friday)
Whereas during working days the behaviour of registered customers differs from the non-registered
users’ behaviour (they do more journeys), during the weekend the amount of rentals made is quite
similar independent to the user’s membership. On Saturdays and Sundays, the usage of the scheme
follows a trend similar to a sinusoidal function that reaches its maximum at 1pm for registered users
and 3pm for non-registered users. At 1pm registered users made 8.58% of their daily rentals and at
3pm non-registered users made 8.63% of their daily rentals. On the other hand, the hour of the day
when users make least rentals during the weekend was at 3am and 5am for registered and non-
registered users when they made 0.1% and 0.45% of their daily rentals respectively.
During 2014, users (on average) made at least one rental from 15 different stations. It is worth
highlighting at this point that SCS had 780 different bike stations during 2014 and registrations for
112,733 different single users. Half of those single users made at least one rental from 11 different
bike stations and this value is the median of the data sample. In addition to this, the user who made
the most widespread usage of the scheme, in terms of different stations chosen made at least one trip
from 202 different stations. This customer was a very active user during 2014 as he made 1,502
rentals during that year. However, there were 123 single users (i.e. a 0.1% of the total amount of
single users) who always chose the same station to pick the bikes.
One out of a hundred journeys (i.e. 74,781 journeys) started from Belgrove Street, King's Cross station
during 2014. This station was the place from which the greatest amount of journeys started. However,
it is possible to define the degree of importance a station has within the network as the amount of
single users that made at least one journey from that station during the year. Following this criteria, the
station with the greatest flow of different users was Hyde Park Corner station. During 2014, 9,415
single users started at least one journey from this station. Nonetheless, during the year studied, each
station was used on average by 2,224 different single users. The least important station in terms of the
previous definition (Teviot Street, Poplar station) was used by 136 different single users. In addition to
this, half of the stations were used at least once by more than 1,811 different single users.
Aesthetically pleasant locations are much appreciated for single users as stations close to these
locations are those with greatest flow of different users. Hyde Park is one of the biggest parks in
London and is one of the Royal Parks of London. Millions of tourists visit the 142 hectares of Hyde
Park every year and they are able to make several recreational activities including open water
swimming, boating, cycling, tennis and horse riding (The Royal Parks, 2016). From this station more
than 25,750 journeys started during the whole 2014 and it is the 23rd
station from where most journeys
started. Being placed close to a location with a remarkable flow of tourists is a clear consequence for
this station being utilised by a lot of different users.
0%
10%
20%
30%
40%
50%
60%
70%
80%
90%
100%
% Users Registered vs. Non-registered per hour weekdays
Registered Non-registered
0%
10%
20%
30%
40%
50%
60%
70%
80%
90%
100%
% Users Registered vs. Non-registered per hour weekends
Registered Non-registered

STAR 2016
Eduardo Martin Moral
Page 6
It is notable that registered users tend to finish their journeys at different stations than their preferred
origin stations whereas non-registered users more frequently return bikes to stations which are in their
top five preferred origin stations. For instance, 9.81% of rentals made by non-registered users which
started in Black Lion Gate, Kensington Gardens (4th most used station by this sort of user) finished in
Hyde Park Corner, Hyde Park station (3rd most used station by this sort of user). Three of the top five
non-registered users’ preferred origin stations are also common destinations to return the bikes rented
by this sort of user. This means that this sort of user is more willing to make ‘round trips’ (i.e. journeys
with coincident origin and destination) than registered users.
It has been found interesting to study the amount of rentals with coincident Origin and Destination for
the different types of membership. During 2014, non – registered users made 61,570 rentals with the
same origin and destination whilst registered users made 45,580 rentals with this characteristic. Both
types of user preferred Black Lion Gate, Kensington Gardens bike station to make this sort of rental.
These rentals made by registered users lasted on average 26 minutes whilst non-registered users´
rentals with coincident origin and destination lasted on average 35 minutes.
3.3 Users classification through Cluster Analysis
As has been explained in the methodology, in order to identify the different groups of users in the
London’s public bikes scheme a cluster analysis has been carried out. In this research to obtain the
different clusters of users inside the dataset a two-step clustering algorithm was used. The algorithm
chosen to carry out the clustering analysis was the SPSS two-step Clustering Component which is
designed to cluster large datasets. This algorithm is based on two steps which allow distinction of the
clusters handling both categorical and attributive variables. In the first step of the method the dataset
is pre-clustered into small sub-clusters. This two-step method then proceeds to cluster these sub-
clusters into a fixed amount of clusters (if the number of clusters is known). Alternatively, the SPSS
two-step Cluster Component also allows the software to determine the proper number of clusters
automatically.
First of all, before running the software it is required to set the variables that will classify the data in the
different clusters. In this case it has been decided to set eight different ‘indicators’ (i.e. variables). The
reason for selecting these variables is that they reflect both temporal and spatial travel behaviours and
because it is possible to extract them from the database that is used in this research. Then, once the
variables are defined, the value of each variable has been calculated for each single user the scheme
registered during 2014. In the dataset there are 112,733 single users who made a total of 7.51 million
rentals during that year. In addition to this, 8 different variables were selected to carry out the
clustering process. Subsequently, a table has been created with all these calculated values which
contain more than 900,000 cells.
The main result of this procedure was interesting as the algorithm classified the users into only two
different clusters. One cluster contains the 66.9% of the users (i.e. 75,461 single users) and the other
cluster is comprised by the 33.1% of the users (i.e. 37,272 single users). The algorithm detects that
the main difference between the users inside these two different clusters is the users’ sort of
membership. Thus, it was decided to repeat the clustering procedure two more times. Nonetheless, in
these new steps registered users and non-registered uses have been classified independently. This
way it is possible to detect different sub-clusters inside the two main clusters of users (i.e. registered
and non-registered users). Once the algorithm is run again it detects 3 different sub-clusters inside the
registered user’s main cluster as well as 6 sub-clusters inside the non-registered user’s main cluster.
The clustering variables´ values for each sub-cluster comprised by registered users have been
obtained using the SPSS software and are summarised in the following table (Table 3.3.1).

STAR 2016
Eduardo Martin Moral
Page 7
Table 3.3.1: Clustering Indicators values for each cluster comprised by registered users
Average rentals per
year
Average duration per year
(sec)
Different stations per year
% Rentals made
morning peak hour
% Rentals made
afternoon peak hour
% Rentals made from preferred
origin station
% Rentals finished in preferred
destination station
Cluster Registered 1 67.98 15 18.1 9% 11% 33% 30%
Cluster Registered 2 130.11 13 11.96 36% 22% 51% 49%
Cluster Registered 3 363.3 13 52.63 17% 11% 32% 29%
Cluster Non-Registered 1 25.52 20 12.69 2% 6% 21% 20%
Cluster Non-Registered 2 113.4 16 27.75 11% 11% 31% 29%
Cluster Non-Registered 3 22.19 20 9.28 3% 27% 30% 29%
Cluster Non-Registered 4 18.84 50 7.57 2% 7% 34% 32%
Cluster Non-Registered 5 24.07 17 7.91 3% 5% 42% 40%
Cluster Non-Registered 6 29.99 17 8.21 36% 12% 44% 40%
Furthermore, how different the behaviour of the different categories of users in terms of rentals made
per hour each day of the week has been analysed. This way it is possible to identify more similarities
and differences between the different clusters of users. The following tables show the proportion of
rentals made per hour and weekday for the 3 sub-clusters identified in the dataset for registered users.
Table 3.3.2: Registered Users –Proportion of rentals made per hour
CLUSTER REGISTERED 1 CLUSTER REGISTERED 2 CLUSTER REGISTERED 3
Mon. Tue. Wed. Thu. Fri. Sat. Sun. Mon. Tue. Wed. Thu. Fri. Sat. Sun. Mon. Tue. Wed. Thu. Fri. Sat. Sun.
00:00 0.08 0.08 0.09 0.12 0.14 0.22 0.21 0.01 0.01 0.02 0.02 0.03 0.05 0.04 0.08 0.08 0.10 0.11 0.15 0.23 0.23
01:00 0.03 0.03 0.04 0.05 0.07 0.13 0.15 0.01 0.01 0.01 0.01 0.01 0.02 0.02 0.04 0.03 0.04 0.05 0.06 0.13 0.15
02:00 0.02 0.02 0.02 0.03 0.04 0.09 0.11 0.00 0.00 0.00 0.00 0.01 0.01 0.01 0.02 0.02 0.02 0.03 0.04 0.09 0.11
03:00 0.01 0.01 0.01 0.02 0.02 0.06 0.07 0.00 0.00 0.00 0.00 0.01 0.01 0.01 0.02 0.02 0.02 0.02 0.02 0.06 0.07
04:00 0.02 0.02 0.02 0.02 0.02 0.03 0.05 0.01 0.01 0.01 0.01 0.01 0.01 0.01 0.02 0.02 0.02 0.02 0.03 0.04 0.05
05:00 0.06 0.07 0.07 0.07 0.06 0.04 0.04 0.05 0.06 0.06 0.06 0.05 0.01 0.01 0.06 0.07 0.07 0.06 0.06 0.04 0.03
06:00 0.33 0.42 0.40 0.40 0.31 0.07 0.06 0.55 0.69 0.66 0.64 0.52 0.02 0.01 0.35 0.42 0.41 0.41 0.34 0.07 0.05
07:00 0.49 0.65 0.65 0.64 0.52 0.12 0.08 2.74 3.28 3.10 3.10 2.51 0.08 0.04 0.94 1.11 1.07 1.07 0.90 0.15 0.11
08:00 1.25 1.48 1.46 1.49 1.29 0.29 0.19 4.45 4.97 4.75 4.87 4.09 0.13 0.07 2.20 2.52 2.44 2.47 2.17 0.29 0.18
09:00 1.36 1.54 1.58 1.61 1.46 0.56 0.38 1.00 1.06 1.10 1.11 0.97 0.17 0.11 1.25 1.32 1.36 1.37 1.33 0.52 0.34
10:00 0.66 0.73 0.77 0.77 0.77 0.76 0.59 0.23 0.26 0.26 0.27 0.26 0.20 0.14 0.53 0.58 0.58 0.60 0.62 0.64 0.49
11:00 0.59 0.66 0.67 0.68 0.69 0.89 0.75 0.16 0.20 0.20 0.20 0.22 0.22 0.17 0.48 0.49 0.51 0.50 0.54 0.73 0.59
12:00 0.75 0.88 0.91 0.92 0.94 0.99 0.89 0.28 0.33 0.37 0.36 0.39 0.24 0.20 0.60 0.65 0.67 0.67 0.71 0.79 0.71
13:00 0.78 0.86 0.89 0.89 0.91 1.01 0.93 0.28 0.32 0.33 0.33 0.37 0.23 0.20 0.62 0.66 0.67 0.68 0.71 0.81 0.75
14:00 0.68 0.79 0.77 0.78 0.79 0.95 0.89 0.21 0.25 0.27 0.26 0.29 0.20 0.18 0.55 0.59 0.60 0.59 0.63 0.75 0.70
15:00 0.68 0.76 0.75 0.76 0.78 0.95 0.90 0.33 0.40 0.37 0.38 0.46 0.19 0.18 0.57 0.60 0.60 0.60 0.65 0.75 0.71
16:00 0.75 0.84 0.85 0.83 0.87 0.91 0.87 1.25 1.42 1.36 1.31 1.37 0.20 0.18 0.71 0.76 0.76 0.75 0.81 0.77 0.72
17:00 1.31 1.46 1.48 1.40 1.38 0.82 0.77 3.52 3.70 3.54 3.33 2.82 0.19 0.15 1.53 1.60 1.58 1.54 1.49 0.73 0.69
18:00 1.75 1.99 1.96 1.85 1.53 0.71 0.68 1.96 2.15 2.03 1.87 1.31 0.15 0.13 1.83 2.01 1.95 1.82 1.53 0.68 0.64
19:00 1.08 1.24 1.25 1.15 0.97 0.58 0.49 0.71 0.81 0.80 0.72 0.47 0.12 0.10 1.20 1.29 1.27 1.21 1.01 0.58 0.49
20:00 0.65 0.74 0.74 0.73 0.57 0.41 0.35 0.29 0.35 0.35 0.33 0.21 0.08 0.07 0.72 0.80 0.79 0.77 0.63 0.43 0.37
21:00 0.41 0.49 0.51 0.50 0.37 0.28 0.26 0.15 0.19 0.20 0.21 0.11 0.05 0.05 0.48 0.54 0.57 0.57 0.42 0.30 0.26
22:00 0.28 0.34 0.39 0.39 0.31 0.26 0.21 0.07 0.11 0.12 0.14 0.09 0.04 0.03 0.32 0.38 0.42 0.44 0.35 0.27 0.23
23:00 0.17 0.22 0.24 0.29 0.29 0.27 0.15 0.03 0.05 0.07 0.08 0.07 0.04 0.02 0.18 0.23 0.27 0.31 0.30 0.26 0.17
The following tables show the proportion of rentals made per hour and weekday for the 6 sub-clusters
identified in the dataset for non-registered users

STAR 2016
Eduardo Martin Moral
Page 8
Table 3.3.3: Non-Registered Users –Proportion of rentals made per hour (I)
CLUSTER NON-REGISTERED 1 CLUSTER NON-REGISTERED 2 CLUSTER NON-REGISTERED 3
Mon. Tue. Wed. Thu. Fri. Sat. Sun. Mon. Tue. Wed. Thu. Fri. Sat. Sun. Mon. Tue. Wed. Thu. Fri. Sat. Sun.
00:00 0.27 0.17 0.16 0.20 0.25 0.47 0.61 0.21 0.19 0.22 0.26 0.30 0.41 0.41 0.12 0.12 0.14 0.15 0.20 0.25 0.23
01:00 0.15 0.11 0.12 0.13 0.17 0.38 0.50 0.12 0.10 0.11 0.14 0.17 0.30 0.31 0.07 0.08 0.08 0.09 0.12 0.19 0.18
02:00 0.08 0.07 0.07 0.07 0.11 0.29 0.37 0.06 0.05 0.06 0.07 0.10 0.21 0.22 0.04 0.05 0.05 0.06 0.08 0.13 0.13
03:00 0.05 0.04 0.05 0.05 0.07 0.22 0.27 0.04 0.04 0.04 0.05 0.06 0.15 0.16 0.03 0.04 0.03 0.05 0.05 0.11 0.10
04:00 0.04 0.03 0.03 0.03 0.04 0.13 0.16 0.05 0.04 0.04 0.05 0.06 0.11 0.12 0.01 0.02 0.03 0.03 0.03 0.07 0.07
05:00 0.03 0.03 0.03 0.03 0.03 0.07 0.09 0.08 0.09 0.10 0.09 0.10 0.08 0.07 0.03 0.04 0.05 0.05 0.04 0.05 0.04
06:00 0.07 0.07 0.07 0.06 0.06 0.05 0.07 0.27 0.32 0.30 0.31 0.27 0.12 0.10 0.14 0.23 0.22 0.21 0.17 0.05 0.05
07:00 0.13 0.14 0.14 0.14 0.13 0.09 0.09 0.64 0.77 0.76 0.74 0.64 0.21 0.15 0.16 0.23 0.24 0.23 0.19 0.09 0.06
08:00 0.36 0.36 0.38 0.38 0.36 0.21 0.19 1.40 1.64 1.57 1.62 1.43 0.31 0.21 0.39 0.55 0.55 0.55 0.48 0.14 0.08
09:00 0.55 0.49 0.50 0.52 0.51 0.54 0.54 0.97 1.06 1.09 1.11 1.08 0.50 0.35 0.67 0.79 0.86 0.90 0.76 0.28 0.18
10:00 0.60 0.49 0.47 0.50 0.57 1.01 1.03 0.53 0.55 0.58 0.58 0.59 0.62 0.51 0.46 0.55 0.61 0.68 0.65 0.44 0.30
11:00 0.63 0.50 0.50 0.54 0.64 1.41 1.47 0.49 0.49 0.54 0.55 0.62 0.75 0.69 0.51 0.59 0.65 0.72 0.76 0.55 0.44
12:00 0.72 0.60 0.62 0.68 0.75 1.78 1.91 0.55 0.58 0.62 0.62 0.69 0.84 0.79 0.66 0.75 0.79 0.89 0.91 0.70 0.60
13:00 0.73 0.60 0.65 0.71 0.80 2.04 2.15 0.61 0.63 0.64 0.65 0.72 0.95 0.91 0.76 0.84 0.89 1.00 1.00 0.78 0.69
14:00 0.73 0.63 0.62 0.70 0.80 2.14 2.17 0.60 0.63 0.66 0.68 0.74 0.95 0.90 0.80 0.93 0.98 1.08 1.04 0.81 0.71
15:00 0.76 0.65 0.63 0.70 0.83 2.18 2.23 0.71 0.74 0.74 0.73 0.82 0.98 0.94 1.07 1.11 1.15 1.27 1.29 0.87 0.77
16:00 0.59 0.50 0.51 0.54 0.67 2.18 2.14 0.84 0.88 0.90 0.89 0.97 1.02 0.95 2.12 2.26 2.25 2.53 2.47 0.91 0.81
17:00 0.65 0.61 0.64 0.65 0.77 2.10 1.97 1.26 1.38 1.38 1.34 1.30 1.00 0.90 2.72 3.01 3.19 3.23 2.93 0.81 0.76
18:00 0.93 1.00 1.02 0.99 1.08 1.79 1.83 1.44 1.62 1.59 1.50 1.29 0.88 0.87 1.31 1.54 1.51 1.57 1.28 0.67 0.68
19:00 0.73 0.80 0.83 0.84 0.95 1.48 1.32 1.02 1.15 1.13 1.08 0.99 0.78 0.66 0.76 0.96 0.98 0.99 0.81 0.49 0.50
20:00 0.54 0.57 0.60 0.63 0.74 1.14 0.95 0.70 0.78 0.78 0.75 0.72 0.61 0.54 0.50 0.59 0.59 0.66 0.53 0.36 0.39
21:00 0.41 0.45 0.48 0.51 0.61 0.83 0.69 0.51 0.60 0.60 0.58 0.53 0.46 0.42 0.33 0.40 0.43 0.47 0.37 0.25 0.26
22:00 0.34 0.38 0.42 0.46 0.56 0.76 0.55 0.42 0.49 0.51 0.52 0.49 0.43 0.39 0.28 0.33 0.33 0.38 0.29 0.26 0.24
23:00 0.25 0.30 0.31 0.39 0.51 0.69 0.41 0.34 0.39 0.43 0.46 0.46 0.44 0.33 0.19 0.23 0.27 0.31 0.29 0.23 0.18
Table 3.3.4: Non-Registered Users –Proportion of rentals made per hour (II)
CLUSTER NON-REGISTERED 4 CLUSTER NON-REGISTERED 5 CLUSTER NON-REGISTERED 6
Mon. Tue. Wed. Thu. Fri. Sat. Sun. Mon. Tue. Wed. Thu. Fri. Sat. Sun. Mon. Tue. Wed. Thu. Fri. Sat. Sun.
00:00 0.20 0.14 0.20 0.19 0.23 0.36 0.53 0.31 0.23 0.24 0.29 0.35 0.54 0.61 0.04 0.03 0.05 0.07 0.09 0.14 0.13
01:00 0.14 0.10 0.10 0.15 0.15 0.38 0.45 0.17 0.16 0.16 0.20 0.23 0.43 0.52 0.02 0.01 0.02 0.03 0.05 0.11 0.11
02:00 0.08 0.08 0.07 0.10 0.10 0.25 0.36 0.11 0.09 0.10 0.12 0.15 0.33 0.39 0.01 0.01 0.01 0.01 0.03 0.09 0.08
03:00 0.09 0.04 0.04 0.08 0.07 0.18 0.28 0.07 0.06 0.06 0.08 0.11 0.25 0.28 0.01 0.01 0.00 0.01 0.02 0.07 0.06
04:00 0.05 0.02 0.04 0.05 0.04 0.13 0.13 0.06 0.06 0.06 0.07 0.08 0.17 0.16 0.01 0.01 0.01 0.01 0.01 0.04 0.03
05:00 0.06 0.05 0.06 0.04 0.04 0.08 0.09 0.08 0.10 0.10 0.10 0.10 0.11 0.11 0.02 0.02 0.03 0.03 0.03 0.03 0.02
06:00 0.11 0.10 0.10 0.09 0.07 0.08 0.10 0.28 0.32 0.33 0.33 0.27 0.12 0.11 0.24 0.30 0.30 0.29 0.24 0.05 0.03
07:00 0.11 0.16 0.17 0.16 0.16 0.08 0.13 0.17 0.17 0.18 0.18 0.17 0.15 0.13 2.19 2.80 2.75 2.69 2.28 0.22 0.12
08:00 0.30 0.33 0.32 0.33 0.28 0.28 0.29 0.40 0.43 0.41 0.42 0.42 0.34 0.27 4.24 4.97 5.05 5.09 4.60 0.29 0.18
09:00 0.45 0.46 0.39 0.47 0.46 0.61 0.59 0.92 0.99 1.04 1.03 1.01 0.70 0.55 0.75 0.82 0.91 0.94 0.91 0.35 0.22
10:00 0.64 0.46 0.50 0.49 0.48 1.10 1.24 0.57 0.53 0.57 0.60 0.65 0.91 0.85 0.23 0.24 0.25 0.28 0.28 0.40 0.35
11:00 0.63 0.50 0.52 0.57 0.69 1.53 1.84 0.56 0.53 0.54 0.58 0.61 1.14 1.18 0.20 0.19 0.22 0.24 0.25 0.47 0.43
12:00 0.65 0.59 0.55 0.71 0.71 1.82 2.07 0.64 0.63 0.64 0.65 0.70 1.36 1.45 0.28 0.35 0.34 0.35 0.40 0.56 0.56
13:00 0.74 0.54 0.65 0.61 0.81 2.13 2.52 0.70 0.66 0.68 0.71 0.76 1.52 1.58 0.31 0.33 0.37 0.36 0.43 0.55 0.61
14:00 0.78 0.56 0.66 0.77 0.78 2.25 2.57 0.67 0.66 0.66 0.67 0.74 1.54 1.56 0.25 0.29 0.31 0.28 0.36 0.52 0.55
15:00 0.80 0.66 0.66 0.82 0.84 2.29 2.46 0.66 0.66 0.65 0.70 0.77 1.54 1.55 0.35 0.38 0.35 0.37 0.45 0.55 0.58
16:00 0.72 0.68 0.69 0.67 0.81 2.23 2.34 0.47 0.47 0.48 0.51 0.55 1.57 1.57 0.66 0.76 0.75 0.73 0.81 0.51 0.51
17:00 0.72 0.71 0.81 0.77 0.79 2.08 2.04 0.57 0.60 0.60 0.61 0.70 1.47 1.40 1.79 1.92 1.95 1.84 1.66 0.47 0.46
18:00 0.97 1.05 1.10 0.97 1.04 1.54 1.68 1.16 1.36 1.35 1.26 1.22 1.29 1.30 1.94 2.20 2.15 1.88 1.40 0.43 0.47
19:00 0.70 0.76 0.85 0.82 0.87 1.25 1.23 0.92 1.08 1.09 1.04 1.01 1.13 1.03 1.04 1.21 1.23 1.04 0.78 0.35 0.35
20:00 0.41 0.48 0.56 0.54 0.68 0.90 0.87 0.71 0.79 0.80 0.79 0.78 0.87 0.78 0.52 0.61 0.64 0.60 0.44 0.25 0.24
21:00 0.28 0.38 0.35 0.42 0.48 0.66 0.54 0.51 0.61 0.61 0.59 0.58 0.68 0.58 0.31 0.40 0.40 0.36 0.26 0.17 0.16
22:00 0.28 0.30 0.34 0.33 0.42 0.62 0.48 0.43 0.50 0.55 0.55 0.57 0.64 0.53 0.18 0.25 0.31 0.29 0.21 0.14 0.13
23:00 0.25 0.25 0.27 0.30 0.44 0.55 0.39 0.36 0.40 0.46 0.50 0.57 0.65 0.45 0.11 0.14 0.17 0.21 0.20 0.14 0.09
Taking into account the seven indicators (Table 3.3.1) studied in the cluster analysis, the usage per
hour and weekday each cluster made (Tables 3.3.2 – 3.3.4) and the spatial distribution of preferred
origins and destinations it is possible to label the clusters according to these spatial and temporal
characteristics.

STAR 2016
Eduardo Martin Moral
Page 9
Table 3.3.5: Clusters Labelling
Cluster Label
Cluster Registered 1 Post-Contemplators
Cluster Registered 2 Multimodal Commuters
Cluster Registered 3 Scheme Enthusiasts
Cluster Non-Registered 1 Weekend Widespread Users
Cluster Non-Registered 2 Irregular Commuters
Cluster Non-Registered 3 Casual afternoon Commuters
Cluster Non-Registered 4 Weekend Recreational Users
Cluster Non-Registered 5 Flexible Commuters & Weekend
Cluster Non-Registered 6 Casual Morning Commuters
Below a summary of each cluster’s characteristics that have helped to label the clusters is presented.
Cluster Registered 1 – Post-Contemplators:
This cluster is comprised of 19,222 users. These users made 1,306,501 rentals during 2014 (i.e. 17%
of total scheme’s rentals). The main characteristic of this user behaviour is that they are the registered
users who cycle more time per rental made (15 minutes). In addition to this, these users are not
focused on making rentals during the peak hours (neither morning nor afternoon peak hours). They
make just around a 10% of their journeys during peak hours. Users in this cluster are the registered
users who made fewest amount of rentals per user during the year (i.e. 68 rentals). It is notable that
the average amount of bikes rented per user independently of the membership was also 67 bikes.
Cluster Registered 1 members start around 30% of their journeys at their preferred station as well as
returning 30% of the bikes they rent to their preferred destination. The spatial distribution of rentals of
these users is quite widespread in comparison to the other clusters comprised by registered users.
Their spatial behaviour is more similar to non-registered users’ behaviour. Thus, in addition to these
users being the registered users who make fewer rentals per year but also the registered users who
make the greatest proportion of rentals during the weekend it is reasonable to think of these users as
customers that have tried the scheme before as non-registered users and now they are contemplating
to use the scheme on a more regular basis and have thus decided to register to get advantages such
as easier access to bikes.
Cluster Registered 2 – Multimodal Commuters:
This cluster is comprised of 11,743 users. These users made 1,532,879 rentals during 2014 (i.e. 20%
of total scheme’s rentals). Each user made on average 130 rentals during 2014. This means that they
were very active users as they made more than two times the rentals an overall user made during that
year. They were outstandingly focused in making rentals during peak hours as they made more than
58% of their trips during peak hours. However, they made shorter trips (13 minutes) in comparison to
overall users and Post-Contemplators (15 minutes). Furthermore, Cluster Registered 2 users are the
registered users with the greatest predilection to start journeys from their preferred station and to
return bikes to their preferred destination station. They started 51% of their journeys from their
preferred origin station and they finished 49% of their journeys in their preferred destination. In
addition to this, these users were not really willing to use a lot of different stations during 2014. Each
user in this cluster started on average at least one journey from 12 different stations whereas for
instance, Cluster Registered 1 users started trips from an average of 18 different stations that year.
Cluster Registered 2 users are the scheme’s customers who prefer to make the least rentals during
the weekend as they just make just 4.8% of their total rentals on Saturday and Sundays. Figure 3.3.1
shows how centralised the usage of stations these users make is, with their preferred origin stations
located at Waterloo, Kings’ Cross and Liverpool Street.

STAR 2016
Eduardo Martin Moral
Page 10
Figure 3.3.1: Most used Start Stations – Cluster Registered 2
Taking into account all of the above it is possible to classify these users as users who mainly take
SCS bikes in combination to other modes of public transport such as rail – hence commuters
Cluster Registered 3 – Scheme enthusiasts:
This cluster is comprised of 6,243 users. These users made 2,268,066 rentals during 2014 (i.e. 30%
of total scheme’s rentals). This cluster is the smallest one comprised of registered users. The user
behaviour in this group is quite similar to that in Cluster Registered 1. They make similar usage of their
preferred stations as they start and end about 30% of their rentals in those stations. They are
customers who do not like to make rentals during peak hours to the same extent as Multimodal
Commuters do. Nonetheless, these sort of registered users make more rentals between 7-9 am than
users from the first group but less in comparison to the users in Cluster Registered 2 as they make the
17% of their rentals in the morning peak. However, the most remarkable characteristic that make
users from Cluster Registered 3 different from users in the first sub-cluster of registered users is that
they were much more active customers. In fact, these users were the most active type of scheme
users as they made on average 363 rentals per year and user. In addition to this enthusiast behaviour,
users in this cluster were also the registered users who chose more different stations for starting their
journeys. These users made on average at least one rental from 53 different stations whereas Post-
contemplators and Multimodal Commuters made at least one rental from 18 and 12 different stations
respectively. However, these users tend to focus the majority of their rentals in the north-east area of
London.
Cluster Non-Registered 1 – Weekend widespread users:
This cluster is comprised of 25,474 users. These users made 649,977 rentals during 2014 (i.e. 9% of
total scheme’s rentals). Each user in this cluster made on average 26 rentals during 2014. User
behaviour in this cluster differs from the other non-registered users´ behaviour mainly in two
characteristics. These users make longer trips and they tend to make trips from a considerable
amount of different stations. Users from this cluster cycled around 20 minutes per rental and each
user in this cluster chose on average 13 different stations during the year to pick up the bikes. In
addition to this, these users do not show a clear preference for determined stations neither to pick nor
return the bikes. Furthermore, these users are not willing to do many trips in the peak hours as they
just make 7.7% of their journeys during those periods of time when the overall degree of usage of the
scheme is higher. These users are one of the groups of customers that most prefer to make rentals
during the weekends. These users made 47.7% of their weekly rentals on Saturdays and Sundays. In
addition to this, this sort of user does not show a clear preference for determined stations as they
make a balanced usage of stations in comparison to the rest of non-registered users.

STAR 2016
Eduardo Martin Moral
Page 11
Cluster Non-Registered 2 – Irregular Commuters:
This cluster is comprised of 17,903 users. These users made 691,846 rentals during 2014 (i.e. 9% of
total scheme’s rentals). These users are the non-registered users who made the greatest amount of
rentals per year (113 rentals per user) and they also were the sort of non-registered users who started
at least one journey from the greatest amount of different stations (28 stations per user during 2014).
They made almost the same proportion of their rentals during both morning and afternoon peak hours
(10% and 11% respectively). However, they tend to make shorter rentals than any other type of non-
registered users. This type of user cycled on average 16 minutes per rental and showed a similar
behaviour regarding the proportion of rentals made per hour and weekday in comparison to the users’
behaviour in Cluster Registered 1. These users make 25% of their total amount of rentals during the
weekend whereas users that comprise Cluster Registered 1 make the 21.5% of their rentals during
weekends. Thus, it is reasonable to think that a high proportion of Cluster Registered 1 users were
Cluster Non-Registered 2 users before they registered.
Cluster Non-Registered 3 - Casual Afternoon Commuters:
This cluster is comprised of 11,976 users. These users made 265,717 rentals during 2014 (i.e. 4% of
total scheme’s rentals). This cluster is comprised of users who were not very active during 2014 as
they just made around 22 rentals each user that year with an average duration similar to Cluster Non-
Registered 1 (i.e. Weekend widespread users) user rental duration. Their rental average duration was
equal to 20 minutes. Although they choose fewer amounts of different stations to start their journeys
than users in Cluster Non-Registered 2 (i.e. Irregular Commuters), this sort of users most noticeable
characteristic is that they like to make trips during the afternoon peak. They made 27% of their rentals
during that peak. However, they do not make the same proportion of rentals during the morning peak
as they only make 3% of their total amount of rentals from 7 to 9 am in the morning. This cluster is one
of the non-registered groups that least preferred to cycle in the weekend as they made just 17.9% of
their total bikes pick-ups during the weekends - as stated before they prefer to rent bikes during the
working days’ afternoon peak hours when they make the 26.7% of their total amount of rentals.
Cluster Non-Registered 4 - Weekend Recreational Users:
This cluster is comprised of 9,169 users. These users made 91,661 rentals during 2014 (i.e. 1% of
total scheme’s rentals). Users in this cluster were the non-registered users who made the fewest
amount of rentals during 2014 (19 rentals) but those rentals were on average outstandingly long
rentals (50 minutes). This means that the vast majority of users in this cluster had to pay the fare for
cycling more than 30 minutes per rental. In addition to this, this type of non-registered user was the
group of users who least preferred to rent bikes during the morning peak (2% of their total rentals) as
well as being the users who started to cycle from the fewest amounts of different stations.
Nonetheless, as Figure 3.3.2 shows the origin stations that these users choose tend to be located
near Kensington Gardens and Hyde Park. These aesthetically pleasant locations are normally used as
recreational areas where visitors can participate in several activities including open water swimming,
boating, cycling, tennis and horse riding (The Royal Parks, 2016). Subsequently, these users can be
classified as Weekend Recreational Users.

STAR 2016
Eduardo Martin Moral
Page 12
Figure 3.3.2: Most used Start Stations – Cluster Non-Registered 4
Cluster Non-Registered 5 - Flexible Commuters & Weekend:
This cluster is comprised of 6,101 users. These users made 430,943 rentals during 2014 (i.e. 6% of
total scheme’s rentals). These users made on average shorter rentals (17 minutes) and used fewer
amounts of different stations (8 bike stations) than users in Cluster Non-Registered 1 (i.e. Weekend
widespread users). As users from previous clusters do, they do not centralise their rentals in the peak
hours as they made just 7.7% of their rentals during peak hours. However, the most remarkable
characteristic of this group of users is that they have a clear preference for renting a noticeable
amount of bikes from their preferred origin stations (42% of total rentals) as well as returning a similar
proportion of bikes to their preferred destination station (40% of total rentals). These users make
widespread usage of stations but they tend to make greater usage of those stations located in the
west of London. Cluster Non-Registered 5 users show a remarkable flexibility when making trips
around peak hours. Whereas other groups of users tend to focus the rentals they made in the morning
and afternoon in just one hour (i.e. 8-9 am & 6-7 pm), users in Cluster Non-Registered 5 make the
same proportion of trips more temporally distributed during the day.
Cluster Non-Registered 6 - Casual Morning Commuters:
This cluster is comprised of 4,866 users. These users made 274,975 rentals during 2014 (i.e. 4% of
total scheme’s rentals). Each user in this cluster made on average 30 rentals with an average duration
equal to 17 minutes. These non-registered users are the users who made the greatest proportion of
rentals during the morning peak hours (36% of their total rentals). On the other hand, they made less
than the half of the rentals they made in the morning peak hours between 4-6 pm (12% of their total
rentals). Furthermore, this sort of user are the non-registered users who made the greatest proportion
of rentals from their preferred station (44% of their total rentals) and they returned more than the 40%
of the bikes they rented in their preferred destination station. These users are the group of non-
registered customers that make the lowest proportion of rentals during the weekend (13.3%).
However, they are not the category of the SCS users who make the least proportion of rentals during
the weekend due to Cluster Registered 2 Users (i.e. Multimodal commuters) making only 4.82% of
their rentals during the weekend. Thus, Cluster Non-Registered 6 users mainly use the scheme to
casually commute in the morning peak hours.
To conclude, the following figure (Figure 3.3.3) summarises the results of this research. This figure
shows the proportion of the total amount of users that comprise the different clusters as well as the
proportion of the total rentals made in London by each category of users. It is possible to see that in
SCS that there are categories of users such as scheme enthusiasts where although it is comprised of
only 6,243 single users the rentals made by this group comprised 30% of the total scheme rentals

STAR 2016
Eduardo Martin Moral
Page 13
made during 2014. On the other hand, there is a cluster comprised of 6,101 single users (Cluster Non-
Registered 5 – Flexible Commuters and Weekend) which is highly similar to the previous cluster in
terms of number of users. However, these non-registered users were one of the clusters with least
importance in the scheme in comparison to the rest of clusters as they made just 6% of the total
amount of rentals. In addition to this, there are two clusters that together comprised 50% of the rentals
made in London and further, there are two clusters (i.e. Multimodal Commuters and Scheme
Enthusiasts) comprised only by registered users and although they made more than 4.5 million rentals
during 2014, these rentals were made just by 17,986 users.
Figure 3.3.3: Users´ categorization and importance in terms of rentals made
Thus, although these schemes are used by a lot of different people, SCS is sustained mainly by
17,986 users. Subsequently, the authority in charge of the scheme must analyse to a greater extent
these users´ preferences if they wish to avoid them using other modes of transport to make their
journeys as the utility in understanding what makes these customers use the scheme to such a high
extent.
4 Conclusions
In this research, we analyse a database concerning 112,733 single users of the SC scheme. 37,272
(33%) users are registered in the scheme. These users are more active since they make a 67% of the
total amount of rentals. Thus, the overall usage of the scheme is more influenced by the usage
registered users make.
Rental duration it is highly dependent on the type of membership. Registered users preferred to make
shorter journeys (13 minutes) and non-registered users cycle more time per rental (19 minutes).
Registered and non-registered users also behave in different ways in terms of the amount of bike
rentals made per user and day: Registered users make an average of 2.17 rentals per day whereas
non-registered users make 1.83.
In working days registered users make more hires (73%) than non-registered users (27%). Registered
users make 42% of their daily rentals in morning and afternoon peak hours (i.e. 7-9am & 4-6pm). Non-
registered users do not focus the rentals they make during peak hours to the same extent registered
0%
5%
10%
15%
20%
25%
30%
35%% Users % Rentals

STAR 2016
Eduardo Martin Moral
Page 14
users do. Non-registered users make 28% of their daily rentals in morning and afternoon peak hours.
However, during the weekend registered users and non-registered users make a more balanced
usage of the scheme as they make 50.19% and 49.81% of rentals respectively. The only difference
between the rentals’ distribution both types of user show during the weekends is that registered users
tend to cycle earlier in the morning. During the weekends, registered users make 80% of their total
daily rentals between 7am to 8pm whereas non-registered users make the same proportion of rentals
(i.e. 80%) between 8am to 9pm.
Rentals of registered users are focused around a smaller number of stations (most of them located
close to important public transport stations) whereas non-registered users make a more balanced
usage of stations. The average number of different journey start station per user is 15. Bike stations
located close to public transport stations (i.e. underground and/or railway) show greater usage and
stations located close to aesthetically pleasant locations (e.g. Hyde Park) are those stations used by
the greatest amount of different single users. The analysis of user behaviours in terms of spatial
distribution has confirmed that if any incident occurs that might cause an important bike station to run
out of service (e.g. Kings Cross station, Waterloo Station), this will affect registered users to a greater
extent due to non-registered users show a more flexible behaviour when choosing stations to start
their journeys.
In this research, a cluster analysis is implemented to identify market segments in the SCS. This
approach finds that the main difference between users is the users’ sort of membership. Therefore, it
is possible to conclude that registered users’ travel behaviours are different from non-registered users’
behaviours, thus the differences between these two groups are greater than the similarities between
them. By further clustering members of each of these two groups, 3 different sub-clusters inside the
registered users’ main cluster are detected and 6 different sub-clusters inside the non-registered
users’ main cluster. A noticeable difference between sub-clusters is that non-registered users show
more different travel behaviours between them than registered users. For instance, there are groups
of non-registered users that prefer to make rentals in the peak hours of working days whereas others
focus their rentals at the weekends. On the other hand, registered users make a more regular usage
of the scheme in terms of proportion of rentals made per day and hour. In fact, all registered user
clusters make the majority of their rentals during working days’ peak hours. However, these uses have
differences between them such as the amount of rentals made per user and/or the amount of different
stations chosen to pick the bikes.
The results of our research may be useful to increase the patronage of the system and provide a
better, more personalised service.
One cluster of non-registered users (Irregular Commuters, 17,903 single users) has a behaviour
similar to registered users’ one: they make relatively short rentals (16 minutes) focusing their bike
pick-ups within the peak hours. Thus, the scheme owner may wish to target this cluster of users to
invite them to become registered users, given that registered users tend to be more active. A more
detailed analysis of registered and non-registered users with the same behaviour may help
understanding the drivers of the service usage.
Once the cluster of each user has been identified, it is possible to give customers a more personalised
treatment. For instance, for clusters of users who do not show a clear preference for finishing their
trips in determined stations (e.g. Weekend Widespread Users) discounts could be offered to avoid
returning bikes to highly used stations such as Waterloo Station. This could be communicated to the
user by displaying a message on the stations’ screen when these users are unlocking a bike.
5 References
Bagchi.M, Davies.S, White.P (2003). “Use of public transport smart card data for understanding travel
behaviour”.

STAR 2016
Eduardo Martin Moral
Page 15
Contardo,C, Morency,C and Rousseau,L (2012), Balancing a Dynamic Public Bike-Sharing System,
Departament of Mathematics and Industrial Engineering, École Polytechnique de Montréal, p.1-27.
Daily Mail Reporter, (2012). Forget the 9 to 5: Brits now arrive at the office for 8.09am and leave at
5.22pm. Available: http://www.dailymail.co.uk/news/article-2082955/Forget-9-5-Brits-arrive-office-8-
09am-leave-5-22pm.html. Last accessed 24 Jan 2015.
Dell, (2015). Cluster Analysis - Statistics Textbook. [online] Available at:
http://documents.software.dell.com/Statistics/Textbook/Cluster-Analysis [Accessed 25 Jan. 2016].
DeMaio,P (2009), Bike-sharing: History, Impacts, Models of Provision, and Future, Journal of Public
Transportation, Volume 12, p.41-56.
Doganaksoy,N, and Hahn,G, (2009). Data Mining: A Gateway to Better Data Gathering. Statistical
Analysis Data Mining, 1(4), pp.280-283.
Midgley.P (2011), Bicycle-Sharing schemes: Enhancing Sustainable Mobility in Urban Areas,
Commission on Sustainable Development, 19th Session.
Shaheen.S, Guzman.S, Zhang.H (2010), Bike sharing in Europe, the Americas and Asia: Past,
Present and Future, Washington D.C.: Transportation Research Board Annual Meeting.
The Royal Parks, (2016). Hyde Park. [online] Available at: https://www.royalparks.org.uk/parks/hyde-
park [Accessed 11 Jan. 2016].
Vogel.P, Greiser.T, Mattfeld.D, (2011), Understanding Bike-Sharing Systems using Data Mining:
Exploring Activity Patterns, Procedia Social and Behavioral Sciences, Volume 20, p.514-523.
Wilkie.C, 2010. “Smart ticketing on public transport”, Tourism & Transport Forum (TTM) Position
Paper. P.2-14.
Zhao.J, Deng.W, Song.Y (2014), Ridership and effectiveness of bike sharing: The effects of urban
features and system characteristics on daily use and turnover rate of public bikes in China, Transport
Policy, Volume 35, pp.253-264.
Acknowledgements
This paper summarises the results of my MEng dissertation at Edinburgh Napier University. I would
like to acknowledge the input to the research of my supervisors Achille Fonzone and Kathryn Stewart.
I express my sincere gratitude to Transport for London and in particular to George Simpson, Katherine
Trill and Helen Sharp for providing data, information and useful comments. I thank also the
Transportation Research Institute of Edinburgh Napier University, which has funded my participation in
the STAR conference.


![Moral Realism, Moral Relativism, Moral Rules [Oddie]](https://static.fdocuments.in/doc/165x107/577cd1091a28ab9e78937559/moral-realism-moral-relativism-moral-rules-oddie.jpg)