Stanisław J. Dubiel*, Mirosław Rzyczniak*, Marek L...
10
375 AGH DRILLING, OIL, GAS Vol. 34 No. 2 2017 * AGH University of Science and Technology, Faculty of Drilling, Oil and Gas, Krakow, Poland ** The paper was carried out under the Statutory Research at the Faculty of Drilling, Oil and Gas, AGH University of Science and Technology, financed from the funds of the Polish Ministry of Science and Higher Education. Agreement 11.11.190.555 http://dx.doi.org/10.7494/drill.2017.34.2.375 Stanisław J. Dubiel*, Mirosław Rzyczniak*, Marek L. Solecki*, Michał Maruta* ANALYSIS OF DRILL STEM TEST (DST) RESULTS AT OSOBNICA OIL FIELD, IN TERMS OF SAMPLING OF SELECTED TECHNOLOGY PARAMETERS** Nomenclature DST – Drill Stem Test, n.o. – barefoot segment of the well, S – skin-effect [±], p – average pressure [MPa], x f – half the length of fracture [m], k – effective permeability of matrix + fracture system [mD], h – thickness [m], p* – initial pressure [MPa], R b – radius of the investigation during test [m], L – distance from the well to boundary [m], t 1 , t 2 – time of first and second period of the inflow [min], Δt 1 , Δt 2 – time of first and second build-up of the bottom pressure [min], ε – hydraulic conductivity [(m 3 /Pa)·s·10 –12 ], W f – actual productivity [(m 3 /h)/MPa·10 –7 ].
-
Upload
dinhnguyet -
Category
Documents
-
view
217 -
download
3
Transcript of Stanisław J. Dubiel*, Mirosław Rzyczniak*, Marek L...

375
����������������� � �� �������� �� ����� �� ����
* AGH University of Science and Technology, Faculty of Drilling, Oil and Gas, Krakow, Poland** The paper was carried out under the Statutory Research at the Faculty of Drilling, Oil and Gas,
AGH University of Science and Technology, financed from the funds of the Polish Ministryof Science and Higher Education. Agreement 11.11.190.555
http://dx.doi.org/10.7494/drill.2017.34.2.375
Stanisław J. Dubiel*, Mirosław Rzyczniak*,Marek L. Solecki*, Michał Maruta*
ANALYSIS OF DRILL STEM TEST (DST) RESULTSAT OSOBNICA OIL FIELD, IN TERMS OF SAMPLING
OF SELECTED TECHNOLOGY PARAMETERS**
Nomenclature
DST – Drill Stem Test,
n.o. – barefoot segment of the well,
S – skin-effect [±],
p – average pressure [MPa],
xf – half the length of fracture [m],
k – effective permeability of matrix + fracture system [mD],
h – thickness [m],
p* – initial pressure [MPa],
Rb – radius of the investigation during test [m],
L – distance from the well to boundary [m],
t1, t2 – time of first and second period of the inflow [min],
Δt1, Δt2 – time of first and second build-up of the bottom pressure [min],
ε – hydraulic conductivity [(m3/Pa)·s·10–12],
Wf – actual productivity [(m3/h)/MPa·10–7].

376
1. INTRODUCTION
Polish Outer Carpathians are still prospective zone of hydrocarbon exploration,where��������������������� ���� ������������������������������� are important andform anticlinal traps for hydrocarbons. In these horizons many oil and gas fields havebeen discovered in the second half of the twentieth century, i.e., Osobnica oil and gasfield. Both already discovered accumulations of hydrocarbons, as well as the newlydrilled Paleocene sandstone intervals in the late twentieth century, typed by well-loggingto DST tests, are perspective horizons of favorable reservoir parameters. Reservoir testsof these strata made by tube sampler (DST) at the end of the twentieth century providedmany reliable information reservoir on which the important decisions in the field of geo-logical exploration and production have been made. The credibility of DST dependslargely on used technology. Finally, based on the results of DST there can be estimatedcommercial value of these horizons. In addition, analysis of the interpretation of DST,especially, charts of the reconstruction of the bottom pressure by traditional Hornermethod (semi-logarithmic system) and modern “log-log” method (double logarithmicsystem) allows, according to the authors, demonstrate not only the relationship betweenobtained test curves shapes with occurring conditions resource properties, but also withthe technological parameters.
In the Polish Oil and Gas Company most commonly two-cycled DST are used, whichin the case of high gas, oil or reservoir water inflow, allow an assessment of:
– the value of relaxation effect of tested horizon to the repression of head pressureof the mud in the hole.
– changes in reservoir parameters defined by Horner method based on the resultsof I and II cycle of DST;
– changes in the permeability of reservoir rocks in the near and further zone of the wellin the area of research within the probe;
– reservoir conditions and the number and shape of the boundaries of the reservoir,using the log-log method.
This paper presents the results of analysis and reinterpretation of data from thethree tests deposit DST: 1/98; 2/98 and 4/98, made in two wells O-139 and O-141, charac-terized by varying degrees of credibility.
2. GEOLOGICAL SETTING OF OSOBNICA OIL FIELD
The Osobnica oil field was discovered in 1953 [10] and it’s accumulated withinthe Bóbrka-Osobnica Fold and which is localized in Silesian Nappe of Polish OuterCarpathians (Fig. 1). The Osobnica structure is a sliced brachyantycline, whis is cut intoblocks by some disclocations. Oil is accumulated mostly in the southern limb of anticline,

377
whereas the northern one is reduced. The Osobnica structure is composed of the Istebna(Czarnorzeki) Beds and three horizons of the Ciężkowice Sandstones separated byMottled Shales. Most productive is Horizon III of Ciężkowice Sandstone, then UpperCretaceous Istebna Sandstone and Horizon II of Ciężkowice Sandstone. The lithologicalseal is made by the Istebna Shales and three layers of Eocene Mottled Shales [7, 8].
Fig. 1. The study area on the background of a map of geological unitsof the Western Carpathians (after [11, 12]), a study area marked by black rectangle
3. ANALYSIS OF DST CHARTS FOR THE EFFECT OF RELIEVINGTHE STUDIED RESERVOIR HORIZONS
Pressure charts during the DST (Figs 2, 3 and 4) have been recorded using mecha-nical pressure gauges type AK-1 and K-3 manufactured by Kuster, installed in sets of prob-ing made by Halliburton, model Standard 5". During the drilling of analyzed reservoirhorizons, high pressures of hydrostatic mud column were used, due to applying too highdensity of a drilling fluid in comparison to the reservoir pressure gradient (Tab. 1).

378
Fig. 2. Pressure chart registered during the test no. 1/98 of Paleocene strata (1621–1673 m)in the well O-139. A – drilling mud hydrostatic pressure in the well; A-B – run in hole,
B-C – I inflow period, D-E – I build-up period, F-G – II inflow period,H-M – II build-up period
Fig. 3. Pressure chart registered during the test no. 2/98 of Istebna beds (1385–1428 m)in the well O-139. A – drilling mud hydrostatic pressure in the well; A-B – run in hole,
B-C – I inflow period, D-E – I build-up period, F-G – II inflow period,H-M – II build-up period

379
Fig. 4. Pressure chart registered during the test no. 4/98 of Eocene strata(III Ciężkowice sandstone) (602–620 m) in the well O-141. A – drilling mud hydrostaticpressure in the well; A-B – run in hole, B-C – I inflow period, D-E – I build-up period,
F-G – II inflow period, H-M – II build-up period
It should be noted, that under dynamic conditions (mud circulation in a wellbore,drilling, plunging drilling pipes) the bottom hole pressure increase by about 10�� [1, 2].
The pressure difference (pE – pM) between points E and M at build-up pressurecharts I and II (Figs 2, 3 and 4, and Tab. 1) can be an estimated measure of the effectof relieving of the horizon and mud pressure. The Table 1 indicates that the pressuredifferences from the tests 1/98 and 2/98 have a relatively large value, therefore morereliable reservoir parameters are obtained based on the results of the second cycle ofanalyzed DST.
Calculations show (Tab. 1), that the most favorable technological conditions fordrilling of reservoir rocks and their sampling occurred in the well O-141, Test No. 4/98:
– minimum build-up pressure difference (less than 0.01 MPa);– a preferred value of the depression to repression pressure ratio (greater than 3).
Much worse technological conditions occurred in the well O-139 (1/98 and 2/98):
– very large build-up pressure difference (greater than 0.1 MPa);– a very unfavorable value of the depression to repression pressure ratio (much
less than 3).
These technological conditions could significantly affect to the too little flow ofreservoir fluid to the sampling probe.

380
By analyzing the ratios of sampling times (Tab. 1) it is clear that they point to pro-vide very good conditions for the registration of easily interpreted pressure charts ina semi-log and log-log systems.
Table 1
Data list of technical and technological parametersfrom DST tests in wells O-139 and O-141
Well No., Test No. O-139, 1/98 O-139, 2/98 O-141, 4/98
1 Stratigraphy Paleocene Paleocene Eocene
2 Sampled interval [m] 1 673–1 620
n.o. 1 385–1 428
n.o. 602–620
n.o.
3 Well dimension [m] 0.216 0.216 0.216
4 Gauge depth [m] 1 615 2 805 580
5 The density of the drilling mud during drilling of reservoir rocks [kg/m3]
1 300 1 292 1 125
6 The time from drilling to testing [day]
30 33 1
7 The height of the water wads column [m] 904 806 20
Time of I inflow test [min] 14.3 14.0 25
Time of II inflow test [min] 64.2 57.9 207.3
t2 /t1 [1] 4.48 4.13 8.29
Time of I build-up test [min] 30.1 29.5 136.7
Time of II build-up test [min] 80.4 75.9 302.7
8 DST time
Δt2 /Δt1 [1] 2.67 2.57 2.21
hydrostatic pressure of the drilling mud on the reservoir horizon [MPa]
20.34 17.65 6.40
Repression of pressure on the reservoir horizon [MPa]
4.21 4.54 1.47
pE – pM [MPa] 0.68 0.73 0.05
The initial pressure depression during sampling [MPa]
7.26 5.05 4.645
9 Pressure values
the ratio of pressure depression and repression [1]
1.72 1.11 3.16

381
4. RATING OF COMMERCIAL OF EXAMINED LEVELSBASED ON THE RESULTS OF I AND II CYCLE OF DST
In order to assess of commercial of tested horizons, the reservoir parameters weredetermined by the Horner method based on the data from cycle I and II (Tab. 2). It wasobserved, that:
Test 1/98 – flow of mud gasified by gas to probe is ambiguous result (Tab. 1), but isthe basis for a decision to intensify the flow of reservoir fluid, especiallyin the case of high variability skin-effect and normal reservoir pressuregradient (Tab. 2) [6].
Test 2/98 – hydraulic conductivity values ε1 and ε2 > 10·10–12m3/Pa·s and perme-ability k1 and k2 > 1 mD, and the ratio of actual productivity Wf1
and Wf2 > 10–1 (m3/h)/MPa (Tab. 2) demonstrate the commercial valueof examined oil-bearing horizon [5]. In addition, during DST of I and II,another fall in the value of skin-effect S1 > S2 shows declogging ofreservoir rocks studied by probe Rb2 = 6,6 m [3].
Test 4/98 – the flow of 1.5 m3 of drilling mud slightly gasified by combustible gaswith traces of oil and the fact that in a sample of fluid, there was notreservoir water [4], is the basis for decisions about necessity of treatmentof flow intensification of fluid reservoir. In addition, changes in theskin-effect and hydraulic conductivity, permeability and productivity,determined on the basis of the interpretation of the results of DSTcycles I and II (Tab. 2) demonstrate declogging of reservoir rocks inthe zone studied by probe with a significant radius of about Rb2 = 47 m.Thus, the sandstone horizon in the well O-141 should be consideredas perspective.
The conditions of the tested reservoir horizons, the number and shape of the bound-aries of horizons were evaluated using the log-log (Figs 5 and 6) method by Saphir 202Bprogram [4, 9], with the following results:
Well O-139, test No. 2/98:
– homogeneous structure of reservoir horizon;– well connected with unlimited conductivity fracture (1/2 length Xf = 6.43 m);– in the area of reservoir horizon there is no fault (boundary).
Well O-141, test No. 4/98:
– homogeneous structure of reservoir horizon;– well connected with unlimited conductivity fracture (1/2 length Xf = 8.93 m);– in the zone of reservoir horizon tested by probe has been identified one rectilinear
sealed fault in distance L = 40 m from the well.
382
Table 2
List of calculated reservoir parameters in wells O-139 and O-141 based on DST tests results
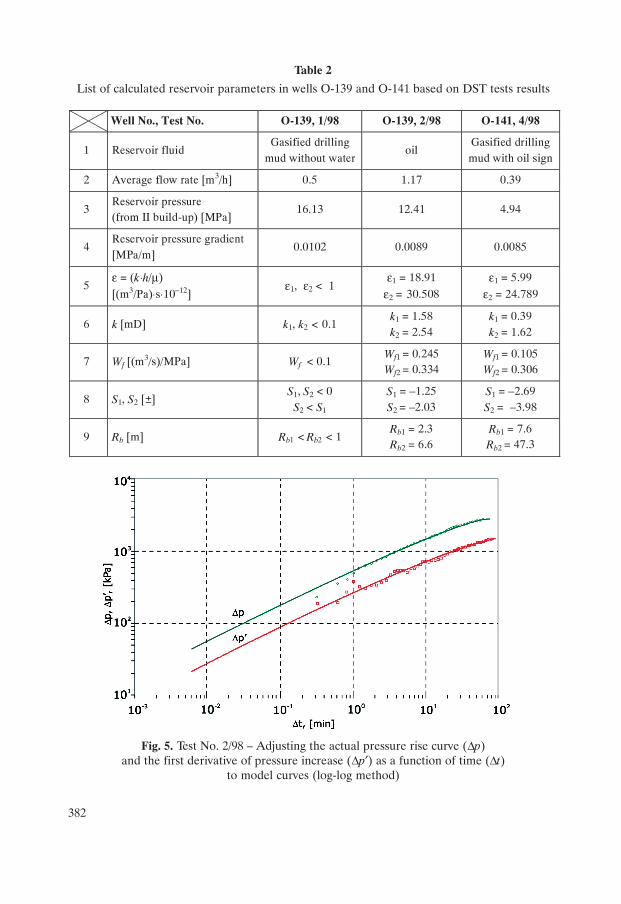
Fig. 5. Test No. 2/98 – Adjusting the actual pressure rise curve (Δp)and the first derivative of pressure increase (Δp′) as a function of time (Δt)
to model curves (log-log method)
Well No., Test No. O-139, 1/98 O-139, 2/98 O-141, 4/98
1 Reservoir fluid Gasified drilling
mud without water oil
Gasified drilling mud with oil sign
2 Average flow rate [m3/h] 0.5 1.17 0.39
3 Reservoir pressure (from II build-up) [MPa]
16.13 12.41 4.94
4 Reservoir pressure gradient [MPa/m]
0.0102 0.0089 0.0085
5 ε = (k⋅h/μ)
[(m3/Pa)⋅s⋅10–12] ε1, ε2 < 1
ε1 = 18.91
ε2 = 30.508 ε1 = 5.99
ε2 = 24.789
6 k [mD] k1, k2 < 0.1 k1 = 1.58 k2 = 2.54
k1 = 0.39 k2 = 1.62
7 Wf [(m3/s)/MPa] Wf < 0.1
Wf1 = 0.245 Wf2 = 0.334
Wf1 = 0.105 Wf2 = 0.306
8 S1, S2 [±] S1, S2 < 0
S2 < S1 S1 = –1.25 S2 = –2.03
S1 = –2.69 S2 = –3.98
9 Rb [m] Rb1 < Rb2 < 1 Rb1 = 2.3 Rb2 = 6.6
Rb1 = 7.6 Rb2 = 47.3
383
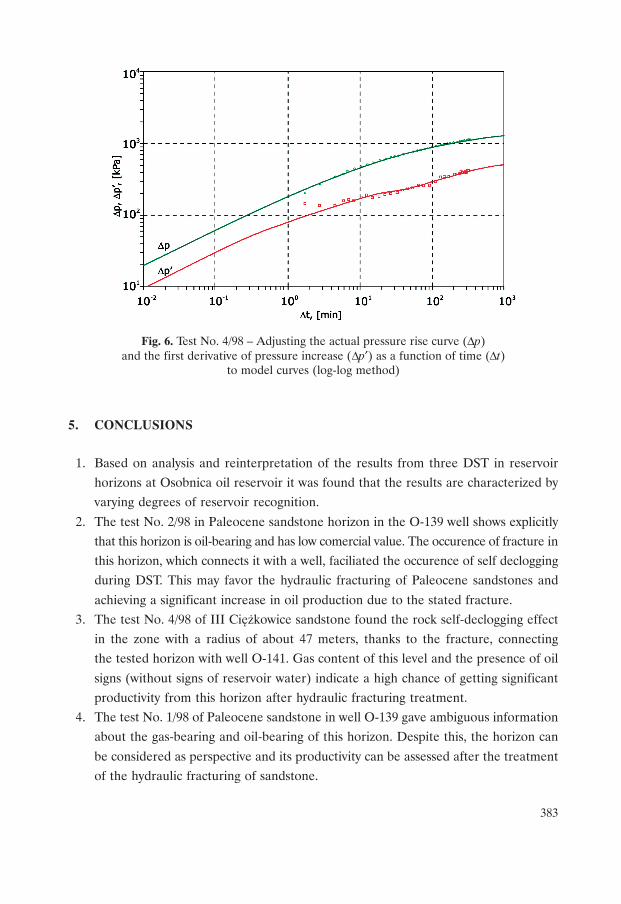
Fig. 6. Test No. 4/98 – Adjusting the actual pressure rise curve (Δp)and the first derivative of pressure increase (Δp′) as a function of time (Δt)
to model curves (log-log method)
5. CONCLUSIONS
1. Based on analysis and reinterpretation of the results from three DST in reservoirhorizons at Osobnica oil reservoir it was found that the results are characterized byvarying degrees of reservoir recognition.
2. The test No. 2/98 in Paleocene sandstone horizon in the O-139 well shows explicitlythat this horizon is oil-bearing and has low comercial value. The occurence of fracture inthis horizon, which connects it with a well, faciliated the occurence of self decloggingduring DST. This may favor the hydraulic fracturing of Paleocene sandstones and
achieving a significant increase in oil production due to the stated fracture.3. The test No. 4/98 of III Ciężkowice sandstone found the rock self-declogging effect
in the zone with a radius of about 47 meters, thanks to the fracture, connectingthe tested horizon with well O-141. Gas content of this level and the presence of oil
signs (without signs of reservoir water) indicate a high chance of getting significantproductivity from this horizon after hydraulic fracturing treatment.
4. The test No. 1/98 of Paleocene sandstone in well O-139 gave ambiguous informationabout the gas-bearing and oil-bearing of this horizon. Despite this, the horizon can
be considered as perspective and its productivity can be assessed after the treatmentof the hydraulic fracturing of sandstone.

384
REFERENCES
[1] Dubiel S., Chrząszcz W., Rzyczniak M.: Problemy dowiercania warstw perspektywicz-nych w otworach naftowych. Uczelniane Wydawnictwa Naukowo-Dydaktyczne AGH,Kraków 2001.
[2] Dubiel S., Chrząszcz W., Rzyczniak M.: Problemy opróbowania warstw perspe-ktywicznych rurowymi próbnikami złoża. Uczelniane Wydawnictwa Naukowo--Dydaktyczne AGH, Kraków 2003.
[3] Dubiel S., Rychlicki S.: The results of double-cycle drill stem test DST of the Malmcarbonate rocks of the Carpathian Foredeep. AGH Drilling, Oil, Gas, vol. 29, No. 2,2012, pp. 367–373.
[4] Dubiel S., Rzyczniak M., Chrząszcz W., Wójtowicz T., Nowakowski Z., Kułaga T.:Analiza i interpretacja wyników spróbowań warstw perspektywicznych rurowymipróbnikami złoża wykonywanych przez OPNiG Kraków. Praca naukowo-badawcza,WWNiG AGH, Kraków 1998.
[5] Dubiel S., Uliasz-Misiak B.: Analiza decyzji technologicznych podejmowanych w za-kresie zarządzania złożem węglowodorów przy dowiercaniu, opróbowaniu i udostęp-nianiu złóż. Przegląd Górniczy, 12, 2014, pp. 106–113.
[6] Dubiel S., Zubrzycki A., Maruta M.: Decision system model for HC explorationon the basis of DST test results. AGH Drilling, Oil, Gas, vol. 30 , No. 1, 2013,pp. 51–56.
[7] Karnkowski P.: Oil and gas deposits in Poland. The Geosynoptics Society „GEOS”,University of Mining and Metallurgy, Cracow 1999.
[8] Lis P.: Zasoby ropy naftowej w III piaskowcu ciężkowickim w złożu Osobnica (jed-nostka śląska, polskie Karpaty zewnętrzne) – uwarunkowania sedymentologiczne.Przegląd Geologiczny, 54, 7, 2006, pp. 597–604.
[9] Materiały firmy Kappa: Oprogramowanie interpretacji testów złożowych francuskiejfirmy Kappa. ZPNiG, Kraków 1993–1995.
[10] Tokarski A.: Dokumentacja złoża ropy naftowej w Osobnicy. Arch. Geonafta, Kra-ków 1955.
[11] Świerczewska A.: The interplay of the thermal and structural histories of the MaguraNappe (Outer Carpathians) in Poland and Slovakia. Mineralogica Polonica, 36 (2),2005, pp. 1–144.
[12] Żytko K., Zając R., Gucik S., Ryłko W., Oszczypko N., Garlicka I., Nemcok J.,Elias M., Mencik E., Stranik Z.: Map of the tectonic elements of the Western OuterCarpathians and their foreland 1:500 000. in: Poprawa P., Nemcok J. (red.), Geolo-gical Atlas of the Western Outer Carpathians and Their Foreland. Panstw. Inst.Geol., Warszawa 1988.