Stanislaus 2015 White Paper
13
Eric J. Barthel Sr. Vice President, HUB International Peter G. Duncan, CEBS, CLU, ChFC Executive Vice President, HUB International HUB International www.hubinternational.com Controlling Health Care Costs The County of Stanislaus’ Transition from Insurance Buyer to Healthcare Purchaser November 3, 2015
-
Upload
eric-barthel -
Category
Documents
-
view
74 -
download
0
Transcript of Stanislaus 2015 White Paper

Eric J. Barthel Sr. Vice President, HUB International
Peter G. Duncan, CEBS, CLU, ChFC Executive Vice President, HUB International
HUB International
www.hubinternational.com
Controlling Health Care CostsThe County of Stanislaus’ Transition from Insurance Buyer to Healthcare Purchaser
November 3, 2015

Page 2 HUB International
INTRODUCTION
The County of Stanislaus (the County) is in the northern part of California’s Central Valley, approximately 150 miles south of Sacramento.
The County is the largest local employer, employing approximately 3,500 people. As of 2010, the County’s total population was approximately 515,000. The County’s seat is in the city of Modesto.
Similar to most California municipalities, the County offers health benefits to eligible, full-time and part-time employees. The majority of the cost is borne by the County and is negotiated with the County’s labor groups through a collective bargaining process that covers over 90% of total employees.
Prior to 2012, the County’s employee health benefits were fully insured.
Over the 15 years (prior to 2012), coverage was provided by a large staff/integrated delivery model HMO (HP1) and another plan; the HP1 alternative, which we’ll call HP2 for the purposes of this report. The health plans that offered insured employee health benefits to County employees alongside HP1 during this period were United Healthcare, Health Plan of San Joaquin and Anthem Blue Cross.
A two benefit plan (HP1 and HP2) design is very common to California public employers. HP1 offers an integrated healthcare delivery model that includes hospitals that consistently receive “A” ratings from the Leapfrog Group for hospital safety and care quality. Another option is usually required to appeal to those that prefer another health plan or do not have access to HP1 facilities.

Page 3 HUB International
CALIFORNIA HEALTH PLANS
Health plan consolidation in California leaves six licensed commercial health plans with over 75% of all commercial membership*, all regulated by the California Department of Managed Healthcare.
With little variation among health plans, there is limited competition for care in any given community. Because of plan design, network configuration and cost sharing that obscures the real cost of care, there is little motivation for health plan members to seek out the most cost-effective care. Even less data exists regarding the quality of care.
For example, according to data collected by the Centers for Medicare and Medicaid Services (CMS) two different U.S. hospitals each deliver knee replacements to residents in their respective communities. One low-volume hospital in California officially charges $223,373 for such surgeries, while a high-volume hospital in Akron, Ohio charges just $15,465. Based on CMS data, there is very little variation in the quality of care delivered, as measured by mortality, incidence of hospital acquired infection, wrong site surgeries, etc.
Health plans in California do not give employers the necessary tools to understand the data related to their population, significantly limiting their ability to manage the cost of delivering health benefits to their population.
*Source: California Healthcare Foundation, California Health Insurers: Brink of Change – 2015
THE CHALLENGE FOR EMPLOYERS
Typically, the funding and product models favored by many employers in California (fully insured Health Maintenance Organizations, or HMOs) have met the needs of the commercial health plan market well. According to the California Healthcare Foundation, HMO participation in California for employees of large groups (> 50 employees) in 2013 is 79% (the highest in the U.S). HMO penetration remains high in California for a variety of reasons:
• High benefit levels are attractive to plan participants
• Premiums are, in most cases, lower than non-HMO plans with comparable benefits
• Medical groups and Independent Practice Associations (IPAs) are more sophisticated, and developed robust healthcare and information systems infrastructures allow them to manage care at a lower cost and with greater efficiency
Page 4 HUB International
Yet, in spite of the relative success of HMOs, there are important gaps in their models:
• Transparency
o HMOs in California provide little useful information on the cost or quality of care in their plans.
• Provider-specific outcomes data and clinical results
o Comparative analysis of the cost of care and clinical performance between network providers
o Little or no information about the health status of employees and beneficiaries covered under the plan
• Health plans will not allow employer to competitively bid for best in market services, such as:
o Pharmacy Benefit Management Services (PBMs)
o Clinical care management services
o Stop-loss or claim pooling
o Health improvement and wellness services
The one-size-fits-all approach also misses the unique characteristics of communities within their service areas. Commercial health plans are often reluctant to do anything that cannot be exported to the majority of their members, leaving employers with very few tools to help their specific populations.
STANISLAUS COUNTY EMPLOYEE BENEFIT PROGRAM
Program elements created an environment that is common to many California employers:
• With little or no information on the cost or quality of care, employers are not equipped to steer membership to plans or providers that provide greater value.
• Employers are relying on a “lower premium” as a proxy for cost of care. Employers typically develop their contributions for health benefits on the basis of the “lowest premium” plan. Premium is often used as a proxy for claim experience.
• As health insurance premiums increased, the County had limited means to determine whether or not the premiums offered by their health plans were appropriate or not. The only way to establish the cost competitiveness of a health plan was to rebid in the open market on an annual basis.
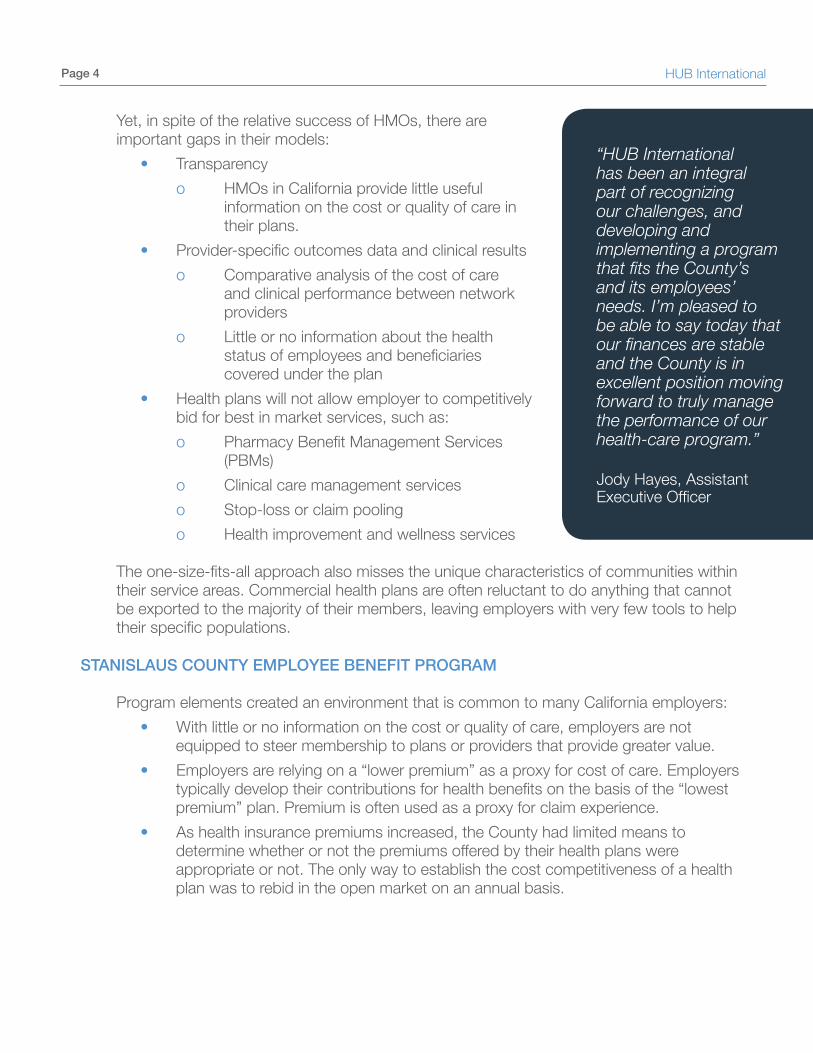
“HUB International has been an integral part of recognizing our challenges, and developing and implementing a program that fits the County’s and its employees’ needs. I’m pleased to be able to say today that our finances are stable and the County is in excellent position moving forward to truly manage the performance of our health-care program.”
Jody Hayes, Assistant Executive Officer

Page 5 HUB International
This approach yielded average annual rate increases of 11% over a 10-year period during which:
• Benefits were reduced through increased member co-payments and deductibles
• The County changed health plans three times
• No continuity of member-specific clinical data existed as members migrated to different health systems
Based on the County’s history and the challenges common to most employers, the County engaged Sidles Duncan & Associates (now wholly owned by HUB International) to evaluate their insured programs and to determine if there is an alternative to their health benefit structure.
THE EVALUATION
Evaluating an insured employer health plan can be a challenge for all the reason’s described previously.
The data provided by health plans to employers, even large employers, has proven of limited value. There are, however, elements that are universal to insured plans that were valuable in the consideration for the County.
• The County’s historical practice of bidding for fully insured contracts among multiple insurers) required underwriters to price for uncertain risk, which manifests itself in higher margin and/or risk charges and premium rates (i.e., the population underwritten is not necessarily the population to be insured in the following year).
• The inherent lack of transparency in a fully insured arrangement significantly limited the County’s ability to compare the effectiveness of its health plan vendors and insurers and to measure the cost/value relationship between what the County pays and what it receives in return.
• The insured funding mechanism includes additional rate margin through the use of “market” trend rates that typically are not specific to any one employer and can be in excess of actual trend, resulting in higher premium rates.
HP1 HP2Retention 9.00% 15.00%Capitation 17.00% 18.14%Pharmacy 9.00% 16.48%Pooling N/A 15.00%Medical 9.00% 11.36%

Page 6 HUB International
• Furthermore, the claims “lag” inherent in projecting future claims in the insured rating process further inflates the premium rates under an insured program.
HP1 HP2
Number of Months 24.0 19.0 Medical Trend Rate 9.00% 11.36% Premium Trend Rate 1 18.75% 18.48%
1 Before Loss Ratio or Experience Calculation
The County’s historical contribution strategy was designed to incent employees to the lowest premium cost plan. The “low premium plan”, however, reflects the projected future cost of the population insured under that plan in the prior year and does not therefore take into account the variances in demographics or health status between the populations insured under different plans.
As a result, participants in the “higher premium plan” were charged a differential, which was reflective of their demographic composition and health status (older and sicker) and may or may not reflect any differences in the relative efficiencies of the County’s two plans in delivering care.
This phenomenon manifests itself in the County’s demographics. HP1 had a lower premium cost than HP2, which had the older, sicker population.
2011 Demographics HP1 HP2Average Age 31.4 41.85% of Population with 1 Major Condition 14.00% 26.51%
% of Population with 2 or More Major Conditions 1.9% 14.26%
The reports from HP1 and HP2 (while not comprehensive) were useful to understand important differences in cost of care in each plan.
It is important to note that, based on reporting from HP1 and HP2, even though HP1 had lower premiums than HP2, the actual unit cost of healthcare services was higher in HP1.
Page 7 HUB International
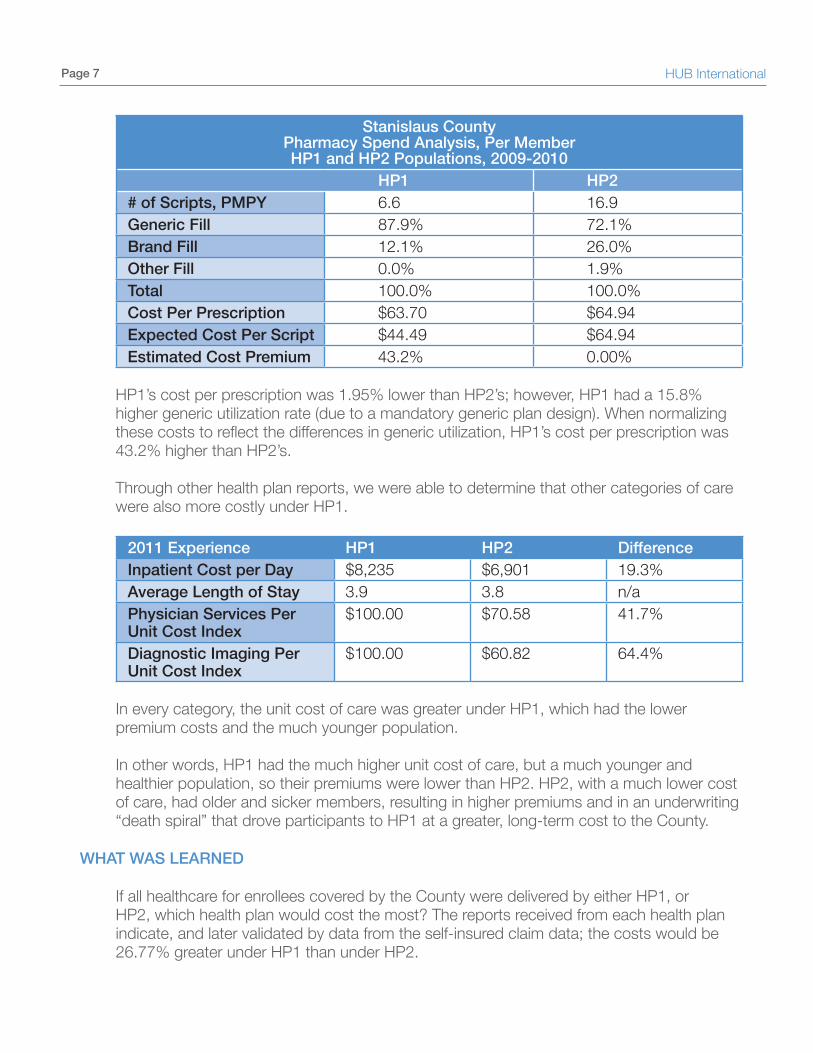
Stanislaus CountyPharmacy Spend Analysis, Per MemberHP1 and HP2 Populations, 2009-2010
HP1 HP2# of Scripts, PMPY 6.6 16.9Generic Fill 87.9% 72.1%Brand Fill 12.1% 26.0%Other Fill 0.0% 1.9%Total 100.0% 100.0%Cost Per Prescription $63.70 $64.94Expected Cost Per Script $44.49 $64.94Estimated Cost Premium 43.2% 0.00%
HP1’s cost per prescription was 1.95% lower than HP2’s; however, HP1 had a 15.8% higher generic utilization rate (due to a mandatory generic plan design). When normalizing these costs to reflect the differences in generic utilization, HP1’s cost per prescription was 43.2% higher than HP2’s.
Through other health plan reports, we were able to determine that other categories of care were also more costly under HP1.
2011 Experience HP1 HP2 Difference Inpatient Cost per Day $8,235 $6,901 19.3% Average Length of Stay 3.9 3.8 n/a Physician Services Per Unit Cost Index
$100.00 $70.58 41.7%
Diagnostic Imaging Per Unit Cost Index
$100.00 $60.82 64.4%
In every category, the unit cost of care was greater under HP1, which had the lower premium costs and the much younger population.
In other words, HP1 had the much higher unit cost of care, but a much younger and healthier population, so their premiums were lower than HP2. HP2, with a much lower cost of care, had older and sicker members, resulting in higher premiums and in an underwriting “death spiral” that drove participants to HP1 at a greater, long-term cost to the County.
WHAT WAS LEARNED
If all healthcare for enrollees covered by the County were delivered by either HP1, or HP2, which health plan would cost the most? The reports received from each health plan indicate, and later validated by data from the self-insured claim data; the costs would be 26.77% greater under HP1 than under HP2.

Page 8 HUB International
Given the significant lack of transparency under the HP1 program, continued migration of employees into HP1 (based upon the employee premium contribution formula), would actually increase, not decrease the County’s cost as the older and sicker HP2 participants began using the significantly more expensive health care services from HP1.
THE RECOMMENDATIONS
Recommendation #1The County should self-fund its health plans.
• Offer common plan design(s) to all health plans
• Reduce the administrative and risk charges associated with insured plans
• Establish greater transparency to better understand and be able to evaluate the value proposition each plan brings to the County in both financial and clinical terms
Recommendation #2The County should combine its health benefit plan offerings into a single risk pool.
• Reduce insurance charges for large claims
• Improve marketability of stop-loss program
• Establish greater predictability though creation of larger single risk pool
Recommendation #3The County should “own” and maintain independent control over financial and utilization data across all plans.
• Maintain independent control over underwriting and rate determination annually
• Independently evaluate plans offered based upon their financial and clinical performance in meeting the needs of their covered populations, not on the “premium rates” assigned to the populations they cover at any given point in time
• Maintain control over ability to change plans and strategies over time with benefit of comprehensive utilization and financial data
Recommendation #4The County should offer a selection of plans.
• Add an additional plan with duplicate plan designs and a select provider network to increase competition among health plans and healthcare systems in Modesto, to reduce healthcare plan costs currently, and to better control health care trend costs
“We experienced significant labor unrest in the process, including having to impose some of these strategy terms and conditions on our second largest bargaining unit to get the program off the ground. Ultimately, all employee groups got on board and we summited that mountain!”
Jody Hayes, Assistant Executive Officer

Page 9 HUB International
STRATEGY IMPLEMENTATION
The changes made to the County’s plans were significant:
• Moved to self-funded from fully insured
• Added a third benefit plan with a competitive provider network
• Plan pricing based on underlying cost of healthcare, not member risk selection
• Singular, unified risk, not bifurcated by plan selection
• Plan designs were normalized across all three plans A third party administrator (TPA), pharmacy benefit manager (PBM), stop-loss carrier, medical management firm and other ancillary service providers were hired
• Achieved virtually complete transparency
• County owned all plan data
THE TRANSITION EXPERIENCE
The County undertook the transition from purchasing insurance to purchasing healthcare, which included the following changes:
• The plan became self-funded after many years of being fully insured
o The County self-funded the HP1 and HP2 plans, and
o A new proprietary self-funded plan called Stanislaus County Partners in Health (SCPH) was created, based on a competitive network of hospital and physician providers that excluded the market’s most expensive healthcare delivery systems
• Fully insured equivalent rates (also known as funding factors) and employee contributions were based un underlying healthcare costs, not on underwriting characteristics of each plan
o This method of rate-setting forced each plan to compete on underlying healthcare costs and quality, not on selection-based underwriting
o Each of the three plans (HP2, HP1 and SCPH) offered identical benefit levels
o Each plan offered an HMO look-alike (an EPO) and a High-Deductible Health plan (HDHP) that included a contribution to a Healthcare Savings Account (HSA)
The scope of these changes required effective communication to the County’s 3,400 employees, and the major effort to build what would become Stanislaus County Partners in Health (SCPH).

Page 10 HUB International
The steps to develop SCPH included:
• Development of a proprietary managed care network
o Identification of the hospitals, physicians and other ancillary providers and facilities that provide high-quality healthcare and are willing to accept market-competitive fees
o Credentialing providers who were selected to participate
o Negotiate rates and execute contracts with each network provider
• Review and select (through a Request for Proposal process) vendors to perform the following functions:
o Claim processing and plan administrative services
o Pharmacy benefit management (PBM) services
o Stop-loss insurance (for individual claims exceeding $225,000 in a 12-month period)
o Medical management and population health services
o Network access to out-of-area providers for SCPH
In addition to SCPH plan-specific services, additional functions were required for total plan management:
• Development and implementation of a County’s comprehensive data warehouse for all plan claim, financial and clinical data to facilitate management decision making
o Corrective action is driven by emerging data and can be made in real-time
o Created a process and identified the appropriate tools that allowed timely distribution, review and analysis of plan data
THE FINANCIAL RESULTS
The difference between actual self-funded plan costs (using incurred) and proposed insured costs for 2012 are based on best-and-final renewal offers from HP1 and HP2. Using market-based trend increases and adding the costs associated to PPACA for insured plans and premium taxes (for the HP2 population only, HP1 is a non-profit entity and premiums are not subject to premium taxes) for 2013 and 2014 membership the County estimates is saved over $30 million, or approximately 13.1% of what the insured costs would have been for that 36-month period.
“The change has been transformational, and certainly a much bigger lift than we originally predicted.”
Jody Hayes, Assistant Executive Officer

Page 11 HUB International
THE CLINICAL RESULTS
With complete financial, clinical and administrative transparency, the County can now review and make plan decisions based on (including, but not limited to):
• Plan participant health status
• Participant clinical gaps in care
• Population disease burden
• Provider behavior
• Prescription drug utilization
• Provider prescribing patterns
• Preventative care screening
• Emerging community health issues
The County and the Plan have made decisions that have had a measurable impact in clinical outcomes.
• Significant reduction in complications from bariatric surgeries
• Reduction in hospital confinements
• Reduction in hospital readmissions
• Improved monitoring of prescription drug utilization
SUMMARY
The County wanted to find a way to reduce the average annual premium increases of 11% for its health benefit plans. It was also willing to consider a different approach that significantly reduced the influence that health plans had on the County annual program renewals and gave the County more influence and control over the management of its annual health plan expenditures.
At the beginning of the process, the County established these objectives:
• Financial and clinical transparency of all health plan-related transactions.
• “Ownership” of health plan data to provide a basis for better decision making and long-term selection and management of plan offerings.
• Creation of a competitive environment between health plans for County enrollment.
• Provision of health plan member choice based on provider choice, demonstrated quality, member service and member cost.
• Use of health plan data to evaluate health plan financial and clinical performance and improve participant health.
• Reduction in overall health plan costs to the County.
The County was able to achieve favorable results in all areas.
• The data warehouse gave the County complete financial and clinical transparency.
• The County was able to use this data to make decisions on plan benefits, network configuration and other plan elements.
Page 12 HUB International
• All plans were given the opportunity to compete on the cost and quality of healthcare, not on insured premiums.
• Members were given the opportunity to select plans based on healthcare costs, quality and other plan dimensions (except for benefit levels – all plan had identical benefits).
• Plan data was used to continuously evaluate individual and overall plan performance and to improve participant health.
• The County saved a lot of money!
As with any change of this magnitude, there can be challenges. Some of the things that created challenges for the County, its members and its consultants included:
• Predicting first-year costs when transitioning from a fully insured, “black-box” environment.
• Service for first six months with the new third party claims administrator was uneven.
• Employee anxiety over the changes.
These challenges notwithstanding, the County and participants of the plan have enjoyed significant advantages, in addition to the financial and clinical benefits listed above:
• No erosion of benefits in the form of increased cost-sharing (e.g., higher copays or deductibles) for a total of seven years. Benefits under the 2011 insured plans were maintained unchanged for the 2012-2014 collective bargaining cycle and were recently renewed for the 2015-2017 cycle).
• Total transparency of all health plan related costs.
• Flexibility – The County can reply on the advice and counsel of its consultants and vendors, but retains ultimate authority on the management of the plan.
• Positive change in engagement with all stakeholders:
o Collective bargaining groups
o County executive leadership
o Plan vendors
o Employees and dependents
o Community healthcare providers

Page 13 HUB International
TRANSPARENCY AND THE COST OF CARE
TransparencyHP1, the County of Stanislaus’ largest insurer in 2011, has the most members of any HMO in the state (approximately 7,500,000), but also has the least transparent cost structure of any health plan in California.
When the County converted its insured plan to a self-funded plan in 2012, it soon became clear that HP1’s cost structure was the highest of any plan that we had encountered. Yet, in California, many employers believe that HP1 has the lowest costs of any health plan. While their premium rates are indeed lower in many cases, in the case of Stanislaus County, it was a function of risk selection as opposed to cost structure.
The Cost of CareWithout transparency, healthcare providers, pharmacy benefit managers and insurers cannot compete for access to plan members on either cost or quality. The insured premium (or rate), intending to be a proxy for the cost of care is nothing more than a vehicle used by insurers to approximate the value of their risk and not the cost or quality of care.
THANK YOU
For More Information, Contact:
Eric BarthelSenior Vice President, Sidles Duncan & Associates, a HUB International [email protected]
Peter DuncanExecutive Vice President, Sidles Duncan & Associates, a HUB International [email protected]