STANFORD CENTER FOR INTERNATIONAL … factors contributed to globalization. ... has contributed to...
45
STANFORD CENTER FOR INTERNATIONAL DEVELOPMENT Working Paper No. 303 A Shift from Market-Driven to Institution-Driven Regionalization in East Asia by Shujiro Urata * * Waseda University Stanford University John A. and Cynthia Fry Gunn Building 366 Galvez Street | Stanford, CA | 94305-6015 November 2006
Transcript of STANFORD CENTER FOR INTERNATIONAL … factors contributed to globalization. ... has contributed to...

STANFORD CENTER FOR INTERNATIONAL DEVELOPMENT
Working Paper No. 303
A Shift from Market-Driven to Institution-Driven Regionalization in East Asia
by
Shujiro Urata*
* Waseda University
Stanford University John A. and Cynthia Fry Gunn Building
366 Galvez Street | Stanford, CA | 94305-6015
November 2006

Revised
A Shift from Market-driven to Institution-driven Regionalization in East Asia
Shujiro Urata
Waseda University
October 2006 JEL Codes: F10, F13 Keywords: multinational corporations, trade agreements, East Asia An earlier version of the paper was presented at the “Conference on Economic Policy Reform in Asia,” Stanford University, May 31 - June 3, 2006. The author is grateful to Professor T.N. Srinivasan for detailed comments.

I. Introduction The world is witnessing simultaneous development of globalization and regionalization of economic activities, although the two types of developments are seemingly contradictory to each other. Globalization of economic activities have been under way in the post WWII period, as international economic activities such as international trade and investment increased faster than domestic economic activities represented by gross domestic product (GDP). These observations can be confirmed by the following statistics. From 1990 to 2003 global GDP in nominal US dollars increased 1.7 times while global trade and foreign direct investment (FDI) increased 2.2 and 3 times, respectively, indicating increasing importance of international economic activities1. Various factors contributed to globalization. Among them important factors include unilateral trade and FDI liberalization, which has been implemented by many countries, and technological progress in communication and transportation sectors, which reduced the costs associated with international economic activities. Globalization has contributed to economic growth as it contributed to improvement of resource allocation and to technological progress. Against backdrop of globalization regionalization of economic activities has proceeded in various parts of the world including East Asia, as we will see in detail below. Regionalization generally takes two forms. One type of regionalization arises as a result of natural economic developments in that the benefits of agglomeration including economies of scope, scale, and speed outweigh the costs of agglomeration such as congestion. Indeed, rapidly growing economies in proximity interact with each other through market and non-market channels to accelerate their economic growth. The other type of regionalization involves institutional arrangement such as regional trade agreements (RTAs) including free trade agreements (FTAs) and customs unions. RTAs are discriminatory trade agreements, providing only members with preferential treatment. The former type of regionalization may be characterized as 'market-driven,' while the latter 'institution-driven.' This paper attempts to examine the changing characteristics of foreign trade in East Asia with a focus on its regional orientation. Specifically, the paper identifies the factors and mechanism behind increasing intra-regional dependence in foreign trade in East Asia. Since foreign trade and FDI are closely related, this paper analyzes them jointly. However, the main focus is foreign trade and therefore the discussions and
1 The information on global GDP and trade is obtained from World Development Indicators 2006 ‘CD-ROM), World Bank, while that on global FDI is taken from FDI database, UNCTAD.
1

analysis of FDI are limited to minimum. The structure of the paper is as follows. Section II examines the changing patterns of foreign trade in East Asia from various perspectives including geographical distribution of trading partners, commodity composition, comparative advantage, intra-industry trade and trade in parts. Section III sheds light on the factors behind the changing pattern of foreign trade focusing on the role of multinational corporations (MNCs), major promoter of FDI. Section IV discusses trade policies in East Asia with a focus on recent emergence of FTAs, which have had substantial impacts on the patterns of foreign trade and FDI. Finally, Section V presents some concluding remarks. II. Changing Pattern of Foreign Trade in East Asia2
East Asia saw remarkable changes in foreign trade patterns in recent years in terms of trading partners and commodity compositions. This section analyzes these changes and set the stage for the analysis of increasing regionalization in later sections. We begin by identifying the intensification of intra-regional trade relationship in East Asia, and then turn to analyze the changing commodity composition. An analysis of the changing patterns of comparative advantage for East Asian economies, which are reflected in the changing commodity composition, follows the analysis of commodity composition. One notable characteristic of emerging trade patterns in East Asia is the increasing importance of vertical intra-industry trade, under which parts and components are traded actively. The final two parts of this section investigate these patterns. As a main purpose of this section is to reveal emerging patterns of foreign trade in East Asia, the discussions are mainly descriptive and the discussion of the factors leading to these changes are given in later sections of the paper. II. 1. Rapid Expansion of Intra-regional Trade in East Asia
One notable characteristic of East Asian trade in recent years is the rapid expansion of intra-regional trade, that is, trade between and among East Asian economies3. This increasing importance of intra-regional trade in East Asia can be confirmed by several statistics. The share of intra-regional trade in East Asia in world trade increased from 8.2 percent in 1990 to 12.9 percent in 2004 (Table 1). Although the 2 East Asia in this paper includes ASEAN (Brunei, Cambodia, Indonesia, Lao PDR, Malaysia, Myanmar, Philippines, Singapore, Thailand, and Vietnam), China, Japan, Korea, and Taiwan, although there are some cases where some countries are excluded from the analysis because of data unavailability. 3 Many studies have identified rapid expansion of intra-regional trade in East Asia See, for example, Petri (1993), Ng and Yeats (2003), Urata (2001, 2005a), and Kawai (2005).
2

share of intra-regional trade in East Asia in world trade is greater than the corresponding share in North America, it is significantly lower compared to the share in Europe. One should be careful in comparing the level of intra-regional trade among different regions, because of the differences in the size of the countries in the regions. One should note that comparison of intra-regional trade dependency among different regions requires some caution. Europe, which includes a number of small countries with high trade dependency on neighboring countries, tends to show high intra-regional dependency.
Another indicator is the share of intra-regional trade in region’s overall trade. The share of intra-regional exports as well as imports in East Asia’s overall exports and imports increased from 39.0 and 46.9 percent in 1990 to 49.6 and 59.5 percent in 2004, respectively. These observations indicate that East Asia is a more important region as an import source rather than an export destination for East Asia. This pattern reflects the fact that East Asia plays a role of world factory, as East Asia manufactures products for the world market with the parts and components procured in East Asia4. The substantial reliance on the regions outside East Asia for East Asia’s exports reflects the open nature of regionalization in East Asia in that East Asia did not have regional trade agreements until recently except for the ASEAN Free Trade Area (AFTA). We will come back to the discussions on the nature of regionalization in a later section.
It is interesting to observe a contrasting pattern for North America, where parts are imported from outside the region to be assembled as finished products, which in turn are sold inside the region. Compared to East Asia and North America, Europe is a self-contained region, where parts are procured and assembled for the production of finished products to be sold inside the region.
The third indicator we examine is trade intensity index, which measures the “pure” intensification of trading relationship. An increase in trade with a country may be attributable to two factors. One is the expansion of trade by a trading partner and the other is “pure” intensification of the trade relationship. Specifically, trade relationship of a country with (or dependency on) a trading partner country can increase when the trading partner’s trade expands faster than other countries. Taking into account of this factor, we compute trade intensity index (definition) and its changes over time5. Trade
4 This observation on the role of East Asia as a factory of the world will be elaborated later by examining the nature of intra-regional trade in East Asia. 5 Trade intensity index is computed as (Xij / X..) / [(Xi. / X..)*(X.j / X..)], where Xij represents exports from region i to region j, and a dot (“.”) indicates the summation across all i or j. Therefore, Xi. represents total export of region i, X.j represents total import of region j, and X.. represents world total trade.
3

intensity index captures the “bias” in bilateral trade relationship by considering the trade volume of the trading partner. Trade relationship is more (less) intensive (or biased) than normal if the value of trade intensity is greater (less) than unity. According to the computed results shown in Table 1, intra-regional trade bias in East Asia declined from 1990 to 2000, but it increased from 2000 to 2004. These findings indicate that the increase in the importance of intra-regional trade for East Asia from 1990 to 2000, which is observed by the two indicators above, is due to rapid expansion of East Asia’s overall trade and not to the “pure” intensification of intra-regional trade relationship. However, the intra-regional bias increased from 2000 to 2004, which may reflect active institutionalization of regional and bilateral cooperation programs in East Asia. It may be worth noting that intra-regional trade bias increased continuously in North America, probably reflecting the establishment of regional cooperation framework such as the North American Free Trade Agreement (NAFTA).
The importance of intra-regional trade increased for most East Asian countries (Table 2). One notable exception is China, whose trade with non-East Asian countries expanded faster compared to that with East Asian countries from 1990-94 to 2000-04. Specifically, the share of East Asia for China’s overall exports and imports declined from 60.5 and 55.8 percent to 45.3 and 53.5 percent over the period under study. A large decline in the importance of intra-regional exports mirrors substantial increase in the importance of exports to the US and the EU.
Contrary to the declining trend of the importance of East Asia for China’s trade, China has become an increasingly important country for other East Asian countries in their trade relationships. The share of China for East Asia’s exports and imports increased substantially from 6.4 and 9.2 percent in 1990-94 to 11.1 and 13.8 percent in 2000-04. The increased importance of China in trade is shared by all the East Asian economies under study. Having pointed out the increased importance of China in East Asia’s trade, it should be noted that ASEAN and NIEs account for similar importance in East Asia’s trade in 2000-04. What is notable is a decline in the importance of Japan for East Asia’s trade. Indeed, the share of Japan for East Asia’s exports and imports declined from 8.6 and 16.8 percent in 1990-94 to 8.2 and 13.3 percent in 2000-04.
The contrasting patterns of changing importance of China and Japan for East Asia’s trade, that is the increasing importance of China and the declining importance of Japan, largely reflect the differences in the rates of economic growth of these two countries. For East Asia, trade with rapidly growing China expanded faster than its trade with stagnant Japan, as rapidly growing China became an increasingly important destination of East Asia’s exports as well as importance source of East Asia’s imports. It
4

should be also noted that trade liberalization as well as active FDI in China contributed to the increased position of China as a trading partner for East Asia. We will come back to these issues later.
South Asia accounts for a very small part of East Asia’s trade, especially so for its imports. The share of South Asia in East Asia’s exports amounted to 1.6 percent in 2000-04, an increase from 1.4 percent in 1990-94, while the corresponding share in East Asia’s imports remained at meager 1 percent for both periods. For India, East Asia is an important trading region, as East Asia accounts for 23.0 and 21.7 percent of India’s exports and imports in 2000-04, registering increases from 1990-94. These shares recorded for East Asia are comparable to those for its trade with the European Union (EU) and higher than those with the US. It is to be noted that similar to East Asian countries the share of China in India’s trade increased from 1990-94 to 2000-04, while the shares of Japan declined. II.2. Rapid Expansion of Machinery Trade Rapid expansion of foreign trade by East Asian economies was accompanied by substantial changes in commodity compositions from 1990-94 to 2000-04 (Table 3). The changes are especially notable for exports, among which manufactures and in particular machinery increased rapidly. Among machinery products, exports of office and telecommunication equipment and electrical machinery grew particularly fast for ASEAN, NIES and China6. For China the share of office and telecommunications equipment in its overall exports increased remarkably from 6.3 to 22.3 percent, while the share of electrical machinery increased from 4 to 10.1 percent. Many ASEAN countries with notable exception of Indonesia saw exports of office and telecommunications equipment and electrical machinery rose significantly to account for the combined share of 30-60 percent of their total exports. Among manufactured exports, textiles and garment grew relatively slowly to experience a decline in their share in total exports for East Asian developing economies, although their share is still high for China and the NIEs. This pattern can also be found for India. It is to be noted that unlike East Asian countries, India registered a low share of machinery in its exports. In contrast to these East Asian developing countries, Japan did not experience
6 For the Philippines the share of others was high in 1990-94, mainly because consignment trade was classified under others. In 2000-04 consignment trade was classified under specific sectors such as office and telecommunications equipment, for the production of which consignment trade was utilized.
5

notable changes in export composition from 1990-94 to 2000-04. It should be noted that unlike East Asian developing economies, with an exception of Korea, Japan registered a high share of automobiles in its exports. A close examination of the export commodity composition of East Asian economies in 1990-94 and 2000-04 reveals increasing similarity among them. This trend can be found by an increase in the correlations coefficient of the export composition between most pairs of economies in East Asia over time (Table 4). Indeed, the decline in the correlation coefficient from 1990-94 to 2000-04 was found in only three cases out of 90 pairs. As to the magnitude of the index, the correlation coefficient was greater than 0.5 for only 12 in the case of exports to the world (7 in the case of exports to East Asia) out of 45 cases in 1990-94, but the number increased to 29 (31). In 2000-04, Indonesia is practically the only country that has a very different export product composition. As expected, the composition of exports for India is very different from the pattern observed for East Asian countries. Furthermore, the compositional pattern of India’s exports became dissimilar with respect to five out of ten East Asian countries from 1990-94 to 2000-04. Turning to the import composition of East Asian economies, one finds relatively smaller changes, when compared to the case for the exports (Table 3). The shares of manufactures remained around 70-80 percent throughout the period for East Asian developing economies with an exception of Korea, where the corresponding shares stayed at lower level at around 60 percent. It is worth noting here that Japan’s import composition is similar to that of Korea, as the share of manufactures in total imports was significantly low at 57 percent in 2000-04 even after a rise from 46 percent in 1990-94. This pattern is also found for India. Similar to the changes observed for exports, imports of machinery, in particular office and telecommunications equipment and electrical machinery, increased their shares in total imports in many East Asian economies including Japan. An examination of the changes in commodity composition of trade for East Asian economies from 1990-94 to 2000-04 revealed a shift in exports from non-manufactures to manufactures. Among the manufactures a shift was observed from light manufactures such as textiles and garment, and wood, paper and furniture to more sophisticated manufactures such as machinery. The share of office and telecommunications equipment and electrical machinery increased notably. Although the changes in import composition were less dramatic, similar to the case of exports, the share of telecommunications equipment and electrical machinery increased substantially. These observations indicate rapid growth of intra-industry trade in telecommunications
6

equipment and electrical machinery. We saw in an earlier section that intra-regional dependence in East Asia is stronger in the case of its imports than exports. An investigation of regional dependence in East Asia’s exports and imports by commodity shows that the above-mentioned pattern is mainly due to machinery products and particularly office and telecommunication equipment and electrical machinery (Table 5). It is worth noting that for these sectors East Asia’s import dependence on other East Asian economies increased except on Japan. II.3. Pattern of Comparative Advantage for East Asian Economies An analysis of the pattern of comparative advantage is useful to understand the changing trade patterns. The commodity composition of exports and imports of a country, which we analyzed above, largely reflects the pattern of comparative advantage of the country. However, the commodity composition is a very rough measure of comparative advantage, because it does not take into account of the important information for discerning the pattern of comparative advantage such as the commodity composition of other countries. To overcome such deficiency and to identify the sectors with a comparative advantage, the concept of revealed comparative advantage (RCA) was developed7. An examination of the computed RCAs for East Asian economies in Table 6, in which the manufactured products are classified into 4 and 9 broad categories, reveals the fact that many East Asian economies have a comparative advantage in electrical and electronics products8. Specifically, for 2000-2004 China, Japan, Korea, Malaysia, the Philippines, Singapore, Thailand, and Taiwan are shown to have a comparative advantage in electrical and electronics products, as the values of RCA for these products in these economies are greater than unity. What is noteworthy is that RCA for China increased from 0.99 in 1990-94 to 1.70 in 2000-04, indicating that electrical and electronics products became a product with a comparative advantage from that with a 7 Balassa (1965) developed the concept of “revealed comparative advantage.” In our exercise RCAij=[Xij/Xi]÷[Xwj/Xw], where Xij and Xwj are the value of j product exported by country i and the world, respectively, while Xi and Xw are total exports of country i and the world, respectively. Country i is interpreted to have a comparative advantage in product j, if RCAij is greater than unity. 8 One should note that the computed RCAs are affected by trade destinations and thus do not necessarily reflect the true RCAs. Specifically, the computed RCAs tend to reflect the comparative advantage of the country under investigation vis-à-vis neighboring countries more strongly than those with far away countries, because of low trade costs associated with trade with neighboring countries..
7

comparative disadvantage. Having discussed that East Asian economies enjoy a comparative advantage in electrical and electronics products, which can be characterized as high-technology products, one should be aware that many East Asian developing economies are engaged in assembly operation of these products, which require labor-intensive rather than high-technology intensive operations such as developing new products. This reflects the “inter-process” division of labor being developed in East Asia, which we will discuss below. Another product, which many East Asian economies have a comparative advantage in, is textiles and garments, as China, Indonesia, Korea, Philippines, Thailand, Taiwan, and Vietnam registered the value greater than unity. It should be noted, however, that the degree of comparative advantage in this product declined for all the countries except Indonesia. Indonesia, Malaysia and Thailand share a common pattern in that they have a comparative advantage in agriculture-based products, while Japan and Korea exhibit a similar pattern in that they have a comparative advantage in medium to high technology products. Medium technology products include automotives, chemicals and industrial machinery, while high technology products include electrical and electronics products. Our findings on the pattern of comparative advantage for East Asian economies are mostly consistent with the expectation that it reflects the endowment of resources. Specifically, advanced economies abundantly endowed with well-educated human resources such as Japan and Korea have a comparative advantage in medium- and hi-technology products, while developing economies abundantly endowed with low-wage labor such as ASEAN countries, China and Vietnam have a comparative advantage in low technology products. Economies with abundant natural resources such as Indonesia and Malaysia have a comparative advantage in natural resource-based products. One important caveat to note is the case of developing economies that are shown to have a comparative advantage in high technology products, i.e. electrical and electronic products. This seeming inconsistency can be due to the development of inter-process division of labor in East Asia, where labor-intensive process in the production of high technology products is conducted in low-wage developing economies. As we will see later, the main promoter of developing inter-process division of labor is multinational corporations (MNCs) from developed economies such as Japan and the United States and developing economies from Korea, Taiwan and others. II.4. Expansion of Vertical Intra-Industry Trade
8
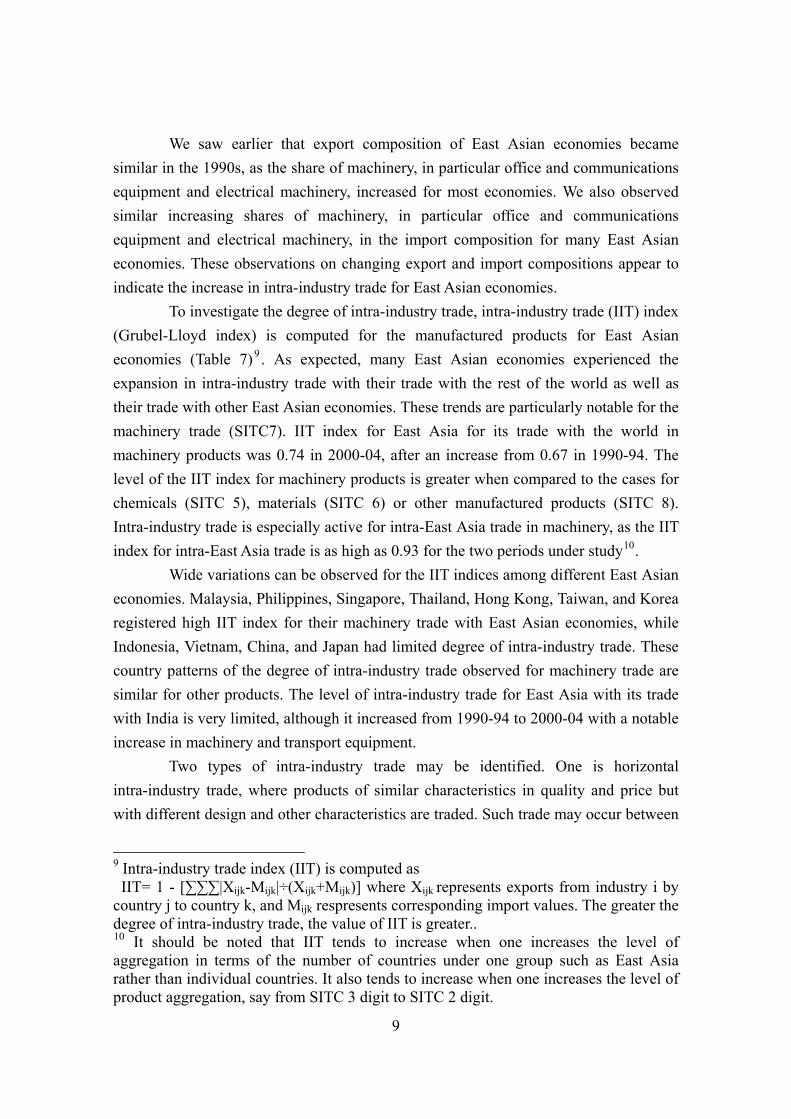
We saw earlier that export composition of East Asian economies became similar in the 1990s, as the share of machinery, in particular office and communications equipment and electrical machinery, increased for most economies. We also observed similar increasing shares of machinery, in particular office and communications equipment and electrical machinery, in the import composition for many East Asian economies. These observations on changing export and import compositions appear to indicate the increase in intra-industry trade for East Asian economies. To investigate the degree of intra-industry trade, intra-industry trade (IIT) index (Grubel-Lloyd index) is computed for the manufactured products for East Asian economies (Table 7)9 . As expected, many East Asian economies experienced the expansion in intra-industry trade with their trade with the rest of the world as well as their trade with other East Asian economies. These trends are particularly notable for the machinery trade (SITC7). IIT index for East Asia for its trade with the world in machinery products was 0.74 in 2000-04, after an increase from 0.67 in 1990-94. The level of the IIT index for machinery products is greater when compared to the cases for chemicals (SITC 5), materials (SITC 6) or other manufactured products (SITC 8). Intra-industry trade is especially active for intra-East Asia trade in machinery, as the IIT index for intra-East Asia trade is as high as 0.93 for the two periods under study10. Wide variations can be observed for the IIT indices among different East Asian economies. Malaysia, Philippines, Singapore, Thailand, Hong Kong, Taiwan, and Korea registered high IIT index for their machinery trade with East Asian economies, while Indonesia, Vietnam, China, and Japan had limited degree of intra-industry trade. These country patterns of the degree of intra-industry trade observed for machinery trade are similar for other products. The level of intra-industry trade for East Asia with its trade with India is very limited, although it increased from 1990-94 to 2000-04 with a notable increase in machinery and transport equipment. Two types of intra-industry trade may be identified. One is horizontal intra-industry trade, where products of similar characteristics in quality and price but with different design and other characteristics are traded. Such trade may occur between
9 Intra-industry trade index (IIT) is computed as IIT= 1 - [∑∑∑|Xijk-Mijk|÷(Xijk+Mijk)] where Xijk represents exports from industry i by country j to country k, and Mijk respresents corresponding import values. The greater the degree of intra-industry trade, the value of IIT is greater.. 10 It should be noted that IIT tends to increase when one increases the level of aggregation in terms of the number of countries under one group such as East Asia rather than individual countries. It also tends to increase when one increases the level of product aggregation, say from SITC 3 digit to SITC 2 digit.
9

the countries with similar income levels, where consumers have similar taste but they have demand for variety. The other type is vertical intra-industry trade, under which products of different quality and price are traded. An example of such trade involves standard color TVs and hi-definition TVs, which are of different quality and price. Another example is trade in components and finished products, which may be classified under the same category such as electronics. As such, vertical intra-industry trade tends to take place between developing and developed countries, where factor prices are different. Between these two types of intra-industry trade, a large part of intra-industry trade in East Asia can be characterized as vertical type. Table 8 reports the results of the analysis to classify intra-regional trade in East Asia into three types, two types of intra-industry trade and inter-industry trade (or one-way trade)11. The results show that the share of intra-industry trade increased notably from 1990 to 2004, which is consistent with the earlier finding on the IIT index. For intra-industry trade, a large portion is vertical intra-industry trade, although both horizontal and vertical types increased over time12. A large share of vertical intra-industry trade in intra-regional trade in East Asia reflects substantial diversity in the level of economic development among the East Asian economies and the development of regional production network under which parts with different quality and characteristics are actively traded. As we argue in a later section, multinational corporations (MNCs) have played a key role in promoting vertical intra-industry trade in East Asia by setting up regional production networks through foreign direct investment. II.5. Active Intra-regional Trade in Machinery Parts One notable characteristic of intra-regional trade in East Asia is increasing and high importance of trade in machinery parts. This observation is supported by the figures in Table 9. For office and telecommunications, electrical appliances and road vehicles, the share of parts in intra-East Asian trade increased from 1990-94 to 2000-04, although the magnitude of the shares differ among the products. Although the share of parts in textile/apparel trade is also high as that for road vehicles, it declined over time13. Among the machinery sectors, the share of parts is highest for electrical appliances, 11 See Fukao et.al (2003) for the classification of three types of trade. 6-digit HS classification is used for the analysis. 12 This finding is consistent with Fukao et.al (2003). 13 In the case of textiles and apparel, textiles composed of yarn and fabrics are considered as parts and apparel as finished products.
10

which is followed by office and telecommunications equipment and then by road vehicles. The importance of parts in intra-East Asian trade can be found by a comparison with trade with the US and the EU. One finds that East Asia’s exports have lower (higher) share of parts (finished products) in its trade with the US and the EU compared to that with East Asia. The pattern of intra-East Asian trade in parts differs by the products and by the economies. For electrical appliances approximately 80 percent of East Asia’s exports take the form of parts and the remaining 20 percent of finished products regardless of their export destinations. High share of parts in electrical appliances may be attributable to high shipping cost, as white goods, a large portion of traded electrical appliances, are bulky and heavy. However, one exception is China in that the share of finished products in the exports of electrical appliance is high, especially for its exports to developed countries, possibly reflecting very competitive (low) prices of Chinese products. A similar trading pattern of China’s electrical appliances trade can be found for East Asia’s trade in office and telecommunications and textiles/apparel. East Asian economies import parts from other East Asian economies and export finished products to developed countries. Our findings on the pattern of trade in parts and finished products in office and telecommunications, electric appliances, and textile/apparel suggest the presence of triangular trade. Under the triangular trade, parts produced by Japan and the NIES are exported to China and ASEAN countries to be assembled as finished products, which in turn are exported to North America and Europe. East Asia’s trade pattern in road vehicles is different from the patterns observed for electronics or textiles/apparel. Similarly to the case for office and telecommunications equipment, and electrical appliances, the share of parts in intra-East Asian trade is increasing, but unlike these products finished products account for a large share of road vehicle exports from Japan and the NIES. In contrast with the case for office and telecommunication equipment or textiles/apparel, almost all of Japan’s imports in road vehicles from East Asia are parts and not finished products. This finding indicates a lack of competitiveness in assembling automobiles in East Asian developing economies vis-à-vis Japan. However, with an improvement in technical capability, East Asian developing economies may improve competitiveness and successfully export finished products to Japan, just like the cases of other machinery products. The findings in this section reveal developing East Asia’s role as a world factory for electronics and electric machinery and textiles/apparel, as they produce finished products by assembling parts supplied by developed and developing economies
11

and sell the finished products in the world market. III. Foreign Direct Investment and Foreign Trade: Increasing Role of Multinational Corporations in International Trade Emergence of new trading patterns in East Asia was identified in the previous section. Specifically, rapid expansion of vertical intra-industry trade involving parts trade inside East Asia was observed by analyzing detailed trade data. The discussions of the findings suggested the role of multinational corporations (MNCs) for these new developments. This section investigates this assertion by examining the activities of MNCs by focusing on their foreign direct investment, a major international business activity for them. Ideally, we would like to analyze MNCs from various countries to discern their roles in shaping foreign trade patterns in East Asia, but a lack of necessary data precludes us from pursing such analysis. Thus, we only examine the activities of Japanese MNCs, for which necessary information for our analysis is available. III.1. Changing Patterns of FDI Inflows in East Asia Foreign direct investment inflows to East Asia increased rapidly and remarkably since the mid-1980s. Several notable characteristics, which have implications on trade patterns in East Asia, can be found for the recent FDI inflows to East Asia. First, as to the sources of FDI inflows, increasing intra-regional orientation can not be found, unlike the case for international trade (Table 10). Out of eight countries, for which the data on the sources of FDI inflows are available, only three countries, Indonesia, Thailand, and Korea, saw the increase in the share of East Asia as a source of FDI inflows. Wide variations in the importance of East Asia as a source of FDI inflows among East Asian economies should also be noted. Unlike the pattern observed for international trade, where intra-regional trade accounted for approximately 40-60 percent of total trade for all the East Asian economies, dependence on intra-regional FDI ranges from 99 percent for Thailand for 2000-04 to 22 percent for Singapore for 2000-04. Second, somewhat similar to the pattern found for international trade, machinery sector, especially electrical and electronic sector received substantial FDI in many East Asian economies (Table 11). In particular, the share of electric and electronics is high in Taiwan, where more than a half of FDI inflows in manufacturing were in that sector. The low share in Thailand is largely due to negative FDI values, or withdrawal of FDI, in the electric and electronics sector in recent years. Despite a
12

declining trend in Thailand, a large amount of FDI inflows in electric and electronic sector in East Asia since the mid-1980s has led to a substantial increase in international trade in that sector, which we discuss in the next section. III.2. Foreign Trade by MNCs Multinational corporations (MNCs) have had huge impacts on East Asian economies through various forms including generating production, fixed investment and employment. Among those activities, their impacts on foreign trade are substantial14. For example, the share of MNCs’ exports in China’s exports increased from 29 percent in 1994 to 55 percent in 2003, while the corresponding share for imports increased from 46 to 56 percent15. Although similar information for many other East Asian economies is not available, the contributions of MNCs for many East Asian economies’ trade appear substantial, considering their increased position in East Asia and their well-developed global trading networks. In light of these observations, it is important to investigate the trading patterns of MNCs in East Asia, in order to deepen understanding of the changing trade patterns in East Asia. Because of the limited availability of necessary information, we examine the patterns of trade by Japanese MNCs only. Asian affiliates of Japanese MNCs have strong export orientation, when compared to the affiliates in other parts of the world, while import orientation of Asian affiliates is similar to those in other parts of the world. In 2001 the share of exports in total sales for the Asian affiliates in manufacturing sector is 52 percent, significantly higher than 14 percent for the affiliates in North America, while the shares of imports in total procurements for the affiliates in Asia and North America are similar at 54 and 50 percent, respectively16. Among different sectors, trade orientation is particularly high for the machinery sectors with the highest trade orientation registered by the electronics sector. Indeed, for the Asian affiliates in the electronics sector, 70 percent of total sales are destined overseas, while 70 percent of total procurements come from overseas. Several trade patterns, which were found in the earlier analysis of foreign trade in East Asia above, can also be found in Japanese MNCs’ trade pattern. First, one observes an increase in the importance of intra-regional trade in East Asia for Japanese MNCs’ trade. The share of exports to Asia (Japan and other Asia combined) in total exports in manufacturing increased slightly from 79.6 percent in 1992 to 82.4 percent in 14 On the impacts of FDI on trade, see, for example, Urata (2001), Kawai and Urata (1998, 2004). 15 China’s Statistical Yearbook, various years. 16 METI, Kaigaij Jigyo Katsudo Kihon Chosa [A Comprehensive Survey of Overseas Activities of Japanese Firms] no. 32, 2004.
13

2001, and the corresponding share for the imports rose from 90.9 to 95.5 percent (Table 12). These increases in the shares are remarkable since the degrees of intra-regional dependence in both exports and imports for the Asian affiliates of Japanese MNCs’ were already very high in the early 1990s. Several interesting changes over time are observed at sectoral levels. High shares of Japan in both exports and imports of Asian affiliates in textiles are observed. This appears to reflect the strategy of Japanese textile producers, which use Asia as a production base for the Japanese market. A substantial increase in the share of exports to Asia is found for transport machinery at the expense of exports to North America, probably reflecting increased importance of Asian market. A shift in the importance of import source from Japan to other Asia is found for electric and electronics machinery. This shift is probably caused by improved competitiveness of electric and electronic parts produced in other Asian economies. Second, one can detect the emergence of triangular trade in electric and electronics products involving Asian affiliates of Japanese MNCs,’ under which parts are imported from Asian economies including Japan to be assembled for finished products, which in turn are exported to North America and the EU. Considering a large increase in trade volume by the Asian affiliates of Japanese MNCs’ from 1992 to 2001, two observed notable changes above must have contributed to an increase in intra-regional trade and triangular trade involving East Asia. A large portion of trade conducted by Asian affiliates of Japanese firms take the form of intra-firm trade, trade between MNC’s parent firm in Japan and its affiliates in Asia or between overseas affiliates. For manufacturing as a whole, more than 70 percent of Asian affiliates’ exports are destined to their affiliated firms regardless of their destinations. The share of intra-firm exports in total exports is particularly high at 96 percent for their exports to Japan. This is understandable as there is a strong linkage between the affiliates and their parent firms. The importance of intra-firm transaction is less for the Asian affiliates’ imports from Japan and other Asian economies, when compared to the importance for their exports. In the case of Asian affiliates’ imports from Japan, a slightly less than a half of them come from their parent and other affiliated firms. Coupled with an observation that 74 percent of exports of Japanese MNCs’ parent firms are destined to their overseas affiliates and 56 percent of their imports are from their overseas affiliates, our findings on Japanese MNCs’ trade and intra-firm trade in Asia appear to indicate that Japanese MNCs have developed their own production and distribution network in Asia by fragmenting their production process into several
14
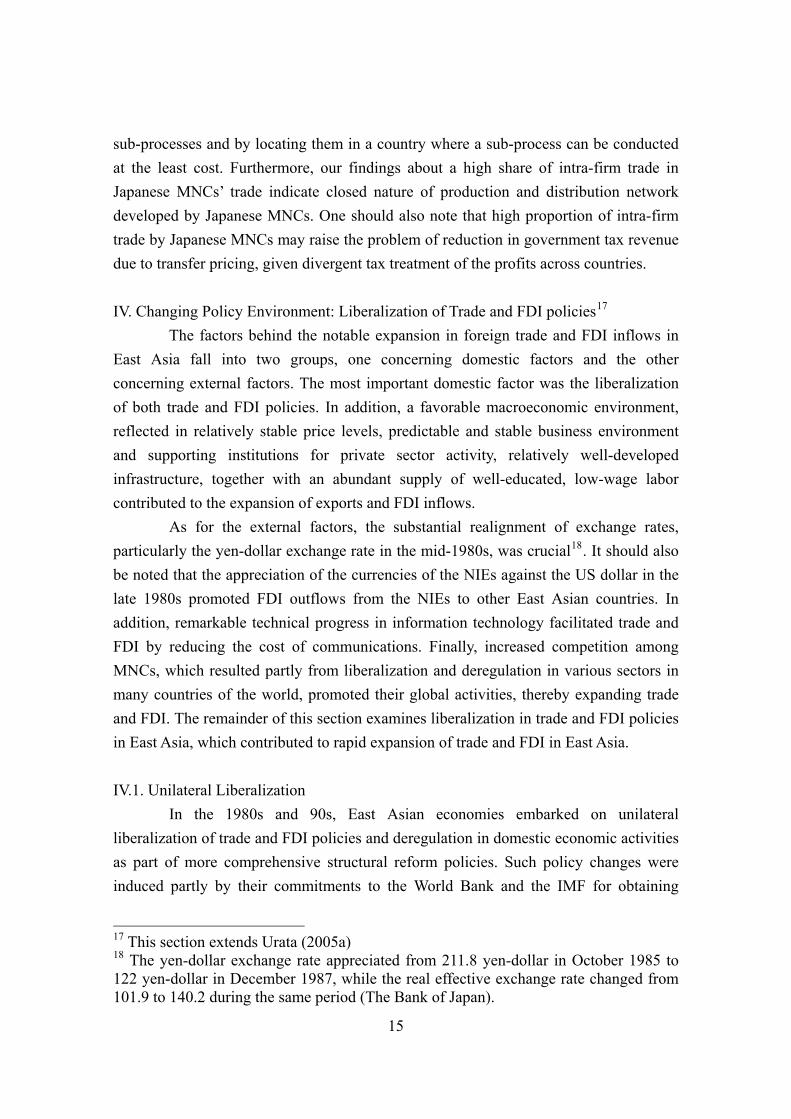
sub-processes and by locating them in a country where a sub-process can be conducted at the least cost. Furthermore, our findings about a high share of intra-firm trade in Japanese MNCs’ trade indicate closed nature of production and distribution network developed by Japanese MNCs. One should also note that high proportion of intra-firm trade by Japanese MNCs may raise the problem of reduction in government tax revenue due to transfer pricing, given divergent tax treatment of the profits across countries. IV. Changing Policy Environment: Liberalization of Trade and FDI policies17
The factors behind the notable expansion in foreign trade and FDI inflows in East Asia fall into two groups, one concerning domestic factors and the other concerning external factors. The most important domestic factor was the liberalization of both trade and FDI policies. In addition, a favorable macroeconomic environment, reflected in relatively stable price levels, predictable and stable business environment and supporting institutions for private sector activity, relatively well-developed infrastructure, together with an abundant supply of well-educated, low-wage labor contributed to the expansion of exports and FDI inflows. As for the external factors, the substantial realignment of exchange rates, particularly the yen-dollar exchange rate in the mid-1980s, was crucial18. It should also be noted that the appreciation of the currencies of the NIEs against the US dollar in the late 1980s promoted FDI outflows from the NIEs to other East Asian countries. In addition, remarkable technical progress in information technology facilitated trade and FDI by reducing the cost of communications. Finally, increased competition among MNCs, which resulted partly from liberalization and deregulation in various sectors in many countries of the world, promoted their global activities, thereby expanding trade and FDI. The remainder of this section examines liberalization in trade and FDI policies in East Asia, which contributed to rapid expansion of trade and FDI in East Asia. IV.1. Unilateral Liberalization In the 1980s and 90s, East Asian economies embarked on unilateral liberalization of trade and FDI policies and deregulation in domestic economic activities as part of more comprehensive structural reform policies. Such policy changes were induced partly by their commitments to the World Bank and the IMF for obtaining
17 This section extends Urata (2005a) 18 The yen-dollar exchange rate appreciated from 211.8 yen-dollar in October 1985 to 122 yen-dollar in December 1987, while the real effective exchange rate changed from 101.9 to 140.2 during the same period (The Bank of Japan).
15
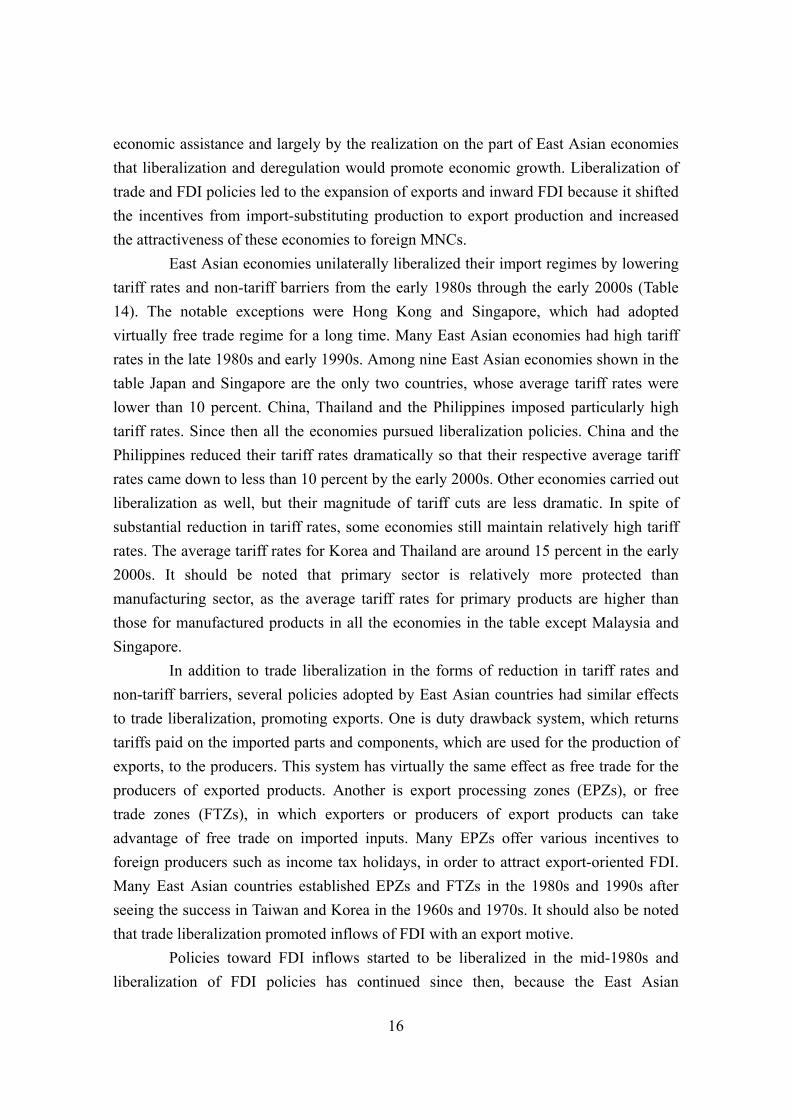
economic assistance and largely by the realization on the part of East Asian economies that liberalization and deregulation would promote economic growth. Liberalization of trade and FDI policies led to the expansion of exports and inward FDI because it shifted the incentives from import-substituting production to export production and increased the attractiveness of these economies to foreign MNCs. East Asian economies unilaterally liberalized their import regimes by lowering tariff rates and non-tariff barriers from the early 1980s through the early 2000s (Table 14). The notable exceptions were Hong Kong and Singapore, which had adopted virtually free trade regime for a long time. Many East Asian economies had high tariff rates in the late 1980s and early 1990s. Among nine East Asian economies shown in the table Japan and Singapore are the only two countries, whose average tariff rates were lower than 10 percent. China, Thailand and the Philippines imposed particularly high tariff rates. Since then all the economies pursued liberalization policies. China and the Philippines reduced their tariff rates dramatically so that their respective average tariff rates came down to less than 10 percent by the early 2000s. Other economies carried out liberalization as well, but their magnitude of tariff cuts are less dramatic. In spite of substantial reduction in tariff rates, some economies still maintain relatively high tariff rates. The average tariff rates for Korea and Thailand are around 15 percent in the early 2000s. It should be noted that primary sector is relatively more protected than manufacturing sector, as the average tariff rates for primary products are higher than those for manufactured products in all the economies in the table except Malaysia and Singapore. In addition to trade liberalization in the forms of reduction in tariff rates and non-tariff barriers, several policies adopted by East Asian countries had similar effects to trade liberalization, promoting exports. One is duty drawback system, which returns tariffs paid on the imported parts and components, which are used for the production of exports, to the producers. This system has virtually the same effect as free trade for the producers of exported products. Another is export processing zones (EPZs), or free trade zones (FTZs), in which exporters or producers of export products can take advantage of free trade on imported inputs. Many EPZs offer various incentives to foreign producers such as income tax holidays, in order to attract export-oriented FDI. Many East Asian countries established EPZs and FTZs in the 1980s and 1990s after seeing the success in Taiwan and Korea in the 1960s and 1970s. It should also be noted that trade liberalization promoted inflows of FDI with an export motive. Policies toward FDI inflows started to be liberalized in the mid-1980s and liberalization of FDI policies has continued since then, because the East Asian
16

economies began to realize that FDI inflows would promote economic growth. Although it is difficult to quantify the restrictiveness of an FDI regime, it is clear that many East Asian economies have liberalized their policies toward FDI inflows since the mid-1980s19. Restrictions on FDI take various forms, including restrictions on market access, most-favored-nation treatment, and national treatment. Many East Asian economies reduced restrictions on market access by reducing the number of sectors and industries on the negative list and by relaxing the limits on foreign equity ownership. Among them, Indonesia, Korea, Malaysia, the Philippines, and Thailand adopted substantial FDI liberalization measures in an effort to attract foreign investors. Furthermore, recognizing the important contribution that FDI may make toward economic growth, a number of economies introduced incentives such as tax breaks to attract FDI. Indeed, there has been keen competition among the countries in the region to attract FDI by reducing barriers and providing incentives. Similar to East Asian countries, India adopted liberalization policies in trade and FDI in early 1990s, in order to deal with deterioration in balance of payment problems as well as inefficiency resulting from prolonged import protection. Despite substantial reduction in import protection, the levels of import tariffs in India are still higher compared to those in East Asian countries. IV.2. Liberalization under Multilateral Framework Turning to the multilateral level, the Uruguay Round of multilateral trade negotiation under the GATT started in 1986 and ended in 1994. Although the negotiations lasted eight years, twice as long as was targeted, the Uruguay Round made substantial progress toward liberalizing trade and FDI. The achievements include: a reduction in tariff rates; framework agreements on trade in services, on intellectual property rights and on trade-related investment measures; a timetable for phasing out all quantitative restrictions on trade including those on textiles under the Multi-Fiber Arrangement (MFA); first steps toward bringing agriculture more firmly under a multilateral discipline; a stronger dispute settlement mechanism; and the establishment of the WTO. Though it is difficult to estimate the impact of these achievements individually, there is no doubt that the GATT/WTO has promoted trade and FDI liberalization in East Asia. Earlier we observed a dramatic reduction in tariff rates by China. It should be
19 Japan PECC (2002) examined the impediments to FDI in APEC economies, and found that many East Asian economies reduced the number and the level of impediments by liberalizing FDI policies.
17

noted that China liberalized its trade regime substantially in order to join the WTO and it has committed itself to liberalize trade further after joining the WTO. Since the establishment of the WTO in 1995, it took as long as six years to start a new multilateral negotiation. The long delay for the start of the new round was mainly due to the differences in the views toward multilateral trade liberalization between developed and developing members. The Doha Development Agenda (DDA), the first round under the WTO, started in 2001 but it has not entered real negotiation yet because of the differences in opinions on the contents of DDA not only between developed and developing members but also within the respective groups. IV.3. Liberalization under Regional Framework Liberalization of trade and FDI policies also progressed in regional contexts in the 1990s in East Asia. The members of the ASEAN started the ASEAN Free Trade Area (AFTA) process in 1992 to make ASEAN a competitive region for exports and for attracting FDI. The 1992 agreement provided for the liberalization of tariff and non-tariff measures under the Common Effective Preferential Tariffs. The target year for achieving tariff and non-tariff liberalization was originally set for 2008, but was later moved forward to 2002. The AFTA has been in effect among the original five ASEAN members—Indonesia, Malaysia, Singapore, Thailand and the Philippines—since January 2002 when the tariff rates were reduced to 0-5 percent, though the exclusion list is long and individual country circumstances vary. Furthermore, Vietnam is to comply with the same tariff standards by 2003, Laos and Myanmar by 2005, and Cambodia by 2007. By 2010 ASEAN is expected to become a complete free trade area free from tariffs with the exception of CLMV members, which are give later deadlines. FDI liberalization in the ASEAN has been underway after the creation of the ASEAN Investment Area (AIA) in 1998, which provides coordinated investment cooperation and facilitation programs, market access, and national treatment of all industries. But some ASEAN members continue to maintain sizeable sensitive and exclusion lists from FDI liberalization. Another regional framework that promoted trade and FDI liberalization in East Asia is the Asia-Pacific Economic Cooperation (APEC) forum. This trans-regional forum, which was established to promote economic growth in the region, includes not only East Asian economies but also economies in North and South America and Oceania. One important characteristic of APEC is its inclusion of China and Taiwan as members. Indeed, APEC was the only international economic forum in which both China and Taiwan pursued trade and FDI liberalization before they became the
18

members of the World Trade Organization (WTO) in 2002.20 Following the Bogor declaration in 1994 calling for full liberalization of trade and FDI by 2010 for developed-economy members and by 2020 for developing-economy members, APEC members agreed to prepare and implement individual action plans specifying near- and medium-term liberalization measures. Peer pressure has played a crucial role in the implementation of liberalization schemes. All APEC members have made significant progress toward freer trade and FDI regimes and they also helped both China and Taiwan to join the WTO. IV.4. Bilateral and Regional Framework: Recent Surge of FTAs in East Asia East Asia was not active in the formation of regional trade agreements (RTAs), which include FTA and customs union, until recently (Table 15)21. ASEAN Free Trade Area (AFTA) was the only major FTA until Japan and Singapore enacted Japan –Singapore FTA (formally named a New Age Japan-Singapore Economic Partnership Agreement, JSEPA) in 200222. However, the situation changed dramatically in recent years. Many economies in East Asia began to form FTAs with the countries not only in the region but also outside the region. In light of these developments, one can detect the change in the characteristics of regionalization in East Asia around the turn of the century from market-driven to institution-driven regionalization as the main driver of regionalization is changing from the market forces unleashed by trade and FDI liberalization to regional and bilateral institutions such as FTAs. Besides AFTA, ASEAN as a group as well as its members individually have become active in FTA discussions with other countries in recent years. One of the FTAs involving ASEAN that has received most attention recently is that with China. ASEAN and China enacted FTA in goods trade in July 2005 and they are currently negotiating 20 They are also members of the Asian Development Bank. 21 In the GATT/WTO, regional trade agreements (RTAs), which violate one of its basic principles of non-discrimination, are permitted under GATT Article XXIV with several conditions, which include liberalization of substantially all the trade of the members, not increasing trade barriers on non-members, and completing the RTA process within ten years. For developing members, more lenient conditions are applied under the enabling clause. An FTA is considered to be a shallow form of regional integration, because it only removes tariff and non-tariff barriers among the members, while a customs union is a deeper integration, as it adopts common external tariffs on non-members, in addition to the removal of tariff and non-tariff barriers on trade among the members. 22 AFTA was discussed in an earlier section. For discussions on FTAs in East Asia, see for example, Aggarwal and Urata (2006), Lincoln (2004), Urata (2005b), and Pangestu and Gooptu (2004).
19

FTA in services trade. ASEAN is currently also negotiating FTAs with Japan, Korea and others. Several ASEAN members have become active in establishing bilateral FTAs. Singapore is a frontrunner in this FTA race as it enacted many FTAs with countries such as New Zealand, Japan, Australia, the USA, the EFTA, and India and it is negotiating FTA with a number of countries. Thailand has also become active in establishing FTAs, as it has implemented FTA with Australia, New Zealand, and India, while it is currently under negotiations with the USA, Japan and many others. Malaysia signed FTA with Japan and it agreed to begin negotiations with several countries including the US. Both the Philippines and Indonesia are negotiating FTA with Japan separately. Compared to ASEAN countries in Southeast Asia, the economies in Northeast Asia including China, Japan, Korea, and Taiwan had not been active in FTAs until recently. However, China, Japan and Korea have become very active in FTAs. China implemented FTA with ASEAN, Hong Kong, Macau, and it is negotiating FTAs with over 20 countries. Japan enacted FTA with Singapore and Mexico. It has singed or is very close to signing FTAs with Malaysia and Thailand, and it is currently in negotiations with ASEAN, Indonesia, the Philippines, Korea, and Chile. Korea implemented FTAs with Chile and Singapore and is in negotiation with Japan, ASEAN and others. It is scheduled to begin negotiations with the US. An idea of FTA covering East Asian countries has emerged. At the Leaders’ summit meeting of ASEAN+3 (China, Japan, and Korea) in 1998 the leaders decided to set up the East Asia Vision Group to study long term vision for economic cooperation. The group has presented the leaders with recommendations including the establishment of East Asia FTA. Currently, the Expert Group, which was set up at the recommendation of ASEAN+3 Economic Ministers, is studying the possibility of East Asian FTA, comprising of ASEAN+3. Despite heightened interests in FTAs by East Asian countries, East Asian countries have faced serious obstacles in reaching an agreement. As one would expect, strong opposition comes from non-competitive sectors, which are subject to competition from FTA members. Besides, some East Asian countries have political, historic, and other kinds of problems. As such, a number of FTA negotiations have been stalled. Various reasons can be considered behind the recent surge of FTAs in East Asia. First, rapid expansion of FTAs in other parts of the world has made East Asian economies realize the importance of establishing FTAs in order to maintain and expand their export opportunities. Indeed, the number of FTAs reported to the GATT/WTO by its members started to expand sharply since the early 1990s and the pace of the expansion accelerated in the mid-1990s when the WTO was established. Specifically,
20

the cumulative number of FTAs reported to the GATT/WTO at the end of 1990 since 1948 was 27.23 It increased sharply since then to register 62 in 1995, 104 in 2000, and 198 in 2005. Second, a stalemate of the negotiations under the DDA turned the attention of the WTO members with an interest in trade liberalization to FTAs. Third, the Asian financial crisis in 1997-98 prompted East Asian economies to realize the need for regional cooperation such as FTAs in order to avoid another crisis. Fourth, rivalry among East Asian economies over gaining a leadership role in the region has activated their FTA strategies. One notable characteristic of FTAs in East Asia is their comprehensiveness in coverage. As such, some of the FTAs established in East Asia are named Economic Partnership Agreement (e.g. Japan-Singapore EPA, JSEPA), or Closer Economic Partnership Agreement (e.g. China-Hong Kong CEPA), and others. These new types of FTAs typically include facilitation of foreign trade, liberalization and facilitation of foreign direct investment (FDI), and economic and technical cooperation, in addition to trade liberalization, which is included in traditional FTAs. It may be worth noting that the basic philosophy of these new types of FTAs is similar to that of Asia Pacific Economic Cooperation (APEC) forum, whose three pillars are (1) liberalization and (2) facilitation of foreign trade and foreign investment, and (3) economic and technical cooperation. Many FTAs in East Asia are quite new and therefore their impacts may not have been fully materialized. However, a number of evidences on the impacts of FTAs in the form of trade expansion have been reported. For example, bilateral trade between China and Thailand has been reported to have increased notably after the enactment of an early harvest program under China-ASEAN FTA. Although FTA may bring benefits in the form of trade expansion to FTA members, several possible negative impacts have been pointed out by researchers, business people, policy makers and others. First, some FTAs that are established in East Asia are of low quality in that a substantial number of commodities and/or important commodities are excluded from trade liberalization. Critics argue that because of low quality, FTAs will not generate expected trade expansion effect, but they only create distortions in the market. Second, proliferation of FTAs with different rules of origin is likely to give rise to the spaghetti bowl effect, which would reduce trade volume by creating impediments to trade. Third, an increased interest in FTAs is likely to have a negative impact on WTO negotiations by diverting interests and negotiating resources
23 Obtained from WTO’s website below accessed on November 11, 2006. http://www.wto.org/english/tratop_e/region_e/summary_e.xls
21

away from the WTO. Given the emergence of FTAs in the region, it would be of interest to examine the possible impacts on FTAs on foreign trade in the region. Urata and Kiyota (2005) analyzed the impacts of East Asia FTA, comprising of ASEAN+3 (China, Japan, and Korea) countries, on foreign trade and other economic variables by using a computable general equilibrium (CGE) model. The results of their analysis are shown in Tables 16 and 17. To begin with the impacts on intra-regional trade, the simulation study shows an increased intra-regional dependence in East Asia, as expected. According to the results shown at the last portion of Table 16, East Asia FTA is projected to increase the share of intra-regional trade in world trade by 3.5 percentage points and to increase the shares of intra-regional exports and imports in East Asia’s overall exports and imports by 8.2 and 9.6 percentage points, respectively. Trade intensity index is also projected to increase by 0.15 point. East Asia FTA is also projected to increase intra-ASEAN dependence in foreign trade but the impacts are not as large as those projected on intra-East Asia trade. Indeed, the trade intensity is expected to decline among ASEAN countries. Finally, it is meaningful to discern the impacts of East Asia FTA on GDP and economic welfare of the members as well as non-members. The results of simulation shown in Table 17 indicate that members gain benefits while non-members suffer from losses in terms of GDP as well as economic welfare24. These results are consistent with our expectation. The impacts vary among the countries. Basically, the countries with strong dependence on trade and/or the countries with high protection are likely to gain from trade liberalization under East Asia FTA. V. Concluding remarks This paper began with observing rapid expansion of foreign trade and foreign direct investment in East Asia, which played an important role in achieving successful economic development in the region. The subsequent analysis revealed the dramatic changes in trade patterns of East Asian economies in various aspects. First, intra-regional trade expanded faster than extra-regional trade, resulting in an increase in intra-regional dependency. Second, composition of trade shifted from non-manufacturing to manufacturing, especially to machinery products. Among machinery products, electronic (office and
24 Although the magnitude of the change for the countries differ for some countries, the direction of the changes are basically the same in other studies such as Scollay and Gilbert.
22

telecommunication equipment) and electric products increased their importance. Third, intra-industry trade expanded faster than inter-industry trade. Within intra-industry trade, a dominant portion is in the form of vertical intra-industry trade although horizontal intra-industry trade is also increasing. Fourth, trade in parts account for a large part of total trade (trade in parts and finished products) and the share is increasing. This pattern reflects increasing extent of division of labor inside East Asia as East Asia has become a factory for the world. Fifth, all these changes in trade patterns observed above appear to have resulted from active involvement of multinational corporations (MNCs) in foreign direct investment and foreign trade, as MNCs took an advantage of business opportunity arisen from freer trade and FDI environment, resulting from trade and FDI liberalization policies adopted by East Asian economies. Under liberalized market condition and efficient communications and transportations systems in recent years, MNCs fragmented production process into a number of sub-processes and then located the sub-processes in countries, where the sub-processes are undertaken most efficiently. As a result of fragmentation strategy by MNCs, regional production and distribution networks have been established in East Asia. These notable features of foreign trade in East Asian were generated by market forces. Focusing on increasing intra-regional trade, observers have described such development as market-driven regionalization. However, market-driven regionalization seems to be giving way to institution-driven regionalization, as a large number of attempts have been made to establish regional preferential agreements in the form of free trade agreement (FTA). An interesting and important question to be asked is whether FTAs would lead to further promotion of the trends and patterns realized so far and to achieve economic growth. The impacts of FTA on trade among FTA members so far appear positive, being consistent with outcome projected by the simulation analysis using economic models. Indeed, many studies of the possible impacts of FTAs by using computable general equilibrium (CGE) models indicate positive impacts on trade and economic growth of the members. One would predict further development of the recent patterns of foreign trade in East Asia as FTAs lead to larger and freer trading environment inside the region. Despite these positive impacts of FTAs, concerns have been raised about possible negative impacts, which may be caused by the proliferation of FTAs with different rules and contents. It is also important to emphasize the possible negative impacts on non-members. Recognizing that global trade liberalization is optimum in terms of economic welfare for all the economies in the world, policy makers and researchers have to devise
23

the scenario and policy to move from regional trade agreements such as FTAs to global trade liberalization. In this regard, it is important to make sure that existing and future FTAs are consistent with GATT/WTO rules, although these rules themselves have to be improved so as to successfully turn FTAs into global free trade.
24

References
Aggarwal, Vinod K. and Shujiro Urarta eds. (2006) Bilateral Trade Agreements: Origins, evolution, and implications, Routledge, New York. Balassa, Bela (1965) “Trade Liberalization and Revealed Comparative Advantage,” The Manchester School of Economic and Social Studies, vol. 33, May Japan PECC (Pacific Economic Cooperation Conference) (2002) An Assessment of Impediments to Foreign Direct Investment in APEC Member Economies, Tokyo. Lall, Sanjaya (2000) “The Technological Structure and Performance of Developing Country Manufactured Exports,” Oxford Development Studies, 28 (3), pp. 337-69. Lincoln, Edward J. (2004) East Asian Economic Regionalism, The Brookings Institution, Washington, D.C. Ng, Francis and Alexander Yeats (2003), Major Trade Trends in East Asia: What are their Implications for Regional Cooperation and Growth? Policy Research Working Paper 3084, The World Bank Fukao, Kyoji, Hikaru Ishido, and Keiko Ito (2003) “Vertical Intra-Industry Trade and Foreign Direct Investment in East Asia,” RIETI Discussion Paper Series 03-E-01, Research Institute of Economy, Trade and Industry. Kawai, Masahiro (2005) “East Asian Economic Regionalism: Progress and Challenges,” Journal of Asian Economics 16, pp. 29-55. Kawai, Masahiro and Shujiro Urata (1998) "Are Trade and Direct Investment Substitutes of Complements? An Empirical Analysis of Japanese Manufacturing Industries," in H. Lee and D. Roland-Holst eds., Economic Development and Cooperation in the Pacific Basin: Trade, Investment and Environmental Issues, Cambridge University Press, Cambridge, U.K., pp. 251-293. Kawai, Masahiro and Shujiro Urata (2004) “Trade and Foreign Direct Investment in East Asia,” in Gordon de Brouwer and Masahiro Kawai, Exchange Rate Regimes and
25

East Asia, RoutledgeCurzon, London, pp. 15-102 Pangestu, Mari and Sudarshan Gooptu (2004) “New Regionalism: Options for China and East Asia,” in Homi Kharas and Kathie Krumm eds., East Asia Integrates, The World Bank, Washington, D.C., pp. 79-99. Petri, Peter A. (1993) “The East Asian trading bloc: An analytical history,” in J.A. Frankel and M. Kahler, eds., Regionalism and Rivalry: Japan and the United States in Pacific Asia, Chicago University Press, Chicago, pp. 21-48. Scollay, Robert and John P. Gilbert (2001) New Regional Trading Arrangements in the Asia Pacific? Institute for International Economics, Washington, D.C. Urata, Shujiro (2001) “Emergence of an FDI-Trade Nexus and Economic Growth in East Asia,” in Joseph Stiglitz and Shahid Yusuf, eds., Rethinking the East Asian Miracle (Washington, DC: World Bank), Oxford University Press, New York, pp. 409-459. Urata, Shujiro (2005a) “East Asia’s Multi-Layered Development Process: The Trade-FDI Nexus,” Kiichiro Fukasaku, Masahiro Kawai, Michael G. Plummer and Alexandra Trzeciak-Duval, eds., Policy Coherence Towards East Asia: Development Challenges for OECD Countries, OECD, Paris, pp.347-410.. Urata, Shujiro (2005b) “Free Trade Agreements: A Catalyst for Japan’s Economic Revitalization,” in Takatoshi Ito, Hugh Patrick, and David E. Weinstein, eds., Reviving Japan's Economy, MIT Press, Boston, pp.377-410. Urata, Shujiro and Kozo Kiyota (2005) "The Impact of East Asia FTA on Foreign Trade in East Asia," in Takatoshi Ito and Andrew K. Rose eds. International Trade in East Asia, University of Chicago Press, Chicago and London, 2005, pp. 217-247. Yeats, Alexander (1998) “What Can Be Expected from African Regional Trade Arrangements,” Policy Research Working Paper, No. 2004, World Bank.
26

Table 1 Regionalization in the World
Share of intra-regional Share of intra-regional trade in region's trade Trade intensitytrade in world trade Exports Imports
1990 2000 2004 1990 2000 2004 1990 2000 2004 1990 2000 2004East Asia 8.2 12.0 12.9 39.0 46.3 49.6 46.9 56.7 59.5 2.24 2.19 2.29NAFTA 6.7 10.6 8.1 41.4 55.7 55.9 35.0 43.3 39.6 2.16 2.28 2.73EU25 29.9 25.3 27.3 66.8 67.2 67.2 67.2 66.4 68.6 1.50 1.76 1.69Source: Computed from the JETRO database.

Table 2 Changing Regional Patterns of Trade in East Asia
Trading partnersEast Asia ASEAN NIES CHINA JAPAN S.ASIA EU US WORLD1990-94 2000-04 1990-94 2000-04 1990-94 2000-04 1990-94 2000-04 1990-94 2000-04 1990-94 2000-04 1990-94 2000-04 1990-94 2000-04 1990-94 2000-04
ExportsEast Asia 44.1 49.0 13.0 12.9 16.3 17.1 6.4 11.1 8.6 8.2 1.4 1.6 15.9 14.7 24.4 21.4 100 100Indonesia 62.0 56.9 12.9 17.9 12.6 12.7 3.6 5.4 32.9 21.0 1.0 3.6 14.0 13.6 13.5 13.3 100 100Malaysia 54.7 54.2 28.8 25.5 10.4 12.4 2.5 5.3 13.6 11.5 2.3 3.1 14.9 12.6 19.2 19.9 100 100Philippines 36.1 53.7 7.8 16.5 9.7 16.7 1.2 4.2 17.4 16.4 0.6 0.3 18.3 17.5 38.1 24.0 100 100Singapore 48.2 56.4 25.3 26.0 14.9 18.3 2.0 6.1 7.8 7.0 2.9 3.3 14.5 13.3 20.1 14.9 100 100Thailand 41.7 48.3 15.8 19.8 8.3 10.3 1.5 5.3 17.3 14.7 1.0 1.7 19.0 15.5 21.7 19.4 100 100Vietnam 49.0 15.9 9.3 9.6 15.7 0.5 19.4 12.3 100 100China 60.5 45.3 5.9 7.1 39.2 24.2 15.8 14.3 1.3 1.7 11.3 16.0 13.5 21.1 100 100Hong Kong 47.0 55.5 6.6 6.1 5.1 4.8 29.9 39.3 5.4 5.4 0.9 1.2 16.9 14.0 23.2 20.0 100 100Taiwan 42.7 55.2 10.8 12.5 20.6 23.4 0.0 10.3 11.3 9.2 0.9 1.2 15.4 13.5 28.7 19.9 100 100Korea 40.8 46.6 11.2 10.6 9.6 10.8 4.2 15.6 15.7 9.8 2.3 1.9 13.2 13.2 24.3 19.2 100 100Japan 34.6 43.1 13.4 13.4 17.5 19.9 3.7 10.0 1.0 0.8 18.0 15.5 30.0 27.1 100 100India 22.3 23.0 6.6 8.7 6.7 7.1 0.7 4.2 8.3 3.1 3.4 4.4 26.9 21.9 17.6 18.8 100 100
ImportsEast Asia 49.1 54.6 11.7 14.6 11.8 13.2 9.2 13.8 16.8 13.3 1.0 1.1 13.9 11.5 16.9 12.5 100 100Indonesia 48.4 52.8 9.4 21.4 12.2 9.5 3.4 7.8 23.4 14.5 1.2 2.3 21.3 12.2 12.3 8.9 100 100Malaysia 58.9 62.5 19.9 23.8 10.5 13.2 2.3 7.3 26.4 18.3 1.0 1.1 14.4 11.8 16.4 15.9 100 100Philippines 48.9 57.5 10.5 17.0 15.7 16.8 1.4 4.2 21.8 19.5 0.9 0.9 11.3 8.5 19.2 18.5 100 100Singapore 55.3 56.4 20.5 24.5 10.7 11.1 3.1 7.7 21.4 13.4 0.9 1.3 13.1 12.1 15.9 14.4 100 100Thailand 55.4 54.6 13.4 16.5 10.4 9.4 2.8 6.6 29.9 23.8 1.7 1.3 15.8 10.8 11.4 10.9 100 100Vietnam 75.3 25.2 27.1 10.8 13.0 1.7 9.3 3.1 100 100China 55.8 53.5 6.0 10.8 30.6 25.2 19.4 17.6 0.4 1.2 15.1 13.0 11.5 8.9 100 100Hong Kong 73.8 78.4 8.2 11.3 13.2 12.1 36.4 43.4 16.0 11.7 1.2 1.6 10.2 8.6 7.8 5.9 100 100Taiwan 45.2 55.0 8.9 13.9 5.5 8.2 1.1 7.3 29.8 25.7 0.7 0.5 14.4 10.6 22.0 15.1 100 100Korea 39.2 45.7 8.0 10.7 2.3 4.3 4.3 11.1 24.9 19.9 0.9 0.9 13.3 10.6 22.4 15.0 100 100Japan 30.5 42.2 13.9 15.3 9.7 9.3 7.5 18.1 1.3 0.7 14.6 12.6 22.9 16.7 100 100India 16.6 21.7 5.3 8.5 3.8 5.5 1.0 4.9 6.9 3.3 0.4 0.4 27.5 19.0 10.3 6.4 100 100

Table 3 Commodity Composition of Foreign Trade for East Asian Economies (percentage share of total)
East Asia ASEAN NIES China Japan India World1990-94 2000-04 1990-94 2000-04 1990-94 2000-04 1990-94 2000-04 1990-94 2000-04 1990-94 2000-04 1990-94 2000-04
ExportsAgriculture 7.0 4.1 15.7 9.0 4.7 2.3 13.7 5.2 1.1 1.0 18.2 12.7 12.1 8.8 Raw Materials 1.9 1.0 4.4 1.9 1.3 0.9 2.5 0.7 0.5 0.5 2.1 1.1 2.5 1.7 Food 5.1 3.1 11.2 7.1 3.4 1.4 11.2 4.5 0.6 0.5 16.1 11.6 9.6 7.1Mining & fuels 5.4 5.1 16.5 12.6 2.1 3.5 6.4 4.1 1.3 1.7 6.1 10.0 9.9 11.3 Metalliferous ores and metal scrap 0.3 0.3 0.8 0.7 0.2 0.1 0.2 0.1 0.1 0.3 3.0 2.7 0.9 0.8 Mineral fuels 4.2 3.7 14.7 10.9 1.1 2.2 5.3 2.7 0.5 0.4 2.4 6.1 7.2 8.7 Non-ferrous metals 0.9 1.1 1.0 1.0 0.8 1.2 1.0 1.3 0.7 1.0 0.7 1.2 1.8 1.8Total manufacture 86.1 88.7 65.2 75.6 92.7 93.2 78.5 90.1 95.8 93.0 73.1 74.7 74.9 76.9 Chemicals 5.0 6.5 3.8 6.2 5.2 6.8 5.3 4.6 5.6 7.8 7.5 11.1 9.0 10.4 Lther, rubber, trvl goods, ftwear 4.0 2.9 2.3 1.7 7.1 3.5 6.9 5.4 1.3 1.2 6.2 3.9 2.5 2.1 Wood, paper, & furnitures 2.3 2.0 4.6 3.3 2.2 1.5 2.0 3.3 0.8 0.6 0.3 0.7 3.5 3.2 Metal 4.6 4.3 1.7 1.6 5.7 5.1 4.4 5.1 5.5 5.0 4.6 7.4 5.1 4.6 Machinery 46.6 53.6 37.6 51.0 36.8 52.6 17.4 40.6 71.6 67.1 7.2 9.0 38.0 41.4
Power gnrtr 1.9 1.7 0.9 0.9 0.9 1.0 0.8 1.1 3.9 3.9 0.7 0.8 2.5 2.6Indstral & metal wrking 6.8 6.3 3.1 3.0 4.7 4.9 2.6 3.8 12.8 12.6 1.9 2.6 8.3 7.1Office & telecm 15.9 19.4 19.5 22.0 14.4 21.6 6.3 22.3 17.7 12.2 0.7 0.9 7.9 10.2Electrical 11.1 16.8 11.9 23.2 11.2 18.0 4.0 10.1 12.7 15.2 1.2 2.0 6.9 9.3Autos 9.0 7.7 0.9 1.3 3.9 4.9 3.0 2.6 21.8 20.6 2.5 2.3 9.3 9.5Oth. transpt 1.8 1.7 1.2 0.6 1.7 2.3 0.6 0.8 2.7 2.5 0.2 0.4 3.0 2.6
Textiles & garment 12.7 9.1 8.7 5.8 20.6 11.8 29.1 18.3 2.1 1.5 27.8 21.9 7.1 5.7 Other manufactures 11.0 10.2 6.6 6.0 15.0 11.9 13.4 12.8 9.0 9.8 19.4 20.7 9.7 9.3Others 1.5 2.1 2.6 2.8 0.5 1.0 1.4 0.6 1.8 4.3 2.6 2.6 3.1 3.0Total 100 100 100 100 100 100 100 100 100 100 100 100 100 100ImportsAgriculture 12.9 8.9 8.5 6.9 9.9 6.2 9.3 7.7 23.3 15.6 7.6 7.7 12.0 9.1 Raw Materials 4.3 2.5 2.5 1.6 3.8 1.8 4.4 4.0 6.8 3.1 3.7 2.9 2.9 1.9 Food 8.6 6.3 6.1 5.2 6.1 4.4 4.9 3.7 16.4 12.5 3.9 4.8 9.2 7.2Mining & fuels 15.4 16.8 11.5 13.6 11.5 14.7 7.7 13.7 27.9 25.5 32.5 35.3 12.2 13.3 Metalliferous ores and metal scrap 1.7 1.8 0.7 0.5 1.2 1.2 1.9 3.3 3.3 2.4 2.7 1.9 1.1 1.0 Mineral fuels 11.3 12.7 9.0 11.5 8.0 11.1 4.1 7.8 21.2 20.7 27.4 31.5 9.1 10.5 Non-ferrous metals 2.4 2.3 1.8 1.6 2.3 2.4 1.7 2.6 3.4 2.4 2.4 1.9 2.0 1.8Total manufacture 68.8 72.7 76.5 77.5 75.4 77.8 82.3 77.9 45.7 56.7 50.7 47.0 72.5 74.7 Chemicals 8.8 9.0 8.9 8.6 9.0 8.3 11.7 12.2 7.0 7.3 14.0 9.2 9.1 10.5 Lther, rubber, trvl goods, ftwear 2.3 1.9 1.1 1.0 3.6 2.8 1.8 1.2 1.9 2.0 0.6 0.6 2.4 2.1 Wood, paper, & furnitures 2.1 1.7 1.6 1.3 2.2 1.5 2.7 1.5 2.3 2.6 1.0 0.9 3.4 3.2 Metal 5.3 4.0 6.6 4.6 5.1 4.1 8.6 5.5 2.7 2.1 4.5 2.7 5.1 4.6 Machinery 34.3 41.8 47.6 52.9 34.4 42.6 42.0 45.0 16.9 27.6 17.0 18.7 36.0 39.5
Power gnrtr 2.1 1.8 3.3 2.1 1.8 1.6 2.7 2.0 1.0 1.6 1.5 1.1 2.3 2.5Indstral & metal wrking 9.0 6.8 12.1 7.8 8.4 6.4 18.0 10.5 2.9 3.2 7.5 5.3 7.9 6.7Office & telecm 7.5 11.6 10.2 12.3 7.8 13.2 6.6 10.3 4.4 10.1 1.6 5.8 7.8 9.9Electrical 9.7 18.1 14.5 25.9 11.4 19.3 5.6 18.6 4.1 8.8 2.9 3.2 6.8 9.5Autos 3.7 2.3 4.1 2.9 3.3 1.5 5.7 2.3 3.0 2.9 1.0 0.7 9.0 9.0Oth. transpt 2.3 1.2 3.4 1.9 1.8 0.8 3.3 1.5 1.5 1.0 2.5 2.6 2.2 1.9
Textiles & garment 7.3 5.4 3.7 2.9 10.0 7.0 9.4 4.4 6.6 6.5 0.9 1.4 6.8 5.5 Other manufactures 8.7 8.9 7.2 6.3 11.0 11.5 6.2 8.0 8.2 8.5 12.7 13.6 9.7 9.3Others 2.9 1.6 3.5 2.0 3.2 1.3 0.7 0.7 3.1 2.2 9.2 10.0 3.3 2.9Total 100 100 100 100 100 100 100 100 100 100 100 100 100 100Note: classifications for these tables are based on SITC rev 2Source: UN-COMTRADE

e
e
e
Table 4 Similarity of Export Composition among East Asian Economies
1990-94 Indonesia Malaysia Philippines Singapor Thailand China Hong Kong Taiwan Korea Japan IndiaIndonesia 1.00 0.22 0.18 0.10 0.19 0.18 0.13 0.04 0.09 -0.06 0.09Malaysia 0.24 1.00 0.63 0.49 0.42 0.08 0.34 0.44 0.60 0.35 -0.02Philippines 0.20 0.49 1.00 0.38 0.50 0.28 0.42 0.38 0.51 0.21 0.11Singapore 0.21 0.49 0.42 1.00 0.35 0.10 0.28 0.57 0.49 0.39 0.03Thailand 0.11 0.47 0.43 0.28 1.00 0.42 0.52 0.52 0.43 0.20 0.34China 0.06 0.05 0.07 0.11 0.13 1.00 0.73 0.36 0.30 0.04 0.28Hong Kong 0.05 0.48 0.27 0.40 0.38 0.36 1.00 0.62 0.50 0.23 0.23Taiwan 0.02 0.43 0.29 0.31 0.37 0.22 0.74 1.00 0.59 0.40 0.03Korea 0.08 0.63 0.48 0.51 0.37 0.22 0.63 0.63 1.00 0.55 0.06Japan -0.04 0.62 0.38 0.47 0.34 0.10 0.59 0.58 0.70 1.00 -0.05India 0.05 -0.03 0.08 -0.03 0.28 0.06 0.07 -0.01 0.00 -0.04 1.00
2000-04 Indonesia Malaysia Philippines Singapor Thailand China Hong Kong Taiwan Korea Japan IndiaIndonesia 1.00 0.33 0.13 0.18 0.26 0.34 0.27 0.19 0.20 0.07 0.12Malaysia 0.38 1.00 0.89 0.92 0.81 0.46 0.68 0.90 0.73 0.53 -0.01Philippines 0.13 0.94 1.00 0.93 0.69 0.33 0.58 0.84 0.67 0.51 0.01Singapore 0.19 0.92 0.94 1.00 0.74 0.42 0.61 0.89 0.76 0.54 0.06Thailand 0.24 0.83 0.75 0.76 1.00 0.55 0.69 0.80 0.67 0.49 0.12China 0.18 0.46 0.41 0.46 0.55 1.00 0.79 0.53 0.48 0.27 0.14Hong Kong 0.20 0.80 0.75 0.76 0.80 0.74 1.00 0.72 0.63 0.43 0.15Taiwan 0.16 0.90 0.92 0.91 0.78 0.47 0.83 1.00 0.76 0.58 0.02Korea 0.22 0.83 0.82 0.91 0.77 0.53 0.81 0.88 1.00 0.75 0.07Japan 0.12 0.81 0.83 0.84 0.70 0.41 0.77 0.90 0.80 1.00 -0.01India 0.04 0.01 0.00 0.03 0.07 0.03 0.06 0.03 0.05 0.00 1.00
Change from 1990-94 to 2000-04Indonesia Malaysia Philippines Singapor Thailand China Hong Kong Taiwan Korea Japan India
Indonesia 0.00 0.11 -0.05 0.09 0.07 0.16 0.14 0.16 0.11 0.13 0.03Malaysia 0.14 0.00 0.26 0.43 0.39 0.38 0.34 0.46 0.13 0.18 0.02Philippines -0.07 0.44 0.00 0.54 0.19 0.05 0.16 0.45 0.16 0.30 -0.10Singapore -0.02 0.43 0.52 0.00 0.39 0.32 0.33 0.32 0.27 0.15 0.03Thailand 0.14 0.36 0.33 0.48 0.00 0.13 0.18 0.29 0.24 0.30 -0.22China 0.12 0.42 0.34 0.35 0.42 0.00 0.06 0.18 0.18 0.23 -0.14Hong Kong 0.15 0.32 0.48 0.37 0.42 0.38 0.00 0.11 0.13 0.20 -0.08Taiwan 0.14 0.46 0.63 0.59 0.40 0.24 0.09 0.00 0.17 0.18 -0.01Korea 0.14 0.21 0.34 0.40 0.40 0.31 0.18 0.25 0.00 0.20 0.01Japan 0.16 0.19 0.45 0.37 0.35 0.31 0.17 0.32 0.10 0.00 0.03India -0.01 0.04 -0.08 0.06 -0.20 -0.03 -0.01 0.04 0.05 0.04 0.00Note: The figures indicate the correlatoin coefficients of the compositional shares of exports for a pair of economies.Below diagonal are with respect to total export to E. Asia, above diagonal are with respect to total export to the world

s
e
s
e
Table 5 Changing Patterns of Trade for East Asia by Commodity (%)
Destinations of East Asia's Exports by CommodityEast Asia ASEAN China NIES Japan South Asia EU US
1990-94 2000-04 1990-94 2000-04 1990-94 2000-04 1990-94 2000-04 1990-94 2000-04 1990-94 2000-04 1990-94 2000-04 1990-94 2000-04Agriculture 60.6 58.3 13.1 14.3 6.1 11.8 17.1 14.0 25.1 19.3 2.6 4.4 13.0 11.2 9.5 10.7 Raw Materials 64.6 63.2 12.6 11.4 9.8 25.2 21.6 14.6 20.7 12.2 2.9 3.9 14.3 13.7 8.6 9.1 Food 59.1 56.7 13.2 15.2 4.8 7.4 15.5 13.8 26.7 21.6 2.5 4.6 12.5 10.3 9.9 11.2Mining & fuels 80.7 76.9 19.9 20.5 7.5 12.4 20.3 24.5 33.3 20.3 2.4 3.1 2.7 3.7 5.6 4.5 Metalliferous ores and metal 80.4 76.5 7.9 8.5 9.1 20.3 14.2 24.0 49.4 23.8 2.9 4.5 7.3 13.9 3.6 1.5 Mineral fuels 81.1 75.9 20.1 21.7 6.4 9.4 18.7 22.1 36.3 23.8 2.4 3.0 1.8 2.3 5.4 4.4 Non-ferrous metals 79.0 80.4 23.1 19.9 12.6 20.3 30.5 32.3 13.1 8.1 2.6 2.7 5.5 5.5 7.8 5.5Total manufacture 40.5 46.9 12.5 12.3 6.4 11.1 16.0 16.7 5.8 7.0 1.2 1.4 16.9 15.5 26.7 22.9 Chemicals 64.4 63.9 18.6 15.1 14.8 22.8 26.0 21.5 5.4 4.9 2.9 3.1 12.2 11.9 11.0 11.3 Lther, rubber, trvl goods, ftw 30.5 31.1 5.3 5.5 4.2 7.7 14.0 10.6 7.2 7.6 0.4 0.6 18.0 18.3 35.3 31.0 Wood, paper, & furnitures 56.4 45.6 8.8 8.1 11.6 8.3 19.6 14.0 16.7 15.5 0.7 1.1 12.2 13.0 20.2 27.8 Metal 54.3 54.6 18.4 15.8 10.0 13.4 17.3 19.0 9.1 6.8 2.2 1.7 9.3 10.9 19.5 18.7 Machinery 36.2 46.1 14.5 13.8 5.1 10.3 13.5 16.3 3.4 6.0 0.9 1.0 17.9 16.4 29.7 23.9
Power gnrtr 42.4 42.4 19.5 16.9 6.3 9.9 12.7 11.1 4.3 4.8 2.5 2.1 11.9 12.8 28.1 27.9Indstral & metal wrking 54.7 52.3 21.3 16.0 10.7 15.0 20.6 17.9 2.5 3.7 2.2 2.2 11.3 13.2 18.2 18.3Office & telecm 28.8 41.9 11.1 10.4 4.3 9.7 9.8 14.1 3.7 7.8 0.3 1.0 24.6 20.9 34.7 27.2Electrical 50.8 66.1 20.4 20.3 4.0 13.2 21.0 25.4 5.5 7.2 0.7 0.6 14.5 12.0 26.4 15.6Autos 19.7 15.6 7.5 6.9 3.9 3.4 7.6 4.1 1.1 1.6 0.9 0.9 18.3 17.6 38.2 40.6Oth. transpt 16.8 16.5 10.7 8.1 1.8 0.9 4.1 6.4 0.7 1.4 2.1 1.2 10.5 18.9 8.3 9.1
Textiles & garment 44.9 45.3 7.0 7.2 7.9 10.8 20.0 16.1 10.1 12.0 1.6 2.4 15.9 13.0 20.7 19.0 Other manufactures 37.5 42.9 8.9 8.4 4.8 8.9 17.0 17.8 7.0 7.9 0.9 1.5 19.8 17.0 29.0 27.1Others 37.9 49.6 15.4 18.0 4.7 7.2 13.2 21.2 4.9 3.5 1.8 1.7 14.6 13.3 30.5 17.9Total Trade 44.1 49.0 13.0 12.9 6.4 11.1 16.3 17.1 8.6 8.2 1.4 1.6 15.9 14.7 24.4 21.4Sources of East Asia's Imports by Commodity
East Asia ASEAN China NIES Japan South Asia EU US1990-94 2000-04 1990-94 2000-04 1990-94 2000-04 1990-94 2000-04 1990-94 2000-04 1990-94 2000-04 1990-94 2000-04 1990-94 2000-04
Agriculture 33.4 31.5 16.1 15.6 8.5 9.8 6.8 4.2 2.5 2.3 1.8 1.7 9.3 9.8 27.6 23.3 Raw Materials 32.9 31.4 19.9 17.9 5.3 4.6 5.5 5.9 3.6 4.0 1.8 0.7 5.3 9.5 28.1 19.2 Food 33.6 31.5 14.2 14.7 10.1 11.9 7.5 3.5 1.9 1.7 1.8 2.1 11.3 10.0 27.3 24.9Mining & fuels 29.7 27.4 21.8 17.0 3.7 4.0 2.8 5.0 3.0 2.6 0.9 1.4 2.8 1.9 6.2 2.5 Metalliferous ores and metal 16.0 19.0 10.3 10.1 1.3 0.9 2.5 3.0 2.1 5.1 5.0 7.3 6.1 4.9 13.9 8.3 Mineral fuels 32.0 26.7 26.9 19.8 4.0 3.6 1.9 4.1 1.4 0.8 0.3 0.6 0.8 0.6 4.0 1.3 Non-ferrous metals 28.8 37.7 6.2 6.9 4.0 8.9 7.6 11.4 11.0 10.6 0.7 1.1 9.7 6.5 11.3 4.5Total manufacture 57.4 64.0 8.8 14.0 10.7 16.7 14.9 16.2 23.0 17.2 0.9 0.9 17.1 13.9 17.0 13.5 Chemicals 38.9 49.9 5.9 11.7 3.8 4.9 12.1 17.2 17.1 16.1 0.6 1.3 24.1 20.6 23.0 16.5 Lther, rubber, trvl goods, ftw 70.0 69.9 4.4 7.8 38.5 45.7 21.0 11.7 6.0 5.0 1.5 2.1 18.1 17.2 6.1 4.6 Wood, paper, & furnitures 60.8 65.1 29.1 26.7 8.0 20.6 13.3 11.4 10.5 6.6 0.1 0.2 16.0 16.2 15.1 10.3 Metal 55.4 64.7 4.2 5.5 6.1 12.7 15.1 20.4 30.0 26.0 0.8 1.5 12.7 10.4 5.9 4.8 Machinery 57.0 65.4 10.6 17.4 4.8 12.7 12.0 16.4 29.6 19.0 0.1 0.2 18.1 13.4 20.8 15.1
Power gnrtr 44.6 44.4 5.0 9.6 4.4 10.4 5.3 6.0 29.9 18.4 0.2 0.4 22.0 22.4 27.7 23.7Indstral & metal wrking 50.8 52.3 3.9 5.8 1.5 5.2 11.7 11.3 33.6 30.1 0.2 0.2 29.0 25.9 15.1 16.6Office & telecm 71.5 75.6 21.0 22.2 10.9 24.5 13.4 16.5 26.2 12.5 0.1 0.2 7.4 7.4 18.6 10.1Electrical 66.5 71.5 15.3 21.8 5.1 10.0 16.5 21.4 29.5 18.4 0.1 0.1 10.0 8.1 21.4 15.0Autos 51.9 47.8 1.9 6.0 1.9 5.1 8.0 7.0 40.1 29.8 0.1 0.2 31.2 37.5 12.0 8.0Oth. transpt 13.6 13.2 2.4 2.8 0.8 1.4 2.2 2.3 8.3 6.8 0.1 0.1 19.4 20.1 55.4 55.5
Textiles & garment 82.0 83.1 5.7 6.8 36.1 51.0 32.2 19.3 8.1 6.3 3.1 3.3 8.4 6.9 3.1 2.0 Other manufactures 53.6 58.4 6.2 7.3 16.1 21.1 12.8 12.5 18.5 17.5 2.7 2.4 16.5 14.4 17.7 16.5Others 25.2 45.7 8.0 16.1 2.0 5.0 8.6 17.7 6.8 7.0 0.2 0.4 15.3 12.7 25.0 16.1Total Trade 49.1 54.6 11.7 14.6 9.2 13.8 11.8 13.2 16.8 13.3 1.0 1.1 13.9 11.5 16.9 12.5

Table 6 Revealed Comparative AdvantagePeriod Period
Reporters Technology class/1 1990-94 2000-04 Reporters Technology class/1 1990-94 2000-04China & Hong Kong PhilipinnesA. Resources-
a.1. Agro based 0.53 0.45 A. Resources-
a.1. Agro based 1.40 0.60a.2. Fuel, mining 0.54 0.51 a.2. Fuel, mining 0.63 0.32
B. Low technology
b.1 Textiles, garment, shoes 4.00 3.33 B. Low technology
b.1 Textiles, garment, shoes 1.63 1.12b.2 Glass, iron, steel 1.65 1.64 b.2 Glass, iron, steel 0.78 0.34
C. Medium technology
c.1. Automotive 0.25 0.14 C. Medium technology
c.1. Automotive 0.09 0.28c.2. Process 0.74 0.73 c.2. Process 0.36 0.15c.3. Engineering 0.84 0.95 c.3. Engineering 0.31 0.46
D. High technology
d.1. Electrical, electronics 0.99 1.70 D. High technology
d.1. Electrical, electronics 1.19 3.60d.2. Engines, aircraft, optics 0.39 0.42 d.2. Engines, aircraft, optics 0.07 0.18
Indonesia SingaporeA. Resources-
a.1. Agro based 2.27 2.39 A. Resources-
a.1. Agro based 0.58 0.30a.2. Fuel, mining 0.93 1.11 a.2. Fuel, mining 2.08 1.68
B. Low technology
b.1 Textiles, garment, shoes 2.02 2.05 B. Low technology
b.1 Textiles, garment, shoes 0.45 0.28b.2 Glass, iron, steel 0.56 0.86 b.2 Glass, iron, steel 0.49 0.51
C. Medium technology
c.1. Automotive 0.06 0.11 C. Medium technology
c.1. Automotive 0.11 0.08c.2. Process 0.71 0.82 c.2. Process 0.67 0.79c.3. Engineering 0.13 0.41 c.3. Engineering 1.01 0.72
D. High technology
d.1. Electrical, electronics 0.18 0.61 D. High technology
d.1. Electrical, electronics 3.38 3.15d.2. Engines, aircraft, optics 0.09 0.07 d.2. Engines, aircraft, optics 0.40 0.52
Japan ThailandA. Resources-
a.1. Agro based 0.27 0.33 A. Resources-
a.1. Agro based 1.34 1.52a.2. Fuel, mining 0.47 0.55 a.2. Fuel, mining 0.65 0.74
B. Low technology
b.1 Textiles, garment, shoes 0.18 0.17 B. Low technology
b.1 Textiles, garment, shoes 2.36 1.44b.2 Glass, iron, steel 0.79 0.71 b.2 Glass, iron, steel 1.12 0.98
C. Medium technology
c.1. Automotive 2.38 2.22 C. Medium technology
c.1. Automotive 0.12 0.47c.2. Process 0.83 1.04 c.2. Process 0.51 0.81c.3. Engineering 1.65 1.67 c.3. Engineering 0.58 0.78
D. High technology
d.1. Electrical, electronics 2.11 1.37 D. High technology
d.1. Electrical, electronics 1.54 1.69d.2. Engines, aircraft, optics 0.65 0.82 d.2. Engines, aircraft, optics 0.20 0.21
S.Korea TaiwanA. Resources-
a.1. Agro based 0.42 0.45 A. Resources-
a.1. Agro based 0.43 0.28a.2. Fuel, mining 0.57 0.94 a.2. Fuel, mining 0.34 0.46
B. Low technology
b.1 Textiles, garment, shoes 2.46 1.13 B. Low technology
b.1 Textiles, garment, shoes 2.17 1.20b.2 Glass, iron, steel 1.25 0.81 b.2 Glass, iron, steel 2.08 1.63
C. Medium technology
c.1. Automotive 0.53 1.18 C. Medium technology
c.1. Automotive 0.44 0.34c.2. Process 1.72 1.33 c.2. Process 1.07 1.38c.3. Engineering 1.03 1.11 c.3. Engineering 0.88 0.86
D. High technology
d.1. Electrical, electronics 1.84 2.02 D. High technology
d.1. Electrical, electronics 2.15 2.43d.2. Engines, aircraft, optics 0.24 0.22 d.2. Engines, aircraft, optics 0.24 0.62
Malaysia VietnamA. Resources-
a.1. Agro based 2.28 1.48 A. Resources-
a.1. Agro based 0.63a.2. Fuel, mining 0.31 0.45 a.2. Fuel, mining 0.38
B. Low technology
b.1 Textiles, garment, shoes 0.69 0.47 B. Low technology
b.1 Textiles, garment, shoes 4.44b.2 Glass, iron, steel 0.61 0.64 b.2 Glass, iron, steel 0.69
C. Medium technology
c.1. Automotive 0.06 0.05 C. Medium technology
c.1. Automotive 0.10c.2. Process 0.37 0.70 c.2. Process 0.20c.3. Engineering 0.89 0.73 c.3. Engineering 0.20
D. High technology
d.1. Electrical, electronics 2.52 2.87 D. High technology
d.1. Electrical, electronics 0.30d.2. Engines, aircraft, optics 0.57 0.34 d.2. Engines, aircraft, optics 0.05
Note: Technology classification is based on Lall (2000)Sources: COMTRADE

Table 7 Intra-industry Trade in East Asia: Manufactured Products (Intra-Industy Trade Index)
Trading PartnersEast Asia ASEAN NIES China Japan India World
90-94 00-04 Change 90-94 00-04 Change 90-94 00-04 Change 90-94 00-04 Change 90-94 00-04 Change 90-94 00-04 Change 90-94 00-04 ChangeChemicals (SITC 5)East Asia 0.64 0.64 0.00 0.42 0.53 0.11 0.45 0.50 0.05 0.33 0.26 -0.07 0.31 0.34 0.03 0.32 0.34 0.02 0.60 0.62 0.02ASEAN 0.56 0.60 0.04 0.52 0.61 0.09 0.49 0.56 0.07 0.30 0.27 -0.03 0.26 0.51 0.25 0.22 0.44 0.22 0.46 0.58 0.12 Indonesia 0.27 0.51 0.24 0.27 0.43 0.16 0.26 0.42 0.16 0.09 0.19 0.10 0.14 0.41 0.27 0.14 0.22 0.08 0.25 0.47 0.22 Malaysia 0.35 0.51 0.16 0.43 0.51 0.08 0.28 0.44 0.16 0.22 0.17 -0.05 0.19 0.49 0.30 0.36 0.33 -0.03 0.33 0.51 0.18 Philippines 0.36 0.19 -0.17 0.40 0.20 -0.20 0.16 0.13 -0.03 0.27 0.17 -0.10 0.21 0.12 -0.09 0.24 0.25 0.01 0.29 0.20 -0.09 Singapore 0.58 0.40 -0.18 0.25 0.31 0.06 0.45 0.33 -0.12 0.32 0.20 -0.12 0.32 0.49 0.17 0.02 0.55 0.51 -0.04 Thailand 0.26 0.39 0.13 0.34 0.35 0.01 0.24 0.31 0.07 0.13 0.21 0.08 0.17 0.24 0.07 0.46 0.55 0.09 0.23 0.38 0.15NIES 0.53 0.52 -0.01 0.44 0.51 0.07 0.42 0.45 0.03 0.26 0.22 -0.04 0.23 0.24 0.01 0.43 0.39 -0.04 0.46 0.48 0.02 Hong Kong 0.39 0.38 -0.01 0.40 0.18 -0.22 0.22 0.14 -0.08 0.22 0.17 -0.05 0.18 0.06 -0.12 0.29 0.38 0.09 0.49 0.44 -0.05 Taiwan 0.43 0.43 0.00 0.36 0.54 0.18 0.18 0.19 0.01 0.03 0.19 0.16 0.18 0.21 0.03 0.13 0.40 0.27 0.32 0.41 0.09 Korea 0.49 0.49 0.00 0.24 0.35 0.11 0.16 0.20 0.04 0.26 0.18 -0.08 0.28 0.33 0.05 0.32 0.49 0.17 0.41 0.46 0.05 China 0.34 0.25 -0.09 0.27 0.22 -0.05 0.27 0.24 -0.03 0.36 0.26 -0.10 0.40 0.47 0.07 0.37 0.35 -0.02 Japan 0.29 0.35 0.06 0.26 0.42 0.16 0.20 0.24 0.04 0.40 0.32 -0.08 0.50 0.59 0.09 0.58 0.55 -0.03Materials (SITC 6)East Asia 0.76 0.79 0.03 0.41 0.53 0.12 0.72 0.69 -0.03 0.50 0.56 0.06 0.38 0.40 0.02 0.21 0.30 0.09 0.63 0.68 0.05ASEAN 0.50 0.60 0.10 0.67 0.76 0.09 0.39 0.45 0.06 0.17 0.37 0.20 0.19 0.32 0.13 0.13 0.46 0.33 0.51 0.61 0.10 Indonesia 0.28 0.33 0.05 0.19 0.27 0.08 0.29 0.29 0.00 0.08 0.27 0.19 0.11 0.19 0.08 0.32 0.17 -0.15 0.29 0.33 0.04 Malaysia 0.41 0.54 0.13 0.58 0.65 0.07 0.32 0.38 0.06 0.11 0.44 0.33 0.11 0.20 0.09 0.25 0.28 0.03 0.41 0.54 0.13 Philippines 0.18 0.27 0.09 0.30 0.41 0.11 0.13 0.22 0.09 0.11 0.13 0.02 0.13 0.20 0.07 0.08 0.24 0.16 0.22 0.33 0.11 Singapore 0.61 0.64 0.03 0.53 0.64 0.11 0.43 0.52 0.09 0.17 0.36 0.19 0.10 0.16 0.06 0.03 0.60 0.64 0.04 Thailand 0.33 0.49 0.16 0.46 0.48 0.02 0.45 0.47 0.02 0.14 0.32 0.18 0.12 0.26 0.14 0.21 0.39 0.18 0.44 0.52 0.08NIES 0.66 0.66 0.00 0.31 0.40 0.09 0.68 0.65 -0.03 0.51 0.59 0.08 0.45 0.47 0.02 0.24 0.44 0.20 0.59 0.63 0.04 Hong Kong 0.82 0.77 -0.05 0.47 0.43 -0.04 0.23 0.11 -0.12 0.48 0.60 0.12 0.22 0.23 0.01 0.32 0.28 -0.04 0.81 0.81 0.00 Taiwan 0.44 0.45 0.01 0.27 0.33 0.06 0.18 0.15 -0.03 0.04 0.37 0.33 0.42 0.47 0.05 0.16 0.25 0.09 0.38 0.38 0.00 Korea 0.47 0.48 0.01 0.15 0.27 0.12 0.22 0.20 -0.02 0.38 0.41 0.03 0.38 0.43 0.05 0.10 0.10 0.00 0.45 0.47 0.02 China 0.51 0.52 0.01 0.19 0.35 0.16 0.57 0.54 -0.03 0.31 0.31 0.00 0.27 0.40 0.13 0.46 0.52 0.06 Japan 0.39 0.39 0.00 0.19 0.29 0.10 0.43 0.41 -0.02 0.31 0.30 -0.01 0.24 0.40 0.16 0.42 0.41 -0.01Machinery & transport (SITC 7)East Asia 0.93 0.93 0.00 0.61 0.76 0.15 0.65 0.80 0.15 0.51 0.68 0.17 0.29 0.50 0.21 0.02 0.28 0.26 0.67 0.74 0.07ASEAN 0.66 0.86 0.20 0.87 0.87 0.00 0.70 0.74 0.04 0.53 0.63 0.10 0.28 0.53 0.25 0.18 0.47 0.29 0.63 0.79 0.16 Indonesia 0.19 0.38 0.19 0.48 0.35 -0.13 0.14 0.45 0.31 0.07 0.38 0.31 0.05 0.22 0.17 0.07 0.30 0.23 0.17 0.37 0.20 Malaysia 0.62 0.81 0.19 0.71 0.78 0.07 0.58 0.74 0.16 0.37 0.62 0.25 0.30 0.40 0.10 0.38 0.24 -0.14 0.66 0.69 0.03 Philippines 0.41 0.68 0.27 0.40 0.66 0.26 0.41 0.69 0.28 0.10 0.55 0.45 0.26 0.60 0.34 0.22 0.26 0.04 0.50 0.75 0.25 Singapore 0.73 0.86 0.13 0.70 0.78 0.08 0.68 0.70 0.02 0.56 0.58 0.02 0.31 0.53 0.22 0.07 0.73 0.81 0.08 Thailand 0.50 0.69 0.19 0.74 0.69 -0.05 0.55 0.64 0.09 0.23 0.69 0.46 0.24 0.47 0.23 0.48 0.35 -0.13 0.50 0.68 0.18NIES 0.79 0.88 0.09 0.66 0.70 0.04 0.75 0.85 0.10 0.50 0.68 0.18 0.31 0.50 0.19 0.10 0.16 0.06 0.70 0.76 0.06 Hong Kong 0.79 0.83 0.04 0.64 0.58 -0.06 0.67 0.57 -0.10 0.49 0.70 0.21 0.23 0.40 0.17 0.14 0.13 -0.01 0.80 0.90 0.10 Taiwan 0.66 0.78 0.12 0.46 0.65 0.19 0.43 0.50 0.07 0.16 0.62 0.46 0.31 0.48 0.17 0.05 0.07 0.02 0.54 0.68 0.14 Korea 0.63 0.74 0.11 0.39 0.70 0.31 0.58 0.58 0.00 0.41 0.54 0.13 0.34 0.49 0.15 0.01 0.15 0.14 0.52 0.56 0.04 China 0.50 0.56 0.06 0.46 0.52 0.06 0.52 0.55 0.03 0.25 0.40 0.15 0.08 0.11 0.03 0.46 0.53 0.07 Japan 0.26 0.50 0.24 0.25 0.46 0.21 0.26 0.46 0.20 0.25 0.45 0.20 0.25 0.23 -0.02 0.26 0.44 0.18Other manufactured goods (SITC 8)East Asia 0.82 0.79 -0.03 0.62 0.74 0.12 0.62 0.52 -0.10 0.28 0.28 0.00 0.31 0.34 0.03 0.27 0.31 0.04 0.57 0.69 0.12ASEAN 0.68 0.78 0.10 0.70 0.76 0.06 0.60 0.64 0.04 0.26 0.40 0.14 0.36 0.49 0.13 0.10 0.36 0.26 0.48 0.57 0.09 Indonesia 0.32 0.39 0.07 0.09 0.27 0.18 0.33 0.56 0.23 0.07 0.26 0.19 0.17 0.14 -0.03 0.14 0.25 0.11 0.13 0.12 -0.01 Malaysia 0.54 0.75 0.21 0.53 0.67 0.14 0.48 0.67 0.19 0.18 0.41 0.23 0.43 0.54 0.11 0.20 0.17 -0.03 0.42 0.57 0.15 Philippines 0.44 0.62 0.18 0.36 0.59 0.23 0.42 0.44 0.02 0.21 0.19 -0.02 0.20 0.50 0.30 0.41 0.45 0.04 0.18 0.34 0.16 Singapore 0.61 0.63 0.02 0.51 0.56 0.05 0.55 0.51 -0.04 0.20 0.33 0.13 0.41 0.44 0.03 0.26 0.72 0.76 0.04 Thailand 0.47 0.51 0.04 0.41 0.59 0.18 0.47 0.47 0.00 0.23 0.31 0.08 0.26 0.37 0.11 0.24 0.26 0.02 0.26 0.36 0.10NIES 0.72 0.61 -0.11 0.53 0.62 0.09 0.66 0.64 -0.02 0.33 0.33 0.00 0.30 0.38 0.08 0.30 0.36 0.06 0.48 0.72 0.24 Hong Kong 0.59 0.56 -0.03 0.54 0.58 0.04 0.56 0.62 0.06 0.33 0.31 -0.02 0.34 0.43 0.09 0.12 0.18 0.06 0.60 0.77 0.17 Taiwan 0.49 0.52 0.03 0.41 0.42 0.01 0.33 0.40 0.07 0.05 0.31 0.26 0.37 0.34 -0.03 0.38 0.21 -0.17 0.29 0.45 0.16 Korea 0.34 0.56 0.22 0.52 0.52 0.00 0.49 0.64 0.15 0.43 0.42 -0.01 0.20 0.29 0.09 0.04 0.05 0.01 0.27 0.59 0.32 China 0.23 0.30 0.07 0.16 0.39 0.23 0.22 0.32 0.10 0.19 0.23 0.04 0.30 0.34 0.04 0.16 0.23 0.07 Japan 0.26 0.29 0.03 0.32 0.43 0.11 0.31 0.32 0.01 0.08 0.15 0.07 0.24 0.26 0.02 0.43 0.42 -0.01Note: The intra-industry trade (IIT) index is computated by using trade data based on 3-digit SITC classification. The definition of IIT index is given in the main text.

Table 8 Intra-Industry Trade within East Asia
Year
Inter-industry
trade
Horizontal intra-
industry trade
Vertical intra-
industry trade
1990 42.5 3.3 54.21991 40.8 3.7 55.51992 23.8 11.7 64.51993 34.6 14.1 51.31994 33.0 13.7 53.31995 31.8 14.1 54.21996 31.0 15.4 53.62000 27.4 16.1 56.52001 25.5 14.0 60.52002 21.6 19.9 58.52003 23.4 16.4 60.32004 21.3 15.1 63.5
Note: aggregation is based on 6-digit HS1988Computed using method proposed by Fukao, Ishido, and Ito (2003)Source: UN-COMTRADE

g
Table 9 Parts Trade for East Asian Economies: Share of Total (%)
Export DestinationsExportin East Asia ASEAN NIES China Japan India US EU WorldRegions 90-94 00-04 90-94 00-04 90-94 00-04 90-94 00-04 90-94 00-04 90-94 00-04 90-94 00-04 90-94 00-04 90-94 00-04Office and telecommunications equipment: (SITC 759 + 764 ) / (SITC 75+76)East Asia 58.2 66.7 65.3 76.4 47.6 61.5 70.8 80.7 49.4 45.8 57.0 68.6 41.0 43.8 38.2 43.7 44.5 54.2ASEAN 56.9 62.3 68.7 76.2 39.0 54.9 73.7 64.7 42.6 43.5 43.3 53.2 33.7 39.1 24.8 38.4 38.3 49.2NIES 69.4 75.0 65.0 81.1 69.3 73.3 79.5 81.7 56.5 51.6 77.1 85.1 41.3 56.6 36.2 52.3 46.9 64.9China 39.0 56.6 44.1 72.1 36.5 58.5 51.1 42.3 29.0 74.3 40.2 34.8 32.7 36.5 37.1 46.2Japan 53.3 71.7 60.6 74.0 50.0 61.1 42.9 88.5 61.0 66.6 46.0 42.1 47.9 43.8 48.1 51.6Electrical & Apparatus: (SITC 771+772+773+776 ) / SITC 77East Asia 81.2 85.4 84.3 88.1 79.0 84.6 68.5 83.8 86.7 83.1 74.7 73.1 73.1 69.7 64.7 70.0 74.2 79.3ASEAN 87.1 91.8 85.6 89.8 87.5 95.1 69.2 90.3 89.8 90.3 80.6 86.0 90.7 93.1 87.8 93.7 86.6 91.6NIES 82.3 87.2 87.3 91.8 83.8 88.9 68.4 84.6 85.1 83.4 76.3 73.5 67.9 69.1 56.5 68.0 71.5 80.9China 56.3 72.2 63.2 76.2 52.4 72.4 77.4 68.2 53.9 52.9 33.9 37.0 27.6 35.8 47.2 55.9Japan 79.4 80.2 81.7 84.9 78.5 77.5 69.0 77.9 71.0 57.8 68.7 60.2 59.3 59.6 71.3 73.1Road vehicles: SITC 784 / (SITC 722+781+782+783+784)East Asia 48.7 53.9 45.0 48.8 63.2 58.4 20.6 46.4 94.9 92.7 87.9 90.9 21.5 19.5 13.2 18.8 23.3 23.6ASEAN 67.7 78.1 58.3 68.5 56.7 89.0 64.9 86.0 91.4 87.3 81.6 94.4 97.7 98.3 19.0 40.2 55.8 58.5NIES 30.0 44.2 32.2 32.4 44.0 60.9 21.2 39.0 93.3 92.2 96.0 33.5 14.9 15.7 10.8 26.4 21.5China 97.7 88.3 79.2 79.1 98.4 63.6 99.1 99.2 52.7 95.6 95.7 92.3 92.8 83.5Japan 42.4 50.7 43.6 47.2 45.6 55.1 18.4 50.9 88.5 86.2 20.2 18.2 12.7 18.5 20.2 20.8Textiles and Apparel: SITC 65 / SITC (65 + 84)East Asia 62.6 56.0 84.9 79.8 64.4 56.9 91.1 83.0 21.8 18.5 97.6 97.0 14.1 16.6 21.7 23.8 44.5 43.8ASEAN 63.3 62.5 73.1 74.8 77.8 71.2 94.0 91.1 29.1 37.2 96.3 93.4 9.2 6.3 23.0 18.5 32.7 29.8NIES 75.4 76.2 91.2 86.9 93.3 88.5 90.8 80.0 19.5 22.9 98.3 97.2 10.7 14.4 13.8 16.9 47.2 53.4China 37.3 32.4 76.3 62.3 40.8 42.6 23.1 15.4 88.1 98.1 24.0 25.4 31.4 29.0 35.5 33.5Japan 93.6 93.6 97.0 97.0 92.2 84.2 94.3 98.3 99.9 99.8 82.7 85.7 82.0 85.1 91.3 92.5

Table 10 Sources of FDI Inflows to East Asian Developing Economies (%)
China (Actualized) Indonesia (Approved) Malaysia (Approved) Philippines (BOP) Singapore (Commited) Thailand (BOP) Korea (Approved) Taiwan (Approved)1995-99 2000-04 1995-99 2000-04 1995-99 2000-04 1995-99 2000-04 1995-99 2000-04 1995-99 2000-04 1995-99 2000-04 1995-99 2000-04
World 100 100 100 100 100 100 100 100 100 100 100 100 100 100 100 100East Asia 73.1 61.6 38.3 41.7 45.4 36.4 48.5 37.5 29.0 21.6 52.0 99.1 26.3 26.5 34.8 31.0 Japan 8.3 8.6 14.7 9.7 18.6 11.6 25.4 24.3 29.0 21.6 26.5 42.1 8.8 13.5 17.2 15.2East Asia ex Japan 64.8 52.9 23.6 32.0 26.8 24.9 23.1 13.3 0.0 0.0 25.5 57.0 17.6 13.0 17.7 15.8 China 0.0 0.0 0.1 10.2 0.7 4.4 2.7 0.0 0.0 0.0 0.0 0.5 0.2 2.9 0.0 0.0 Korea 3.6 6.7 2.9 3.1 3.2 4.5 1.6 0.1 0.0 0.0 0.9 1.2 0.0 0.0 0.5 1.4 Taiwan 7.4 6.2 4.8 0.7 7.7 4.2 2.6 0.2 0.0 0.0 3.6 5.2 0.1 1.0 0.0 0.0 Hong Kong 45.8 34.1 2.9 3.2 0.5 0.8 8.8 1.4 0.0 0.0 9.4 9.0 2.4 1.2 6.2 3.1 Singapore 6.1 4.2 6.9 9.6 14.2 9.8 6.2 10.8 0.0 0.0 10.6 37.7 4.8 2.3 7.5 8.8 Indonesia 0.2 0.3 0.0 0.0 0.5 0.4 0.0 0.1 0.0 0.0 0.2 0.1 0.0 0.0 0.1 0.0 Malaysia 0.8 0.6 4.5 4.9 0.0 0.0 1.2 0.6 0.0 0.0 0.5 1.2 10.0 5.4 0.3 2.4 Philippines 0.3 0.4 0.1 0.2 0.0 0.3 0.0 0.0 0.0 0.0 0.1 1.9 0.0 0.0 3.1 0.0 Thailand 0.6 0.4 1.3 0.2 0.0 0.5 0.0 0.1 0.0 0.0 0.0 0.0 0.0 0.1 0.0 0.1 Vietnam 0.0 0.0 0.0 0.0 0.0 0.0 0.0 0.0 0.0 0.0 0.0 0.0 0.0 0.0 0.0 0.0 Cambodia 0.0 0.0 0.0 0.0 0.0 0.0 0.0 0.0 0.0 0.0 0.0 0.1 0.0 0.0 0.0 0.0 Brunei 0.0 0.1 0.0 0.0 0.0 0.0 0.0 0.0 0.0 0.0 0.0 0.0 0.0 0.0 0.0 0.0 Myanmmar 0.0 0.0 0.0 0.0 0.0 0.0 0.0 0.0 0.0 0.0 0.0 0.1 0.0 0.0 0.0 0.0 Laos 0.0 0.0 0.0 0.0 0.0 0.0 0.0 0.0 0.0 0.0 0.1 0.0 0.0 0.0 0.0 0.0US 8.5 8.8 4.0 1.7 29.7 21.2 20.6 19.1 45.3 42.4 20.4 2.2 31.3 31.5 24.9 16.6EU 7.7 7.0 24.0 17.0 9.1 30.3 18.7 4.8 23.2 30.8 17.3 -0.2 29.5 21.6 7.5 17.0Note: The EU includes Italy, UK, the Netherlands, France and Germany. In the case of Singapore, the EU indicates Europe.Source: Country data sources.

Table 11 Sectoral Distribution of FDI Inflows (%)
Malaysia (Approved) Thailand (BOP) Korea (Approved) Taiwan (Approved)1995-99 2000-04 1995-99 2000-04 1995-99 2000-04 1995-99 2000-04
Manufacturing 100 100 100 100 100 100 100 100Food 2.5 3.5 7.3 7.3 11.9 4.4 3.2 3.4Textiles 2.6 1.9 4.2 2.6 1.3 0.9 2.8 1.3Wood 8.2 8.0 a a 11.3 0.9 0.5 1.6Metals 8.3 9.6 20.2 13.6 3.6 5.1 12.2 6.9Chemicals 33.0 17.1 9.3 10.2 18.9 18.5 12.6 10.0General machinery 2.2 1.7 25.9 32.2 8.7 13.2 3.1 5.3Electric machinery 35.4 43.1 26.9 11.9 29.6 35.9 56.9 61.9Transport machinery 2.9 6.5 b b 8.8 12.6 5.3 4.0Others 4.9 8.4 10.9 22.3 5.5 8.4 3.4 5.5
Manufacturing na na 39.6 53.5 49.4 36.4 48.6 35.0share of totalNote: For Thailand Wood (a) is included in others and tranport machinery (b) is included in general machinery.Source: Country data sources

Table 12 Trading Patterns of Asian Affiliates of Japanese Firms
1992 2001Exports Exports to Exports to
Total Japan Other North Europe Total Japan Other North EuropeAsia Asia America Asia Asia America
Manufacturing Total 79.6 46.6 33.0 10.9 5.9 82.4 47.2 35.1 8.9 5.1 Food 58.1 49.1 9.1 5.7 3.7 83.3 38.4 44.9 5.6 4.4 Textiles 60.4 32.3 28.0 16.4 15.3 83.4 59.1 24.3 9.3 6.4 Wood and Pulp 95.4 94.8 0.6 4.8 0.0 88.0 72.4 15.6 6.1 5.9 Chemical Products 94.9 13.9 81.0 1.1 0.6 88.3 25.7 62.6 2.9 6.3 Iron and Steel 73.8 14.5 59.3 20.7 6.2 83.9 13.1 70.9 12.8 1.9 Nonmetallic Products 98.9 58.3 40.6 0.3 0.0 93.2 37.4 55.8 2.5 0.8 General Machinery 74.3 50.2 24.0 4.5 20.9 87.8 61.7 26.2 3.7 2.6 Electric and Electronics Machinery 85.1 50.1 35.0 9.8 4.1 82.4 50.5 31.9 10.6 4.0 Electric Machinery na na na na na 68.6 42.8 25.8 20.7 6.5 Electronics Machinery na na na na na 86.4 52.7 33.7 7.6 3.3 Transport Machinery 36.5 23.0 13.5 52.7 6.8 72.3 24.0 48.3 8.4 11.9 Precision Instruments 85.1 82.1 3.0 8.2 6.0 92.2 69.8 22.4 5.2 2.2 Coal and Petroleum Products 0.5 0.0 0.5 99.5 0.0 95.5 71.1 24.4 0.0 2.3 Other Manufacturing 70.1 43.9 26.2 12.1 13.1 82.2 62.7 19.5 11.8 4.4
1992 2001Imports Imports from Imports from
Total Japan Other North Europe Total Japan Other North EuropeAsia Asia America Asia Asia America
Manufacturing Total 90.9 73.6 17.3 3.5 1.0 95.5 64.4 31.1 2.1 1.2 Food 97.9 16.1 81.8 1.1 0.4 77.5 32.9 44.6 9.0 0.9 Textiles 58.2 37.8 20.4 7.9 2.4 77.0 60.3 16.7 5.1 14.8 Wood and Pulp 82.8 81.0 1.8 5.5 11.7 84.0 62.5 21.5 3.0 4.0 Chemical Products 71.3 59.1 12.2 12.9 4.5 83.6 43.0 40.6 12.0 3.0 Iron and Steel 98.0 66.6 31.4 0.0 0.0 98.5 86.6 11.9 0.0 1.3 Nonmetallic Products 43.8 26.1 17.6 1.1 1.1 84.8 53.3 31.5 4.6 4.4 General Machinery 95.9 93.7 2.2 3.3 0.8 98.9 88.5 10.4 0.8 0.3 Electric and Electronics Machinery 97.9 73.7 24.3 1.9 0.2 97.7 54.3 43.3 0.8 0.4 Electric Machinery na na na na na 98.5 55.6 43.0 0.4 0.9 Electronics Machinery na na na na na 97.5 54.0 43.4 0.8 0.3 Transport Machinery 95.3 93.0 2.3 3.8 0.8 95.7 88.2 7.5 3.0 0.8 Precision Instruments 97.1 91.5 5.6 2.9 0.0 99.5 84.5 15.0 0.1 0.4 Coal and Petroleum Products 85.1 51.4 33.8 14.9 0.0 91.6 4.1 87.5 2.3 0.6 Other Manufacturing 81.4 66.4 15.0 9.7 5.1 94.8 72.7 22.1 1.1 3.7Note: The figures indicate the share of sales to (procurements from) the respective regions in total sales (procurements). Source: Computed from METI, Kaigaijigyo Katsuodo Kihon Chosa, No. 5 and No. 34, [Comprehensive Survey of Overseas Affiliates of Japanese Firms], 1994 and 2004.

Table 13 Intra-firm Trade by Asian Affiliates of Japanese Firms: 2001 (%)
Exports to Imports fromJapan Other North Europe Japan Other North Europe
Asia America Asia AmericaManufacturing Total 96.0 70.2 73.8 80.9 46.7 65.9 98.9 93.9 Food 78.7 66.6 73.8 21.8 52.3 24.2 100.0 100.0 Textiles 89.8 59.1 90.9 97.9 52.2 85.2 100.0 100.0 Wood and Pulp 82.8 100.0 -- -- 100.0 100.0 -- -- Chemical Products 77.1 50.5 92.8 74.4 74.6 87.4 100.0 100.0 Iron and Steel 86.6 27.9 100.0 -- 81.9 100.0 -- -- Nonmetallic Products 97.8 65.4 100.0 100.0 54.7 87.8 81.1 100.0 General Machinery 98.7 91.8 98.9 100.0 59.1 61.6 100.0 97.1 Electric Machinery 98.3 75.8 51.7 81.5 27.7 29.8 67.1 56.6 Electronics Machinery 95.5 80.8 80.3 84.8 44.3 72.6 100.0 94.9 Transport Machinery 99.5 29.8 99.7 72.9 46.4 83.4 100.0 95.9 Precision Instruments 99.5 93.7 92.3 99.4 50.9 89.2 79.0 100.0 Coal and Petroleum Products 100.0 99.4 -- 100.0 -- 78.9 100.0 -- Other Manufacturing 98.4 78.2 96.1 74.1 29.4 77.9 98.6 100.0Note: The figures indicate the share of intra-firm transactions in total transactions.Source: METI, Kaigaijigyo Katsuodo Kihon Chosa, No. 34, [Comprehensive Survey of Overseas Affiliates of Japanese Firms], 2004.

Table 14 Trade Liberalization in Selected East Asian Economies
All products Primary products Manufactured products Ad valoremImport- Import- Import- equivalent
Binding Unweighted weighted Unweighted weighted Unweighted weighted of non-tariffCoverage averages averages averages averages averages averages barriers
China 1992 40.4 32.1 36.1 14.1 40.6 35.62004 100 9.8 6.0 10.0 5.6 9.7 6.0 1.5
Indonesia 1989 19.2 13.0 18.2 5.9 19.2 15.12003 96.6 6.4 5.2 8.0 3.1 6.1 5.8 0.5
Japan 1988 4.2 3.6 8.3 4.4 3.5 2.72004 99.6 2.9 2.4 5.3 3.9 2.4 1.6 1.6
Korea 1988 18.6 14.0 19.3 8.3 18.6 17.02002 94.4 15.5 9.5 20.9 19.0 7.8 5.0 0.0
Malaysia 1988 14.5 9.7 10.9 4.6 14.9 10.82003 83.7 7.3 4.2 4.5 2.1 7.8 4.6 1.7
Phillipines 1988 28.3 22.4 29.9 18.5 27.9 23.42003 66.8 4.5 2.6 5.7 5.0 4.2 2.0 0.4
Singapore 1989 0.4 1.1 0.2 2.5 0.4 0.62003 69.8 0.0 0.0 0.0 0.0 0.0 0.0 0.5
Thailand 1989 38.5 33.0 30.0 24.3 39.0 35.02003 75.0 14.0 8.3 16.4 4.4 13.5 9.3 0.3
Vietnam 1994 14.8 20.6 20.9 46.7 13.9 13.12004 13.7 13.7 18.1 16.7 12.9 12.5
India 1990 79.0 56.1 69.8 34.1 79.9 70.82004 73.8 28.3 28.0 30.0 36.9 27.9 25.3 3.2
Source: World Bank, World Development Indicators 2005

Table 15 Major FTAs Involving East Asian Economies (as of April 2006)In Action In Negotiation Under StudyBangkog Treaty (1976) China-Thailand* China-IndiaAFTA(1992) China-Australia Japan-AustraliaSingapore-New Zealand (2001) China-New Zealand Japan-IndiaJapan-Singapore (2002) China-Chile Korea-ASEANSingapore-Australia (2003) Japan-ASEAN Korea-AustraliaSingapore-EFTA (2003) Japan-Indonesia Korea-New ZealandSingapore-US (2004) Japan-Korea Korea-ThailandKorea-Chile (2004) Japan-Malaysia* Korea-USChina-Hong Kong (2004) Japan-Thailand ASEAN-IndiaChina-Macau (2004) Japan-Philippines ASEAN-USTaiwan-Panama(2004) Korea-ASEAN ASEAN-CERJapan-Mexico (2005) Korea-Singapore* Malaysia-EUThailand-Australia (2005) Malaysia-Australia Malaysia-IndiaThailand-New Zealand (2005) Malaysia-New Zealand Philippines-USChina-ASEAN(2005) Singapore-Canada Singapore-ChileIndia-ASEAN(2005) Singapore-Mexico Singapore-TaiwanIndia-Sri Lanka Singapore-India* India-GCC
Singapore-Sri Lanka India-MalaysiaSingapore-Qatar*Singapore-PeruSingapore-PanamaSingapore-KuwaitSingapore-Brunei-Chile-NZThailand-India*Thailand-USThailand-Peru*Thailand-EFTAHong Kong-New ZealandIndia-MauritiusIndia-ChileIndia-Egypt
Note: '*' indicates conclusion of the negotiation.Source: Country sources

Table 16 Impacts of East Asia FTA on Regionalization in East Asia
A) Regionalization in 1997East Asia ASEANShare of intra-regional trade in world trade
Share of intra-regional trade in region's trade
Trade intensity
Share of intra-regional trade in world trade
Share of intra-regional trade in region's trade
Trade intensity
Sector Exports Imports Exports ImportsTotal 10.9 44.5 49.5 2.02 1.3 21.0 20.3 3.17Agriculture 4.1 55.6 18.6 2.53 0.6 18.7 12.7 3.81Forestory 10.2 70.8 19.8 1.38 0.8 6.6 22.5 1.79Fishing 18.4 83.7 52.1 2.37 1.9 22.3 54.2 6.52Mining 5.5 81.0 19.4 2.87 0.7 12.9 14.2 2.67Food products and beverages 7.0 57.7 33.0 2.72 1.0 14.6 23.7 3.37Textiles 16.6 47.6 76.7 2.20 0.5 7.8 14.5 2.32Pulp, paper and paper products 7.5 55.1 44.9 1.72 0.7 10.9 26.0 2.83Chemicals 10.4 56.4 49.4 3.32 1.6 30.6 25.1 3.78Iron, steel and metal products 11.7 62.8 47.1 2.68 0.7 29.6 10.4 4.81Transportation machinery 3.6 17.9 32.3 2.54 0.2 23.7 3.8 4.26Electronic equipment 21.8 42.0 68.2 1.61 4.5 22.7 32.4 5.73General machinery 11.4 46.3 52.0 1.31 1.0 28.8 13.0 1.63Other manufacturing 8.9 29.2 52.1 2.12 0.6 11.1 16.0 3.82B) Regionalization resulting from an East Asia FTATotal 14.4 52.7 59.1 2.17 1.6 22.5 22.2 3.09Agriculture 12.7 85.0 45.8 3.06 1.3 35.6 21.0 5.55Forestory 10.5 72.2 20.2 1.38 0.9 7.0 22.6 1.78Fishing 22.5 87.2 59.4 2.30 2.4 24.9 61.3 6.43Mining 5.6 82.2 19.3 2.84 0.7 13.9 14.0 2.65Food products and beverages 17.7 80.2 64.6 2.93 1.7 15.9 32.3 2.97Textiles 23.9 57.3 87.9 2.11 0.6 8.3 14.2 1.92Pulp, paper and paper products 9.2 61.3 51.4 3.42 0.9 12.0 28.3 3.69Chemicals 12.4 61.6 55.1 2.72 1.9 32.9 27.1 4.75Iron, steel and metal products 14.1 68.4 53.2 2.58 0.9 33.0 12.0 4.34Transportation machinery 8.3 36.3 60.2 2.64 0.2 20.3 4.1 3.97Electronic equipment 23.8 44.7 71.6 1.34 5.0 23.7 34.4 1.63General machinery 13.7 52.4 58.6 2.23 1.2 31.8 15.5 3.95Other manufacturing 12.1 36.9 62.9 1.91 0.9 13.5 19.4 3.04Changes from 1997 (A) to FTA (B)Total 3.5 8.2 9.6 0.15 0.3 1.5 1.9 -0.09Agriculture 8.6 29.4 27.2 0.52 0.7 17.0 8.3 1.73Forestory 0.4 1.4 0.3 0.00 0.1 0.4 0.2 -0.01Fishing 4.1 3.5 7.3 -0.07 0.5 2.5 7.1 -0.10Mining 0.1 1.3 -0.2 -0.03 0.0 0.9 -0.2 -0.02Food products and beverages 10.7 22.5 31.7 0.22 0.7 1.3 8.7 -0.40Textiles 7.3 9.7 11.2 -0.09 0.1 0.5 -0.3 -0.40Pulp, paper and paper products 1.7 6.2 6.5 1.70 0.2 1.1 2.3 0.87Chemicals 2.0 5.1 5.6 -0.60 0.3 2.3 2.0 0.97Iron, steel and metal products 2.4 5.6 6.1 -0.10 0.2 3.4 1.6 -0.47Transportation machinery 4.7 18.4 27.8 0.10 0.1 -3.4 0.3 -0.28Electronic equipment 2.0 2.7 3.4 -0.27 0.5 1.0 2.0 -4.10General machinery 2.4 6.1 6.6 0.92 0.3 3.1 2.5 2.32Other manufacturing 3.2 7.6 10.8 -0.20 0.2 2.4 3.5 -0.77Source: Adopted from Urata and Kiyota (2005)

Table 17 The Estimated Impacts of East Asia FTA on Real GDP and WelfareGDP Equivalent Variation(Changes from basedata, 1997 %)
(Changes from basedata, 1997 US$ million)
(Changes divided by GDP in 1997, %)
Australia/New Zealand -0.23 -1,342 -0.29China 1.27 5,485 0.64Hong Kong 1.41 3,389 2.42Japan 0.05 8,199 0.19Korea 1.71 7,805 1.75Taiwan 1.51 5,597 1.87Indonesia 5.61 10,209 4.89Malaysia 2.83 2,279 2.15Philippines 2.02 602 0.77Singapore 2.26 2,944 3.69Thailand 15.90 19,790 12.54Vietnam 8.42 1,446 6.61Other Asia -0.31 -1,803 -0.34United States -0.06 -7,059 -0.09EU -0.01 -1,807 -0.02Source: Adopted from Urata and Kiyota (2005)