Standing on the Shoulders - ROMA - Home INVALSIwholesale"endorsement"is" not"matched"...
15
Standing on the Shoulders of Chess Masters: Using RCTs to Produce Evidence on Teaching Chess in Schools Gianluca Argentin, Università Milano Bicocca Alberto Martini, Università del Piemonte Orientale Barbara Romano, Università di Genova & University of Pennsylvania Paper presented at the INVALSIAPPAMUMD international conference “Improving Education Through Accountability and Evaluation” Rome, 35 October 2012 Abstract The study provides an evidencebased approach to respond to the official declaration by the European Parliament recommending the adoption of a “chess in school” policy and calling for research on the effects of such policy. Indeed, conclusive evidence on the best way to implement such policy is still lacking. The paper addresses three research questions that would inform the inclusion of chess in elementary school curriculum: (i) what are the immediate benefits from learning chess on selected cognitive outcomes, including achievement in mathematics (effects of learning)? (ii) do students need to continue playing chess to retain the cognitive benefits obtained when learning the game (sustainability of effects)? (iii) what is the costeffectiveness of two alternatives ways of teaching chess, using live instructors or webbase applications. The study produced convincing evidence on the first question by fielding an RCT involving 113 3 rd grade classes. The main finding is a remarkable effect size of 0.34 in a standardized math achievement test, controlling for pretest. Evidence emerges of heterogeneity of the impact, significantly higher for foreign born pupils and for those living in Southern Italy. However, the study has little external validity, being based on volunteer school. The final section of the paper presents complex RCT design able to answer all the above questions, gaining in external validity and relevance without sacrificing internal validity. ______________________________ The authors are grateful to Alessandro Dominici for making possible the evaluation of the SAM project, and to Bob Boruch, Bob Granger and Rebecca Maynard for helpful discussions on this topic.
Transcript of Standing on the Shoulders - ROMA - Home INVALSIwholesale"endorsement"is" not"matched"...

Standing on the Shoulders of Chess Masters: Using RCTs to Produce Evidence on
Teaching Chess in Schools
Gianluca Argentin, Università Milano Bicocca Alberto Martini, Università del Piemonte Orientale
Barbara Romano, Università di Genova & University of Pennsylvania
Paper presented at the INVALSI-‐APPAM-‐UMD international conference “Improving Education Through Accountability and Evaluation”
Rome, 3-‐5 October 2012
Abstract The study provides an evidence-‐based approach to respond to the official declaration by the European Parliament recommending the adoption of a “chess in school” policy and calling for research on the effects of such policy. Indeed, conclusive evidence on the best way to implement such policy is still lacking. The paper addresses three research questions that would inform the inclusion of chess in elementary school curriculum: (i) what are the immediate benefits from learning chess on selected cognitive outcomes, including achievement in mathematics (effects of learning)? (ii) do students need to continue playing chess to retain the cognitive benefits obtained when learning the game (sustainability of effects)? (iii) what is the cost-‐effectiveness of two alternatives ways of teaching chess, using live instructors or web-‐base applications. The study produced convincing evidence on the first question by fielding an RCT involving 113 3rd grade classes. The main finding is a remarkable effect size of 0.34 in a standardized math achievement test, controlling for pre-‐test. Evidence emerges of heterogeneity of the impact, significantly higher for foreign born pupils and for those living in Southern Italy. However, the study has little external validity, being based on volunteer school. The final section of the paper presents complex RCT design able to answer all the above questions, gaining in external validity and relevance without sacrificing internal validity. ______________________________ The authors are grateful to Alessandro Dominici for making possible the evaluation of the SAM project, and to Bob Boruch, Bob Granger and Rebecca Maynard for helpful discussions on this topic.

2
1. MOTIVATION OF THE STUDY
The ultimate goal of this paper is to provide an evidence-‐based response to the Declaration of the European Parliament supporting the introduction of ‘Chess in School’ in the educational systems of the European Union. The declaration, approved in March 2012, states that “Chess can improve children’s concentration, patience and persistence and can develop sense of creativity, intuition, memory, analytic and decision-‐making skills. Chess also teaches determination, motivation and sportsmanship.”1
Such wholesale endorsement is not matched by equally solid empirical evidence. The fame and charisma of the chief supporter of the declaration – the all-‐time chess champion and now full-‐time chess advocate, Garry Kasparov – made up for the gaps in the available evidence. Perhaps reflecting awareness of the limitations of existing research, the declaration includes the request that the Commission takes into consideration the results of any studies on the effects of this programme on children’s development. To be sure, there are myriad pieces of evidence on the effect of learning chess on a variety of cognitive outcomes, scattered across journals of various disciplines, from psychology to education to economics.2 But most of the existing studies tend to be local, involving only one school or even one class, let alone involving one whole country, and tend to look at immediate effects – in the same year in which the students are taught chess. To our knowledge, no synthesis of the chess effectiveness research has been conducted and no country-‐wide assessment of the feasibility and expected returns from a hypothetical inclusion of chess in the school curriculum has been implemented. The new RCT proposed here would give an informative response to the need for more evidence, and it might even help promoting the use of random assignment in Italy (as well as in other European countries similarly situated in terms of evaluation research in education). The RCT proposed in this paper builds upon a preliminary analysis with RCT we conducted with the support of the Piedmont Chess Federation, for a project named SAM (Scacchi e Apprendimento della Matematica, “Chess and Math Learning”), whose results are described more fully below. Despite its limited size and its lack of external validity, the SAM study represents a novelty in the context of education research in Italy, because of its use of random assignment. Building upon the SAM experience, we have designed a more ambitious evaluation of the effectiveness of chess in schools, which we call Sc3.3 Admittedly, the ambition goes beyond chess and aims at increasing the weight of quantitative studies in the context of education research in Italy and beyond. While the RCT is not the only way to establish causality, we believe that the RCT should be one of the preferred weapons in the arsenal of educational researchers The Sc3 evaluation has been designed to inform the education policy maker about the major issues that would likely emerge were the teaching of chess to become an integral part of a country’s primary education curriculum. The three main questions refer to: (i) the effectiveness of learning chess on the many cognitive processes it is claimed to affect, including but not limited to math achievement; (ii) the role of continued practice of chess on the persistence of its effects; (iii) the practical question of the relative cost-‐effectiveness of live instructors versus less expensive (but possibly less effective) web-‐based methods. 1 The full text of the declaration is in Appendix A. 2 The following are just few examples: Scholz et al (2008), Buki & Ho (2008), Campitelli & Gobet (2008), Hong & 2 The following are just few examples: Scholz et al (2008), Buki & Ho (2008), Campitelli & Gobet (2008), Hong & Bart (2007), Berkman, (2004), Thompson (2003), Smith & Cage (2000). 3 Sc3 is the acronym for Sperimentazione controllata di Scacchi a Scuola.

3
2. THE RESULTS OF THE SAM STUDY
The SAM study used a simple clustered RCT design to estimate the effect of learning chess during third grade on math achievement at the end of the same year. A sample of 33 schools (located in over half of the Italian regions) was recruited through a network of past contacts with the Chess Federation. The enrollment of schools in the study was totally voluntary. Actually, no general call nor announcement was made, rather an existing network of schools was alerted of the opportunity. This was the only feasible approach because the lack of resources to conduct a systematic nationwide recruitment effort to guarantee external validity. The following map of Italy shows the uneven distribution of the schools, a clear consequence of the convenience nature of the sample used. On the positive side, one has to notice that the 33 schools are also well spread all over the country.
Figure 1: The geographical distribution of the schools involved in SAM
The intervention was implemented during the 2010/11 school year, under the supervision of the Piemonte Regional branch of the Italian Chess Federation (ICF), with the financial support of a grant-‐making foundation.4 The intervention consisted in approximately 30 hours of classroom instruction provided to 3rd graders by instructors certified by the ICF. The hours of chess instruction were delivered in the classroom during regular school hours. The actual number of hours of instruction varied depending on the school’s availability of resources and on the number of hours that the regular classroom teachers made available for it. We have no evidence of the effect of different hours on the outcomes, as they were not randomly assigned.
Most importantly, each school, in order to participate in the study, had to accept the following condition: at least one of the 3rd grade classes enrolled was to be randomly assigned to receive SAM in 4th grade, while all the others received the treatment in 3rd grade. The results, while lacking external validity due to the convenience nature of the sample, are quite credible when it comes to internal validity.
At the conclusion of the recruitment process, there were 113 classrooms in 33 schools, located in 14 out of the 20 Italian regions. Of these 113 classes, 53 were randomly assigned to the control group and 60 to the experimental group. The degree of compliance with the assignment was very high, as shown in Table 1. Only six cases deviated from the assignment, three in each direction. 4 The funds available for the intervention were about € 30,000 and the budget allocated to the evaluation was less than € 4,000
4
Table 1: Compliance with the random assignment The students were assessed at the beginning and at the end of the end of the 2010/11 school year. The outcome of interest was math achievement. To measure achievement at the pre-‐test, we used the National Institute for Education Evaluation (INVALSI) standardized test used to assess 2nd grade students math achievement at the end of the year. We considered it an adequate instrument for pre-‐testing, because at the beginning of the 3rd grade math abilities are no greater than at the end of 2nd grade. Given that all the students in our study took the INVALSI test at the end of school Year 2009/10, we used the 2008/09 INVALSI test to avoid the risk of contamination. We could not use directly the test results actually obtained by the student in the study sample at the end of the 2nd grade, because they cannot be easily disclosed for privacy concerns.
For the post-‐test, we developed a new test based on the previous one. The constructs measured were the same as in the pre-‐test, but the degree of difficulty higher. Both pre and post-‐test consisted of 28 multiple-‐choice items. The tests were administered in class through a web platform under the supervision of a chess instructor supervision. Because of the tight budget, the project was not able to afford external and neutral data collectors that would have secured standardization of test administration procedures.
Almost 2,000 students took the pre-‐test with an almost identical proportion of treated and controls. Together with the pre-‐test, we collected from the student some background information on country of birth (Italy or abroad), parents’ country of birth (Italy or abroad), sex, attitude toward math, self perceived performance in math as well as perceived ability in chess. While neither sex nor residence have a significant effect on pre-‐test scores, being foreign born status has a sizeable negative effect that lowers performance on the pre-‐test by 6 to 8 percentage points. As expected, students who like math or with good self perceived math abilities, perform better on the pre-‐test. However, they score only about 4 percentage point higher than their classmate. Testing the equivalence of experimental and control groups The pre-‐test scores and the information collected with the baseline questionnaire allow us to check for the equivalence between experimental and control. We considered both the demographic characteristics of the student as well as the self-‐reported measures.
All the characteristics considered are equally distributed except for the area of residence: in the experimental group the proportion of students from the South is significantly larger. This is due to the fact that southern schools tend to offer fewer classes to be randomized to the control group than schools in the north. When estimating the impacts, this imbalance is corrected by regression-‐adjustment.
Experimental Control Total Participated 57 3 60 Did not participate 3 50 53
Total 60 53 113
5
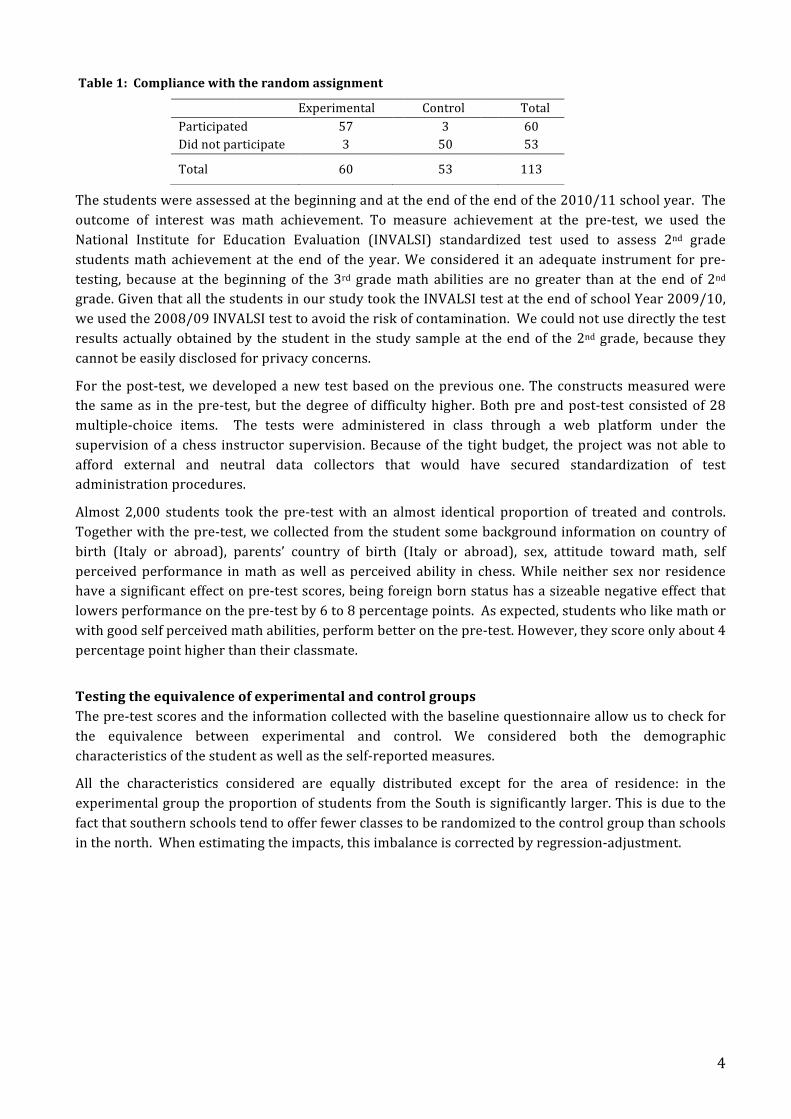
Table 2 – Comparison of baseline characteristics of experimental and control groups.
Does learning chess have a positive effect on math achievement?
The most intuitive way to look at the results of the experiment is to visually compare the two distributions of scores before and after the intervention, shown in Figure 2a and 2b. The shift to the right of the density of the experimental group leaves little doubt that learning chess has had an effect on math test scores. Figure 2a. Pre-‐test score density functions Figure 2b. Post-‐test score density functions
Note: we apologize for the labels in Italian The simplest measure of the effect of the treatment offered by SAM is the difference between the post-‐test mean score for the experimental and the control group:
Effect of chess on math = mean score experimental – mean score control = 63.1–58.1 = 5.0 (t=5.56)
This means that the students in the treatment group gave 5% percentage points more of correct answers than the students in the control group (a 9.6% relative increase). In a 28-‐item test, this means a difference of about 1.4 correct answers. When controlling for pretest score through linear regression, the effect of the treatment goes up to 6.8 percent more correct answers for the experimental group.
More informative is to show the impact as effect size:
Effect Size = (experimental mean – control mean)/pooled standard deviation= 0.068/0.20 = 0.34
Experimentals Controls Difference t-statistic
Male 53.2 51.4 1.76 0.78
Foreign born 5.78 6.46 -1.46 0.62
Either parent foreign born 16.6 18.4 -1.74 1.03
Lives in the south 43.3 39.3 4.01 1.91
Total sample 1,071 925
"I know how to play chess" 15.8 15.9 -0.07 0.04
"I am good at math" 32.7 34.5 -1.84 0.86
Percent
"I like math" 57.6 56.5 1.05 0.46
0 20 40 60 80 100
Gruppo di controlloGruppo sperimentale
0 20 40 60 80 100
Gruppo di controlloGruppo sperimentale
6
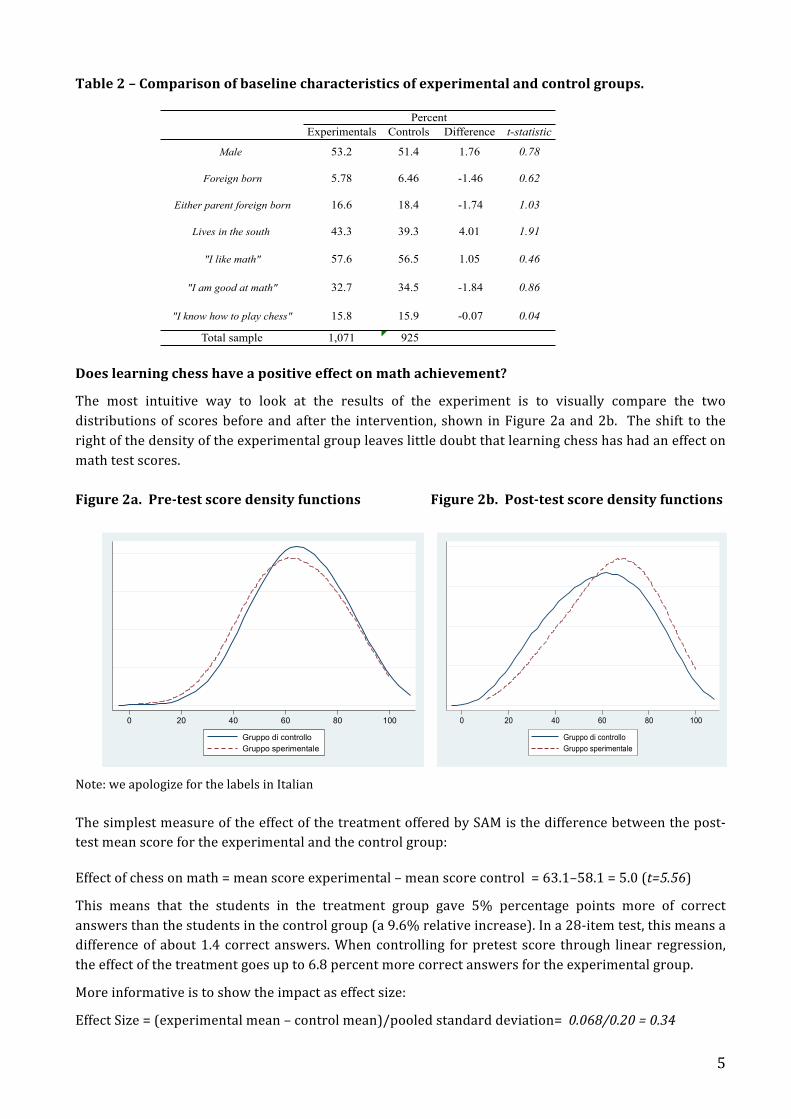
The evidence gathered by SAM thus suggests that being taught how to play chess in 3rd grade improves average math achievement by a third of a standard deviation. According to Lipsey, Bloom et al. (2009) an effect size greater than 0.25 is “educationally significant”. The above estimates are derived as if student observations were independent, but the intervention was made at the class level, not at the student level. We have, therefore, to correct our estimates for the clustering at the classroom level. The estimate of the effect should not change, what changes is the precision of the estimate. The estimates were obtained with clustering routine available in STATA. The impact is still statistically significant, but the confidence interval widens as shown in Figure 3: now the effect size goes from 0.20 to 0.50, while before it went from 0.28 to 0.42. In both cases the impact of the intervention is statistically significant. Figure 3. Overall effect size without and with correction for clustering
Do some groups gain more than others from learning chess?
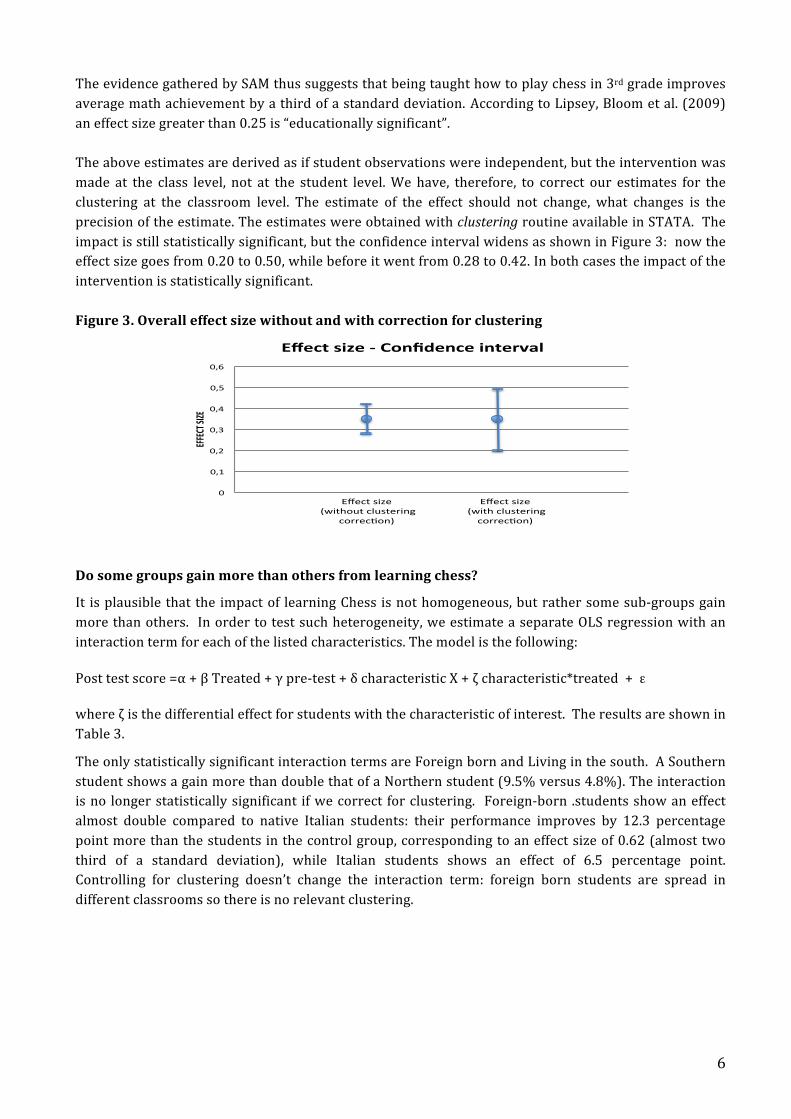
It is plausible that the impact of learning Chess is not homogeneous, but rather some sub-‐groups gain more than others. In order to test such heterogeneity, we estimate a separate OLS regression with an interaction term for each of the listed characteristics. The model is the following:
Post test score =α + β Treated + γ pre-‐test + δ characteristic X + ζ characteristic*treated + ε
where ζ is the differential effect for students with the characteristic of interest. The results are shown in Table 3.
The only statistically significant interaction terms are Foreign born and Living in the south. A Southern student shows a gain more than double that of a Northern student (9.5% versus 4.8%). The interaction is no longer statistically significant if we correct for clustering. Foreign-‐born .students show an effect almost double compared to native Italian students: their performance improves by 12.3 percentage point more than the students in the control group, corresponding to an effect size of 0.62 (almost two third of a standard deviation), while Italian students shows an effect of 6.5 percentage point. Controlling for clustering doesn’t change the interaction term: foreign born students are spread in different classrooms so there is no relevant clustering.
!"
!#$"
!#%"
!#&"
!#'"
!#("
!#)"
!""!#
$%&'(!
%
!)*+,%-./*%0%#1234*2+*%.2,*5678%
*+,-."/01,""230.4"-56/.,7089"
-:77,-;:8<"
*+,-."/01,""230.4:6."-56/.,7089"
-:77,-;:8<"

7
Table 3 – Effect sizes calculated for specific sub-‐groups
Assessing the evidence The students taking the pre-‐test where 1,996 (1,071 experimental and 925 controls), and the two groups were equivalent, as we have shown above. It is important to analyze the overall and the differential attrition between the two conditions, because both can contribute to the potential bias of the estimated effect of an intervention. The post-‐test was taken by 1,756 students and the overall attrition rate is 12.0%. The differential attrition rate is 1,6%. An overall attrition rate of 12% combined a differential attrition rate of 1.6% falls abundantly in the range of values that, according to the What Works Clearinghouse guidelines (2009), indicate that the attrition will be considered “low” and the level of bias acceptable”.
We also checked the potential cheating due to the absence of external and neutral test collectors. The intra-‐class correlation coefficients (ICC) and standard deviations of treated and control classes are similar. Even the distribution of suspected classes (high performance and low variance) is identical between treated and control classes. Moreover, the results do not change if these cases are removed from the analysis. The main weakness of the SAM experiment remains its lack of external validity. All schools where volunteers and we do not have enough information to judge it they are representative of the overall population of Italian schools (or at least of the schools operating in the same area). The recruitment of “friendly” schools on the other hand made it possible to run the study on such a low budget. Correcting for such weakness would be the crucial point of departure of the Sc3 evaluation, together with addressing a much wider set of questions.
3. MAIN DESIGN FEATURES OF THE SC3 EVALUATION
The novelties of the proposed RCT, with respect to SAM and most other existing studies, are the following. First, we pay special attention to the issue of sustainability of the effects of chess, and to the role that schools can play in inducing the newly taught students to practice chess regularly. To this end instead of relying only on outcome data from the same year in which chess is taught, which can capture only immediate effects, we follow the same students from third grade (when chess instruction would start) to the end of fifth grade. This is made possible by exploiting, as the main source of data on achievement, the INVALSI math and reading standardized tests, administered annually to all Italian second and fifth graders. The other novelty of this study is that it seeks to capture the effects of two separate aspects of treatment-‐with-‐chess: (a) teaching chess at the classroom level; (b) implementing at
Student Characteristic ! P-value Interaction (") P-valueEffect for those with
the characteristc Effect size
Male .065 0.000 .006 0.655 0.071 0.36
Foreign born .065 0.000 .058 0.064 0.123 0.62
Foreign-born parent(s) .066 0.000 .009 0.648 0.075 0.37
Lives in the south .048 0.000 .047 0.001 0.095 0.48
"I like math" .071 0.000 -.005 0.581 0.066 0.33
"I do well in math" .068 0.000 .002 0.122 0.070 0.35
"I know how to play chess" .061 0.000 .013 0.367 0.074 0.37

8
the school level activities to stimulate the continuing practice of chess.
The specific questions to be addressed by the Sc3 evaluation are the following:
a. Does learning chess at school (at some point between 3rd and 4th grade) affects achievement in mathematics and reading measured in 5th grade? It should be noted that SAM did not answer exactly this question, since it focused only on 3rd grade.
b. How persistent are the effects of learning chess? Does any beneficial effect remain one or two years after the chess training? A common question for many school interventions is whether they have a temporary or permanent effect. In this case a special issue arises in connection with actually playing chess vs. learning it. Which fraction of pupils continue to play chess and possibly benefit from it, after it is no longer taught in class? Can the school make a difference by being pro-‐active in creating a chess-‐friendly atmosphere (like organizing tournaments) to stimulate playing after instruction ends? These issues will be addressed by analyzing the responses to a questionnaire submitted to all pupils at the end of 5th grade (with some specific items limited to the treated schools).
c. Which cognitive processes does playing chess activate toward improving scholastic achievement? We are looking for mechanisms generating the positive effects on achievement found in SAM: such mechanisms obviously must be investigated using cognitive tests rather than achievement tests. We envision adapting existing tests on concentration, persistence, and analytical reasoning. These tests would be administered at the end of 3rd grade, for all treated and controls.
d. Does chess taught by professional instructors obtain better or similar results than when based on web teaching tools with the support of regular teachers? Which solution is more cost-‐effective and sustainable at scale? Under the Sc3 evaluation, two broad types of chess training will be tested: professional instruction vs. web-‐based. The first approach is based on the presence in the classroom of a professional instructor, hired from outside. Given the high cost of this training, it is important to establish the relative cost effectiveness with respect to the other modes. The second type of training is web-‐based, with no external teacher involved in teaching in the classroom.
The design of the experiment
Answering the above questions requires an RCT with a factorial design, which allows to test the independent effect of each intervention and the combined effect of (interaction between) the two interventions. First, a stratified probability sample of schools must be extracted from the roster of all Italian primary schools with probability proportional to student size. About 240 schools will be needed, yielding approximately 500 classrooms and 10,000 pupils. The next step consists of randomly assigning one third of the total sampled schools to a no-‐chess control group, and the remaining 160 schools to four cells, resulting from the combination of the two types of methods for teaching chess (Instructor or Web) and of the two types of chess-‐climate to be created in 5th grade (active or passive). Crossing the two dimensions creates four types of treatment at the school level: A. taught by instructor in 3rd or 4th grade, passive climate in 5th grade B. taught by instructor in 3rd or 4th grade, active climate in 5th grade C. taught by web applications in 3rd or 4th grade, passive climate in 5th grade D. taught by web applications in 3rd or 4th grade, active climate in 5th grade The following table contains the Minimum Detectable Effect Size for the four types of comparisons, under two alternative values for the ICC. Appendix B contains the details of the power analysis performed.

9
Table 4: MDES for different comparisons
Comparisons Treated Controls Proportion treated
MDES
ICC=0.15 ICC=0.25
treatment A with treatment B 40 40 0,50 0,22 0,28 treatment A or B or C or D with controls 40 80 0,33 0,19 0,24 A+B (or C+D) treatment with controls 80 80 0,50 0,16 0,19 A+B+C+D treatments with controls 160 80 0,67 0,13 0,17 Note: numbers obtained using Power-‐Up!, an Excel-‐based program developed by Nianbo Dong and Rebecca Maynard The remaining design choice concerns the grade in which the teaching of chess would take place. We favor teaching half of the classes in third and half in fourth grade and randomizing this choice at the classroom level—that is, within the treated schools. This would create an additional control group, the 3rd grade classes waiting to be taught in 4th grade, as in the SAM project. Moreover, splitting between 3rd and 4th grade would allow the length of non-‐exposure to chess to vary between one year and two years, instead of being always two years. Another advantage is the fact that such design would allow to spread the instructors’ s time evenly across the two years.
4. CONCLUDING REMARKS
Education research in Italy has virtually never adopted the rigorous design represented by the RCT. The total neglect of such a widely used and powerful tool can be explained only by a strong negative prejudice. Our ultimate goal is to break this mold by implementing a large scale and well designed RCT, hoping to establishing a precedent that would help to “jump-‐start” experimental evaluation of education in Italy. Realizing such an endeavor will require applying the RCT design to initiatives sufficiently removed from ideologically and politically charged education controversies, such as those involving issues of class size or merit pay for teachers. The RCT raises already a number of a priori negative reactions, so that it is wise to avoid mixing two sources of controversies. In particular chess does not involve the ethical issue of denying access to a service that some would consider essential. We claim that the “Chess in schools” declaration from the European Parliament creates an extremely propitious situation to launch a large scale RCT on this topic. Our ambition is to make Sc3 an exemplary case, from which future advocates of rigorous evaluation methods can draw inspiration and motivation. The Sc3 evaluation has been designed to inform the education policy maker some of the major issues that would likely emerge were the teaching of chess to become integral part of a country’s primary education curriculum. However, this type of design is applicable to a wide range of school innovations.
10
References
Argentin G., Martini A., Romano B. (2012) “Giocare a scacchi aiuta a imparare la matematica? Evidenze
da una sperimentazione controllata“ in Trinchero R., Gli scacchi: un gioco per crescere, Franco Angeli.
Berkman, R. M. (2004). The Chess and Mathematics Connection: More than Just a Game. Mathematics Teaching in the Middle School, 9(5), 246-‐250.
Buki, J., & Ho, F. (2008). The Effect of Math and Chess Integrated Instruction on Math Scores | PRLog. The Chess Academy. Retrieved from http://www.prlog.org/10086633-‐the-‐effect-‐of-‐math-‐and-‐chess-‐integrated-‐instruction-‐on-‐math-‐scores.html
Campitelli, G., & Gobet, F. (2008). The role of practice in chess: A longitudinal study. Learning and Individual Differences, 18, 446-‐458. Doi:10.1016/j.lindif.2007.11.006
Hong, S., & Bart, W. M. (2007). Cognitive Effects of Chess Instruction on Students at Risk for Academic Failure. International Journal of Special Education, 22(3), 89-‐96.
Lipsey M., Bloom H., Hill C., Rebeck Black A. How Big is Big Enough? Achievement Effect Sizes in Education. University of Pennsylvania Graduate School of Education, February 2007.
Marguiles S. (1991) "The Effect of Chess on Reading Scores: District Nine Chess Program Second Year Report" Ph.D. dissertation.
Romano, B. (2011) “Does Playing Chess Improve Math Learning? Promising (And Inexpensive) Results From Italy”, unpublished research paper, Graduate School of Education, University of Pennsylvania
Rossi, P. H., Lipsey, M. W., & Freeman, H. E. (2004). Evaluation. A Systematic Approach. Seventh Edition. Thousand Oaks, CA: Sage.
Scholz, M., Niesch, H., Steffen, O., Ernst, B., Loeffler, M., Witruk, E., & Schwarz, H. (2008). Impact of Chess Training on Mathematics Performance and Concentration Ability of Children with Learning Disabilities. International Journal of Special Education, 23(3), 138-‐148.
Smith, J. P., & Cage Bob N. (2000). The Effects of Chess Instruction on the Mathematics Achievement of Southern, Rural, Black Secondary Students. Research in the Schools, 7(1), 19-‐26.
Sweller, J. & Clark, R.E. Kirschner, P.A. (2006). Why minimal guidance during instruction does not work: An analysis of the failure of constructivist, discovery, problem-‐based, experiential, and inquiry based teaching. Educational Psychologist, 41, 75-‐86.
Thompson M. (2003). Does the playing of chess lead to improved scholastic achievement? Issues In Educational Research, Vol 13, 2003.
What Works Clearinghouse (2009). WWC Quick review protocol. Version 2.0 . Retrieved from http://ies.ed.gov/ncee/wwc/DownloadSRG.aspx

11
Appendix A 0050/2011 Written declaration on the introduction of the programme ‘Chess in School’ in the educational systems of the European Union
The European Parliament,
– having regard to Articles 6 and 165 of the Treaty on the Functioning of the European Union,
– having regard to Rule 123 of its Rules of Procedure,
A. whereas the Treaty on the Functioning of the European Union, in its Article 6, provides that sport is among the areas ‘where the Union shall have competences to carry out actions to support, coordinate or supplement the actions of the Member States’;
B. whereas whatever the age of the child, chess can improve children’s concentration, patience and persistence and can develop the sense of creativity, intuition, memory, and analytic and decision-‐making skills; whereas chess also teaches determination, motivation and sportsmanship;
1. Calls on the Commission and the Member States to encourage the introduction of the programme ‘Chess in School’ in the educational systems of the Member States;
2. Calls on the Commission, in its forthcoming communication on sport, to pay the necessary attention to the program ‘Chess in School’ and to ensure sufficient funding for it from 2012 onwards;
3. Calls on the Commission to take into consideration the results of any studies on the effects of this programme on children’s development;
4. Instructs its President to forward this declaration, together with the names of the signatories, to the Commission and to the Parliaments of the Member States.
Having received the required number of signatures to be passed in the European Parliament, the Written Declaration will be officially communicated from the Parliament to the Commission and to the Parliament of each EU Member State together with the list of signatories.
12
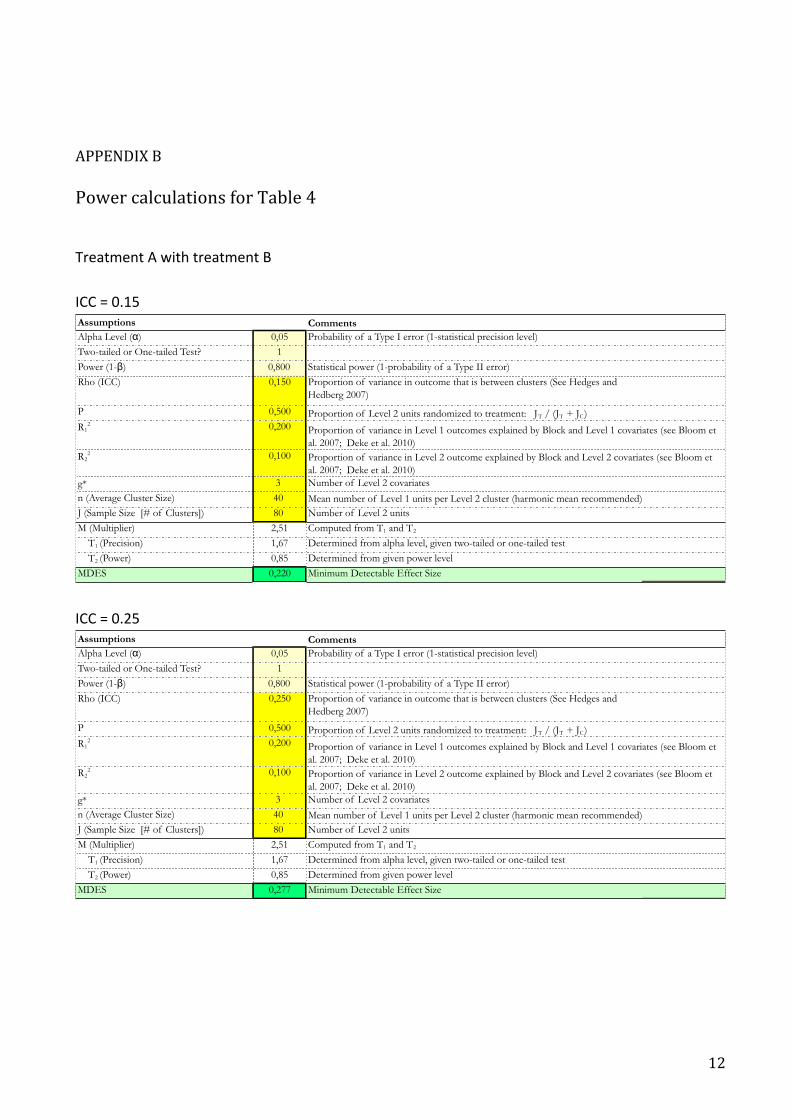
APPENDIX B
Power calculations for Table 4 Treatment A with treatment B ICC = 0.15
ICC = 0.25
AssumptionsAlpha Level (!) 0,05 Probability of a Type I error (1-statistical precision level)Two-tailed or One-tailed Test? 1Power (1-") 0,800 Statistical power (1-probability of a Type II error)Rho (ICC) 0,150 Proportion of variance in outcome that is between clusters (See Hedges and
Hedberg 2007)
P 0,500
R12 0,200
R22 0,100
g* 3n (Average Cluster Size) 40J (Sample Size [# of Clusters]) 80M (Multiplier) 2,51 T1 (Precision) 1,67 T2 (Power) 0,85 MDES 0,220
Determined from given power level
Comments
Proportion of Level 2 units randomized to treatment: JT / (JT + JC)
Proportion of variance in Level 1 outcomes explained by Block and Level 1 covariates (see Bloom et al. 2007; Deke et al. 2010)Proportion of variance in Level 2 outcome explained by Block and Level 2 covariates (see Bloom et al. 2007; Deke et al. 2010)
Number of Level 2 units
Number of Level 2 covariates
Mean number of Level 1 units per Level 2 cluster (harmonic mean recommended)
Computed from T1 and T2
Determined from alpha level, given two-tailed or one-tailed test
Minimum Detectable Effect Size
AssumptionsAlpha Level (!) 0,05 Probability of a Type I error (1-statistical precision level)Two-tailed or One-tailed Test? 1Power (1-") 0,800 Statistical power (1-probability of a Type II error)Rho (ICC) 0,250 Proportion of variance in outcome that is between clusters (See Hedges and
Hedberg 2007)
P 0,500
R12 0,200
R22 0,100
g* 3n (Average Cluster Size) 40J (Sample Size [# of Clusters]) 80M (Multiplier) 2,51 T1 (Precision) 1,67 T2 (Power) 0,85 MDES 0,277
Determined from given power level
Comments
Proportion of Level 2 units randomized to treatment: JT / (JT + JC)
Proportion of variance in Level 1 outcomes explained by Block and Level 1 covariates (see Bloom et al. 2007; Deke et al. 2010)Proportion of variance in Level 2 outcome explained by Block and Level 2 covariates (see Bloom et al. 2007; Deke et al. 2010)
Number of Level 2 units
Number of Level 2 covariates
Mean number of Level 1 units per Level 2 cluster (harmonic mean recommended)
Computed from T1 and T2
Determined from alpha level, given two-tailed or one-tailed test
Minimum Detectable Effect Size

13
Treatment A or B or C or D with controls ICC = 0.15
ICC = 0.25
AssumptionsAlpha Level (!) 0,05 Probability of a Type I error (1-statistical precision level)Two-tailed or One-tailed Test? 1Power (1-") 0,800 Statistical power (1-probability of a Type II error)Rho (ICC) 0,150 Proportion of variance in outcome that is between clusters (See Hedges and
Hedberg 2007)
P 0,330
R12 0,200
R22 0,100
g* 3n (Average Cluster Size) 40J (Sample Size [# of Clusters]) 120M (Multiplier) 2,50 T1 (Precision) 1,66 T2 (Power) 0,84 MDES 0,190
Determined from given power level
Comments
Proportion of Level 2 units randomized to treatment: JT / (JT + JC)
Proportion of variance in Level 1 outcomes explained by Block and Level 1 covariates (see Bloom et al. 2007; Deke et al. 2010)Proportion of variance in Level 2 outcome explained by Block and Level 2 covariates (see Bloom et al. 2007; Deke et al. 2010)
Number of Level 2 units
Number of Level 2 covariates
Mean number of Level 1 units per Level 2 cluster (harmonic mean recommended)
Computed from T1 and T2
Determined from alpha level, given two-tailed or one-tailed test
Minimum Detectable Effect Size
AssumptionsAlpha Level (!) 0,05 Probability of a Type I error (1-statistical precision level)Two-tailed or One-tailed Test? 1Power (1-") 0,800 Statistical power (1-probability of a Type II error)Rho (ICC) 0,250 Proportion of variance in outcome that is between clusters (See Hedges and
Hedberg 2007)
P 0,330
R12 0,200
R22 0,100
g* 3n (Average Cluster Size) 40J (Sample Size [# of Clusters]) 120M (Multiplier) 2,50 T1 (Precision) 1,66 T2 (Power) 0,84 MDES 0,239
Determined from given power level
Comments
Proportion of Level 2 units randomized to treatment: JT / (JT + JC)
Proportion of variance in Level 1 outcomes explained by Block and Level 1 covariates (see Bloom et al. 2007; Deke et al. 2010)Proportion of variance in Level 2 outcome explained by Block and Level 2 covariates (see Bloom et al. 2007; Deke et al. 2010)
Number of Level 2 units
Number of Level 2 covariates
Mean number of Level 1 units per Level 2 cluster (harmonic mean recommended)
Computed from T1 and T2
Determined from alpha level, given two-tailed or one-tailed test
Minimum Detectable Effect Size

14
A+B (or C+D) treatment with controls ICC=0.15
ICC=0.25
AssumptionsAlpha Level (!) 0,05 Probability of a Type I error (1-statistical precision level)Two-tailed or One-tailed Test? 1Power (1-") 0,800 Statistical power (1-probability of a Type II error)Rho (ICC) 0,150 Proportion of variance in outcome that is between clusters (See Hedges and
Hedberg 2007)
P 0,500
R12 0,200
R22 0,100
g* 3n (Average Cluster Size) 40J (Sample Size [# of Clusters]) 160M (Multiplier) 2,50 T1 (Precision) 1,65 T2 (Power) 0,84 MDES 0,155
Determined from given power level
Comments
Proportion of Level 2 units randomized to treatment: JT / (JT + JC)
Proportion of variance in Level 1 outcomes explained by Block and Level 1 covariates (see Bloom et al. 2007; Deke et al. 2010)Proportion of variance in Level 2 outcome explained by Block and Level 2 covariates (see Bloom et al. 2007; Deke et al. 2010)
Number of Level 2 units
Number of Level 2 covariates
Mean number of Level 1 units per Level 2 cluster (harmonic mean recommended)
Computed from T1 and T2
Determined from alpha level, given two-tailed or one-tailed test
Minimum Detectable Effect Size
AssumptionsAlpha Level (!) 0,05 Probability of a Type I error (1-statistical precision level)Two-tailed or One-tailed Test? 1Power (1-") 0,800 Statistical power (1-probability of a Type II error)Rho (ICC) 0,250 Proportion of variance in outcome that is between clusters (See Hedges and
Hedberg 2007)
P 0,500
R12 0,200
R22 0,100
g* 3n (Average Cluster Size) 40J (Sample Size [# of Clusters]) 160M (Multiplier) 2,50 T1 (Precision) 1,65 T2 (Power) 0,84 MDES 0,194
Determined from given power level
Comments
Proportion of Level 2 units randomized to treatment: JT / (JT + JC)
Proportion of variance in Level 1 outcomes explained by Block and Level 1 covariates (see Bloom et al. 2007; Deke et al. 2010)Proportion of variance in Level 2 outcome explained by Block and Level 2 covariates (see Bloom et al. 2007; Deke et al. 2010)
Number of Level 2 units
Number of Level 2 covariates
Mean number of Level 1 units per Level 2 cluster (harmonic mean recommended)
Computed from T1 and T2
Determined from alpha level, given two-tailed or one-tailed test
Minimum Detectable Effect Size

15
A+B+C+D treatments with controls ICC = 0.15
ICC = 0.25
AssumptionsAlpha Level (!) 0,05 Probability of a Type I error (1-statistical precision level)Two-tailed or One-tailed Test? 1Power (1-") 0,800 Statistical power (1-probability of a Type II error)Rho (ICC) 0,150 Proportion of variance in outcome that is between clusters (See Hedges and
Hedberg 2007)
P 0,670
R12 0,200
R22 0,100
g* 3n (Average Cluster Size) 40J (Sample Size [# of Clusters]) 240M (Multiplier) 2,49 T1 (Precision) 1,65 T2 (Power) 0,84 MDES 0,134
Determined from given power level
Comments
Proportion of Level 2 units randomized to treatment: JT / (JT + JC)
Proportion of variance in Level 1 outcomes explained by Block and Level 1 covariates (see Bloom et al. 2007; Deke et al. 2010)Proportion of variance in Level 2 outcome explained by Block and Level 2 covariates (see Bloom et al. 2007; Deke et al. 2010)
Number of Level 2 units
Number of Level 2 covariates
Mean number of Level 1 units per Level 2 cluster (harmonic mean recommended)
Computed from T1 and T2
Determined from alpha level, given two-tailed or one-tailed test
Minimum Detectable Effect Size
AssumptionsAlpha Level (!) 0,05 Probability of a Type I error (1-statistical precision level)Two-tailed or One-tailed Test? 1Power (1-") 0,800 Statistical power (1-probability of a Type II error)Rho (ICC) 0,250 Proportion of variance in outcome that is between clusters (See Hedges and
Hedberg 2007)
P 0,670
R12 0,200
R22 0,100
g* 3n (Average Cluster Size) 40J (Sample Size [# of Clusters]) 240M (Multiplier) 2,49 T1 (Precision) 1,65 T2 (Power) 0,84 MDES 0,168
Determined from given power level
Comments
Proportion of Level 2 units randomized to treatment: JT / (JT + JC)
Proportion of variance in Level 1 outcomes explained by Block and Level 1 covariates (see Bloom et al. 2007; Deke et al. 2010)Proportion of variance in Level 2 outcome explained by Block and Level 2 covariates (see Bloom et al. 2007; Deke et al. 2010)
Number of Level 2 units
Number of Level 2 covariates
Mean number of Level 1 units per Level 2 cluster (harmonic mean recommended)
Computed from T1 and T2
Determined from alpha level, given two-tailed or one-tailed test
Minimum Detectable Effect Size