Standardizing county-level recreation supply … · 1 Version Final November 7, 2003 Standardizing...
32
University of Wisconsin – Madison/Extension Department of Urban and Regional Planning and Center for Community Economic Development Standardizing county-level recreation supply components: A precursor to the Wisconsin SCORP, 2005 Working Paper 03-2 November, 2003 Peter Herreid, Dave Marcouiller, and Jeff Prey
Transcript of Standardizing county-level recreation supply … · 1 Version Final November 7, 2003 Standardizing...

University of Wisconsin – Madison/Extension Department of Urban and Regional Planning and
Center for Community Economic Development
Standardizing county-level recreation supply components:
A precursor to the Wisconsin SCORP, 2005
Working Paper 03-2
November, 2003
Peter Herreid, Dave Marcouiller, and Jeff Prey
1
Version Final November 7, 2003
Standardizing county-level recreation supply components: A precursor to the Wisconsin SCORP, 2005
Peter Herreid, Dave Marcouiller, and Jeff Prey*
Working Paper 03-2
Department of Urban and Regional Planning and Center for Community Economic Development, University of Wisconsin – Madison/Extension
November, 2003
Abstract: While the demand aspects of publicly provided recreation have long held the spotlight of research, the supply side of public recreation components remains inexact and relatively unexplored. In this report, we focus on supply components of recreational resources in Wisconsin. The supply of recreational resources is a complex combination of natural amenities and recreational sites which are influenced by an array of factors that act to provide opportunities which satisfy recreational needs and desires. Measures of recreational site density are a critical first step in analyzing supply and need to account for both physical/geographic size and population, or social capacity. In an effort to assess recreation supply in Wisconsin, we present county-level data analyzed using alternative indices that speak to referencing amenities and recreational sites within a broader regional context. Results suggest that measures of recreational carrying capacity vary widely depending on the metric used and that capturing a broader geographical realm is critical to understanding the spatial supply patterns of amenities and certain types of recreational sites. ____________________ * Authors are listed in alphabetical order with shared lead authorship. Herreid is a graduate student and Marcouiller is an Associate Professor in the Department of Urban and Regional Planning at the University of Wisconsin – Madison. Prey is a Senior Planner with the Wisconsin Department of Natural Resources. This research was made possible with funding from the Wisconsin Department of Natural Resources – Bureau of Parks and Recreation. We appreciate the assistance of Don English and the USDA Forest Service but forward the notion that any errors, omissions, misinterpretations, or implications contained in this report are solely the responsibility of the authors and do not reflect the stated policy positions of state or federal agencies.
2
Standardizing county-level recreation supply components: A precursor to the Wisconsin SCORP, 2005
INTRODUCTION A large component of recreation and tourism planning works to match the availability of recreational sites with the needs and desires of people. In the private realm, this is done within a market framework with an ability of the provider to exclude use based on market prices. Public recreation planning, on the other hand, mimics the desires of the voting electorate and acts to develop fundamentally non-marketed recreational goods and services. In the public realm, recreation planning is accomplished by providing common-pool, publicly-owned resources based on political will within fairly rigid and constrained fiscal resources. While the demand aspects of publicly provided recreational sites have long held the spotlight of research, the supply side of public recreation components remains inexact and relatively unexplored (Hall and Page 2002). In this report, our focus is on the supply components of recreational resources in Wisconsin. The supply of recreational resources is a complex combination of natural amenities and recreational sites which are influenced by an array of factors that act to provide opportunities which satisfy recreational needs and desires (Kretuzwiser 1989). Implicit to this definition is a continuum ranging from biophysical resources to developed (or built) facilities.
One critical yet unresolved issue of recreation production (or supply) is the importance of publicly provided and non-marketed natural amenities. These publicly provided goods and services tend to be hidden from view due to their non-priced attributes (Leiper 1990 ; Smith1998; Marcouiller 1998). As noted in the early seminal work of Clawson and Knetsch (1966, page 89):
“There is nothing in the physical landscape or features of any particular piece of land or body of water that makes it a recreation resource; it is the combination of the natural qualities and the ability and desire of man to use them that makes a resource out of what might otherwise be a more or less meaningless combination of rocks, soil and trees.”
Given this broad perspective of recreation supply, the need to separate and analytically focus on both natural amenities and individual recreational sites becomes obvious. These latter amenity-based public goods defy empirical analysis due to their non-priced and common-pool characteristics, but their characteristics do matter in many leisure and recreational products. For example, a quiet forested campsite along a lake is different from a campsite along a heavily trafficked interstate. The campsite itself is only a portion of the recreational product. Indeed the surrounding land use, the forests or water resources, and the environment dramatically affect the camping experience. Amenity-based public goods such as forests and water serve as latent primary factor inputs into the production process of recreation and tourism. Although some sectors of amusement-based recreation, such as theme parks or water parks, require few if any latent environmental inputs, outdoor and nature-based recreation are based on environmental resources and facilities play a secondary role (Hall and Page 2002; Marcouiller 1998; Dissart 2003). Public recreation planning Planning for recreation encompasses a broad set of activities ranging from physical site planning and environmental resource management to budgetary analysis based on economic and social benefits. One important overarching role of planning is to equilibrate the regional supply of recreation resources with their respective demands within the context of protection and
3
maintenance of the physical resource base. When recreational demands and public recreation supply are out of balance, efforts can and should be directed toward improving the supply-demand match. Effective recreation planning requires the integration of policies and actions of governmental agencies, non-profit organizations, and commercial enterprises (Gunn 1994). In the United States, the Statewide Comprehensive Outdoor Recreation Planning (SCORP) process performed by most state resource agencies every five years attempts to address both demand for and supply of publicly provided recreational resources. Several innovators in this process provide the context for our work reported here. For instance, Florida’s Statewide Comprehensive Outdoor Recreation Plan (SCORP) is viewed as an important example of applying recreation supply capacity techniques within a planning framework. In a similar vein, Oregon's SCORP work with inventory of recreation supply provides another good example.
The Florida SCORP provides an analysis of supply capacity. The authors of this work contend that a focal point of outdoor recreation planning is the quantitative comparison of outdoor recreation demand against the supply of recreation resources and facilities at a given point in time. Spatial imbalance exists where demand exceeds supply. An admitted shortfall of Florida’s quantitative analysis of recreation supply and recreational demand is that outdoor recreation demand figures are computed based on resident population, and a “shortage” of a resource or a facility in one community, city, or county may not be apparent because of a surplus in a neighboring jurisdiction or an un-captured demand source located outside of the region under examination (State of Florida, 5-4). Simply stated, there remains a great need to develop estimates of supply and demand that account for broader geographies and capture the driving influence of urban populations.
Delineating recreation supply often boils down to an ad-hoc exercise (Smith 1999). Gunn (1994) outlines five broad categories of supply: attractions, transportation, services, information, and promotion. These components are controlled by government agencies, non-profit organizations, and private business interests. These components tend to be dynamic, interdependent, and difficult to coordinate; greatly influenced by external factors such as natural resources, cultural resources, entrepreneurship, finance, labor, competition, community, governmental policies, organization, and leadership. Importance of planning analysis focused on recreation supply
The supply of recreation has important developmental dimensions. To communities across Wisconsin, outdoor recreation and tourism appeal as development strategies because of general increases in leisure demand, changing rural economic patterns, perceptions of tourism as a clean industry, relatively low capital requirements for business, and other community development benefits (Frederick 1993; Power 1996; Marcouiller 1997; Dissart 2003). Gateway communities, or those communities that are closely proximate to public recreation destinations, are grappling with complex and traditionally unfamiliar growth management issues (Howe, McMahon, and Probst 1997; Marcouiller, Olson and Prey 2002). Indeed, the presence of natural amenities, the supply of recreational sites, and the promotion of recreation as an economic growth engine through tourism is rarely a developmental panacea and may have adverse effects on income equality, social health, and the environment (Rothman 1999; Power 1996; Marcouiller and Green 2000).
The issue of recreational supply is taking on an increasing sense of urgency as open and publicly accessible lands experience increased pressures. As rural landscapes become fragmented by private residential developments, the extent and quality of publicly accessible recreation lands becomes scarce. The effects of this transition act to constrain the supply of recreation land and facility development (State of Wisconsin 2000).
With technological progress and increases in disposable incomes, the last twenty years has seen a dramatic increase in alternative recreational uses of land. Jet skis, all terrain vehicles (ATVs), and skateboard parks are all new hallmarks of outdoor recreation; many of which generate significant conflict. With this alternative set of recreational activities come an increasing

4
number of antagonistic recreational pursuits that compete for the same limited recreation land resources. A specific planning focus on intra-recreational use conflict becomes a glaringly obvious component of interest to the general public as voiced through the prior planning processes (State of Wisconsin 2000). Recreational conflict is a confounding element associated with recreation supply. Certain recreation activities interact with others in less than compatible ways. Conflict management is necessary so that recreation resources can be protected and most equitably enjoyed. Effectively managing recreational use conflicts entails an understanding of how alternative recreational uses interact. A logical approach to managing recreational conflicts might involve maximizing those uses thought to be complementary and supplementary while segregating those uses that are competitive and antagonistic (Clawson 1974; Marcouiller and Ellefson 1987; vanKooten 1992). Although it is recognized that intra-recreational use conflict poses a serious caveat to recreation and tourism supply analysis, there exists a dearth of useful approaches that allow its incorporation into standardized metrics of carrying capacity or recreation supply.
Public recreation planning activities need to take on a comprehensive and balanced view that incorporates both demand and supply sides extending beyond its site specific facility planning tasks to the incorporate a regional context. Guidelines that promote integration of recreation and tourism within broader regional goals and objectives should be stressed (Clawson and Knetsch 1966; Gunn 1994; Marcouiller 1997; Hall and Page 2002). If recreation planning continues to revolve around the increasing, dynamic, and often capricious demands of recreation, without maintaining and/or increasing the supply of recreation resources, the ability of those in the future to enjoy the same level of recreation amenities is severely threatened. This report is organized into three subsequent sections. The first section outlines both the data on recreation supply and the alternative analytical approaches used in developing recreational supply indices. The next section presents the descriptive results for key recreation supply components in Wisconsin. As an initial effort, we focus on 8 key elements that provide an overview of broadly defined amenities and specific recreational sites in Wisconsin. The final concluding section outlines relevant implications for policy and presents a framework for future research that addresses recreation supply.
METHODS
An array of qualitative and quantitative approaches exists to address recreation supply (Smith 1994; Ioannides and Debbage 1998; Hall and Page 1998; Schaffer 1999). The supply elements of recreation and tourism resources are inextricably intertwined. While those recreating are not necessarily tourists, recreation and recreation facilities often serve as tourist attractions. The literature background from this paper borrows heavily from sources intended for tourism planning. For example, Gunn (1994) wrote a seminal handbook on the basics of tourism supply while Hall and Page (2002), Smith (1998) and Marcouiller (1997; 1998) provide current analysis and alternative viewpoints of supply side tourism and recreation planning. With respect to the analysis found in this paper, the fugitive literature contains important background. For example, Holland (2003) compared the population ratios for recreation facilities of Florida counties and Illinois park districts, which are considered to have above average supply. A planning report by the Southeastern Wisconsin Regional Planning Commission (SEWRPC 1977; Appendix A) suggests some objectives, principles, and actual population and areal standards for recreation facilities. Tracking the supply of recreation resources Recreation sites evade easy characterization. For example, the range of sites considered to have leisure opportunities includes an open field or a picnic site to a multi-million dollar water park. A recreational facility is a site specific development that either provides its own amenity

5
(e.g. an amusement park or museum) or allows access to surrounding amenities (e.g. boat launch onto a lake or campsites in a forest). The former typically entails significant financial capital to develop the amenity while the latter typically substitutes the surrounding amenity value (often publicly provided) for financial capital. Sites and facilities fall generally under Gunn’s (1994) “attractions” category for the components of recreation supply. Providers of recreational sites and facilities, as well as the other components of recreation supply, can be categorized by ownership group including private, public (government agencies at local, state, federal levels), and non-profit organizations.
The recognition of recreational resource supply typically is accompanied by an inventory process that assesses the quantity, quality and extent of the resource base (Hall and Page 1999). Although no definitive scheme exists for classifying recreational resources, the need to distinguish between built and naturally occurring amenities, useful initial groupings address alternative environments and resource types. For instance, Chubbs’ (1981) classification includes:
• The undeveloped recreation resources, where physical attributes of land, water and
vegetation are untouched; • Private recreation, such as second homes, resources owned by quasi-public
organizations; • Commercialized private recreation resources, such as shopping malls, theme parks,
museums, gardens, and resorts; • Publicly owned recreation resources, including parks, sports and leisure facilities,
national parks, forest and tourist sites; • Cultural resources, based in both the public and private sector, such as libraries, the Arts
and what is increasingly being termed ‘the cultural industries’; • Professional resources, which may be divided into the administrative functions for
recreational provision and management.
Variables in a typology might include urban and rural resource-based, intermediate and user-oriented, man-modified and natural resources; formal and informal; intensive and extensive; fragile and resistant; and public and private ownership (Hall and Page 1999). The spatial aspect of supply is also an important dimension in the supply of recreational opportunities. Coppock and Duffield (1975) recognize the spatial separation between users of recreation (demand) and the presence of amenities and recreation sites (supply). Matching these demands with supply of recreation reflects important locational components and spatial patterns reflective of underlying resource endowments. These endowments include both natural (hills, lakes, forests) and socioeconomic resources (undeveloped land, available skilled labor and financial capital). In this way, we can recognize that supply is often unable to spatially respond to demand. The location of recreation facilities has been referred to as ‘site preferred’ goods, where proximity to their location is often seen as a measure of their use (Austin 1974). The tension in recreation planning involves balancing the location of recreation supply with the distance people have to travel and providing access to as many people as possible. Certainly, infrastructure (roads and transportation corridors) and recreational access are inextricably intertwined thus providing a broad set of coordinating tasks. Also, it is important to recognize that certain recreational endeavors require remoteness and inaccessibility as a precondition for their existence. Wilderness and deep-woods canoeing or hiking are recreational examples where increased use can detract from the resource itself. A federal effort to standardize recreation supply data. The federal government has been actively involved in recreation supply planning for the past 50 years. Since the 1980s, there has been a nationwide effort to standardize data on recreation supply. Today, the National Outdoor Recreational Supply Information System (NORSIS) data set developed and maintained by the USDA Forest Service’s Wilderness Assessment Unit, Southern Research Station at Athens,

6
Georgia provides one of the few standardized sources of data for recreation in the United States. This database is a record of roughly 450 different amenity and recreation site variables for every county in the country. It contains a wide array of amenity attribute measures, including everything from American Business Index’s number of archery ranges per county to the USDA Forest Service’s measure of wild and scenic river miles per county. Unfortunately, its ground-truthing for accuracy and regular updating remain significant issues for further refinement and additional research. This said, it remains as the only national recreational dataset in which a base reference point can be established. The analysis of recreation supply contained in this report is based on the NORSIS dataset which was released in 1997 and built using incidence of data elements from the preceding 3-5 year period. Although this dataset provides a valuable benchmark, it reflects recreation supply during the early to mid-1990s. To be sure, it would benefit from both updating and confirmation. For this updating and confirmation, it is interesting to look at what other states have done for their own recreation planning exercises. The experience of other States. The State of Oregon more widely categorizes providers of public and private-sector recreation organizations that provide outdoor recreation opportunities for the general public. Oregon classifies each recreation provider into one of eight major recreation supplier categories. Major recreation supplier categories are comprised of federal, state, county, municipal, other public, public schools, utilities, and private providers (State of Oregon 2001; 2003). A central component of Oregon’s statewide recreation plan is the quantitative comparison of outdoor recreation supply and demand of existing recreation resources and facilities. Data collected over a period of 10 months by the Oregon Parks and Recreation Department staff included outdoor recreation resource and facility information from public and private-sector recreation providers in the state. In total, outdoor recreation resources and facilities information from 1,622 outdoor recreation providers was collected. Results are presented at the county, regional, and statewide levels. Outdoor recreation settings are also a classification that is important because they comprise a major portion of most recreation experiences. In Oregon, participants were asked to indicate the setting where they did there favorite activity and the setting they would prefer to do it in. The nine outdoor recreating settings were on a scale of decreasing primitiveness. The nine groups (decreasing in wildness) are primitive, semi-primitive, roaded natural, roaded modified, rural, highly developed, nature-dominated within urban, park-like within urban, facility-dominant within urban. Primitive, on the wildest side of the spectrum, is defined as an unmodified, natural setting where you will meet few, if any, other people. Access is cross-country travel to fairly difficult trails where motorized use is prohibited. Recreation facilities are generally not provided. Rural, in the middle of the scale, is defined as rural area where development such as farms, houses, stores, or equipment is commonly visible. Access is by paved road and the interaction between people can be moderate to high. Rustic bathrooms and showers, some electricity, lighted fields, etc., may be provided. Facilities for motorized use and parking are available. Facility-dominant within urban, the most developed category, is defined as predominantly build setting of pavement and structures, intended for leisure or recreation use within the urban context where one can expect a high level of interaction, management, and visitor controls. Areas may include small areas of grass, other vegetation, and/or shade trees growing within a paved area. Examples would be paved plaza parks or ornamental gardens (State of Oregon 2001; 2003). The State of Florida (2000) has also recently completed a process whereby a thorough inventory of existing parks, open spaces and other outdoor recreation facilities was compiled. They felt it necessary to assess whether the system was comprehensive, equitably distributed, accessible and representative of each community’s natural landscape qualities. The Florida Division of Recreation and Parks maintain an inventory that provides details regarding the location, type, and size of outdoor recreation facilities and resources throughout the state. It is a planning tool for public and private recreation interests, useful in analyzing outdoor recreation and open space needs and capabilities and establishing program goals and priorities. Additional
7
information such as maps of existing and proposed recreation resources, assessments of the conditions and qualities of existing facilities, and details of any limitations or barriers to participation and access provide qualitative measures to combine with visitor satisfaction data to provide a much detailed assessment of the ability of the system to meet current and future needs (State of Florida 2000: 2-61). In Florida, the inventory includes all outdoor recreation facilities and resources provided by federal, state, regional, county, and municipal governments, commercial enterprises, non-profit organizations, and clubs. The Division of Parks and Recreation updates the inventory every two years. The staff mails inventory update forms to all previously inventoried providers and uses secondary data sources, including trade publications, private recreation directories and guides, and Internet web pages, to identify new providers to add to the inventory. However, there are certainly privately owned recreation resources and facilities that are not included in the private supply inventory (State of Florida 2000). Standardizing supply components It is important to recognize that demand and supply are fundamentally unique and are built on different units of measurement. While descriptive metrics of demand primarily focus on visitor numbers by place of origin, recreation supply represents the extent of physical resources present and some indication of its capacity.1 Examples of the former include the number of park acres or the number of lifts in a downhill ski hill. The latter capacity elements speak to a more detailed assessment of capacity; examples include items such as the number and size of camping sites or the uphill lift capacity in skiers per hour. Use guidelines are employed as a means of stating the amount of use a resource or facility can accommodate under certain conditions. Population guidelines are used in determining the amount of resources and facilities that are required to serve a given population. Site guidelines are used primarily for estimating acreage needs for local parks and recreation areas (State of Florida 2000).
It is also important to recognize that use of recreation areas and facilities is not evenly distributed throughout the year. Most outdoor recreational activities have a distinct and unique seasonal pattern that is determined by climate. Also, recreational demands normally peak on weekends and holidays.
These peak days are the most important for purposes of comparison with existing recreation supply. Peak days and seasons are considered critical thresholds; they represent high volumes of demand expected for activity throughout the year. “Design demand” is the term used for an average weekend or holiday volume of participation, or peak day. The quantity of resources and facilities required to meet design demand represents a more realistic goal for recreation providers than the level of supply required to accommodate the highest demand generated.
In applying guidelines to the computation of supply capacities in Florida, it was assumed that recreation demand would be distributed to each and every existing recreation resource up to its capacity as envisioned by the appropriate guideline. Naturally, not all existing resources receive the average level of use. Also, a local resource or facility may be needed in a locality where needs statistics in the plan may indicate no need for the region as a whole (State of Florida 2000). Population ratios. The first known recreation and park population ratios were of British origin in the late 1800’s. Alternative ratios exist but one usable population ratio for recreation 1 We recognize that there is a difference between descriptive and inferential metrics of demand and supply that differ by discipline. Examples of inferential demand metrics often include price-quantity tradeoffs (economics), biophysical limits on resource use (conservation biology), or social and cultural constraints on use (sociology). For our purposes here, we limit our analysis to descriptive metrics of supply.
8
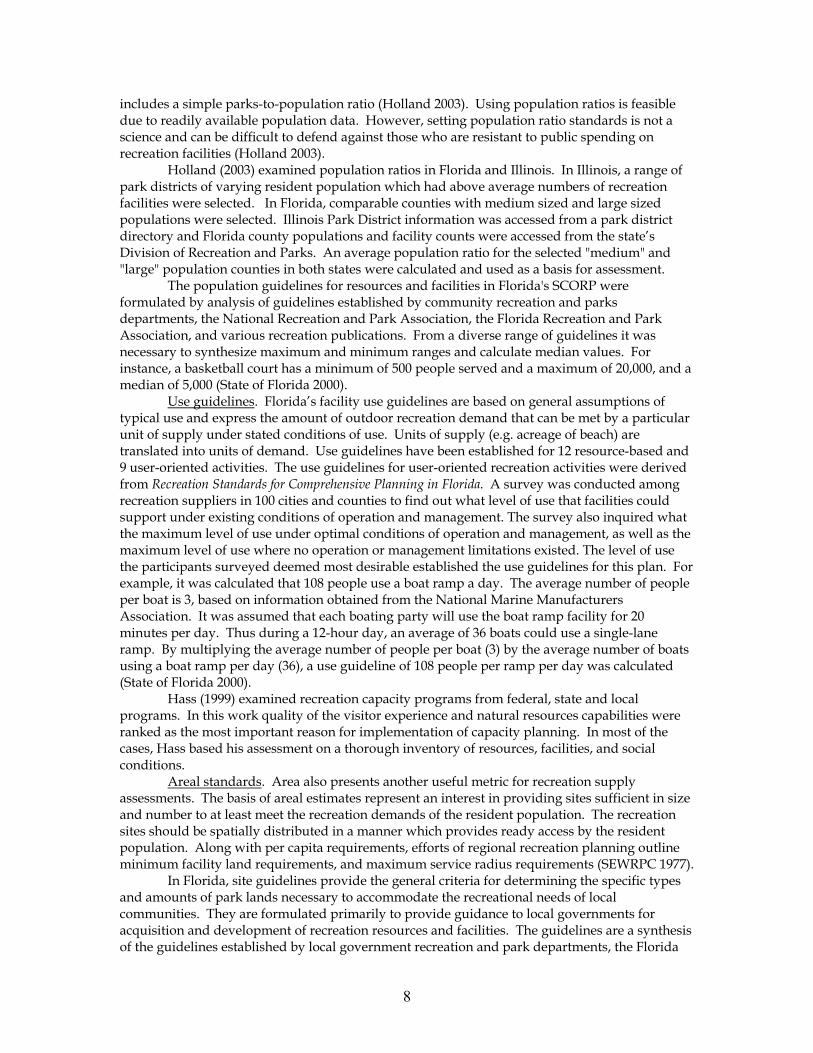
includes a simple parks-to-population ratio (Holland 2003). Using population ratios is feasible due to readily available population data. However, setting population ratio standards is not a science and can be difficult to defend against those who are resistant to public spending on recreation facilities (Holland 2003). Holland (2003) examined population ratios in Florida and Illinois. In Illinois, a range of park districts of varying resident population which had above average numbers of recreation facilities were selected. In Florida, comparable counties with medium sized and large sized populations were selected. Illinois Park District information was accessed from a park district directory and Florida county populations and facility counts were accessed from the state’s Division of Recreation and Parks. An average population ratio for the selected "medium" and "large" population counties in both states were calculated and used as a basis for assessment. The population guidelines for resources and facilities in Florida's SCORP were formulated by analysis of guidelines established by community recreation and parks departments, the National Recreation and Park Association, the Florida Recreation and Park Association, and various recreation publications. From a diverse range of guidelines it was necessary to synthesize maximum and minimum ranges and calculate median values. For instance, a basketball court has a minimum of 500 people served and a maximum of 20,000, and a median of 5,000 (State of Florida 2000). Use guidelines. Florida’s facility use guidelines are based on general assumptions of typical use and express the amount of outdoor recreation demand that can be met by a particular unit of supply under stated conditions of use. Units of supply (e.g. acreage of beach) are translated into units of demand. Use guidelines have been established for 12 resource-based and 9 user-oriented activities. The use guidelines for user-oriented recreation activities were derived from Recreation Standards for Comprehensive Planning in Florida. A survey was conducted among recreation suppliers in 100 cities and counties to find out what level of use that facilities could support under existing conditions of operation and management. The survey also inquired what the maximum level of use under optimal conditions of operation and management, as well as the maximum level of use where no operation or management limitations existed. The level of use the participants surveyed deemed most desirable established the use guidelines for this plan. For example, it was calculated that 108 people use a boat ramp a day. The average number of people per boat is 3, based on information obtained from the National Marine Manufacturers Association. It was assumed that each boating party will use the boat ramp facility for 20 minutes per day. Thus during a 12-hour day, an average of 36 boats could use a single-lane ramp. By multiplying the average number of people per boat (3) by the average number of boats using a boat ramp per day (36), a use guideline of 108 people per ramp per day was calculated (State of Florida 2000).
Hass (1999) examined recreation capacity programs from federal, state and local programs. In this work quality of the visitor experience and natural resources capabilities were ranked as the most important reason for implementation of capacity planning. In most of the cases, Hass based his assessment on a thorough inventory of resources, facilities, and social conditions. Areal standards. Area also presents another useful metric for recreation supply assessments. The basis of areal estimates represent an interest in providing sites sufficient in size and number to at least meet the recreation demands of the resident population. The recreation sites should be spatially distributed in a manner which provides ready access by the resident population. Along with per capita requirements, efforts of regional recreation planning outline minimum facility land requirements, and maximum service radius requirements (SEWRPC 1977).
In Florida, site guidelines provide the general criteria for determining the specific types and amounts of park lands necessary to accommodate the recreational needs of local communities. They are formulated primarily to provide guidance to local governments for acquisition and development of recreation resources and facilities. The guidelines are a synthesis of the guidelines established by local government recreation and park departments, the Florida
9
Recreation and Park Association, various recreation publications, and the National Recreation and Park Association. For example, a "neighborhood park" is meant to be a "walk-to" park. It has a population radius of .5 miles and should have two acres for every 1000 people, and its size usually ranges from 5 – 10 acres (State of Florida 2000).
These supply metrics boil down to the use of simple indices that reflect the incidence of recreational resources. Useful supply measures standardize resources by scaling them on some per unit basis. This scaling can be based on per capita or per acre basis depending on the task at hand. In their simplest form, these indices can serve as a base metric of carrying capacity. One problem associated with simple indices of local population is their use for resources that draw people into the region from the outside. It is important to recognize that there exists wide variation in demand characteristics that differ by unique recreational resource types. For instance, municipal parks (playgrounds, picnic areas, basketball courts, etc.) are typically used (demanded) by people who reside in the city. The level of use by non-locals is limited. On the other hand, popular state and federal parks (Devils Lake State Park, Yellowstone National Park, etc.) are typically used by non-locals with local use limited to off-peak times. Thus, for non-locally demanded recreation/tourism resources, there is a need a broader geography that captures a larger regional demand. This leads to alternative metrics such as the recreation location quotient.
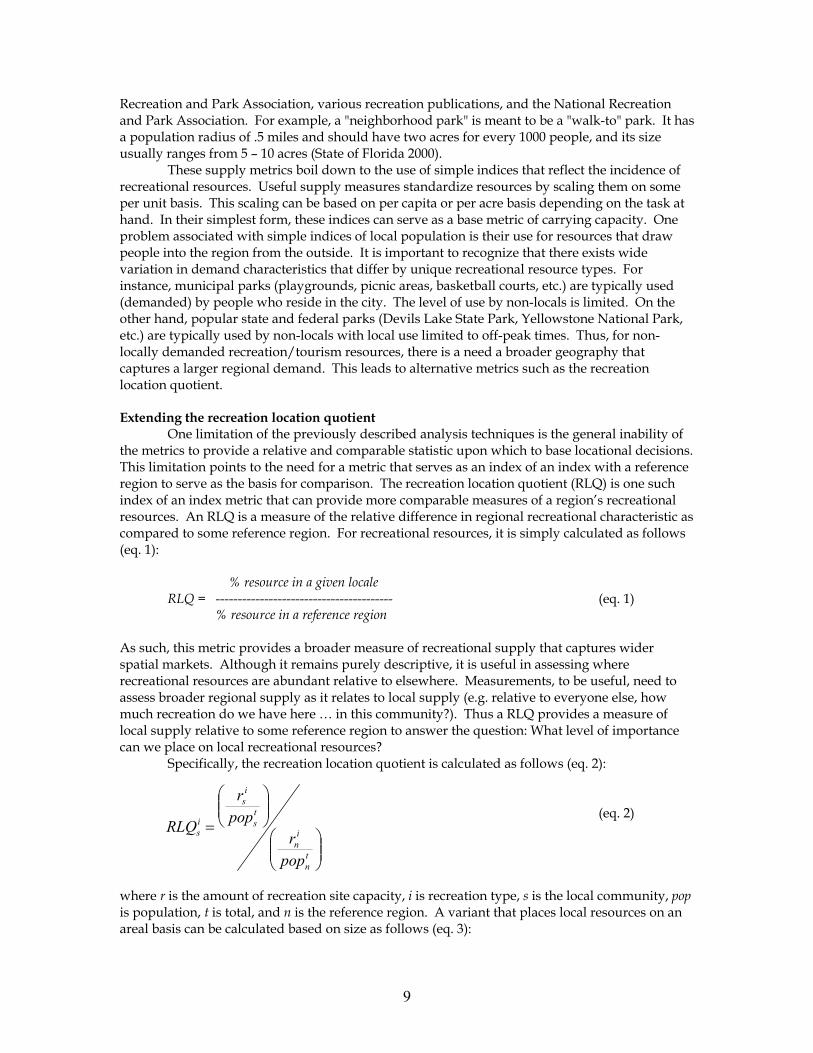
Extending the recreation location quotient One limitation of the previously described analysis techniques is the general inability of the metrics to provide a relative and comparable statistic upon which to base locational decisions. This limitation points to the need for a metric that serves as an index of an index with a reference region to serve as the basis for comparison. The recreation location quotient (RLQ) is one such index of an index metric that can provide more comparable measures of a region’s recreational resources. An RLQ is a measure of the relative difference in regional recreational characteristic as compared to some reference region. For recreational resources, it is simply calculated as follows (eq. 1): % resource in a given locale RLQ = ---------------------------------------- (eq. 1) % resource in a reference region As such, this metric provides a broader measure of recreational supply that captures wider spatial markets. Although it remains purely descriptive, it is useful in assessing where recreational resources are abundant relative to elsewhere. Measurements, to be useful, need to assess broader regional supply as it relates to local supply (e.g. relative to everyone else, how much recreation do we have here … in this community?). Thus a RLQ provides a measure of local supply relative to some reference region to answer the question: What level of importance can we place on local recreational resources? Specifically, the recreation location quotient is calculated as follows (eq. 2): (eq. 2) where r is the amount of recreation site capacity, i is recreation type, s is the local community, pop is population, t is total, and n is the reference region. A variant that places local resources on an areal basis can be calculated based on size as follows (eq. 3):
=
tn
in
ts
is
is
popr
popr
RLQ

10
(eq. 3)
The implications of recreation location quotient values speak to the level of excess recreation supply. The theoretical domain of a recreation location quotient extends between zero and infinity (0 < RLQ < ∞) but in practice, the upper bound is about 50 or so. Inferences of alternative RLQ values include the following: RLQ = 1 region has same proportion of recreation type i as reference region RLQ < 1 region is producing less of recreation type i than reference region – key indicator for recreation development strategies (if appropriate) RLQ > 1 region has an excess proportion of recreation type i as compared to reference region (infers amount of non-local, or tourist, use) RLQ = 4 region has four times the level of recreation type i compared to the reference region Again, the recreation location quotient provides a usable metric for assessing where recreation supply exists and doesn’t exist. Recreation location quotients have limitations. An RLQ does not allow for variations in regional tastes and preferences, propensities to consume locally, ease of access via transportation networks, income levels and employment, economies of size (agglomerative effects of urban influence), and regional comparative advantage. The overpowering advantages of using location quotients are that they provide an inexpensive and comparable statistic for examining the incidence of a characteristic in any given location.
Selecting the reference region determines the characteristics of an RLQ index. More detailed assessment and use of peer regions provides an extension of the RLQ, referred to in the regional science literature as the minimum requirements (MR) technique. In the MR approach, a reference region is selected from a peer-group of regions that can be defined based on population, density, distance from metropolitan area, or other key demographic characteristics. The MR approach assumes that set of regions comprising the peer has no excess recreational resources until local consumption needs are met. Peer-group regions that have higher proportions than the minimum devote the difference to non-local use.
The minimum requirements approach allows for homogeneous regions to be compared, which can be useful when interests include a focus on regional uniqueness. For instance, by comparing only urban areas the MR approach allows for an accounting of agglomerative effects. On the other hand, comparing only rural remote regions of like amenity bases allows us to distinguish like resource regions that are uniquely distant from major demand sources. The MR approach is a more specific alternative to the location quotient, because it measures a region with respect to a specific peer group. In the case of recreation, this can be done based upon their degree of rurality. An example of a standardized regional approach to peer groups is found in something referred to as the urban to rural continuum code, initially developed by Calvin Beale2.
2 The Beale Code is a USDA ERS regional typology that classifies counties into finer residential categories beyond the standard metropolitan statistical area. Particularly for the analysis of trends in non-metropolitan areas that are related to population density and metropolitan influence, this classification represents the rural-urban continuum. The continuum begins with 0, which designates a central county with metropolitan areas of 1 million population or more, and continues in rurality to 9, which designates a county that is completely rural (no places with a
=
tn
in
ts
is
is
arear
arear
RLQ

11
Beale codes were developed to measure this characteristic by forming a classification scheme that distinguishes metropolitan counties by size, and nonmetropolitan counties by degree of urbanization and proximity to metro areas.
For ease of presentation and because of a general lack of prior regional recreation delineations, we will only present recreation location quotients and will use the three Lake States of Wisconsin, Minnesota, and Michigan as our reference region. Alternative reference specifications including minimum requirements peer identification, while a component of previous Wisconsin-based tourism work (Leatherman and Marcouiller 1996), remains for further research.
DESCRIPTIVE RESULTS FOR WISCONSIN COUNTIES
This section will outline the results of analyzing county-level recreation supply components in Wisconsin based on selected NORSIS database variables. Tallies of attribute measures using various approaches to standardization are discussed and graphically displayed using maps produced using ArcGIS 8.3. Their relative spatial distributions are presented from simple population ratio to the more complex recreational location quotient perspectives. Natural amenities Natural amenities serve as backdrop resources for recreation and exist as a generally unexplored inferential recreation supply component. As an initial assessment, this section contains three basic measures of natural amenities. These include inland water resources, forest resources, and county-owned lands. 1. Inland water resources
The measure of water acreage is comprised of the summed water acreage of six NRI variables in the NORSIS database. These include water bodies less than two acres, water bodies of two to forty acres, water bodies greater than or equal to forty acres (both lakes and reservoirs), perennial streams greater than or equal to 1/8 mile wide, and perennial stream 66 – 660 feet wide. Water acreage density follows the general pattern of lakes, reservoirs, and rivers in Wisconsin. County populations are also displayed on the graphic presented as Figure 2. Because of definitional complexities, Lake Michigan and Lake Superior are excluded from consideration which poses an important caveat. We recognize that these larger lakes do provide many of the same recreation opportunities as do “inland” water resources and further work can clarify appropriate techniques to incorporate their presence. Inland freshwater bodies represent an amenity whose physical presence does not change dramatically over time. In stating the obvious, these water resources provide key recreational resources in Wisconsin. During the past 50 years, there has been an increasing demand for lands in close proximity to water resources for residential development. This has led to a significant development saturation effect. Simply stated, there is precious little undeveloped land surrounding lakes and rivers in Wisconsin today. Furthermore, the presence of lakes and rivers are reflected in value premiums for proximate real estate representing important drivers of property value and local property tax bases in rural remote regions. Many of these properties are owned by non-local and seasonal homeowners. They are typically non-residents of the county where the second home is located. Thus, a “resident population standard” would most likely not realize the actual utilization of a water resource by seasonal homeowners.
population of 2,500 or more) not adjacent to a metropolitan area. Designations 0-3 are considered metropolitan, 4-9 are considered non-metropolitan.

12
Figure 1a. Inland water acreage across Wisconsin
Inland water acreage densities on both acreage and population bases are presented in
Figure 1a. There is a distinct spatial pattern to the location of Wisconsin’s 15,000 inland bodies of water. From the Figure, it is apparent that the flowage basins of Northern Wisconsin and the Fox River Valley exist as water-rich regions of the State while the driftless region of Southwestern Wisconsin and a band extending through the North Central part of the state have relatively fewer water-based resources. On a population basis, the simple presence of Milwaukee and Madison identify regions with relatively low water per capita metrics.
Recreation location quotients for inland water resources show a slightly different spatial pattern of water-based amenity supply that captures broader regional characteristics of the Lake States (Minnesota, Wisconsin, and Michigan). These RLQs for inland water resources are graphically displayed in Figure 1b for both acreage and population bases. It is important to remember that counties showing up as brown shades reflect RLQs of less than 1 which infer less than average regional inland water resource supplies while those in blue shades (RLQs of greater than 1) reflect higher than average relative inland water resource supplies.
13
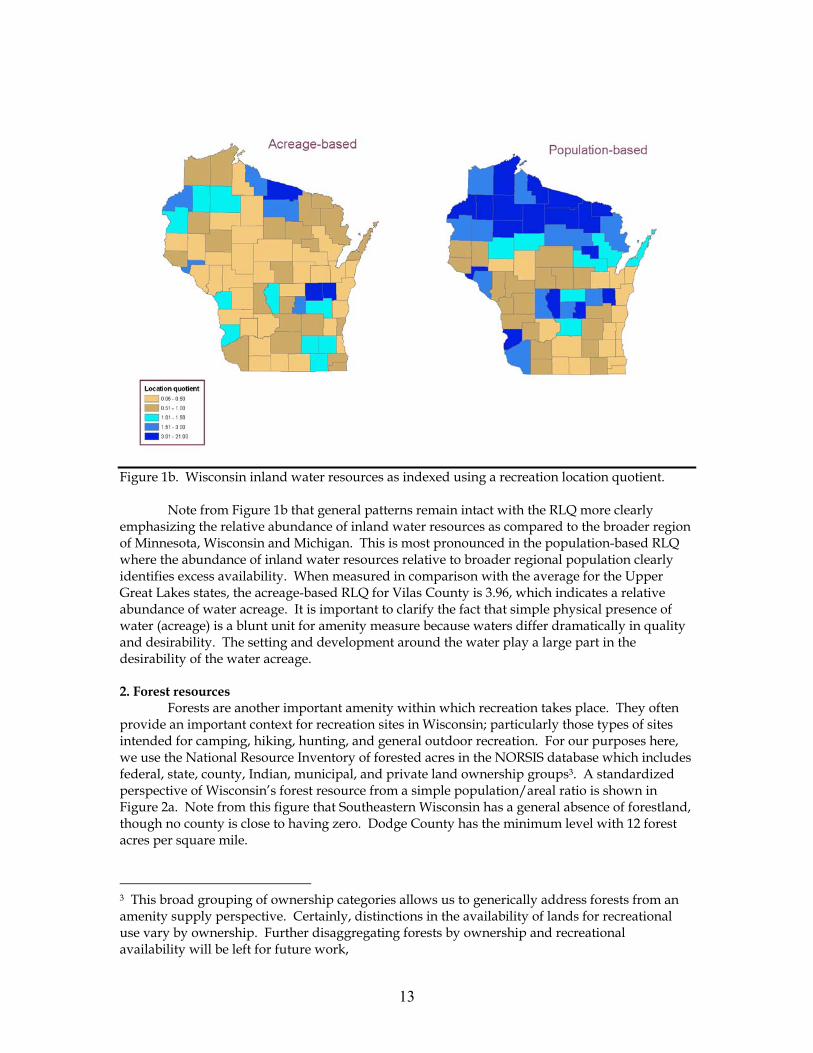
Figure 1b. Wisconsin inland water resources as indexed using a recreation location quotient.
Note from Figure 1b that general patterns remain intact with the RLQ more clearly emphasizing the relative abundance of inland water resources as compared to the broader region of Minnesota, Wisconsin and Michigan. This is most pronounced in the population-based RLQ where the abundance of inland water resources relative to broader regional population clearly identifies excess availability. When measured in comparison with the average for the Upper Great Lakes states, the acreage-based RLQ for Vilas County is 3.96, which indicates a relative abundance of water acreage. It is important to clarify the fact that simple physical presence of water (acreage) is a blunt unit for amenity measure because waters differ dramatically in quality and desirability. The setting and development around the water play a large part in the desirability of the water acreage. 2. Forest resources
Forests are another important amenity within which recreation takes place. They often provide an important context for recreation sites in Wisconsin; particularly those types of sites intended for camping, hiking, hunting, and general outdoor recreation. For our purposes here, we use the National Resource Inventory of forested acres in the NORSIS database which includes federal, state, county, Indian, municipal, and private land ownership groups3. A standardized perspective of Wisconsin’s forest resource from a simple population/areal ratio is shown in Figure 2a. Note from this figure that Southeastern Wisconsin has a general absence of forestland, though no county is close to having zero. Dodge County has the minimum level with 12 forest acres per square mile.
3 This broad grouping of ownership categories allows us to generically address forests from an amenity supply perspective. Certainly, distinctions in the availability of lands for recreational use vary by ownership. Further disaggregating forests by ownership and recreational availability will be left for future work,

14
Like inland water resources, forest acres are temporally and spatially stable amenity attributes; particularly in the short-term (less than 10 years). Because the quantities of land discussed as forest cover are generally large and joint production issues such as timber management are common, compatibility issues and their relative economic consequences can be important. Non-recreation activities, such as timber and mining, often compete for the same land-based resources with recreational activities. Those counties with high forest density may also be areas with a large forestry industry presence, which could limit recreational uses of forests depending on accessibility, the intensity of forestry activities, and type of forest management practices employed.
Figure 2a. Forestland in Wisconsin
The northern portions of Michigan and Minnesota are heavily forested. The three-state average for forest cover is 225 NRI forest acres per square mile4. All three states are similarly homes to dominant and locally important wood-products industries; again, particularly in the northern portions of each state. Also worthy of mentioning is southwestern Wisconsin’s forest resources. Crawford County has an average of 298 forest acres per square mile which equates to a location quotient of 1.33 inferring a higher than average supply of forest cover. The county may also have a competitive advantage because it is closer to the large population centers and large transportation systems than the northern, forest-abundant counties.
4 One square mile is equal to 640 acres

15
Figure 2b. Extent of forestland as indexed by recreation location quotients The broader reference region of the Lake States is explicitly accounted for in the RLQ indices shown in Figure 2b. Like inland water acreage, forest cover when indexed using a RLQ for population suggests the populated regions of Southeastern Wisconsin have significantly lower forested land classes per capita. On the other end of the spectrum, Northern and Southwestern Wisconsin have more vast supplies of forested lands per capita. 3. County-owned land Wisconsin, Minnesota, and Michigan are unique in the extent of county owned and managed land. This is a general result of the high incidence of tax reversion that took place in the 1920s and 1930s across the region due to earlier post cutover agricultural development beyond the extensive margin (Roth 1989; Stier, Kim, and Marcouiller 1999). Today, county-owned lands comprise important recreational resources across Wisconsin. The NRI number of county-owned acres per square mile and per capita is graphically presented in Figure 3a. The largest county-owned acres to square mileage ratios are in the North. Oddly, eleven counties in clusters are reported as not having county-owned acres. The Southeast portion of the state has below average density for this attribute. One could speculate that more productive agricultural lands, larger populations, and generally higher land values lend themselves to higher degrees of privatization in the southern portion of the state.

16
Figure 3a. County-owned lands in Wisconsin The northeastern portion of the state has both lower population densities and less uniform densities of county-owned acres. The proportion of privately owned land may be a factor, as well as the portion owned by other public groups such as state and federal lands. In assessing Wisconsin relative to the broader Lake States, the RLQ indexes are shown in Figure 3b. The three-state average is 30.00 county-owned acres per square mile. Marinette County has an abundance of county-owned acres confirmed by a recreation location quotient of 5.80. Racine County in southeastern Wisconsin, adjacent to Milwaukee and part of the Chicago-Milwaukee corridor, has a location quotient of 0.55.

17
Figure 3b. County lands as indexed using recreation location quotients These three amenity attributes (inland water, forests, and county-owned lands) are certainly not an exhaustive list of natural resources upon which recreation is based. They represent our initial attempt to descriptively outline the location of natural amenity supplies across the state. Further research can obviously add other important attributes such as topography, landscape fragmentation, and infrastructure that could likewise be explanatory elements that are involved in the supply of recreation throughout the state. Outdoor recreational sites Unlike the natural amenity base, outdoor recreation sites are human built extensions that allow recreational access to outdoor characteristics. They typically result from public and/or private investments in infrastructure and are often closely reliant on the presence of natural amenities. For instance, downhill ski areas exist as private lands with significant entrepreneurial capital investments for slope development and maintenance, uphill lift equipment, and related services (chalets and rental shops). They are inextricably linked to the natural topography; completely reliant on a naturally existing feature for their recreational use. To reiterate, recreational sites are distinguishable from natural amenities from the simple standpoint of an element of public and/or private investment for development of a specific recreational use. Our intent with this report is to outline an initial set of recreational site types. Specifically, we focus attention on campgrounds, campsites, rails to trails conversions, golf courses, amusement places, and ski hills. Further extensions and additional types of sites are left to future work. 4. Campgrounds Campground density is a measure of the number of campgrounds per county as given by a sum of several NORSIS attribute variables (USDA-FS # of campgrounds 1987, ABI # of public and private campgrounds, and WOODALLS # of public and private campgrounds) divided by the
18
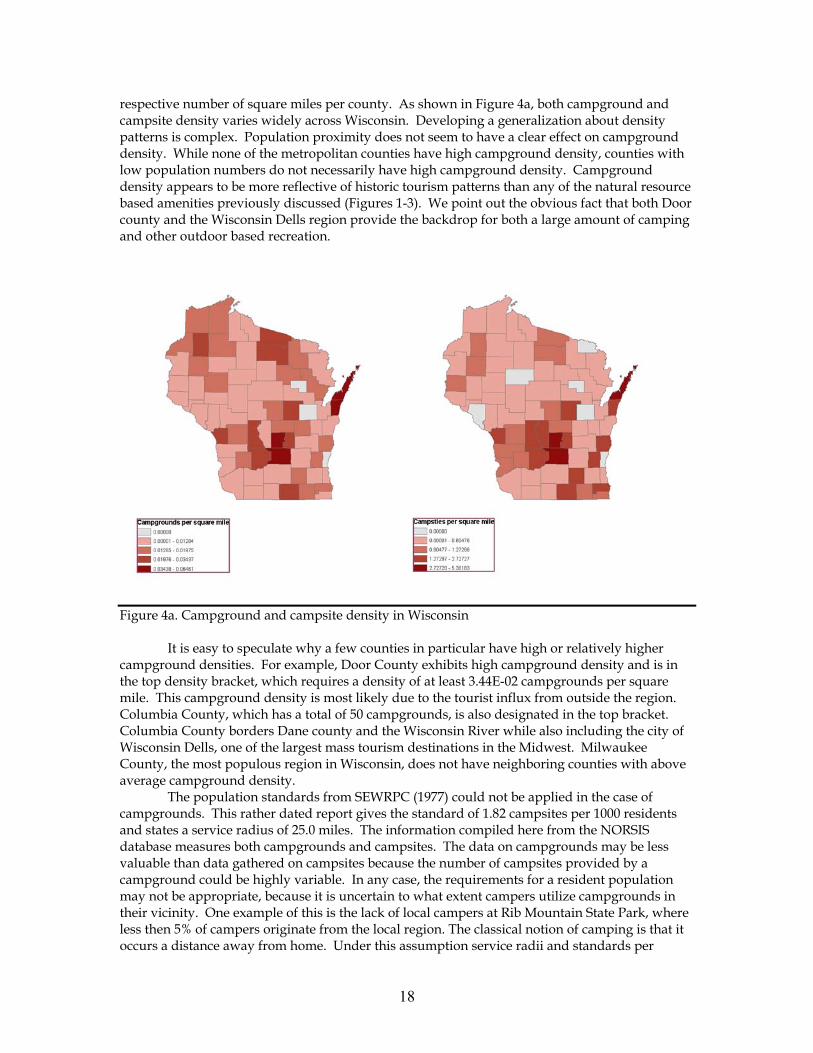
respective number of square miles per county. As shown in Figure 4a, both campground and campsite density varies widely across Wisconsin. Developing a generalization about density patterns is complex. Population proximity does not seem to have a clear effect on campground density. While none of the metropolitan counties have high campground density, counties with low population numbers do not necessarily have high campground density. Campground density appears to be more reflective of historic tourism patterns than any of the natural resource based amenities previously discussed (Figures 1-3). We point out the obvious fact that both Door county and the Wisconsin Dells region provide the backdrop for both a large amount of camping and other outdoor based recreation.
Figure 4a. Campground and campsite density in Wisconsin
It is easy to speculate why a few counties in particular have high or relatively higher
campground densities. For example, Door County exhibits high campground density and is in the top density bracket, which requires a density of at least 3.44E-02 campgrounds per square mile. This campground density is most likely due to the tourist influx from outside the region. Columbia County, which has a total of 50 campgrounds, is also designated in the top bracket. Columbia County borders Dane county and the Wisconsin River while also including the city of Wisconsin Dells, one of the largest mass tourism destinations in the Midwest. Milwaukee County, the most populous region in Wisconsin, does not have neighboring counties with above average campground density. The population standards from SEWRPC (1977) could not be applied in the case of campgrounds. This rather dated report gives the standard of 1.82 campsites per 1000 residents and states a service radius of 25.0 miles. The information compiled here from the NORSIS database measures both campgrounds and campsites. The data on campgrounds may be less valuable than data gathered on campsites because the number of campsites provided by a campground could be highly variable. In any case, the requirements for a resident population may not be appropriate, because it is uncertain to what extent campers utilize campgrounds in their vicinity. One example of this is the lack of local campers at Rib Mountain State Park, where less then 5% of campers originate from the local region. The classical notion of camping is that it occurs a distance away from home. Under this assumption service radii and standards per

19
resident population do not apply well. Assessments of campground and camping site densities require a broader comparison region. This type of outdoor recreational site is unique in that it attracts primarily non-local users. Thus, a RLQ should provide a better interpretation. Indeed, when campgrounds and campsites are analyzed using an RLQ, different patterns emerge as shown in Figure 4b.
Figure 4b. Campgrounds across Wisconsin as indexed using recreation location quotients
A location quotient for a given county can be performed by taking that county’s campground density and dividing it by the county average for the Lake States (Michigan, Minnesota, and Wisconsin). The campground density for Columbia County is 6.46E-02 campgrounds per square mile. When this is divided by the three-state average of 1.21E-02 the RLQ is 5.35, which indicates a relative high degree of campground concentration and specialization of this county in providing campgrounds. As another example, the suburban metropolitan county Waukesha, has a RLQ of 1.04, which indicates a rather average concentration of campgrounds.

20
Figure 4c. Campsites in Wisconsin as indexed using recreation location quotients Comparisons of the RLQ supply assessment of campgrounds (Figure 4b) with campsites (Figure 4c) shows some interesting differences. These results suggest that while there tend to be more campgrounds in the Northern part of the state, these campgrounds have fewer campsites. Also, the same general inference can be inferred from the population-based RLQs. Certainly, further study of campground and campsite location that distinguishes public from private campgrounds and develops explanatory models that assess key amenity relationships will provide further interesting results. 5. Rails-to-trails Abandoned rail lines often provide stimulus for the creation of an important recreational resource in Wisconsin. The early Rails to Trails conversions took place in the 1960s and continue through today. One of the nation’s most famous rails to trails conversions is the Elroy-Sparta bike trail in Monroe and Juneau Counties. For our analysis, we present the total NORSIS rail-trail miles variable. This is graphically presented in Figure 5a. Rail-trail mile density is highly variable throughout Wisconsin. Milwaukee County and two of its adjacent counties, Racine and Waukesha, have markedly high rail-trail densities on an areal basis. Brown County, which includes the city of Green Bay, has an above average rail-trail density. Yet, some population scarce counties, like Washburn and Barron, also have high rail-trail densities.

21
Figure 5a. Rails to trails incidence in Wisconsin Rail-trails are conversions of old rail beds into trails for recreation uses. Obviously, rail-trails require abandoned rail tracks or beds. These are prevalent in urban areas and in corridors between urban areas due to the historical reliance on rail to transport goods and people and the evolution to an era of dependence on other forms of transportation, like air travel or interstate freeways. Likewise, they are also present in areas that have had a history of extractive resource use, such as Iron and Price counties. Again, this is due to the presence of old rail beds. The conversion of old rail beds may also be the result of local communities’ initiatives to produce this type of recreation supply component. In particular, the initiative of individuals or leaders of a local government/community with the aggressiveness and competence to secure aid from higher levels of government are often keys to the presence of rail-trail projects.

22
Figure 5b. Rails-to-trails miles in Wisconsin as indexed using recreation location quotients The rather dated SEWRPC Appendix A does not mention rail-trails probably because they are a rather specific form of trails (SEWRPC 1977). The location quotient for Milwaukee County is 13.86 which indicates an extreme abundance of rail-trail miles. If the density were measured by population, the location quotient quotient for Milwaukee is much lower. Door County has a location quotient of 0.55, indicating a scarcity of rail-trail miles. This is probably due to the geography of the county; peninsulas don’t tend to be areas with an abundance of through line rail beds to be converted. 6. Golfing An increasingly popular form of warm-weather outdoor recreation is provided by the state’s golf courses. These typically exist as privately owned or as quasi-public municipal recreation facilities. Milwaukee County is rather famous for its early development of municipal golfing resources; much of which has recently been characterized as experiencing a state of decline due to local fiscal stress.
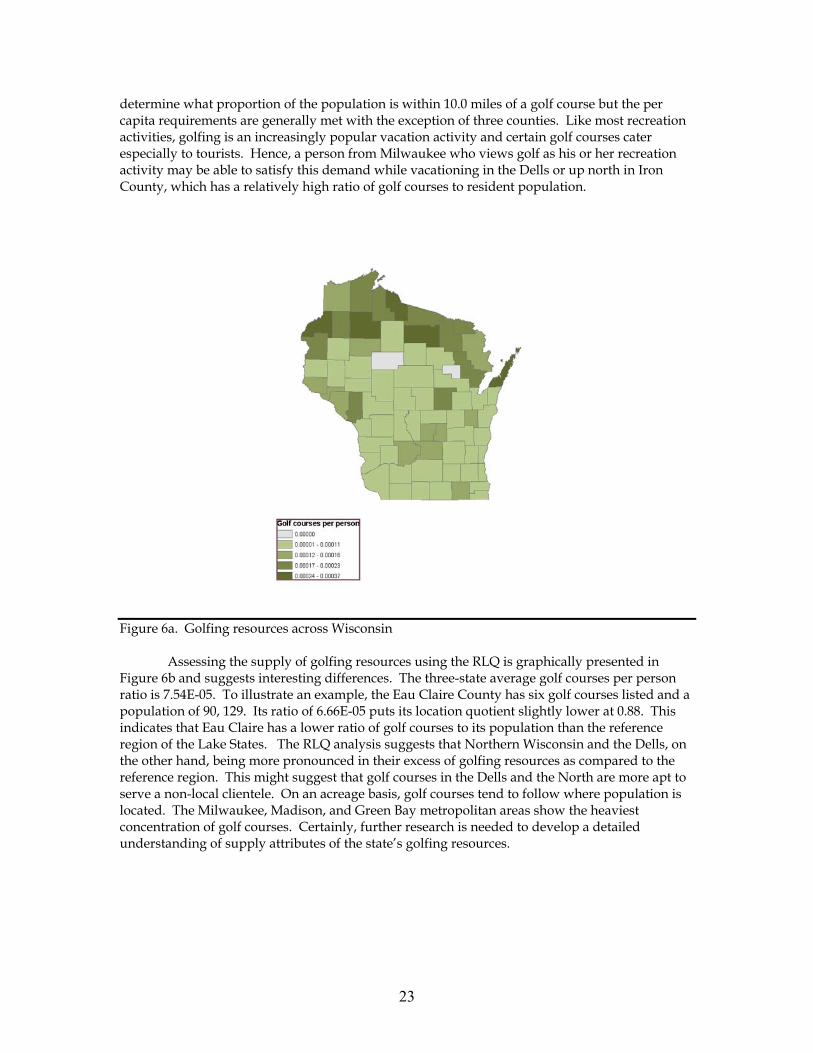
The supply analysis of golfing is done using two NORSIS attribute variables, ABI # of public golf courses and private golf courses per county, divided by county population. This is graphically presented in Figure 6a. Given population distributions, counties with a higher ratio are predominantly in the North where population densities are lower. The South has an almost completely uniform lower golf course to person ratio. Two exceptions are Sauk and Columbia counties, which have a slightly higher ratio than their neighboring counties probably due to the Wisconsin Dells as a tourist destination zone. Dane and Waukesha counties each have over twenty golf courses, but both counties also have populations over 350,000 so they are still in the lowest ratio bracket for golf courses per person.
For most golfing resources, we can speculate that the primary demands exist in rather close proximity to the golf course. Certainly, this may not apply as well to destination resorts that have golfing such as Devil’s Head in Sauk County or the golf courses surrounding the Wisconsin Dells. SEWRPC (1977; Appendix A) lists the per capita requirements of golf courses as 0.040 (facilities per 1000 population) with a service radius of 10.0 miles. Data is lacking to
23
determine what proportion of the population is within 10.0 miles of a golf course but the per capita requirements are generally met with the exception of three counties. Like most recreation activities, golfing is an increasingly popular vacation activity and certain golf courses cater especially to tourists. Hence, a person from Milwaukee who views golf as his or her recreation activity may be able to satisfy this demand while vacationing in the Dells or up north in Iron County, which has a relatively high ratio of golf courses to resident population.
Figure 6a. Golfing resources across Wisconsin
Assessing the supply of golfing resources using the RLQ is graphically presented in
Figure 6b and suggests interesting differences. The three-state average golf courses per person ratio is 7.54E-05. To illustrate an example, the Eau Claire County has six golf courses listed and a population of 90, 129. Its ratio of 6.66E-05 puts its location quotient slightly lower at 0.88. This indicates that Eau Claire has a lower ratio of golf courses to its population than the reference region of the Lake States. The RLQ analysis suggests that Northern Wisconsin and the Dells, on the other hand, being more pronounced in their excess of golfing resources as compared to the reference region. This might suggest that golf courses in the Dells and the North are more apt to serve a non-local clientele. On an acreage basis, golf courses tend to follow where population is located. The Milwaukee, Madison, and Green Bay metropolitan areas show the heaviest concentration of golf courses. Certainly, further research is needed to develop a detailed understanding of supply attributes of the state’s golfing resources.

24
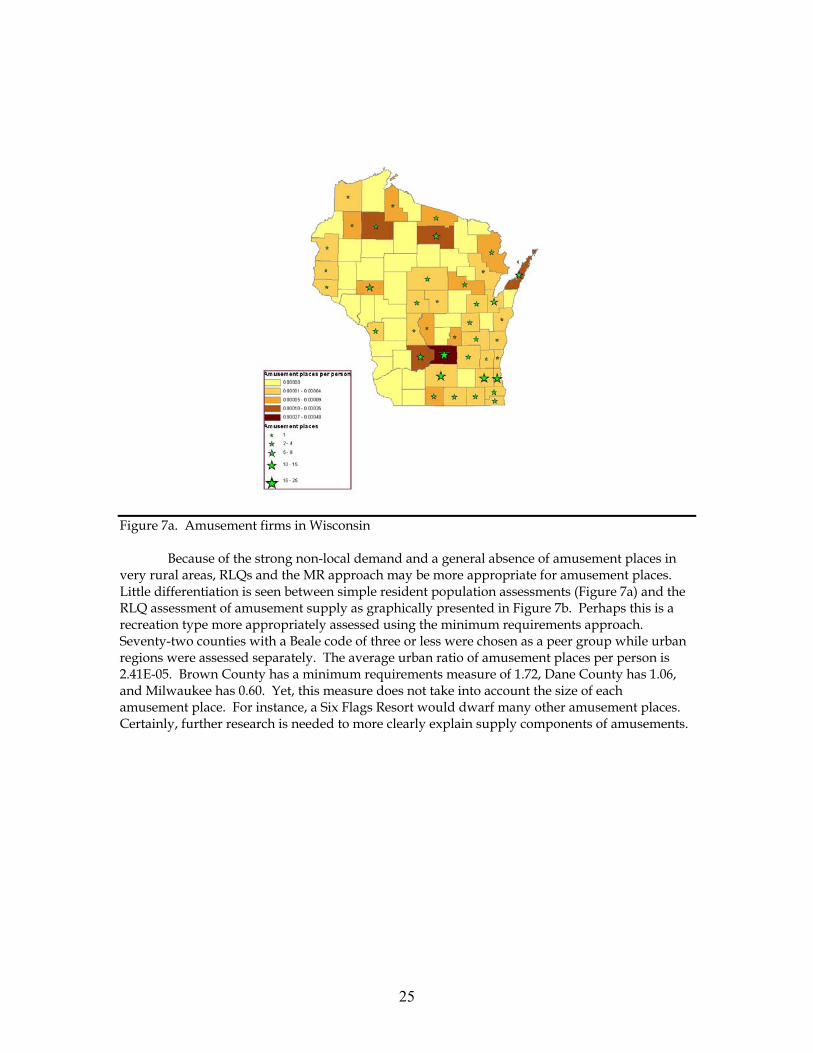
Figure 6b. Golf courses in Wisconsin as indexed using recreation location quotients 7. Amusement places An alternative form of recreation that caters to all age groups is found generally in what might be termed amusements. These range from go-kart tracks and water parks to mini-golf and museums and are typically privately owned businesses. The NORSIS variable ABI # amusement places per person is graphically presented in Figure 7a. The counties with high concentrations of amusements are situated by either tourist destination zones or large cities. For instance, Columbia and Sauk counties have an abundance of amusement places, which reflects the presence of the Wisconsin Dells as a tourist destination zone and the development of an amusement focused tourism industry in these counties. Columbia County alone has 25 amusement places and only a population of 52,421, which makes for an apparently high density of amusement places. Brown, Dane, Milwaukee, and Waukesha counties all have several amusement places.
25
Figure 7a. Amusement firms in Wisconsin
Because of the strong non-local demand and a general absence of amusement places in
very rural areas, RLQs and the MR approach may be more appropriate for amusement places. Little differentiation is seen between simple resident population assessments (Figure 7a) and the RLQ assessment of amusement supply as graphically presented in Figure 7b. Perhaps this is a recreation type more appropriately assessed using the minimum requirements approach. Seventy-two counties with a Beale code of three or less were chosen as a peer group while urban regions were assessed separately. The average urban ratio of amusement places per person is 2.41E-05. Brown County has a minimum requirements measure of 1.72, Dane County has 1.06, and Milwaukee has 0.60. Yet, this measure does not take into account the size of each amusement place. For instance, a Six Flags Resort would dwarf many other amusement places. Certainly, further research is needed to more clearly explain supply components of amusements.

26
Figure 7b. Amusement firms in Wisconsin as indexed by recreation location quotient 8. Winter skiing resources
Wisconsin’s topography is highly varied. Despite a lack of mountains, there are numerous regions which sport downhill ski areas throughout Wisconsin. These provide an important winter recreation resource across the state. The amount of ski acreage and ski acreage per person based on the two relative attribute variables in the NORSIS database are graphically presented in Figure 8a. Iron County in northern Wisconsin has the largest ski hill in terms of ski acreage. The county also has few people and accordingly a high ski hill to population ratio. Only six counties have two ski hills (the maximum amount for any county) and forty-four counties do not have any ski hills.

27
Figure 8a. Downhill ski hills in Wisconsin
The dated report by SEWRPC (1977; Appendix A) lists the per capita requirements
(facility per 1000 residents) as 0.100 with a service radius of 25.0 miles. The majority of counties do not have a ski hill and thus these counties fall below the per capita requirement indicated in this report. The service ratio also seems inappropriate for ski hills. People are generally willing to drive further for downhill ski recreation and often include in overnight stay.
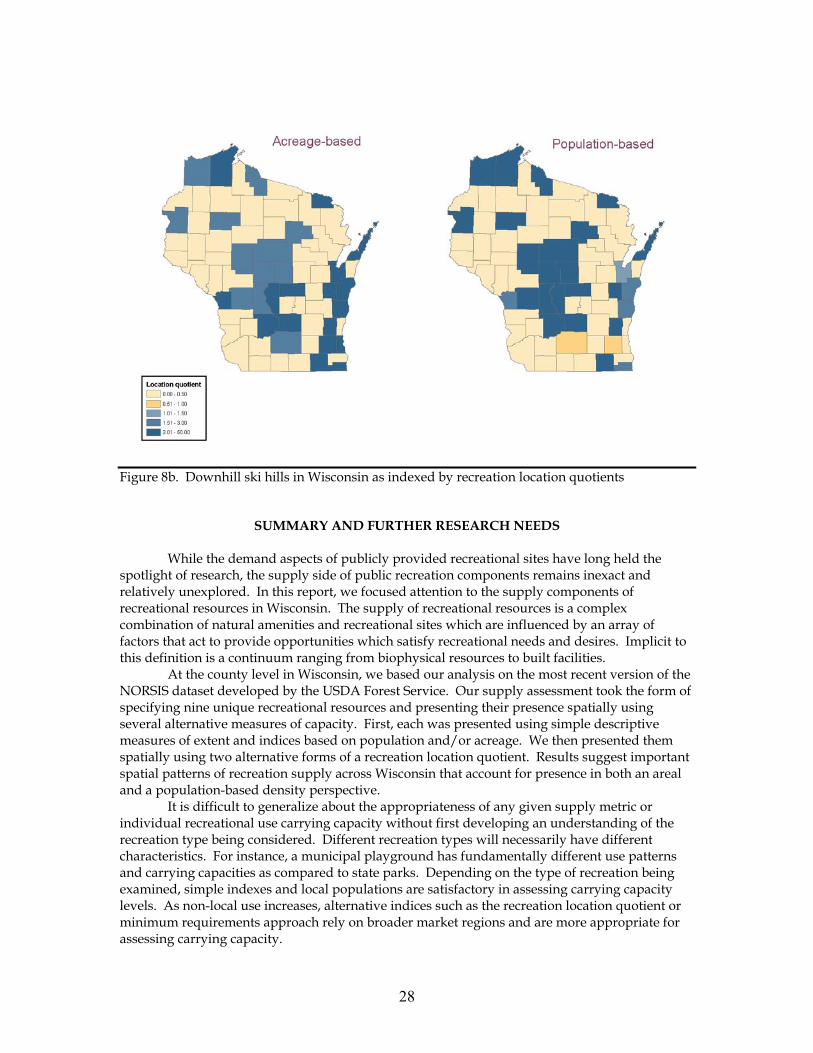
Minnesota and Michigan also lack mountain ranges and have similarly sized ski industries that primarily serve the resident population of the upper Midwest. Because there are so few ski hills the three-state average ski hill per person ratio is very small (4.3E-06). Basically any county that has a ski hill is above the average and would have a location quotient signifying that the county specializes in downhill skiing. To better analyze what counties have a supply advantage over other counties with skill hills, a broader look that includes ski acres and possibly vertical drop or uphill lift capacity should be taken. For instance, one could presume that Bayfield County draws a significant number of non-residents to its downhill ski areas. The county population is only 15,480, and there are two ski hills with an abundance of ski acreage. On the other hand, Dane County is a large metropolitan county with one small ski hill – Blackhawk Ski Club. The county also neighbors other counties with substantially more ski acreage and lower population figures. It is nearly the only county with a ski hill that has a location quotient less than one. It can be assumed that the supply of ski recreation in Dane county does not meet the demand.
28
Figure 8b. Downhill ski hills in Wisconsin as indexed by recreation location quotients
SUMMARY AND FURTHER RESEARCH NEEDS
While the demand aspects of publicly provided recreational sites have long held the spotlight of research, the supply side of public recreation components remains inexact and relatively unexplored. In this report, we focused attention to the supply components of recreational resources in Wisconsin. The supply of recreational resources is a complex combination of natural amenities and recreational sites which are influenced by an array of factors that act to provide opportunities which satisfy recreational needs and desires. Implicit to this definition is a continuum ranging from biophysical resources to built facilities. At the county level in Wisconsin, we based our analysis on the most recent version of the NORSIS dataset developed by the USDA Forest Service. Our supply assessment took the form of specifying nine unique recreational resources and presenting their presence spatially using several alternative measures of capacity. First, each was presented using simple descriptive measures of extent and indices based on population and/or acreage. We then presented them spatially using two alternative forms of a recreation location quotient. Results suggest important spatial patterns of recreation supply across Wisconsin that account for presence in both an areal and a population-based density perspective. It is difficult to generalize about the appropriateness of any given supply metric or individual recreational use carrying capacity without first developing an understanding of the recreation type being considered. Different recreation types will necessarily have different characteristics. For instance, a municipal playground has fundamentally different use patterns and carrying capacities as compared to state parks. Depending on the type of recreation being examined, simple indexes and local populations are satisfactory in assessing carrying capacity levels. As non-local use increases, alternative indices such as the recreation location quotient or minimum requirements approach rely on broader market regions and are more appropriate for assessing carrying capacity.

29
There is certainly ample opportunity for more work in this area. As a next step, a scope of future supply work needs to perform a broader and more comprehensive assessment of current recreational resources at the county-level across Wisconsin. This can include an inventory of recreational resources to benchmark current NORSIS dataset and develop standardized inventory practices for regular updating of database. In this way, we can triangulate and combine existing data elements with evolving recreational uses and new SCORP-specific needs. A related area of further work can address the development of a set of recreational use carrying capacity guidelines that incorporate economic, social, and/or environmental attributes of regions. This can begin with the use of available data and our supply analysis to spatially array Wisconsin resources. Carrying capacities guidelines can be based on an assessment of peak capacity analysis by recreation type. Another related area of further research deals with recreational use compatibility. This work needs to array alternative recreational uses in a matrix that identifies compatibility and conflict in a similar fashion to the early work by Clawson (1974). Objectives of this research need can array alternative recreational uses with one another and seek both a literature base empirical evidence on intra-use interactions. As a beginning, it is possible to use outside research to qualitatively assess the level of intra-recreational use conflicts. In other words, what’s needed are guidelines that identify levels of compatibility among the variety of recreational uses that exist today.
Each of these further research needs can be used to provide a more comprehensive understanding of recreational supply to be matched with current and future demands. If we better understood locational attributes of recreation supply, it would then be possible to analyze critical needs in the location of public recreational opportunities spatially across Wisconsin. It is important to utilize supply and demand aspects to identify where recreational opportunities are lacking for strategic targeting of increasingly scarce public funds.
Wisconsin is a land of many outdoor recreation opportunities. This paper focuses on recreation supply from the perspective of both local and regional use based upon different techniques. Results suggest that measures of recreational carrying capacity vary widely depending on the metric used and that capturing a broader geographical realm is critical to understanding the spatial supply patterns of amenities and recreational sites. This type of work is logically a central feature of progressive and comprehensive outdoor recreation planning.
References Austin, M. 1974. The evaluation of urban public facility location: An alternative to cost-benefit
analysis. Geographical Analysis 6: 135-146. Chubb, M and H. Chubb. 1981. One Third of Our Time? An Introduction to Recreation Behaviour and
Resources. New York, NY: Wiley. Clawson, Marion. 1974. Conflicts, strategies, and possibilities for consensus in forest land use
and management. In: Forest Policy for the Future, papers and discussions from a forum on forest policy for the future, May 8-9, 174. Washington, D.C.: Resources for the Future. pp. 101-191.
Coppock, J.T. and B. Duffield. 1975. Outdoor Recreation in the Countryside: A Spatial Analysis.
London, England: Macmillan.

30
Dissart, Jean Christophe. 2003. The Role of Outdoor Recreation in Remote Rural Economic Development Planning: An Exploratory Approach. Unpublished Ph.D. Dissertation, Department of Urban and Regional Planning, University of Wisconsin – Madison.
Florida, State of. 2000. Outdoor Recreation in Florida: Florida's Statewide Comprehensive Outdoor
Recreation Plan. 2002. Department of Environmental Protection, Division of Recreation and Parks. Secretary David B. Struhs. Tallahassee, Florida.
Gunn, Clare A. 1994. Tourism Planning: Basics, Concepts, Cases. Third Edition. Washington D.C.:
Taylor & Francis. Hall, C. Michael and Stephen J. Page. 1999. The Geography of Tourism and Recreation : Environment,
Place and Space. Second Edition. London, England: Routledge. Hass, Glenn E. 1999. Comparative Analysis of Outdoor Recreation Capacity Programs. 1999 Congress
on Recreation and Resource Capacity. Snowmass Colorado Holland, Stephen. 2003. Population ratios for outdoor recreation facility planning: Searching for
an empirical basis. Presented at: National Association of Recreation Resources Planners Conference. Milwaukee, Wisconsin. May 6, 2003.
Howe, J., E. McMahon, and L. Propst. 1997. Balancing Nature and Commerce in Gateway
Communities. Washington, D.C.: Island Press. Ioannides, D and K.G. Debbage (eds.). 1998. The Economic Geography of the Tourist Industry: A
Supply-side Analysis. New York, NY: Routledge. Kreutzwiser, R. 1989. Supply. In: Wall, G. (ed.) Outdoor Recreation in Canada. Toronto, Canada:
Wiley. Leatherman, J.C. and D.W. Marcouiller. 1996. Estimating tourism's share of local income from
secondary data sources. Review of Regional Studies 26, 3: 317-339. Leiper, Neil. 1990. Partial industrialization of tourist systems. Annals of Tourism Research 17(4):
600-605. Marcouiller, D.W., E.F. Olson, and J. Prey. 2002. State Parks and their Gateway Communities:
Development and Recreation Planning Issues in Wisconsin. Monograph G3773, Board of Regents of the University of Wisconsin System, Madison, WI. 62 pages.
Marcouiller, D.W. and G.P. Green. 2000. Outdoor recreation and community development:
Perspectives from the social sciences. Chapter 2 in: Machlis, G.E., D. Field, and W.H. Gardiner. (eds.) National Parks and Rural Development. Island Press, Washington, D.C. Pages 33-49.
Marcouiller, David W. 1998. Environmental resources as latent primary factors of production in
tourism: the case of forest-based commercial recreation. Tourism Economics 4 (2):131-145. Marcouiller, David W. 1997. Toward integrative tourism planning in rural America. Journal of
Planning Literature 11, 337-357.

31
Marcouiller, D.W. and P.V. Ellefson. 1987. Forest Land Use and Management Conflicts: A Review and Evaluation of Approaches for Management. Technical Staff Paper No. 73, Minnesota Agricultural Experiment Station, St. Paul, MN. 86 pages.
Oregon, State of. 2003. Oregon's Statewide Comprehensive Outdoor Recreation Plan 2003 -2007.
Oregon Parks and Recreation Department, Corvalis, OR. Oregon, State of. 2001. Oregon Statewide Outdoor Recreation Resource/Facility Inventory Bulletin.
Oregon Parks and Recreation Department, Corvalis, OR. Power, Thomas Michael. 1996. Lost Landscapes and Failed Economies. Washington, D.C.: Island
Press. Roth, F. 1989. On the Forestry Conditions of Northern Wisconsin. Bulletin No. 1. Economic Series
No.1., Wisconsin State Geological and Natural History Survey, Madison, WI. SEWRPC. 1977. Regional Park and Recreation Open Space Plan. Southeastern Wisconsin Regional
Planning Commission Shaffer, William A. 1999. Regional impact models. West Virginia University: Regional Research
Institute. Smith, Stephen L.J. 1998. Tourism as an industy: Debates and concepts. In: Ioannides, D and
K.G. Debbage (eds.) The Economic Geography of the Tourist Industry: A Supply-side Analysis. New York, NY: Routledge.
Smith, Stephen L.J. 1994. Tourism Analysis. New York, NY: Praeger Publishing. Stier, J.C., K.K. Kim, and D. W. Marcouiller. 1999. Growing stock, forest productivity, and land
ownership. Canadian Journal of Forest Research 29, 6: 1736-1742. vanKooten, Cornelius. 1993. Land Resource Economics and Sustainable Development: Economic
Policies for the Common Good. Vancouver, BC: University of British Columbia Press. Wisconsin, State of. 2000. Wisconsin's Statewide Comprehensive Outdoor Recreation Plan 2000 –
2005. Madison, WI: Wisconsin Department of Natural Resources.