
Standard Tools’ KitStandard Tools’ Kit Version 1 · Supply chain Progress towards Aeronautical...
43
Supply chain Progress towards Aeronautical Community Excellence Standard Tools’ Kit Standard Tools’ Kit Standard Tools’ Kit Standard Tools’ Kit Version 1 Version 1 Version 1 Version 1
Transcript of Standard Tools’ KitStandard Tools’ Kit Version 1 · Supply chain Progress towards Aeronautical...
Supply chain Progress towards Aeronautical Community Excellence
Standard Tools’ KitStandard Tools’ KitStandard Tools’ KitStandard Tools’ Kit Version 1Version 1Version 1Version 1

Supply chain Progress towards Aeronautical Community Excellence
SPACE Standard Tool's Kit V1_280509 1
1. Table of Contents
1. Table of Contents.................................................................................. 1
2. Preface .................................................................................................. 3
3. Tools’ Summary .................................................................................... 5
4. List of Abbreviations ............................................................................. 7
5. FMEA (Failure Modes and Effects Analysis) ......................................... 8
6. 5 Why’s ............................................................................................... 10
7. 8 D ....................................................................................................... 11
8. Check Sheet ........................................................................................ 12
9. Histogram ........................................................................................... 13
10. Scatter Diagram .............................................................................. 14
11. Control Chart .................................................................................. 15
12. Flow Chart ....................................................................................... 16
13. Cause & Effect Analysis ................................................................... 17
14. Pareto Analysis ............................................................................... 18
15. First Pass Yield ................................................................................ 19
16. Key Characteristics .......................................................................... 20
17. Overall Equipment Effectiveness .................................................... 23
18. Skill matrix ...................................................................................... 24
19. Value Stream Mapping ................................................................... 25
20. Line Balancing ................................................................................. 27
21. Visual Management ........................................................................ 28
22. Takt time ......................................................................................... 29

Supply chain Progress towards Aeronautical Community Excellence
SPACE Standard Tool's Kit V1_280509 2
23. Kanban ............................................................................................ 30
24. Process Mapping............................................................................. 31
25. Total Productive Maintenance ....................................................... 32
26. Single Minute Exchange of Die ....................................................... 34
27. Poka Yoke........................................................................................ 35
28. Line of Balance ................................................................................ 36
29. Manufacturing Resource Planning (MRPII) .................................... 38
30. Input – Output Control ................................................................... 40
APPENDIX: The Six Big Losses ..................................................................... 41
REFERENCES ................................................................................................ 42

Supply chain Progress towards Aeronautical Community Excellence
SPACE Standard Tool's Kit V1_280509 3
2. Preface
This document has been created by SPACE. It describes the best
practice tools used in the most performing industries.
They have been selected by SPACE in order to provide a guide for
SPACE experts, Executive Members, supplier development experts,
and suppliers’ continuous improvement project managers.
They can be used to support every improvement project in the area
of supply chain management. They cover the three main domains of
supply chain management improvement projects:
- Planning organization and systems
- Lean manufacturing
- Quality tools
As they are defined as a standard in the Supply Chain Management
Handbook, created by IAQG (International Aerospace Quality
Group), they also cover the main processes of a company,:
1. Sales, master scheduling and sequencing
2. Contract requirement flow down
3. Design and Development
4. Supplier sourcing selection & approval (Purchasing process)
5. Planning of product realization
6. Order management & logistics (internal & external
7. Manufacturing & inspection (production and service
provision
8. Supplier operational management and product validation
(purchasing process)

Supply chain Progress towards Aeronautical Community Excellence
SPACE Standard Tool's Kit V1_280509 4
9. Control of non-conformities, corrective & preventive actions
(on-time, on-quality)
10. Customer support (control of service operations)
11. Business management and customer satisfaction monitoring
The goals of these improvement projects are to:
- Improve delivery performance
- Reduce waste
- Reduce lead times
- Increase reactivity
- Improve productivity
- Improve quality
- Reduce cost
- …
These tools are not exclusive.
The main intent of this booklet is to spread out the tools’ usage, so
don’t hesitate to use them, to copy them, to distribute them within
your company, to your suppliers, etc…
The tools are presented in no order. You will find then a Tools’
Summary indicated in which situation each of these tools can be
applied.

Supply chain Progress towards Aeronautical Community Excellence
SPACE Standard Tool's Kit V1_280509 5
3. Tools’ Summary
Tools categories
Tools
Planning
organization
and systems
Lean
manufacturing Quality
FMEA
5 WHY’S
8D
Check sheet
Histogram
Scatter diagram
Control chart
Flow chart
Cause & effect
analysis
Pareto analysis
First pass yield
Key characteristics
Overall Equipment
Efficiency
Skill matrix
Value Stream
Mapping
Line balancing
Visual management
Takt time
Kanban
Process Mapping
Total Productive

Supply chain Progress towards Aeronautical Community Excellence
SPACE Standard Tool's Kit V1_280509 6
Maintenance
Single Minute
Exchange of Die
Poka Yoke
Line of balance
Manufacturing
Resource Planning
(MRPII)
Input – Output
Control
Supply chain Progress towards Aeronautical Community Excellence
SPACE Standard Tool's Kit V1_280509 7
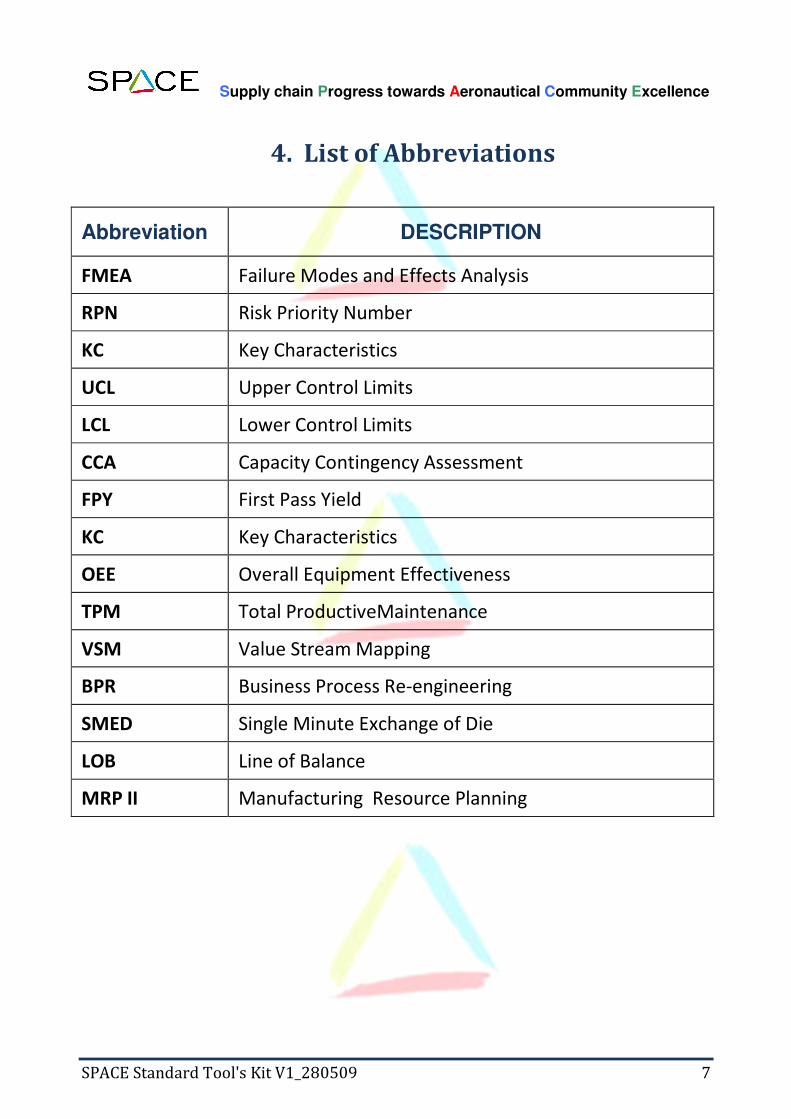
4. List of Abbreviations
Abbreviation DESCRIPTION
FMEA Failure Modes and Effects Analysis
RPN Risk Priority Number
KC Key Characteristics
UCL Upper Control Limits
LCL Lower Control Limits
CCA Capacity Contingency Assessment
FPY First Pass Yield
KC Key Characteristics
OEE Overall Equipment Effectiveness
TPM Total ProductiveMaintenance
VSM Value Stream Mapping
BPR Business Process Re-engineering
SMED Single Minute Exchange of Die
LOB Line of Balance
MRP II Manufacturing Resource Planning

Supply chain Progress towards Aeronautical Community Excellence
SPACE Standard Tool's Kit V1_280509 8
5. FMEA (Failure Modes and Effects Analysis) What is it?
FMEA is a risk assessment technique for systematically identifying
potential failures in a system, product or a process before enter into
service. There are four types of FMEA:
• FMEA Concept : To verify the feasibility of a product concept
based by clients demand
• FMEA Product : To design the most robust product fitting
with the customer expectation
• FMAE Process : To identify the potential risks generating a non-conformity in a manufacturing process
• FMAE Logistics : To identify the potential risks of delivery failure in the logistics system
How to proceed?
1. Describe concept, product, process and logistics
2. Identify the potentials of failures; functions, product
specifications and process steps
3. Quote risks by 3 indices: Occurrence (O), Detection (D) and
Severity (S), ranging from 1 (lowest risk) to 10 (highest risk).
4. Consider the overall Criticity value (Criticity = O × D x S)
ranking from 1 to 1000
5. Define the actions to mitigate higher risks
6. Reconsider the risks to make sure that Criticity remains <
100 and severity < 7.
7. Implement the actions

Supply chain Progress towards Aeronautical Community Excellence
SPACE Standard Tool's Kit V1_280509 9
8. If the risks cannot be effectively removed, define Key
Characteristics(KC)
9. Monitor KC on Process and Product
Example:
Tips
� FMEA is a teamwork that require to gather the experts on
Concept, Product and Process
� FMEA is living documents which need to be updated any
time where a new risk is identified.
1 3 2 4 5 6 7 8 9 10
1) What part is being assessed?
2) In what ways can the part fail perform or deliver requirements?
3) What are the failure’s effects or impacts?
4) How severe is the effect on the customer?
5) What causes process going wrong?
6) How often does the failure mode occur because of that cause?
7) What are the current or planned Controls (Prevention & Detection)?
8) How well can the controls detect the
failure mode or the causes? 9) Criticity value (O × D x S) 10) Risk Priority Code Low-Medium,
Medium High, High-Critical 11) Corrective actions and new rating
11
Supply chain Progress towards Aeronautical Community Excellence
SPACE Standard Tool's Kit V1_280509 10
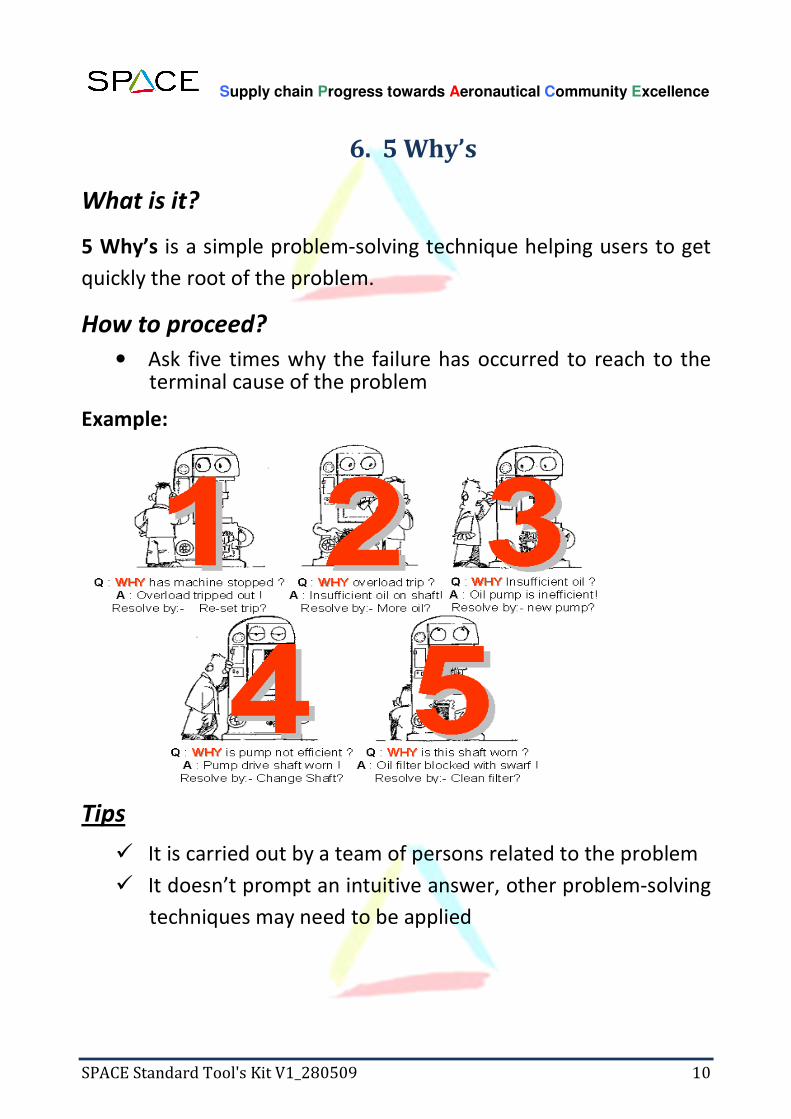
6. 5 Why’s
What is it?
5 Why’s is a simple problem-solving technique helping users to get
quickly the root of the problem.
How to proceed?
• Ask five times why the failure has occurred to reach to the terminal cause of the problem
Example:
Tips
� It is carried out by a team of persons related to the problem
� It doesn’t prompt an intuitive answer, other problem-solving
techniques may need to be applied

Supply chain Progress towards Aeronautical Community Excellence
SPACE Standard Tool's Kit V1_280509 11
7. 8 D What is it?
8D is a problem-solving technique to improve the way escapes and problems are managed, to reduce their impacts, contain them as far upstream as possible and prevent recurrence, by implementing efficient corrective action plans.
Launching a formal Root Cause Analysis and problem solving process shall always be considered when an issue (undesirable conditions, defects and failures) is detected.
How to proceed?
Follow the 8+1 steps of the method
Tips
� Top management buying into the whole corrective action process is a must
� Effective communication is mandatory

Supply chain Progress towards Aeronautical Community Excellence
SPACE Standard Tool's Kit V1_280509 12
8. Check Sheet
What is it?
A check sheet is a structured, prepared form for collecting and
analyzing data. This is a generic tool that can be adapted for a wide
variety of purposes.
How to proceed?
1. Decide what event or problem will be observed. Develop the
operational definitions.
2. Decide when data will be collected and for how long.
3. Design the form. Set it up so that data can be recorded simply
by making check marks or Xs or similar symbols and so that data
do not have to be recopied for analysis.
4. Label all spaces on the form.
5. Test the check sheet for a short trial period to be sure that it
collects the appropriate data and whether it is easy to use.
6. Each time the targeted event or problem occurs, record data on
the check sheet.
Example: The figure below shows a check sheet used to collect data on telephone interruptions. The
tick marks were added as data was collected over several weeks.
Excerpted from Nancy R. Tague’s The Quality Toolbox, 2
nd Edition, ASQ Quality Press, 2004, p 141-142
http://www.asq.org/learn-about-quality/data-collection-analysis-tools/overview/check-sheet.html
Supply chain Progress towards Aeronautical Community Excellence
SPACE Standard Tool's Kit V1_280509 13
9. Histogram
What is it?
A frequency distribution shows how often each different value in a set of
data occurs. A histogram is the most commonly used graph to show
frequency distributions. It looks very much like a bar chart, but there are
important differences between them.
How to proceed?
1. Collect at least 50 consecutive data points from a process.
2. Use the histogram worksheet to set up the histogram. It will help you
determine the number of bars, the range of numbers that go into
each bar and the labels for the bar edges. After calculating W in step
2 of the worksheet, use your judgment to adjust it to a convenient
number. For example, you might decide to round 0.9 to an even 1.0. The value for W must not have more decimal places than the numbers you will be graphing.
3. Draw x- and y-axes on graph paper. Mark and label the y-axis for
counting data values. Mark and label the x-axis with the L values from
the worksheet. The spaces between these numbers will be the bars of
the histogram. Do not allow for spaces between bars.
4. For each data point, mark off one count above the appropriate bar
with an X or by shading that portion of the bar.
Example: 1 125,36 26 119,42
2 126,66 27 120,83
3 130,28 28 136,53
4 133,74 29 120,4
5 126,92 30 136,58
6 120,85 31 121,73
7 119,42 32 132,72
8 128,61 33 109,25
9 123,53 34 125,42
10 130,15 35 117,67
11 126,02 36 124,01
12 116,65 37 118,74
13 125,24 38 128,99
14 126,84 39 131,11
15 125,95 40 112,27
16 114,41 41 118,76
17 138,62 42 119,15
18 127,4 43 122,42
19 127,59 44 122,22
20 123,57 45 134,71
21 133,76 46 126,22
22 124,6 47 130,33
23 113,48 48 120,52
24 128,6 49 126,88
25 121,04 50 117,4
Bin Frequency
109,3 1
114,2 2
119 6
123,9 13
128,8 16
133,7 6
138,6 6
Data Table
Excerpted from Nancy R. Tague’s The Quality Toolbox, 2
nd Edition, ASQ Quality Press, 2004, p 292-299
http://www.asq.org/learn-about-quality/data-collection-analysis-tools/overview/histogram.html
Supply chain Progress towards Aeronautical Community Excellence
SPACE Standard Tool's Kit V1_280509 14
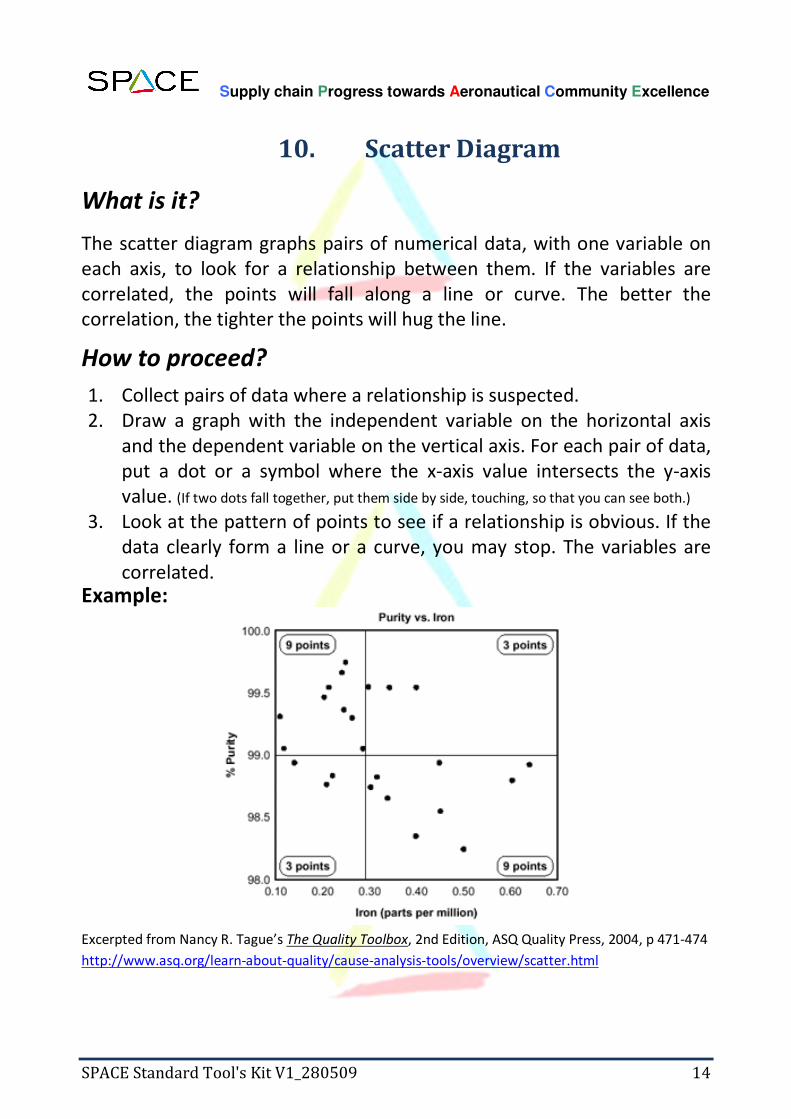
10. Scatter Diagram
What is it?
The scatter diagram graphs pairs of numerical data, with one variable on
each axis, to look for a relationship between them. If the variables are
correlated, the points will fall along a line or curve. The better the
correlation, the tighter the points will hug the line.
How to proceed?
1. Collect pairs of data where a relationship is suspected.
2. Draw a graph with the independent variable on the horizontal axis
and the dependent variable on the vertical axis. For each pair of data,
put a dot or a symbol where the x-axis value intersects the y-axis
value. (If two dots fall together, put them side by side, touching, so that you can see both.)
3. Look at the pattern of points to see if a relationship is obvious. If the
data clearly form a line or a curve, you may stop. The variables are
correlated.
Example:
Excerpted from Nancy R. Tague’s The Quality Toolbox, 2nd Edition, ASQ Quality Press, 2004, p 471-474
http://www.asq.org/learn-about-quality/cause-analysis-tools/overview/scatter.html

Supply chain Progress towards Aeronautical Community Excellence
SPACE Standard Tool's Kit V1_280509 15
11. Control Chart What is it? The control chart is a graph used to study how a process changes over
time. Data are plotted in time order. A control chart always has a central
line for the average, an upper line for the upper control limit and a lower
line for the lower control limit. These lines are determined from historical
data. By comparing current data to these lines, you can draw conclusions
about whether the process variation is consistent (in control) or is
unpredictable (out of control, affected by special causes of variation).
How to proceed?
1. Choose the appropriate control chart for your data.
2. Determine the appropriate time period for collecting and plotting data.
3. Collect data, construct your chart and analyze the data.
4. Look for “out-of-control signals” on the control chart. When one is
identified, mark it on the chart and investigate the cause. Document
how you investigated, what you learned, the cause and how it was
corrected.
5. Continue to plot data as they are generated. As each new data point is
plotted, check for new out-of-control signals.
6. When you start a new control chart, the process may be out of control.
If so, the control limits calculated from the first 20 points are
conditional limits. When you have at least 20 sequential points from a
period when the process is operating in control, recalculate control
limits. Example:
Excerpted from Nancy R. Tague’s The Quality Toolbox, 2
nd Edition, ASQ Quality Press, 2004, p 155-158.
http://www.asq.org/learn-about-quality/data-collection-analysis-tools/overview/control-chart.html

Supply chain Progress towards Aeronautical Community Excellence
SPACE Standard Tool's Kit V1_280509 16
12. Flow Chart What is it? A flowchart is a picture of the separate steps of a process in sequential order.
Elements that may be included are: sequence of actions, materials or services
entering or leaving the process (inputs and outputs), decisions that must be
made, people who become involved, time involved at each step and/or process
measurements.
How to proceed? 1. Define the process to be diagrammed. Write its title at the top of the work
surface.
2. Discuss and decide on the
boundaries of your process:
Where or when does the
process start? Where or when
does it end? Discuss and
decide on the level of detail to
be included in the diagram.
3. Brainstorm the activities that
take place. Write each on a
card or sticky note. Sequence
is not important at this point,
although thinking in sequence
may help people remember all
the steps.
4. Arrange the activities in
proper sequence.
5. When all activities are
included and everyone agrees
that the sequence is correct,
draw arrows to show the flow
of the process.
6. Review the flowchart with
others involved in the process (workers, supervisors, suppliers and customers)
to see if they agree that the process is drawn accurately.
Excerpted from Nancy R. Tague’s The Quality Toolbox, 2
nd Edition, ASQ Quality Press, 2004, p 255-257.
http://www.asq.org/learn-about-quality/process-analysis-tools/overview/flowchart.html
Process Decision Wait Link Input
or output Documen Start or
end point

Supply chain Progress towards Aeronautical Community Excellence
SPACE Standard Tool's Kit V1_280509 17
13. Cause & Effect Analysis
What is it? The cause and effect diagram identifies many possible causes for an effect
or problem. It can be used to structure a brainstorming session. It
immediately sorts ideas into useful categories. Also Called: fishbone or Ishikawa Diagram
How to proceed? 1. Agree on a problem statement (effect). Write it at the center right of
the flipchart or whiteboard. Draw a box around it and draw a
horizontal arrow running to it.
2. Brainstorm the major categories of causes of the problem. If this is
difficult use generic headings: Methods, Machines (equipment), People
(manpower), Materials, Measurement, Environment
3. Write the categories of causes as branches from the main arrow.
4. Brainstorm all the possible causes of the problem. Ask: “Why does this
happen?” As each idea is given, the facilitator writes it as a branch from
the appropriate category. Causes can be written in several places if
they relate to several categories.
5. Again ask “why does this happen?” about each cause. Write sub-causes
branching off the causes. Continue to ask “Why?” and generate deeper
levels of causes. Layers of branches indicate causal relationships.
6. When the group runs out of ideas, focus attention to places on the
chart where ideas are few.
Example:
Excerpted from Nancy R. Tague’s The Quality Toolbox, 2nd
Edition, ASQ Quality Press, 2004, p 247-249.
http://www.asq.org/learn-about-quality/cause-analysis-tools/overview/fishbone.html
Supply chain Progress towards Aeronautical Community Excellence
SPACE Standard Tool's Kit V1_280509 18
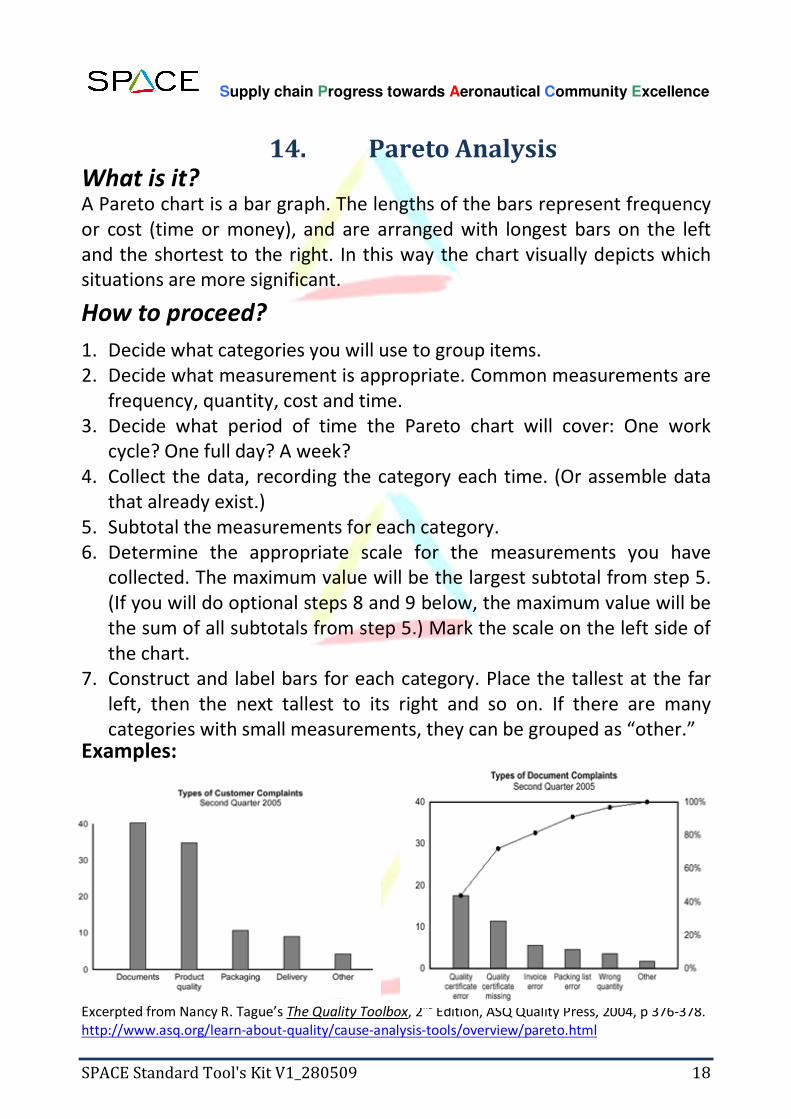
14. Pareto Analysis What is it? A Pareto chart is a bar graph. The lengths of the bars represent frequency
or cost (time or money), and are arranged with longest bars on the left
and the shortest to the right. In this way the chart visually depicts which
situations are more significant.
How to proceed?
1. Decide what categories you will use to group items.
2. Decide what measurement is appropriate. Common measurements are
frequency, quantity, cost and time.
3. Decide what period of time the Pareto chart will cover: One work
cycle? One full day? A week?
4. Collect the data, recording the category each time. (Or assemble data
that already exist.)
5. Subtotal the measurements for each category.
6. Determine the appropriate scale for the measurements you have
collected. The maximum value will be the largest subtotal from step 5.
(If you will do optional steps 8 and 9 below, the maximum value will be
the sum of all subtotals from step 5.) Mark the scale on the left side of
the chart.
7. Construct and label bars for each category. Place the tallest at the far
left, then the next tallest to its right and so on. If there are many
categories with small measurements, they can be grouped as “other.” Examples:
Excerpted from Nancy R. Tague’s The Quality Toolbox, 2
nd Edition, ASQ Quality Press, 2004, p 376-378.
http://www.asq.org/learn-about-quality/cause-analysis-tools/overview/pareto.html

Supply chain Progress towards Aeronautical Community Excellence
SPACE Standard Tool's Kit V1_280509 19
15. First Pass Yield
What is it?
FPY is an effective measurement to record defect. It also contributes to:
• Improve the quality performance and material management by
defining bottleneck
• consolidate a global production process
How to proceed?
Example:
FPY1 * FPY2 * FPY3 * … * FPYn = Total Process Yield
100 units enter 1 and 90 leave. The FPY1 for process 1 is 90/100 = .9
90 units go into 2 and 80 units leave. The FPY2 for process 2 is 80/90 = .89
80 units go into 3 and 75 leave. The FPY3 for 3 is 75/80 = .94
75 units got into n and 70 leave. The FPYn for n is 70/75 = .93
The total process yield is equal to FPY1 * FPY2 * FPY3 * FPYn or .9*.89*.94*.93 = .70
The number of units coming out of a process
The number of units going into that process
= FPY
(in a specific period)
Supply chain Progress towards Aeronautical Community Excellence
SPACE Standard Tool's Kit V1_280509 20
16. Key Characteristics
What is it?
Key Characteristics (KC) is product features, manufacturing processes, and
assembly characteristics that significantly affect a product’s performance,
function, fit, and form [Lee & Thornton, 1996].
KC methods are tools and processes used by design and manufacturing
organizations to identify the critical parameters that cannot withstand a
significant amount of variation -- particularly if the variation causes a
significant loss e.g. scrap, rework, repair, or failure.( Basak Ertan, “Analysis of
Key Characteristic Methods and Enablers Used in Variation Risk Management” ,1996)
The use of KC methods can help to reduce cost in a production if they are
identified correctly.
How to proceed?
Selecting and evaluating key characteristics is done throughout the
product life cycle, from early in the product definition phase through
design, fabrication, assembly, and operation.
• Use a cross-functional team approach. Include customers and
suppliers.
• Investigate customer needs and requirements, including specifications,
problems, used-on information, and so on.
• Collect and analyze historical data: quality problems scrap, rework,
rejections, waste, unit performance, test results, and so on.
• Investigate and document the production processes.
• There is no one method for selecting key characteristics; however, risk
analysis has often proven to be an effective tool (see Example1 below)
• Draw a flowchart, develop a measurement plan and identify tooling
needs
• Record the information in Control Plan (see Example2 below)
• Continue the process to reduce variation, solve problems, and pursue
continuous improvement. High-level key characteristics should be
flowed down to lower level key characteristics and key process
parameters

Supply chain Progress towards Aeronautical Community Excellence
SPACE Standard Tool's Kit V1_280509 21
Adapted from ”AQS Tools”, 1998
From page 4 of http://www.boeing.com/companyoffices/doingbiz/supplier/d1-9000-1.pdf
Example 1: Tools used in identifying key characteristics
From page 39 of http://www.boeing.com/companyoffices/doingbiz/supplier/d1-9000-1.pdf

Supply chain Progress towards Aeronautical Community Excellence
SPACE Standard Tool's Kit V1_280509 22
Example 2: Control Plan
From page 60 of http://www.boeing.com/companyoffices/doingbiz/supplier/d1-9000-1.pdf

Supply chain Progress towards Aeronautical Community Excellence
SPACE Standard Tool's Kit V1_280509 23
17. Overall Equipment Effectiveness
What is it?
OEE is a “best practices” metric for monitoring how well a piece of
equipment is utilized and improving the efficiency of your manufacturing
processes (i.e. machines, cells, assembly lines, etc.).
How to proceed?
OEE takes the most common sources of manufacturing productivity losses and places them into three categories
Availability is the ratio of Operating Time to Planned Production Time, and accounts for Downtime Loss.
Availability = Operating Time / Planned Production Time
Performance is the ratio of Net Operating Time to Operating Time, and accounts for Speed Loss.
Performance = (Ideal Cycle Time x Total Pieces) / Operating Time
Quality is the ratio of Fully Productive Time (time for Good Pieces) to Net Operating Time (time for Total Pieces).
Quality = Good Pieces / Total Pieces
OEE is the ratio of Fully Productive Time to Planned Production Time.
OEE = Availability x Performance x Quality, or OEE = Good Pieces x Ideal Cycle Time / Planned Production Time
Tips
� Understanding of TPM’s principles(Total ProductiveMaintenance)
� Understanding of the Six Big Losses
Supply chain Progress towards Aeronautical Community Excellence
SPACE Standard Tool's Kit V1_280509 24
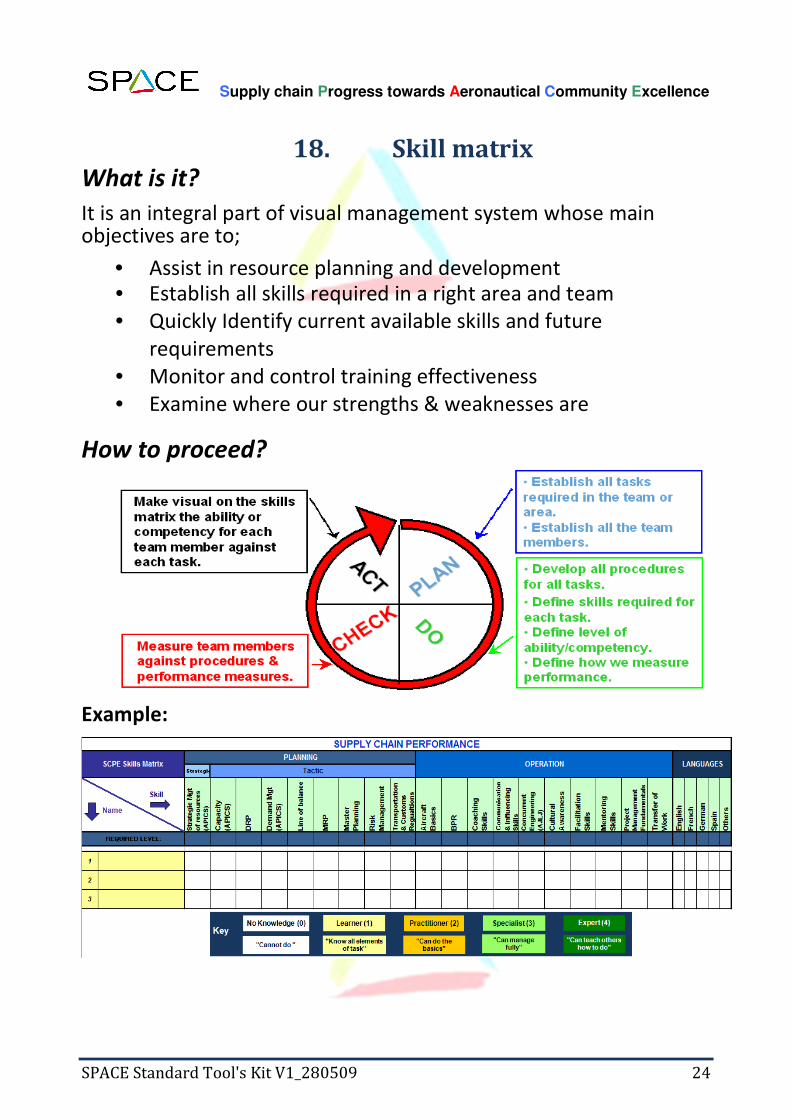
18. Skill matrix What is it?
It is an integral part of visual management system whose main objectives are to;
• Assist in resource planning and development
• Establish all skills required in a right area and team
• Quickly Identify current available skills and future
requirements
• Monitor and control training effectiveness
• Examine where our strengths & weaknesses are
How to proceed?
Example:

Supply chain Progress towards Aeronautical Community Excellence
SPACE Standard Tool's Kit V1_280509 25
19. Value Stream Mapping
What is it?
• A diagram of all the actions (both value added and non-value added) required bringing a product through from raw material to the customer.
• The current state map revealing all forms of waste and their sources
• The future state map is a vision of a lean business utilising flow.
How to proceed?
1. Identify the customer requirement.
2. Draw a current state value stream map, which is the current steps, delays, and information flows required to deliver the target product or service. This may be a production flow (raw materials to consumer) or a design flow (concept to launch).
3. Assess the current state value stream map in terms of creating flow by eliminating waste.
4. Draw a future state value stream map. The following questions must be kept in mind;
- What are the Customer requirements (Takt time)? - How to apply Continuous Flow Processing? - Which process is the pacemaker? - How to control the upstream processes? - What size shop stock is required? - Is it sequential or fill-up pull? - Where to level production? - At what frequency will Kanban be released? - What further improvements can be made?
5. Implement the future state. Draw up a tactical Implementation Plan to move from the current state to the future state.
- Show the high level objective (compelling need). - Have a set of objectives/actions for each loop. - Define Milestones for each objective. - Show owners for delivery of each objective.
Supply chain Progress towards Aeronautical Community Excellence
SPACE Standard Tool's Kit V1_280509 26
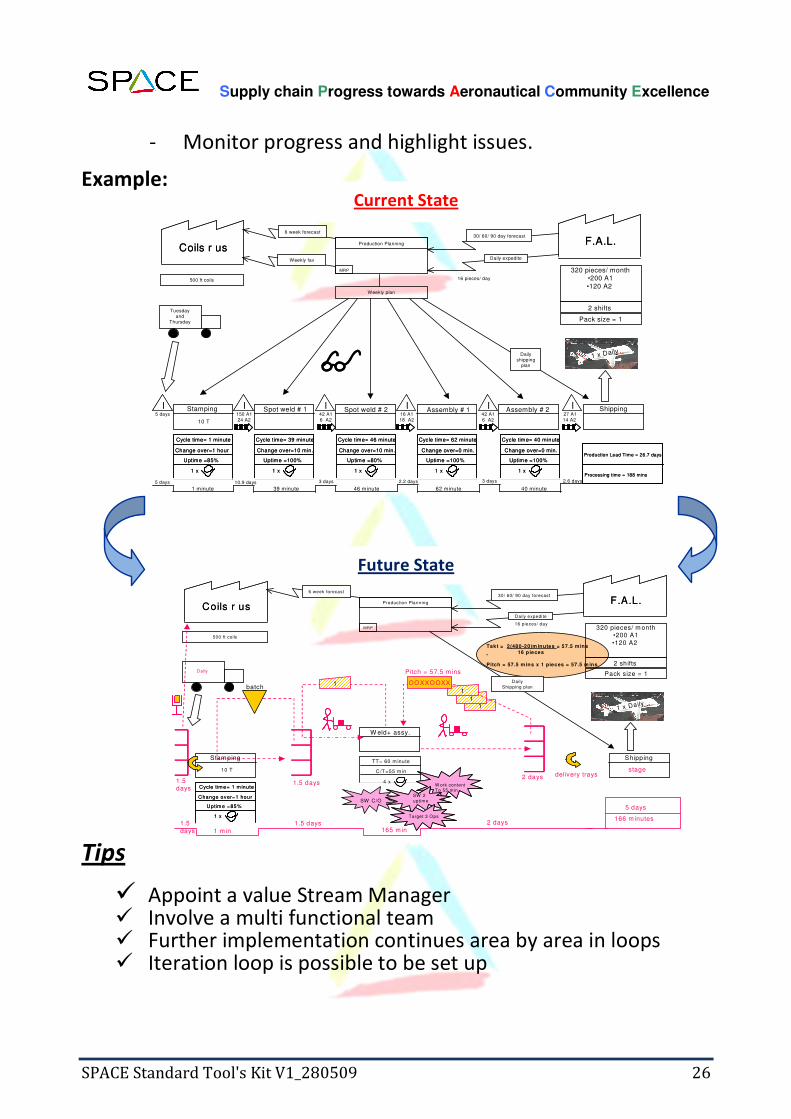
- Monitor progress and highlight issues.
Example:
Tips
� Appoint a value Stream Manager � Involve a multi functional team � Further implementation continues area by area in loops � Iteration loop is possible to be set up
Future State
Current State
F.A.L.F.A.L.
Pack size = 1
320 pieces/ month•200 A1
•120 A2
2 shifts
1 x Daily1 x Daily
Shipping Assembly # 2Assembly # 1Spot weld # 2Spot weld # 1Stamping
Cycle time= 1 minute
Change over=1 hour
Uptime =85%
1 x
Cycle time= 1 minute
Change over=1 hour
Uptime =85%
1 x
Cycle time= 39 minute
Change over=10 min.
Uptime =100%
1 x
Cycle time= 39 minute
Change over=10 min.
Uptime =100%
1 x
10 T
Cycle time= 46 minute
Change over=10 min.
Uptime =80%
1 x
Cycle time= 46 minute
Change over=10 min.
Uptime =80%
1 x
Cycle time= 62 minute
Change over=0 min.
Uptime =100%
1 x
Cycle time= 62 minute
Change over=0 min.
Uptime =100%
1 x
Cycle time= 40 minute
Change over=0 min.
Uptime =100%
1 x
Cycle time= 40 minute
Change over=0 min.
Uptime =100%
1 x
IIII II II5 days 150 A1
24 A2
II II42 A1
6 A2
16 A1
18 A2
42 A1
6 A2
27 A1
14 A2
Coils r usCoils r us
500 ft coils
Tuesdayand
Thursday
Production Planning
30/ 60/ 90 day forecast
Daily expedite
6 week forecast
Weekly fax
MRP
Weekly plan
Dailyshipping
plan
16 pieces/ day
10.9 days 2.2 days 3 days 2.6 days5 days
1 minute 39 minute 46 minute 62 minute 40 minute
3 days
Production Lead Time = 26.7 days
Processing time = 188 mins
Production Lead Time = 26.7 days
Processing time = 188 mins
11
F.A.L.F.A.L.
Pack size = 1
320 pieces/ m onth•200 A1
•120 A2
2 shifts
1 x Daily1 x Daily
Shipping
W eld+ assy.
Stam ping
Cycle tim e= 1 m inute
Change over=1 hour
Uptim e =85%
1 x
Cycle tim e= 1 m inute
Change over=1 hour
Uptim e =85%
1 x
10 T
TT= 60 m inute
C/T=55 m in
4 x
500 ft coils
Daily
Production Planning
30/ 60/ 90 day forecast
Daily expedite
6 week forecast
MRP
Daily
Shipping plan
16 pieces/ day
W ork contentTo 55 min.W ork contentTo 55 min.
SW C/OSW 2
uptim e
SW 2
uptim e
2 days
1batch
1.5 days
1
stage
OOXXOOXX
1.5days
1.5
days 1 m in
1.5 days165 m in
2 days
5 days
166 m inutes
delivery trays
Takt = 2(480-20)m inutes = 57.5 mins
16 pieces
Pitch = 57.5 m ins x 1 pieces = 57.5 m ins
Pitch = 57.5 m ins
Target 3 OpsTarget 3 Ops
Coils r usCoils r us
Supply chain Progress towards Aeronautical Community Excellence
SPACE Standard Tool's Kit V1_280509 27
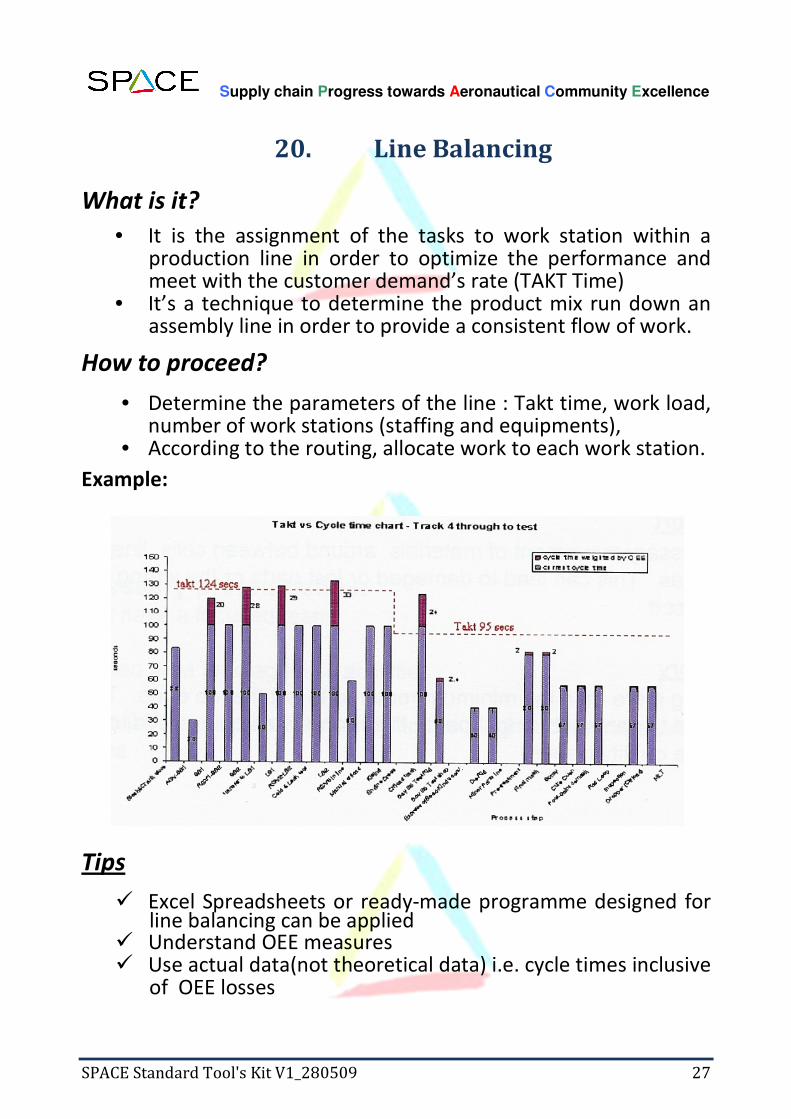
20. Line Balancing
What is it?
• It is the assignment of the tasks to work station within a production line in order to optimize the performance and meet with the customer demand’s rate (TAKT Time)
• It’s a technique to determine the product mix run down an assembly line in order to provide a consistent flow of work.
How to proceed?
• Determine the parameters of the line : Takt time, work load, number of work stations (staffing and equipments),
• According to the routing, allocate work to each work station.
Example:
Tips
� Excel Spreadsheets or ready-made programme designed for line balancing can be applied
� Understand OEE measures � Use actual data(not theoretical data) i.e. cycle times inclusive
of OEE losses

Supply chain Progress towards Aeronautical Community Excellence
SPACE Standard Tool's Kit V1_280509 28
21. Visual Management
What is it?
• It is a communicating and controlling mechanism that reflects the state of process at any given time.
• It creates an information-rich environment, by the use of visually stimulating signals, symbols and objects. The use of signs, lights, notice boards, brightly and contrasting painted equipments and graphic displays that catch people’s attention and communicate important information is visual management in the working environment.
• make the problems, abnormalities, or deviation from standards visible to everyone and thus corrective action can be taken immediately
How to proceed?
1. Identify the key information and item needed or the problem
which should be prevented
2. Design a simple and usual display environment that that
makes the problems or deviations from standards visible to
everyone.
3. Test the method and find the feedback from those involved.
4. Train every involved user
5. Update and review regularly
Tips
� Develop with the owners of process � Clearly define responsibilities � Ensure that the tool is seen, used and developed by those
managing the process or activity
Supply chain Progress towards Aeronautical Community Excellence
SPACE Standard Tool's Kit V1_280509 29
TAKT Time = Available Working Time/ Shift (Seconds)
Customer Demand Rate/ Shift (Units)
22. Takt time
What is it?
• The rate of production required meeting the customer’s demand rate.
• It’s used to synchronize the pace of production to match with the pace of sales (see line balancing), to provide the target rate for the production, targeted cycle time, staffing level, targets of improvement actions, line balancing and bottleneck identification.
How to proceed?
• Calculation can be done over periods of day, a week etc. as
long as both sides are measured over the same period
• The units used are usually time per unit (seconds, minutes or
shifts). The number of units per hour, shift, or day is also a
way of measure.
Tips
� Ensure available working time is correct, i.e. time actually available to work.
� Eliminate causes of unplanned downtime.
� Provide a fast response to problems.

Supply chain Progress towards Aeronautical Community Excellence
SPACE Standard Tool's Kit V1_280509 30
23. Kanban
What is it?
• It origins from Japanese Concept where kan, 看 カン, means "visual," and ban, 板 バン, means "card" or "board.
• It is a signalling system to trigger the action.
• It is an efficient tool that is a part of a pull system to release the supply or production according to the actual demand and highlight problem areas to achieve Just in Time (JIT).
How to proceed?
1. To signal a need for an item, cards, plastic markers, but also empty bins or trolleys, can be used to activate the movement, production or supply of an item.
2. Each Kanban’s bin can be placed basically in production line, the factory store and the suppliers’ store.
3. The bins usually have a removable card (called Kanban card) that contains the product details and other relevant information such as preceding and subsequent process etc.
4. The exact quantity of materials required will be called by Kanban cards from production line to the factory store and then to the right production area.
Tips
� It is recommended to overestimate how many Kanban cards are required for each product, end then slowly reduce that number until reaching the optimized quantity.
� Eliminate common problems such as manual entry errors and lost cards, E-Kanban systems can be integrated into enterprise resource planning (ERP) systems
Supply chain Progress towards Aeronautical Community Excellence
SPACE Standard Tool's Kit V1_280509 31
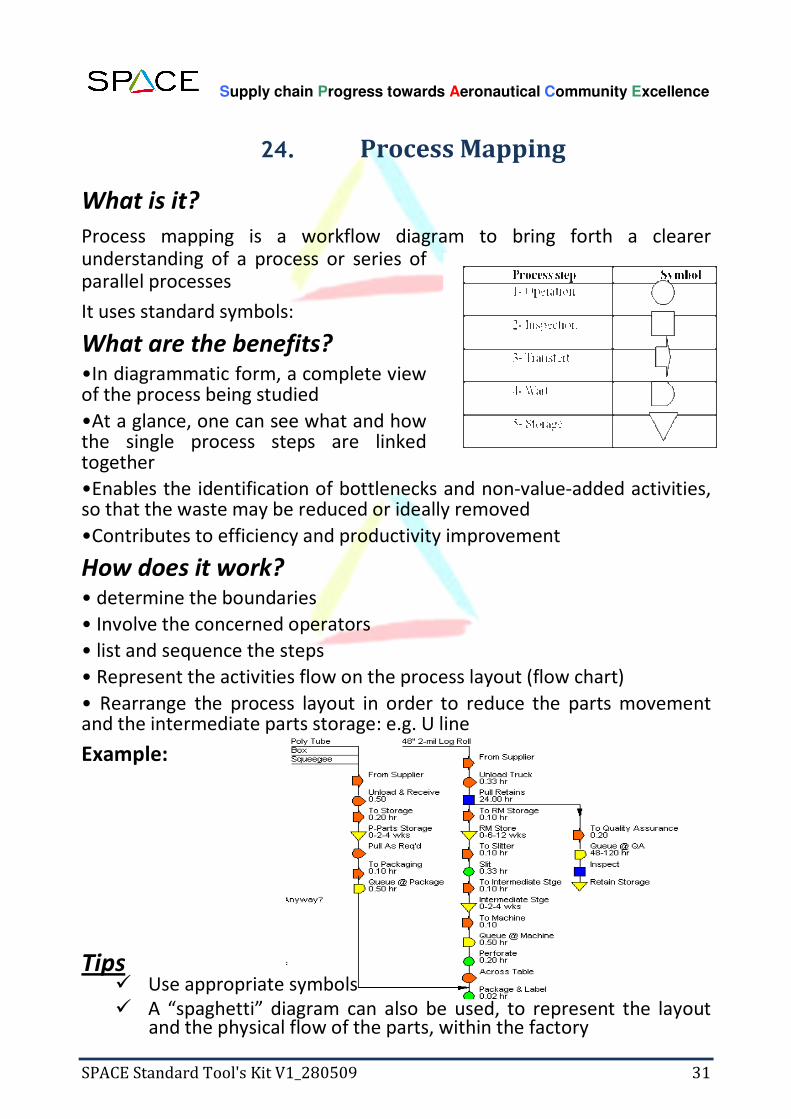
24. Process Mapping
What is it?
Process mapping is a workflow diagram to bring forth a clearer understanding of a process or series of parallel processes
It uses standard symbols:
What are the benefits? •In diagrammatic form, a complete view of the process being studied
•At a glance, one can see what and how the single process steps are linked together
•Enables the identification of bottlenecks and non-value-added activities, so that the waste may be reduced or ideally removed
•Contributes to efficiency and productivity improvement
How does it work? • determine the boundaries
• Involve the concerned operators
• list and sequence the steps
• Represent the activities flow on the process layout (flow chart)
• Rearrange the process layout in order to reduce the parts movement and the intermediate parts storage: e.g. U line
Example:
Tips
� Use appropriate symbols
� A “spaghetti” diagram can also be used, to represent the layout and the physical flow of the parts, within the factory

Supply chain Progress towards Aeronautical Community Excellence
SPACE Standard Tool's Kit V1_280509 32
25. Total Productive Maintenance
What is it?
• “Improvement of the productivity (measured by Overall equipment effectiveness)with all employees participating“
• “Preventive maintenance plus continuing efforts to adapt, modify, and refine equipment to increase flexibility, reduce material handling, and promote continuous flow”, according to the 11
th edition of the
APICS dictionary.
What is it aimed to?
• Increase work station productivity through total operators involvement
• Maximize equipment effectiveness
• Proactive, not reactive equipment maintenance
• Maintain and improve Equipment Reliability which contributes to safety, quality and productivity.
• Maintain equipment for Maximum Life Utilization.
• Develop Operator Skill building so as to maximize Production Expertise.
What are benefits?
TPM helps to avoid waste by reducing 6 main sources of loss
• Start-up problems (Warm-up, trials) • Changeover, and adjustment
activities • Machine breakdowns • Idling and short stops • Increased machine cycle time
(compared to designed machine cycle time)
• Flaws in the process
Supply chain Progress towards Aeronautical Community Excellence
SPACE Standard Tool's Kit V1_280509 33
How to proceed?
Implement the 5 pillars of the TPM, in order to eliminate the sources of loss:
1. Implement improvement activities, to improve equipment efficiency – OEE provides e measure of the success
2. Establish a system of autonomous maintenance, performed by
equipment operators : the team has a ‘fix it now’ attitude when
something goes wrong
3. Develop a planned maintenance system: schedules and standards for cleaning and lubrication are created and implemented.
4. Implement education and training, to increase operators skills (either on maintenance operations and technical knowledge)
5. Create a system for maintenance preventive design and early equipment management – feedback from machine users is given to machine manufacturers and designers.
Implement the TPM in 3 stages:
Stage One: Preparation
• Announce the top management decision to introduce and fully
support TPM, establish goals, formulate the plan
• Create teams, launch education program
Stage Two: Implementation
• Hold the kick off meeting,
• Improve the effectiveness of each piece of equipment
• Develop an autonomous maintenance program
• Develop a scheduled maintenance program
• Conduct training to improve the skills
• Develop an early equipment management program
Stage Three: Stabilisation
• Perfect the TPM implementation and raise the levels of the TPM
program.
• Finally, use the Continuous Improvement philosophy to continue
to develop.

SPACE Standard Tool's Kit V1_280509 34
26. Single Minute Exchange of Die
What is it?
“SMED is the concept of setup times of less than 10 minutes, developed by Shigeo Shingo in 1970 at Toyota”, according to the 11
th edition of the
APICS dictionary.
How to proceed?
Four basic steps to reducing changeover using the SMED system;
1. Observe the current methodology and identify all the operations.
2. Separate the INTERNAL and EXTERNAL activities. Internal activities are those that can only be performed when the process is stopped, while External activities can be done while the previous or next batch is being produced.
3. Convert (where possible) Internal activities into External ones (pre-
heating of tools is a good example of this).
4. Streamline the remaining internal activities, by simplifying them.
Focus on fixings - Shigeo Shingo rightly observed that it's only the last
turn of a bolt that tightens it - the rest is just movement. Streamline
also the external activities.
Tips � Use video to record and analyze the process
� Ensure that external setup actions are performed while the
machine is still running,
� Standardize function, not shape
� Use functional clamps or eliminate fasteners altogether
� Use intermediate jigs
� Eliminate adjustments

SPACE Standard Tool's Kit V1_280509 35
27. Poka Yoke What is it?
Poka-yoke (ポカヨケ) or “fail safe” was first introduced by Shigeo Shingo. It implies the concept of removing faults at the first instance and making a process or product “foolproof”.
How to proceed?
Shigeo Shingo recognizes three types of Poka-Yoke:
1. The contact method identifies defects by whether or not contact is
established between the device and the product. Color detection and
other product property techniques are considered extensions of this.
2. The fixed-value method determines whether a given number of
movements have been made.
3. The motion-step method determines whether the prescribed steps or motions of the process have been followed.
Poka-yoke either give warnings or can prevent, or control, the wrong
action. It is suggested that the choice between these two should be made
based on the behaviors in the process, occasional errors may warrant
warnings whereas frequent errors, or those impossible to correct, may
warrant a control Poka-yoke.
Example:
� Use color-coded parts
� Put the template over an assembled component to show operators where specific parts go.
� Use counters to tell an operator how many operations have been performed.
� Have one prong larger than the other so the electric plug will fit only one way.

SPACE Standard Tool's Kit V1_280509 36
28. Line of Balance
What is it?
• It is a method of identifying the progress of parts in a process against the required completion date on a daily & weekly basis
• It allows having a synthetic and visual representation of procurement coverage included with stock’s situation.
• The method is suited for a production of a repetitive nature.
How to proceed?
1. Set up a table presenting in one dimension the production plans, with units identified by serial number or delivery due date and the other dimension showing the bill of material (all references are not required, only critical or main references could be applied & tracked), the number of final deliverable product covered etc..
2. Identify when each component of the BOM will start getting shortage.
- visualize how many final deliverable products are completed – usually on an array, but can be done also on a cumulative chart
- illustrate for each subsequent final product which parts are not yet in stock or what the expected delivery date is.
3. Highlight on Critical references’ cells for better pro-active planning and follow-up.
Color code: Red - Late, Amber-Concern, Yellow-Complete on time, White-In Process or Not Started, Green – available.

SPACE Standard Tool's Kit V1_280509 37
Example:

SPACE Standard Tool's Kit V1_280509 38
29. Manufacturing Resource Planning
(MRPII)
What is it?
• It is a method for the effective planning of all resources of a manufacturing company.
• It integrates many areas of the manufacturing enterprise into a single entity for planning and control purposes, from board level to operative level and from long term plan to daily plan.
• It addresses operational planning in units, financial planning in dollars, and has a simulation capability to answer "what-if" questions and extension of closed-loop MRP
What are the benefits?
• Improved scheduling • Increased on-time deliveries • Better control of inventories • Productive relationships with suppliers • Reduced working capital for inventory • Improved cash flow through quicker deliveries

SPACE Standard Tool's Kit V1_280509 39
How to proceed?
The specific software package is available depending on how well it fits the needs of manufacturing operation. Here are the key steps :
• Implement monthly Sales & Operation Planning at the steering committee level, to determine production levels and anticipate capacity needs
• Implement weekly Master Production Schedule, at the production department level (stable, level, realistic)
• Run a weekly Materials Requirements Planning and Capacity Requirements Planning, to update materials and capacity requirements
• Implement Execution and Control of Operations, and Input-Output Control
Tips
� Don’t focus on software, but on methods and education
� Validate only realistic plans – use bill of resources for rough
cut capacity plans
� Focus on data accuracy (inventories, bill of materials,
routings, item master)

SPACE Standard Tool's Kit V1_280509 40
30. Input – Output Control
What is it?
• A technique for capacity control where planned and actual inputs and planned and actual outputs of a work center are monitored.
• Actual input is compared to planned input to identify when work center output might vary from the plan because work is not available at the work center
• This technique is used either at work center level or at shop level, to :
o Control (or reduce) the work-in-process and manufacturing lead time, but using the obvious rule: “if you want to reduce WIP, don’t put more in that what goes out!”
o Control the capacity: each time the WIP goes over a certain limit, take immediate action (add capacity).
How to proceed?
1. Define optimum queue size at each work center (based on lead time objective, productivity constraints)
2. Planned inputs and outputs for each work center are developed by capacity requirements planning and approved by manufacturing management.
3. Track the actual values daily, and take immediate appropriate actions: vary capacity, release orders, slow down material flows.

SPACE Standard Tool's Kit V1_280509 41
APPENDIX: The Six Big Losses
The Six Big Losses—the most common causes of efficiency loss in manufacturing. The following table lists the Six Big Losses, and shows how they relate to OEE Loss categories.

SPACE Standard Tool's Kit V1_280509 42
REFERENCES
The references quoted in this document :
- Advanced Quality Tools, Nov.1998 http://www.boeing.com/companyoffices/doingbiz/supplier/d1-9000-1.pdf
- Quality Toolbox by Nancy R. Tague’s 2nd
Edition, ASQ Quality Press, 2004
http://www.asq.org/learn-about-quality/seven-basic-quality-
tools/overview/overview.html