Watersheds and the Hydrologic Cycle. The Global Hydrologic Cycle.

Standard Title Page - Report on State Project Report No.
Report Date
No. Pages
Type Report: Final
Project No.:72987
VTRC 05-CR25
June 2005 64 Period Covered: July 2001-June 2005
Contract No.
Title: Effects of Soil Amendments and Other Practices Upon the Success of the Virginia Department of Transportation’s Non-Tidal Wetland Mitigation Efforts
Key Words: wetlands mitigation organic amendments hydric soils remedial tillage
Authors: W. Lee Daniels, James E. Perry, Richard G. Whittecar, Gariela Fajardo, Cara Bergschneider, and Aaron Despres
Performing Organization Name and Address: Virginia Transportation Research Council 530 Edgemont Road Charlottesville, VA 22903
Sponsoring Agencies’ Name and Address Virginia Department of Transportation 1401 E. Broad Street Richmond, VA 23219
Supplementary Notes
Abstract
Construction of created wetlands to mitigate for highway impacts requires more than $100,000 per ha of impacts. A detailed study of soil, hydrology, and vegetation at 10 recently constructed non-tidal mitigation sites indicates excessive soil compaction and a lack of organic matter continue to limit mitigation success. Detailed hydrologic studies at two mitigation sites (Charles City and Sandy Bottom) point out significant differences in their hydrologic regime vs. adjacent natural wetlands related to soil reconstruction procedures. Results from two compost amendment experiments at Charles City indicate that approximately 100 Mg/ha of organic amendment is optimal for reconstructing hydric soil conditions when natural organic enriched soil materials cannot be returned. Overall mitigation success would improve from (1) utilization of appropriate organic amendments, (2) tillage/ripping protocols at all sites to meet target density specifications, and (3) reconstruction of a soil-geologic profile that is similar in texture and permeability to natural wetland soils. These reconstruction guidelines will help ensure that VDOT complies with existing mitigation regulations in the most cost-effective manner.

FINAL CONTRACT REPORT
EFFECTS OF SOIL AMENDMENTS AND OTHER PRACTICES ON THE SUCCESS OF THE VIRGINIA DEPARTMENT OF TRANSPORTATION’S NON-TIDAL
WETLAND MITIGATION EFFORTS
W. Lee Daniels, Ph. D. Gabriela Fajardo
Cara R. Bergschneider Department of Crop and Soil Environmental Sciences
Virginia Tech
James E. Perry III, Ph. D. Department of Coastal and Ocean Policy
Virginia Institute of Marine Science
Richard G. Whittecar, Ph.D. Aaron D. Despres
Ocean, Earth, and Atmospheric Sciences Department Old Dominion University
Project Manager G. Michael Fitch, Virginia Transportation Research Council
Contract Research Sponsored by
Virginia Transportation Research Council
Virginia Transportation Research Council (A Cooperative Organization Sponsored Jointly by the
Virginia Department of Transportation and the University of Virginia)
Charlottesville, Virginia
June 2005
VTRC 05-CR25

ii
NOTICE
The project that is the subject of this report was done under contract for the Virginia Department of Transportation, Virginia Transportation Research Council. The contents of this report reflect the views of the authors, who are responsible for the facts and the accuracy of the data presented herein. The contents do not necessarily reflect the official views or policies of the Virginia Department of Transportation, the Commonwealth Transportation Board, or the Federal Highway Administration. This report does not constitute a standard, specification, or regulation. Each contract report is peer reviewed and accepted for publication by Research Council staff with expertise in related technical areas. Final editing and proofreading of the report are performed by the contractor.
Copyright 2005 by the Commonwealth of Virginia.

iii
ABSTRACT
Construction of created wetlands to mitigate for highway impacts requires more than $100,000 per ha of impacts. A detailed study of soil, hydrology, and vegetation at 10 recently constructed non-tidal mitigation sites indicates excessive soil compaction and a lack of organic matter continue to limit mitigation success. Detailed hydrologic studies at two mitigation sites (Charles City and Sandy Bottom) point out significant differences in their hydrologic regime vs. adjacent natural wetlands related to soil reconstruction procedures. Results from two compost amendment experiments at Charles City indicate that approximately 100 Mg/ha of organic amendment is optimal for reconstructing hydric soil conditions when natural organic enriched soil materials cannot be returned. Overall mitigation success would improve from (1) utilization of appropriate organic amendments, (2) tillage/ripping protocols at all sites to meet target density specifications, and (3) reconstruction of a soil-geologic profile that is similar in texture and permeability to natural wetland soils. These reconstruction guidelines will help ensure that VDOT complies with existing mitigation regulations in the most cost-effective manner.

INTRODUCTION AND BACKGROUND Wetland impact mitigation, particularly the construction of created wetlands to offset
unavoidable impacts is a major expense associated with new roads and right-of-way improvements in Virginia. Due to uncertainties over the long-term success of mitigation efforts, VDOT and others must recreate more wetland area than disturbed, typically at mitigation:disturbance ratios of 2:1 for forested wetland impacts. Costs of mitigation site development and construction in eastern Virginia typically exceed $100,000 per ha of impact.
Between 1992 and 1997, we conducted detailed studies of soil conditions and associated
hydrologic regimes in a wide variety of non-tidal mitigation wetlands constructed by VDOT in the late 1980’s and early 1990’s. As a part of this program, all sites constructed before 1993 (>90 sites) were evaluated in general, and detailed studies of five “typical” mitigation sites compared to adjacent natural forested wetlands were performed. The results of those studies were reported by Stolt et al. (2000 and 2001) and Cummings (1999), whose combined work revealed major differences in topography, hydrology, soil properties, and other environment conditions such as soil temperature and redox potential. Microrelief was much greater in reference wetlands than in the associated constructed wetlands. Seasonal fluctuations in water-table levels were similar in both wetland types. However, soils in the mitigation wetlands were much lower in soil carbon (C) and nitrogen (N) levels and had higher bulk densities in both the A horizon and subsoil layers than their paired reference wetlands. Similar results were reported by Bishel-Machung et al. (1996) for mitigation wetlands in Pennsylvania.
Additionally, sulfidic materials have been routinely encountered in potential mitigation sites and highway corridors throughout Virginia (Orndorff and Daniels, 2002), and are particularly abundant in lower Tertiary deposits of the Coastal Plain. When exposed and oxidized in dewatered cuts and fills, these materials quickly oxidize, generating extremely acidic (pH < 3.0) and phytotoxic conditions. Once exposed, heavy liming (5 to 50 T/ac; 10 to > 100 Mg/ha) or re-saturation of the materials is required to neutralize the potential acidity present, and serious local soil and water quality degradation is inevitable.
Recreating the appropriate soil wetness regime in mitigation sites is an essential prerequisite for mitigation success, regardless of soil properties. The majority of non-tidal wetland mitigation in our region is designed to replace palustrine forested wetlands. However, the recreation of the deep annual hydroperiod that is typical of the soil-hydrologic conditions at many forested wetland sites is very difficult to plan for and to execute through typical a priori water budgeting procedures (Daniels et al., 2000), especially when deep excavations are involved. The recreation of an appropriate soil wetness regime is further complicated by the widespread use of surface water driven episaturated “perching designs” (Whittecar and Daniels, 1999). Thus, the difficulties involved in accurately predicting the post-construction water budget and associated hydroperiod for a given mitigation site design are considerable. Despite these difficulties, the studies cited above have indicated that many mitigation sites do develop a seasonal hydroperiod that is very similar to nearby reference wetlands. However, many of these same sites subsequently suffer from very dry and hot mid-summer conditions due to (1) adverse surface soil conditions of high clay content and bulk density, (2) low organic matter and

2
associated low water holding capacity, and (3) the lack of an insulating canopy and well-developed forest litter layer.
The eventual success of these constructed wetlands may lie in the process of how and
when different parts of the soil become saturated. Epiaquic conditions, as defined by the Soil Science Society of America (2004), occur when soil that is saturated in one or more layers within 2 m of the surface also has one or more lower layers of soil that are unsaturated within 2 m of the surface. This condition most likely exists due to the perching effect of one or more layers present, slowing water infiltration downward through the soil profile (e.g., Griffin et al., 1998). Epiaquic conditions may indicate hydrologically stressful circumstances for vegetation because roots may not readily penetrate into the perching layer if it is extremely hard or compacted. Root systems in epiaquic settings may therefore be more prone to drying out than would a deeper, unrestricted root system. Shallower root systems may also be vulnerable to extreme weather events such as high winds that could result in toppling that would otherwise not occur in a forest community with a deeper root system. Endoaquic conditions are more favorable for vegetation than epiaquic environments. Endoaquic conditions occur when all layers are saturated to a depth of two meters from the surface, in effect indicating that a hard or compacted perching layer is not present and water may move freely downward through the soil profile from the surface. Roots are therefore able to establish themselves deeper into the soil profile, increasing stability of vegetation and its ability to take up soil water.
Due to our reporting of these earlier results to VDOT and at regional scientific meetings, the USCOE and VDEQ have established guidance (COE/DEQ, 2004) that specifically requires organic matter additions and other soil reconstruction practices. The addition of these assessment and construction requirements can be potentially very expensive. However, when either the agencies (USCOE/DEQ) or the VDOT Environmental Division requests detail on optimal rates of organic application or remedial tillage based upon economics and/or "proof" of actual long-term efficacy of these treatments, it is very difficult to provide exact and scientifically based prescriptions because we had no dedicated field plots or "in-mitigation site" studies to rely on. This study reports the first replicated scientific study on the effects of organic amendments and ripping to date and provides essential guidance for not only Virginia, but also the entire Mid-Atlantic region.
PURPOSE AND SCOPE
In this report, we summarize results from three separate and parallel studies that were executed between 2001 and 2005. The detailed objectives and rationale for each study are described here.
Study 1: Mitigation Site Comparative Study
In 2001, the VDOT Environmental Division also expressed a need for a thorough
assessment of their relative success in restoring appropriate mitigation site hydrology, soil conditions and vegetation. In particular, the Environmental Division requested an assessment of whether or not their recently constructed wetlands appear to be moving down an appropriate soil

3
and vegetation successional pathway that will result in their being similar in form and function to their intended mitigation targets. The objectives of this study of mitigation site conditions were:
1. To detect the important interactions of organic additions, tillage, and other soil reconstruction practices on overall mitigation success across a range of reconstructed site wetness regimes.
2. To assess the relative success of VDOT mitigation site design and construction
practices across a representative range of sites constructed in the 1990’s.
Study 2: Hydrologic Variations Within Created and Natural Wetlands in Southeastern Virginia
The purpose of this portion of the overall research project was to understand the
hydrologic impacts of wetland construction techniques used in different geologic and pedologic settings. Objectives of this portion of our work were:
1. To determine the causes of variations in patterns of hydrologic response to recharge events.
2. To determine the effects that construction practices used in mitigation wetlands have
on the permeability and hydrologic response in fine-grained soils.
3. To determine the effects that construction practices used in constructing wetlands have on the permeability and hydrologic response in stratified multi-textured soils.
4. To determine if soil cracking influences the hydrology of a constructed wetland.
Study 3: Effects of Compost Loading Rate on Mitigation Success
Although the importance of organic matter additions into created wetlands has been recognized, no known replicated scientific experiments have been conducted to specify appropriate organic matter loading rates. Likewise, limited research has been reported on the effects of organic matter additions on hydric soil developmental processes in created wetlands. Therefore, the Charles City Wetland Experiment (CCW) was established with the following specific objectives:
1. To quantify the overall effects of organic matter amendments in relation to redox potential, bulk density, and volumetric water content and to qualify the effects of organic matter amendments on redox feature formation;
2. To measure the overall effects of organic matter amendments upon the growth, vigor,
and survival of planted bottomland hardwood species in created wetlands;

4
3. To determine an appropriate loading rate of organic matter amendments for non-tidal forested created wetlands in the mid-Atlantic Coastal Plain.
METHODS AND MATERIALS
Study 1: Mitigation Site Comparative Study
Ten sites were selected for sampling in 2002 and 2003 based upon a combination of factors including (1) input from the VDOT Environmental Division and (2) previous experience of the principal investigators and established background research histories. These ten sites were chosen to represent the best range of actively permitted VDOT mitigation sites available over a range of geomorphic conditions and construction techniques in central and eastern Virginia. Over the course of this study, these ten recently constructed VDOT wetlands (Table 1) were assessed for combined soil/hydrologic/vegetation properties and then evaluated qualitatively for their relative success in meeting their permitted mitigation targets. It is important to note that the construction dates given in Table 1 denote the time of initial grading and site development and not necessarily final planting. Figure 1 shows the general location of the ten sites. Table 1. Ten selected VDOT sites used for collective study of soil, hydrology and vegetation indicators and overall wetland establishment response. Wetlands were evaluated in 2002 and 2003.
Physiographic Province
Site Name
Site Abbreviation
Construction Date
Size (ha)
Wetland Type
Type of Reconstruction
Charles City CCW 1998 20.78 Mineral Flat Cut Mount Stirling
MTS 1999 13.00 Riverine Cut
Sandy Bottom
SB 2002 19.43 Mineral Flat Fill Lower/Middle Coastal Plain
SW Suffolk/ Lake Kilby
SWS 2002 5.02 Mineral Flat/Slope
Cut/Fill
Mattaponi MATTA 2001 8.41 Riverine Cut Middle/Upper Coastal Plain Stony Creek SCW 1998 2.27 Riverine Cut/Fill
Butchers Creek
BCK 1999 2.02 Riverine Cut
Dick Cross DC 2000 10.45 Riverine Cut Manassas MAN 1999 15.87 Riverine Cut
Piedmont/ Triassic
Reedy Creek RCK 2001 18.22 Riverine Cut Site Properties and Development Histories
Lower/Middle Coastal Plain Sites
Charles City.
The Charles City mitigation site (CCW, Figure 2) is located west of State Route 623 in Charles City County, near the town of Mount Airy and the Chickahominy River. It serves as mitigation for impacts associated with the construction of Route 199 around Williamsburg.

5
CCW lies within the middle Coastal Plain physiographic province, and is underlain by the Shirley formation. Wetland hydrology is maintained in this pocosin setting by precipitation, by slow drainage down through low permeability soils, and by the breadth of the Coastal Plain terrace surfaces. In the natural wetland, deep fine-grained subsoil (B) horizons retard downward movement of water, but the overlying horizons (O+A+E) have significant water-holding capacity because of cracks, megapores, and other soil structures. These shallow subsoil and surface horizons are thick enough to hold sufficient water for vegetation during dry seasons.
Figure 1. Location of the ten VDOT wetlands selected for detailed study of soils, vegetation and hydrology.
The pre-disturbance soils at CCW included the hydric Chickahominy (loam) series, as well as the Newflat (silt loam) series, which is not hydric. The original approach to mitigation site creation was to excavate the pre-existing mineral flat landscape down from 0.5 to 1.0 m, presumably lowering the system (which was not jurisdictional before disturbance) to an appropriately wet elevation. The topsoil layers (0+A+E horizons) were removed to varying depths and stored in a large above grade fill. A large pond abuts the CCW wetland and serves to slow surface and subsurface drainage from the wetland. More specific information is provided later on site conditions relative to the detailed study of hydrologic conditions.
Average excavation of the upper soil profile at CCW ranged from 0.61 – 0.91 m; this
estimate is based on soil analyses, well data, and nearby reference wetlands. Overall, designated forested areas have an elevation from 9.97 – 10.58 m, scrub-shrub zones have elevations ranging from 9.51 – 9.81 m, and emergent wetland were returned to elevations ranging from 8.84 – 9.69 m. Because CCW is underlain by a thick clayey (argillic) soil horizon, the site was designed to perch water. In reconstructing the soil profile, the existing topsoil (approx. 2.5 – 7.6 cm thick) was supposedly stockpiled and then reapplied, incorporating the clay subsoil. For some reason, very little of the topsoil was returned as a soil building treatment at this site, although earlier work by Schmidt (2002) at this site indicates that topsoil was returned to some areas. Additionally, some burn piles of mixed pine/hardwoods (prior vegetation) were integrated at the location of the burn pile and spread out. The site was then disked once prior to Corps of Engineers grading approval to a depth of 15 cm, making many passes over the site, since the topsoil/clay chunks were not breaking up easily due to the very dry conditions (drought year).

6
Deep ripping was also done with a chisel plow crossing twice, 30 cm by 30 cm, which apparently ended up re-compacting the ripped soil on the second pass (Peter Constanzer, personal communication). The site also received a lime application at the rate of 1.2 Mg/ha. No fertilizer or organic amendments were used.
Final planting did not occur until spring 2004 due to lack of agency agreement over whether appropriate wetland hydrology had been established. In 2004, after the sampling study reported here, much of the site was re-graded, organic amended and ripped again. There is evidence that a temporary herbaceous seed mix was applied in 1999, however, and a wide array of plants had naturally invaded the site over time. Trees planted in 2004 include willow oak (Quercus phellos), pin oak (Quercus palustris), river birch (Betula nigra), and cherrybark oak (Quercus pagodaefolia). In the scrub-shrub sections, swamp rose (Rosa palustris), buttonbush (Cephalanthus occidentalis), and bald cypress (Taxodium distichum) were planted. Emergents included soft rush (Juncus effusus), swamp smartweed (Polygonum hydropiperoides), and woolgrass (Scirpus cyperinus).
Figure 2. Detailed location map and sampling plan for Charles City Wetland (CCW). Mount Stirling.
Mount Stirling (MTS; Figure 3) is located on floodplains adjacent to the Chickahominy River and Collins Run, and east of State Route 155 in Charles City County. This site was mitigated for unavoidable impacts to wetlands in construction of the I-95 Atlee Elmont

7
Interchange. MTS is located in the Coastal Plain physiographic province, and is underlain by Quaternary alluvium and the Shirley formation (Rader & Evans, 1993). The natural and cut valley sides next to MTS wetlands are formed in permeable Coastal Plain sediments and thus this site receives significant amounts of groundwater flow. Wetland hydrology is maintained at this site by a combination of precipitation, groundwater seepage, overbank flow piped through levees, and occasional overbank flow. The MTS wetlands are constructed in a series of relatively flat-bottomed cells surrounded by berms that are connected via concrete overflow structures. The site functions as a complex series of slope wetlands and mineral soil flats except during periods of flooding when it serves as a floodplain basin.
The soils at MTS were mapped as Augusta sandy loam and hydric Tomotley fine sandy loam, with inclusions of Altavista fine sandy loam, Dragston fine sandy loam, and hydric Nawney silt loam. A portion of the site (approximately 80%) was prior-converted farm land (Travis Crayosky, personal communication). The site was expanded by cutting the soil to a maximum of 0.76 – 0.91 m, which was based on well data from on-site and adjacent wetlands, elevations of adjacent wetlands, and presence of hydric soils or redoximorphic features. The graded topsoil was stockpiled and re-spread to a depth of 15 cm, and then disked to a depth of 10 cm before seeding occurred. The surface was disked once, crossing the site numerous times until the topsoil appeared “fluffy” (Travis Crayosky, personal communication). In addition, fertilizer (10-30-15) was added to the soil at a rate of 27 Kg/ha. No organic amendments or lime applications were made, nor did any deep ripping occur on the site.
Planted forested species include red maple (Acer rubrum), river birch (Betula nigra), water oak (Quercus nigra), and black willow (Salix nigra). Scrub-shrub plants include red chokeberry (Aronia arbutifolia), winterberry holly (Ilex verticillata), and highbush blueberry (Vaccinium corymbosum).
Sandy Bottom.
Sandy Bottom (SB) is located between I-64 and Hampton Roads Center Parkway, and is adjacent to the Sandy Bottom Nature Park in Hampton (Figure 4). SB is intended as off-site compensation for impacts to forested wetland from the construction of the Hampton Roads Center Parkway and extension of the directly adjacent East-West Expressway. It is situated in the Coastal Plain over the Tabb formation (Rader & Evans, 1993), and was once a VDOT site for sand and gravel for I-64, which left the site with several deep (> 4 m) lakes. Therefore, much of the site was originally soil mapped as open water. However, the northern fringe of the site was mapped as Udorthents due to the presence of extensive acid-sulfate sand piles and unvegetated fill. A more thorough discussion of geo-hydrologic setting at SB is provided in the hydrologic study methods later.
To achieve design elevations (5.5 – 7.0 m msl), which were based on adjacent wetland areas, filling and grading the old borrow pit areas were necessary, and as a result, minimal excavation of the site was required. Though the site was not designed to perch water above a limiting layer, the high clay content of the imported fill material has perched water in the surface layers in a dissimilar manner to the natural surrounding wetlands. The site was reconstructed by filling and compacting former borrow areas in lifts to an elevation of 15 cm below final design

8
grades. The subgrade soil was limed (approximately 1.4 Mg/ha) to adjust the pH of the soil to within the range of 5.5-8.0, which was required to satisfy DEQ’s discharge water quality standards (Steve Russell, personal communication). The placement of 15 cm of compost-amended topsoil (min. 4% organic by wt) was then added. Composted wood chips, which originated from stripped material from other unidentified VDOT projects, were used as an organic amendment. Very generic requirements were established for use of organic materials, as the only condition was that no pieces over 8 cm could be used (Dean Devereaux, personal communication). The topsoil substitute layer was disked to a depth of 20 cm by making two passes across the site one time; one time in an east-west direction and the second pass in a north-south direction (Dean Devereaux, personal communication). No deep ripping occurred on-site. The soil was limed until the pH was within the same pH range as the subsoil. As there was no onsite topsoil available to the project, salvaged topsoil (from O, A, and E horizons) from various sources, including the Sentara Hospital construction site on Coliseum Drive and the 199 project in James City County, was used and mixed with organic amendment. This imported soil was pH-tested onsite.
Figure 3. Detailed location map and sampling plan for Mount Stirling wetland (MTS).

9
Figure 4. Detailed location map and sampling plan for Sandy Bottom Nature Park wetland (SB).
Planting of the site occurred in the fall of 2004, and included forested species such as
overcup oak (Quercus lyrata), willow oak (Quercus phellos), bald cypress (Taxodium distichum), and water tupelo (Nyssa aquatica). Scrub-shrub species included tag alder (Alnus serrulata), arrowwood (Viburnum dentatum), and red chokeberry (Aronia prunifolia). Plans for the emergent wetland section consisted of lizard tail (Saururus cernuus), cardinal flower (Lobella cardinalis), and blue iris (Iris virginica). SW Suffolk/Lake Kilby.
The SW Suffolk site (SWS; Figure 5) is located adjacent to Lake Kilby and Kilby Shores Subdivision in Suffolk, and is compensatory mitigation for wetlands impacted by the construction of the SW Suffolk US-460 Bypass. SWS is located within the Coastal Plain region near the Suffolk Scarp, and the geology consists of the Chuckatuck formation (Rader & Evans, 1993). Soils mapped at this site include Suffolk loamy sand and loamy Udorthents within the disturbed borrow area. The site was mainly used for sand mining and fill borrow operations and
10
steep slopes with up to 10 meters of relief surround the SWS wetland. Thus, groundwater seepage is the primary source of water for this site. Ponds at the lower end of the wetland help maintain elevated groundwater levels. Excess surface water and shallow groundwater leave the site via overflow lips lined with very coarse gravel. Thus the wetland functions principally as a slope wetland with a gentle gradient.
Because SWS was a borrow pit lake, it was filled an average of +0.30 m, while the outer
areas of the original pit were cut an average 3.05 m. The grading plan achieved elevations of 7.38 – 7.62 m, which was decided upon after conducting a water budget analysis. At the time of construction, the contractor misinterpreted the plans and excavated too deep. As a result, they had to backfill with imported material, which came from the borrow pit that served the road project and the topsoil that was stripped and stockpiled. After topsoil was replaced, 457 m3 /ha of composted yard waste was disked in to achieve 4% organic matter content. At the time of seeding, 1.2 Mg/ha of fertilizer (15-30-15) and 800 Kg/ha of lime were applied to the soil. In addition, a total of 109 Kg of slow release fertilizer (18-6-12) was specified for individual woody plantings. No deep ripping occurred at SWS.
Planted forested wetland species include bald cypress (Taxodium distichum), water tupelo (Nyssa aquatica), pond pine (Pinus seratina), and overcup oak (Quercus lyrata). Scrub-shrub zones consist of water loosestrife (Decodon vertcillatus), swamp rose (Rosa palustris), and buttonbush (Cephalanthus occidentalis). The emergent wetland is comprised of species such as sago pondweed (Potamogeton pectinatus), fringed sedge (Carex crinita), and creeping redtop (Agrostis stolonifera).
Middle/Upper Coastal Plain Sites Mattaponi.
Mattaponi (MATTA; Figure 6) is a mitigation wetland bank located southwest of Milford, in Caroline County. MATTA is located along the western edge of the Coastal Plain physiographic province, a region with abundant coarse alluvial gravel terraces. Water for the eastern portion of the site comes from groundwater seepage from slopes cut into the gravel terraces and from overbank flow. Overflow from the river and adjacent natural floodplain can inundate the site for periods of several days. During times between these infrequent floods, the smaller, eastern portion of the wetland is somewhat more dependent upon direct precipitation because it has a smaller source area draining groundwater into this area. Because of the large amount of water present at MATTA, this site functions mostly as a floodplain basin with fringes of slope wetlands. The bank provides off-site compensation for unavoidable impacts to wetlands in non-tidal portions of the York River watershed. The majority of the pre-construction soils were mapped as Altavista sandy loam, while a small area on the southern boundary was mapped as a Bojac sandy loam.

11
Figure 5. Detailed location map and sampling plan for Suffolk Bypass/Lake Kilby wetland (SWS).
MATTA was created by grading the surface down to 0.61 – 1.2 m to produce a
microtopograpy that modeled the ridge and swale landscape of point bars found nearby in the Mattaponi river floodplain. The site design grades were based on one year of data from 22 groundwater monitoring wells and adjacent wetlands. The soil was reconstructed by excavating 0.3 m below final grade and then back-filled to final grade with sandy loam topsoil. Prior to replacement, the topsoil was amended to 4% organic content with composted yard waste, which consisted of blended leaves, branches, and grass clippings. This compost material originated from Grind-All, a commercial handler based in Richmond, VA. The specifications for the composted yard waste included moisture content (35-55%), pH (5.5-8.0), particle size (pass through a 25 mm screen), soluble salt concentration (≤ 3.0 dS/m), and nutrient contents (N: 0.5-2.5%; P: 0.2-2.0%; K: 0.3-1.5%) In addition to these requirements, the compost material also had to be free of viable weed seed and low in heavy metal content (Robert Pickett, personal communication). Before seeding occurred, the soils were disked to a depth of 15 cm, and during the seeding of the site, 1.8 Mg/ha of lime and 0.24 Mg/ha of fertilizer (15-30-15) were applied. No deep ripping occurred on-site.

12
Figure 6. Detailed location map and sampling plan for Mattaponi wetland (MATTA).
Forested zones were designed across higher portions the site, and include ironwood
(Carpinus caroliniana), green ash (Fraxinus pennsylvanica), river birch (Betula nigra), and willow oak (Quercus phellos). Scrub-shrub zones were designed along linear ‘fingers’ that stretch toward the northwest portion of the site. The scrub-shrub community consists of tag alder (Alnus serrulata), buttonbush (Cephalanthus occidentalis), and deciduous holly (Ilex decidua). Emergent areas are situated throughout the sloughs, and include arrow arrum (Peltandra virginica), marsh hibiscus (Hibiscus moscheutos), trailing seedbox (Ludwigia repens), and watercress (Nasturtium officinale). Wetland hydrology was approved in May 2003 and the site was planted to permanent vegetation during that time.

13
Stony Creek.
Stony Creek (SCW) is located immediately NE of the intersection of I-95 and State Route 40 in Sussex County. SCW is situated in the western part of the Coastal Plain physiographic province on Quaternary alluvial deposits. Wetland hydrology is maintained in part by minor seepage from gravelly upland slopes next to the site and occasional stream overflow during flood events. Most of the water comes from lateral seepage through coarse alluvium connected to flow in the channel of Stoney Creek. Thus the wetland functions as a slope wetland when channel flow is low, and as a floodplain backswamp basin following large floods.
This site was constructed to compensate for seven small maintenance projects and two
large bridge replacement projects. SCW was originally a sand mining pit that left the site as a deep pond, and it was filled to generate an appropriate wetland environment. To create wetland soils, imported topsoil was applied to the eastern leg of the site. The topsoil (O, A, and E horizons) was obtained from the previous owner of the site, who was a borrow pit operator that stripped and stockpiled topsoil. On the main body of the site, 10 cm of old sawdust was incorporated into in-situ material. The sawdust originated from a local lumber mill that had stopped operating 15 years ago (Dean Devereaux, personal communication). After the soil was graded to final elevations, and before planting occurred, the soil was disked to a depth of 15 cm and 400 Kg/ha of lime was applied. Individual plantings also received fertilizer tablets. No deep ripping occurred on-site.
Wetland hydrology was approved in May 1999, and planting occurred that following September. Planted forested species include bald cypress (Taxodium distichum), pin oak (Quercus palustris), river birch (Betula nigra), and black willow (Salix nigra). Emergent species that were planted include pickerel weed (Pontederia cordata) and giant bur-reed (Sparganium americanum). Piedmont/Triassic Sites Butchers Creek.
Butchers Creek (BCK; Figure 7) is located north of State Route 677 within the western floodplain of Butcher Creek in Mecklenburg County. It is situated entirely within the Piedmont region of Virginia, and is compensatory mitigation for impacts related to the widening of State Route 58. The site is located on floodplain alluvium of Butcher Creek, which has a watershed composed of felsic volcanic rocks of the Carolina Slate Belt (Rader & Evans, 1993). Wetland hydrology is maintained by groundwater seepage along toe slopes at the sides of the floodplain, groundwater passing laterally through sandy floodplain sediments, and overbank floodflows. Excess surface water returns to the creek via gravel lined lips. Thus the wetland functions as a complex of slope wetlands except during occasional floods when it serves as a floodplain back-swamp basin. Pre-construction soils mapped at the site include the hydric Chewacla silt loam, as well as the Congaree silt loam (Jurney & Henry, 1956). BCK was previously used for agriculture.

14
Figure 7. Detailed location map and sampling plan for the Butchers Creek wetland (BCK).
In order to achieve wetland hydrology, soil cutting and reconstruction were necessary.
An average depth of 1.07 m of soil was removed, which was based on the estimated local ground-water levels and flooding history of Butcher Creek. Before topsoil was returned, 1 part composted organic backfill (492 m3 /ha) was mixed with 2 parts topsoil. The organic amendment originated from Scott Company, located in Lawrenceville, VA, and consisted of composted leaf matter and yard waste that had a pH of 6-8, was at least 40% organic, and had an average bulk density that did not exceed 0.74 g/cm3. This mixture was then spread over the site in a 15 cm layer. Shallow disking (5 – 8 cm) occurred before planting, and lime was added at a rate of 560 Kg/ha. Furthermore, 120 Kg ha-1 of fertilizer (15-30-15) was applied to the soil, as well as a total of 70 Kg of time released fertilizer (18-6-12) for the plants. No deep soil ripping occurred onsite, and in fact, the subsoil was intentionally compacted limit groundwater losses.
The planned forested habitat included species such as green ash (Fraxinus pennsylvanica), pin oak (Quercus palustris), willow oak (Quercus phellos), American elm (Ulmus americana), and swamp white oak (Quercus bicolor). Scrub-shrub species included black willow (Salix nigra), silky dogwood (Cornus amomum), and swamp rose (Rosa palustris). Emergents consisted of mud plantain (Alisma plantago-aquatica), woolgrass (Scirpus cyperinus), hop sedge (Carex lupulina), and bushy seedbox (Ludwigia alterniflora).

15
Dick Cross.
Dick Cross (DC; Figure 8) is located off Rt. 615 near South Hill, VA in Mecklenburg County, and is situated on the floodplain of the Roanoke River and the associated upland transitional landscape. Bordering the wetland is Allen Creek, a tributary of the Roanoke River; DC is approximately 1.2 km west of where Allen Creek joins the Roanoke River, which is impounded as Lake Gaston. The DC wetland is located in the Piedmont region, and overlies late Proterozoic to Mississippian aged Buggs Island Granite (Rader & Evans, 1993). The soils at DC were mapped as Congaree silt loam and Chewacla silt loam (Jurney & Henry, 1956). In conjunction with BCK, DC is compensation for unavoidable impacts associated with the widening of State Route 58 and construction of the US Route 1 Bridge over the Roanoke River.
Figure 8. Detailed location map and sampling plan for the Dick Cross wetland (DC).
A very complex set of hydrologic factors influences DC. Groundwater seepage is
abundant near the valley margins and is passed partway across the valley bottom. In portions of the site closer to Allen Creek, the wetlands rely upon groundwater seepage through sediments

16
connected to the stream channel, upon precipitation, and upon overflow from the channel during floods. Estimates of the amount and timing of water available is complicated by releases of water from the Kerr Dam 3 km upstream which raise water levels in Lake Gaston and backflood Allen Creek. Thus, DC is a mosaic of wetlands some of which function as slope wetlands and others as floodplain basins.
Extensive excavation of this site was required because there were very few surface water
inputs that could be relied upon to sustain a large wetland area. Thus, both groundwater and overbank flooding were presumed and expected to drive the water budget. The average excavation of the upper soil profile was 0.6 – 0.9 m, and was based on well data and the adjacent natural wetland. Overall, 32 wells were monitored for approximately 10 months (11/1996 – 9/1997) prior to construction. In reconstructing the soil, the topsoil was stockpiled prior to excavation, and then replaced to a 15 cm depth. The topsoil layer was then disked to 15 cm, and received 5.0 Mg ha-1 of lime and 0.7 Mg ha-1 of fertilizer (15-30-15). No deep ripping or organic amendments were applied to the site (Chris Frye, personal communication).
Planting was approved in August, 2003 even though the site hydrology was not approved (Dave Bova, personal communication). Forested zones were planted with water oak (Quercus nigra), swamp white oak (Quercus michauxii), willow oak (Quercus phellos), and river birch (Betula nigra), among others. Scrub-shrub species include buttonbush (Cephalanthus occidentalis), marsh mallow (Hibiscus moscheutos), and silky dogwood (Cornus amomum). Plants in the emergent wetlands include lizard tail (Saururus cernuus), duck potato (Sagittaria latifolia), and fringed sedge (Carex crinita). Manassas.
Manassas (MAN; Figure 9) is located in central Prince William County, east of the Manassas Municipal Airport, and was developed to compensate for impacts to wetlands associated with the construction of the State Route 234 Bypass. MAN lies within the Piedmont physiographic province on the floodplain of Broad Run, a tributary of the Occoquan River. The site sits on a broad terrace that was the floor of the valley carved by Broad Run, before the stream abandoned this valley for its present valley to the west. Alluvium, including coarse gravels, sand, and mud, lie beneath the terrace. Rocks beneath the valley sides are from the Triassic Newark Supergroup, which includes interbedded sandstone, siltstone, and shale (Rader & Evans, 1993). The vast majority of the native soils at MAN were mapped as the hydric Aden silt loam, Bermudian silt loam, and Dulles silt loam, though an inclusion of Rowland silt loam was present as well (Elder, 1989). The site was once used for farming operations.
The hydrology of this large and complex site is driven by abundant groundwater seepage
passing through the terrace alluvium from the steep valley slopes, and by surface water flow during floods. Ponds located on the lower end of the wetlands help to maintain elevated groundwater levels near the ponds. Slightly elevated areas on the terrace surface relatively far from the valley edge receive water only from precipitation and may end up being too dry for wetland conditions. Thus MAN is a complex mosaic of wetlands, most of which function as slope wetlands.
17
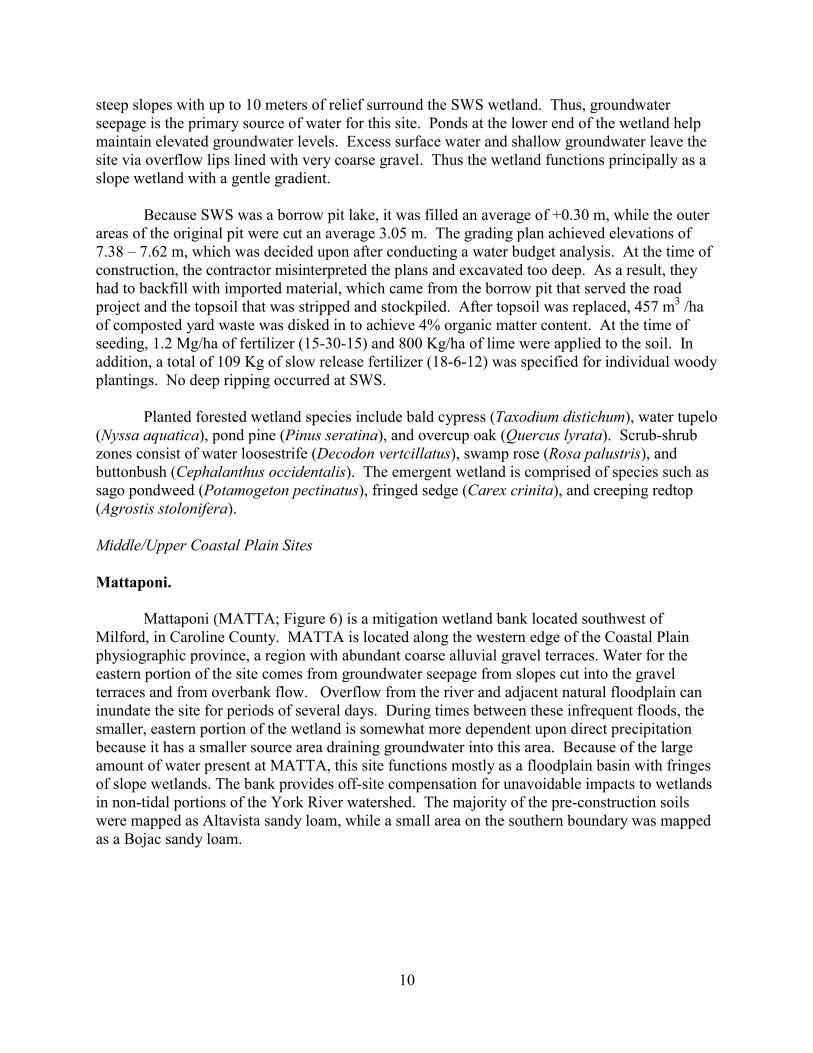
Overall, the original soil was cut an average of 0.56 m, which was based on adjacent reference wetlands and well data. Subgrade soils were compacted to 95% maximum compaction followed by the return of loose subsoil and topsoil. Before seeding occurred, the soil was disked to an unknown depth, though no deep ripping took place. In addition, 2.6 Mg/ha of fertilizer (15-30-15) and 1.4 Mg ha-1 of lime were applied to the site to increase nutrient availability. No organic amendments were used. Wetland hydrology was approved in April 2000, and planting occurred the following month. Trees planted include green ash (Fraxinus pennsylvanica), pin oak (Quercus palustris), and willow oak (Quercus phellos). Scrub-shrub species include black willow (Salix nigra), tag alder (Alnus serrulata), button bush (Cephalanthus occidentalis), and swamp rose (Rosa palustris). Emergents include shallow sedge (Carex lurida), water plantain (Alisma subcordatum), and duck potato (Sagittaria latifolia).
Figure 9. Detailed location map and sampling plan for Manassas wetland (MAN).

18
Reedy Creek.
The Reedy Creek mitigation wetland (RCK, Figs. 11a,b,c) is located adjacent to the Appomattox River, off State Route 602 in Chesterfield County. This site is intended as off-site compensation for impacts to wetlands associated with construction of Route 288. RCK is located in the Piedmont physiographic province at a site where the Appomattox River carved a deep valley before it abandoned that area and moved to its present location. The site is underlain by thick sandy alluvium and by the arkosic sandstones of the Triassic Newark Supergroup (Rader & Evans, 1993). Soils in Section A were mapped as Forestdale silt loam, Lenoir loam, and Molena loamy sand. Section B consisted of Dogue loam, Lenoir loam, and Pamunkey loam. The soils in Section C were mapped as Pamunkey loam, Dogue loam, and Forestdale silt loam. Both the Forestdale and Lenoir series are on the hydric soils list.
Wetland hydrology at the site is maintained mostly by groundwater seepage from the
valley sides and by precipitation. Overbank flow from the river occurs occasionally, too. Two large natural backswamp floodplain ponds are present adjacent to RCK. Thus RCK is a collection of separate wetlands that function as slope wetlands or as mineral soil flats most of the time, except during flood events when they serve as floodplain basins.
This site was constructed by cutting the soil down an average of 0.30 – 0.46 m, with the deepest cuts occurring at 0.76 – 0.91 m. Well data from on-site and adjacent wetlands, elevations found in adjacent wetlands, and presence of hydric soils or redoximorphic features were factors in determining the soil grade. Sixteen wells and six piezometers were monitored for 4 months (March-June) before soil cutting occurred. The graded topsoil was stockpiled and respread to a depth of 30 cm, and disked to a depth of 15 cm before seeding. Potassium as KCl (0-0-50) was applied to the soil at a rate of 55 Kg ha-1, dolomitic limestone at 400 Kg ha-1, and triple super phosphate at a rate of 36 Kg ha-1. In addition, existing vegetation (site was a scrub-shrub/cut-over pine area) was ground and incorporated with the stripped topsoil to increase the organic matter content. The exact rate at which this organic amendment was applied is unknown, though it was known that it was respread to an average thickness of 15 cm (Travis Crayosky, personal communication).
Proposed forest species include boxelder (Acer negundo), American hornbeam (Carpinus caroliniana), black willow (Salix nigra), and swamp white oak (Quercus bicolor). Scrub-shrub species include buttonbush (Cephalanthus occidentalis), swamp rose (Rosa palustris), and American elder (Sambucus canedensis). Field Sampling Procedures for Soils
Over the summer and early fall of 2002, we sampled five sites (CCW, DC, MAN, MATTA, and SCW), and the remaining sites were sampled in 2003. Sampling locations were determined by electronically superimposing a grid on a digital image of the site map. Grid spacing was adjusted until there were 10 (e.g., CCW, DC, MAN, MATTA, MTS, SB, and SWS) to 14 (e.g., RCK) detailed sample locations for larger mitigation projects (i.e. > 4 ha). For smaller wetlands (< 4 ha: BCK and SCW), sample numbers were reduced so that there were at least 2 samples per ha. This was achieved by designating each node within the boundaries of the
19
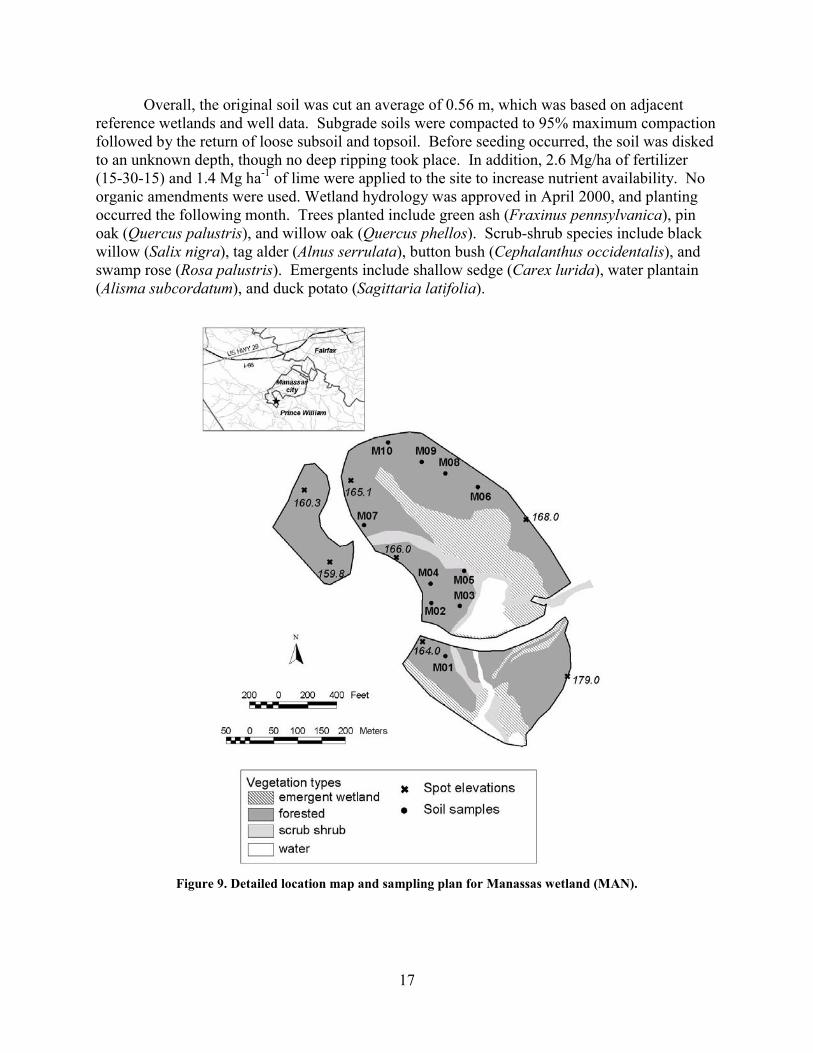
created wetland as a sample location. Therefore, the number of nodes on the grid equaled the number of sample locations. Forested wetlands are one of the most difficult systems to recreate, therefore we focused our attention on soil properties in those areas that were designated to become forested wetland. Thus, our sampling excluded ponded, emergent, and very wet shrub-scrub areas. This sampling model is therefore a stratified, completely randomized design.
Figure 10 a. Detailed location map and sampling plan for area A in Reedy Creek wetland (RCK).

20
Figure 10 b. Detailed location map and sampling plan for area B in Reedy Creek wetland (RCK).

21
Figure 10 c. Detailed location map and sampling plan for area C in Reedy Creek wetland (RCK).

22
Actual sampling locations were located as close as possible to the pre-determined map grid points. At each point, the auger description location was chosen to be typical of what was within the surrounding 10 m (based on vegetation, surface conditions and elevation). If the grid location was in standing water (> 10 cm), all samples except the composite surface samples were instead taken from closest non-ponded soil. This lateral shift was implemented due to the difficulty in collecting auger and bulk density samples in standing water.
Sampling locations were pin flagged (adjacent to auger description) and recorded via GPS using a Garmin eMap unit (15 m RMS accuracy). Other pertinent site information such as location, date, weather, surface conditions, vegetative cover, were logged into a bound data book. Digital images were taken of the typical vegetation and surface conditions. Then the following procedures were carried out:
1. A sample boring was augered to a depth of 1.5 m with an 8 cm diameter auger into a tray (some shallower due to bedrock, cobble layers, loose sediment). The soil was described by horizons for color, structure, rooting depth and redoximorphic features using a soil description data sheet from Vepraskas (1992) and the Hydric Soils Manual (Hurt et al., 1998) (i.e. pore linings, depletions, concentrations, etc). Subsequently, a sample of each delineated horizon was placed into a plastic bag and taken to the lab for further analysis. If more than > 1 cm of O horizon litter was present, it was also described by layer (L, F, H) and collected. Digital images were taken of the profile and certain horizons (e.g., Fe concentrations/depletions).
2. Three surface bulk density samples were taken after moving aside vegetation and
litter. Since the bulk density hammer used required the uppermost portion of the core to be discarded, sample depths typically begin at 3 to 5 cm.
3. With a sharpshooter, either the A horizon and/or whatever surface substrate was
present down to a depth of 25 cm was carefully removed. This was accomplished in "one square plug" in most cases by pushing the sharpshooter down in a square around the sides and then excavating the plug intact. Using a Munsell color book, the 25 cm cube of soil was examined for redox features of oxidized rhizospheres, Fe-masses, and Fe-depletions with depth, and their colors, abundance and location (e.g., on roots), and were noted in a field notebook and/or soil profile sheet. Pictures were taken of any notable features. If it was not possible to excavate the full 25 cm (due to bedrock, traffic pan, etc), a note of this was made in the field book.
4. Three bulk density cores were taken from the bottom of the 25 cm mini-pit that was
excavated. On a few occasions (e.g., shallow bedrock at Manassas), deep bulk density samples could not be taken. All bulk density samples were roughly trimmed to the ring in the field, with final trimming performed in the lab.
5. Using a soil probe, a composite sample of the 0-15 cm of soil from ten random
locations within a 10 m circle of the plot center was taken. This sample would allow for a broader comparison of soil properties across the grid locations and would address any point sample variability that might come with the point auger sample.
23
Laboratory Methods for Soils
Soils were sampled by horizon and brought to the laboratory. After the collected soil samples were air-dried, they were ground through a 2 mm sieve and stored for further chemical analysis. To assess texture, particle size analysis via the pipette method was used (Soil Survey Laboratory Staff, 1996). The dry combustion method was used to ascertain total soil C and N, (Soil Survey Laboratory Staff, 1996) and pH was determined (Virginia Cooperative Extension, 1994) on 1:1 soil:water mixtures. Bulk density was determined by the intact core method with three replications per location per horizon (Blake & Hartge, 1986). Statistical Analysis
After field sampling and laboratory analyses were completed, the resulting data were entered into a spreadsheet. Variables included in the data set were pH, %C, C:N, %sand, silt, and clay, macronutrients (P, K, Ca, Mg) and micronutrients (Zn, Mn, B, Fe, Cu), bulk density, and mass C. Mass C is an estimate of the actual total mass of carbon (Mg C ha-1) within the soil, and was calculated by using the layer based method:
Mass C (Mg ha-1) = TiυiCi[1-(δi/100)]
where Ti is the thickness (cm) of layer i, υi is the bulk density (Mg m-3) of layer i, Ci is the %C content in layer i, and δi is the percentage of rock fragments (>2 mm) in layer i.
Statistical analyses of each parameter were performed to examine whether any significant differences occurred across sites at a given depth. When comparing the surface soil variables across sites, the composite samples were used. SAS System for Windows, Version 8 (1999) was utilized to conduct statistical analyses. Analysis of variance (ANOVA), via the Fisher’s LSD approach, was used to perform multiple comparisons on all variables among sites at a given depth. The Wilcoxon Rank Sum Test was used to compare variables across sites due to non-normal data and small sample sizes. The Wilcoxon Rank Sum Test is the nonparametric equivalent to the two-sample t-test, and is generally a better test to use when dealing with non-normal data and unequal or small samples (Iman, 1994). In order to normalize the data, Tukey’s multiple comparisons on the ranks of the data were performed (Zar, 1999). Differences were considered significant when P ≤ 0.05. Field Sampling for Vegetation Three-meter radius (28.3m2) vegetation plots were established at each soil sample location, with the mini-pit at the center. The larger than normal plot size allowed for more accurate determination of the dominant vegetation at each soil sample pit. The large plot size also minimized any problems associated with trampling of the vegetation around the soil sample pit. To help determine cover estimates of individual species, each plot was then divided into four quadrants and a cover estimate was determined for each species in each quadrant. Total cover for a species was calculated as the sum of the cover value for that species from the four quadrants of the plots. Dominant species for each site were determined as those species that comprised >20% of the total cover for a given plot. The larger plot size used in this study also

24
produced a large than normal number of species in the sample plots than would normally be expected. Most of them, however, were not common (comprised less than 2% of total cover in a plot) and will not be discussed in this report. Dominant species were not determined if total vegetation cover for a plot was less than 2% (5.7 m2). The presence of a predominance of wetland vegetation (i.e. hydrophytic vegetation) for each site was determined by listing the dominant species from each plot. Next, the wetland indicator status (USFWS Plant List 1996) for each species was determined. Note that if an individual species was dominant in more than one plot within a site, it was represented on that sites list more than once. If more than 50% of the plants on a sites dominant species list were hydrophytic, then the site was considered dominated by hydrophytic vegetation (US Corps of Engineers 1987). No state, or federal, rare or endangered species were encountered during this study. When present in the plots, invasive plant species, regardless of cover, has been noted in each site write-up. All data was collected during a two-week period between May 20 and June 15, 2004, however, we visited the sites several different times. All plants within the plots were identified to species according to Radford et al. (1968), Gleason and Cronquist (1991), and Godfrey and Wooten (1979, 1981). Nomenclature follows the Flora of North America Project as cited in USDA, NRCS (2004).
Study 2: Hydrologic Variations Within Created and Natural Wetlands
in Southeastern Virginia Detailed Hydrologic Setting and Properties of Two Study Sites
Two large mitigation wetlands underwent varying phases of final construction during 2002-2004 – Sandy Bottom (SB) and Charles City (CCW) - are in landscapes where the natural hydrologic patterns are very similar. However, both the geologic settings and the methods of construction used were quite different and may have affected the hydrology of the two sites significantly.
The two study locations each include a natural and constructed wetland sites located in the middle of broad, incised Coastal Plain terraces. Classified as Mineral Soil Flat wetlands (Brinson 1993), the sites would be expected to have pocosin-like hydrology (i.e. a groundwater mound recharged solely by precipitation). Natural wetland sites adjacent to the constructed sites both display hydroperiods that are similar and representative of pocosins. However, differences in the patterns of near-surface permeability in the constructed wetlands may prove to be critical to VDOT’s ability to establish the target wetland vegetation community at the mitigation sites. These differences may stem from variations in the geologic strata, the degree of soil development, and the construction practices used.
The CCW site sits on the Shirley Formation, an alluvial unit dated between 200-400 Ka that underlies midlevel terraces along the James River (Mixon et al., 1989). Radiometric dates on Shirley material suggest an age of 200-400 Ka for the formation (Mixon et al., 1982). More than

25
24 m thick in paleochannels, the Shirley Formation contains thick beds of sand and gravel, but is capped by more than 3 m of silty clay (Johnson et al., 1987) that can be weakly cemented.
The natural wetland site at CCW is formed in the Chickahominy soil, a unit common on this surface that may have large amounts of expansive clays such as montmorillonite (Hodges et al., 1990). The forested natural wetland contains the same soils as the constructed wetland with a few exceptions (Figure 11). The A-horizon is up to 0.1 m deep at the natural site, while at the constructed site most of the A and E-horizon were removed during construction to reduce the elevation of the surface to achieve the proper hydrologic conditions. The Btg horizon present in the natural wetland is not considered compacted, although it is very dense at depth.
. . Figure 11. Diagram illustrating the relationships between soil horizons, strata, and peizometer screens at sites at CCW. Soil sample depths refer to analyses of soil density reported in Despres (2004). Left, Conditions in natural wetland site with piezometer nests CCP-3. Right, Conditions in constructed wetland with piezometer nest CCP-1.
Because 2002 was drier than average, most of the surface at the CCW constructed
wetland was dry for long periods of time. Later in 2003/2004, the constructed wetland site was regraded, and broad expanses of freshly exposed and compacted argillic (Btg) soil horizon cracked significantly. The desiccation cracks were most numerous where the soil surface was most often free of standing water.
Sandy Bottom Nature Park (SB) wetlands, formerly Chisman Lakes, in Hampton, Virginia were acidified gravel pits abandoned for several decades. In the late 1990s, the land was altered considerably and turned into the Sandy Bottom Nature Park (SB). The park sits on the Tabb Formation, a late Pleistocene unit deposited in the ancestral Chesapeake Bay that has been

26
dated at 70-120 Ka (Peebles et al., 1984). On the York-James Peninsula, the gravelly sand at the base of the formation grades upwards into a medium sand and then into a fine sandy clayey silt (Johnson et al., 1987). Based on three 30 m deep boreholes, Daniels et al. (1995) reported that the Tabb Formation at the study site is approximately 7.6 m thick, capped by a sandy silt at the surface. The natural soils at SB are dominantly comprised of the Tomotley soil series with horizons that range in texture from sand to sandy loam (Daniels et al., 1995). The large, relatively undisturbed natural wetland evaluated at this study site (Daniels et al., 1995; Whittecar and Daniels, 1999) showed no signs of compaction or cracking.
To recap, VDOT constructed two mitigation wetlands in sites with very similar landscape characteristics that should have the same regional-scale hydrologic propertied. However these two sites are on distinct Coastal Plain formations with different soil textures and degrees of soil development and constructed using very different construction techniques and materials. Comparisons of the pattern of permeability in these soils and sediments may help explain the different hydrologic responses of these materials to seasonal changes and precipitation events. Hydrologic Monitoring Methods
In order to meet the objectives of this research, we evaluated the stratigraphic setting and collected hydrologic and permeability data from critical levels in the shallow subsurface. Methods used to collect data of greatest application to concerns expressed by VDOT are reported below; explanations of methods used in analyses of soil density and hydrologic response rates are in Despres (2004). Stratigraphic Data
Based upon the quality and close proximity of sites used in previous stratigraphic studies (Johnson et al., 1987; Daniels et al., 1995; Whittecar and Daniels 1999), stratigraphic data collection for this research focused on the shallow subsurface. Stratigraphic data were gained during borehole excavation for well and piezometer installation (discussed below) at both CCW and SBNP locations. A hand auger was used and soil material was sampled at approximately every 0.15 m and described for composition and texture. Maximum borehole depths were approximately 3 m. Several other shallow boreholes were made throughout the constructed wetland sites to further explore the stratigraphy that was controlling the hydrology at these locations. Hydrologic Conditions
Hydrologic conditions of both CCW and SB were investigated by installing and monitoring wells and piezometers screened at various elevations of interest at each site. Water level data were collected at each site for approximately 0.5-1.5 years, depending on the site.
At the CCW constructed site, monitoring wells and piezometers were placed in and around the two experimental plots. A three-piezometer nest was constructed in the center of each plot. Plot 1 was topographically higher and therefore drier than plot 2, which remained wetter, perhaps because it was slightly lower (by approximately 0.06 m). The bottom of each

27
piezometer was capped and screened for 0.15 m (Figure 11). A third piezometer nest was installed in the natural wetland surrounding the newly constructed site at CCW. In addition, four monitoring wells were installed at the corners of each experimental plot. Each one was installed to a depth ranging from 1.22-1.83 m. The wells were screened from the bottom of the well to the ground surface.
At the SB natural site, three-piezometer nests were installed at two locations, sites 201 and 213 that were previously used by Daniels and others (1995). The SBNP constructed site also had two three-piezometer nests installed within it – SB-1 and SB-2. All piezometers were screened at the bottom 0.15 m. Each monitoring well and piezometer casing was positioned in the augured hole and sand placed in the annular space surrounding the casing to cover over the screened portion of the casing. Excavated material was used to fill in the remaining annular space. Bentonite was then be used to seal around the top of the casing. All piezometers were constructed using 0.04 m diameter schedule 40 polyvinyl chloride (PVC) pipe and screen.
Riser heights were measured and recorded for all wells and piezometers as the length from the surface of the ground to the highest point of the casing. At the CCW site, an arbitrary datum was established at 10.668 m (35.00 ft) above mean sea level (MSL). All well and piezometer top-of-casing (TOC) elevations for both the natural and constructed sites were established from this datum using a CST/Berger surveying level (SAL Series 28X). The TOC elevations of the piezometers at the SBNP reference sites were determined using the elevation of two existing wells from a previous study and surveyed in from these known elevations. At the SBNP constructed site, the TOC elevation of piezometer SB-1A was established at 7.62 m (25.00 ft) above MSL. All five remaining piezometers were referenced from this elevation.
We measured water levels of all wells and piezometers biweekly using a 30.48 m (100 ft) Slope Indicator water level indicator (Model Number 51453). Hourly water level sampling occurred in selected piezometers from 2/22/2004 to 5/29/2004. Continuous sampling was accomplished by installing Solinst Levelloger Model 3001 pressure transducers in the piezometers. Pressure transducers were installed in the piezometers by suspending them on a wire line at approximately 0.30 m above the bottom of the piezometer. The elevation of each transducer was determined using the TOC elevation and subtracting the distance from the top of casing to the instrument (machined line on case). Soil Saturation Conditions
Epiaquic and endoaquic soil conditions were determined by both direct and indirect methods. Direct observation of the water table level occurred as boreholes were excavated near areas that had ponding. If the water table was at the surface and therefore connected to the ponded areas, the site displayed endoaquic conditions. If the water table was significantly deeper than the surface and therefore not connected the ponding, the site was found to be epiaquic. Direct observation was only possible if the perching layer was at or just below the surface during wet conditions.
Indirect methods were used to determine soil saturation conditions using stratigraphic and biweekly hydrologic data. If stratigraphic data indicated that perching layers could be present, then it was assumed that epiaquic conditions could exist at these sites and further investigation

28
followed. However, if no perching layers were present, then it was assumed that epiaquic conditions could not exist even if the hydrologic data supported such conditions at these sites. If perching layers such as tight clay beds were found to exist over strata that may transmit water with relative ease such as a thick sand bed, this ‘aquifer’ may or may not be fully saturated. If the sand bed were fully saturated, then endoaquic conditions would exist. However, if the confined aquifer were not fully saturated, then epiaquic conditions would be demonstrated.
In this study, piezometer screen depths and strata types and thicknesses were determined, as well as hydrologic data gathered. If the upper well contained water but the middle well’s water level was below that of the upper well’s screen elevation, then epiaquic conditions were presumed. If the water level of the lower piezometer was at or above the screened portion of the upper well, then it was probable that this confined aquifer was fully saturated, indicating endoaquic conditions. The extent of the capillary fringe for the sediment type in which the middle well was screened was also used. Since the fringe is water-bearing sediment, it was also used to determine soil saturation conditions, instead of the true water level elevation of the middle well (Tiner, 1999).
Study 3: Effects of Compost Loading Rate on Mitigation Success Experimental Design
At Charles City (see Fig. 2), we selected two experimental blocks, one “dry” block (CCW-Dry) and one “wet” block (CCW-Wet), based on the presence/absence of hydrophytic vegetation and associated surface indicators of wetland hydrology. Dominant species in CCW-Dry included Lespedeza cuneata and Panicum anceps. The CCW-Dry experiment was laid out as a completely randomized design (CRD) due to the lack of any obvious soil or wetness gradient in the field. Delineation of CCW-Wet was based upon the existence of dominant hydrophytic vegetation such as Typhus angustifolia, Juncus effususi and Scirpus cyperinus. The long, linear extension of the wet block area, as well as observed lateral variability in soil and vegetation indicators, indicated that a randomized complete block design (RCBD) was most appropriate. Each experimental block was designed with twenty 4.6 x 3.0 m plots separated by 3.0 m alleyways (Figure 12). Five yard waste compost treatments, each replicated four times, were applied to both experimental blocks in order to determine the effects of increased loading rates on hydric soil processes in created wetlands. Each plot within a block received one of five organic matter loading rates (Figure 12). The loading rates were chosen to 1) bracket the currently utilized and recommended rates employed by the wetland design and construction industry, and 2) coincide with loading rates reported for other disturbed land re-vegetation studies in Virginia. Site Preparation In late June of 2002 a John Deere 1200 tractor equipped with a bush-hog removed the existing standing vegetation within the experimental blocks. The soils of both blocks were then ripped with a root rake attached to a CAT D-9 track bulldozer to a depth of approximately 15 cm. Any existing undulations were subsequently smoothed with a tractor mounted roto-tiller. In order to determine lime requirements for the block areas, pH was measured in the field with a

29
portable pH meter. All measurements for CCW-Dry and CCW-Wet yielded a pH higher than 6.0, therefore, it was not necessary to add lime to either experimental block. The yard waste compost loading rates were applied to the corresponding plots and evenly raked across each plot. A tractor mounted roto-tiller incorporated the organic matter amendment into the soil to a depth of approximately 12.5 cm. Treatments four and five were not fully incorporated into the soil due to the height and low density of the compost. In September 2002, a manually operated tiller was utilized to better incorporate treatments four and five into the plots.
Figure 12. Experimental blocks and organic matter amendment plots at CCW.
Two bottomland hardwood tree species, Betula nigra (river birch) and Quercus phellose (willow oak), were planted in the experimental plots in December of 2002 while the trees were dormant. The plots received five trees of each species, totaling ten trees per plot. The trees were arranged with 1.2 m centers in order to minimize competition and maximize the distance between each tree within a plot. After planting of the trees, each was fertilized with two 16-8-12 (N-P-K) controlled release tablets buried near the tree roots. To limit herbivory, a double 12 volt electric fence and a lower rabbit fence (the latter constructed of chicken wire) were installed around both experimental blocks.

30
Field Sampling
Measurement of soil redox potential in experimental plots occurred using five Pt electrodes inserted into the soil in a circular pattern around a saturated calomel reference electrode. The Pt electrodes were constructed according to the procedures described by Faulkner et al., (1989). The electrodes were inserted at a depth of 12.5 cm based on the average depth of organic matter amendment incorporation. A portable volt meter was used to measure the voltage of each Pt electrode. Soil temperature and pH of each plot were simultaneously measured at a depth of 12.5 cm. Field voltages were corrected to standard hydrogen electrode potentials by applying the correction factors found in Vepraskas and Faulkner (2001). A “mini-profile” of soil in each plot was thoroughly described in accordance with the National Cooperative Soil Survey procedure (Soil Survey Staff, 1994). The profiles were evaluated for texture, matrix color, structure, root abundance, and redoximorphic features. A description of each redox feature consisted of type, color, location, and percent abundance. An intact bulk density core was retrieved from the bottom of the soil profile pit following procedures described by Blake and Hartge (1986). Bulk density cores were transported to Virginia Tech Soil for analysis. The loose and friable nature of the organic matter amendment incorporated into the upper 12.5 cm of soil did not allow a surface bulk density sample to be collected with the standard core/hammer method. Instead, surface bulk density was calculated on a volumetric basis. A Trace System Model designed by Soilmoisture Equipment Corp. was used to measure soil moisture content at CCW. This model incorporates Time Domain Reflectometry (TDR) to instantaneously measure the volumetric water content of soils. Water content was measured at a depth of 15 cm and replicated three times in each plot. The initial height, total number of stems (primary and secondary), and length of stems was measured upon planting of each tree in the experimental blocks. After a year had passed, three of the five trees per species per plot were randomly selected to be measured; this time for maximum height, number and length of primary stems, and number of secondary stems. In the summer of 2003, we conducted a biomass assessment study of the experimental plots at CCW. Two 0.5 m2 PVC quadrats were randomly placed in a plot; any and all vegetation lying within the square area was cut at ground level and placed in a bag. The biomass was then transported to Virginia Tech where plant species were differentiated from one another and partitioned into identifying bags. The plant material was dried in a forced air oven at 40o C for approximately 5 days and the total weight of each species, minus the weight of the bag, was recorded. Statistical Analysis The following variables composed data sets and were statistically analyzed utilizing the SAS System for Windows, Version 8 (2001): bulk density, Eh, volumetric water content, and biomass. Analysis of variance (ANOVA) was used to perform multiple comparisons of treatments within experiments. Fisher’s LSD was utilized when significant differences occurred (p-value < 0.05) while Tukey’s multiple comparison was employed when differences were not

31
significant. Tukey’s test was also utilized to normalize any data found non-normal under the Shapiro-Wilk’s test for normality.
RESULTS
Study 1: Mitigation Site Comparative Study
Many differences in soil properties occurred across sites at a given depth. Some horizon differentiation existed at some sites, due to persisting remnant soil profiles. However, weakly developed A-C horizon profiles were described as well, which likely formed by final grading. Percent C was low at all sites and decreased with depth, as would be expected. Mass C was also low across sites, however not many differences were observed with depth. Soil pH was higher than expected at many sites, and at some sites decreased dramatically with depth. Furthermore, the 10 VDOT sites studied here were plagued with high bulk density and coarse textures (Table 2). These trends are most likely due to current construction methods, a lack of soil development time, and a general lack of appropriate soil reconstruction and deep tillage procedures.
Table 2. Average soil properties across all sites at the surface and with depth (Values within columns by depth
class followed by different letters are significantly different at P ≤ 0.05).
Site
Total Percent (%)
C Mass C (Mg/ha)
Bulk Density (g/cm3) pH
Percent (%) Clay
0-15 cm BCK 2.43a 37.8bc 1.29f 5.3e 12.5d CCW 1.08bc 19.0f 1.42de 5.3e 28.4a DC 0.76c 16.4f 1.61b 5.5de 14.9cd MAN 1.00bc 21.9ef 1.59bc 5.7cd 18.8b MATTA 1.17bc 33.1bcd 1.68b 6.2b 7.8e MTS 1.06bc 29.2cde 1.60b 5.4de 6.4e RCK 1.14bc 25.2def 1.36ef 5.8c 17.7bc SB 1.42b 40.5b 1.82a 6.6a 12.4d SCW 2.22a 42.1b 1.49cd 5.3e 12.4d SWS 2.28a 56.7a 1.46d 6.4ab 15.5bcd 30-45 cm BCK 0.54bc 33.3bc 1.74c 5.5b 21.1bcd CCW 0.19d 13.4c 1.58d 4.5c 44.3a DC 0.17d 15.0c 1.74c 5.4b 24.1bc MAN 0.18d 10.4c 1.80bc 5.4b 28.9b MATTA 0.39bcd 55.9a 1.59d 3.7c 16.2de MTS 0.33cd 17.6c 1.92a 5.0bc 10.7e RCK 0.18d 15.3c 1.61d 5.4b 26.6b SB 0.83a 48.4ab 1.89a 6.7a 20.6cd SCW 0.15d 8.9c 1.91a 5.5b 9.9e SWS 0.62ab 30.3bc 1.86ab 5.0bc 13.3e
32
Lower/Middle Coastal Plain Sites Charles City
We sampled CCW in the fall of 2002, well before the majority of the site was cut down another increment, ripped, and backfilled with a mixture of removed subsoil and organics. The soils at all sampling locations appeared to be cut Chickahominy or Newflat series soils, with the A, E, and likely some of the Bt or Btg horizon being removed. This resulted in truncated profiles usually beginning with a vegetated Btg horizon serving as the surface layer. A variable amount of “topsoil”, likely a mixture of the original A and E horizons was used as a cap (0-12 cm thick) in 50% of the soil profiles. While this cap provided a less clayey and compact growth medium, the naturally shallow A horizons of the Chickahominy and Newflat series as seen in the adjacent forested wetland (Schmidt, 2002) resulted in limited addition of organic matter and nutrients, especially after stockpiling the material. Combined with the drought prone hydrology, the low organic matter levels suggest compost or wood waste additions would potentially improve soil properties, water holding capacity, and plant survival. Redox features were observed in all the soil horizons, although most were probably relict. The presence of pore linings along some fine roots in many horizons suggests active reducing conditions. The readily apparent coarse platy structure and high bulk density (Table 2) in the upper Btg horizon most likely had a negative effect on plant growth and rooting, especially when the soil dried. This traffic pan was likely caused during the construction of the wetland and is somewhat variable in lateral extent. Samples 1-5, 7, and 10 had confirmed Hydric Soil Indicators as they all had a depleted matrix (F3). Thus while approximately 70% of the observed soils would qualify as hydric, we doubt very much that this is due to site/soil reconstruction practices per se.
Over the five years that we have worked on this site with various research programs, it has become very obvious that in dry years, the upper 0.5 m or so of this soil becomes very dry and bricklike, often with wide (> 2 cm) cracks open to the surface. In very wet years (like 2004) the site perches local surface water and remains ponded during many summer months. This altered hydrology (relative to naturally adjacent endoaquic soils) when combined with the very high levels of observed compaction and rooting limitations indicates to us that wetland mitigation success at this site will be strongly limited by combined soil-hydrologic conditions.
There were a total of 12 dominant plant species present; two were non-wetland (one Ambrosia artemisiifolia, and one Solidago speciosa v. erecta) and 10 hydrophytes (one Juncus acuminatus, four Juncus effuses, one Juncus tenuis, and four Scirpus cyperinus). Therefore, the site consisted of hydrophytic vegetation. Thirty-one plant species were collected in the vegetation plots. Average cover for the ten plots was respectable (59%). However, four of the ten plots had vegetation cover of <2% (more than likely because of recent re-grading activities) and one of the remaining plots (#9) was dominated by upland species. Invasive species included Lespedeza cuneata, Ambrosia artemisiifolia, Lolium perenne, and Typha latifolia. Control of Typha latifolia should be considered for this site.

33
Mount Stirling
Overall, the southern portion of this site tended to be much wetter than the northern section. The water table was encountered within 30 cm in samples 1-3, while most of the remaining borings indicated a local water table starting at 1.22-1.52 m. At the time of sampling, the bulk density ranged from 1.31-1.82 g/cm3 in surface soils to 1.76-2.01 g/cm3 with depth.
The soils at MTS are truncated alluvial soils capped with topsoil. Soil samples 1-3 are not very well developed, since they have loamy sand Ag horizons overlying structureless (single-grain) C horizons. The soils progressively became more variable and structured towards the northern end of the site, as relict Bt and BC horizons were present. The typical Ag horizon extended to 20 cm, was dark grayish brown, had a strong coarse granular structure, and had common to many very fine and fine roots. Strong brown pore linings were common and distinct or prominent in the A horizon. As a result, over half of the samples taken met an NRCS Hydric Soil Indicator (Table 3). Samples 1 and 2 met the sandy redox (S5) field indicator, while samples 3, 6, 9, and 10 met the depleted matrix (F3) field indicator.
There were a total of 14 dominant plant species and all were hydrophytes (nine Juncus effuses, two Lemna valdiviana, and one Typha latifolia). Therefore, the site consisted of hydrophytic vegetation. Fifty-four plant species were collected in the vegetation plots. Average cover for the ten plots was good (82%). All plots were individually dominated by hydrophytes as well. Invasive species included Lolium perenne, Oxalis europea, Phalaris arundinacea, Phragmites australis, Solanum carolinense, and Typha latifolia. Control of P. australis and Typha latifolia should be considered for this site. Table 3. Hydric soil reconstruction success in VDOT wetlands as estimated by presence of USDA-NRCS hydric soil indicators. Note: At many sites as discussed in text, indicators may be relict of previous hydrology rather than active due to active hydric soil reconstruction after site development.
Site Number of
Sampled Pedons
Number of Pedons Meeting a Hydric Soil Indicator
Percent (%) of Pedons Meeting a Hydric Soil Indicator
BCK 6 0 0 CCW 10 7 70 DC 9 4 44 MAN 10 0 0 MATTA 10 4 40 MTS 10 6 60 RCK 14 7 50 SB 9 5 56 SCW 10 4 40 SWS 6 3 50 TOTAL 94 40 43

34
Sandy Bottom
Vegetation populations at SB varied widely due to differences in age of grading, invading species, and wetness regimes. Clumps of wetland and upland species coexisted at many of the sample locations (4, 7, 9, and 10), while some locations (1 and 3) exhibited no vegetation, and others were sparse (5 and 8). Sample location 6 was the wettest site, dominated by sedges. Soil sample 2, which was dominated by cattails, could not be taken as it was inundated with water. This disparity in vegetation and local wetness was clearly due to abrupt local variations in elevation.
SB soils consisted of highly compacted, truncated marine sediments (1.59-2.09 g/cm3) capped with extremely compact topsoil (1.76-1.88 g/cm3, Figure 22). A typical pedon had a very dark gray sandy loam A horizon, with a strong fine granular structure that extended down to a depth of 12 cm. No redox features were found in the A horizon, indicating either that insufficient time has passed for these features to develop or the soil is not potentially hydric. However, underlying this topsoil was a dark grayish brown sandy loam BAg horizon. At these depths, relict redox features (common to many, distinct and prominent Fe/Mn masses and redox depletions in the matrix) from the imported fill were present. As a result, over half of the samples taken met the depleted matrix hydric soil field indicator (F3; samples 1, 3, 7, 8, 9). Underneath this BAg layer was a sandy clay loam Btg horizon, which in conjunction with the compact nature of the soil, presumably aided in the development of a depleted matrix, as the higher clay contents would impede downward water movement, and subsequently cause perching. Clay contents in deeper layers dramatically decreased, as the deeper subsoil layers tended to be loamy sands or sands.
It is important to point out that we sampled SB before the entire site grading was completed and planted, and we were told that some sort of remedial soil tillage or ripping treatment would be employed where needed. However, we were informed that the areas we sampled were at final grade and did represent the intended soil reconstruction sequence.
There were a total of 18 dominant plant species; four were non-wetland (one Ambrosia
artimisiifolia, one Eupatorium capillifolium, one Lolium perenne, and one Vicia sativa) and 14 hydrophytes (six Aster noveanglii, two Betula nigra, two members of the Carex vulpinoides group of sedges, one Diodia virginiana, two Eleocharis obtusa, and one Typha latifolia). Therefore, the site consisted of hydrophytic vegetation. Forty-seven plant species were collected in the vegetation plots. Average cover for the eleven sample plots was very good (102%). However, the site had many invasive plant species including Ambrosia artemisiifolia, Campsis radicans, Lespedeza cuneata, Lolium perenne, Melilotus officinalis, Phragmites australis, Ranunculus bulbosus, and Typha latifolia. Control of P. australis and Typha latifolia should be considered for this site. SW Suffolk/Lake Kilby
Soils at SWS varied somewhat, most likely due to the mining history of the site. Subsoil textures ranged from very coarse sand to sandy clay loam, and structure was weak to strong subangular blocky, massive, or single grain. Sample 4 had hydrogen sulfide odor with depth,
35
signifying anaerobic conditions. One morphology in common, however, was that the majority of pedons contained a gleyed matrix at depth, which indicates that SWS is a groundwater fed site. In addition, Fe/Mn masses, pore linings, and depletions in the matrix were commonly observed. Bulk density in the subsoils ranged from 1.67-1.99 g/cm3. The water table at this site was encountered at depths of 1.22-1.52 m.
Despite the differences observed in subsoil layers, the topsoil capping was similar at all sampling locations. The sandy loam A horizon was characterized as having a very dark gray to black color; a direct result of the high levels of organic materials mixed into the topsoil. This friable reconstructed topsoil extended to an average depth of 19 cm, had many very fine and fine roots, and bulk densities that ranged from 1.23-1.69 g/cm3. Common Fe masses and few pore linings were observed in the A horizon. Hydric soil field indicators were found at some locations. Samples 7 and 9 met the depleted matrix (F3) field indicator, while sample 2 met the hydrogen sulfide (A4) indicator.
Several small (<100 m2) pockets of dead vegetation and bare soil did occur at SWS, indicating the presence of acid sulfate soils. Some remediation should take place to raise the pH of these dead spots, as spot sampling results indicated a bulk soil pH of 2.8. However, this should not be a major concern as long as the soils remain saturated, which will help to keep sulfur in its reduced state.
There were a total of 16 dominant plant species; five were non-wetland (one Eragrostis pilosa, one Lolium perenne, and three Trifolium pratensis) and 11 hydrophytes (six Agrostis stolonifera [seeded during planting], one Juncus effusus, and four Typha latifolia). Therefore, the site consisted of hydrophytic vegetation. Thirty-seven plant species were collected in the vegetation plots. Average cover for the eleven sample plots was 88.8%. The site had many invasive species including Ambrosia artemisiifolia, Lespedeza cuneata, Lolium perenne, Melilotus officinalis, Oxalis europea, Phalaris arundinacea, Ranunculus bulbosus, Typha latifolia, and Vicia sativa. Control of Typha latifolia should be considered for this site.
Middle/Upper Coastal Plain Sites Mattaponi
At the time of soil sampling (May, 2002), MATTA had not yet received its final seeding and planting, so we returned in 2003 to complete the vegetation survey. Topographic variation was designed into the site, with alternating scroll bands with approximately 15-25 cm difference between crests and swales. The soils at MATTA were fairly similar to each other, yet there were variations likely associated with different depths of excavation and/or variation in underlying sediments as we moved away from the Mattaponi River. All sampling locations were capped with topsoil mixed with wood mulch, as seen and in stockpiles onsite. Below this cap, there usually were alluvial gravelly or sandy horizons. In locations where augering through deeper profiles was not inhibited by wet cobble or sand layers that caved in, a dark gray deposit with common mica flakes was observed at approximately 25 cm. In several cases, white shell fragments were also found in the deepest parts of this reduced layer. Because some of the locations (5-8) had gray colors within 25 cm, they met the depleted matrix (F3) hydric soil

36
indicator. Acid sulfate materials were exposed in the cut banks around the site and were generating very low pH (<4.0) conditions with some acidified runoff evident.
While returning topsoil with organic matter additions should improve mitigation success, it also can lead to certain soil problems. The mixing and stockpiling of the topsoil appeared to have destroyed aggregation and created a massive replaced A horizon with high bulk density (1.68 g/cm3). Although this may improve with time as soil structure develops, compaction may be a concern in the short-term, especially on the drier islands where high bulk density is more likely to directly limit rooting and rainfall infiltration.
There were a total of 14 dominant plant species; all were hydrophytes (nine Juncus effuses, two Lemna valdiviana, and three Typha latifolia). Therefore, the site was dominated by hydrophytic vegetation. Thirty-one plant species were collected in the vegetation plots. Average cover for the ten plots was low for an immature forested wetland (43.7%). All plots were individually dominated by hydrophytes. Invasive species included Microstegium vimineum, Typha latifolia, and Xanthium strumarium. Control of Typha latifolia using cutting and herbicide was underway at the site during this study. Stony Creek
The Stony Creek site (SCW) was constructed from an old gravel mine and features a large pond in the intersection of the two arms of the L-shaped wetland. It was difficult to find similarities between the soil profiles onsite, likely due to the history of sand and gravel mining. One common feature was the hard, compact, and often platy surface horizon. This high bulk density horizon is likely a traffic pan, and may pose longer term problems for rooting. For sampling locations 1-3, organic material (compost or ground wood waste) was added to the surface soil. This reduced the bulk density to 0.75-1.43 g/cm3 compared to 1.63-1.95 g/cm3 for samples 4-6 (Figure 22), and reconfirms the value of organic amendments and appropriate tillage/incorporation for ameliorating high bulk densities from wetland construction. Four out of 6 samples met a hydric soil indicator. Because sample 3 had a sulfur odor within 30 cm of the surface, it met the hydrogen sulfide (A4) soil indicator. Sample 4 exhibited the sandy redox (S5) indicator, while 5 and 6 contained a depleted matrix (F3).
There were a total of 7 dominant plant species; all were hydrophytes (one Echinochloa crus-galli, five Eleocharis obtusa, and one Salix nigra). Therefore, the site was dominated by of hydrophytic vegetation. Nineteen plant species were collected in the vegetation plots. Average cover for the six sample plots was respectable for a semi-mature forested wetland (72.8%). All plots were individually dominated by hydrophytes. A large number of important hydrophytic woody species (e.g., Fraxinus pensylvanica, Salix nigra, and Taxodium distichum) were present in a semi-mature state. There were only two invasive plant species (Anthoxanthum odoratum and Lespedeza cuneata). Both were found on the upland/wetland margin and did not appear to spreading into the wetland vegetation.

37
Piedmont/Triassic Sites Butcher Creek
The soils at BCK consist of a truncated alluvial subsoil layer capped by a topsoil layer. A representative pedon had an A horizon that extended to a depth of 15 cm, had a silt loam texture, and consisted of a strong coarse granular structure. In addition, many very fine roots were present, and prominent, dark reddish brown pore linings were common in the A horizon. Sampling locations 5 and 6 had the darkest A horizons, while the rest of the locations were typically brown or dark yellowish brown. Because locations 5 and 6 were closest to the road, it is most likely that the topsoil was stockpiled in these areas and then spread out to the rest of the site. Bulk densities in surface soils ranged from 0.98-1.59 g/cm3.
Although the surface horizon was rather uniform throughout the site, subsurface soils tended to be much more variable. Matrix colors include many hues of brown, and textures ranged from silt loam to clay loam to sandy loam. Soil structure was described as either weak to strong coarse subangular blocky or massive. Sampling locations 1, 4, and 5 exhibited the most horizon differentiation, as they consisted of 4-5 horizons. A gravel bed was encountered in sample 2, while samples 3 and 6 were underlain by massive C horizons. As a result, bulk density in subsurface horizons ranged from 1.62-1.87 g/cm3 . Many types of redox concentrations (Fe/Mn masses, Fe concretions and Mn nodules, pore linings) and depletions (in matrix and along pores) were found in all soil horizons, although those below the replaced A are most likely relict. While redox features were apparent at this site, no NRCS defined Hydric Soil Indicators were met (Table 3).
There were a total of 3 dominant plant species; one was non-wetland (one Potentilla canadensis) and two hydrophytes (one Betula nigra and one Diodia virginiana). Therefore, the site consisted of hydrophytic vegetation. Twenty-one plant species were collected in the vegetation plots. Average cover for the ten sites was very low (19.7%) 5 and may have been the result of resent heavy flooding. Only two plots had a vegetation cover >2%; large areas had been swept clean of vegetation and wracks of debris were found throughout the site. Therefore, it is in question that the vegetation data taken during this study was truly representative of the sites successional vegetation community. The site had many invasive plant species including Ambrosia artemisiifolia, Campsis radicans, Lolium perenne, Potentilla canadensis, Typha latifolia, and Valerianella locusta. Control of Typha latifolia should be considered for this site. Dick Cross
The vegetative patterns at DC follow the contours of the topographic variations in the wetland design, where the wetland is divided into cells separated by slightly higher bands (approximately 10 cm higher). The mitigation area with the “oxbow feature” (sample 5) was inaccessible for soil sampling due to the high water in the oxbow. The soils at Dick Cross consist of truncated alluvial subsoil capped by a topsoil layer. Pre-existing (relict) Fe-masses and depletions were common in the subsoil of the soil profiles. Active redox features, namely pore linings along some roots in the A horizon, were only seen in the wetter portions of the wetland (samples 1, 7, 9, and 10). Similar to other mitigation wetlands, most pedons exhibited

38
high bulk densities (1.61 in surface; 1.74 g/cm3 in subsurface), likely associated with construction traffic. Samples 3 and 7-9 had NRCS Hydric Soil Indicators with a depleted matrix (F3).
There were a total of 10 dominant plant species; 2 were non-hydrophytes (one Lespedeza cuneata and one Panicum ancepts) and eight were hydrophytes (one Eleocharis obtusa, one Juncus effusus, one Juncus tenuis, one Paspalum floridanum, and one Typha latifolia). Therefore, the site consisted of hydrophytic vegetation. Twenty-three plant species were collected in the vegetation plots. Average cover for the ten plots was low (43.1%). All plots were individually dominated by hydrophytes as well. The site had many invasive species including Sorghum halepense and Typha latifolia. The former appeared to be a problem in the upland/wetland transition zone while the latter was common in the wet site areas. Spread of Typha latifolia is presently being controlled on the site with cutting and herbicide application.
Manassas
There are large portions (approximately 40-50%) of MAN dominated by upland species, such as lespedeza (samples 1, 3, 4, 7, and 9), while other areas have typical wetland vegetation such as reeds, sedges, and cattails as detailed below. The area where Cockrell Branch enters the wetland (sample 5) is especially wet and characterized by hummocks of reeds and standing water. At the time of sampling (July, 2002), beavers may have contributed to the drier than anticipated site by diverting water from the northern portions of the wetland. Plans were being made to return the flow to the wetland and some additional grading. There also have been some problems with erosion surrounding the wetland.
A common characteristic of MAN is shallow red shale/siltstone bedrock (20-94 cm) underlying a variably compacted soil. A typical profile had an A horizon over compact red clay subsoil with some redox features, such as Fe-depletions in the subsoil or pore linings in the surface. Nevertheless, no hydric soil indicators were present, which is a common issue for natural wetlands in Triassic landscapes due to problems with detecting redox depletions these soils. Similar to other mitigation sites, soil compaction is a concern in many areas of the wetland, with an average subsurface bulk density of 1.80 g/cm3. An exception to these high bulk density soils was the wetter cattail-dominated sample area 10. This particular sampling location had abundant roots to a depth of 13 cm, which may have helped improve surface soil conditions.
There were a total of 17 dominant plant species; one was a non-hydrophyte (one Panicum ancepts) and 16 were hydrophytes (one Bidens frondosa, two Juncus acuminatus, seven Juncus tenuis, one Lindernia dubia, one Ludwigia palustris, two Scirpus cyperinus, one Typha angustifolia, and one Typha latifolia). Therefore, the site consisted of hydrophytic vegetation. Average cover for the ten plots was low (46.1%) for a young forested wetland. All plots were individually dominated by hydrophytes as well. Forty-nine species were collected from the vegetation plots. The site had many invasive species including Campsis radicans, Festuca elatior, Lespedeza cuneata, Lonicera japonica, Potentilla canadensis, Typha angustifolia, and Typha latifolia. Control of Typha latifolia should be considered for this site.

39
Reedy Creek
This site is relatively flat, with some depressional areas that contained emergents. Berms bisect section B and C, where lespedeza and other upland species have proliferated as detailed below. In the southern portion of Section A (sample 12), water was ponded at the surface. Due to the saturated conditions, deep bulk density samples could not be taken here. The northern part of A was slightly higher in elevation. The southern area of Section B and C was wetter than the northern portion, since it was lower in elevation and closer to the water table.
The soils at RCK were truncated alluvial soils capped with topsoil, with the exception of sample location 9, which must have been overlooked when topsoil was re-spread over the site. The most common feature among samples was the presence of a strong coarse angular blocky sandy clay loam layer located immediately below the A horizon. The angularity and compaction of this layer was probably a result of compaction through construction practices, as was done intentionally in Areas B and C to create a perching layer. The bulk densities with depth ranged from 1.34-1.87 g/cm3. Underneath this layer, the clay content dropped dramatically, as loamy sands and sands with high mica contents were observed at 1 m and deeper. Prominent Fe/Mn masses and redox depletions in the matrix were commonly detected.
The sandy loam to loam topsoil layer was commonly dark grayish brown to light olive brown, and contained many very fine and fine roots. Prominent Fe/Mn masses and distinct to prominent strong brown pore linings were common, while few redox depletions in the matrix were observed. Bulk densities of the surface horizon ranged from 1.17-1.58 g/cm3. Hydric soil field indicators were found in some of the sample locations. Samples 1, 3 - 5, 7, 8, and 13 met the depleted matrix (F3) field indicator. Samples 7 and 13 also met the Fe/Mn masses (F12) field indicator.
There were a total of 24 dominant plant species; all were hydrophytes (three Alisma subcordatum, six members of the Carex vulpinoides group, two Echinochloa walteri, two Eleocharis obtusa, one Juncus effusus, one Ludwigia decurrens, three Ludwigia palustris, one Polygonum pensylvanicum, one Scirpus atrovirens, and one Typha latifolia). Therefore, the site was dominated by hydrophytic vegetation. Thirty-nine species were identified in the plots. Average cover for the fourteen sample plots was moderately low for an immature forested wetland (57.2%). The low cover was probably due to invasive species control: the sit had recently been cutover to control for Typha latifolia. All plots were individually dominated by hydrophytes. The site had numerous invasive species including Ambrosia artemisiifolia, Oxalis europea, Potentilla canadensis, Richardia brasiliensis, and Typha latifolia. Control of Typha latifolia is currently underway at the site. Overall Occurrence of Hydric Soil Indicators
Although the depleted matrix indicator was met at some of the soil locations, it is doubtful that they formed under their current conditions. According to Vepraskas et al. (1999), it takes at least five years for a depleted matrix to form. Since all of the sites had not reached that age by the time they were sampled, it can be said with reasonable certainty that those soils were already depleted when the wetland was created. Soil excavation just brought them closer to the

40
surface, which resulted in meeting a Hydric Soil Indicator. Assuming that regardless of their active vs. relict status, the presence of NRCS Hydric Soil Indicators would be used for regulatory determination of hydric soils, Table 3 summarizes the overall success of hydric soil reconstruction in VDOT wetlands.
Study 2: Hydrologic Variations Within Created and Natural Wetlands
in Southeastern Virginia
Overall, the results of the stratigraphic and the permeability analysis revealed notable differences between the study sites. Some of these differences may explain the variations in hydrologic response exhibited by the piezometers. Stratigraphic Data
At the CCW location, the natural and constructed sites are both dominated by a thick Bt horizon formed in Chickahominy silt clay loam profiles. However, the natural site has a 0.08 m thick organic-rich A-horizon while this horizon is absent in many areas of the constructed site. Regrading at the constructed site removed 0.4 to 0.6 m of natural soil including the A-horizon and as much as 0.5 m of the B horizon. Over the entire CCW constructed site, much of the surface was amended with organic matter during regrading activities in late 2003. However, many other areas were not amended, leaving the compacted argillic B-horizon as the surface.
At the SB location, there were several major differences between the soils of the constructed and natural sites. As seen in Figure 13, the natural site consisted of a relatively uniform sandy loam, overlain by an argillic Bt-horizon. At the constructed site, material that was used to fill in the lakes varied in grain size and texture. The result was the creation of an artificial stratigraphic profile that consisted of a very compacted sandy loam at the surface, underlain by several sand looser layers interbedded with thin clay lenses throughout. Below the alternating clay/sand layers, at a depth of approximately 2.6 m, was a much more massive clay bed of at least 0.5 m in thickness (limit of hand auger). To determine the extent of the relatively clean sands present between the compacted surface and tight clay at depth, several boreholes were made around the piezometer nest SB-2. These borings indicated that the buried sand strata extend in at least 5 m in all directions from SB-2. Of particular note is that the sand layers extended from SB-2 to the surface water canal 20 m to the west. The sand beds outcropped along the side and bottom of the canal.

41
. Figure 13. Diagram illustrating the relationships between soil horizons, strata, and peizometer screens at sites at SB. Soil sample depths refer to analyses of soil density reported in Despres (2004). Left, Conditions in natural wetland site with piezometer nests 201 and 213. Right, Conditions in constructed wetland with piezometer nest SB-2.
Hydrologic Conditions Biweekly Data
The hydrographs of biweekly data at all piezometers at CCW show the upper piezometer water level was consistently higher than that of the middle and lower piezometers (Figs. 15 and 16). This vertically ‘stacked’ pattern of the hydrograph implies downward movement of water, which is indicative of an area of recharge. The three piezometers nests had the same hydrologic patterns in that all piezometers tended to respond at or about the same time and in the same direction throughout the sampling period.
The SB natural site piezometer data showed two distinct hydrologic patterns. In Figure 14, piezometer nest 201 showed a pattern indicative of an area of through-flow where groundwater was moving laterally rather than vertically. However, the piezometer nest 213 demonstrated a stacked pattern that indicates this is an area of recharge, and thus closer to the top of the groundwater dome in this pocosin. At the SB constructed site, hydrologic data for the piezometer nests (SB-1 and SB-2) were extremely variable (Figs. 17 and 18). Both nests demonstrated periods when the area acted as a recharge zone and then other times when water was moving upward through the soil profile.

42
Hourly Data
Similar conditions were seen in the hourly data hydrographs and the hydrographs of the biweekly data. At the CCW site, data from the CCP-3 piezometer nest in the natural wetland demonstrated a recharge pattern between the upper and middle piezometers (Figure 18) that was also seen in the biweekly data hydrograph. Water levels below the instrument were recorded as no data and appear as a discontinuous hydrograph line.
At the SB site, piezometer nest 213, which located in the natural wetland demonstrated nearly the same “stacked” hydrologic pattern between the upper and lower piezometers that indicates recharge conditions. At the SB constructed site the three piezometers of SB-2 demonstrated the same variable patterns among the piezometers that were seen in the biweekly hydrograph data (Figure 19). The upper piezometer, SB-2A, tended to remain dry throughout much of the sampling period except during wetter periods. The middle piezometer, SB-2B, tended to exhibit a ‘flashy’ pattern while SB-2C, the lower piezometer had relatively constant water levels, showing slight response to wetter periods, especially when the water level in SB-2B was high.
Figure 14. Hydrograph of biweekly data from piezometers that illustrate long-term recharge conditions and variations in soil saturation conditions at the natural wetland site (CCP-3) at CCW. The dotted line marks the top of the (potentially) saturated fringe, as suggested by the middle piezometer values. Note that during the recharge season (Nov-Apr) hydraulic heads in subsurface soil horizons and the saturated fringe rise higher than the screen of the upper piezometer. During these periods, the soils would be endoaquic; during other periods, water levels in horizons near the surface appear to be “perched” suggesting epiaquic conditions.

43
Figure 15. Hydrographs of biweekly data from piezometers that illustrate long-term recharge conditions and variations in soil saturation conditions at the constructed wetland sites (CCP-1 and CCP-2) at CCW. The dotted line marks the top of the (potentially) saturated fringe, as suggested by the middle piezometer values. Top, At CCP-1, note that during most of the year hydraulic heads in subsurface soil horizons and the saturated fringe rise higher than the screen of the upper piezometer. During these periods, the soils would be endoaquic. Bottom, At CCP-2, most periods of the time monitored exhibited epiaquic conditions.

44
Figure 16. Hydrographs of biweekly data from piezometers that illustrate soil saturation conditions at natural wetland sites (201 and 213) at SB. The dotted line marks the top of the saturated fringe, as suggested by the deep piezometer values. Note that during the recharge season (Oct-Apr) hydraulic heads in subsurface soil horizons and saturated fringe rise higher than the screen of the shallow piezometer. During other periods, water levels in horizons near the surface were below the screen of the shallow piezometer. Thus during the entire time period monitored, the soils displayed endoaquic conditions.
Figure 17. Hydrographs of biweekly data from piezometers that illustrate soil saturation conditions at constructed wetland sites (SB-1 and SB-2) at SB. The dotted line marks the top of the saturated fringe, as suggested by the intermediate piezometer values. Note that during the recharge season (Jan-Apr) hydraulic heads in subsurface soil horizons and the saturated fringe rise higher than the screen of the shallow piezometer. During other periods, water levels in horizons near the surface were below the screen of the shallow piezometer. Thus during the entire time period monitored, these indirect hydrologic data suggest that the constructed wetland soils displayed endoaquic conditions. As discussed in the text, though, direct observations of dry soil horizons sampled in boreholes directly next to surface puddles indicate that epiaquic conditions actually are very common here.

45
Figure 18. Hydrographs of hourly data from piezometers and of rainfall at CCW sites. Left, Fluctuations in the natural wetland nest (CCW-3). Note the middle piezometer (1.72 m deep) shows minor changes following recharge events. Right, Fluctuations in the “dry plot” in the constructed wetland nest (CCW-1) that experienced significant cracking. Note the middle piezometer (1.70 m deep) shows very rapid and significant responses following recharge events.
Figure 19. Hydrographs of hourly data from piezometers and of rainfall at SB sites. Left, Fluctuations in the natural wetland nest (213). Note the lower piezometer (2.70 m deep) shows rapid and only slightly muted changes following recharge events. Right, Fluctuations in the constructed wetland nest (SB-2) located in highly stratified sediments. Note the upper piezometer (0.49 m deep) is in compacted fine sediments that are saturated for limited periods only after rainfall events. The middle piezometer (1.80 m deep) is in a sand bed connected to a neighboring water-filled canal that was pumped lower episodically. The lower piezometer (2.68 m deep) is in compacted fine sediments that show muted and delayed hydrologic responses to the head changes in the overlying sand bed.

46
Study 3: Effects of Compost Loading Rate on Mitigation Success
Soil Parameters The addition of organic matter to mineral soil increases soil aggregation, thereby increasing porosity (Stevenson, 1994; Buol et al., 1997). A high porosity, or percentage of pore space, contributes to low bulk densities and high water holding capacity (both on a weight and volume basis). Surface bulk density in CCW-Dry and CCW-Wet significantly decreased with an increase in organic matter loading rate up to the addition of 224 Mg/ha (treatment 4 in Figure 20). Surface bulk densities did not differ between treatments 4 and 5 in both CCW-Dry and CCW-Wet, indicating a maximum treatment effect in relation to bulk density at the addition of 224 Mg/ha of organic matter amendment. Significant differences were not present between treatments in either CCW-Dry or CCW-Wet for subsurface bulk density samples collected at a depth of 25-30 cm below the surface.
cc
bb
a
dd
c
ba
0.0
0.5
1.0
1.5
2.0
0 56 112 224 336
Treatment (Mg/ha)
Bul
k de
nsity
(g/c
m3)
CCW-Dry
CCW-Wet
Figure 20. Results for mean surface bulk density in relation to organic matter loading rate in CCW-Dry and CCW-Wet. Means followed by differing letters by experiment are significantly different at P < 0.05. As described above, soil organic matter content affects soil moisture. Although significant differences between treatments were generally not present in the CCW-Dry experiment, an evident pattern occurred over the three sampling dates (Figure 21). In the first three organic matter treatments, volumetric soil moisture slightly increased with an increase in loading rate. Soil moisture consistently decreased from treatment 3 to treatment 4 and proceeded to increase from treatment 4 to treatment 5. In two out of the three sampling dates, treatment 3 yielded the highest soil moisture. This trend is most likely due to the substantial elevation increase associated with higher loading rates present in treatments 4 and 5. Treatments 4 and 5 were consistently observed above the saturated soil level while the lower rate treatments were below the saturated zone.

47
a
a
aa
a
bbbb
a
a
a
aa
a
0.0
10.0
20.0
30.0
40.0
50.0
60.0
70.0
0 56 112 224 336
Treatment (Mg/ha)
% S
oil M
oist
ure
2/11/2003
7/23/2003
5/8/2004
Figure 21. Results for mean soil moisture content for CCW-Dry. Means followed by differing letters for each date are significantly different at P < 0.05. Significant differences (p-value < 0.05) in soil moisture occurred between treatments in the CCW-Wet experiment. Volumetric soil moisture increased linearly with increasing compost loading rates (Figure 22). These results were expected due to the known absorption and water holding capacity of organic matter (Stevenson, 1994). Under saturated conditions, such as those present in CCW-Wet, an increase in soil organic matter is obviously conducive to an increase in soil moisture.
c
bb
aa d
cdbcb
a
cbcbab
a
0.0
10.0
20.0
30.0
40.0
50.0
60.0
70.0
80.0
90.0
0 56 112 224 336
Treatment (Mg/ha)
% S
oil M
oist
ure
2/11/2003
7/23/2003
5/8/2004
Figure 22. Results for mean % moisture per treatment for CCW-Wet. Means followed by differing letters for each date are significantly different at P < 0.05.

48
Redox potential (EH) is a quantitative measurement of the tendency of a soil to reduce or oxidize substances based on electron availability (Faulkner et al., 1989; Stanturf and Shoenholtz, 1998). As a soil becomes more reduced, moving down the sequence of electron acceptors, the EH decreases. Soil reduction continues in saturated soils as long as a 1) an adequate microbial population exists, 2) a food supply (most commonly organic matter) is present, and 3) the ambient temperature is above biological zero (Bouma, 1983). Aside from adequate hydrology, a palatable organic matter source is the most important factor for reduction to occur in soils (Vepraskas and Sprecher, 1997). EH decreased in treatments 56 and 112 Mg/ha in both experimental blocks, but increased again at higher loading rates (Table 4). These findings indicate that the lower treatments (1 and 2) appear optimal for the reduction of substances. An increase in EH in the higher treatments can most likely be contributed to an increase in elevation with the addition of higher loading rates of organic matter. As elevation increases, the soil is exposed to oxidizing conditions, thereby decreasing the potential for reduction to occur. Table 4. Mean Eh results for CCW-Dry and CCW-Wet. Means followed by differing letters for each date are and experiment are significantly different at P < 0.05.
Treatment Mg/ha ----------------------------Sampling Dates--------------------------------- 3/4/2003 5/13/2003 3/7/2004 5/7/2004 11/18/2004
CCW-Dry-1 0 218.7a 621.7b 557.2a 373.4ab 636.1b CCW-Dry-2 56 197.2a 593.6b 551.8a 272.3a 572.2a CCW-Dry-3 112 182.4a 581.1ab 543.2a 262.0a 581.2a CCW-Dry-4 224 366.2b 527.3a 561.0a 460.1b 572.3a CCW-Dry-5 336 410.3b 527.3a 563.6a 472.2b 562.7a CCW-Wet-1 0 158.3a 335.8ab 238.8a 163.3a 149.1a CCW-Wet-2 56 118.8a 241.5a 280.5a 185.7a 156.6a CCW-Wet-3 112 128.9a 303.8a 255.9a 170.3a 147.5a CCW-Wet-4 224 172.7ab 452.9b 313.6a 203.9a 196.3a CCW-Wet-5 336 235.5b 488.7b 315.8a 294.9b 257.0b
Redoximorphic features are the visible result of the reduction, movement, and
oxidation of Fe and Mn in saturated soils. In reduced soils, Fe and Mn oxides that impart soil color dissolve in water, resulting in a gray matrix. The reduced forms of Fe and Mn are water soluble and therefore free to move with soil water to other horizons (Vepraskas, 1999). As the soil receives new supplies of oxygen, the reduced Fe-Mn compounds oxidize and form a “mottled” soil appearance. The presence of active redoximorphic features indicate hydric soil development. Treatment 2 produced the greatest concentration of active redox features to a depth of 25 cm. Active soil redox features in the upper 15 cm increased from ~2-10% in treatment 1 to ~20% in treatment 2, and ~20-30% in treatment 3. Active soil redox features decreased in the upper 15 cm to ~2-5% in treatment 4 and ~0-2% in treatment 5. The lack of redox features in the upper 15 cm of higher treatments is most likely due to a combination of 1) increased surface elevation and 2) the masking of redox features due to a black matrix imparted by the organic matter amendment.

49
Vegetation Response to Compost Additions
The living portion of the soil depends on decomposition of soil organic matter (SOM) for a supply of essential nutrients and energy (Ugolini and Edmonds, 1983). An increase in net primary production (NPP) of plant biomass leads to SOM accumulation and therefore a source of nutrients for developing plant and microbial communities. Results from the biomass study conducted in the summer of 2003 revealed a linear increase in total biomass with an increase in loading rate for the CCW-Wet experiment (Figure 23). Total biomass in CCW-Dry steadily increased from treatment 1 to treatment 4 and then slightly decreased from treatment 4 to treatment 5. It was expected for total biomass to increase as organic matter loading rates increased due to improved water and nutrient availability.
0
100
200
300
400
500
600
700
800
0 56 112 224 336
Treatment (Mg/ha)
Bio
mas
s (g
)
CCW-Dry
CCW-Wet
Figure 23. Mean biomass results for organic matter treatments in CCW-Dry and CCW-Wet.
DISCUSSION
Study 1: Mitigation Site Comparative Study
Detailed evaluation of reconstructed soil conditions across the ten recently constructed mitigation sites revealed that in general, most mitigation site soils are still severely compacted. Critical root-limiting bulk densities range from > 1.45 g/cm3 in fine textured soils to around 1.75 g/cm3 in coarse textured soils (Brady and Weil, 2003). These critical levels were exceeded in the subsoils at most sites, and in the topsoils of many. In natural soils, adverse rooting effects of high bulk density and soil strength are offset by aggregation and soil structure development that allows roots to pass downward via interconnected macro-pores around dense ped interiors. However, virtually all of the mitigation site soils that we observed in this study were described as structureless-massive with very limited structural development; many also contained root limiting platy structure in their subsoils or at the topsoil/subsoil contact. High bulk density and

50
poor aggregation also directly limit bulk porosity, water holding, and infiltration. In combination, these density related functions negatively impact annual soil wetness (hydroperiod) and lead to very dry and hot soil conditions in mid-summer months after local water tables drop or perched surface water evaporate away.
At the close of our study, we met together to review and analyze all available data sets for the ten study sites with the goal of assigning a qualitative assessment of mitigation success for each site. Our relative rankings for each site are given in Table 5, and reflect our combined scientific opinion as to the probability that each site will develop into the type or mix of wetlands that was intended by permit requirements. This assessment is obviously subjective and required us to predict combined long-term soil and vegetation succession pathways based upon our collective short-term data sets and insights. Overall, we assigned the highest probability of mitigation success to the Stony Creek and Suffolk By-pass sites and the lowest probabilities to Charles City, Sandy Bottom and Mattaponi. However, it is important to point out that these estimated probabilities are based upon the site conditions at the time sampled. All three of the latter sites received substantial soil remedial soil treatments and/or hydrologic adjustments since they were sampled. We should also point out that our review of these sites largely focused on their probability of successful development into forested wetlands, which would be particularly sensitive to the subsoil density and altered seasonal hydrologic patterns discussed earlier. It is quite possible that considerable areas at a number of these sites (e.g., Mattaponi) will develop into non-forested wetlands of various types (e.g., emergent and/or shrub/scrub).
Study 2: Hydrologic Variations Within Created and Natural Wetlands in Southeastern Virginia
Variations in patterns of hydrologic response to recharge events were caused by several
factors. Seasonal hydrologic fluctuations were common in all the hydrologic data for the natural and constructed sites at CCW and SB. These fluctuations were the direct result of the amount of precipitation and rate of evapotranspiration. During dry times of the year, from July through September where evapotranspiration often exceeds precipitation, piezometer levels were relatively low. During wetter times of the year, from January through March when evapotranspiration is very low, piezometer levels were generally high.
Diurnal hydrologic fluctuations were common at the natural wetland sites adjacent to CCW and SB. Fluctuations that were occurring at this scale were the result of evapotranspiration by trees where during daylight hours, trees pull water out of the ground and release it into the atmosphere. At night, after vegetation has stopped transpiring, groundwater levels recover. Diurnal fluctuations that occurred in the natural setting were the result of evapotranspiration. Diurnal fluctuations only occurred in one case at the SB constructed site and were the result of high barometric efficiency between the atmosphere and the aquifer.
The rate of hydrologic response of various aquifers to individual rainfall events reflects the overall permeability of the aquifers and their hydrologic position within the wetland system. Aquifers with high permeability, from either primary porosity (e.g., sand) or secondary porosity (e.g., clay loam with cracks), transmitted water rapidly, and slowed in the most pronounced

51
hydrologic fluctuations. The long-term decline of water levels after recharge events also reflected the permeability of the regional aquifer. The wetlands formed on higher permeability aquifer systems (e.g., SBNP) pass water more readily to underlying groundwater systems than those on lower permeability systems (e.g., CCW).
Table 5. Overall evaluation of mitigation success at ten study sites. Site Name Score/10* Comments on soils/vegetation/hydrology Butcher Creek 8.0 Soils: Good for density and C in upper 25 cm. Veg: 2/3 adequate; 1/3 not Hydro: Good, over-bank issues? Charles City 2.0 Soils: Poor, high density and clay; low C over many Veg: 70% hydrophytic; correct types? Hydro: Duration of hydroperiod is ok; too dry in summer Dick-Cross 7.0 Soils: Suffer from variable compaction; texture ok Veg: Wetter areas ok; dry ridges too dry Hydro: Appears ok, but very complex Manassas 5.5 Soils: Compact, low C, highly variable Veg: Strongly mixed by zones; much is ok Hydro: Variable by zones; certain areas too dry Mattaponi 4.0 Soils: Compact, low C in many areas, acid-S Veg: Hard to assess; wet zones are too wet, etc.. Hydro: Too wet; needs adjustments; SW section better. Mt. Stirling 8.0 Soils: Some are quite compact and low C; some areas better. Veg: Good across most of site Hydro: Good except on shelves/steps Reedy Creek Not Rated Soils: Appear adequate, some compaction. Veg: cannot assess yet rigorously Hydro: Need site hydro data sets; appears adequate. Sandy Bottom 4.0 Soils: Very compact, much more clay than native Veg: Cannot assess yet rigorously
Hydro: Will be dissimilar from native ground; need to keep water in canoe trails high.
Stony Creek 9.0 Soils: Moderate density and C in upper 25 cm. Veg: Good overall Hydro: Good overall and similar to natural sites Suffolk Bypass 9.0 Soils: Low density and very high C in upper 25 cm. Veg: Very good overall Hydro: Good, may be wetter than natural ground?
Average of 9 sites: 6.3 *The cumulative score is based upon our collective “opinion” of the probability that the overall site would succeed into its designated wetland type and functions within several decades of our evaluation. Thus, the score of 8/10 indicates we feel that Butcher Creek has an 80% probability of meeting mitigation goals.

52
Natural forested landscapes on broad terraces made of stratified sediment (e.g., Mineral Soil Flats of Brinson, 1995) maintain hydric soil conditions and ecologic sustainability by a combination of factors. These include
�� sufficient precipitation year-round, but particularly during months with low evaportranspiration
�� inefficient downwards groundwater seepage, maintained by very low lateral hydraulic
gradients and topographic slopes and by the presence at depth of moderately low permeability strata or soils with deep subsoil horizons of moderately low permeability
�� sufficient soil-water storage capability within soil horizons in the upper subsoil and
surface horizons to provide support for vegetation survival during period of high ET
�� sufficiently low soil density to permit root penetration
�� sufficient quantities of soil organic carbon to support microbial activity and generate reducing conditions in the soil
�� sufficient microtopography with a wide range of drainage conditions to promote plant
propagation and permit development of a variety of ecological microenvironments Construction practices used in mitigation wetlands produce significant effects on the
permeability and hydrologic response of fine-grained soils. Hydrologic differences found between the CCW natural and constructed sites clearly illustrate several of these effects. The CCW natural site displayed both endoaquic and epiaquic conditions at different times of the year. During the drier times of the year, such as during the summer, the CCW constructed and natural sites displayed epiaquic conditions. During the wetter periods such as during the winter and early spring, these sites displayed endoaquic conditions. The sites displayed temporal variations in soil saturation characteristics as well, although different areas of the site displayed different conditions. The differences in saturation conditions and the differences of occurrence and duration of epiaquic status may be a result of the how the surface was constructed. Graded surfaces that were not ripped or amended but simply scraped, usually had a perching layer at the surface and were predominantly epiaquic. Ripped and amended surfaces may ultimately loosen the surface to the ripping limit, allowing the surface to hold water better. However, these areas may still become epiaquic at different times of the year where a low permeability Btg-horizon still exists below the ripped zone. At the CCW constructed site, the combination of moderately expansive clay soils and unusually dry weather resulted in extensive soil cracking on the newly graded surface at all but the wettest areas. These particular conditions altered the permeability of the surface layer by allowing direct access of water through the perching layer.
Practices used in constructing wetlands with stratified multi-textured soils, such as at SB, make patterns of permeability and hydrologic response that differ significantly from the surrounding loamy natural soils. The SB wetland site was constructed by filling in an existing lake with a variety of coarse to fine-grained sediment types. The finer-grained clay-rich layers became extremely compacted during construction. Strata in the upper 2 m of the constructed SB

53
site displayed extreme groundwater fluctuations. Subsurface sandy beds connected to the surface water canal system responded rapidly to changes in the canal water levels. Rainfall response at the constructed site was variable, but was generally slower in the upper (compacted) portion of the soil profile than in the natural (loamy) wetland. The clay layers most likely impede vertical flow and therefore act as perching layers. Endoaquic and epiaquic conditions were both observed at this site. Epiaquic conditions may occur both at the surface and within the subsurface. At the SB constructed site, the low permeability fine-grained cap that was compacted during grading may act as a perching layer and force precipitation to run off rather than infiltrate. However, the highly permeable sand units that connect the canal system to the subsurface of the wetland influence available groundwater in the wetland.
Cracking at the CCW constructed site had significant effects on the hydrology of the site. Initially, it was assumed that the site would have a slow precipitation response much like the natural site, especially at depth. However, the subsurface of constructed site responded rapidly. Rapid response was most likely the result of the influence that secondary porosity had on the site. The severe cracking that was observed was likely transmitting water through the surface to the subsurface very rapidly and therefore much more influential than primary porosity. The removal of the A-horizon and the exposure of the expansive clay-containing Btg-horizon altered the hydrology of this site considerably from the hydrology displayed at the natural site. During times of the year when little precipitation fell, the surface was allowed to dry out and crack. Cracking created a conduit for water to travel from the surface to the subsurface with relative ease.
The data collected during this study show that several factors can affect the hydrology of both natural and constructed pocosin wetland sites. Significant climatic influences include evapotranspiration, seasonal precipitation variations, and diurnal barometric pressure fluctuations. Geologic factors include landscape position, regional aquifer characteristics, stratigraphic variations in shallow sediments and soils, and both primary and secondary porosity. Construction practices affect hydrology via scraping surface soils, layering and compaction of sediments, deep ripping, and the addition and mixing of organic material into the final wetland surface. The result of these influences is that both natural and constructed sites demonstrated endoaquic and epiaquic conditions, which varied both spatially and temporally.
Assessments in the future will need to determine if the hydrologic and compositional differences noted at CCW and SBNP significantly influence the establishment and rate of development of the desired forested wetland community at these sites.
Study 3: Effects of Compost Loading Rate on Mitigation Success
Results from the organic matter loading rate study at the CCW site clearly point out the
positive influence that appropriate organic matter additions can have on the reconstruction of hydric soils in VDOT mitigation wetlands. When added and incorporated adequately, this palatable organic amendment drives the feeding web in wetland soils from detritivores down through final microbial decomposers, resulting in accumulating humus and an active microbial biomass. The bulk water content of the soil is increased due to aggregation and pore space enhancement by humic substances and the direct water adsorption of the added organics. The higher bulk water content coupled with oxygen consumption by the microbial decomposers
54
quickly leads to lowered redox potential and biogeochemical reduction of Fe and Mn, which subsequently generates redoximorphic features in the soil. These results directly confirm and amplify earlier findings by Stolt et al. (1998; 2000) and Cummings (1999) regarding the importance of adding organic matter to developing soils in young mitigation sites.
Overall, it is clear from the CCW experiments that these mitigation site soils had a practical loading rate limit of approximately 100 to 150 Mg/ha, beyond which we simply could not fully and adequately incorporate the added amendment. Over the first two years of our experiments, this added surface elevation actually increased oxygen diffusion rates and associated redox potentials, which presumably is a negative result. However, by the end of the 2004 growing season, most of this added excess organic matter had settled to a large extent, and very positive vegetation response was noted to these higher organic loading rates. Thus, in the short-term it is clear that approximately 100 Mg/ha of organic amendment is optimal for initial hydric soil reconstruction efforts in Virginia. From a longer-term perspective, however, even higher loading rates may also be advantageous if cost or logistics are not limiting.
Recently published COE/DEQ (2004) regional guidance suggests that all mitigation sites should be amended with sufficient organic amendments to bring their soil organic matter content to approximately 5%. It is important to point out that this soil organic matter target reflects an ideal situation that would more than likely take a number of years to achieve and is probably not economically or practically achievable via one-time application of organic amendments. For example, under standard assumptions of soil density and organic loadings, our optimal rate of compost loading (112 Mg/ha) actually supplies 5% fresh organic material on a dry weight basis to the upper 15 cm of soil. However, it is also well documented (Schmidt, 2002) that at least 50% of the added organic matter will be lost as CO2, CH4, and water via natural decomposition process within two years after placement. Longer-term organic matter turnover studies (reviewed by Schmidt, 2002) indicate that a maximum of 35% of the initial mass of added organic amendments will be retained over the long term as stable soil humus. Therefore, the intent of organic matter amendments such as we are discussing here should be to provide for an appropriate soil environment that will lead to high bulk water contents and low redox potentials. This combined soil physical, chemical and microbial environment will then lead to enhanced organic matter accumulation and an appropriate hydric soil succession over time. Finally, it is also clear from our experimental results at CCW that you really cannot adequately incorporate higher organic amendment loading rates.
Collectively, our findings over the past decade clearly indicate that even when mitigation site soils stay saturated for extended periods during the growing season, low redox conditions and associated hydric soil features do not necessarily form. This is most likely due to a combination of heavy compaction that directly limits rooting and essential rhizosphere redox processes, coupled with low overall microbial activity due to low organic matter content. Thus, the combined effects of adding and incorporating an appropriate organic amendment such as in the studies reported here directly overcomes both of these limitations, at least in the critical surface soil layer.
It should be noted that our experiments at CCW did not directly study the differential effects of deep ripping and loosening compacted subsoils on the establishment and growth of

55
appropriate wetland vegetation. While it is true that subsoil rooting limitations per se would probably have a limited effect on herbaceous vegetation, subsoil compaction will definitely limit the overall rooting volume and long-term production of woody species. One obvious operational limitation to ripping and tillage in mitigation wetlands is the fact that in order for rippers, chisel plows or other implements to effectively shatter compacted soil, it must be fairly dry. Wet soils simply deform plastically around the tillage implement as it pulls through them, drastically limiting the loosening effect on adjacent bulk soil. This requires that the site must be adequately dewatered for several weeks prior to ripping/tillage, and in many instances limits this procedure to the late summer or early fall dry season. This in turn obviously requires considerable advance planning and oversight during mitigation site construction. Regardless, the relative effects of different ripping depths, frequencies, and implements upon wetland soils, hydrology and the resultant performance of wetland vegetation over multiple seasons deserves further study.
As indicated by the results of our study of the ten recently constructed VDOT wetlands, a fairly wide array of organic amendments plus topsoil reconstruction practices have been employed by VDOT in recent years. At certain sites (e.g., SWS), large amounts of incorporated organic amendments have generated a relatively loose, well-aggregated and high organic matter surface soil that is quite similar to natural hydric soils. At other locations, organic amendments have not been employed at all and/or low organic matter content topsoils have been returned with mixed results. We feel strongly that a reasonable target organic matter content (as discussed above) should be established for all constructed mitigation sites, and then a site-specific combination of topsoil return coupled with appropriate organic amendment should be employed to reach that target over time. While this approach is now required by recent COE/DEQ (2004) guidance, the exact loading rates and methods to be employed to reach long-term soil organic matter targets have not.
Currently available organic soil amendment products include a wide array of stabilized/ composted wood and yard wastes, various municipal and industrial water treatment sludges, minimally processed/chipped wood mulch, various bark mulches, sawdust of varying decomposition states, and a wide array of animal manure based products. The availability and cost of these various organic amendments varies considerably statewide due to local market conditions and haul distances. To be conservative, we intentionally chose a high quality wood waste derived compost product for our experiments at CCW and Shirley Plantation, and the direct application of our results to sites using quite different organic amendments (e.g., papermill sludge compost) would need further study.
CONCLUSIONS
Heavy subsoil compaction and low surface soil organic matter contents continue to limit
hydric soil reconstruction success in the majority of recently constructed mitigation wetlands. This is despite a decade of reporting on these issues by the scientific community and widespread recognition and acknowledgment of these problems by VDOT and wetlands regulatory community. Soil compaction also drastically alters the seasonal wetness regime (hydroperiod) of mitigation wetlands relative natural wetlands.

56
Addition of appropriate rates (100 to 150 Mg/ha) of high quality organic matter amendment to reconstructed soils in VDOT mitigation sites has a wide array of positive effects on hydric soil development processes, surface soil wetness regime, and the response and vigor of hydrophytic vegetation. Addition of higher rates of organic amendments, where practical, may actually result in negative short-term soil and vegetation response.
RECOMMENDATIONS Reconstructing Appropriate Hydric Soil Conditions in Mitigation Wetlands 1. A complete hydric soil reconstruction plan should be developed for all VDOT constructed
wetland mitigation sites that includes specific procedures for remediating construction related compaction in both subsoil and replaced topsoil layers and returns sufficient organic matter to the topsoil layer over time to support the long-term development of hydric soil conditions.
2. Specific engineering plans for each mitigation site should include remedial ripping or tillage
of the subsoil layer to target bulk density levels (1.4 g/cc for clays to 1.75 g/cc for sands; or lower) before final topsoil or soil amendments. These activities should be integrated into the overall site grading and development plans and accomplished when the soil is as dry as possible to maximize tillage shatter of compacted zones.
3. Appropriate organic matter additions should be coupled with existing soil organic matter
stocks to generate a soil that will store and accumulate additional organic matter via natural hydric soil processes over time. In most instances, addition of organic amendments at rates greater than 150 Mg/ha is not warranted nor practical.
4. Additional studies that compare various available ripping/tillage regimes, depths, frequencies
and implements under varying mitigation site soil moisture conditions are needed. 5. Further research into the location, economics, rates, and properties of varying organic
amendments across Virginia and their application to VDOT mitigation site needs is also warranted.
Reconstructing Appropriate Hydrologic Conditions in Created Wetlands in Same Landscape and Geologic Settings Studied
1. Assure that deep subsoil conditions retard vertical seepage. These conditions will depend
upon a combination of many factors being balanced, including strata or soil permeability and duration of saturation in the deep subsoil. Depending upon conditions at the site, this goal might be accomplished in several ways, including identification or construction of fine-grained strata or thick soil horizons that will retard downward seepage, and construction of level with ponds at the lower end of the created wetland to slow the lateral drainage of groundwater from the deep subsoil throughout much of the site.

57
2. Develop a thick zone of moderate permeability at the surface. The permeability and thickness needed will depend upon a combination of factors including desired degree of water table fluctuation, local average precipitation and ET conditions, amount of seepage passing downward through the underlying aquitard, and elevation and lateral distance to the nearest regional groundwater drain. Depending upon site conditions, this goal might be accomplished in several ways, including addition of sediment with moderate permeability (e.g., sandy loam), and/or deep ripping of compacted or consolidated high density sediments or soil horizons.
COSTS AND BENEFITS ASSESSMENT
Federal and state regulations with regard to protecting wetlands mandate compensation for dredging and filling of protected non-tidal wetlands. This generally entails the construction of new "mitigation wetlands" that must replace both the form and function of the originally disturbed systems. These construction efforts are typically very expensive (typically around $100,000 per ha or, in some cases, even more). Adverse soil properties such as low organic matter content and compaction may be significant factors in the poor performance of many wetland restoration efforts. This research study developed optimal organic matter loading rates and recommendations for remedial tillage to maximize the probability of a successful restoration. The generation of these rates, as well as the other reconstruction guidelines developed in this study, will help ensure that VDOT complies with existing mitigation regulations in the most cost-effective manner.
REFERENCES
Bishel-Machung, L., R. P. Brooks, S. S. Yates, and K. L. Hoover. Soil properties of reference
wetlands and wetland creation projects in Pennsylvania. Wetlands 16:532-541. 1996. Blake, G.R. and K.H. Hartge. Bulk density. In A. Klute (ed.), Methods of Soil Analysis. Part 1:
Physical and Mineralogical Methods, 2nd Edition, 9: 363-382, ASA-SSSA, Madison, WI. 1986.
Bouma, J. Hydrology and soil genesis of soils with aquic moisture regimes. pp. 253-281. In L.P Wilding, N.E. Smeck, and G.F. Hall (eds.) Pedogenesis and Soil Taxonomy. I. Concepts and Interactions. Elsevier Science Publishers B.V., Amsterdam, The Netherlands. 1983. Brady, N.C. and R.R. Weil. The Nature and Properties of Soils, 11th ed. Prentice Hall, Saddle
River, NJ, 2002. Brinson, M.M. A hydrogeomorphic classification for wetlands. Technical Report WRP-DE-4,
U.S. Army Engineer Waterways Experiment Station, Vicksburg, MS, 1993.

58
Buol, S.W., F.D. Hole, R.J. McCracken, and R.J. Southard. Soil Genesis and Classification. 4th ed. Iowa State University Press, Ames. 1997.
Cummings, A.R. An analysis of palustrine mitigation wetlands in the Virginia Coastal Plain.
M.S. thesis, Virginia Tech, Blacksburg. 1999. COE/DEQ, Norfolk District Corps and Virginia Department of Environmental Quality
Recommendations for Wetland Compensatory Mitigation Including Site Design, Permit Conditions, Performance and Monitoring Criteria. July 2004.
http://www.nao.usace.army.mil/Regulatory/Annotated_Corps-DEQ_Mit_7-04.pdf. Daniels, W.L., A. Cummings, M. Schmidt, N. Fomchenko, G. Speiran, M. Focazio and M. Fitch.
Wetland water balance studies: 1994-1998. Virginia Transportation Research Council, Charlottesville. 2000.
Daniels, W.L., Genther M., Whittecar G.R., Hodges B., Nagle S. Hydrogeology and Soils of
Chisman Lakes Gravel Pit Wetlands Mitigation Site. Fieldtrip Guidebook, Virginia Association of Professional Soil Scientists Workshop. 1995.
Despres, A.D. Hydrologic variations within created and natural wetlands in southeastern
Virginia. Unpublished M.S. thesis, Department of Ocean Earth and Atmospheric Sciences, Old Dominion University. 2004.
Elder, Jr., J.H. Soil Survey of Prince William County, VA. USDA-SCS in cooperation with
Virginia Polytechnic Institute and State Univ. U.S. Gov. Print. Off. Washington, DC. 1989. Faulkner, S.P., W.H. Patrick, Jr., and R.P. Gambrell. Field techniques for measuring wetland soil
parameters. Soil Science Society of America Journal 53:883-890. 1989. Gleason, H. A. and A. Cronquist. 1991. Manual of Vascular Plants of Northeastern United
States and Adjacent Canada. New York Botanical Garden, Bronx, New York. Godfrey, R. K. and J. W. Wooten. 1979. Aquatic and wetland plants of the southeastern United States: Monocotyledons. The University of Georgia Press, Athens, Georgia. Godfrey, R. K. and J. W. Wooten. 1981. Aquatic and wetland plants of the southeastern United
States: Dicotyledons. The University of Georgia Press, Athens, Georgia. Griffin, R.W., Starowitz S.M., Wilding, L.P. Wetness Conditions and Redoximorphic Features
in a Microtoposequence on the Texas Coast Prairie. In: M.C. Rabenhorst, J.C. Bell, and P.A. McDaniel (eds.) Quantifying Soil Hydromorphology. SSSA Special Publication Number 54. SSSA, Madison, WI, 151-172. 1998.
Hodges, R.L., Thomas, P.J., Edmonds, W.J. Supplemental Data for Soil Survey of Charles City
County, Virginia. VAES Bulletin 90-3. 1990.

59
Hurt, G.W., P.M. Whited, and R.F. Pringle (eds.). Field Indicators of Hydric Soils in the United States. USDA Natural Resources Conservation Service. Fort Worth, TX. 1998.
Iman, R.L. A Data-Based Approach to Statistics. Wadsworth Pubs. Belmont, CA. 1994. Johnson, G.H., Ward L.W., Peebles P.C., Stratigraphy and Paleontology of Pliocene and
Pleistocene deposits of southeastern Virginia. In: G.R. Whittecar (ed.) Geological Excursions in Virginia and North Carolina. Southeastern section- GSA 36th annual meeting. Norfolk, VA. 1987.
Jurney, R.C. and E.F. Henry. Soil Survey for Mecklenburg County, VA. USDA-SCS in
cooperation with the Virginia Agricultural Experiment Station. U.S. Gov. Print. Off., Washington, DC. 1956.
Mixon, R.B., Szabo B.J., Owens, J.P., Uranium-series dating of mollusks and corals, and age of
Pleistocene deposits, Chesapeake Bay area, Virginia and Maryland. USGS paper 1067-E, 1-18. 1982.
Mixon, R.B., Berquist, C.R., Newell, W.L., Johnson, G.H., Geologic Map and Generalized
Cross-Sections of the Coastal Plain and adjacent parts of the Piedmont, Virginia. USGS Map I-2033. 1989.
Orndorff, Z.W. and W.L. Daniels. Delineation and Management of Sulfidic Materials in Virginia
Highway Corridors. Final Contract Report VTRC 03-CR3, Virginia Transp. Research Council, Charlottesville, 2002.
Peebles, P.C., Johnson G.H., Berquist C.R., The middle and late Pleistocene stratigraphy of the outer coastal plain, Southeastern Virginia. Virginia Minerals, 30:13-22. 1984.
Rader, E.K., and N.H. Evans (Eds.). Geologic map of Virginia-Expanded explanation. Virginia
Division of Mineral Resources, 1993. Radford, A. E., H. E. Ahles, and R. E. Bell. 1968. Manual of the vascular flora of the Carolinas. University of North Carolina Press, Charlotte, North Carolina. SAS. SAS System for Windows, Version 8, SAS Institute Inc., Cary, NC. 1999. Schmidt, J.M., Litter decomposition in created and adjacent forested wetlands of the Coastal
Plain of Virginia. M.S. Thesis. Virginia Polytechnic Inst. and State Univ., Blacksburg, VA. 278 pp. 2002.
Soil Science Society of America, 2004. www.soils.org. Soil Survey Staff. 1994. National Soil Survey Handbook. USDA-SCS. Washington, DC. Soil Survey Laboratory Staff. Soil Survey Laboratory Methods Manual. USDA-NRCS-NSSC
Soil Survey Investigations Report No. 42. U.S. Gov. Print. Office, Washington DC. 1996.

60
Standturf, J.A. and S.H. Schoenholtz. Soils and landforms. pp. 123-147. In M.G. Messina and W.H. Conner (eds.) Southern Forested Wetlands: Ecology and Management. Lewis Publishers, Washington, DC. 1998. Stevenson, F.J. Humus Chemistry: Genesis, Composition, Reactions. 3rd ed. John Wiley & Sons, New York. 1994. Stolt, M.H., M.H. Genthner, W.L. Daniels, V.A. Groover and S.M. Nagle. Quantifying Fe, Mn,
and carbon fluxes in palustrine wetlands. p. 25-42 In: M.L. Rabenhorst et al. (Eds.), Quantifying Soil Hydromorphology. SSSA/ASA Special Publication, Amer. Soc. Agron., Madison, WI. 1998.
Stolt, M.H., M.H. Genthner, W.L. Daniels, V.A. Groover, S.M. Nagle, and K.C. Haering.
Comparison of soil and other environmental conditions in constructed and adjacent palustrine reference wetlands. Wetlands 20: 671-683. 2000.
Tiner, R.W., Wetland Indicators. CRC, Boca Raton, 392 pp. 1999. Ugolini, F.C. and R.L. Edmonds. Soil Biology. pp. 193-231. In L.P Wilding, N.E. Smeck, and
G.F. Hall (eds.) Pedogenesis and Soil Taxonomy. I. Concepts and Interactions. Elsevier Science Publishers B.V., Amsterdam, The Netherlands. 1983.
US Corps of Engineers. 1987. Corps of Engineers Wetland Delineation Manual. Technical Report Y-87-1, Army Engineers Waterway Experiment Station, Vicksburg, Mississippi. USDA, NRCS. 2004. The PLANTS Database, Version 3.5 (http://plants.usda.gov). National
Plant Data Center, Baton Rouge, LA 70874-4490 USA US Fish and Wildlife Service Plant list. 1996.
(http://www.sac.usace.army.mil/permits/national.pdf) Vepraskas, M.J. Redoximorphic Features for Identifying Aquic Conditions. Tech. Bull. 301. NC
Agric. Exp. Sta., Raleigh, NC. 1992. Vepraskas, M.J., S.J. Teets, J.L. Richardson, and J.P. Tandarich. Dynamics of hydric soil
formation across the edge of a created deep marsh. Wetlands 19: 78-89. 1999. Vepraskas, M.J. Morphological features of seasonally reduced soils. pp. 163-182. In J.L.
Richardson and M.J. Vepraskas (eds) Wetland Soils: Genesis, Hydrology, Landscapes, and Classification. Lewis Publishers, Washington, DC. 2001.
Vepraskas, M.J. and S.P. Faulkner. Redox chemistry of hydric soils. p. 85-105. In J.L.
Richardson and M.J. Vepraskas (eds) Wetland Soils: Genesis, Hydrology, Landscapes, and Classification. Lewis Publishers, Washington, DC. 2001.

61
Virginia Cooperative Extension. Laboratory Procedures. Virginia Tech Soil Testing and Plant Analysis Laboratory. Pub. 452-881. Virginia Tech, Blacksburg, VA. 1994.
Whittecar, G.R., Daniels W.L., Use of hydrogeomorphic concepts to design created wetlands in
southeastern Virginia. Geomorphology. 31:355-371. 1999. Zar, J.H. Biostatistical Analysis. 4th Edition. Prentice-Hall, Inc. Upper Saddle, NJ. 1999.