
Standard Test Method for Measurement of Fracture...
46
Designation: E 1820 – 01 Standard Test Method for Measurement of Fracture Toughness 1 This standard is issued under the fixed designation E 1820; the number immediately following the designation indicates the year of original adoption or, in the case of revision, the year of last revision. A number in parentheses indicates the year of last reapproval. A superscript epsilon (e) indicates an editorial change since the last revision or reapproval. 1. Scope 1.1 This test method covers procedures and guidelines for the determination of fracture toughness of metallic materials using the following parameters: K, J, and CTOD (d). Tough- ness can be measured in the R-curve format or as a point value. The fracture toughness determined in accordance with this test method is for the opening mode (Mode I) of loading. 1.2 The recommended specimens are single-edge bend, [SE(B)], compact, [C(T)], and disk-shaped compact, [DC(T)]. All specimens contain notches that are sharpened with fatigue cracks. 1.2.1 Specimen dimensional (size) requirements vary ac- cording to the fracture toughness analysis applied. The guide- lines are established through consideration of material tough- ness, material flow strength, and the individual qualification requirements of the toughness value per values sought. 1.3 The values stated in SI units are to be regarded as the standard. The values given in parentheses are for information only. 1.4 This standard does not purport to address all of the safety concerns, if any, associated with its use. It is the responsibility of the user of this standard to establish appro- priate safety and health practices and determine the applica- bility of regulatory limitations prior to use. NOTE 1—Other standard methods for the determination of fracture toughness using the parameters K, J, and CTOD are contained in Test Methods E 399, E 813, E 1152, E 1290, and E 1737. This test method was developed to provide a common method for determining all applicable toughness parameters from a single test. 2. Referenced Documents 2.1 ASTM Standards: E 4 Practices for Force Verification of Testing Machines 2 E 8 Test Methods for Tension Testing of Metallic Materials 2 E21 Test Methods for Elevated Temperature Tension Tests of Metallic Materials 2 E 399 Test Method for Plane-Strain Fracture Toughness of Metallic Materials 2 E 813 Test Method for J Ic , A Measure of Fracture Tough- ness 2 E 1152 Test Method for Determining J-R Curves 2 E 1290 Test Method for Crack-Tip Opening Displacement (CTOD) Fracture Toughness Measurement 2 E 1737 Test Method for J-Integral Characterization of Frac- ture Toughness 2 E 1823 Terminology Relating to Fatigue and Fracture Testing 2 E 1921 Test Method for Determination of Reference Tem- perature, T o , for Ferric Steels in Transition Range 2 E 1942 Guide for Evaluating Data Acquisition Systems Used in Cyclic Fatigue and Fracture Mechanics Testing 2 3. Terminology 3.1 Terminology E 1823 is applicable to this test method. 3.2 Definitions: 3.2.1 compliance [LF -1 ], n— the ratio of displacement increment to load increment. 3.2.2 crack displacement [L], n—the separation vector be- tween two points (on the surfaces of a deformed crack) that were coincident on the surfaces of an ideal crack in the undeformed condition. 3.2.2.1 Discussion—In this practice, displacement, v, is the total displacement measured by clip gages or other devices spanning the crack faces. 3.2.3 crack extension, Da [L], n—an increase in crack size. 3.2.4 crack-extension force, G [FL -1 or FLL -2 ], n—the elastic energy per unit of new separation area that is made available at the front of an ideal crack in an elastic solid during a virtual increment of forward crack extension. 3.2.5 crack size, a [L], n—a lineal measure of a principal planar dimension of a crack. This measure is commonly used in the calculation of quantities descriptive of the stress and displacement fields, and is often also termed crack length or depth. 3.2.5.1 Discussion—In practice, the value of a is obtained from procedures for measurement of physical crack size, a p , original crack size, a o , and effective crack size, a e , as appro- priate to the situation being considered. 3.2.6 crack-tip opening displacement (CTOD), d [L], n—the crack displacement due to elastic and plastic deforma- tion at variously defined locations near the original (prior to an application of load) crack tip. 1 This test method is under the jurisdiction of ASTM Committee E08 on Fatigue and Fracture and is the direct responsibility of Subcommittee E08.08 on Elastic- Plastic Fracture Mechanics Technology. Current edition approved June 10, 2001. Published August 2001. Originally published as E 1820 - 96. Last previous edition E 1820 - 99a. 2 Annual Book of ASTM Standards, Vol 03.01. 1 Copyright © ASTM International, 100 Barr Harbor Drive, PO Box C700, West Conshohocken, PA 19428-2959, United States. COPYRIGHT 2003; ASTM International Document provided by IHS Licensee=MIT Libraries/6110146001, User=, 10/10/2003 10:08:20 MDT Questions or comments about this message: please call the Document --``,,,,``,,,,,```,``,`,``,``,,-`-`,,`,,`,`,,`---
Transcript of Standard Test Method for Measurement of Fracture...

Designation: E 1820 – 01
Standard Test Method forMeasurement of Fracture Toughness 1
This standard is issued under the fixed designation E 1820; the number immediately following the designation indicates the year oforiginal adoption or, in the case of revision, the year of last revision. A number in parentheses indicates the year of last reapproval. Asuperscript epsilon (e) indicates an editorial change since the last revision or reapproval.
1. Scope
1.1 This test method covers procedures and guidelines forthe determination of fracture toughness of metallic materialsusing the following parameters:K, J, and CTOD (d). Tough-ness can be measured in theR-curve format or as a point value.The fracture toughness determined in accordance with this testmethod is for the opening mode (Mode I) of loading.
1.2 The recommended specimens are single-edge bend,[SE(B)], compact, [C(T)], and disk-shaped compact, [DC(T)].All specimens contain notches that are sharpened with fatiguecracks.
1.2.1 Specimen dimensional (size) requirements vary ac-cording to the fracture toughness analysis applied. The guide-lines are established through consideration of material tough-ness, material flow strength, and the individual qualificationrequirements of the toughness value per values sought.
1.3 The values stated in SI units are to be regarded as thestandard. The values given in parentheses are for informationonly.
1.4 This standard does not purport to address all of thesafety concerns, if any, associated with its use. It is theresponsibility of the user of this standard to establish appro-priate safety and health practices and determine the applica-bility of regulatory limitations prior to use.
NOTE 1—Other standard methods for the determination of fracturetoughness using the parametersK, J, and CTOD are contained in TestMethods E 399, E 813, E 1152, E 1290, and E 1737. This test method wasdeveloped to provide a common method for determining all applicabletoughness parameters from a single test.
2. Referenced Documents
2.1 ASTM Standards:E 4 Practices for Force Verification of Testing Machines2
E 8 Test Methods for Tension Testing of Metallic Materials2
E 21 Test Methods for Elevated Temperature Tension Testsof Metallic Materials2
E 399 Test Method for Plane-Strain Fracture Toughness ofMetallic Materials2
E 813 Test Method forJIc, A Measure of Fracture Tough-ness2
E 1152 Test Method for DeterminingJ-R Curves2
E 1290 Test Method for Crack-Tip Opening Displacement(CTOD) Fracture Toughness Measurement2
E 1737 Test Method for J-Integral Characterization of Frac-ture Toughness2
E 1823 Terminology Relating to Fatigue and FractureTesting2
E 1921 Test Method for Determination of Reference Tem-perature, To, for Ferric Steels in Transition Range2
E 1942 Guide for Evaluating Data Acquisition SystemsUsed in Cyclic Fatigue and Fracture Mechanics Testing2
3. Terminology
3.1 Terminology E 1823 is applicable to this test method.3.2 Definitions:3.2.1 compliance [LF−1], n— the ratio of displacement
increment to load increment.3.2.2 crack displacement [L], n—the separation vector be-
tween two points (on the surfaces of a deformed crack) thatwere coincident on the surfaces of an ideal crack in theundeformed condition.
3.2.2.1 Discussion—In this practice, displacement,v, is thetotal displacement measured by clip gages or other devicesspanning the crack faces.
3.2.3 crack extension,Da [L] , n—an increase in crack size.3.2.4 crack-extension force, G [FL−1 or FLL−2], n—the
elastic energy per unit of new separation area that is madeavailable at the front of an ideal crack in an elastic solid duringa virtual increment of forward crack extension.
3.2.5 crack size, a [L], n—a lineal measure of a principalplanar dimension of a crack. This measure is commonly usedin the calculation of quantities descriptive of the stress anddisplacement fields, and is often also termed crack length ordepth.
3.2.5.1 Discussion—In practice, the value ofa is obtainedfrom procedures for measurement of physical crack size,ap,original crack size,ao, and effective crack size,ae, as appro-priate to the situation being considered.
3.2.6 crack-tip opening displacement (CTOD),d [L] ,n—the crack displacement due to elastic and plastic deforma-tion at variously defined locations near the original (prior to anapplication of load) crack tip.
1 This test method is under the jurisdiction of ASTM Committee E08 on Fatigueand Fracture and is the direct responsibility of Subcommittee E08.08 on Elastic-Plastic Fracture Mechanics Technology.
Current edition approved June 10, 2001. Published August 2001. Originallypublished as E 1820 - 96. Last previous edition E 1820 - 99a.
2 Annual Book of ASTM Standards, Vol 03.01.
1
Copyright © ASTM International, 100 Barr Harbor Drive, PO Box C700, West Conshohocken, PA 19428-2959, United States.
COPYRIGHT 2003; ASTM International
Document provided by IHS Licensee=MIT Libraries/6110146001, User=, 10/10/200310:08:20 MDT Questions or comments about this message: please call the DocumentPolicy Group at 1-800-451-1584.
--``,,,,``,,,,,```,``,`,``,``,,-`-`,,`,,`,`,,`---

3.2.6.1 Discussion—In this test method, CTOD is the dis-placement of the crack surfaces normal to the original (un-loaded) crack plane at the tip of the fatigue precrack,ao. In thistest method, CTOD is calculated at the original crack length,ao, from observations away from the crack tip.
3.2.6.2 Discussion—In CTOD testing, dIc [L] is a value ofCTOD near the onset of slow stable crack extension, heredefined as occurring atDap = 0.2 mm (0.008 in.) + 0.7dIc.
3.2.6.3 Discussion—In CTOD testing, dc [L] is the value ofCTOD at the onset of unstable crack extension (see 3.2.17) orpop-in (see 3.2.17) whenDap<0.2 mm (0.008 in.) + 0.7dc. Thedc corresponds to the loadPc and clip-gage displacement vc. Itmay be size-dependent and a function of test specimengeometry.
3.2.6.4 Discussion—In CTOD testing, du [L] is the value ofCTOD at the onset of unstable crack extension (see 3.2.28) orpop-in (see 3.2.17) when the event is preceded byD ap >0.2mm (0.008 in.) + 0.7du. Thedu corresponds to the loadPu andthe clip gage displacement vu. It may be size-dependent and afunction of test specimen geometry. It can be useful to definelimits on ductile fracture behavior.
3.2.6.5 Discussion—In CTOD testing, dm [L] is the value ofCTOD at the first attainment of a maximum load plateau forfully plastic behavior. Thedm corresponds to the loadPm andthe clip gage displacementvm. It may be size-dependent and afunction of test specimen geometry. It can be useful to definelimits on ductile fracture behavior.
3.2.6.6 Discussion—In CTOD testing, []dc[L] character-izes the CTOD fracture toughness of materials at fractureinstability prior to the onset of significant stable tearing crackextension. The value of []dc c determined by this test methodrepresents a measure of fracture toughness at instability with-out significant stable crack extension that is independent ofin-plane dimensions. However, there may be a dependence oftoughness on thickness (length of crack front).
3.2.7 effective thickness, Be [L] , n—for side-grooved speci-mens Be = B − (B − B N)2/B. This is used for the elasticunloading compliance measurement of crack length.
3.2.7.1 Discussion—This definition is different from thedefinition of effective thickness in Test Method E 813.
3.2.8 effective yield strength,sY [FL−2] , n—an assumedvalue of uniaxial yield strength that represents the influence ofplastic yielding upon fracture test parameters.
3.2.8.1 Discussion—It is calculated as the average of the0.2 % offset yield strengthsYS, and the ultimate tensilestrength,sTS as follows:
sY 5~sYS1 sTS!
2 (1)
3.2.8.2 Discussion—In estimatingsY, influences of testingconditions, such as loading rate and temperature, should beconsidered.
3.2.9 J-integral, J [FL−1], n—a mathematical expression, aline or surface integral that encloses the crack front from onecrack surface to the other, used to characterize the localstress-strain field around the crack front.
3.2.9.1 Discussion—The J-integral expression for a two-dimensional crack, in thex-zplane with the crack front parallelto thez-axis, is the line integral as follows:
J 5 *GS Wdy2 T ·
] u]x dsD (2)
where:W = loading work per unit volume or, for elastic
bodies, strain energy density,G = path of the integral, that encloses (that is,
contains) the crack tip,ds = increment of the contour path,T = outward traction vector onds,u = displacement vector atds,x, y, z = rectangular coordinates, and
T·]u]x ds
= rate of work input from the stress field intothe area enclosed byG.
3.2.9.2 Discussion—The value of J obtained from thisequation is taken to be path-independent in test specimenscommonly used, but in service components (and perhaps in testspecimens) caution is needed to adequately consider loadinginterior to G such as from rapid motion of the crack or theservice component, and from residual or thermal stress.
3.2.9.3 Discussion—In elastic (linear or nonlinear) solids,the J-integral equals the crack-extension force,G. (Seecrackextension force.)
3.2.10 Jc [FL−1]—The propertyJc determined by this testmethod characterizes the fracture toughness of materials atfracture instability prior to the onset of significant stabletearing crack extension. The value ofJc determined by this testmethod represents a measure of fracture toughness at instabil-ity without significant stable crack extension that is indepen-dent of in-plane dimensions; however, there may be a depen-dence of toughness on thickness (length of crack front).
3.2.11 Ju [FL−1]—The quantityJu determined by this testmethod measures fracture instability after the onset of signifi-cant stable tearing crack extension. It may be size-dependentand a function of test specimen geometry. It can be useful todefine limits on ductile fracture behavior.
3.2.12 net thickness, BN [L] , n—distance between the rootsof the side grooves in side-grooved specimens.
3.2.13 original crack size, ao [L] , n—the physical crack sizeat the start of testing.
3.2.13.1Discussion—In this test method,aoq is used todenote original crack size estimated from compliance.
3.2.14 original remaining ligament, bo [L] , n—distancefrom the original crack front to the back edge of the specimen,that is (bo = W − a o).
3.2.15 physical crack size, ap [L] , n—the distance from areference plane to the observed crack front. This distance mayrepresent an average of several measurements along the crackfront. The reference plane depends on the specimen form, andit is normally taken to be either the boundary, or a planecontaining either the load line or the centerline of a specimenor plate. The reference plane is defined prior to specimendeformation.
3.2.16 plane-strain fracture toughness, KIc [FL−3/2], JIc
[FL−1], KJIc [FL−3/2] , n—the crack-extension resistance underconditions of crack-tip plane strain.
3.2.16.1Discussion—For example, in Mode I for slow ratesof loading and negligible plastic-zone adjustment, plane-strainfracture toughness is the value of the stress-intensity factor
E 1820
2COPYRIGHT 2003; ASTM International
Document provided by IHS Licensee=MIT Libraries/6110146001, User=, 10/10/200310:08:20 MDT Questions or comments about this message: please call the DocumentPolicy Group at 1-800-451-1584.
--``,,,,``,,,,,```,``,`,``,``,,-`-`,,`,,`,`,,`---

designatedKIc [FL−3/2] as measured using the operationalprocedure (and satisfying all of the qualification requirements)specified in this test method, which provides for the measure-ment of crack-extension resistance at the start of crack exten-sion and provides operational definitions of crack-tip sharp-ness, start of crack extension, and crack-tip plane-strain.
3.2.16.2Discussion—For example, in Mode I for slow ratesof loading and substantial plastic deformation, plane-strainfracture toughness is the value of theJ-integral designatedJIc
[FL−1] as measured using the operational procedure (andsatisfying all of the qualification requirements) specified in thistest method, that provides for the measurement of crack-extension resistance near the onset of stable crack extension.
3.2.16.3Discussion—For example, in Mode I for slow ratesof loading, plane-strain fracture toughness is the value of thestress intensity designatedKJIc[FL−3/2] calculated from JIcusing the equation (and satisfying all of the qualificationrequirements) specified in this test method, that provides forthe measurement of crack-extension reistance near the onset ofstable crack extension under dominant elastic conditions.(1)3
3.2.17 pop-in, n—a discontinuity in the load versus clipgage displacement record. The record of a pop-in shows asudden increase in displacement and, generally a decrease inload. Subsequently, the displacement and load increase toabove their respective values at pop-in.
3.2.18 R-curve or J-R curve, n—a plot of crack extensionresistance as a function of stable crack extension,Dap or Dae.
3.2.18.1Discussion—In this test method, theJ-Rcurve is aplot of the far-field J-integral versus the physical crackextension,Dap. It is recognized that the far-field value ofJ maynot represent the stress-strain field local to a growing crack.
3.2.19 remaining ligament, b [L], n—distance from thephysical crack front to the back edge of the specimen, that is(b = W − ap).
3.2.20 specimen center of pin hole distance, H* [L], n—thedistance between the center of the pin holes on a pin-loadedspecimen.
3.2.21 specimen gage length, d [L], n—the distance be-tween the points of displacement measure (for example, clipgage, gage length).
3.2.22 specimen span, S [L], n—the distance betweenspecimen supports.
3.2.23 specimen thickness, B [L], n—the side-to-side di-mension of the specimen being tested.
3.2.24 specimen width, W [L], n—a physical dimension ona test specimen measured from a reference position such as thefront edge in a bend specimen or the load line in the compactspecimen to the back edge of the specimen.
3.2.25 stable crack extension [L], n—a displacement-controlled crack extension beyond the stretch-zone width (see3.2.27). The extension stops when the applied displacement isheld constant.
3.2.26 stress-intensity factor, K, K1, K2, K3, KI, KII, KIII
[FL−3/2] , n—the magnitude of the ideal-crack-tip stress field(stress-field singularity) for a particular mode in a homoge-neous, linear-elastic body.
3.2.26.1Discussion—Values ofK for the Modes 1, 2, and 3are given by the following equations:
K1 5 r→0lim @syy~2pr!1/2# (3)
K2 5 r→0lim @t xy~2pr!1/2# (4)
K3 5 r→0lim @tyz~2pr!1/2# (5)
wherer = distance directly forward from the crack tip to a locationwhere the significant stress is calculated.
3.2.26.2Discussion—In this test method, Mode 1 or ModeI is assumed. See Terminology E 1823 for definition of mode.
3.2.27 stretch-zone width, SZW [L], n—the length of crackextension that occurs during crack-tip blunting, for example,prior to the onset of unstable brittle crack extension, pop-in, orslow stable crack extension. The SZW is in the same plane asthe original (unloaded) fatigue precrack and refers to anextension beyond the original crack size.
3.2.28 unstable crack extension [L], n—an abrupt crackextension that occurs with or without prior stable crackextension in a standard test specimen under crosshead or clipgage displacement control.
4. Summary of Test Method
4.1 The objective of this test method is to load a fatigueprecracked test specimen to induce either or both of thefollowing responses (1) unstable crack extension, includingsignificant pop-in, referred to as “fracture instability” in thistest method; (2) stable crack extension, referred to as “stabletearing” in this test method. Fracture instability results in asingle point-value of fracture toughness determined at the pointof instability. Stable tearing results in a continuous fracturetoughness versus crack-extension relationship (R-curve) fromwhich significant point-values may be determined. Stabletearing interrupted by fracture instability results in anR-curveup to the point of instability.
4.2 This test method requires continuous measurement ofload versus load-line displacement and crack mouth openingdisplacement. If any stable tearing response occurs, then anR-curve is developed and the amount of slow-stable crackextension shall be measured.
4.3 Two alternative procedures for measuring crack exten-sion are presented, the basic procedure and the resistance curveprocedure. The basic procedure involves physical marking ofthe crack advance and multiple specimens used to develop aplot from which a single point initiation toughness value can beevaluated. The basic procedure cannot be used to develop anR-curve. The resistance curve procedure is an elastic-compliance method where multiple points are determined froma single specimen. In the latter case, high precision of signalresolution is required; however, these data can be used todevelop anR-curve. Other procedures for measuring crackextension are allowed.
4.4 The commonality of instrumentation and recommendedtesting procedure contained herein permits the application ofdata to more than one method of evaluating fracture toughness.Annex A4-Annex A11 define the various data treatment op-tions that are available, and these should be reviewed tooptimize data transferability.
4.5 Data that are generated following the procedures and3 The boldface numbers in parentheses refer to a list of references at the end of
this test method.
E 1820
3COPYRIGHT 2003; ASTM International
Document provided by IHS Licensee=MIT Libraries/6110146001, User=, 10/10/200310:08:20 MDT Questions or comments about this message: please call the DocumentPolicy Group at 1-800-451-1584.
--``,,,,``,,,,,```,``,`,``,``,,-`-`,,`,,`,`,,`---

guidelines contained in this test method are labeled qualifieddata. Data that meet the size criteria in Annex A4-Annex A11are insensitive to in-plane dimensions.
4.6 Supplementary information about the background ofthis test method and rationale for many of the technicalrequirements of this test method are contained in(2). Theformulas presented in this test method are applicable over therange of crack length and specimen sizes within the scope ofthis test method.
5. Significance and Use
5.1 Assuming the presence of a preexisting, sharp, fatiguecrack, the material fracture toughness values identified by thistest method characterize its resistance to: (1) fracture of astationary crack, (2) fracture after some stable tearing, (3)stable tearing onset, and (4) sustained stable tearing. This testmethod is particularly useful when the material responsecannot be anticipated before the test.
5.1.1 These fracture toughness values may serve as a basisfor material comparison, selection, and quality assurance.Fracture toughness can be used to rank materials within asimilar yield strength range.
5.1.2 These fracture toughness values may serve as a basisfor structural flaw tolerance assessment. Awareness of differ-ences that may exist between laboratory test and field condi-tions is required to make proper flaw tolerance assessment.
5.2 The following cautionary statements are based on someobservations.
5.2.1 Particular care must be exercised in applying tostructural flaw tolerance assessment the fracture toughnessvalue associated with fracture after some stable tearing hasoccurred. This response is characteristic of ferritic steel in the
transition regime. This response is especially sensitive tomaterial inhomogeneity and to constraint variations that maybe induced by planar geometry, thickness differences, mode ofloading, and structural details.
5.2.2 The J-R curve from bend-type specimens recom-mended by this test method (SE(B), C(T), and DC(T)) has beenobserved to be conservative with respect to results from tensileloading configurations.
5.2.3 The values ofdc, du, dm, andJu may be affected byspecimen dimensions.
6. Apparatus
6.1 Apparatus is required for measurement of applied load,load-line displacement, and crack-mouth opening displace-ment. Load versus load-line displacement and load versuscrack-mouth opening displacement may be recorded digitallyfor processing by computer or autographically with anx-yplotter. Test fixtures for each specimen type are described in theapplicable Annex.
6.2 Displacement Gages:6.2.1 Displacement measurements are needed for the fol-
lowing purposes: to evaluatePQ in the KIc evaluation,J fromthe area under the load versus load-line displacement record,CTOD from the load versus crack-mouth opening displace-ment record and, for the elastic compliance method, to infercrack extension,D ap, from elastic compliance calculations.
6.2.2 The recommended displacement gage has a workingrange of not more than twice the displacement expected during
the test. When the expected displacement is less than 3.75 mm(0.15 in.), the gage recommended in Fig. 1 may be used. Whena greater working range is needed, an enlarged gage such as theone shown in Fig. 2 is recommended. Accuracy shall be within
FIG. 1 Double-Cantilever Clip-In Displacement Gage Mounted By Means of Integral Knife Edges
E 1820
4COPYRIGHT 2003; ASTM International
Document provided by IHS Licensee=MIT Libraries/6110146001, User=, 10/10/200310:08:20 MDT Questions or comments about this message: please call the DocumentPolicy Group at 1-800-451-1584.
--``,,,,``,,,,,```,``,`,``,``,,-`-`,,`,,`,`,,`---

61 % of the full working range. In calibration, the maximumdeviation of the individual data points from a fit (linear orcurve) to the data shall be less than60.2 % of the workingrange of the gage when using the elastic compliance methodand61 % otherwise. Knife edges are required for seating thegage. Parallel alignment of the knife edges shall be maintainedto within 1°. Direct methods for load-line displacement aredescribed in Refs(2-5).
6.2.2.1 Gage Attachment Methods—The specimen shall beprovided with a pair of accurately machined knife edges thatsupport the gage arms and serve as the displacement referencepoints. These knife edges can be machined integral with thespecimen or they may be attached separately. Experience hasshown that razor blades serve as effective attachable knifeedges. The knife edges shall be positively attached to thespecimen to prevent shifting of the knife edges during the testmethod. Experience has shown that machine screws or spotwelds are satisfactory attachment methods.
6.2.3 For the elastic compliance method, the recommendedsignal resolution for displacement should be at least 1 part in32 000 of the transducer signal range, and signal stabilityshould be64 parts in 32 000 of the transducer signal rangemeasured over a 10-min period. Signal noise should be lessthan62 parts in 32 000 of the transducer signal range.
6.2.4 Gages other than those recommended in 6.2 arepermissible if the required accuracy and precision can be metor exceeded.
6.3 Load Transducers:6.3.1 Testing is performed in a testing machine conforming
to the requirements of Practices E 4. Applied load may bemeasured by any load transducer capable of being recordedcontinuously. Accuracy of load measurements shall be within61 % of the working range. In calibration, the maximumdeviation of individual data points from a fit to the data shall beless than60.2 % of the calibrated range of the transducer whenusing elastic compliance, and61 % otherwise.
6.3.2 For the elastic compliance method, the signal resolu-tion on load should be at least 1 part in 4000 of the transducersignal range and signal stability should be64 parts in 4000 ofthe transducer signal range measured over a 10-min period.Recommended maximum signal noise should be less than62parts in 4000 of the transducer signal range.
6.4 System Verification—It is recommended that the perfor-mance of the load and displacement measuring systems shouldbe verified before beginning a series of continuous tests.Calibration accuracy of displacement transducers shall beverified with due consideration for the temperature and envi-ronment of the test. Load calibrations shall be conductedperiodically and documented in accordance with the latestrevision of Practices E 4.
6.5 Fixtures:6.5.1 Bend-Test Fixture—The general principles of the
bend-test fixture are illustrated in Fig. 3. This fixture is
designed to minimize frictional effects by allowing the supportrollers to rotate and move apart slightly as the specimen isloaded, thus permitting rolling contact. Thus, the supportrollers are allowed limited motion along plane surfaces parallelto the notched side of the specimen, but are initially positivelypositioned against stops that set the span length and are held inplace by low-tension springs (such as rubber bands). Fixturesand rolls shall be made of high hardness (greater than 40 HRC)steels.
6.5.2 Tension Testing Clevis:6.5.2.1 A loading clevis suitable for testing compact speci-
mens is shown in Fig. 4. Both ends of the specimen are held insuch a clevis and loaded through pins, in order to allow rotation
NOTE 1—All dimensions are in millimetres.FIG. 2 Clip Gage Design for 8.0 mm (0.3 in.) and More Working
Range
FIG. 3 Bend Test Fixture Design
E 1820
5COPYRIGHT 2003; ASTM International
Document provided by IHS Licensee=MIT Libraries/6110146001, User=, 10/10/200310:08:20 MDT Questions or comments about this message: please call the DocumentPolicy Group at 1-800-451-1584.
--``,,,,``,,,,,```,``,`,``,``,,-`-`,,`,,`,`,,`---

of the specimen during testing. In order to provide rollingcontact between the loading pins and the clevis holes, theseholes are provided with small flats on the loading surfaces.Other clevis designs may be used if it can be demonstrated thatthey will accomplish the same result as the design shown.Clevises and pins should be fabricated from steels of sufficientstrength (greater than 40 HRC) to elastically resist indentationof the clevises or pins.
6.5.2.2 The critical tolerances and suggested proportions ofthe clevis and pins are given in Fig. 4. These proportions arebased on specimens havingW/ B = 2 for B > 12.7 mm (0.5 in.)andW/B = 4 for B # 12.7 mm. If a 1930-MPa (280 000-psi)yield strength maraging steel is used for the clevis and pins,adequate strength will be obtained. If lower-strength gripmaterial is used, or if substantially larger specimens arerequired at a givensYS/E ratio, then heavier grips will berequired. As indicated in Fig. 4 the clevis corners may be cutoff sufficiently to accommodate seating of the clip gage inspecimens less than 9.5 mm (0.375 in.) thick.
6.5.2.3 Careful attention should be given to achieving goodalignment through careful machining of all auxiliary grippingfixtures.
7. Specimen Size, Configuration, and Preparation
7.1 Specimen Configurations—The configurations of thestandard specimens are shown in Annex A1-Annex A3.
7.2 Crack Plane Orientation—The crack plane orientationshall be considered in preparing the test specimen. This isdiscussed in Terminology E 1823.
7.3 Alternative Specimens—In certain cases, it may bedesirable to use specimens havingW/B ratios other than two.Suggested alternative proportions for the single-edge bendspecimen are 1# W/B # 4 and for the compact (anddiskshaped compact) specimen are 2# W/B # 4, however, anythickness can be used as long as the qualification requirementsare met.
7.4 Specimen Precracking—All specimens shall be pre-cracked in fatigue. Experience has shown that it is impracticalto obtain a reproducibly sharp, narrow machined notch thatwill simulate a natural crack well enough to provide asatisfactory fracture toughness test result. The most effectiveartifice for this purpose is a narrow notch from which extendsa comparatively short fatigue crack, called the precrack. (Afatigue precrack is produced by cyclically loading the notchedspecimen for a number of cycles usually between about 104
and 106 depending on specimen size, notch preparation, andstress intensity level.) The dimensions of the notch and theprecrack, and the sharpness of the precrack shall meet certainconditions that can be readily met with most engineeringmaterials since the fatigue cracking process can be closelycontrolled when careful attention is given to the known
NOTE 1—Corners may be removed as necessary to accomodate the clip gage.FIG. 4 Tension Testing Clevis Design
E 1820
6COPYRIGHT 2003; ASTM International
Document provided by IHS Licensee=MIT Libraries/6110146001, User=, 10/10/200310:08:20 MDT Questions or comments about this message: please call the DocumentPolicy Group at 1-800-451-1584.
--``,,,,``,,,,,```,``,`,``,``,,-`-`,,`,,`,`,,`---
contributory factors. However, there are some materials thatare too brittle to be fatigue-cracked since they fracture as soonas the fatigue crack initiates; these are outside the scope of thepresent test method.
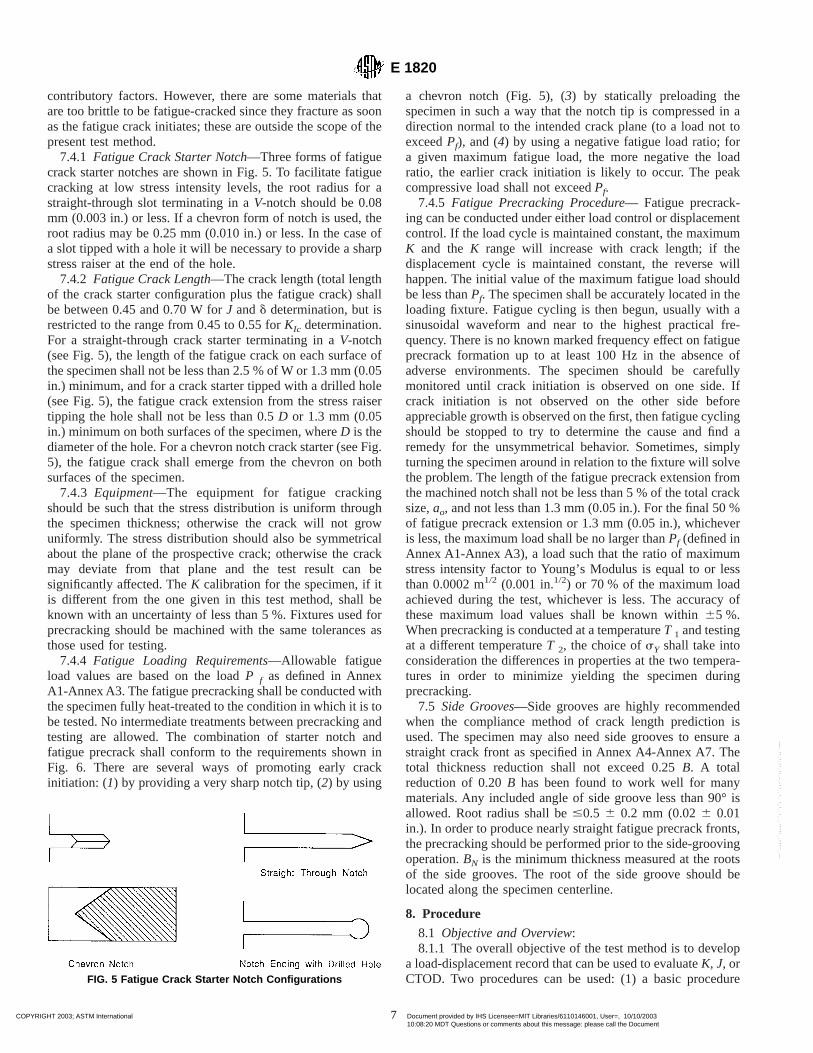
7.4.1 Fatigue Crack Starter Notch—Three forms of fatiguecrack starter notches are shown in Fig. 5. To facilitate fatiguecracking at low stress intensity levels, the root radius for astraight-through slot terminating in aV-notch should be 0.08mm (0.003 in.) or less. If a chevron form of notch is used, theroot radius may be 0.25 mm (0.010 in.) or less. In the case ofa slot tipped with a hole it will be necessary to provide a sharpstress raiser at the end of the hole.
7.4.2 Fatigue Crack Length—The crack length (total lengthof the crack starter configuration plus the fatigue crack) shallbe between 0.45 and 0.70 W forJ andd determination, but isrestricted to the range from 0.45 to 0.55 forKIc determination.For a straight-through crack starter terminating in aV-notch(see Fig. 5), the length of the fatigue crack on each surface ofthe specimen shall not be less than 2.5 % of W or 1.3 mm (0.05in.) minimum, and for a crack starter tipped with a drilled hole(see Fig. 5), the fatigue crack extension from the stress raisertipping the hole shall not be less than 0.5D or 1.3 mm (0.05in.) minimum on both surfaces of the specimen, whereD is thediameter of the hole. For a chevron notch crack starter (see Fig.5), the fatigue crack shall emerge from the chevron on bothsurfaces of the specimen.
7.4.3 Equipment—The equipment for fatigue crackingshould be such that the stress distribution is uniform throughthe specimen thickness; otherwise the crack will not growuniformly. The stress distribution should also be symmetricalabout the plane of the prospective crack; otherwise the crackmay deviate from that plane and the test result can besignificantly affected. TheK calibration for the specimen, if itis different from the one given in this test method, shall beknown with an uncertainty of less than 5 %. Fixtures used forprecracking should be machined with the same tolerances asthose used for testing.
7.4.4 Fatigue Loading Requirements—Allowable fatigueload values are based on the loadP f as defined in AnnexA1-Annex A3. The fatigue precracking shall be conducted withthe specimen fully heat-treated to the condition in which it is tobe tested. No intermediate treatments between precracking andtesting are allowed. The combination of starter notch andfatigue precrack shall conform to the requirements shown inFig. 6. There are several ways of promoting early crackinitiation: (1) by providing a very sharp notch tip, (2) by using
a chevron notch (Fig. 5), (3) by statically preloading thespecimen in such a way that the notch tip is compressed in adirection normal to the intended crack plane (to a load not toexceedPf), and (4) by using a negative fatigue load ratio; fora given maximum fatigue load, the more negative the loadratio, the earlier crack initiation is likely to occur. The peakcompressive load shall not exceedPf.
7.4.5 Fatigue Precracking Procedure— Fatigue precrack-ing can be conducted under either load control or displacementcontrol. If the load cycle is maintained constant, the maximumK and theK range will increase with crack length; if thedisplacement cycle is maintained constant, the reverse willhappen. The initial value of the maximum fatigue load shouldbe less thanPf. The specimen shall be accurately located in theloading fixture. Fatigue cycling is then begun, usually with asinusoidal waveform and near to the highest practical fre-quency. There is no known marked frequency effect on fatigueprecrack formation up to at least 100 Hz in the absence ofadverse environments. The specimen should be carefullymonitored until crack initiation is observed on one side. Ifcrack initiation is not observed on the other side beforeappreciable growth is observed on the first, then fatigue cyclingshould be stopped to try to determine the cause and find aremedy for the unsymmetrical behavior. Sometimes, simplyturning the specimen around in relation to the fixture will solvethe problem. The length of the fatigue precrack extension fromthe machined notch shall not be less than 5 % of the total cracksize,ao, and not less than 1.3 mm (0.05 in.). For the final 50 %of fatigue precrack extension or 1.3 mm (0.05 in.), whicheveris less, the maximum load shall be no larger thanPf (defined inAnnex A1-Annex A3), a load such that the ratio of maximumstress intensity factor to Young’s Modulus is equal to or lessthan 0.0002 m1/2 (0.001 in.1/2) or 70 % of the maximum loadachieved during the test, whichever is less. The accuracy ofthese maximum load values shall be known within65 %.When precracking is conducted at a temperatureT 1 and testingat a different temperatureT 2, the choice ofsY shall take intoconsideration the differences in properties at the two tempera-tures in order to minimize yielding the specimen duringprecracking.
7.5 Side Grooves—Side grooves are highly recommendedwhen the compliance method of crack length prediction isused. The specimen may also need side grooves to ensure astraight crack front as specified in Annex A4-Annex A7. Thetotal thickness reduction shall not exceed 0.25B. A totalreduction of 0.20B has been found to work well for manymaterials. Any included angle of side groove less than 90° isallowed. Root radius shall be#0.5 6 0.2 mm (0.026 0.01in.). In order to produce nearly straight fatigue precrack fronts,the precracking should be performed prior to the side-groovingoperation.BN is the minimum thickness measured at the rootsof the side grooves. The root of the side groove should belocated along the specimen centerline.
8. Procedure
8.1 Objective and Overview:8.1.1 The overall objective of the test method is to develop
a load-displacement record that can be used to evaluateK, J,orCTOD. Two procedures can be used: (1) a basic procedureFIG. 5 Fatigue Crack Starter Notch Configurations
E 1820
7COPYRIGHT 2003; ASTM International
Document provided by IHS Licensee=MIT Libraries/6110146001, User=, 10/10/200310:08:20 MDT Questions or comments about this message: please call the DocumentPolicy Group at 1-800-451-1584.
--``,,,,``,,,,,```,``,`,``,``,,-`-`,,`,,`,`,,`---

directed toward evaluation of a singleK, J, or CTOD valuewithout the use of crack extension measurement equipment, or(2) a procedure directed toward evaluation of a completefracture toughness resistance curve using crack extensionmeasurement equipment. This also includes the evaluation ofsingle-point toughness values.
8.1.2 The basic procedure utilizes a load versus displace-ment plot and is directed toward obtaining a single fracturetoughness value such asK1c, Jc, or dc. Optical crack measure-ments are utilized to obtain both the initial and final physicalcrack sizes in this procedure. Multiple specimens can be usedto evaluateJ at the initiation of ductile cracking,J1c, or d1c.
8.1.3 The resistance curve procedure utilizes an elasticunloading procedure or equivalent procedure to obtain aJ- orCTOD-based resistance curve from a single specimen. Cracklength is measured from compliance in this procedure andverified by posttest optical crack length measurements. Analternative procedure using the normalization method is pre-sented in Annex A15: Normalization Data Reduction Tech-nique.
8.1.4 Three or more determinations of the fracture tough-ness parameter are suggested to ascertain the effects of materialand test system variability.
8.2 System and Specimen Preparation:8.2.1 Specimen Measurement—Measure the dimensions,
BN, B, W, H* , andd to the nearest 0.050 mm (0.002 in.) or0.5 %, whichever is larger.
8.2.2 Specimen Temperature:8.2.2.1 The temperature of the specimen shall be stable and
uniform during the test. Hold the specimen at test temperature63°C for 1⁄2 h/25 mm of specimen thickness.
8.2.2.2 Measure the temperature of the specimen during thetest to an accuracy of63°C, where the temperature ismeasured on the specimen surface withinW/4 from the cracktip. (See Test Methods E 21 for suggestions on temperaturemeasurement.)
8.2.2.3 For the duration of the test, the difference betweenthe indicated temperature and the nominal test temperatureshall not exceed63°C.
8.2.2.4 The term “indicated temperature” means the tem-perature that is indicated by the temperature measuring deviceusing good-quality pyrometric practice.
NOTE 2—It is recognized that specimen temperature may vary morethan the indicated temperature. The permissible indicated temperaturevariations in 8.2.2.3 are not to be construed as minimizing the importanceof good pyrometric practice and precise temperature control. All labora-tories should keep both indicated and specimen temperature variations assmall as practicable. It is well recognized, in view of the dependency offracture toughness of materials on temperature, that close temperaturecontrol is necessary. The limits prescribed represent ranges that arecommon practice.
8.3 Alignment:8.3.1 Bend Testing—Set up the bend test fixture so that the
line of action of the applied load passes midway between thesupport roll centers within61 % of the distance between thecenters. Measure the span to within60.5 % of the nominallength. Locate the specimen so that the crack tip is midwaybetween the rolls to within 1 % of the span and square the rollaxes within62°.
8.3.1.1 When the load-line displacement is referenced fromthe loading jig there is potential for introduction of error fromtwo sources. They are the elastic compression of the fixture as
NOTE 1—The crack-starter notch shall be centered between the top and bottom specimen edges within 0.005 W.FIG. 6 Envelope of Fatigue Crack and Crack Starter Notches
E 1820
8COPYRIGHT 2003; ASTM International
Document provided by IHS Licensee=MIT Libraries/6110146001, User=, 10/10/200310:08:20 MDT Questions or comments about this message: please call the DocumentPolicy Group at 1-800-451-1584.
--``,,,,``,,,,,```,``,`,``,``,,-`-`,,`,,`,`,,`---

the load increases and indentation of the specimen at theloading points. Direct methods for load-line displacementmeasurement are described in Refs(3-6). If a remote trans-ducer is used for load-line displacement measurement, takecare to exclude the elastic displacement of the load-trainmeasurement and brinelling displacements at the load points(7).
8.3.2 Compact Testing—Loading pin friction and eccentric-ity of loading can lead to errors in fracture toughness determi-nation. The centerline of the upper and lower loading rodsshould be coincident within 0.25 mm (0.01 in.). Center thespecimen with respect to the clevis opening within 0.76 mm(0.03 in.). Seat the displacement gage in the knife edges firmlyby wiggling the gage lightly.
8.4 Basic Procedure—Load all specimens under displace-ment gage or machine crosshead or actuator displacementcontrol. If a loading rate that exceeds that specified here isdesired, please refer to Annex Annex A14: Special Require-ments for Rapid-Load J-Integral Fracture Toughness Testing.
8.4.1 The basic procedure involves loading a specimen to aselected displacement level and determining the amount ofcrack extension that occurred during loading.
8.4.2 Load specimens at a constant rate such that the timetaken to reach the loadPf lies between 0.1 and 10.0 min.
8.4.3 If the test ends by a fracture instability, measure theinitial crack length and any ductile crack extension by theprocedure in Section 9. Ductile crack extension may bedifficult to distinguish but should be defined on one side by thefatigue precrack and on the other by the brittle region. Proceedto Section 9 to evaluate fracture toughness in terms ofK, J, orCTOD.
8.4.4 If stable tearing occurs, test additional specimens toevaluate an initiation value of the toughness. Use the procedurein 8.5 to evaluate the amount of stable tearing that has occurredand thus determine the displacement levels needed in theadditional tests. Five or more points favorably positioned arerequired to generate anR curve for evaluating an initiationpoint. See Annex A9 and Annex A11 to see how points shall bepositioned for evaluating an initiation toughness value.
8.5 Optical Crack Length Measurement:8.5.1 After unloading the specimen, mark the crack accord-
ing to one of the following methods. For steels and titaniumalloys, heat tinting at about 300°C (570°F) for 30 min workswell. For other materials, fatigue cycling can be used. The useof liquid penetrants is not recommended. For both recom-mended methods, the beginning of stable crack extension ismarked by the end of the flat fatigue precracked area. The endof crack extension is marked by the end of heat tint or thebeginning of the second flat fatigue area.
8.5.2 Break the specimen to expose the crack, with caretaken to minimize additional deformation. Cooling ferritic steelspecimens to ensure brittle behavior may be helpful. Coolingnonferritic materials may help to minimize deformation duringfinal fracture.
8.5.3 Along the front of the fatigue crack and the front of themarked region of stable crack extension, measure the size ofthe original crack and the final physical crack size at nineequally spaced points centered about the specimen centerline
and extending to 0.005 W from the root of the side groove orsurface of smooth-sided specimens. Calculate the originalcrack size,ao, and the final physical crack size,ap, as follows:average the two near-surface measurements, combine the resultwith the remaining seven crack length measurements anddetermine the average. The measuring instrument shall have anaccuracy of 0.025 mm (0.001 in.).
8.5.4 None of the nine measurements of original crack sizeand final physical crack size may differ by more than 5 % fromthe average physical crack size defined in 8.5.3.
8.6 Resistance Curve Procedure:8.6.1 The resistance curve procedure involves using an
elastic compliance technique or other technique to obtain theJor CTOD resistance curve from a single specimen test. Theelastic compliance technique is described here, while thenormalization technique is described in Annex A15.
8.6.2 Load the specimens under the displacement gage ormachine crosshead or actuator displacement control. Load thespecimens at a rate such that the time taken to reach the loadPf lies between 0.1 and 10.0 min. The time to perform anunload/reload sequence should be as needed to accuratelyestimate crack length, but not more than 10 min. If a higherloading rate is desired, please refer to Annex Annex A14:Special Requirements for Rapid-Load J-Integral FractureToughness Testing.
8.6.3 Take each specimen individually through the follow-ing steps:
8.6.3.1 Measure compliance to estimate the original cracklength,ao, using unloading/reloading sequences in a load rangefrom 0.5 to 1.0 times the maximum precracking load. Estimatea provisional initial crack size,aoq, from at least threeunloading/reloading sequences. No individual value shall differfrom the mean by more than60.002W.
8.6.3.2 Proceed with the test using unload/reload sequencesthat produce crack extension measurements at intervals pre-scribed by the applicable data analysis section of Annex A8 orAnnex A10. Note that at least eight data points are requiredbefore specimen achieves maximum load. If fracture instabilityis an expected response, then it may be helpful to load thespecimen monotonically over the rangePf< P < PQ. (See AnnexA5 for a definition of PQ). If crack length values changenegatively by more than 0.005ao(backup), stop the test andcheck the alignment of the loading train. Crack length valuesdetermined at loads lower than the maximum precracking loadshould be ignored.
8.6.3.3 For many materials, load relaxation may occur priorto conducting compliance measurements, causing a time-dependent nonlinearity in the unloading slope. One methodthat may be used to remedy this effect is to hold the specimenfor a period of time until the load becomes stable at a constantdisplacement prior to initiating the unloading.
8.6.3.4 The maximum recommended range of unload/reloadfor crack extension measurement should not exceed either50 % of Pf or 50 % of the current load, whichever is smaller.
8.6.3.5 After completing the final unloading cycle, returnthe load to zero without additional crosshead displacementbeyond the then current maximum displacement.
8.6.3.6 After unloading the specimen, use the procedure in
E 1820
9COPYRIGHT 2003; ASTM International
Document provided by IHS Licensee=MIT Libraries/6110146001, User=, 10/10/200310:08:20 MDT Questions or comments about this message: please call the DocumentPolicy Group at 1-800-451-1584.
--``,,,,``,,,,,```,``,`,``,``,,-`-`,,`,,`,`,,`---

8.5 to optically measure the crack lengths.8.7 Alternative Methods:8.7.1 Alternative methods of measuring crack extension,
such as the electric potential drop method, are allowed.Methods shall meet the qualification criteria given in 9.1.5.2.
8.7.2 If displacement measurements are made in a planeother than that containing the load line, the ability to inferload-line displacement shall be demonstrated using the testmaterial under similar test temperatures and conditions. In-ferred load-line displacement values shall be accurate to within61 %.
9. Analysis of Results
9.1 Qualification of Data—The data shall meet the follow-ing requirements to be qualified according to this test method.If the data do not pass these requirements, no fracture tough-ness measures can be determined in accordance with this testmethod.
NOTE 3—This section contains the requirements for qualification thatare common for all tests. Additional qualification requirements are givenwith each type of test in the Annexes as well as requirements fordetermining whether the fracture toughness parameter developed isinsensitive to in-plane dimensions.
9.1.1 All requirements on the test equipment in Section 6shall be met.
9.1.2 All requirements on machining tolerance and pre-cracking in Section 7 shall be met.
9.1.3 All requirements on fixture alignment, test rate, andtemperature stability and accuracy in Section 8 shall be met.
9.1.4 The following crack size requirements shall be met inall tests.
9.1.4.1 Original Crack Size—None of the nine physicalmeasurements of initial crack size defined in 8.5.3 shall differby more than 5 % from the average,ao.
9.1.4.2 Final Crack Size—None of the nine physical mea-surements of final physical crack size,a p, defined in 8.5.3 shalldiffer by more than 5 % from the average. In subsequent tests,the side-groove configuration may be modified within therequirements of 7.5 to facilitate meeting this requirement.
9.1.5 The following crack size requirements shall be met inthe tests using the resistance curve procedure of 8.6.
9.1.5.1 Crack Extension—None of the nine physical mea-surements of crack extension shall be less than 50 % of theaverage crack extension.
9.1.5.2 Crack Extension Prediction—The crack extensionpredicted from elastic compliance (or other method) at the lastunloading shall be compared with the measured physical crackextension. The difference between these shall not exceed 0.15D ap for crack extensions less than 0.2bo, and the differenceshall not exceed 0.03bo thereafter.
9.2 Fracture Instability—When the test terminates with afracture instability, evaluate whether the fracture occurredbefore stable tearing or after stable tearing. The beginning ofstable tearing is defined in A6.3 and A7.3. For fractureinstability occurring before stable tearing proceed to AnnexA5, Annex A6, and Annex A7 to evaluate the toughness valuesin terms ofK, J, or CTOD. For fracture instability occurringafter stable tearing, proceed to Annex A5, Annex A6, andAnnex A7 to evaluate toughness values and then go to 9.3 toevaluate stable tearing.
9.3 Stable Tearing:9.3.1 Basic Procedure—When the basic procedure is used,
only an initiation toughness can be evaluated. Proceed toAnnex A9 and Annex A11 to evaluate initiation toughnessvalues.
9.3.2 Resistance Curve Procedure—When the resistancecurve procedure is used, refer to Annex A8 and Annex A10 todevelop theR curves. Proceed to Annex A9 and Annex A11 todevelop initiation values of toughness.
10. Report
10.1 A recommended table for reporting results is given Fig.7 and Fig. 8.
10.2 Report the following information for each fracturetoughness determination:
10.2.1 Type of test specimen and orientation of test speci-men according to Terminology E 1823 identification codes,
10.2.2 Material designation (ASTM, AISI, SAE, and soforth), material product form (plate, forging, casting, and soforth), and material yield and tensile strength (at test tempera-tures),
10.2.3 Specimen dimensions (8.2.1), ThicknessB and BN,and WidthW,
10.2.4 Test temperature (8.2.2), loading rate (8.4.2 and8.6.2), and type of loading control,
10.2.5 Fatigue precracking conditions (7.4),Kmax, DKrange, and fatigue precrack length (average),
10.2.6 Load-displacement record and associated calcula-tions (Section 9),
10.2.7 Original measured crack length (8.5), original pre-dicted crack length,aoq, final measured crack length, finalpredicted crack length,afq, physical crack extension duringtest, crack front appearance—straightness and planarity, andfracture appearance,
10.2.8 Qualification of fracture toughness measurement(Annex A4-Annex A7 and Annex A8-Annex A11), based onsize requirements, and based on crack extension, and
10.2.9 Qualified values of fracture toughness.
E 1820
10COPYRIGHT 2003; ASTM International
Document provided by IHS Licensee=MIT Libraries/6110146001, User=, 10/10/200310:08:20 MDT Questions or comments about this message: please call the DocumentPolicy Group at 1-800-451-1584.
--``,,,,``,,,,,```,``,`,``,``,,-`-`,,`,,`,`,,`---

11. Precision and Bias
11.1 Bias—There is no accepted “standard” value for any ofthe fracture toughness criteria employed in this test method. In
the absence of such a true value no meaningful statement canbe made concerning bias of data.
11.2 Precision—The precision of any of the various fracturetoughness determinations cited in this test method is a functionof the precision and bias of the various measurements of lineardimensions of the specimen and testing fixtures, the precisionof the displacement measurement, the bias of the load mea-surement as well as the bias of the recording devices used toproduce the load-displacement record, and the precision of theconstructions made on this record. It is not possible to makemeaningful statements concerning precision and bias for allthese measurements. However, it is possible to derive usefulinformation concerning the precision of fracture toughnessmeasurements in a global sense from interlaboratory testprograms. Most of the measures of fracture toughness that canbe determined by this procedure have been evaluated by aninterlaboratory test program. TheKIc was evaluated in(8), JIc
was evaluated in(9), theJ-Rcurve was evaluated in(10), andthe measures ofdc anddm were evaluated in a research report.4
In addition, the overall analysis procedures of this test methodwere evaluated in an interlaboratory test program.
12. Keywords
12.1 crack initiation; crack-tip opening displacement;CTOD; ductile fracture; elastic-plastic fracture toughness;fracture instability; J-integral; KIc; plane strain fracture tough-ness; resistance curve; stable crack growth
4 Data on the round-robin results are on file at ASTM Headquarters. RequestRR:E24-1013.
FIG. 7 Suggested Data Reporting Format
E 1820
11COPYRIGHT 2003; ASTM International
Document provided by IHS Licensee=MIT Libraries/6110146001, User=, 10/10/200310:08:20 MDT Questions or comments about this message: please call the DocumentPolicy Group at 1-800-451-1584.
--``,,,,``,,,,,```,``,`,``,``,,-`-`,,`,,`,`,,`---

ANNEXES
(Mandatory Information)
A1. SPECIAL REQUIREMENTS FOR TESTING SINGLE EDGE BEND SPECIMENS
NOTE A1.1—Annex A1-Annex A3 cover specimen information.
A1.1 Specimen
A1.1.1 The standard bend specimen is a single edge-notched and fatigue-cracked beam loaded in three-point bend-ing with a support span,S, nominally equal to four times thewidth, W. The general proportions of the specimen configura-tion are shown in Fig. A1.1.
A1.1.2 Alternative specimens may have 1# W/B # 4.These specimens shall also have a nominal support span equalto 4W.
A1.2 Apparatus
A1.2.1 For generally applicable specifications concerningthe bend-test fixture and displacement gage see 6.5.1 and 6.2.
A1.3 Specimen Preparation:
A1.3.1 For generally applicable specifications concerningspecimen configuration and preparation see Section 7.
A1.3.2 All specimens shall be precracked in three-pointbending fatigue based upon the loadPf, as follows:
Pf 50.5Bbo
2sY
S (A1.1)
See 7.4.5 for fatigue precracking requirements.
A1.4 Calculation
A1.4.1 Calculation of K—For the bend specimen at a load,P(i), calculateKas follows:
K ~i! 5 F PiS
~BBN! 1/2W3/2G f~ai /W! (A1.2)
where:
3~ai/W! 1/2 @1.992 ~ai/W! ~1 2 a i/W! (A1.3)
f~ai/W! 53 ~2.152 3.93~ai/W! 1 2.7 ~ai/W!2!#
2~1 1 2ai/W!~1 2 a i/W!3/2
A1.4.2 Calculation of J:
NOTE A1.2—In the calculation ofJ for the bend specimen a load-linedisplacement is required. For evaluating crack length, a crack mouthdisplacement is used.
For the single edge bend specimen, calculateJ as follows:
J 5 Jel 1 Jpl (A1.4)
FIG. 8 Suggested Data Reporting Format
E 1820
12COPYRIGHT 2003; ASTM International
Document provided by IHS Licensee=MIT Libraries/6110146001, User=, 10/10/200310:08:20 MDT Questions or comments about this message: please call the DocumentPolicy Group at 1-800-451-1584.
--``,,,,``,,,,,```,``,`,``,``,,-`-`,,`,,`,`,,`---

where:Jel = elastic component ofJ, andJpl = plastic component ofJ.
A1.4.2.1 J Calculations for the Basic Test Method—At apoint corresponding to v andP on the specimen load versusload-line displacement, calculate as follows:
J 5K2 ~1 2 v 2!
E 1 Jpl (A1.5)
whereK is from A1.4.1 witha = ao, and
Jpl 52Apl
BNbo
where:Apl = area as shown in Fig. A1.2,BN = net specimen thickness (BN = B if no side grooves are present),
andbo = W − ao.
A1.4.2.2 J Calculations for the Resistance Curve TestMethod—At a point corresponding to a(i), v(i), andP(i) on thespecimen load versus plastic load-line displacement calculateas follows:
J ~i! 5~K~i!!
2 ~1 2 v2!
E 1 Jpl~i! (A1.6)
whereK(i) is from A1.4.1, and
Jpl~i! 5 FJpl~i21! 1 S 2b ~i21!
D SApl~i! 2 Apl~i21!
BNDG· F1 2
a~i! 2 a~i21!
b ~i21!G
(A1.7)
In Eq A1.7, the quantityApl(i) − Apl(i–1) is the increment ofplastic area under the load versus load-line displacement recordbetween lines of constant displacement at pointsi−1 and ishown in Fig. A1.3. The quantityJpl(i) represents the total crack
growth corrected plasticJ at pointi and is obtained in two stepsby first incrementing the existingJ pl(i-1) and then by modifyingthe total accumulated result to account for the crack growthincrement. Accurate evaluation ofJpl(i) from the Eq A1.7relationship requires small and uniform crack growth incre-ments consistent with the suggested elastic compliance spacingof Annex A8 and Annex A10. The quantityApl(i) can becalculated from the following equation:
Apl~i! 5 Apl~i21! 1 @P~i! 1 P ~i21!# @vpl~i! 2 vpl~i21!#/2 (A1.8)
where:vpl(i) = plastic part of the load-line displacement = v(i) −
(P (i)CLL (i))), andCLL(i) = slope, (Dv/DP) (i), required to give the current crack length,
ai.
CLL(i) can be determined from knowledge ofai/W using thefollowing equation:
CLLi 51
E BeS S
W2 a iD2
@1.1932 1.98~a i/W! 1 4.478~ai/W!2
2 4.443~a i/W!3 1 1.739~ai/W!4# (A1.9)
NOTE 1—The two side planes and the two edge planes shall be parallel and perpendicular as applicable to within 0.5°.NOTE 2—The machined notch shall be perpendicular to specimen length and thickness to within62°.
FIG. A1.1 Recommended Single Edge Bend [SE(B)] Specimen
FIG. A1.2 Definition of Area for J Calculation Using the BasicMethod
FIG. A1.3 Definition of Plastic Area for Resistance Curve JCalculation
E 1820
13COPYRIGHT 2003; ASTM International
Document provided by IHS Licensee=MIT Libraries/6110146001, User=, 10/10/200310:08:20 MDT Questions or comments about this message: please call the DocumentPolicy Group at 1-800-451-1584.
--``,,,,``,,,,,```,``,`,``,``,,-`-`,,`,,`,`,,`---

where:Be = B − (B − BN) 2/B
A1.4.3 Calculation of Crack Length—For a resistancecurve test method using an elastic compliance technique onsingle edge bend specimens with crack opening displacementsmeasured at the notched edge, the crack length is given asfollows:
ai/W5 @0.9997482 3.9504u 1 2.9821u 2 2 3.21408u3
1 51.51564u 4 2 113.031u5# (A1.10)
where:
u 51
FBeWECi
S/4 G1/2
1 1(A1.11)
Ci = (Dvm/DP) on an unloading/reloading sequence,vm = crack opening displacement at notched edge,Be = B − (B − BN)2/B .
NOTE A1.3—Crack length on a single edge bend specimen is normallydetermined from crack opening compliance. It can be determined fromload-line compliance if the correct calibration is available.
A1.4.4 Other compliance equations are acceptable if theresulting accuracy is equal to or greater than those describedand the accuracy has been verified experimentally.
A1.4.5 Calculation of CTOD:A1.4.5.1 Calculation of CTOD for the Basic Test Method—
For the basic test method, calculations of CTOD for any pointon the load-displacement curve are made from the followingexpression:
d 5K2 ~1 2 n2!
2sYSE1
r p~W2 ao!v pl
@rp ~W2 ao! 1 ao 1 z#(A1.12)
where:ao = original crack length,K = stress intensity factor as defined in A1.4.1 witha = a o,n = Poisson’s ratio,sYS = yield or 0.2 % offset yield strength at the temperature of
interest,E = elastic modulus at the test temperature,vpl = plastic component of crack mouth opening displacement at the
point of evaluation on the load-displacement curve, vc, vi, vu,or vm,
z = distance of knife edge measurement point from the notchededge on the single edge bend specimen, and
rp = plastic rotation factor = 0.44.
A1.4.5.2 Calculations of CTOD for the Resistance CurveTest Method—For the resistance curve test method, calcula-tions of CTOD for any point on the load-displacement curveare made from the following expression:
d ~i! 5K~i!
2 ~1 2 v2!
2s YSE1
@rp~W2 a ~i!! 1 Da#vpl~i!
@rp ~W2 a ~i!! 1 a ~i! 1 z#(A1.13)
where:a (i) = current crack length,Da = a (i) − ao,K (i) = stress intensity factor as defined in A1.4.1 witha = a (i), and
the other terms are defined in A1.4.5.1.
A2. SPECIAL REQUIREMENTS FOR TESTING COMPACT SPECIMENS
A2.1 Specimen
A2.1.1 The standard compact specimen,C(T), is a singleedge-notched and fatigue cracked plate loaded in tension. Twospecimen geometries which have been used successfully forJtesting are shown in Fig. A2.1.
A2.1.2 The compact specimen in Fig. A2.2 has generallybeen used only forKIc testing; it has no provision for load-linedisplacement measurement. Do not use this specimen forductile fracture toughness measurement. Use it only whenKIcbehavior is expected.
A2.1.3 Alternative specimens may have 2# W/B # 4 butwith no change in other proportions.
A2.2 Apparatus
A2.2.1 For generally applicable specifications concerningthe loading clevis and displacement gage, see 6.5.2 and 6.2.
A2.3 Specimen Preparation
A2.3.1 For generally applicable specifications concerningspecimen size and preparation see Section 7.
A2.3.2 All specimens shall be precracked in fatigue at aload value based upon the loadPf as follows:
Pf 50.4Bbo
2sY
~2W1 ao!(A2.1)
See Section 7 for fatigue precracking requirements.
A2.4 Calculation
A2.4.1 Calculation of K—For the compact specimen at aload P (i), calculateK as follows:
K ~i! 5Pi
~BBNW!1/2f~a i/W! (A2.2)
with:
@~2 1 a i/W! ~0.8861 4.64~ai/W! (A2.3)
f~ai/W! 52 13.32~ai/W! 2 1 14.72~ai/W!3 2 5.6~a i/W!4!#
~1 2 ai/W! 3/2
A2.4.2 Calculation of J—For the compact specimen calcu-late J as follows:
J 5 Jel 1 Jpl (A2.4)
where:Jel = elastic component ofJ, andJpl = plastic component ofJ.
A2.4.2.1 J Calculations for the Basic Test Method—For thecompact specimen at a point corresponding to v,P on thespecimen load versus load-line displacement record calculateas follows:
E 1820
14COPYRIGHT 2003; ASTM International
Document provided by IHS Licensee=MIT Libraries/6110146001, User=, 10/10/200310:08:20 MDT Questions or comments about this message: please call the DocumentPolicy Group at 1-800-451-1584.
--``,,,,``,,,,,```,``,`,``,``,,-`-`,,`,,`,`,,`---

J 5K2~1 2 n2!
E 1 Jpl (A2.5)
where:K is from A2.4.1 witha = ao, and
Jpl 5hApl
BNbo(A2.6)
where:Apl = Area A as shown in Fig. A1.2,BN = net specimen thickness (BN = B if no side grooves
are present),bo = uncracked ligament, (W − a o), andh = 2 + 0.522bo/W.
FIG. A2.1 Two Compact Specimen Designs That Have Been Used Successfully for Fracture Toughness Testing
E 1820
15COPYRIGHT 2003; ASTM International
Document provided by IHS Licensee=MIT Libraries/6110146001, User=, 10/10/200310:08:20 MDT Questions or comments about this message: please call the DocumentPolicy Group at 1-800-451-1584.
--``,,,,``,,,,,```,``,`,``,``,,-`-`,,`,,`,`,,`---

A2.4.2.2 J Calculation for the Resistance Curve TestMethod—For theC(T)specimen at a point correspondinga (i),v(i), and P(i) on the specimen load versus load-line displace-ment record calculate as follows:
J ~i! 5~K~i!!
2 ~1 2 n2!
E 1 Jpl~i! (A2.7)
whereK(i) is from A2.4.1, and:
Jpl~i! 5 FJpl~i21! 1 Sh ~i21!
b ~i21!D Apl~i! 2 Apl~i21!
BNG
·F1 2 g~i21!
a~i! 2 a~i21!
b ~i21!G (A2.8)
where:h(i− 1) = 2.0 + 0.522b(i−1)/W, andg(i− 1) = 1.0 + 0.76b( i−1)/W.
In Eq A2.8, the quantityApl(i)− Apl(i-1) is the increment ofplastic area under the load versus plastic load-line displace-ment record between lines of constant displacement at pointsi−1 andi shown in Fig. A1.3. The quantityJpl(i) represents thetotal crack growth corrected plasticJ at pointi and is obtainedin two steps by first incrementing the existingJpl(i−1) and thenby modifying the total accumulated result to account for thecrack growth increment. Accurate evaluation ofJ pl(i) from theabove relationship requires small and uniform crack growthincrements consistent with the suggested elastic compliance
spacing of Annex A8 and Annex A10. The quantityApl(i) can becalculated from the following equation:
Apl~i! 5 Apl~i21! 1@P~i! 1 P~i21!# @ vpl~i! 2 v pl~i21!#
2 (A2.9)
where:vpl(i) = plastic part of the load-line displacement, vi − (P
(i)CLL(i) ), andCLL(i) = compliance, (Dv/DP)i required to give the current
crack length,ai.CLL(i) can be determined from knowledge ofai/W using the
following equation:
CLL~i! 51
EBeSW1 ai
W2 a iD2
@2.16301 12.219~a i/W!
2 20.065~ai/W!2 2 0.9925~a i/W!3
1 20.609~ai/W!4 2 9.9314~a i/W!5# (A2.10)
where:
Be 5 B 2~B 2 BN!2
B (A2.11)
In an elastic compliance test, the rotation corrected compli-ance,Cc(i), described in A2.4.4 shall be used instead ofCLL (i)
in Eq A2.10.A2.4.3 Calculation of Crack Length—For a single speci-
men test method using an elastic compliance technique on thecompact specimen with crack opening displacements measured
NOTE 1—A surfaces shall be perpendicular and parallel as applicable to within 0.002 W TIR.NOTE 2—The intersection of the crack starter notch tips with the two specimen surfaces shall be equally distant from the top and bottom edges of the
specimen within 0.005 W.NOTE 3—Integral or attachable knife edges for clip gage attachment to the crack mouth may be used.NOTE 4—For starter-notch and fatigue-crack configuration see Fig. 6.
FIG. A2.2 Compact Specimen for KIc Testing
E 1820
16COPYRIGHT 2003; ASTM International
Document provided by IHS Licensee=MIT Libraries/6110146001, User=, 10/10/200310:08:20 MDT Questions or comments about this message: please call the DocumentPolicy Group at 1-800-451-1584.
--``,,,,``,,,,,```,``,`,``,``,,-`-`,,`,,`,`,,`---

on the load line, the crack length is given as follows:
ai/W5 @1.0001962 4.06319u 1 11.242u 2 2 106.043u3
1 464.335u 4 2 650.677u5# (A2.12)
where:
u 51
@BeECc~i!#1/2 1 1
(A2.13)
Cc(i) = specimen load-line crack opening elastic compli-ance (Dv/D P) on an unloading/reloading sequencecorrected for rotation (see A2.4.4),
Be = B − (B − B N)2/B.
A2.4.4 To account for crack opening displacement inC(T)specimens, the crack length estimation shall be corrected forrotation. Compliance is corrected as follows:
Cc~i! 5Ci
FH*R sinui 2 cosuiGFD
R sinu i 2 cosuiG (A2.14)
where (Fig. A2.3):Ci = measured specimen elastic compliance (at the load-
line),H* = initial half-span of the load points (center of the pin
holes),R = radius of rotation of the crack centerline, (W + a)/2,
wherea is the updated crack length,D = one half of the initial distance between the displace-
ment measurement points,u = angle of rotation of a rigid body element about the
unbroken midsection line, or
u 5 sin21F Sdm
2 1 DD~D2 1 R2!1/2G2 tan21SD
RD, and (A2.15)
dm = total measured load-line displacement.
A2.4.5 Other compliance equations are acceptable if theresulting accuracy is equal to or greater than those describedand the accuracy has been verified experimentally.
A2.4.6 Calculation of CTOD:
A2.4.6.1 Calculation of CTOD for the Basic Test Method—For the basic test method, calculations of CTOD for any pointon the load-displacement curve are made from the followingexpression:
d~i! 5K~i!
2 ~1 2 n 2!
2sYSE1
@rp~W2 ao!# vpl~i!
@rp ~W2 ao! 1 ao 1 z#(A2.16)
where:ao = original crack length,K = stress intensity factor as defined in A2.4.1 with
a = ao,
n = Poisson’s ratio,sYS = yield or 0.2 % offset yield strength at the tempera-
ture of interest,E = elastic modulus at the test temperature,vpl = plastic component of clip gage opening displace-
ment at the point of evaluation on the load-displacement curve, vc, vu, or vm,
z = distance of knife-edge measurement point from theload-line on theC(T) specimen, and
rp = plastic rotation factor = 0.4 (1 +a),where:
a 5 2FS ao
boD2
1ao
bo1
12G1/2
2 2Sao
bo1
12D (A2.17)
A2.4.6.2 Calculation of CTOD for the Resistance CurveTest Method—For the resistance curve test method, calcula-tions of CTOD for any point on the load-displacement curveare made from the following expression:
d ~i! 5K~i!
2 ~1 2 n2!
2s YSE1
@rp~i!~W2 a ~i!! 1 Da#vpl~i!
@rp~i!~W2 a ~i!! 1 a ~i! 1 z#(A2.18)
FIG. A2.3 Elastic Compliance Correction for Specimen Rotation
E 1820
17COPYRIGHT 2003; ASTM International
Document provided by IHS Licensee=MIT Libraries/6110146001, User=, 10/10/200310:08:20 MDT Questions or comments about this message: please call the DocumentPolicy Group at 1-800-451-1584.
--``,,,,``,,,,,```,``,`,``,``,,-`-`,,`,,`,`,,`---

where:Da = a (i) − ao,K (i) = stress intensity factor as defined in A2.4.1, with
a = a (i), andrp(i) = plastic rotation factor = 0.4 (1 +a (i)),
where
a~i! 5 2FSa~i!
b~i!D2
1a~i!
b ~i!1
12G1/2
2 2Sa~i!
b ~i!1
12D (A2.19)
and the other terms are defined in A2.4.6.1.
A3. SPECIAL REQUIREMENTS FOR TESTING DISK-SHAPED COMPACT SPECIMENS
A3.1 Specimen
A3.1.1 The standard disk-shaped compact specimen,DC(T), is a single edge-notched and fatigue cracked plateloaded in tension. The specimen geometry which has been usedsuccessfully is shown in Fig. A3.1.
A3.1.2 Alternative specimens may have 2# W/B # 4 butwith no change in other proportions.
A3.2 Apparatus
A3.2.1 For generally applicable specifications concerningthe loading clevis and displacement gage see 6.5.2 and 6.2.
A3.3 Specimen Preparation
A3.3.1 For generally applicable specifications concerningspecimen size and preparation, see Section 7.
A3.3.2 All specimens shall be precracked in fatigue at aload value based upon the loadPf as follows:
Pf 50.4Bbo
2sY
~2W1 ao!(A3.1)
See 7.4 for precracking requirements.
A3.4 Procedure
A3.4.1 Measurement— The analysis assumes the specimenwas machined from a circular blank, and, therefore, measure-ments of circularity as well as width,W; crack length,a; andthicknesses,B andBN , shall be made. Measure the dimensions
BN and B to the nearest 0.05 mm (0.002 in.) or 0.5 %,whichever is larger.
A3.4.1.1 The specimen blank shall be checked for circular-ity before specimen machining. Measure the diameter at eightequally spaced points around the circumference of the speci-men blank. One of these measurements shall lie in the intendednotch plane. Average these readings to obtain the diameter,D.If any measurement differs from the average diameter,D, bymore than 5 %, machine the blank to the required circularity.Otherwise,D = 1.35W.
A3.4.1.2 Measure the width,W, and the crack length,a,from the plane of the centerline of the loading holes (thenotched edge is a convenient reference line but the distancefrom the centerline of the holes to the notched edge must besubtracted to determineWanda). Measure the width,W, to the
NOTE 1—All surfaces shall be perpendicular and parallel as applicable within 0.002 W TIR.NOTE 2—The intersection of the crack starter notch tips on each surface of the specimen shall be equally distant within 0.005W from the centerline
of the loading holes.NOTE 3—Integral or attached knife edges for clip gage attachment to the crack mouth may be used.NOTE 4—For starter-notch and fatigue-crack configuration see Fig. 6.NOTE 5—Required circularity measurements shall be made at eight equally spaced points around the circumference. One of these points shall be the
notch plane. Average the readings to obtain the radius. All values shall be within 5 % of the average.FIG. A3.1 Disk-Shaped Compact Specimen, DC(T), Standard Proportions and Dimensions
E 1820
18COPYRIGHT 2003; ASTM International
Document provided by IHS Licensee=MIT Libraries/6110146001, User=, 10/10/200310:08:20 MDT Questions or comments about this message: please call the DocumentPolicy Group at 1-800-451-1584.
--``,,,,``,,,,,```,``,`,``,``,,-`-`,,`,,`,`,,`---

nearest 0.05 mm (0.002 in.) or 0.5 %, whichever is larger.
A3.5 Calculation
A3.5.1 Calculation of K—For the DC(T) specimen at a loadP(i), calculateKas follows:
K ~i! 5Pi
~BBNW!1/2 f~a i/W! (A3.2)
where:
@~2 1 a i/W! ~0.761 4.8~ai/W! 2 11.58~a i/W!2 (A3.3)
f~ai/W! 51 11.43~ai/W!3 2 4.08~a i/W!4!#
~1 2 ai/W! 3/2
A3.5.2 Calculation of J—For the DC(T) specimen, calcu-late J as follows:
J 5 Jel 1 Jpl (A3.4)
where:Jel = elastic component ofJ, andJpl = plastic component ofJ.
A3.5.2.1 J Calculation for the Basic Test Method—For theDC(T) specimen at a point corresponding to v(i), P(i) on thespecimen load versus load-line displacement record calculateas follows:
J 5K2~1 2 n 2!
E 1 Jpl (A3.5)
whereK is from A3.5.1 witha = ao, and
Jpl 5hApl
BNbo(A3.6)
where:Apl = Area A as shown in Fig. A1.2,BN = net specimen thickness (BN = B if no side grooves
are present),bo = uncracked ligament, (W − a o), andh = 2 + 0.522bo/W.
A3.5.2.2 J Calculation for the Resistance Curve TestMethod—For the DC(T) specimen at a point corresponding toai, vi, andPi on the specimen load versus load-line displace-ment record, calculate as follows:
J ~i! 5~K~i!!
2 ~1 2 v2!
E 1 Jpl~i! (A3.7)
whereK(i) is from A3.5.1 and:
Jpl~i! 5 FJpl~i21! 1 Sh ~i21!
b ~i21!D Apl~i! 2 Apl~i21!
BNG
F 1 2 g~i21!
a ~i! 2 a~i21!
b ~i21!G (A3.8)
where:h(i− 1) = 2.0 + 0.522 b(i−1)/W, andg(i− 1) = 1.0 + 0.76 b(i−1)/W.
In the preceding equation, the quantityApl(i) − Apl(i−1) is theincrement of plastic area under the load versus load-linedisplacement record between lines of constant displacement atpoints i−1 and i shown in Fig. A1.3. The quantityJpl(i)
represents the total crack growth corrected plasticJ at Pointiand is obtained in two steps by first incrementing the existingJpl(i−1) and then by modifying the total accumulated result to
account for the crack growth increment. Accurate evaluation ofJpl(i) from the preceding relationship requires small and uni-form crack growth increments consistent with the suggestedelastic compliance spacing of Annex A8 and Annex A10. ThequantityApl(i) can be calculated from the following equation:
Apl~i! 5 Apl~i21! 1@P~i! 1 P ~i21!# @vpl~i! 2 vpl~i21!#
2 (A3.9)
where:vpl(i) = plastic part of the load-line displacement, vi −
(PiCLL(i)), andCLL(i) = compliance, (Dv/DP)i required to give the current
crack length,ai.For test methods that do not utilize the elastic compliance
techniques,CLL(i) can be determined from knowledge ofa(i)/Wusing the following equation:
CLL~i! 51
EBeS1 1 a~i!/W
1 2 a ~i!/WD2
@2.04621 9.6496~a i/W! 2 13.7346~a ~i!/W!2
1 6.1748~a ~i!/W!3# (A3.10)
where:Be = B − (B − B N)2/B.
In an elastic compliance test, the rotation corrected compli-ance,Cc(i), described in A3.5.4 shall be used instead ofCLL(i)
given above.A3.5.3 Calculation of Crack Length—For a single-
specimen test method using an elastic compliance technique onDC(T) specimens with crack opening displacements measuredat the load-line, the crack length is given as follows:
a ~i!/W5 0.9981932 3.88087u 1 00.187106u 2
1 20.3714u3 2 45.2125u 4 1 44.5270u5 (A3.11)
where:
u 51
@~BeECc~i!!1/2 1 1#
(A3.12)
where:Cc (i) = specimen crack opening compliance (Dv/DP) on
an unloading/reloading sequence, corrected forrotation (see A3.5.4),
Be = B − (B − BN) 2/B.A3.5.4 To account for crack opening displacement in DC(T)
specimens, the crack size estimation shall be corrected forrotation. Compliance shall be corrected as follows:
Cc~i! 5Ci
FH*R sinui 2 cosu iGFD
Rsinui 2 cosuiG (A3.13)
where (Fig. A2.3):Ci = measured specimen elastic compliance (at the load-
line),H* = initial half-span of the load points (center of the pin
holes),R = radius of rotation of the crack centerline, (W + a)/2,
wherea is the updated crack length,D = one half of the initial distance between the displace-
ment measurement points,
E 1820
19COPYRIGHT 2003; ASTM International
Document provided by IHS Licensee=MIT Libraries/6110146001, User=, 10/10/200310:08:20 MDT Questions or comments about this message: please call the DocumentPolicy Group at 1-800-451-1584.
--``,,,,``,,,,,```,``,`,``,``,,-`-`,,`,,`,`,,`---

u = angle of rotation of a rigid body element about theunbroken midsection line, or
u 5 sin21F Sdm
2 1 DD~D2 1 R2!1/2G2 tan21SD
RD, and (A3.14)
dm = total measured load-line displacement.
A3.5.5 Other compliance equations are acceptable if theresulting accuracy is equal to or greater than those describedand the accuracy has been verified experimentally.
A3.5.6 Calculation of CTOD:A3.5.6.1 Calculation of CTOD for the Basic Test Method—
For the basic test method calculations of CTOD for any pointon the load-displacement curve are made from the followingexpression:
d~i! 5K~i!
2 ~1 2 n 2!
2sYSE1
@rp~W2 ao!# vpl~i!
@rp ~W2 ao! 1 ao 1 z#(A3.15)
where:ao = original crack length,K = stress intensity factor as defined in A3.5.1 with
a = ao,
n = Poisson’s ratio,sYS = yield or 0.2 % offset yield strength at the tempera-
ture of interest,E = elastic modulus at the test temperature,
vpl = plastic component of clip gage opening displace-ment at the point of evaluation on the load-displacement curve, vc, vu, or vm,
z = distance of knife edge measurement point from theload-line on the C(T) specimen, and
rp = plastic rotation factor = 0.4 (1 +a),
where:
a 5 2FS ao
boD2
1ao
bo1
12G1/2
2 2Sao
bo1
12D (A3.16)
A3.5.6.2 Calculation of CTOD for the Resistance CurveTest Method—For the resistance curve test method, calcula-tions of CTOD for any point on the load-displacement curveare made from the following expression:
d ~i! 5K~i!
2 ~1 2 n2!
2s YSE1
@rp~i!~W2 a ~i!! 1 Da#vpl~i!
@rp~i!~W2 a ~i!! 1 a ~i! 1 z#(A3.17)
where:a (i) = current crack length,Da = a (i) − ao,K (i) = stress intensity factor as defined in A3.5.1, with
a = a (i), andrp(i) = plastic rotation factor = 0.4 (1 +a (i)),
where:
a~i! 5 2FSa~i!
b ~i!D2
1a~i!
b ~i!1
12G1/2
2 2Sa~i!
b ~i!1
12D (A3.18)
and the other terms are defined in A3.5.6.1.
A4. METHODS FOR EVALUATING INSTABILITY AND POP-IN
NOTE A4.1—Annex A4-Annex A7 through cover methods for evaluat-ing toughness for fracture instability.
A4.1 Pop-In Crack Propagation:
A4.1.1 If the pop-in is attributed to an arrested fractureinstability in the plane of the fatigue precrack, the result isconsidered to be a characteristic of the material tested. Pop-incan be assessed by a specific change in compliance, and also aposttest examination of the fracture surfaces. Pop-ins are onlyevaluated when the load rises with increasing displacementafter the pop-in.
A4.1.2 The following procedure may be used to assess thesignificance of small pop-ins when the post-test examinationindicates that these are associated with arrested fracture insta-bility in the plane of the fatigue precrack (Refer to Fig. A4.1):
A4.1.2.1 Draw a line,CB, which is parallel to the initialslope0A and that passes through the crack initiation load pointof the pop-in under consideration.
A4.1.2.2 Draw a second line, that originates at PointC: LineCF, and that has 5 % reduced slope from LineCB.
A4.1.2.3 Mark the pointG, corresponding to the load anddisplacement at pop-in crack arrest.
A4.1.2.4 When PointG is within the angleBCF, the pop-inis judged to be insignificant. (See Fig. A4.1(b).)
A4.1.2.5 When PointGis outside the angleBCF, the pop-inis significant (see Fig. A4.1(a)). J andd values determinedbeyond point G are invalid. Calculate values of fracturetoughness corresponding to the point of onset (vc or v u).
E 1820
20COPYRIGHT 2003; ASTM International
Document provided by IHS Licensee=MIT Libraries/6110146001, User=, 10/10/200310:08:20 MDT Questions or comments about this message: please call the DocumentPolicy Group at 1-800-451-1584.
--``,,,,``,,,,,```,``,`,``,``,,-`-`,,`,,`,`,,`---

A5. METHOD FOR KIc DETERMINATION
A5.1 This annex describes the methods and calculationsrequired to determine the linear elastic, plane-strain fracturetoughness,KIc, and the associated requirements for qualifyingthe data according to this test method. Data meeting all of thequalification requirements of 9.1 and those of this annex resultin a size-independentK Ic value.
A5.2 Test Record—Conduct the test following the proce-dure in Section 8. Make a test record as shown in Fig. A5.1with the load along the vertical axis and crack-mouth displace-ment along the horizontal axis. This record can be generatedautographically during the test or after the test from digitallyrecorded data. If only an autographic record is taken, the initial
slope of the linear portion on the plotter shall be between 0.7and 1.5.
A5.3 Calculation of Results—In order to determineKIc inaccordance with this test method, it is necessary first tocalculate a conditional result,KQ, which involves a construc-tion on the test record, and then to determine whether thisresult is consistent with size and yield strength requirements.The procedure is as follows:
A5.3.1 Construct a secant line as shown on Fig. A5.1 witha slope (P/v)5 = 0.95(P/v)o where (P/v)o is the slope of thetangentOA to the initial portion of the data record. This slopecan be obtained from a slope calculation using digital data or
NOTE 1—Slope of Line CF is exaggerated for clarity.FIG. A4.1 Procedure for Evaluating Significance of Pop-in
E 1820
21COPYRIGHT 2003; ASTM International
Document provided by IHS Licensee=MIT Libraries/6110146001, User=, 10/10/200310:08:20 MDT Questions or comments about this message: please call the DocumentPolicy Group at 1-800-451-1584.
--``,,,,``,,,,,```,``,`,``,``,,-`-`,,`,,`,`,,`---

fit to an autographic record as desired.
NOTE A5.1—Slight nonlinearity often occurs at the very beginning of arecord and should be ignored. However, it is important to establish theinitial slope of the record with high precision and therefore it is advisableto minimize this nonlinearity by a preliminary loading and unloading withthe maximum load not producing a stress intensity level exceeding thatused in the final stage of fatigue cracking.
The loadPQ is then defined as follows: if the load at everypoint on the record that precedesP5 is lower thanP5, thenP5
is PQ (Fig. A5.1, Type I); if, however, there is a maximum loadprecedingP5 that exceeds it, then this maximum load isPQ
(Fig. A5.1, Types II and III).
NOTE A5.2—For the Annex A1-Annex A3 specimens over the range0.45# a/W # 0.55, the 95 % offset criterion corresponds to an increasein elastic compliance equivalent to that caused by a crack extension ofapproximately 2 % of the original remaining ligament,b o or the originalcrack length,a o.
A5.4 Qualification of KQ as KIc:
A5.4.1 ForKQ to be qualified as aKIc value it must meet thequalification requirements of 9.1. To be a size-independentKvalue, it must meet the following requirements:
A5.4.2 Calculate the ratioPmax/PQ, where Pmax is themaximum load the specimen was able to sustain (see Fig.A5.1). If this ratio does not exceed 1.10, proceed to calculateKQ as described in Annex A1-Annex A3 using the formulaappropriate to the specimen being tested. IfPmax/PQ doesexceed 1.10, then the test is not a size-independentKIc test
because it is then possible thatKQ bears no relation toKIc.A5.4.3 Calculate 2.5 (KQ/sYS)
2 wheresYSis the 0.2 % offsetyield strength in tension (see Test Methods E 8). If this quantityis less than both the specimen thickness,B, and the length ofthe initial uncracked ligament,bo, then KQ is equal toKIc.Otherwise, the test is not a qualified and sizeindependentKIc
test. Expressions for calculations ofKQ are given in the AnnexA1-Annex A3 appropriate to the specimen being tested.
A5.4.4 If the test result fails to meet the qualificationrequirements in 9.1 or in A5.4, or both, it will be necessary touse a larger specimen to determineKIc. The dimensions of thelarger specimen can be estimated on the basis ofKQ butgenerally will be at least 1.5 times those of the specimen thatfailed to yield a qualified and size-independentKIc value. TheunqualifiedKIc test result can be evaluated by the methods ofAnnex A4-Annex A7 and Annex A8-Annex A11 to determinewhether other measures of fracture toughness can be developedfrom this test method.
A5.5 Significance of KIc—The propertyKIc determined bythis test method characterizes the resistance of a material tofracture in a neutral environment in the presence of a sharpcrack under severe tensile constraint, such that the state ofstress near the crack front approaches tritensile plane strain,and the crack-tip plastic region is small compared to both thecrack size and to the specimen dimension in the constraintdirection. AKIc value is believed to represent the lower limitingvalue of fracture toughness.
FIG. A5.1 Principle Types of Load-Displacement Records
E 1820
22COPYRIGHT 2003; ASTM International
Document provided by IHS Licensee=MIT Libraries/6110146001, User=, 10/10/200310:08:20 MDT Questions or comments about this message: please call the DocumentPolicy Group at 1-800-451-1584.
--``,,,,``,,,,,```,``,`,``,``,,-`-`,,`,,`,`,,`---

A6. FRACTURE INSTABILITY TOUGHNESS DETERMINATION USING J
A6.1 This annex describes the method for characterizingfracture toughness values based onJ, Jc, or Ju, for a fractureinstability and the associated requirements for qualifying thedata according to this test method. Data meeting all of thequalification requirements of 9.1 and those of this annex resultin qualified values ofJc or Ju. Data meeting the size require-ment result in a value ofJc that is insensitive to the in-planedimensions of the specimen.
A6.2 Fracture Instability Before Stable Tearing—Whenfracture occurs before stable tearing a single-point toughnessvalue may be obtained labeledJc.
A6.2.1 J is calculated at the final point, instability, using theJ formulas for the basic method. (Note: These formulas mustbe applied for evaluatingJ no matter which method was usedin the test because a resistance curve was not obtained.) Thispoint is labeledJQc, a provisionalJc value.
A6.2.2 Qualification of JQc as Jc—JQc = Jc, a measure offracture toughness at instability without significant stable crackextension that is independent of in-plane dimensions, providedthe following two conditions are both met: (1) if the materialis a ferritic steel and the measured room temperature yield andtensile strength fall within the box illustrated in Fig. A6.1,B, bo
$ 50 JQ/s Y, otherwiseB, bo $ 100 JQ/sY, and ( 2) crackextensionDap < 0.2 mm +JQ/MsY whereM = 2, or an alter-native value can be determined from the test data, see A9.8.Note that even if these conditions are met, Jc may be dependenton thickness (length of crack front).
A6.3 Fracture Instability After Stable Tearing—Whenfracture occurs after stable tearing crack extensionDap >0.2mm (0.008 in.) +JQ/Ms Y, a single-point fracture toughnessvalue may be obtained, labeledJQu. In addition, part of anRcurve may be developed or the final point may be used in theevaluation of an initiation toughness valueJIc (these are
described in Annex A8-Annex A11).
A6.3.1 J is calculated at the final point where instabilityoccurs using theJ formulas for the basic method. Theseformulas must be used for evaluating a singleJ value no matterwhich method was used in the test. This point is aJu value.
A6.3.2 Qualification of JQu as Ju—JQu = J u if crack exten-sion Dap $ 0.2 mm (0.008 in.) +JQ/Ms Y.
A6.4 Significance of Jc and Ju—Values ofJQc that meet thesize criteria are labeledJc and are considered to be insensitiveto the in-plane dimensions of the specimen. Values ofJQc thatdo not meet validity remainJ Qc and may be size-dependent.Ju
is not considered to be a size-insensitive property and thereforeis not subject to a size criterion. It is a characteristic of thematerial and specimen geometry and size. It signifies that at thetest temperature the material is not completely ductile and cansustain only limitedR-curve behavior.
A7. FRACTURE INSTABILITY TOUGHNESS DETERMINATION USING CTOD ( d)
A7.1 This annex describes the method for characterizingfracture toughness values based ond, dc,du, ordm, for a fractureinstability and the associated requirements for qualifying thedata according to this test method. Data meeting all of thequalification requirements of 9.1 and those in this annex resultin qualified values ofdc, du, or dm. Data meeting the sizerequirement result in a value ofdc that is insensitive to in-planedimensions of the specimen.
A7.2 Fracture Instability Before Stable Tearing—Whenfracture occurs before stable tearing a single-point toughnessvalue may be obtained labeleddc.
A7.2.1 d is calculated at the final point, instability, using thed formulas from Annex A1-Annex A3. This point is labeleddQc, a provisionaldc value.
A7.2.2 Qualification of dQc as dc—A fracture toughnessvalue that is insensitive to the in-plane dimensions of the
specimen, if the following two conditions are met: (1) dQc = dc
if B, bo$ 300 dQc, and (2) crack extensionDap < 0.2 mm(0.008 in.) +dQu/Md whereMd = 1.4 or an alternative value canbe determined from the test data, see A11.3. Data that fail tomeet the size criterion based onB or bo, but still meet therestriction on crack extension, are labeleddc.
A7.3 Fracture Instability After Stable Tearing—Whenfracture occurs after stable tearing, crack extensionD ap $ 0.2mm (0.008 in.) + 0.7dQu, a single-point fracture toughnessvalue may be obtained, labeleddu. In addition, part of anRcurve may be developed or the final point may be used in theevaluation of an initiation toughness value (these are describedin Annex A8-Annex A11).
A7.3.1 d is calculated at the final point where instabilityoccurs, using thed formulas for the basic method. Theseformulas must be used for evaluating a singled value no matter
FIG. A6.1 Strength Limits Within Which Use of M = 50 is Justifiedfor Ferritic Steels.
E 1820
23COPYRIGHT 2003; ASTM International
Document provided by IHS Licensee=MIT Libraries/6110146001, User=, 10/10/200310:08:20 MDT Questions or comments about this message: please call the DocumentPolicy Group at 1-800-451-1584.
--``,,,,``,,,,,```,``,`,``,``,,-`-`,,`,,`,`,,`---

which apparatus was used in the test. This point is labeleddQu,a provisionaldu value.
A7.3.2 Qualification ofdQu asdu—dQu = du, if crack exten-sion,Dap > 0.2 mm (0.008 in.) +dQu/Md whereMd = 1.4 or analternative value can be determined from the test data, seeA11.3.
A7.3.3 Significance ofdc and du—Values ofdQc that meetthe qualification requirements are labeleddc and are consideredto be insensitive to the in-plane dimensions of the specimen.Values ofdQc that do not meet the size requirement aredc andmay be size-dependent.du is not considered to be a size-insensitive property and, therefore, is not subject to a sizecriterion. It is a characteristic of the material and specimen
geometry and size. It signifies that at the test temperature thematerial is not completely ductile and can sustain only limitedR-curve behavior.
A7.4 Maximum Loaddm—When no fracture instabilityoccurs up to the first attainment of maximum load, a value ofdm can be calculated.d is calculated at the first attainment ofmaximum load plateau using the formulas for the basicmethod. These formulas must be used no matter whichapparatus was used.dm may be size-dependent and a functionof test specimen geometry and is not subject to a size criterion.It can be useful to define limits on ductile fracture behavior.
A8. J-R CURVE DETERMINATION
NOTE A8.1—Annex A8-Annex A11 cover methods for evaluatingtoughness for stable tearing.
A8.1 This method describes a single-specimen techniquefor determining theJ-R curve of metallic materials. TheJ-Rcurve consists of a plot ofJ versus crack extension in theregion ofJ controlled growth. To measure theJ-R curve, theresistance curve procedure of 8.6 must be used. TheJ-Rcurveis qualified provided that the criteria of 9.1 and A8.3 aresatisfied.
A8.2 J Calculation:
A8.2.1 J can be calculated at any point on the load versusload-line displacement record using the equations suggested inthe calculation section of Annex A1-Annex A3 for the differentspecimen geometries.
A8.2.2 The values of crack length are calculated using thecompliance equations described in Annex A1-Annex A3 (or analternative method for measuring crack length). The rotationcorrection shall be applied to account for geometry changesdue to deformation for the compact, C(T) and disk-shapedcompact DC(T) specimens.
A8.2.3 The unload/reload sequences should be spaced withthe displacement interval not to exceed 0.01W, the average
being about 0.005W. If an initiation value of toughness isbeing evaluated more unload/reload sequences may be neces-sary in the early region of theJ-R curve.
A8.3 Measurement Capacity of Specimen:
A8.3.1 The maximumJ-integral capacity for a specimen isgiven by the smaller of the following:
Jmax5 bsY/20, or
Jmax5 BsY/20.
A8.3.2 The maximum crack extension capacity for a speci-men is given by the following:
Damax5 0.25bo
A8.4 Constructing the J-R Curve:
A8.4.1 TheJ-integral values and the corresponding crackextension values must be plotted as shown in Fig. A8.1. Shiftthe J-R curve according to the procedure described in A9.3.TheJ-Rcurve is defined as the data in a region bounded by thecoordinate axes and theJmaxandD amax limits given in A8.3.1and A8.3.2.
E 1820
24COPYRIGHT 2003; ASTM International
Document provided by IHS Licensee=MIT Libraries/6110146001, User=, 10/10/200310:08:20 MDT Questions or comments about this message: please call the DocumentPolicy Group at 1-800-451-1584.
--``,,,,``,,,,,```,``,`,``,``,,-`-`,,`,,`,`,,`---

A9. JIc and KJIc EVALUATION
A9.1 Significance—The propertyJIc determined by thismethod characterizes the toughness of a material near the onsetof crack extension from a preexisting fatigue crack. TheJIc
value marks the beginning stage of material crack growthresistance development, the full extent of which is covered inAnnex A8.JIc is qualified provided that the criteria of 9.1 andA9.8 and A9.9 are satisfied.
A9.2 J Calculation—Calculations of theJ integral aremade using the equations in Annex A1-Annex A3.
A9.3 Corrections and Adjustments to Data:
A9.3.1 A correction is applied to the estimatedDai datavalues to obtain an improvedaoq. This correction is intended toobtain the best value ofaoq, based on the initial set of cracklength estimates,ai, data. For data generated using the basicprocedure of 8.4, no adjustments to the data are necessary. ToevaluateJIc using data from the basic procedure, proceed toA9.6.
A9.3.2 A modified construction line slope,M, can becalculated from a fit to the initialJi andai data, and used for thecalculation ofJIc.
A9.3.3 Adjustment of aoq—The value ofJQ is very depen-dent on theaoq used to calculate theDai quantities. The valueobtained foraoq in 8.6.3.1 might not be the correct value andthe following adjustment procedure is required.
A9.3.3.1 Identify allJi and ai pairs that were determinedbefore the specimen reached the maximum load for the test.Use this data set of points to calculate a revisedaoq from thefollowing equation:
a 5 aoq 1J
2sY1 BJ2 1 CJ3 (A9.1)
The coefficients of this equation shall be found using a leastsquares fit procedure. An example BASIC code (see Fig. X1.1)to accomplish this fit is presented in Appendix X1.
A9.3.3.2 If the number of points used in A9.3.3.1 todetermineaoq is less than 8 or of these 8 there are less than 3between 0.4JQ andJQ or the correlation coefficient of this fitis less than 0.96, the data set is not adequate to evaluate anytoughness measures in accordance with this test method.
A9.4 If the optically measured crack length,ao, differs fromaoq by more than 0.01W, the data set is not adequate accordingto this test method.
A9.5 Evaluate the finalJi values using the adjustedaoq ofA9.3.3 and the equations of the applicable Annex A1, AnnexA2, or Annex A3.
A9.6 Calculation of an Interim JQ:
A9.6.1 Basic Procedure—for each specimen, calculateDaas follows:
FIG. A8.1 Typical J-R Curve
E 1820
25COPYRIGHT 2003; ASTM International
Document provided by IHS Licensee=MIT Libraries/6110146001, User=, 10/10/200310:08:20 MDT Questions or comments about this message: please call the DocumentPolicy Group at 1-800-451-1584.
--``,,,,``,,,,,```,``,`,``,``,,-`-`,,`,,`,`,,`---

Da 5 ap 2 ao (A9.2)
Resistance Curve Procedure—for each ai value, calculate acorrespondingDai as follows:
Dai 5 ai 2 a0q (A9.3)
Plot J versus Da as shown in Fig. A9.1. Determine a
construction line in accordance with the following equation:
J 5 MsYDa (A9.4)
whereM = 2 or M can be determined from the test data. Insome cases the initial slope of theJ-Rcurve is steeper than 2sY,for example with austenitic stainless steels. For these materials,it is recommended that aJQ value be determined usingM = 2such that an experimentalM can then be evaluated and verifiedaccording to A9.7. An improvedJQ can then be evaluated.Under no circumstances can a value ofM less than 2 be usedfor JQ evaluation.
A9.6.2 Plot the construction line, then draw an exclusionline parallel to the construction line intersecting the abscissa at0.15 mm (0.006 in.). Draw a second exclusion line parallel tothe construction line intersecting the abscissa at 1.5 mm (0.06in.). Plot allJ − Da data points that fall inside the area enclosedby these two parallel lines and capped byJlimit = bos Y/15.
A9.6.3 Plot a line parallel to the construction and exclusionlines at an offset value of 0.2 mm (0.008 in.).
A9.6.4 At least oneJ–Da point shall lie between the0.15-mm (0.006-in.) exclusion line and a parallel line with anoffset of 0.5 mm (0.02 in.) from the construction line as shownin Fig. A9.2. At least oneJ−Da point shall lie between this0.5-mm offset line and the 1.5-mm (0.06-in.) exclusion line.Acceptable data are shown in Fig. A9.2. The otherJ−Da pairscan be anywhere inside the exclusion zone.
A9.6.5 Using the method of least squares, determine a linearregression line of the following form:
lnJ 5 lnC1 1 C 2 lnSDak D (A9.5)
wherek = 1.0 mm or 0.0394 in. Use only the data whichconform to the requirements stated in the previous sections.
Draw the regression line as illustrated in Fig. A9.1.A9.6.6 The intersection of the regression line of A9.6.5 with
the 0.2-mm offset line definesJQ andDaQ. To determine thisintersection the following procedure is recommended.
A9.6.6.1 As a starting point estimate an interimJQ(1) = JQ(i)
value from the data plot of Fig. A9.1.A9.6.6.2 EvaluateDa(i) from the following:
Da ~i! 5JQ~i!
MsY1 0.2 mm~0.008 in.! (A9.6)
A9.6.6.3 Evaluate an interimJQ(i+1) from the followingpower law relationship:
JQ~i 1 1! 5 C1 SDa~i!
k DC2
(A9.7)
wherek = 1.0 mm or 0.0394 in.A9.6.6.4 Incrementi and return to A9.6.6.2 and A9.6.6.3 to
get Da(i) and interim JQ(i+1) until the interim JQ valuesconverge to within62 %.
A9.6.6.5 Project the intercepts of the power law curve withthe 0.15-mm (0.006-in.) and the 1.5-mm (0.06-in.) exclusionlines vertically down to the abscissa. This indicatesDamin andDalimit, respectively. Eliminate all data points that do not fallbetweenDamin andDalimit as shown in Fig. A9.1. Also elimi-nate all data points which lie above the limitingJ capacitywhereJlimit = bosY/15. The region of qualified data is shown inFig. A9.2.
A9.6.6.6 At least five data points must remain betweenDamin andDalimit andJlimit. Data point spacing must meet therequirements of A9.6.4. If these data points are different fromthose used in A9.6.6 to evaluateJQ, obtain a new value ofJQ
based only on qualified data.
A9.7 An alternative construction line slope,M, can becalculated by fitting the least squares linear regression line tothe initial J-R curve data for data in the region 0.2JQ# Ji #0.6JQ as evaluated withM = 2. A minimum of 6 data points arerequired in the evaluation region to allow an experimentalvalue ofM. Only values ofM $2 are allowed by this method.A revisedJQ can now be evaluated using thisM by returning toA9.6.1-A9.6.6.
FIG. A9.1 Definition of Construction Lines for Data Qualification
FIG. A9.2 Definition of Regions for Data Qualification
E 1820
26COPYRIGHT 2003; ASTM International
Document provided by IHS Licensee=MIT Libraries/6110146001, User=, 10/10/200310:08:20 MDT Questions or comments about this message: please call the DocumentPolicy Group at 1-800-451-1584.
--``,,,,``,,,,,```,``,`,``,``,,-`-`,,`,,`,`,,`---

A9.8 Qualification of Data—The data shall satisfy therequirements of 9.1 and all of the following requirements to bequalified according to this test method. If the data do not passthese requirements no fracture toughness values can be deter-mined according to this test method.
A9.8.1 The power coefficientC 2 of A9.6.5 shall be less than1.0.
A9.8.2 For theResistance Curve Procedurethe followingadditional requirements must be satisified:
A9.8.2.1 aoq shall not differ fromao by more than 0.01W.A9.8.2.2 The number of data available to calculateaoq shall
be$8; the number of data between 0.4JQ andJQ shall be$3;and the correlation coefficient of the least squares fit ofA9.3.3.1 shall be greater than 0.96.
A9.8.2.3 If an experimental value ofM is determined, atleast 6 data points are required in the region 0.2JQ #Ji# 0.6JQ.Only M # 2.0 can be used in the method.
A9.9 Qualification of JQ as JIc—JQ = JIc , a size-independent value of fracture toughness, if:
A9.9.1 ThicknessB > 25 JQ/sY,
A9.9.2 Initial ligament,bo > 25 JQ/sY,A9.9.3 Regression Line Slope—The slope of the power law
regression line,dJ/da, evaluated atDaQ is less thansY.
A9.10 Evaluation of KJIc—Calculate KJIc= =(E8JIc) usingE8 = E/(1-n2) and the qualified JIc of A9.9.
A10. METHOD FOR d-R CURVE DETERMINATION
A10.1 This annex describes a single-specimen techniquefor determining thed-R curve of metallic materials. Thed-Rcurve consists of a plot ofd versus crack extension. To measurethe d-R curve the resistance curve procedure of 8.6 must beused. Thed-Rcurve is qualified provided that the criteria of 9.1and A10.3 are satisfied.
A10.2 d Calculation:
A10.2.1 Thed calculation can be evaluated at any pointalong the load versus load-line displacement record using theequations suggested in the calculation section of Annex A1-Annex A3 for the different specimen geometries.
A10.2.2 The values of crack length are calculated using thecompliance equations described in Annex A1-Annex A3. Therotation correction shall be applied to account for geometrychanges due to deformation for the compact, C(T) and disk-shaped compact DC(T) specimens.
A10.2.3 The unload/reload sequences should be spacedwith the displacement interval less than 0.01 W, the averagebeing about 0.005W. If an initiation value of toughness isbeing evaluated more unload/reload sequences may be neces-sary in the early region of thed-R Curve.
A10.3 Measurement Capacity of a Specimen:
A10.3.1 The maximumd capacity for a specimen is given asfollows:
d max 5 bo/20
A10.3.2 The maximum crack extension capacity for aspecimen is given as follows:
Damax 5 0.25bo.
A10.4 Constructing thed-R Curve:
A10.4.1 Thed values and the corresponding crack exten-sion values must be plotted as shown in Fig. A10.1. Ad- Rcurve is established by smoothly fitting the data points in theregion bounded by the coordinate axes and thedmax andDamax
limits.
FIG. A10.1 Typical d-R Curve
E 1820
27COPYRIGHT 2003; ASTM International
Document provided by IHS Licensee=MIT Libraries/6110146001, User=, 10/10/200310:08:20 MDT Questions or comments about this message: please call the DocumentPolicy Group at 1-800-451-1584.
--``,,,,``,,,,,```,``,`,``,``,,-`-`,,`,,`,`,,`---

A11. METHOD FOR dIc DETERMINATION
A11.1 Significance—The value of CTOD,d Ic, determinedby this method characterizes the fracture toughness of materi-als near the onset of stable crack extension from a preexistingfatigue crack.dIc is qualified provided that the criteria of 9.1and A11.8 and A11.9 are satisfied.
A11.2 d Calculation—Calculations ofd are made using theequations in Annex A1-Annex A3.
A11.3 Corrections and Adjustments to Data:
A11.3.1 A correction is applied to the estimatedai datavalues to obtain an improvedaoq. This correction is intended toobtain the best value ofaoq, based on the initial set of cracklength estimates,ai, data. For data generated using the basicprocedure of 8.4, no adjustments to the data are necessary. ToevaluatedIc using data from the basic procedure, proceed toA11.7.
A11.3.2 A modified construction line slope,Md, can becalculated from a fit to the initialdi andai data, and used for thecalculation ofdIc.
A11.3.3 Adjustment of aoq—The value ofdQ is very depen-dent on theaoq used to calculate theDai quantities. The valueobtained foraoq in 8.6.3.1 might not be the correct value, andthe following adjustment procedure is required.
A11.3.3.1 Identify alldi andai pairs that were determinedbefore the specimen reached the maximum load for the test.Use this data set of points to calculate a revisedaoq from thefollowing equation:
a 5 aoq 1d
1.41 Bd2 1 Cd 3 (A11.1)
The coefficients of this equation shall be found using a leastsquares fit procedure. Example BASIC code (see Fig. X1.1) toaccomplish this fit is presented in Appendix X1.
A11.3.3.2 If the number of points used in A11.3.3.1 tocalculateaoq is less than 8, or of these 8 there are less than 3between 0.4dQ anddQ, or the correlation coefficient of this fitis <0.96, the data set is not adequate to evaluate any toughnessmeasures in accordance with this method.
A11.4 If the optically measured crack length,ao, differsfrom aoq by more than 0.01 W, the data set is not adequate inaccordance with this method.
A11.5 Evaluate the finaldi values using the adjustedaoq ofA11.3.3.1 and the equations of the applicable Annex A1,Annex A2, or Annex A3.
A11.6 Calculation of an InterimdQ:
A11.6.1 Basic Procedure—for each specimen, calculateDaas follows:
Da 5 ap 2 ao (A11.2)
Resistance Curve Procedure—for each ai value, calculate acorrespondingDai as follows:
Dai 5 ai 2 a0q (A11.3)
Plotd versusDa as shown in Fig. A11.1. Draw a constructionline in accordance with the following equation:
d 5 Md Da (A11.4)
whereMd = 1.4 orMd can be determined from the test data.In some cases the initial slope of thed-R curve is steeper than1.4. For these materials it is recommended that adQ value bedetermined usingM d = 1.4 such that an experimentalMd canthen be evaluated and verified according to A11.7. An im-proveddQ can then be evaluated. Under no circumstances cana value ofMd less than 1.4 be used fordQ evaluation.
A11.6.2 Plot the construction line on suitable graph paper.Draw an exclusion line parallel to the construction lineintersecting the abscissa at 0.15 mm (0.006 in.) as shown inFig. A11.1. Draw a second exclusion line intersecting theabscissa at 1.5-mm (0.06-in.). Plot alld-Dap data points thatfall inside the area enclosed by these two parallel lines andcapped bydlimit = bo/15.
A11.6.3 Oned-Dap point must lie between the 0.15-mm(0.006-in.) exclusion line and a parallel line with an offset of0.5 mm (0.02 in.) from the construction line. Oned-Dap pointmust lie between a line parallel to the construction line at anoffset of 0.5 mm (0.020 in.) and the 1.5-mm exclusion line.Acceptable data is shown in Fig. A11.2 with one point in ZoneA and one point in Zone B. The otherd-Dap pairs can be placedanywhere inside the exclusion zone.
A11.6.4 Plot a line parallel to the construction line andexclusion lines at an offset value of 0.2 mm (0.008 in.).
A11.6.5 To establish a crack initiation measurement pointunder dominant slow-stable crack growth, a power law curvefitting procedure shall be used. This has the following form:
dQ 5 C1 SDak DC2
(A11.5)
wherek = 1 mm (or 0.0394 in.) depending upon units used.This power law can be determined by using a method of leastsquares to determine a linear regression line of the followingform:
FIG. A11.1 Definition of Construction Lines for Data Qualification
E 1820
28COPYRIGHT 2003; ASTM International
Document provided by IHS Licensee=MIT Libraries/6110146001, User=, 10/10/200310:08:20 MDT Questions or comments about this message: please call the DocumentPolicy Group at 1-800-451-1584.
--``,,,,``,,,,,```,``,`,``,``,,-`-`,,`,,`,`,,`---

lnd 5 lnC1 1 C 2 lnSDak D (A11.6)
Use only the data that conform to the criteria stated in theprevious sections. Plot the regression line as illustrated in Fig.A11.1.
A11.6.6 The intersection of the regression line of A11.6.4with the offset line of A11.6.5 definesdQ and DaQ. Todetermine this intersection the following procedure is recom-mended:
A11.6.6.1 Estimate adQ (1) value from the data plot of Fig.A11.1.
A11.6.6.2 EvaluateDap (1) from the following:
Dap~1! 5dQ~1!
Md1 0.2 mm~0.008 in.! (A11.7)
A11.6.6.3 Evaluate
dQ~1! 5 C1 SDap~1!
k DC 2
(A11.8)
A11.6.6.4 Return to A11.6.6.2 and A11.6.6.3 to getDa(i) anddQ(i + 1) until the dQ values converge to within 2 %.
A11.6.6.5 Project the intercepts of the power law curve withthe 0.15-mm (0.006-in.) and the 1.5-mm (0.06-in.) exclusionlines vertically down to the abscissa. This indicatesDamin and
Dalimit, respectively. Eliminate all data points that do not fallbetweenD amin and Dalimit as shown in Fig. A11.1. Alsoeliminate all data points which lie above the limitingd capacitywheredlimit = bo/15. The region of qualified data is shown inFig. A11.2.
A11.6.6.6 At least five data points must remain betweenDa
minandDalimit anddlimit . Data point spacing must meet the
requirements of A11.6.3. If these data points are different fromthose used in A11.6.6 to evaluated Q, obtain a new value ofdQ
based only on qualified data.
A11.7 An alternative construction line slope,Md, can becalculated by fitting the least squares linear regression line tothe initial J-R curve data for data in the region 0.2dQ # di #0.6dQ as evaluated withMd = 1.4. A minimum of 6 data pointsare required in the evaluation region to allow an experimentalvalue of Md. Only values ofM d$ 1.4 are allowed by thismethod. A reviseddQ can now be evaluated using thisMd byreturning to A11.6.1-A11.6.6.
A11.8 Qualification of Data—The data shall satisfy therequirements of 9.1 and all of the following requirements to bequalified according to this method. If the data do not pass theserequirements, no fracture toughness values can be determinedaccording to this method.
A11.8.1 The power coefficientC2 of A11.6.5 shall be lessthan 1.0.
A11.8.2 For theResistance Curve Procedurethe followingadditional requirements must be satisified:
A11.8.2.1 aoq shall not differ fromao by more than 0.01W.A11.8.2.2 The number of data available to calculateaoq
shall be$8; the number of data between 0.4dQ anddQ shall be$3; and the correlation coefficient of the least squares fit ofA11.6.5 shall be greater than 0.96.
A11.8.2.3 If an experimental value ofMd is determined, atleast 6 data points are required in the region 0.2dQ # di#0.6dQ. Only Md # 1.4 can be used by this method.
A11.9 Qualification ofdQ asdIc—
d Q = dIc, a size-independent value of fracture toughness, if:A11.9.1 The initial ligament,b o $ 35dQ.A11.9.2 The slope of the power law regression line,dd/da,
evaluated atDaQ must be less than 1.
A12. COMMON EXPRESSIONS
NOTE A12.1—Annex A12 and Annex A13 cover miscellaneous infor-mation.
A12.1 Stress-Intensity Factor:
A12.1.1 The elastic stress intensity factor for a specimen isexpressed as follows:
K 5Pf~a/W!
~BBNW!1/2 (A12.1)
where:
f~a/W! 5 SjzD @C0 1 C1~a/W!
1 C 2~a/W! 2 1 C3~a/W! 3 1 C 4~a/W! 4#
A12.1.2 The parameters forf(a/W)are listed in Table A12.1.
A12.2 Compliance from Crack Length:
A12.2.1 Compliance,C , of a specimen is expressed as afunction of crack length as follows:
FIG. A11.2 Definition of Regions for Data Qualification
E 1820
29COPYRIGHT 2003; ASTM International
Document provided by IHS Licensee=MIT Libraries/6110146001, User=, 10/10/200310:08:20 MDT Questions or comments about this message: please call the DocumentPolicy Group at 1-800-451-1584.
--``,,,,``,,,,,```,``,`,``,``,,-`-`,,`,,`,`,,`---

C 5vP
5Y2
BeE8@A0 1 A 1~a/W!
1 A2~a/W!2 1 A 3~a/W!3 1 A4~a/W!4 1 A 5~a/W!5# (A12.2)
A12.2.2 Be = B − (B − BN) 2/B andE8 = E/(1 − v 2) for allcases and the other parameters for compliance are listed inTable A12.2.
A13. METHOD FOR RAPID LOADING KIc DETERMINATION
A13.1 This annex describes the determination of plane-strain fracture toughness (K Ic) properties of metallic materialsunder conditions where the loading rates exceed those forconventional (static) testing [150 000 psi·in.1/2/min (2.75MPa·m1/2/s)].
A13.2 Summary of Requirements—Special requirementsare necessary for plane-strain fracture toughness testing atloading rates exceeding those of conventional (static) plane-strain fracture toughness testing. This description of theserequirements does not include impact or quasi-impact testing(free-falling or swinging masses). Conventional fracture tough-ness test specimens are prepared as described in this method,tested under rapid-load conditions, and a fracture toughnessvalue is calculated. Load-deflection, load-time, and deflection-time curves are recorded for each test. The load-deflectioncurves resulting from these tests are analyzed to ensure that theinitial linear portion of the load-displacement record is suffi-ciently well-defined thatPQcan be determined unambiguously.In addition, a test time (t), restricted to not less than onemillisecond is determined. This test time and an optionallycalculated average stress intensity factor rate,K, characterize
the rapid load test. The yield strength of the material must bedetermined or estimated for the loading time of the fracture testand is used in the analysis of the fracture test data. All of thecriteria for static KIcdetermination apply to the rapid-loadplane-strain fracture toughness test. The toughness property isdenoted byKIc( ) where the time to reach the load correspond-ing to KQ in milliseconds is indicated in the parentheses ( ).
A13.3 Significance and Use—The significance of theconventional (static)KIc properties applies also to the case ofrapid loading. The plane-strain fracture toughness of certainmaterials is sensitive to the loading rate and substantialdecreases in toughness may be noted as the loading rateincreases. Generally, such materials also show a pronounceddependence ofKIc on test temperature. For example, theloading rate sensitivity of structural grade steels has requiredthe development of a lower boundKIR curve, given inAppendix G of Division III of the ASME Boiler and PressureVessel Code,5 for the fracture-safe design of heavy-wall
5 Available from the American Society of Mechanical Engineers, 345 E. 47thStreet, New York, NY 10017.
TABLE A12.1 Parameters for Stress-Intensity Factors
Specimens
SE(B) C(T) DC(T)
j 3(S/W) (a/W)1/2 2 + a/W 2 + a/Wz 2(1 + 2a/W) (1 −
a/W)3/2(1 − a/W)3/2 (1 − a/W)3/2
C0 1.99 0.886 0.76C1 −2.15 4.64 4.8C2 6.08 −13.32 −11.58C3 −6.63 14.72 11.43C4 2.7 −5.6 −4.08Limits 0 # a/W # 1 0.2 # a/W# 1 0.2 # a/W # 1
S/W = 4 H/W = 0.6 D/W = 1.35Refs (10) (10), (11) (12)
TABLE A12.2 Parameters for Compliance Expressions
Specimen SE(B) C(T) DC(T)
Location vLL vLL vLL
Y S~W 2 a!
~W 1 a!
~W 2 a!
~W 1 a!
~W 2 a!
A0 1.193 2.163 2.0462A1 −1.980 12.219 9.6496A2 4.478 −20.065 −13.7346A3 −4.433 −0.9925 6.1748A4 1.739 20.609 0A5 0 −9.9314 0Limits 0 # a/W # 1 0.2 # a/W# 0.2 # a/W #
0.975 0.8Refs (13) (14) (15)
E 1820
30COPYRIGHT 2003; ASTM International
Document provided by IHS Licensee=MIT Libraries/6110146001, User=, 10/10/200310:08:20 MDT Questions or comments about this message: please call the DocumentPolicy Group at 1-800-451-1584.
--``,,,,``,,,,,```,``,`,``,``,,-`-`,,`,,`,`,,`---

nuclear pressure vessels. Additionally,KIc values for steelstested at various temperatures and loading rates are required forcorrelation with small-scale production control tests (such asthe Charpy V-notch test) for setting material specifications andfracture-safe design procedures.
A13.4 Apparatus:
A13.4.1 Loading—Generally, hydraulic machines withrapid-acting servo controlled valves are used. Depending onthe compliance of the loading system and the pump capacity,an accumulator may be required.
A13.4.2 Fixtures—The fixtures used for static plane-strainfracture toughness tests are generally suitable for rapid-loadtests. However, consideration should be given to the possibilitythat the toughness of the fixture material may be reduced byrapid loading.
A13.4.3 Load and Displacement Transducers—The trans-ducers used for static plane-strain fracture toughness tests aregenerally suitable for rapid-load tests. However, these trans-ducers must have response characteristics that will ensure thatinertial effects will not influence the load and displacementsignals.
NOTE A13.1—While not required, the resonant frequencies of thesetransducers may be determined by suitably exciting them and observingthe wave characteristic on an oscilloscope. If ringing (high-frequencyoscillation) is observed within the time period required to reach thePQ
load, the stiffness of the transducers should be increased or their massreduced. Load cells are quite stiff and should provide no problem at theminimum loading time of 1 ms. The displacement transducer might because for concern depending on its design. The cantilever beam displace-ment gage described in Section 6 has been used successfully at loadingtimes slightly lower than 1 ms. The resonant frequency of this gage whenmounted in a specimen in a conventional manner and excited by tappingis about 3300 Hz. The free-arm resonant frequency is about 750 Hz. Othergages of the same type but having different dimensions should operatesatisfactorily if their free-arm resonance is at least 750 Hz. The followingequation may be used to estimate the free-arm resonant frequency of sucha gage:
f 5 RCFB2Eg
rl4 G (A13.1)
where:RC = 51.7,f = resonant frequency, Hz,B = arm thickness, m,E = elastic modulus of the arms, MPa,g = gravitational acceleration, 9.804 m/s2,r = density of the arm material, kg/m3, andl = length of the uniform thickness section of the arms,
m.The coefficientRC becomes 0.162 if inch-pound units are
used whereB is in inches,E is in pound-force per square inch,g is 386 in./s2, r is pounds per cubic inch, and 1 is in inches.
A13.4.4 Signal Conditioners—Amplification or filtering ofthe transducer signals may be necessary. Such signal condi-tioning units should have a frequency response from dc to atleast 20/t (kilohertz) where t is the test time in milliseconds asdefined in A13.6.3. As described in A13.4.3, conventionalmechanical recording devices may not have sufficient fre-quency response to permit direct plotting of the load versustime and the displacement versus time signals.
A13.5 Procedure:
A13.5.1 Loading Rate— The rate of loading is optional withthe investigator, but the time to reach the load corresponding toKQ shall not be less than 1 ms. Use a preload to eliminateringing in the load or displacement transducers associated withclearances in the load train being suddenly taken up by the startof rapid loading.
A13.5.2 For each test conducted, a load versus time, adisplacement versus time, and a load versus displacementrecord shall be obtained. The time scale of these records shallbe accurately determined since the time is used to characterizethe test. Examine the time-dependent records for the presenceof ringing before reaching theP Q load. Such ringing can resultfrom inertial effects as described in Note A13.2. The specialrecord analysis procedure described in A13.6 may be helpful inassessing the magnitude of such effects.
NOTE A13.2—It should be recognized that some materials may exhibita burst of crack extension at loads less thanPQ that is sufficiently abruptto produce ringing in the displacement transducer signal. Such an abruptadvance of the crack may be associated with material inhomogeneitieslocal to the fatigue crack tip. If the ringing is severe it may not be possibleto unambiguously determine a value forPQ. The presence of such burstsof crack extension should be recorded for those tests having analyzableload versus displacement records.
NOTE A13.3—The test data may be directly recorded if the recordingdevices have sufficient frequency response. Generally, it is advantageousto use a storage device that will capture the data and permit playing it outat a sufficiently slow speed that a pen recorder can be used in producingthe required records. Such storage devices are commonly available in theform of digital storage oscilloscopes having pen recorder outputs. Sepa-rate storage instruments are also available. In general these digital storagedevices have performance characteristics that are more than adequate tocapture, store, and replay the transducer signals from a 1-ms test. Forexample, calculations show that for a typical fracture test, the crack-mouthdisplacement resolution would be about 0.76 mm/sample (0.030 mil/sample) and the load resolution would be about 712 N/sample (160lbf/sample). It should be possible to obtain at least 1000 simultaneoussamples of load and displacement during such a test. A digital storagescope capable of at least this performance would have the followingcharacteristics: maximum digitizing rate of 1 MHz, maximum sensitivityof 6100 mV, resolution of 0.025 %, and memory of 4096 words by 12bits. It may be necessary to amplify the output of the clip gage moderatelyand possibly that of the load cell depending on its capacity in terms of therange required. These values of resolution are based on a total noise figureof about 50 mV.
A13.6 Calculation and Interpretation of Results:
A13.6.1 Special requirements are placed on the analysis ofthe load versus displacement record. These take into accountthe fact that experience(17) has shown load versus displace-ment records from rapid-load fracture toughness tests are notalways as smooth in the linear range as those obtained fromstatic tests. The special requirements of this annex are designedto ensure that an unambiguous value ofPQ can be determined.The test time must be determined from the load versus timerecord.
A13.6.2 The additional analysis of the load versus displace-ment record is illustrated in Fig. A13.1. The procedure is asfollows: Construct the straight lineOA best representing theinitial portion of the test record that ideally should be linear butmay not be smooth. Then construct the lineOP5 as describedin Annex A5 and determinePQ. Draw a vertical line at vp
E 1820
31COPYRIGHT 2003; ASTM International
Document provided by IHS Licensee=MIT Libraries/6110146001, User=, 10/10/200310:08:20 MDT Questions or comments about this message: please call the DocumentPolicy Group at 1-800-451-1584.
--``,,,,``,,,,,```,``,`,``,``,,-`-`,,`,,`,`,,`---

passing throughPQ and definePv at the point of intersection ofthis line with the lineOA. Determine 5 % ofPv and constructtwo linesBC andDE parallel toOA with BC passing throughPv + 0.05P v andDE passing throughPQ (Pv − 0.05Pv). Drawa horizontal line atP = 0.5 PQ. For the test to be valid thatrecorded load versus displacement curve up toPQ must liewithin the envelope described by these parallel lines for theportion of the record withP # 0.5 PQ.
A13.6.3 The test timet in milliseconds is determined fromthe record of load versus time as indicated in Fig. A13.2.Construct the best straight lineOA through the most linearportion of the record. The valuet is then determined from thepoint of intersection of this line with the time axis to the timecorresponding toPQ. This time,t is shown in the parentheses( ) following KIc. An average stress intensity rate,K, may becalculated by dividingKQ or KIc by t with the result beingexpressed in ksi·in.1/2/s or MPa·m1/2/s. It should be recognizedthat minor errors in determining the loading time are notsignificant because significant changes in the toughness requirea change of several orders of magnitude in loading rate.
A13.6.4 The 0.2 % offset tensile yield strengthsYS is usedin determining the specimen size requirements for a valid testas described in Annex A5. If the rapid load value ofKQ is validusing a static yield strength value determined at a temperature
at or above that of the rapid-load test, no further yield strengthconsiderations are necessary.
A13.6.5 If the test is invalid using such a yield strength, atension test should be conducted on the test material at thetemperature and loading time of the rapid-load toughness testwith the time to reach the yield load in the tension testapproximately equal to the timet defined in A13.6.3.
A13.6.6 In the absence ofs YSvalues as defined in A13.6.5,the dynamic yield strengthsYD of certain steels may beestimated using the following equation:
sYD 5 sYD 1A
Tx log10~2 3 107t!2 B (A13.2)
where:sYS = 0.2 % offset room temperature static yield strength,t = loading time, ms, andTx = temperature of the rapid-load toughness test.
Units:If sYSis in megapascals, thenA = 1 198 860,B = 187.4 MPa,If s YS is in pound force per square inch, thenA = 174 000,B = 27.2 ksi,If the test temperatureT is measured inK, thenTx = 1.8T, andIf the test temperatureT is measured in °F, thenTx = (T + 460).
NOTE A13.4—The equation in A13.6.6 has been found useful only inestimating the low-temperature dynamic yield strength of constructionalsteels having room temperature yield strengths below 480 MPa (70 ksi).
FIG. A13.1 Special Requirements for Analysis of Load VersusDisplacement Records (5 % Secant Line Not Shown)
FIG. A13.2 Determination of Test Time from Load Versus TimeRecord
E 1820
32COPYRIGHT 2003; ASTM International
Document provided by IHS Licensee=MIT Libraries/6110146001, User=, 10/10/200310:08:20 MDT Questions or comments about this message: please call the DocumentPolicy Group at 1-800-451-1584.
--``,,,,``,,,,,```,``,`,``,``,,-`-`,,`,,`,`,,`---

A14. SPECIAL REQUIREMENTS FOR RAPID-LOAD J-INTEGRAL FRACTURE TOUGHNESS TESTING 6
A14.1 Scope
A14.1.1 This annex covers the determination of the ratedependentJIc(t) and theJ-integral versus crack growth resis-tance curve (J-R(t) curve) for metallic materials under condi-tions where the loading rate exceeds that allowed for conven-tional (static) testing, see Section 8.4.2.
A14.2 Summary of Requirements
A14.2.1 Special requirements are necessary forJ-integralfracture toughness testing of metallic materials at loading ratesexceeding those of conventional (static) testing. Standardfracture toughness test specimens are prepared as described inthis method, tested under rapid-load or drop weight conditions,and aJ-R(t)curve is calculated. From thisJ-R(t)curve aJQ(t)can be evaluated using Section 9 of this method. If unstablefracture intervenes, aJQc(t) can be evaluated at the onset ofunstable behavior as in the static case.
A14.2.1.1 Load, load line displacement, and time are re-corded for each test. The load versus displacement curveresulting from each test is analyzed to ensure that the initialportion of the curve is sufficiently well defined that anunambiguous curve can be determined from theJ(t) versuscrack length(a(t)) data. In addition a minimum test time iscalculated from the specimen stiffness and effective mass thatsets a maximum allowed test rate for the material and geometrybeing tested. At times less than the minimum test time asignificant kinetic energy component is present in the specimenrelative to the internal energy, and the staticJ integralequations presented in this method are not accurate. Evaluationof a JQ(t) or JQc(t) at a time less than the minimum test time isnot allowed by this method.
A14.2.1.2 Evaluation of theJ-R(t)curve requires estimationof crack extension as a function of load line displacement ortime using the normalization method of Annex A15. An elasticcompliance method cannot be used. A multiple specimenmethod can be used to evaluateJQ(t) from a series of tests, butthe resultingJ-R(t)curve is not valid according to this method.
A14.2.1.3 All of the criteria for the staticJIc, Jc, and J-Rcurve evaluations apply to the rapid loadJ integral fracturetoughness test. The rapid loadJ integral resistance curve isdenotedJ-R(t), the stable initiation propertyJIc(t), and theunstable initiation property byJc(t), where the time to reach theinstant corresponding toJQ in milliseconds is indicated in thebrackets.
A14.3. Terminology
A14.3.1 Definitions:A14.3.1.1 The definitions given in Terminology E 1823 are
applicable to this annex.A14.3.1.2 The definitions given in Section 3 of this method
are applicable.
A14.3.1.3 Rapid load—In J integral fracture testing, anyloading rate such that the time taken to reachPf (see 7.4.4) isless than 0.1 minutes.
A14.3.1.4 Minimum test time-tw(t)—In J integral fracturetesting, the minimum time to the rate dependentJQ(t) or JQc(t)accepted by this method (18). Test times less thantw will leadto inaccurateJ integral results since large kinetic energycomponents will be present. In this method:
tw 52 p
=ks/Meff(A14.1)
where:ks = specimen load line stiffness, (N/m),Meff = effective mass of the specimen, taken here to be half
of the specimen mass (kg).A14.3.1.5 Test time - tQ(t)(T)—In J integral fracture testing,
the observed time to the rate dependentJQ(t).A14.3.1.6 Jc(t)(FL−1)—In J integral fracture testing, the
rate dependentJ integral at the onset of fracture instabilityprior to the onset of significant stable tearing crack extension,see Section 3.2.10, as defined in this annex.
A14.3.1.7 JQc(t)(FL−1)—In J integral fracture testing, theprovisional rate dependentJ integral at the onset of fractureinstability prior to the onset of significant stable tearing crackextension, as defined in this annex.
A14.3.1.8 Ju(t)(FL−1)—In J integral testing, the rate depen-dentJ integral at the onset of fracture instability after signifi-cant stable tearing crack extension, see Section 3.2.11, asdefined in this annex.
A14.3.1.9 JIc(t)(FL−1)—In J integral testing, the rate depen-dentJ integral at the onset of stable crack extension as definedin this annex.
A14.3.1.10JQ(t)(FL−1)—In J integral fracture toughnesstesting, the provisional, rate dependent,J integral at the onsetof stable crack extension as defined in this annex.
A14.3.1.11dJ/dt(FL−1T−1)—In J integral fracture testing,the rate of change of theJ integral per unit time. Two loadingrate quantities are defined in this method,(dJ/dt)I measuredbeforeJQ(t), and (dJ/dt)T measured afterJQ(t), as defined bythis annex.
A14.4 Significance and Use
A14.4.1 The significance of the staticJ-Rcurve,JIc, andJc
properties applies also to the case of rapid loading. TheJintegral fracture toughness of certain metallic materials issensitive to the loading rate and to the temperature of test. TheJ-R(t)curve andJIc(t) properties are usually elevated by highertest rates whileJc(t) can be dramatically lowered by higher testrates.
A14.5 Apparatus
A14.5.1 Loading—Two types of high rate loading systemsare anticipated. Servohydraulic machines with high flow rateservovalves and high capacity accumulators, or alternatively,drop weight impact machines can be used. On-specimen loadmeasurements are recommended for high rate tests. Remote
6 This test method is an Annex to ASTM E1820. It under the jurisdiction ofASTM Committee E08 on Fatigue and Fracture and is the direct responsibility ofSubcommittee E08.08 on Elastic-Plastic and Fracture Mechanics Technology.
E 1820
33COPYRIGHT 2003; ASTM International
Document provided by IHS Licensee=MIT Libraries/6110146001, User=, 10/10/200310:08:20 MDT Questions or comments about this message: please call the DocumentPolicy Group at 1-800-451-1584.
--``,,,,``,,,,,```,``,`,``,``,,-`-`,,`,,`,`,,`---

load cells or other transducers can be used for high rate tests ifthe requirements of this annex are met. Strain gage bridges arerecommended for on-specimen load measurement, as shown inFig. A14.1 and Fig. A14.2. For each specimen type, four gagesare connected to construct a four-arm bridge and calibratedstatically before the rapid load test (see A14.5.4). Strain gageswith grid patterns of approximately 0.25 B are recommended.For SE(B) specimens, gages should be positioned on thespecimen mid-plane at the specimen span quarterpoints. ForC(T) specimens, the gages should be positioned on the speci-men upper and lower surfaces near the specimen mid-planewith the gage edge at least 0.1W behind the initial crack,ao.
A14.5.2 Servohydraulic Testing Fixtures—The fixtures usedfor static fracture toughness tests generally require somemodification for rapid load tests. Slack grip fixtures are oftennecessary to reduce the applied load oscillation and to allowthe actuator to accelerate before load is applied to the speci-men. Soft metal absorbers are generally used in drop towertests to reduce the inertial shock caused by the impact of thetest machine striker on the specimen surface.
Both initial and final crack lengths are required by thenormalization method ofJ-R(t) curve development of AnnexA15. The high rate test must be stopped abruptly to obtain alimited specimen deformation and a crack extension incrementsatisfying the requirement of A15.1.2.1. Rigid stop blockfixtures can be used to obtain the abrupt stop. In some cases aramp and hold or square wave command signal can be used toobtain limited specimen deformation for the specimen test.
A14.5.3 Drop Tower Testing Fixtures—Special fixtures arenecessary for drop tower testing according to this standard.Recommended fixtures for SE(B) and C(T) specimens areshown in Figs. A14.3 and A14.4 respectively (19). Stop blockfixtures are required to obtain a limited extent of stable crack
growth forJ-R(t)curve development. Soft metal absorbers arerecommended to reduce the initial shock resulting from theimpact of the drop tower striker on the specimen surface. Ahigh frequency load line displacement transducer and signalconditioner is required for drop tower tests.
A14.5.4 Load Transducers—If remote load transducers areused, they shall meet the requirements of Practice E 4. Re-quirements on the measured initial specimen stiffness and onthe load and displacement signal smoothness are presented inA14.7.4. Static calibration of the on-specimen strain gagebridge should be done over a load range from 20 to 100 % ofthe final precracking load. At least five load calibration valuesshall be used, spaced evenly over this interval, and at least tworepeat data sets are required. The applied load shall exceed1⁄4of the calibrated range of the reference load cell used. Theon-specimen, transmitted load measuring system shall beaccurate to within 2 % of the final precracking load over thecalibration range.
A14.5.5 Displacement Transducers—The transducer shallhave response characteristics that allow it to follow the motionof the specimen while not introducing excessive mechanicalnoise into the measured displacement.
A14.5.5.1 Cantilever beam displacement gages such asthose used in static fracture toughness testing may be suitablefor rapid-load testing, see A13.4.3. The cantilever beam dis-placement gage described in Annex A1 of Test Method E 399has been used successfully at loading times (tQ) slightly lessthan 1 ms.
A14.5.5.2 Gap measuring transducers that use either capaci-tance or optical means to measure displacement have also beenused successfully in rapid-load testing (19). These transducershave the advantage that they can be rigidly attached to thespecimen, and the vibration characteristics of the transducer
FIG. A14.1 Strain Gages Mounted on SE(B) Specimen for Measurement of Transmitted Load
E 1820
34COPYRIGHT 2003; ASTM International
Document provided by IHS Licensee=MIT Libraries/6110146001, User=, 10/10/200310:08:20 MDT Questions or comments about this message: please call the DocumentPolicy Group at 1-800-451-1584.
--``,,,,``,,,,,```,``,`,``,``,,-`-`,,`,,`,`,,`---

generally do not affect the measured displacement. The disad-vantages are that the output may be non-linear, and the signalconditioners used with these transducers are often the limiting
component in frequency response of the displacement mea-surement system. Capacitive transducers have been designed tofit in the notch of the C(T) specimen as shown in Fig. A14.5.
FIG. A14.2 Strain Gages Mounted on C(T) Specimen for Measurement of Transmitted Load
FIG. A14.3 Test Fixture for Drop Tower SE(B) Specimens
E 1820
35COPYRIGHT 2003; ASTM International
Document provided by IHS Licensee=MIT Libraries/6110146001, User=, 10/10/200310:08:20 MDT Questions or comments about this message: please call the DocumentPolicy Group at 1-800-451-1584.
--``,,,,``,,,,,```,``,`,``,``,,-`-`,,`,,`,`,,`---
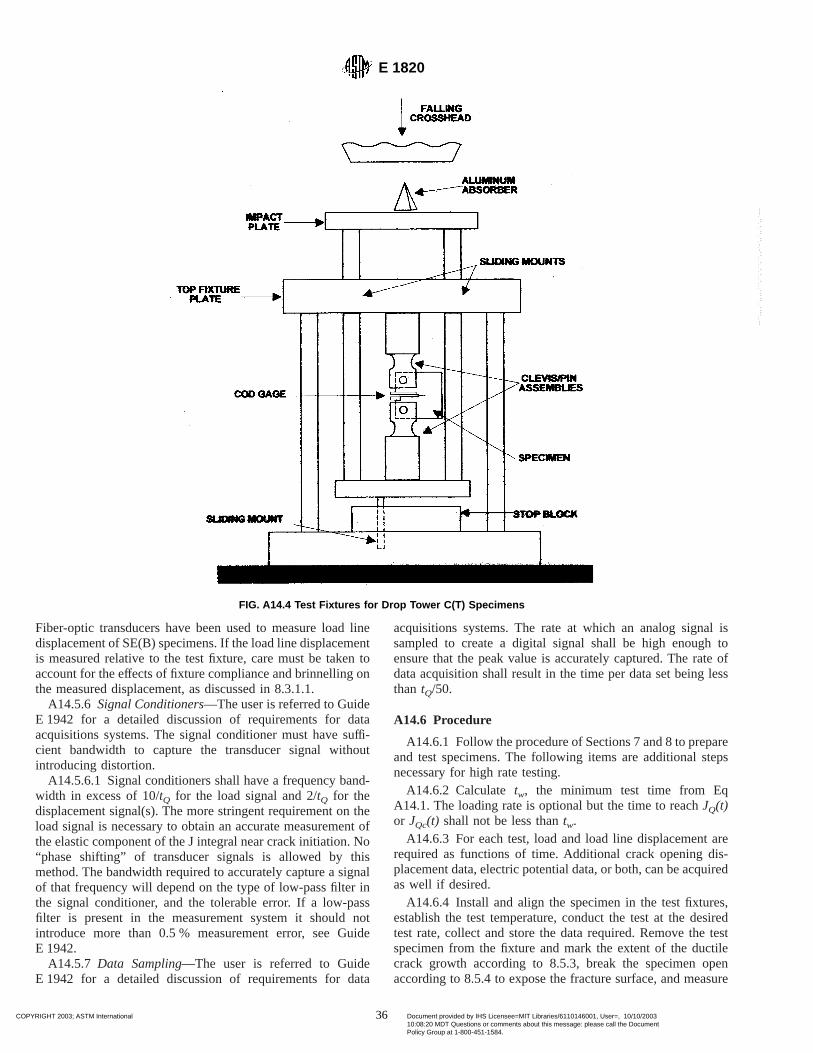
Fiber-optic transducers have been used to measure load linedisplacement of SE(B) specimens. If the load line displacementis measured relative to the test fixture, care must be taken toaccount for the effects of fixture compliance and brinnelling onthe measured displacement, as discussed in 8.3.1.1.
A14.5.6 Signal Conditioners—The user is referred to GuideE 1942 for a detailed discussion of requirements for dataacquisitions systems. The signal conditioner must have suffi-cient bandwidth to capture the transducer signal withoutintroducing distortion.
A14.5.6.1 Signal conditioners shall have a frequency band-width in excess of 10/tQ for the load signal and 2/tQ for thedisplacement signal(s). The more stringent requirement on theload signal is necessary to obtain an accurate measurement ofthe elastic component of the J integral near crack initiation. No“phase shifting” of transducer signals is allowed by thismethod. The bandwidth required to accurately capture a signalof that frequency will depend on the type of low-pass filter inthe signal conditioner, and the tolerable error. If a low-passfilter is present in the measurement system it should notintroduce more than 0.5 % measurement error, see GuideE 1942.
A14.5.7 Data Sampling—The user is referred to GuideE 1942 for a detailed discussion of requirements for data
acquisitions systems. The rate at which an analog signal issampled to create a digital signal shall be high enough toensure that the peak value is accurately captured. The rate ofdata acquisition shall result in the time per data set being lessthan tQ/50.
A14.6 Procedure
A14.6.1 Follow the procedure of Sections 7 and 8 to prepareand test specimens. The following items are additional stepsnecessary for high rate testing.
A14.6.2 Calculatetw, the minimum test time from EqA14.1. The loading rate is optional but the time to reachJQ(t)or JQc(t) shall not be less thantw.
A14.6.3 For each test, load and load line displacement arerequired as functions of time. Additional crack opening dis-placement data, electric potential data, or both, can be acquiredas well if desired.
A14.6.4 Install and align the specimen in the test fixtures,establish the test temperature, conduct the test at the desiredtest rate, collect and store the data required. Remove the testspecimen from the fixture and mark the extent of the ductilecrack growth according to 8.5.3, break the specimen openaccording to 8.5.4 to expose the fracture surface, and measure
FIG. A14.4 Test Fixtures for Drop Tower C(T) Specimens
E 1820
36COPYRIGHT 2003; ASTM International
Document provided by IHS Licensee=MIT Libraries/6110146001, User=, 10/10/200310:08:20 MDT Questions or comments about this message: please call the DocumentPolicy Group at 1-800-451-1584.
--``,,,,``,,,,,```,``,`,``,``,,-`-`,,`,,`,`,,`---

the initial crack lengthao, and the final crack lengthaf
according to 8.5.5.A14.6.5 If the specimen is characterized by ductile upper
shelf behavior, the normalization method of Annex A15 can beused to develop theJ-R(t) curve for the test specimen. UsingSection 9, calculateJQ (the tentativeJIc) and the correspondingload PQ and timetQ. If a ductile instability occurs so that thefinal stable crack lengthaf cannot be determined, the normal-ization method cannot be used to develop theJ-R(t) curve orthe correspondingJQ for this test specimen.
A14.6.5.1 If a pop-in is present, refer to Annex A4 to assessits significance. If the pop-in is significant,Jc(t) or Ju(t) valuescorresponding to the point of onset can be calculated usingAnnex A6. If fracture instability occurs without significantductile crack extension,Jc(t) or Ju(t) values corresponding tothe point of onset can be calculated as defined in Annex A6. Iffracture instability follows significant ductile crack extension,the J-R(t) and JIc(t) can be determined providing thataf isdistinguishable. The validity of theJ-R(t) curve andJIc(t) aresubject to the requirements of Annex A8, Annex A9, andSection 9.
A14.7 Qualification of the Data
A14.7.1 Test equipment, specimen geometries, specimenfixture alignment, and measured data must meet all require-ments of Sections 6, 7, 8, and 9, except as specifically replacedin A14.5. Additional requirements specified here are necessaryfor high rate testing.
A14.7.2 All of the test equipment requirements of A14.5shall be met.
A14.7.3 Plot theJ integral versus the time as shown in Fig.A14.6. If fracture instability occurs, calculateJ based onao
using the basic analysis procedure and plot the data up to andincluding JQc(t) or JQu(t). Use a linear regression analysis toevaluate(dJ/dt)I as shown in the example of Fig. A14.5 usingthe data from 0.5JQ(t) to JQ(t), from 0.5JQc(t) to JQc(t), or from
0.5JQu(t) to JQu(t), as the case may be. Extrapolate this line tothe abscissa to evaluate the quantitytQ, as shown in Fig. A14.6.
A14.7.3.1 A second loading rate, (dJ/dt)T, is defined as theslope of theJ versus time data beyond maximum load, asshown in Fig. A14.6, over the range fromJQ to JQ +0.5(Jmax−JQ) or the end of test, if fracture instability occurs.
A14.7.4 Plot load versus load line displacement for the timeinterval 0# t # tQ, as shown schematically in Fig. A14.7. Usea linear regression analysis to evaluate the initial specimenstiffnessks using data over the range from 20 % to 50 % of themaximum load measured in the test. Plot this best fit line on thefigure, and also plot two parallel lines of the same slope withthe y-intercept offset by610 % of Pmax as shown in Fig.A14.7. Locate the final crossoverDLL
F.A14.7.4.1 For this data set to be qualified according to this
method, the compliance, 1/ks, shall agree with the predictionsof Eq A2.10 for the C(T) specimen and Eq A1.9 for the SE(B)specimen within610 %. Additionally, the measured loaddisplacement data in the region between 0.3DLL
F and 0.8DLLF
should remain within the bounds of the parallel lines con-structed on Fig. A14.7. If these requirements are not met, slackgrips or impact absorbers must be added or modified or the testrate reduced to obtain a smoother data set that can be qualifiedaccording to this method.
A14.7.5 If tQ< tw, the test data are not qualified according tothis method. A slower loading rate must be used, or thespecimen geometry changed to decreasetw for the test to bequalified according to this method.
A14.7.6 If the normalization method of Annex A15 is usedto obtain JIc, the J resistance curve, or both, at least oneconfirmatory specimen must be tested at the same test rate andunder the same test conditions. From the normalization methodthe load line displacement corresponding to a ductile crackextension of 0.5 mm shall be estimated. The additionalspecimen shall then be loaded to this load line displacementlevel, marked, broken open and the ductile crack growth
FIG. A14.5 High Rate Capacitance COD gage and C(T) Specimen with Attachment Holes
E 1820
37COPYRIGHT 2003; ASTM International
Document provided by IHS Licensee=MIT Libraries/6110146001, User=, 10/10/200310:08:20 MDT Questions or comments about this message: please call the DocumentPolicy Group at 1-800-451-1584.
--``,,,,``,,,,,```,``,`,``,``,,-`-`,,`,,`,`,,`---

measured. The measured crack extension shall be 0.56 0.25mm in order for these results to be qualified according to thismethod.
A14.8 Qualifying the High Rate Results
A14.8.1 All qualification requirements of 9.1, Annex A6,Annex A8, Annex A9, and A14.7 must be met to qualify theJ-R(t) curve,JQ(t) asJIc(t), or JQc(t) asJc(t) according to thismethod. If the normalization method of Annex A15 is used, theadditional requirements of this annex shall also be met.
A14.9 Report
A14.9.1 The report shall include all the items of Section 10as well as the following:
A14.9.1.1 The minimum test time,tw, according to A14.6.2.A14.9.1.2 ThePQ and tQ, corresponding to the calculated
JQ(t) or JQc(t).A14.9.1.3 The(dJ/dt)I, (dJ/dt)T values, or both.A14.9.1.4 If JIc(t) is being reported, the final crack exten-
sion obtained on the confirmatory specimen of A14.7.6 shall bereported.
A14.10 Precision and Bias
A14.10.1 Precision—The precision of J versus crack
growth is a function of material variability, the precision of thevarious measurements of linear dimensions of the specimenand testing fixtures, precision of the displacement measure-ment, precision of the load measurement, as well as theprecision of the recording devices used to produce the load-displacement record used to calculateJ and crack length. Forthe test rates allowed by this annex, if the procedures outlinedin this annex are followed, the load and load-line displacementcan be measured with an precision comparable with that of thestatic loading as described in the main body. If the normaliza-tion function method of Annex A15 is used, the crack lengthand crack extension information must be inferred from initialand final crack length measurements. The requirement for theadditional specimen to be tested near to the point of crackinitiation has been added to validate theJIc(t) measurement. Around robin used to evaluate the overall test procedures of thismethod is reported in (20).
A14.10.2 Bias—There is no accepted “standard” value formeasures of elastic-plastic fracture toughness of any material.In absence of such a true value, any statement concerning biasis not meaningful.
FIG. A14.6 Evaluation of t Q and the Test Rates (dJ/dt) I and (dJ/dt) T
E 1820
38COPYRIGHT 2003; ASTM International
Document provided by IHS Licensee=MIT Libraries/6110146001, User=, 10/10/200310:08:20 MDT Questions or comments about this message: please call the DocumentPolicy Group at 1-800-451-1584.
--``,,,,``,,,,,```,``,`,``,``,,-`-`,,`,,`,`,,`---

A15. NORMALIZATION DATA REDUCTION TECHNIQUE
A15.1 Scope
A15.1.1 The normalization technique can be used in somecases to obtain aJ-R curve directly from a load displacementrecord taken together with initial and final crack lengthmeasurements taken from the specimen fracture surface. Ad-ditional restrictions are applied (see A14.1.3) which limit theapplicability of this method. The normalization technique isdescribed more fully in Herrera and Landes (21) and Landes, etal. (22), Lee (23), and Joyce (20). The normalization techniqueis most valuable for cases where high loading rates are used, orwhere high temperatures or aggressive environments are beingused. In these, and other situations, unloading compliancemethods are impractical. The normalization method can beused for statically loaded specimens if the requirements of thissection are met. The normalization method is not applicable forlow toughness materials tested in large specimen sizes wherelarge amounts of crack extension can occur without measurableplastic load line displacement.
A15.2 Analysis
A15.2.1 The starting point for this analysis is a load versusload point displacement record like that shown in Fig. A15.1.Also required are initial and final physical crack lengthsoptically measured from the fracture surface. This procedure isapplicable only to Test Method E 1820 standard specimengeometries with 0.45# ao/W # 0.70 and cannot be used if thefinal physical crack extension exceeds the lesser of 4 mm or
15 % of the initial uncracked ligament.A15.2.2 Each load valuePi up to, but not including the
maximum loadPmax, is normalized using:
PNi 5Pi
WBFW2 abi
W Ghpl(A15.1)
whereabi is the blunting corrected crack length at the ith datapoint given by:
abi 5 ao 1Ji
2 sY(A15.2)
with Ji calculated from:
Ji 5Ki
2 ~1 2 v2!E 1 Jpli (A15.3)
whereKi, hpl, and Jpli are calculated as in Annex A1 andAnnex A2 for each specimen type using the crack lengthao.
A15.2.3 Each corresponding load line displacement is nor-malized to give a normalized plastic displacement:
v8pli 5vpli
W 5~vi 2 Pi Ci!
W (A15.4)
whereCi is the specimen elastic load line compliance basedon the crack lengthabi, which can be calculated for eachspecimen type using the equations of Annex A1 and Annex A2.
A15.2.4 The final measured crack length shall correspond toa crack extension of not more than 4 mm or 15 % of the initialuncracked ligament, whichever is less. If this crack extension
FIG. A14.7 Load Smoothness Verification Schematic
E 1820
39COPYRIGHT 2003; ASTM International
Document provided by IHS Licensee=MIT Libraries/6110146001, User=, 10/10/200310:08:20 MDT Questions or comments about this message: please call the DocumentPolicy Group at 1-800-451-1584.
--``,,,,``,,,,,```,``,`,``,``,,-`-`,,`,,`,`,,`---

is exceeded, this specimen can not be analyzed according tothis annex.
A15.2.5 The final load displacement pair shall be normal-ized using the same equations as above except that the finalmeasured crack length,af, is used. Typical normalized data areshown in Fig. A15.2.
A15.2.6 A line should be drawn from the final load displace-ment pair tangent to remaining data as shown in Fig. A15.2.Data to the right of this tangent point shall be excluded fromthe normalization function fit. Data withvpli/W # 0.001 shallalso be excluded from the normalization function fit.
A15.2.7 If at least ten data pairs conform with A15.2.6, thedata of Fig. A15.2 can be fit with the following requiredanalytical normalization function:
PN 5a 1 b v8pl 1 c v8pl
2
d 1 v8pl(A15.5)
wherea, b, c,andd are fitting coefficients. This function canbe fitted to the data of Fig. A15.1 using standard curve fittingpackages available as part of computer spreadsheet programsor separately. An example fit for the data of Fig. A15.2 isshown in Fig. A15.3. The normalization function shall fit allthe data pairs described above (including the final pair) with amaximum deviation less than 1 % of thePN at the final point.Data should be evenly spaced betweenvpli /W = 0.001 and thetangency point. If less than ten data pairs are available for thisfit, including the final measured data pair, this method cannotbe used.
A15.2.8 An iterative procedure is now used to force allPNi,vpli/W, ai data to lie on Equation A15.5. This involvesadjusting the crack size of each data set to get the normalizedload and displacement pair defined in A15.2.2 and A15.2.3 to
fall on the function defined in Equation A15.5. To do so, startat the first data point with a positive plastic load line displace-ment, normalize the load and displacement using the initialmeasured crack sizeao, and compare the normalized load withthe result of the normalization function of A15.2.7. Adjust thecrack size until the measuredPNi and the functional value ofPN
are within 60.1 %. Each subsequent data set is treated simi-larly. If each step is started with the crack length resulting fromthe previous data set, only small, positive adjustments of cracklength are necessary, and the process of obtaining the cracklengths corresponding to each data set is relatively rapid.
A15.2.8.1 The data of Fig. A15.1, normalized and adjustedto fit the normalization function of Fig. A15.3 is shown in Fig.A15.4.
A15.2.9 Since load, load line displacement, and cracklength estimates are now available at each data point, thestandard equations of Annex A1 and Annex A2 are used toevaluate theJ integral at each data point, resulting in aJ-Rcurve as shown in Fig. A15.5. AJIc value can now beevaluated from thisJ-R curve using the method of SectionAnnex A9.
A15.3 Additional Requirements
A15.3.1 Requirements presented in 9.1, Annex A8, andAnnex A9 shall be met to qualify aJ-R curve or aJIc valueobtained by the normalization method. Additional require-ments specific to the use of the normalization method arepresented below.
A15.3.2 If the normalization method is used to obtainJIc, atleast one additional, confirmatory specimen shall be tested atthe same test rate and under the same test conditions. From the
FIG. A15.1 Typical Load Versus Displacement Curve
E 1820
40COPYRIGHT 2003; ASTM International
Document provided by IHS Licensee=MIT Libraries/6110146001, User=, 10/10/200310:08:20 MDT Questions or comments about this message: please call the DocumentPolicy Group at 1-800-451-1584.
--``,,,,``,,,,,```,``,`,``,``,,-`-`,,`,,`,`,,`---

normalization method the load line displacement correspond-ing to a ductile crack extension of 0.5 mm shall be estimated.The additional specimen shall then be loaded to this load linedisplacement level, marked, broken open and the ductile crackgrowth measured. The measured crack extension shall be 0.560.25 mm in order for these results, and hence theJIc value, tobe qualified according to this method.
A15.4 Report
A15.4.1 Section 10 describes the reporting requirements forthis method. If the normalization function method is used thefollowing additional items shall be reported.
A15.4.2 If the normalization function is used the coeffi-cients of the fit shall be reported as well as the maximumdeviation of the fit and the number of data used.
A15.4.3 If JIc is reported, the accuracy of the confirmatoryspecimen of A15.3.2 shall be reported.
A15.5 Precision and Bias
A15.5.1 Precision—The precision of theJ resistance curveis a function of material variability, the precision of the variousmeasurements of linear dimensions of the specimen and testingfixtures, precision of the displacement measurement, precisionof the load measurement, as well as the precision of therecording devices used to produce the load-displacementrecord used to calculateJ and crack length. For the test rates
allowed by this annex, if the procedures outlined in this annexare followed, the crack length throughout the fracture tough-ness test can be measured with a precision comparable withthat of the unloading compliance procedure described in themain body. A round robin describing the use of the normaliza-tion procedure on rapidly loaded SE(B) and C(T) specimens ispresented in (20). A requirement for the testing of a confirma-tory specimen tested near the point of stable crack initiation ispresent to validate theJIc measurement.
A15.5.2 Bias—Crack lengths generally vary through thethickness of fracture toughness specimens. A nine point aver-age procedure based on optical measurements obtained fromthe post-test fracture surface is generally used to give areportable crack length. Different measurements would beobtained using more or less measurement points. Alternativecrack lengths can be estimated using compliance methods,which obtain different average crack length estimates forirregular crack front shapes. Stringent crack front straightnessrequirements are present in this standard to minimize differ-ences caused by these effects. The normalization method actsto interpolate between optically measured crack averagelengths measured at the start and end of the stable resistancecurve fracture toughness test. This method has been demon-strated in (20) to give results consistent with those obtained byunloading compliance procedures.
FIG. A15.2 Normalized Load Versus Displacement Curve Showing Points up to Maximum Load and the Final Data Point
E 1820
41COPYRIGHT 2003; ASTM International
Document provided by IHS Licensee=MIT Libraries/6110146001, User=, 10/10/200310:08:20 MDT Questions or comments about this message: please call the DocumentPolicy Group at 1-800-451-1584.
--``,,,,``,,,,,```,``,`,``,``,,-`-`,,`,,`,`,,`---

FIG. A15.3 The Normalization Function Shown Fitted to the Normalization Data
E 1820
42COPYRIGHT 2003; ASTM International
Document provided by IHS Licensee=MIT Libraries/6110146001, User=, 10/10/200310:08:20 MDT Questions or comments about this message: please call the DocumentPolicy Group at 1-800-451-1584.
--``,,,,``,,,,,```,``,`,``,``,,-`-`,,`,,`,`,,`---

FIG. A15.4 Data is Adjusted, Defining the Crack Length Necessary to Place All Points on the Analytical Normalization Function. (Only aportion of the data is shown for clarity.)
FIG. A15.5 The Resulting J-R Curve for this Specimen
E 1820
43COPYRIGHT 2003; ASTM International
Document provided by IHS Licensee=MIT Libraries/6110146001, User=, 10/10/200310:08:20 MDT Questions or comments about this message: please call the DocumentPolicy Group at 1-800-451-1584.
--``,,,,``,,,,,```,``,`,``,``,,-`-`,,`,,`,`,,`---

APPENDIX
(Nonmandatory Information)
X1. BASIC CODE EXAMPLE
X1.1 Fig. X1.1 To fit Eq A9.1 to theJi, ai data using themethod of least squares, the following equation must be set upand solved foraoq, B, andC:
X1.2 This equation can be set up and solved using astandard spreadsheet. The following listing gives a MicrosoftQuickBASIC program listing that can also be used to accom-plish this process. This algorithm can be easily modified toperform the fit for CTOD calculations required in C4.4.1.
FIG. X1.1 BASIC Program
FIG. X1.1 BASIC Program (continued)
E 1820
44COPYRIGHT 2003; ASTM International
Document provided by IHS Licensee=MIT Libraries/6110146001, User=, 10/10/200310:08:20 MDT Questions or comments about this message: please call the DocumentPolicy Group at 1-800-451-1584.
--``,,,,``,,,,,```,``,`,``,``,,-`-`,,`,,`,`,,`---

REFERENCES
(1) Joyce, J. A., and Tregoning, R. L., “Development of Consistent SizeCriteria for ASTM Combined Fracture Mechanics Standards,”Fatigueand Fracture Mechanics, Vol 30, ASTM STP 1360, P. C. Paris, et al,eds., ASTM, West Conshohocken, PA, 1999.
(2) Joyce, J. A., “Manual on Elastic-Plastic Fracture: Laboratory TestProcedures,” ASTM Manual Series MNL 27, 1996.
(3) Dawes, M. G.,“ Elastic-Plastic Fracture Toughness Based on the CODandJ-Integral Concepts,”Elastic-Plastic Fracture ASTM STP 668, J.D. Landes, J. A. Begley, and G. A. Clarke, eds., ASTM, 1979, pp.307–333.
(4) Willoughby, A. A., and Garwood, S. J., “On the Loading ComplianceMethod of Deriving Single SpecimenRCurves in Three Point Bend-ing,” Elastic-Plastic Fracture: Second Symposium, Volume II—Fracture Resistance Curves and Engineering Applications, ASTM STP803, C. F. Shih and J. P. Gudas, eds., ASTM, 1983, pp. II-372–II-397.
(5) Hackett, E. M., and Joyce, J. A., “DynamicJ-R Curve Testing of a
High Strength Steel Using Key Curve and Multi-Specimen Tech-niques,” Fracture Mechanics,Seventeenth Volume,ASTM STP 905,ASTM, 1986, pp. 741–774.
(6) Hellman, D., Rohwerder, G., and Schwalbe, K. H.,“ Development ofa Test Setup for Measuring Deflections of Single Edge Notched Bend(SENB) Specimens,”Journal of Testing and Evaluation, Vol 12, No. 1,January 1984, pp. 62–64.
(7) KarisAllen, K. J. and Mathews, J. R., “The Determination of SingleEdge-Notched Bend Specimen Load-Line Displacement from Re-motely Located Sensors in Elastic-Plastic Fracture Testing,”Journal ofTesting and Evaluation, JTEVA, Vol 22, No. 6, Nov. 1994, pp.581-583.
(8) McCabe, D. E., “Evaluation of the Compact Specimen for Plane StrainFracture Toughness of High Strength Materials,”Journal of Materials,Vol 7, No. 4, December 1972, p. 449.
(9) Begley, J. A., Clarke, G. A., and Landes, J. D., “Results of an ASTM
FIG. X1.1 BASIC Program (continued)
E 1820
45COPYRIGHT 2003; ASTM International
Document provided by IHS Licensee=MIT Libraries/6110146001, User=, 10/10/200310:08:20 MDT Questions or comments about this message: please call the DocumentPolicy Group at 1-800-451-1584.
--``,,,,``,,,,,```,``,`,``,``,,-`-`,,`,,`,`,,`---

Cooperative Test Program on theJIc Determination of HY-130 Steel,”Journal of Testing and Evaluation, Vol 8, No. 5, September 1980.
(10) Gudas, J. P., and Davis, D. A., “Evaluation of the TentativeJI-RCurve Testing Procedure by Round Robin Tests of HY-130 Steel,”Journal of Testing and Evaluation, Vol 10, No. 6, November 1982,pp. 252–262.
(11) Srawley, J. E., “Wide Range Stress Intensity Factor Expressions forASTM E399 Standard Fracture Toughness Specimens,”InternationalJournal of Fracture, Vol 12, June 1976, pp. 475–476.
(12) Newman, J. C., Jr., “Stress Analysis of the Compact SpecimenIncluding the Effects of Pin Loading,”ASTM STP 560, 1974, pp.105–121.
(13) Newman, J. C., Jr., “Stress Intensity Factors and Crack OpeningDisplacements for Round Compact Specimens,”International Jour-nal of Fracture, 17(6), December 1981, pp. 567–578.
(14) Underwood, J. H., Kapp, J. A., and Baratta, F. I., “More onCompliance of the Three-Point Bend Specimen,”International Jour-nal of Fracture, Vol 28, 1985, pp. R41–R45.
(15) Saxena, A., and Hudak, S. J., “Review and Extension of ComplianceInformation for Common Crack Growth Specimens,”InternationalJournal of Fracture, Vol 14, October 1978, pp. 453–468.
(16) Yoon, K. K., Gross, L. B., Wade, C. S., and VanDerSluys, W. A.,“Evaluation of Disk-Shaped Specimen for Determining J-R Curves,”Fracture Mechanics:26th Volume, ASTM STP 1256, W. G. Reuter, J.H. Underwood, and J. C. Newman, eds., American Society forTesting and Materials, Philadelphia, 1995.
(17) Shoemaker, A. K., and Seeley, R. R., “Summary Report of RoundRobin Testing By ASTM Task Group E24.01.06 on Rapid LoadingPlane Strain Fracture ToughnessKIc Testing,”Journal of Testing andEvaluation, Vol 11, No. 4, July 1983.
(18) Nakamura, T., Shih, C.F., and Freund, L.B., “Analysis of a Dynami-cally Loaded Three-Point-Bend Ductile Fracture Specimen,” Engi-neering Fracture Mechanics, Vol. 25, No. 3, 1986, pp. 323–339.
(19) Joyce, J.A., and Hackett, E.M., “An Advanced Procedure for J-RCurve Testing Using a Drop Tower,” Nonlinear Fracture Mechanics:Vol. 1–Time Dependent Fracture, ASTM STP 995, A. Saxena, J.D.Landes, and J.L. Bassani, Eds., ASTM, Philadelphia, 1989, pp.298–317.
(20) Joyce, J.A., “Analysis of the E08.02 High Rate Round Robin,”Journal of Testing and Evaluation, JTEVA, Vol. 29. No. 4. July 2001,pp. 329–351.
(21) Herrera, R., and Landes, J.D., “Direct J-R Curve Analysis: A Guideto the Methodology,”Fracture Mechanics: Twenty-First Symposium,ASTM STP 1074, J.P. Gudas, J.A. Joyce, and E.M. Hackett, Eds.,ASTM, Conshohocken, PA, 1990, pp 24–43.
(22) Landes, J.D., Zhou, Z., Lee, K., and Herrera, R., “NormalizationMethod for Developing J-R Curves with the LMN Function,” Journalof Testing and Evaluation, JTEVA, Vol. 19, No. 4, July 1991, pp.305–311.
(23) Lee, Kang, “Elastic-Plastic Fracture Toughness Determination UnderSome Difficult Conditions,” Ph.D Dissertation, The University ofTennessee, Knoxville, August, 1995.
ASTM International takes no position respecting the validity of any patent rights asserted in connection with any item mentionedin this standard. Users of this standard are expressly advised that determination of the validity of any such patent rights, and the riskof infringement of such rights, are entirely their own responsibility.
This standard is subject to revision at any time by the responsible technical committee and must be reviewed every five years andif not revised, either reapproved or withdrawn. Your comments are invited either for revision of this standard or for additional standardsand should be addressed to ASTM International Headquarters. Your comments will receive careful consideration at a meeting of theresponsible technical committee, which you may attend. If you feel that your comments have not received a fair hearing you shouldmake your views known to the ASTM Committee on Standards, at the address shown below.
This standard is copyrighted by ASTM International, 100 Barr Harbor Drive, PO Box C700, West Conshohocken, PA 19428-2959,United States. Individual reprints (single or multiple copies) of this standard may be obtained by contacting ASTM at the aboveaddress or at 610-832-9585 (phone), 610-832-9555 (fax), or [email protected] (e-mail); or through the ASTM website(www.astm.org).
E 1820
46COPYRIGHT 2003; ASTM International
Document provided by IHS Licensee=MIT Libraries/6110146001, User=, 10/10/200310:08:20 MDT Questions or comments about this message: please call the DocumentPolicy Group at 1-800-451-1584.
--``,,,,``,,,,,```,``,`,``,``,,-`-`,,`,,`,`,,`---


