Standard Techniques - NASA · PDF fileStandard Techniques ... correlation of bistatic-radar...
25
NASA Technical Memorandum 79730 Standard Techniques for Presentation and Analysis of Crater Size-Frequency Data APRIL 19'.'8 https://ntrs.nasa.gov/search.jsp?R=19780014063 2018-05-18T05:06:43+00:00Z
Transcript of Standard Techniques - NASA · PDF fileStandard Techniques ... correlation of bistatic-radar...
NASA Technical Memorandum 79730
Standard Techniques for Presentation and Analysis of Crater Size-Frequency Data
APRIL 19'.'8
https://ntrs.nasa.gov/search.jsp?R=19780014063 2018-05-18T05:06:43+00:00Z

NASA Technical Memorandum 79730
Standard Techniques for Presentation and Analysis of Crater Size-Frequency Data
Crater Analysis Tcchniques Working Group Ofice of Spice Scie.vce I~"rsbit1gtotr, D. c.
National Aeronautics and Space Administration
Scientific and Technical Information Office
1978

Crater Analys is Techniques
Working Group
(A lphabe t i ca l l y ) R. Arvidson, Washington, Univ. ; J. Boyce (Co- chairperson), USGS/NASA Hdqt; C. Chapman, Planetary Sciences I n s t . ; M. C in ta la , Brown Univ.; M. Fulchignoni, Lab. A s t r o f i s c i a Spacial CNR; H. Moore, USGS; G. Neukum, Univ. Munich; P. Schultz, Lunar and Planetary Ins t . ; L. Soderblom, USGS; R. Strorn, Univ. Arizona; A. Woronow (Chairperson) , Univ. Arizona; R. Young, SUNY.

TABLE OF CONTENTS
Abstract . . . . . . . . . . . . . . . . . . . . . . . . . . . . 1
In t roduc t ion . . . . . . . . . . . . . . . . . . . . . . . . . 2
Achievements and Goals o f Crater Analysis . . . . . . . . . . 4
Recomnendations f o r Crater Size-Frequency Presentat ions . . . 6
The Cumulative Size-Frequency D i s t r i b u t i o n P l o t . . . . . . . 8
Construct ion from Unbinned Data . . . . . . . . . . . . . . 8
Ccnstrcct ion from Binned Data . . . . . . . . . . . . . . . 9
The Re la t i ve Size-Frequency D i s t r i b u t i o n P l o t . . . . . . . . 9
Tables . . . . . . . . . . . . . . . . . . . . . . . . . . . . 10
Morphologic Analysis . . . . . . . . . . . . . . . . . . . . . 12
Summary o f Recommendations . . . . . . . . . . . . . . . . . . 14
Acknowledgments . . . . . . . . . . . . . . . . . . . . . . . 15
Appendix I : Relat ionships Among P l o t t i n g Techniques . . . . . 16
Appendix 11: Examples . . . . . . . . . . . . . . . . . . . . 17
I 1 1 u s t r a t ions
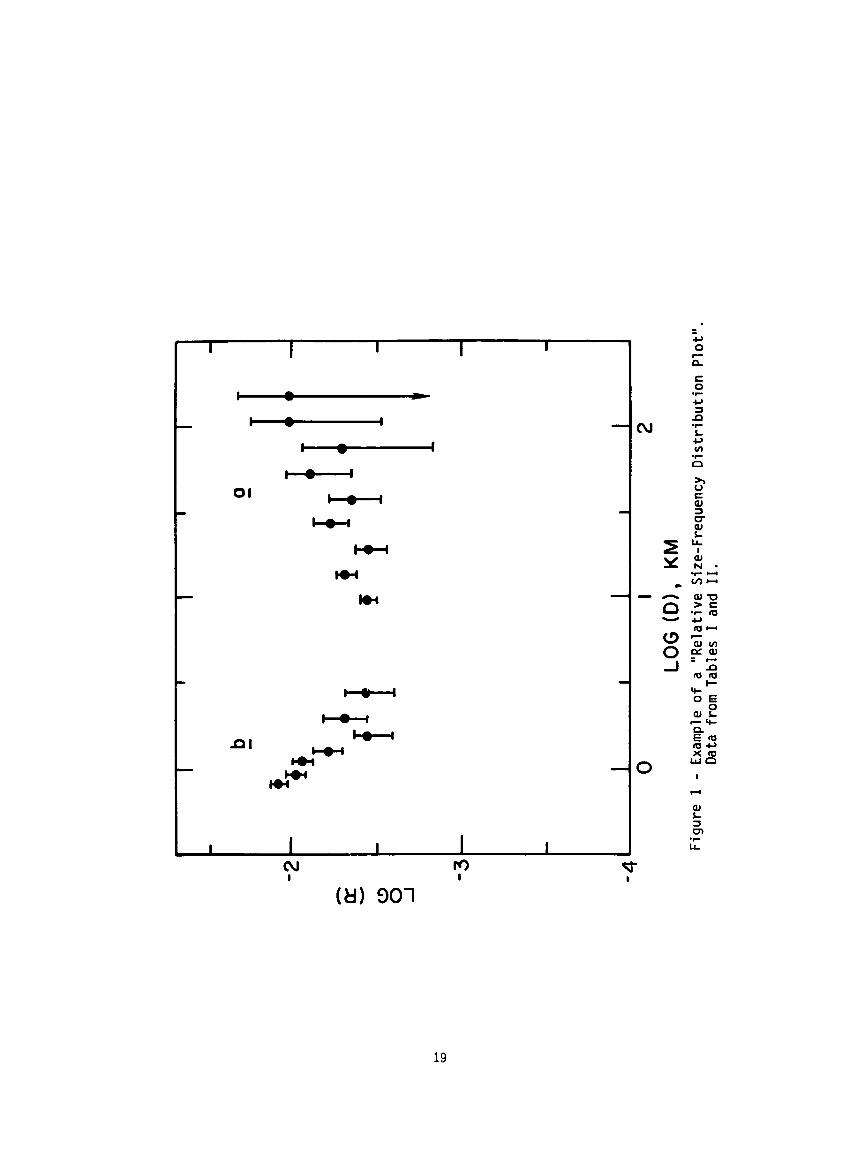
Figure 1 . Example o f a "Re la t i ve Size-Frequency D i s t r i b u t i o n
P l o t " . . . . . . . . . . . . . . . . . . . . . . . 19
Example o f a "Cumulative Size-Frequency D i s t r i b u -
t i o n P l o t " . . . . . . . . . . . . . . . . . . . . 20
F igure 2 .
Tab1 es
Table 1 . Lunar Mare: Fronts ide Post Mare (data s e t ' a ' ) . . 18
Table 2: Mare Crisium: Easternpart (data s e t ' b ' ) . . . . . 18

ABSTRACT
I n September 1977, a c ra ter studies workshcp was held f o r the
purpose of developing standardized data analysis and presentation
techniques.
the part ic ipants. This f i r s t meeting considered pr imar i ly c ra ter
size-frequency data. Future meetings w i l l t r e a t other aspects o f
c r a t e r studies such as morphologies.
This report contains the unanimous recomnendations o f
1

INTRODUCTION
Analyses of c r a t e r popu la t ion s t a t i s t i c s have played a major r o l e
i n e s t a b l i s h i n g p lanetary chronologies, i n determin ing the nature o f
p lanetary sur face processes, and i n i n f e r r r i n g the c h a r a c t e r i s t i c s o f
as te ro ida l and cometary populat ions and the meteoroid complex. These
analyses a l s o have been a r e l i a b l e t o o l f o r probing the phys ica l env i ron-
ment o f p lanetary surfaces and i n t e r i o r s . The wide a r ray o f app l i ca t i ons
of c r a t e r analyses has brought i nves t i ga to rs o f d iverse i n t e r e s t s and
backgrounds i n t o t h i s r e l a t i v e l y young d i s c i p l i n e ; and a myriad o f data
ana lys is techniques have ar isen.
the same, and attempt t o d i sp lay o r analyze t h e sanle a t t r i b u t e s o f the
c r a t e r populat ions bu t the f i n a l products have markedly d i f f e r e n t appear-
ances and o f t e n are not e a s i l y intercompared.
techniques, redundant data c o l l e c t i o n and reduc t ion will be minimized and,
most impor tan t ly , under ly ing concepts can be t raced more e a s i l y through
r e l a t e d s tud ies. Toward the Goal o f s tandard izat ion, a working group was
formed.
F lags ta f f , Az.
rebul t i n g from t h a t meeting.
Most o f t h e techniques are fundamentally
By s tandard iz ing ana lys is
The group met September 8 and 9, 1977, a t the USGS f a c i l i t y i n
This document contains the f i nd ings and recommendations
Because " c r a t e r anal yses" i nvo l ve such a broad range o f d i s c i p l i nes ,
the working group chose t o concentrate on c r a t e r s ize- f reo lency ana lys is
a t i t s f i r s t meeting, w i t h o ther top i cs l e f t u n t i l f u t u r e meetings. The
group members represent a cross-sect ion o f i n s t i t u t i o n s and in te res ts , bu t
a l l have i n common cur ren t involvement i n c r a t e r size-frequency data c o l -
l e c t i o n and reduct ion. A d r a f t o f t h i s repo r t has been widely c i r c u l a t e d
f o r comment t o an extens ive l i s t o f s c i e n t i s t s whose research incorporates
2
c r a t e r analys is . Those s c i e n t i s t s responding are l i s t e d i n the acknow-
ledgments and t h e i r comments have been taken i n t o account i n t h i s f i n a l
repor t .
I n t h i s document i t a l i c s emphasize the s o e c i f i c recorrpendations of
t h e comnittee. A l l o f the recomnendations presented were adopted unani-
mously by the committee.
Before present ing the i n d i v i d u a l recommend
the past accomplishments and cur ren t top ics of
c r a t e r size-frequency ana lys is w i l l es tab l i sh a
view the body o f t h i s repo r t .
t i ons , a b r i e f review o f
nves t i ga t i on u t i l i z i n g
perspect ive from which t o
3

ACHIEVEMENTS AND GOALS OF CRATER ANALYSIS:
Crater s t a t i s t i c a l analyses have been used success fu l l y i n th ree
major ways, namely:
date geologic u n i t s and events, ( 2 ) t o i d e n t i f y sur face and subsurface
processes, and ( 3 ) t o prov ide a framework f o r i n t e r p r e t a t i o n o f data from
o the r f i e l d s .
(1 ) t o understand p lanetary chronologies and t o
Dating o f p lanetary surfaces was one o f the f i r s t app l i ca t i ons o f
c r a t e r s t a t i s t i c s .
densi ty , and morphology d i s t r i b u t i o n s , r e l i a b l e r e l a t i v e chronologies are
being es tab l i shed f o r the Moon, Mars, and Mercury.
Apol l o and Luna re tu rned samples are avai 1 ab1 e , Moon-wi de absol Ute chrono-
l og ies have been developed and are being extended across the surface.
Many sub-d isc ip l ines o f p laneto logy r e q u i r e a t l e a s t a framework o f r e l a -
t i v e ages i n o rder t o i n t e r p r e t p lanetary evo lu t i on i n terms o f chemistry,
s t ruc tu re , and processes; c r a t e r analyses are the c h i e f means o f ob ta in ing
t h i s t ime framework.
s t a t i s t i c s prov ide the on ly p resen t l y a v a i l a b l e means o f es t ima t ing absolute
(admi t ted ly coarse) chronologies f o r Mercury, Venus, and Mars.
Through d e t a i l e d study o f c r a t e r size-frequency,
For the Moon, where
When combined w i t h a s t e r o i d and comet surveys , c r a t e r
Crater analyses have es tab l i shed the genera l l y anc ient nature of the
surfaces o f t h e Moon, Mercury, and Mars, thereby demonstrating the unique-
ness o f the Ear th ' s r a p i d t e c t o n i c cyc le o f c r u s t a l production, al,Jlution,
and des t ruc t ion .
combined t o e s t a b l i s h t h a t the impact f l u x i n the Earth-Moon system hda
been h i g h l y time-dependent w i t h an e a r l y h igh f l u x t h a t dropped r a p i d l y t o
a l e v e l several orders o f magnitude lower w i t h poss ib le ep isod ic excursion
back t o h igher l eve l s .
Lunar c r a t e r s t a t i s t i c s and re tu rned samp:c ages are
4

Analysis of microcrater populations on exposed lunar rocks has
yielded exposure time information and has helped t o establish rates for
such processes as lunar rock erosion, regolith m i x i n g , solar f lare iron-
group particle track formation, solar wind sputtering, and accumulation
of solar wind elements.
Progress continues to be made i n establishing both relative and
absolute chronologies and i n improving impact-flux histories. We believe
that crater analyses will provide improved absolute dates for the surfaces
of a1 1 the terrestr ia l planets and better interplanetary correlations of
geologic time.
Because impact craters form a t random locations on planetary surfaces,
b u t geologic events often locally a l te r this uniformity, crater analyses
have been useful for mapping geologic units of common origin and age.
Furthermore, different geologic processes (e.g. aeolian erosion, volcanism,
and tectonic disruption) affect crater size-frequency distributions and
morp;io i o g i es i n characteristic manners. Through crater analyses a wide
range of internal and surface geologic processes have been identified or
contrasted on the Moon, Mercury, and Mars.
Other areas of planetology utilized knowledge established by crater-
i n g mechanics and s ta t i s t ica l studies i n order t o interpret their own
observations.
temperatures w i t h surface impact ages; correlation of bistatic-radar echo
broadening w i t h crater densities and size distribution; interpretation of
the 25 km-deep change i n lunar p-wave velocity i n terms of crustal frac-
t u r i n g from impact events; and correlation of l u n a r reflection spectra
w i t h impact-glass content.
Among the many possible examples are correlation of eclipse
5

Crater analyses a l ready have produced valuable and otherwise un-
a t t a i n a b l e information, and the prospects f o r s t i 11 f u r t h e r successes
are exce l len t .
vancements and ref inements o f our understanding o f c r a t e r i n g as a geolo-
g i c process; recogn i t i on o f t h e c h a r a c t e r i s t i c s o f pr imary and secondary
c ra te r ing ; understanding o f the o r i g i n , evo lu t ion , and dynamics o f small
bodies i n the s o l a r system; and understanding o f p lanetary c r u s t a l pro-
pe r t i es , environment;, and evo lu t ion .
continues t o expand the l i b r a r y o f bas ic in fo rmat ion about the t e r r e s t r i a l
Current compet i t ion and debate are producing r a p i d ad-
As t he techniques o f c r a t e r analys is
p lanets , t h e i r use and respect by o the r d i s c i p l i n e s w i l l cont inue t o
i ncreascz.
RECOMMENDATIONS FOR CMTER SIZE-FREQUENCY PRESENTATIONS:
A wide va r e t y o f p resenta t ion techniques f o r c r a t e r data have ap-
Occasional ly the data appear i n tab les, more peared i n the 1 te ra tu re .
o f t e n i n graphs.
s t rengths and weaknesses, a l l f a l l i n t o two broad classes: those t h a t
d i sp lay the d i f f e r e n t i a l size-frequency d i s t r i b u t i o n and those t h a t d i s
Although each of the techniques has i t s p a r t i c u l a r
p l a y i t s i n t e g r a l , the cumu a t i v e size-frequency d i s t r i b u t i o n .
s i t y o f graphic techniques
d i f f i c u l t , For t h i s reason we have developed a system o f s tandard iza t ion
o f c r a t e r s t a t i s t i c s techniques.
The d i v e r -
n use has made communication among researchers
The s i n g u l a r l y most impor tant b e n e f i t der ived from standardized
c r a t e r ana lys is techniques i s enhanced communication.
min imiza t ion o f redundant measurements.
w i l l p e w i t r a p i d comparisons among i n d i v i d u a l s tud ies and data sets. I n
p a r t i c u l a r , r e l a t e d features o f the data w i l l be a t t he same l o c a t i o n
Another bene f i t i s
P l o t t i n g data i n standard formats
6

( x and y values) and look the same on a l l p l o t s . Oral communication w i l l
also b e n e f i t because reference t o a bump o r w igg le a t some se t o f coor-
d inates w i 11 unambiguously 1 ocate t h a t feature,
The c r i t e r i a l i s t e d below es tab l i shea the bas is f o r s e l e c t i n g the
two p l o t t i n g techniques.
o r e a s i l y understood; (2) be e a s i l y implemented; (3 ) be r e a d i l y i n t e r -
preted; (4) have wide a p p l i c a b i l i t y t o recognized problems so t h a t t he
need t o use a l t e r n a t i v e techniques i s minimized; and ( 5 ) be both "consis-
t e n t " and "unbiased" ( i n the s t a t i s t i c a l sense) and i n s e n s i t i v e t o the data
ga ther ing techniques.
diameter b i n s i z e used.
The technique(s) should: (1 ) be i n common use,
The p l o t should no t depend s t rong ly on the c r a t e r -
Based on the above c r i t e r i a , we chose two p lo t t i ng techniques as the
standards; the "Cumulative Size-Frequency D i s t r i b u t i o n P l o t " clnd the
"Re la t i ve Size-Frequency D i s t r i b u t i o n P l o t " .
a t t r i b u t e s and benef i t s o f a cumulative p l o t t i n g technique, wh i l e the
l a t t e r i s a v a r i a t i o n on a d i f f e r e n t i a l p l o t t i n g technique.
t ha t a l l C,ta be p lo t t ed i n both o f the standard formats. However, we
recognize t h a t a l l des i rab le c r a t e r analyses may no t be served by j u s t
these two p lo t s .
recommended standard formats, but the standard f o m a t s should s t i l l be
presented, i n addition t o the specicl formats.
e a s i l y t o u t i l i z e t h e data sets.
The former possesses the
We recommzd
I n such cases, special needs take p r i o r i t y over the
This w i l l enable o thers
D e t a i l s o f these p l o t t i n g techniques are given below.
we recommend us ing the f o l l o w i n g bas ic conventions o f p l o t t i n g :
double logarithmic axes o f the ssiiie scale.
consis tent un i t s .
F i r s t however,
(1) Uze
( 2 ) Both axes should h a w
That 1:; i f c r a t e r diameters were given i n k i lometers,
7
c r a t e r dens i t i es should be i n number per square k i lometer . (3) P Z O S one
standard deviation, lo , confidence in tervals f o r each data point plot ted.
For most purposes t h i s can be e a s i l y done by assuming t h a t the populat ions
are Poisson d i s t r i b u t e d then 10 can b2 estimated by us ing N = ?fl where N
i s the number o f c ra te rs .
THE CUMULATIVE S I ZE-FREQUENCY DISTRIBUTION PLOT:
The Cumulative Size-Frequency D i s t r i b u t i o n P l o t possesses a number of
important a t t r i b u t e s :
(1)
(2)
( 3 )
It disp lays the i n t e g r a l o f F(D).
It i s a well-known and e a s i l y implemented technique.
The p l o t t e d r e s u l t s are f a i r l y independent of the b i n s i z e
(but r e s o l u t i o n i s not independent o f b i n L i ze ) .
Construct ion from Unbinned Data: When the diameter o f i n d i v i d u a l
c ra te rs are measured and recorded, the da ta are ungrouped o r unbinned, and
when c r a t e r diameters are measured and recorded by keeping a t a l l y of the
number o f c ra te rs i n increments the data are grouped o r binned. Unbinned
data provides the g rea tes t f l e x i b i l i t y because they can e a s i l y be recast
i n t o binned data and they prov ide the maximum poss ib le r e s o l u t i o n o f small
features i n the d i s t r i b u t i o n funct ion. However, c o l l e c t i o n , manipulat ion,
and d i sp lay of unbinned data i s more t i m e consuming than f o r binned data.
The requi red s eps f o r p l o t t i n g unbinned data are:
(1 ) So r t the c r a t e r s i n t o descending order by diameter (d) ;
obta n i n g the sequence d,, d2, dj, ... P l o t the l o g o f the diameter o f each c r a t e r dn, l o g (dn),
against the l o g o f the t o t a l o r cumulative number of c ra te rs
per u n i t area w i t h equal o r l a r g e r diameters, l o g (n/A),
where A i s the surface area.
dn (2)
8
( 3 ) P l o t the confidence i n t e r v a l 50, which f o r the n t h c r a t e r d
i s l o g [-I. Construct ion from Binned Data: For many purposes the c r a t e r diameter
measurements can be taken i n bins o r be binned before p l o t t i n g . The widths
of the b ins can be adjusted t o achieve the des i red l e v e l o f reso lu t i on .
the l a r g e s t diameter b i n be b i n 1 conta in ing nl c ra te rs (nl>l) , and the
second l a r g e s t b i n be b i n 2 conta in ing n2 c ra te rs . .. , and the i t h diameter be
b i n i conta in ing ni c ra te rs .
l i m i t s Da t o Db (Db > Da) and contains ni c ra te rs , p l o t l o g (p ) where,
Let
To p l o t the data i n b i n i which has diameter
i nK
K = l K = Z A , aga ins t l o g (Da). This equation a l lows the populat ion i n each
b i n t o have been measured on a d i f f e r e n t amount o f surface area. L e t t i n g
i the t o t a l number o f c ra te rs i n b i n i and a l l l a r g e r diameter b ins, nKK’ N = C
K= 1
the confidence i n t e r v a l , 20 , i s l o g p * p - . i 1 THE RELATIVE SIZE-FREQUENCY DISTRIBUTION PLOT:
The Re la t i ve Size-Frequency D i s t r i b u t i o n P l o t possesses a number o f
i mportan t a ttr i bu tes :
(1) I t i s e a s i l y implemented.
(2 ) The p l o t d isp lays in format ion on the d i f f e r e n t i a l size-frequency
d i s t r i b u t i o n func t i on F( 0) .
( 3 ) The p l o t t e d r e s u l t s are as independent o f the b i n s i z e as pos-
s i b l e (bu t r e s o l u t i o n i s no t independent o f t h e b i n s i ze ) .
( 4 ) Most c r a t e r populat ions have slope ind i ces w i t h i n the range of
21 of the funct ion D-3; therefore, they w i l l p l o t as non-sloping o r
moderately s lop ing l i n e s on these p l o t s .
l i n e s on these p l o t s make any changes i n the F(D) more obvious and f a c i l i -
ta tes i d e n t i f y i n g d i f f e rences i n d i s t r i b u t i o n funct ions and dens i t i es among
9 c r a t e r populat ions.
The shal low average slopes o f

P r i o r t o p l o t t i n g t h e data by t h i s technique, they must be binned.
Consider a b i n w i t h diameter l i m i t s Da t o Db (Ob
which were 'neasured on a surface of area A. To determine the value t o be
Da) con ta in ing n c ra te rs
p l o t t e d along t h - absicissas, f i r s t ca l cu la te the geometric mean (q o f
the c ra te rs i n the b in .
D = [ i=ldj] v idua l diameters are no t ava i lab le ,
3 p l o t Log (R) where R = (c) n/A(Db-Da) against Log (m.
I f the i n d i v i d u a l diameters ( d ' s ) a re ava i lab le ,
- 1 /n the n th r o o t o f the product of t he diameters. If the i n d i -
z q. To p l o t t he da ta i n b i n i,
The confidence
i n t e r v a l , +-c, i s l o g R C f i . Rl TABLES :
A Z i data shoxZd be given i n tabular f o n . Exceptions t o t h i s are data
publ ished i n a previous a r t i c l e o r data from a w ide ly access ib le c r a t e r
catalog. Some data may be so extens ive t h a t g i v i n g tne f u l l s e t o f tab les
i n an a r t i c l e would r e s u l t
case, the author should use
Whether o r n o t t h i s serv ice
.:a*~ Z L :.;'s s?z:'u:a ~a asnt _ - ? - . .
n excessive expense o r a r t i c l e length. I n t h i s
the j o u r n a l ' s m ic ro f i che serv ice, i f ava i lab le .
i s ava i l ab le , a r e p r h t of a11 a r t i c l e s ami t h e i r
9 the L m a r a id PZaxetaq I n s t i t u t e (ir 'rl 3308
.7t:::): .?,2ad 1 , . Y . ~ ~ ~ ~ ~ i ~ , ?ex&, 77358, f o r a r c i z Z g i m ? . I f the data are no t pre-
sented i n the a r t i c l e then s t a t e where the tabu la ted data can be obtained.
Thas, data sets w i l l be a v a i l a b l e t o others f o r f u r t h e r ana lys is and re -
duntisnt c r a t e r measurements w i 11 be minimized.
I n order t o maximize the da ta ' s usefi i lness, the t d k shostZd comply
s!tj: 2 ~ t n d m d mat.
make s t r i c t compliance t o the fo l low ing format impossible.
should comply w i t h as many of the f o l l o w i n g r u l e s as poss ib le .
f o r m a t i s :
We are aware t h a t some data c o l l e c t i o n techniques
However, tab les
The standard
10

(1) A l l data should be binned f o r the t a b u l a r presentat ion, regard-
l ess o f how they were taken o r p l o t t e d .
widths o f n o t greater than a. A b i n boundary, o r pro jected boundary, 1 should be a t D = 1 km (e.g. b ins o f /a t o 1 km, 1 t o km, t o 2 km
s a t i s f y t h i s format).
a l l o w combining t h a t data w i t h o the r data binned as described
The b ins should have geometric
If f i n e r b ins are desirable, us ina roo ts o f f i w i 1 1
,eve.
(2) The number o f c ra te rs w i t h i n each b i n should be given. Do no t
g ive the cumulative number o r the number per u n i t area.
(3 ) Speci fy the area of the surface over which the measurements were
made. I f the area changes from b i n t o b in , g i ve i t f o r each b in .
Stcpporting information for each tabZe must aZso be given. It shouZd
include, but not be limited to , the foZlming:
( 1 ) A d e s c r i p t i o n o f t he type o f mater ia ls from which the measurements
Give photograph I . D. number, type o f processing i t received, were made.
the scale used t o convert the measurements t o the actual diameter, the source
o f the scale, and whether the scale was assumed t o be constant o v e r the
e n t i r e photograph.
( 2 ) G i v e the exact l o c a t i o n of the region studied. E i t h e r l a t i t u d e -
longi tude l i m i t s o r a l o c a t i o n cha r t can be used.
( 3 ) Speci fy the method o f data c o l l e c t i o n and reduct ion. Describe
the measuring device ( r u l e r , p a r t i c l e - s i z e dnalyzer, e t c . ) and i t s accuracy.
Describe a l l cor rect ions made t o the measurements (such as f o r sun angle)
and why those correct ions were needed.
( 4 ) Give a l l o ther data t h a t wou;d be necessary f o r the reader t o be
able t o reconst ruct the data s e t from the appropr iate photographs.
11

Regression analyses:
pomr ser i e s , a s p e c i f f c model, o r other function, ax indicat ion of the
success of the regression shouZd be given.
done by us ing a non-parametric t e s t (e.g. x o r Ki lmogorof f -Smirnof f t e s t )
t o compare the data and the regress ion r e s u l t s .
regress ion adequately represents the data.
f i t t e s t , the l a confidence i n t e r v a l on the regress ion coe f i c i e n t s should
be given. Non-parametric t e s t s a re a lso use fu l f o r examin ng the range of
admi s s i b l e models.
MORPHOLOGIC ANALYSES :
I f the data are regressed t o a s t ra igh t l i n e , a
I n most cases t h i s i s bes t 2
A t e s t insures t h a t the
I n a d d i t i o n t o a goodness-of-
The coniini t t e e de fer red extens ive fo rmula t ion o f standards f o r c r a t e r
morphology s tud ies u n t i l a l a t e r meeting. Nonetheless, morphologic s tud ies
cannot be considered completely separate from s t a t i s t i c a l analyses, and the
committee decided t o l a y the foundat ion f o r f u t u r e discussions w i t h the
f o l l o w i n g two recommendations:
(1 ) k (quantitative measurerent is ahayo" t o be pref2rrt.d ovdr a
quaZZtative m c .
classes (whether the classes are numbered 1, 2 , 3, o r c a l l e d high, medium, low,
e t c . ) do n o t form a unique bas is f o r s t a t i s t i c a l eva lua t i on o f the con-
c lus ions. Q u a n t i t a t i v e measurements (whether from a continuum such as
ins ide /ou ts ide diameter r a t i o s , o r a Boolean t r u e - f a l s e eva lua t i on such as
cen t ra l peak presence o r absence) can be unambiguously t rea ted and are l ess
sub jec t t o a l t e r n a t i v e i n t e r p r e t a t i o n r e s u l t i n g from dif ferences i n sub-
j e c t i v e judgments. Therefore, i f a hypothesis could be tes ted by e i t h e r
a q u a n t i t a t i v e o r q u a l i t a t i v e morphology measurement, the q u a n t i t a t i v e
measurement i s t o be preferred.
Assignments o f morphologic c h a r a c t e r i s t i c s t o sub jec t i ve
12
( 2 ) In many instances a quantitative measurement may not be
possible. I f a qual i ta t ive measurement i s necessary, the exact c r i t e r i a
for making the quaZitative judgments must be g iven . A detailed descrip-
tion of the criteria may suffice, but specific examples illustrating
applications of the criteria would be preferable.
13

SUMMARY OF RECOMMENDATIONS
Graphs :
1. Disp lay data on both a "Cumulative Size-Frequency P l o t " and a "Relat ive Size-Frequency P lo t " .
2. Make the abscissas and ord ina tes both base 10 logar i thmic . 3. Use cons is ten t u n i t s on both axes. 4. Use the same scale f o r both axes. 5. P l o t the l a confidence i n t e r v a l s f o r the data po in ts .
Tables:
1. Give a l l the data i n tabu la r form. 2. 3 . Give t h e number o f c ra te rs i n each b i n . 4. 5.
Bin the data i n &-factor o r f i n e r b ins.
Speci fy the amount o f sur face area on which the data were measured. Deposit the data tab les w i t h L P I .
Support i ng I n f orma t i on :
1.
2. 3. Give the exact l o c a t i o n o f the area studied. 4.
Speci fy t h e source and k i n d o f mater ia ls on which the measurements were made. Speci fy the measuring technique used and assess i t s accuracy.
Give a l l o ther p e r t i n e n t in fo rmat ion such as the assumed scale o f the photographs and the correct ions, i f any, made t o the raw measurements .
Regression Analyses:
1. 2.
Give the la confidence i n t e r v a l s on the regress ion c o e f f i c i e n t s . Report the r e s u l t s o f a goodness-of - f i t t e s t o f the data t o the regression.
Morphologic Analyses:
1. 2.
A q u a n t i t a t i v e measure i s p re fe rab le t o a q u a l i t a t i v e measure. Speci fy the exact c r i t e r i a used f o r making q u a l i t a t i v e assign- ments o r measurements.
14

ACKNOWLEDGMENTS
We wish t o thank the fo l low ing ind iv idua ls fo r reviews and suggestions:
C. C. Allen, R. B. Baldwin, K. R. Blasius, B. M. Cordell, T. L. Duxbury, D. E.
Gault, W. K. Hartmann, J. B. Hartung, B. R. Hawke, 3. W. Head, F. H k , L. D.
Jo l le , K. C. Jones, M. Leake, G. E. McGi l l , R. J. Pike, J . Roberts, E. A.
Whitaker.
support and encouragement.
We a lso thank the NASA Planetary Geology Programs O f f i c e f o r t h e i r
15

APPENDIX I
Re 1 a t i on s h i ps Among P1 o t t i n g Techn i ques
Basic d e f i n i t i o n s :
(1 ) Surface area i s A.
( 2 ) Let F(D) be the d i f f e r e n t i a l s ize number d i s t r i b u t i o n o f the
craters per u n i t area.
C(D), the cumulative number o f craters w i t h diameters greater ( 3 )
than o r equal t o D and less than o r equal t o Dmax ( t he 1argesL
c ra te r measured) per u n i t area i s C(D) =
Each p l o t t i n g technique w i l l be re la ted t o F(D) o r C(D).
I . Cumulative Size-Frequency D i s t r i b u t i o n Plot :
- This i s given by d e f i n i t i o n (3) . We p l o t l o g (CCD)) against
l o g (D).
I I . Re1 a t i ve S i ze-Frequency D i s t r i b u t i o n P l o t :
- Let S(D) be a d i f f e r e n t i a l "reference d i s t r i b u t i o n " :
3 S(D) z D-
- R(D) E $# To apply t h i s d e f i n i t i o n we evaluate R ( D ) over the
f i n i t e i n te rva l AD between Da and Db (Db > Da):
- S(D) i s evaluated a t the geometric mean o f the i n t e r v a l Da t o Db:
- Therefore,
- We p l o t l o g (R(D)) against l o g [ (DaDb)"] .
16

111. D i f f e r e n t i a l Size-Frequency D i s t r i b u t i o n P l o t (e.g. Chapman and
Haefner, JGR, 1967):
- This method approximates F(D) over the i n t e r v a l Da t o Ob
(Db 2 Da] - We would p l o t l o g (F(D))against l o g
IV. Incremental Number P l o t (e.g. Hartmann, Corn., Lunar and Planetary
Laboratory, 1964) :
- J (D) = C(DJ- C(ID,)
Where I i s a constant f a c t o r greater than u n i t y ( o f t e n I =
which must be maintained f o r the e n t i r e span o f the p l o t .
We would p l o t l o g (J(D)) against l o g (DaI’). -
V. Area P l o t (e.g. Strom, Abs. 8 th LSC, 1977): ,. lT(i7y - T(D) = -7 J(D)
- Where D = DaI’ (I i s as def ined i n IV above).
- We would p l o t l o g (T(D)) against l o g (Da12).
APPENDIX I 1 - EXAMPLES
Below a r e given two sets o f c r a t e r s ize-frequency data i n tabu la r and
both graphic formats. Table I i s data from the new LPL l u n a r catalog. This
tab le conforms e x a c t l y t o the suggested format:
j e c t e d b i n boundary o f 1 km diameter.
and 2. The second t a b l e i s rebinned data from Neukum e t a l . (Moon, 1975). The
b ins have not been made i n t o Jz i n t e r v a l s , b u t a b in boundary i s a t 1 km
diameter. This data i s labe led c b i n Figures 1 and 2.
4Z geometric b i n s w i t h a pro-
These data are labe led - a i n Figures 1
17
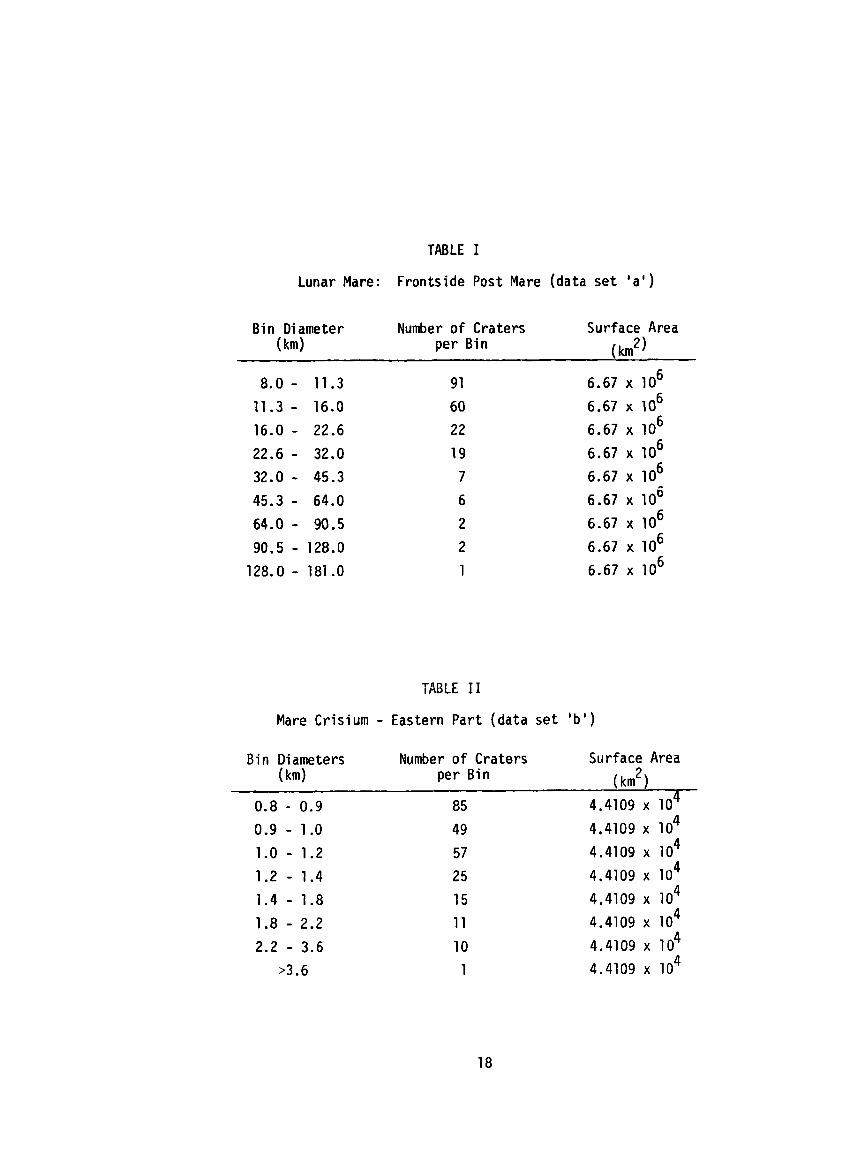
TABLE I
Lunar Mare: Frontside Post Mare (data set ' a ' )
Bin Diameter Number o f Craters Surface Area
8.0 - 11.3 91 6.67 x lo6 11.3 - 16.0 60 6.67 x lo6
16.0 - 22.6 22 6.67 x lo6 22.6 - 32.0 19 6.67 x lo6 32.0 - 45.3 7 6.67 x lo6 45.3 - 64.0 6 6.67 x lo6
64.0 - 90.5 2 6.67 x lo6 90.5 - 128.0 2 6.67 x lo6
128.0 - 181.0 1 6.67 x lo6
( km2) (km) per Bin
TABLE I 1
Mare Crisium - Eastern Part (data set ' b ' )
B i n Diameters Number o f Craters Surface Area
0.8 - 0.9 85 4.4109 x lo4 0.9 - 1.0 49 4.4109 x lo4 1.0 - 1.2 57 4.4109 x lo4 1.2 - 1.4 25 4.4109 x lo4
15 4.4109 x lo4 1.8 - 2.2 11 4.4109 x lo4 2.2 - 3.6 10 4.4109 x lo4
>3.6 1 4.4109 x lo4
( km2) (km) per Bin
1.4 - 1.8
18
m-
N I
19

-*c # I f
f f
LOG (01, KM
Figure 2 - Example o f a "Cumulative Size-Frequency D i s t r i b u t i o n P l o t " . Data from Tables I and 11.
20

I . Report No. I 2. Government Accession No. I 3. Recipient's Catalog No
Standard Techniques For Presenta t ion and Ana lys is o f Cra ter S i ze-frequency Data
NASA TM-797?P I I 4. Title and Subtitle I 5. Report Dare
A w l 1 1978
s t - 4 6 Performing Organization Code
7 Author($)
L r a t e r Analysis Techniques Working Group
9 Performing Organization Name and Address
8. Performing Organization Report No.
10 Work Unit r b
Of f i ce o f Space Science
Planetary Geoloqy Program
I2 Sponsoring Agency Name and Address
Planetary D i v i s i o n
Nat iona l Aeronautics and Space Admin i s t ra t i on Washington, D . C . 20546
1 1 Contract or Grant No,
13 Type of Repan and Pertad Cuverffl Technical Memorandum
14 Sponsoring Agency Code F
7 Key Words lSupoesled by Au~horlsl I
Crater Size-Frequency Data Standard Techniques
I
I5 Supplementary Notes
113 Cirtributlon Statement
Unc lass i f i ed - Un l im i ted
Cat. 91
I n September 1977, a c r a t e r s tud ies workshop was he ld f o r the purpose of developing standard data ana lys i s and presenta t ion techniques. o f the p a r t i c i p a n t s . Future meetings will t r e a t o ther aspects o f c r a t e r s tud ies such as morphologies.
This repo r t contains the unanimous recomnendations This f i r s t meeting considered p r i m a r i l y c r a t e r s ize-frequency data.
9 k u r 1 1 y Oavrf lof this report: 20 Security Cldruf lot this paw) 21 No. 01 Pages 22 hire'
24 Unclassi f i ed Unc lass i f ied $4 .OO