STANDARD STUDENT PROGRAM 3 - Modern...
68
STANDARD STUDENT PROGRAM 3 STUDENT MANUAL Molecular Biology of Nucleic Acids
-
Upload
truongquynh -
Category
Documents
-
view
218 -
download
0
Transcript of STANDARD STUDENT PROGRAM 3 - Modern...

STANDARD STUDENT PROGRAM 3STUDENT MANUAL
Molecular Biology of Nucleic Acids


Preface This laboratory manual forms an integral part of a unique teaching system. In add ion to the manual, the complete system consists of electrophoresis equipment and the chemicals and materials required to perform six key experiments in modern biology. A description of the electrophoresis apparatus is found in Part Ill of this manual.
This teaching system was designed principally for students taking a first laboratory course in modern biology. tt is well suited for secondary level or undergraduate students enrolled in general biology, genetics, biochemistry or molecular biology. I have assumed that readers have had an introductory lecture course in the biological sciences. However, I have attempted to write the manual in such a way that even a stranger to biology could follow it and perform the exercises by doing them in sequence.
The laboratory manual is divided into two major sections. The first section provides basic information on the biology and chemistry of nucleic acids and is also intended to acquaint students with the principles and techniques of electrophoresis. Student should be familiar with this material before advancing to the second section of the manual. The second part of the manual, shows students how to apply what they have learned to perform six exercises in modern biology. The exercises deal with the structure and function of DNA. Each experiment provides state-of-the-art information and most can be completed in a 3-hour laboratory session. Experiments 4 and 6 require three laboratory sessions each to complete. A background information section is given for each exercise and students should read this material prior to performing the exercise in the laboratory. I have also included a number of relevant references from Scientific American other sources for future study. Each exercise includes study questions, the answers to which students derive from integrating the background material found in the text with the results of the experiments.
John N. Anderson, Ph.D. Professor of BiologyDepartment of Biological SciencesPurdue UniversityWest Lafayette, Indiana 47907
© 2013 by John N. Anderson, All rights reserved.
i STANDARD STUDENT PROGRAM 3MODERNBIO.COM


Table of conTenTsPart A. Background Information
I. Nucleic Acid Structure and Function: A Review of the Basics Nucleotides-Building Blocks of Nucleic Acids ................................. 1 The Polynucleotide Chain .............................................................................. 3 DNA Structure .............................................................................................. .4 Biological Role of DNA and RNA ................................................................ 4 Analyzing Specific Genes and Recombinant DNA Technology ................... 7
II. General Description of Agarose Gel Electrophoresis
III. Practical Aspects of Electrophoresis Electrophoresis Equipment .......................................................................... 12 Electrophoresis Chemicals ........................................................................... 14
IV. Electrophoresis Procedures Pouring the Agarose Gels ............................................................................ 15 Sample Application ...................................................................................... 16 Electrophoresis ............................................................................................ 17 Staining ........................................................................................................ 18 Determining the Size of DNA by Electrophoresis ....................................... 19
V. Hybridization Analysis DNA Denaturation and Renaturation ........................................................... 21 Hybridization Procedures ............................................................................ 24 Application of Southern Blotting in Medicine ............................................ 30
VI. Suggested Reading and References for Part A ............................................ 33
Part B. Laboratory Exercises301. Determination of the Length of DNA Molecules ...................................... 20
302. Restriction Nuclease Mapping DNA ......................................................... 24
303. Plasmid DNA Structure .............................................................................. 30
304. Molecular Cloning A. Introducing Plasmid DNA into E.coli ..................................................... 34 B. Isolating and Analyzing a Plasmid from E.coli ....................................... 39
305. Identifying Satellite Sequences ................................................................. 46
306. The Nucleosome Structure of Chromatin A. General Studies ....................................................................................... 50 B. Structure of Plant Chromatin .................................................... ............. 55 C. Chromatin DNA by Cell Nucleases (Optional) ....................................... 57
Suggested Reading and References for Part B ................................................... 60
Appendix - The Metric System .......................................................................... 61
iii STANDARD STUDENT PROGRAM 3MODERNBIO.COM


1 STANDARD STUDENT PROGRAM 3MODERNBIO.COM
ParT a. background InformaTIonI. Nucleic Acids: A Review of the Basics
The concept that chromosomal units known as genes transmit heritable information from parent to offspring was founded in the late 19th century. However, a description of genes in terms of their unique structural and functional properties is relatively new. We now know that genes are composed of a type of nucleic acid called deoxyribonucleic acid (DNA). The DNA molecule not only directs its own reproduction but also stores all the information that determines the types of proteins produced during the lifetime of an organism. In so doing, DNA orchestrates the complex reactions and structures characteristic of an organism and its offspring. Ribonucleic acid (RNA), the second major category of nucleic acids, is involved principally in the transmission of genetic information and in protein production. The structure and function of DNA and RNA can most easily be understood by examining the chemical composition of the nucleic acids.
Nucleotides - Building Blocks of Nucleic AcidsUnder the proper conditions, nucleic acids can be broken down to low- molecular weight products of three types: a pentose (or 5 carbon) sugar; purines and pyrimidines; and phosphoric acid (Figure 1). The phosphate group is responsible for the strong negative charge of nucleic acids. The pentose sugar from RNA is always ribose and that from DNA is 2-deoxyribose. These sugars differ only by the presence or absence of a hydroxyl group on carbon 2 (so-called 2’). The numbers assigned to the five carbon atoms are shown in Figure 1. The purines and pyrimidines are often called nitrogenous bases (or, simply, bases). The major purine bases in DNA and RNA are adenine (A) and guanine (G), and the major pyrimidines in DNA are cytosine (C) and thymine (T). RNA contains the base uracil (U) in place of thymine. The sugars and phosphates are readily soluble in water. That is, they are hydrophilic. In contrast, the bases are hydrophobic in that they display limited solubility in water. As will be discussed below, these differences in water solubility are extremely important for the structure of the DNA molecule.
A nucleotide consists of a pentose sugar, a nitrogenous base and a phosphate group structured as shown below. The high-energy storage compound, adenosine triphosphate (ATP), is a well known nucleotide found in biological systems.

2 STANDARD STUDENT PROGRAM 3MODERNBIO.COM
Figure 1. The Nucleotide Components

3 STANDARD STUDENT PROGRAM 3MODERNBIO.COM
The Polynucleotide ChainNucleic acids are polynucleotides and have the general structure shown below:
A polynucleotide is composed of repeating nucleotide units linked into chains by phosphodiester bonds that join the 5’ carbon of one ribose or deoxyribose group to the 3’ carbon of the next sugar (Figure 2). The sequence or order of nucleotides in a polynucleotide chain is often abbreviated by a 1-letter code (e.g., G-C-A-T-A) with the 5’ end of the chain written at the left. A typical RNA molecule is a single-stranded polynucleotide chain. As will be described below, DNA usually contains two polynucleotide strands coiled around one another to form a double-stranded helix. The number of nucleotide units in a nucleic acid chain varies tremendously depending on the nucleic acid type. For example, each chromosome from a higher organism is thought to contain a single, very long DNA molecule. A DNA molecule from the largest human chromosome is composed of approximately 5.4 x 10⁸ nucleotides, which corresponds to a molecular weight of the order of 10 11 and a length of about 4cm. On the other hand, transfer RNA molecules generally contain only 70-80 nucleotides.
Figure 2. Structure of the Polynucleotide Chain

4 STANDARD STUDENT PROGRAM 3MODERNBIO.COM
DNA StructureIn early physical studies of DNA, a variety of experiments indicated that DNA molecules occur in long helixes with each helix being formed from two or more polynucleotide chains bound side by side. Chemical analyses also demonstrated that the phosphate groups were on the outside of the helix and that the number of A and T residues in DNA were always equal, as were those of G and C. With these facts in mind, Watson and Crick in 1953 proposed that the DNA molecule actually consists of two polynucleotide chains coiled around the same axis to form a double helix (Figure 3). In this model, the hydrophilic sugar-phosphate groups follow the outer edges of the molecule where they can interact with water. The hydrophobic bases face inward toward each other in the molecule’s center and thus avoid contact with water. The two polynucleotide strands run in opposite directions (they are anti- parallel) and are held together primarily by hydrogen and hydrophobic bonding between the bases, where A is always paired with T, and G with C. These complementary bases have an affinity for each other such that, when they are paired, they contribute to the overall stability of the DNA helix. Because of this complementary base-pairing, the sequence of bases in one polynucleotide chain determines the sequence in the other. For example, if the bases along one strand are arranged in the order T-G-C-T-A-G, the opposite bases on the complementary strand will be A C-G-A-T-C. This fact is of extreme biological significance because it explains how a DNA helix in the chromosome directs the formation of copies of itself and directs the formation of RNA molecules with its specific informational content. The B-form DNA shown in Figure 3 is the most common of the DNA types. It is a right-handed double helix and contains about 10.5 nucleotide pairs per helical turn.
Figure 3. Double-Helical Structure of Common B-DNA

5 STANDARD STUDENT PROGRAM 3MODERNBIO.COM
Biological Role of DNA and RNADNA is an information molecule with two general functions (Figure 4). First, DNA plays a central role in the propagation of the species and the determination of the heritable characteristics of the cell and its descendants. Prior to the time of each cell division, the two strands of the DNA helix separate from one another and each serves as a pattern or template for the synthesis of a new, complementary chain. This process of DNA biosynthesis is known as replication. One of the double helices formed is then transmitted to one daughter cell, and one to the other. Although the principle underlying DNA replication is straightforward, the actual mechanism responsible for the replication process in the cell involves an array of enzymes and regulatory proteins.
The informational content of DNA also determines the types of proteins that are produced by a cell. In this manner, the DNA molecule functions as a blueprint for all cellular processes that go on during the lifetime of an organism. In the first step along the information pathway from DNA to protein, a segment of DNA is copied into a complementary strand of messenger RNA (mRNA) by a process known as transcription. Transcription begins when an enzyme called RNA polymerase binds to a specific sequence on the DNA known as the promoter. At this site, the enzyme unwinds a small segment of double helix, exposing the bases of the two single strands of the DNA molecule. One of these strands is then transcribed. As the polymerase travels along the DNA, ribonucleotides with bases complementary to the DNA are added to the growing chain. For example, the DNA segment C-G-T-A-T G is transcribed into G-C-A-U-A-C in the mRNA. Each sequence of three nucleotides in the mRNA is called a “codon,” and codes for one amino acid. Since most polypeptide chains contain between 100 to 1,000 amino acids, an mRNA must be at least 300 to 3000 nucleotides long. Therefore, a gene that codes for a polypeptide chain must contain at least 300 to 3,000 base pairs.
The translation of mRNA into protein is a complex process that occurs on particles called ribosomes. This process requires ribosomal RNAs (rRNAs) and transfer RNAs (tRNAs). These RNA species do not specify proteins themselves but rather take part in decoding the information carried by the mRNAs. At one end of each tRNA molecule is a nucleotide triplet called the “anticodon,” which is complementary to an mRNA codon. A specific amino acid is bound to the opposite end of each tRNA molecule. On the ribosome, tRNAs carrying amino acids associate with the mRNA by way of complementary base-pairing at the anticodon-codon sequences. As the ribosome moves along the mRNA, the amino acids carried by the tRNAs are linked to the growing polypeptide chain. In this manner, the order of codons along the mRNA directs the amino acid sequence of a polypeptide chain. The translation process occurs on the surface of the ribosomes. These particles, which are composed of rRNA and ribosomal proteins, serve to bring together the mRNAs, the tRNA and other factors that are required for protein production.

6 STANDARD STUDENT PROGRAM 3MODERNBIO.COM
ReplicationThe two DNA strands separate and each serves as a template for the synthesis of a new, complementary polynucleotide.
TranscriptionOne strand of the DNA serves as a template for the synthesis of complementary RNA.
TranslationThe mRNA associates with ribosomes and its nucleotides are matched three at a time to a complementary set of three nucleotides in a specific tRNA molecule. The tRNA molecule carries an amino acid and when it associates with the mRNA, the amino acid is added to the growing polypeptide chain.
Figure 4. Molecular Information Transfer: Complimentary Base Pairing
7 STANDARD STUDENT PROGRAM 3MODERNBIO.COM
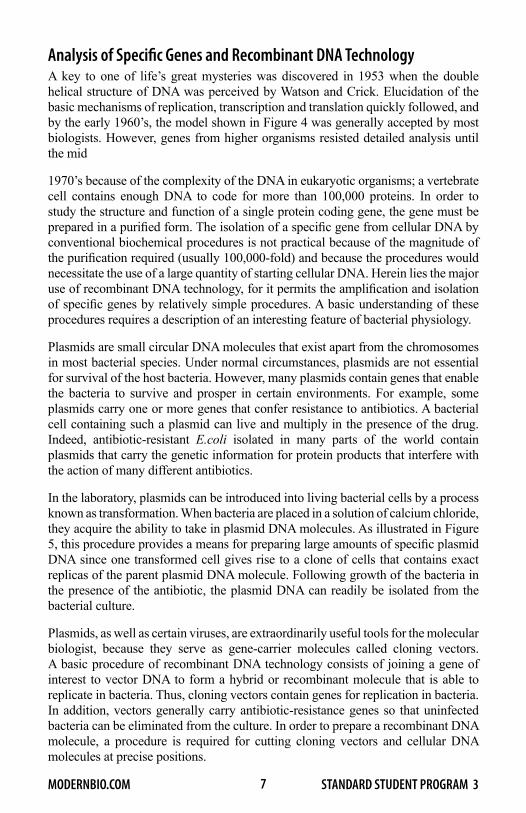
Analysis of Specific Genes and Recombinant DNA TechnologyA key to one of life’s great mysteries was discovered in 1953 when the double helical structure of DNA was perceived by Watson and Crick. Elucidation of the basic mechanisms of replication, transcription and translation quickly followed, and by the early 1960’s, the model shown in Figure 4 was generally accepted by most biologists. However, genes from higher organisms resisted detailed analysis until the mid
1970’s because of the complexity of the DNA in eukaryotic organisms; a vertebrate cell contains enough DNA to code for more than 100,000 proteins. In order to study the structure and function of a single protein coding gene, the gene must be prepared in a purified form. The isolation of a specific gene from cellular DNA by conventional biochemical procedures is not practical because of the magnitude of the purification required (usually 100,000-fold) and because the procedures would necessitate the use of a large quantity of starting cellular DNA. Herein lies the major use of recombinant DNA technology, for it permits the amplification and isolation of specific genes by relatively simple procedures. A basic understanding of these procedures requires a description of an interesting feature of bacterial physiology.
Plasmids are small circular DNA molecules that exist apart from the chromosomes in most bacterial species. Under normal circumstances, plasmids are not essential for survival of the host bacteria. However, many plasmids contain genes that enable the bacteria to survive and prosper in certain environments. For example, some plasmids carry one or more genes that confer resistance to antibiotics. A bacterial cell containing such a plasmid can live and multiply in the presence of the drug. Indeed, antibiotic-resistant E.coli isolated in many parts of the world contain plasmids that carry the genetic information for protein products that interfere with the action of many different antibiotics.
In the laboratory, plasmids can be introduced into living bacterial cells by a process known as transformation. When bacteria are placed in a solution of calcium chloride, they acquire the ability to take in plasmid DNA molecules. As illustrated in Figure 5, this procedure provides a means for preparing large amounts of specific plasmid DNA since one transformed cell gives rise to a clone of cells that contains exact replicas of the parent plasmid DNA molecule. Following growth of the bacteria in the presence of the antibiotic, the plasmid DNA can readily be isolated from the bacterial culture.
Plasmids, as well as certain viruses, are extraordinarily useful tools for the molecular biologist, because they serve as gene-carrier molecules called cloning vectors. A basic procedure of recombinant DNA technology consists of joining a gene of interest to vector DNA to form a hybrid or recombinant molecule that is able to replicate in bacteria. Thus, cloning vectors contain genes for replication in bacteria. In addition, vectors generally carry antibiotic-resistance genes so that uninfected bacteria can be eliminated from the culture. In order to prepare a recombinant DNA molecule, a procedure is required for cutting cloning vectors and cellular DNA molecules at precise positions.

8 STANDARD STUDENT PROGRAM 3MODERNBIO.COM
Figure 5. Introduction of a Plasmid Into Bacteria by Transformation

9 STANDARD STUDENT PROGRAM 3MODERNBIO.COM
A nuclease is an enzyme that breaks the phosphodiester bonds that connect the nucleotide units in DNA or RNA. Restriction nucleases are powerful tools used in recombinant DNA technology because they cut DNA at specific sites. These enzymes are produced chiefly by bacterial species in which they serve to degrade invading foreign DNA within the bacterial cell. Most restriction enzymes recognize a specific sequence of four to six nucleotides in DNA and each will cut a long DNA double helix into a series of discrete pieces known as restriction fragments.
Table 1. Properties of Three Restriction Enzymes

10 STANDARD STUDENT PROGRAM 3MODERNBIO.COM
Typically, the restriction sites for a given enzyme are hundreds to thousands of base-pairs apart so that the fragments generated are hundreds to thousands of base-pairs long. More than 300 different restriction nucleases are now commercially available. General properties of three of these enzymes are given in Table 1. It should be noted that some restriction nucleases (e.g., EcoR1 and Bam H1) produce a staggered cleavage that creates sticky, or cohesive, single-stranded ends on the cut molecules. These cohesive ends are very important in recombinant DNA procedures because they enable any two DNA fragments to be linked together by complementary base pairing at their ends, provided that they were generated with the same restriction enzyme.
Figure 6 illustrates one basic procedure by which cellular DNA from essentially any source can be amplified by recombinant DNA techniques. First, a plasmid is cleaved at a single site by a restriction nuclease, such as EcoR1, that produces cohesive ends on the plasmid DNA. The cellular DNA to be cloned is cleaved with the same enzyme, and fragments of the cellular DNA are annealed to the plasmid DNA by complementary base-pairing at the cohesive ends of the DNA molecules. The newly formed joints are sealed with an enzyme called DNA ligase, which forms covalent bonds between the ends of each DNA molecule. The recombinant DNA molecules are introduced into E.coli by transformation, and the bacteria are grown in the presence of an antibiotic. The hybrid plasmid can replicate in the dividing bacterial cells to produce an enormous number of copies of the original DNA fragment. At the end of the proliferation period, the hybrid plasmid molecules are purified from the bacteria. Copies of the original DNA fragments can then be recovered by cleavage of the recombinant plasmid with EcoR1.
Digestion of DNA from a vertebrate cell with EcoR1 generates about 106 different DNA fragments. Thus, the DNA cloning procedure described above and outlined in Figure 6 gives rise to a large number of plasmids, each descended from a single hybrid DNA molecule. The most difficult step in the procedure is to identify the hybrid plasmid in this “library” that contains the inserted cellular DNA of interest. When a particular mRNA can be purified from a tissue, such as the mRNAs for the polypeptide chains of hemoglobin, the mRNA or a DNA copy of it can be used to identify its corresponding gene sequence in a recombinant library. In this procedure, the mRNA, or its DNA copy, is first labeled with a radioactive isotope. Under the appropriate conditions, the radioactive probe will preferentially stick or hybridize to the DNA clone of interest because of complementary base-pairing. By this procedure, the genes for many different proteins in DNA libraries have been identified.

11 STANDARD STUDENT PROGRAM 3MODERNBIO.COM
Figure 6. Production of a Recombinant DNA Molecule

12 STANDARD STUDENT PROGRAM 3MODERNBIO.COM
II. General Description of Agarose Gel Electrophoresis
Electrophoresis is the movement of charged particles in solution under the influence of an electric field. In the most common form of electrophoresis, the sample is applied to a stabilizing medium which serves as a matrix for the buffer in which the sample molecules travel. The agarose gel is a common type of stabilizing medium used for the electrophoretic separation of nucleic acids. A diagram of the essential components of an agarose electrophoretic system is shown in Figure 7. The agarose gel, containing preformed sample wells, is submerged in buffer within the electro phoretic gel cell. Samples to be separated are then loaded into the sample wells. Current from the power supply travels to the negative electrode (cathode),supplying electrons to the conductive buffer solution, gel and positive electrode (anode), thus completing the circuit.
At neutral pH, a molecule of DNA or RNA is negatively charged because of the negative charges on the phosphate backbone. Under these conditions, nucleic acids applied to sample wells at the negative electrode end of the gel migrate within pores of the gel matrix towards the positive electrode. The agarose gel serves as a molecular sieve in that its structure is similar to that of a sponge. The size of the pores in the gel are generally on the same order as the size of the DNA molecules that are being separated. As a result, large molecules move more slowly through the gel than smaller molecules. Thus, the method sorts the molecules according to size, since it relies on the ability of uniformly charged nucleic acids to fit through the pores of the agarose gel matrix.
Ill. Practical Aspects of ElectrophoresisElectrophoresis EquipmentThe PROCELL Horizontal Electrophoresis unit is composed of an acrylic cell with central platform, platinum electrodes, four removable gel-casting trays, four sample well-forming combs and a safety lid with power cords. The four gels are made in the casting trays and then placed on the central platform of the electrophoresis cell. Each gel contains 8 separate sample wells. The experiments described below were designed such that each student uses four sample wells per experiment. Therefore, the experiments of 8 students can be analyzed in one electrophoretic run. If the students work in pairs, the system can be used by 16 students.
The Model MB-170 power supply is a general purpose electrophoresis power source. The unit produces a constant voltage output of 85 or 170 volts. Voltage selection is controlled by the switch located in the center of the front panel. The ammeter, also located on the front panel, permits the current to be monitored during an electrophoretic run. The unit can reach a maximum of 500 mAmp.

13 STANDARD STUDENT PROGRAM 3MODERNBIO.COM
Figure 7. Components of a Horizontal Electrophoresis System
Electrophoresis Chemicals
The Agarose GelBecause the agarose gel is an ideal solid support for the separation of nucleic acids on the basis of size, it is used extensively for this purpose in the molecular biology laboratory. Agarose is a natural polysaccharide of galactose and 3,6-

14 STANDARD STUDENT PROGRAM 3MODERNBIO.COM
anhydrogalactose derived from agar, which, in turn, is obtained from certain marine red algae. Agarose gels are made by dissolving the dry polymer in boiling buffer, pouring the gels into casting trays and allowing them to set by cooling at room temperature. The resolving power of an agarose gel depends on the pore size, which is dictated by the concentration of dissolved agarose. High percentage agarose gels (e.g., 3%) are used for the separation of small DNA molecules (102-1()3 base-pairs in length), while low percentage gels (e.g., 0.6%) are used for large molecules (104 -105 base-pairs). The 1.2% and 1.5% agarose gels used in the experiments described in this manual are suitable for separating DNA molecules that range in length from about 200 to 10,000 base-pairs.
Electrophoresis BufferThe buffer (0.04M Tris-Acetate-EDTA, pH 8.0) used in the experiments described below is a common buffer employed in the research laboratory for separating double stranded DNA molecules by agarose gel electrophoresis. The buffer is provided as a 100-fold stock solution and should be diluted with distilled or deionized water prior to use.
StainingNucleic acids are not colored, and therefore it is necessary to make them visible in some way in order to determine their position in the agarose gel after electrophoresis. The most common method involves staining the nucleic acids with ethidium bromide, and then detecting the DNA or RNA-bound dye with ultraviolet lamps. However, ethidium bromide is a powerful mutagen (and probably a carcinogen) and UV light can cause serious eye and skin burns. Therefore, in the studies described below, the agarose gels are stained with the harmless dye, methylene blue.
The Sample BufferThe DNA samples in the exercises described below are loaded into the wells of the agarose gel as 10-20% glycerol solutions. The viscous glycerol ensures that the samples will layer smoothly at the bottom of the sample wells. The sample buffer also contains the tracking dye bromophenol blue. As will be described below, this dye enables the investigator to follow the progress of an electrophoretic run.
AccessoriesThe accessories listed below are required to perform the experiments described in this manual. They are used for sample handling, and for the preparation and analysis of the agarose gels.
*Glass test tubes (25ml) *Gloves*Micro tubes (0.5ml) *Gel staining trays with lids*Tube holders for the 0.5ml tubes *Macropipets (pipet-syringe)*Tape *Micropipetors and micropipets

15 STANDARD STUDENT PROGRAM 3MODERNBIO.COM
The micropipetors are an important accessory used for electrophoresis procedures. The micropipetor consists of a stainless steel plunger and 50 micropipets with calibration lines of 5µ1*, 10µ1, l5µ1, 20µ1, and 25µ1 as shown below.
A Diagram of the Micropipet Apparatus
*One milliliter (ml) = 1,000 microliters (µ1)
To Operate the Micropipetor:
1. Insert the metal plunger into the end of the glass pipet that is opposite the calibration lines. The glass pipet can be held between your thumb and middle finger and the plunger operated with your index finger on the same hand.
2. Gently push down on the plunger until the plunger handle comes to rest on the pipet.
3. Hold the micropipet in a vertical position and place the filling end into the sample solution.
4. Draw the sample into the pipet to the appropriate calibration line by lifting up on the handle of the plunger assembly.
5. Carefully wipe excess liquid from the outer pipet surface with an absorbent tissue.
6. Direct the filling end of the micropipet into a tube and slowly eject the sample.
7. Rinse the pipet between samples by drawing up and expelling water three times from the pipetor.
Students should practice using these pipets prior to beginning the experiments.

16 STANDARD STUDENT PROGRAM 3MODERNBIO.COM
IV. Procedures for the Preparation, Electrophoresis and Staining of Agarose Gels
The exercises described in this manual were designed such that he samples of two students are analyzed on one agarose gel. If students work in pairs, four students will share one gel. Four agarose gels are electrophoresed simultaneously using the Procell and MB-170 power supply.
Pouring the Agarose Gels1. Place the casting tray on a level work surface and place a precleaned
glass slide into the gel support deck.
2. Seal both ends of the gel support deck with tape. The tape must be firmly pressed against the edges of the deck to ensure a tight seal.
Casting Tray Assembly
3. * With the macropipetor (pipet-syringe), dispense 15ml of electrophoresis buffer into a 25ml glass test tube and add 0.18 grams of agarose. The agarose can be weighed out directly on an appropriate balance. If a balance is not available, 0.18 grams of agarose can be estimated by filling a 0.5ml micro tube with agarose until two-thirds full. Gently swirl the glass tube until the agarose forms a suspension.
4. Place the test tube into a boiling water bath and allow the agarose suspension to come to a vigorous boil. After boiling for about two minutes, remove the test tube from the bath, stir gently with a glass rod, and cool at room temperature for about 2-3 minutes. At this time, the agarose solution should be absolutely clear.
*The melted agarose for the four gels (15ml per gel) can also be prepared in one operation by boiling 0.9g of agarose in 75ml of buffer in a 250-500ml flask over a Bunsen burner or in a microwave oven. The flask should be rotated periodically during the heating process in order to prevent damage to the agarose.

17 STANDARD STUDENT PROGRAM 3MODERNBIO.COM
5. Pour the melted agarose directly from the test tube onto the casting deck and return the test tube to the hot (but not boiling) water bath. The small amount of melted agarose left in the test tube will be used for sample application (see below). Insert the comb into the casting tray slots and push down gently on the top of the comb until resistance is encountered. The teeth of the comb will come to rest in the melted agarose about 0.2mm above the surface of the glass plate.
6. After the gel has cooled for at least 15 minutes, remove the tape strips and carefully lift the comb straight up and away from the casting tray. The gel is now ready for sample application. Gels can also be stored for up to one week before use. For gel storage, the comb is left in place and the tray containing the gel and comb is wrapped in plastic wrap and placed in the refrigerator.
Sample ApplicationPrior to sample application, place the following items on the laboratory bench in front of you.
*Agarose gel*Sample for electrophoresis*Micropipetor and micropipets*Absorbent tissue (e.g. Kleenex or Kim wipes)*Small beaker of distilled or deionized water*Melted agarose - Transfer the melted agarose from the large test tube in the
hot water bath to a small tube. The small tube should then be placed in a beaker of hot water to ensure that the agarose remains in a liquid state.
1. Hold the micropipetor in a vertical position and place the filling end of the micropipet into the sample solution.
2. Draw the sample into the pipet to the l5µ1 calibration line by lifting up on the handle of the plunger assembly.
3. Wipe excess liquid from the outer pipet surface with an absorbent tissue.
4. Carefully direct the filling end of the micropipet into the top of the sample well and slowly eject the 15µ1 of the sample well.
5. Draw melted agarose into the micropipet to the 20µ1 calibration line, direct the filling end into the sample well, and slowly eject the agarose onto the sample until the well is full. Between 10-20µ1 of agarose are required to fill the well. The agarose will seal the sample in the sample well.
6. Rinse the pipet by drawing up and expelling water three times from the pipetor.
7. Wipe excess liquid from the outer pipet surface with an absorbent tissue.
8. Repeat steps 1-7 to load each additional sample.

18 STANDARD STUDENT PROGRAM 3MODERNBIO.COM
Electrophoresis1. Transfer the four casting trays with gels to the central platform of the
electrophoresis cell and position them such that the sample wells are closest to the black (negative) electrode. Upon electrophoresis, DNA will then migrate from the negative (black) towards the positive (red) electrode.
2. Place the gel tray stabilizing bar parallel to the long axis of the electrophoresis cell between the gel trays.
3. Slowly fill the electrophoresis chamber with electrophoresis buffer until the four gels are covered with a 1/4cm layer of buffer. Approximately 2.5 liters of buffer are required.
4. Place the electrophoresis cell lid in position.
5. With the power supply off, connect the cables from the cell to the power supply, red to red (positive) and black to black (negative).
6. Push the rocker switches on the power supply to “on” and”170V”. The voltage will now remain constant at 170 volts during the run.
7. Unless otherwise indicated, electrophorese until the bromophenol blue in the sample solution has migrated to within 1/4cm of the positive electrode end of the gel. At 170V, this takes approximately 50 minutes.
8. At the termination of the electrophoretic separation, shut off the power supply, disconnect the cables and remove the gel casting trays containing the gels.
9. The buffer should be emptied from the electrophoresis cell and stored under refrigeration in a separate container until the next electrophoretic run. The same buffer should be used for at least 3 electrophoretic separations. However, fresh buffer should be employed for the preparation of all agarose gels. The electrophoresis cell should be rinsed with deionized or distilled water and stored in an upright position.
Staining
Normal Procedure (Overnight Staining)1 Carefully slide the agarose gel out of the casting tray and off of the slide
and place the gel in a staining dish. (Note: The glass slide should not be placed in the staining dish.)
2. Dilute the gel stain concentrate 1000-fold with distilled water.

19 STANDARD STUDENT PROGRAM 3MODERNBIO.COM
3. Cover the gel with about 100ml of staining solution, making certain that the agarose does not stick to the dish and all gel surfaces are exposed to the stain.
4. Place the staining tray in the refrigerator and allow 3-18 hours for staining.
5. Decant and discard the stain, rinse the gel and dish with distilled water and add about 100ml of distilled water.
6. Change the water after about 10-20 minutes and hold the staining dish over a light source such as a desk lamp or light box. Note the position of the dark blue DNA bands against the light blue gel background. The gel can be stored in water in the refrigerator for a few days. After about a week or two in the refrigerator, the dye will diffuse out of the gel and the DNA bands will no longer be visible.
Rapid Procedure1. Dilute the gel stain concentrate 1000-fold and stain the gels for 30-60
minutes in 100mls at 37°C.
2. Decant and discard the stain, rinse the gel and dish with water and add about 100ml of distilled water.
3. Change the water after about 20 minutes and again after an additional 20 minutes. DNA bands can been seen during these destaining steps.
4. When the background stain has been reduced sufficiently, hold the staining dish over a light source and carefully observe the stained DNA bands in the gel.
Gel Storage1. The gel can be stored in a sealed plastic bag (3x3”) with a few mls of
distilled water for up to one month in the refrigerator.
2. For long term storage, place the gel on a glass slide and smooth with a gloved index finger to eliminate air bubbles between the gel and the slide. Allow the gel to dry onto the slide at room temperature for 3-4 days. Cover the dry gel film and glass slide with saran wrap.
V. Suggested Reading and Reference for Part ALewin, B. Genes V. Oxford University Press, Oxford NewYork Tokyo, 1994.
Jones, P. Gel Electrophoresis: Nucleic Acids. Chichester, West Sussex, UK, New York: Wiley 1995.

20 STANDARD STUDENT PROGRAM 3MODERNBIO.COM
exPerImenT 302Determination of the Length of DNA Molecules
Determining the Size of DNA by ElectrophoresisA first step in the analysis of a DNA molecule in the molecular biology laboratory frequently involves determining its length in nucleotide pairs. Electro phoresis in agarose gels has proven to be an extremely useful tool for this purpose, as well as for separating DNA fragments of different sizes. The smaller a DNA fragment, the more rapidly it moves during electrophoresis. The length of a given DNA fragment can be determined by comparing its electrophoretic mobility on agarose gels with DNA markers of known lengths. As illustrated in Figure 8, DNA fragments of known lengths (DNA standards or markers) and a DNA fragment of unknown length, are electrophoresed on adjacent lanes of the same gel. After electrophoresis, the DNA in the gel is stained and the positions of the standard and unknown DNA bands are determined. A linear relationship is obtained if the logarithms of the sizes of the standard DNA fragments are plotted against their respective electrophoretic mobilities. The length of the unknown DNA fragment is then estimated from this calibration curve. The length of DNA is frequently given in base-pairs (bp) for small fragments and kilobase pairs (KB) for large ones. One kilobase-pair equals 1000 base-pairs.
Figure 8. Determining the Length of a DNA Molecule.
Left Six DNA standards and a DNA fragment of unknown length are electrophoresed on adjacent lanes of a gel and the distances (in em) that each has migrated during the run are determined.
Right: The distances migrated by the standards are plotted against the logarithms of their lengths. The length of the unknown is determined by extrapolation from the standard graph. In the example, the unknown is about 1.5 KB.

21 STANDARD STUDENT PROGRAM 3MODERNBIO.COM
Table 1-1. Length of Standard DNA Fragments fragment number fragment length (kb)
1 23.132 9.413 6.684 4.365 2.326 2.03
The standard DNAs were obtained by digestion of bacteriophage lambda DNA with the restriction nuclease Hind III. Fragments smaller than 2.0 kilobase pairs are not listed in the table above and will not be visible on your gels.
Certain dyes can be used as standards to calibrate an agarose gel. Dyes such as xylene cyanol, bromophenol blue and orange-G are fairly accurate size markers for small DNA fragments. Table 1-2 shows the approximate sizes of DNA (in base pairs) with which these dyes commigrate on a 1.2% gel. Calibration is performed by including a mixture of these dyes in one of the sample wells of the gel. These dyes permit the investigator to follow the progress of the separation during an electrophoretic run.
Table 1-2. Base-Pair Equivalents of Marker Dyes (1.2% Gel) dye color base-Pair equivalent
Xylene Cyanol Blue-Green 2800Bromophenol Blue Purple-Blue 250Orange-G Orange 70
ObjectiveTo determine the length of a DNA fragment.
MaterialsA. The solutions and materials required lor electrophoresis, sample handling
and gel staining (see Appendices 1 and 2).
B. The three samples provided in the container marked Experiment 301: Dye Mixture: A mixture of xylene cyanol, bromophenol blue and orange-G. DNA Standards: The sizes of these DNA molecules are given in Table 1-1, Unknown DNA: DNA fragment of unknown length.

22 STANDARD STUDENT PROGRAM 3MODERNBIO.COM
ProcedureThe procedures for the preparation, electrophoresis and staining of the agarose gels are described in detail in Section IV of this manual and are briefly outlined below. This experiments designed so that the samples of two students will be analyzed on one agarose gel. H the students work in pairs,four students will share one gel. The samples of each student (or student pair) will be electrophoresed on four gel lanes.
1. Prepare the agarose gel as described in Section IV. In this experiment, 1.2% gels will be used.
2. Load 15μl of each sample into the wells as indicated below.
sample Well number sample1 Dye Mixture2 Standard DNAs3 Unknown DNA4 Dye Mixture5 Dye Mixture6 Standard DNAs7 Unknown DNA8 Dye Mixture
3. Seal the wells with agarose and transfer your gel to the electrophoresis cell, making sure you note its position.
4. Electrophorese for 20 minutes and then turn off and disconnect the power supply.
5. Remove the lid of the electrophoresis cell and note the relative position of the three dyes as compared to their point of application at the sample wells.
6. Resume electrophoresis until the bromophenol blue (purple dye) in the dye mixture and DNA samples has migrated to within 1 mm of the positive electrode end of the gel. Remove the gels from the unit and measure the distance of the dyes from the sample origin.
7. Stain and destain the agarose gels as described in Section IV.
8. Measure the distance of the DNA bands (in em) from the sample origin.
23 STANDARD STUDENT PROGRAM 3MODERNBIO.COM
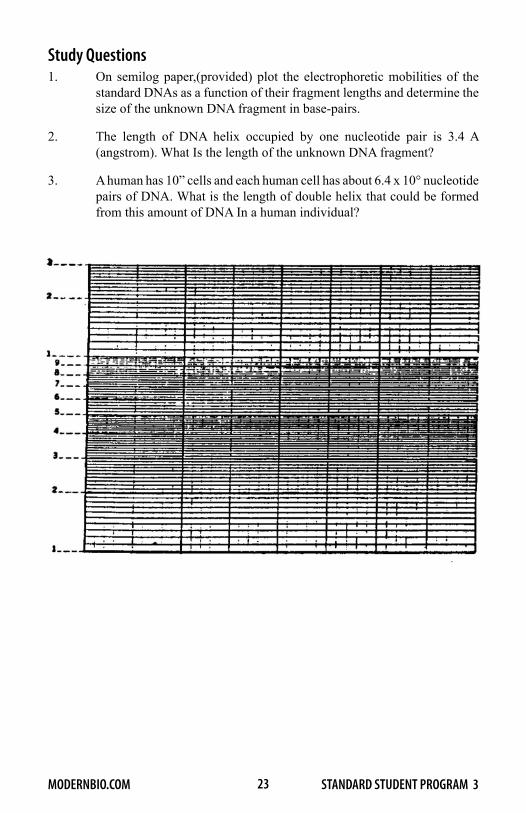
Study Questions1. On semilog paper,(provided) plot the electrophoretic mobilities of the
standard DNAs as a function of their fragment lengths and determine the size of the unknown DNA fragment in base-pairs.
2. The length of DNA helix occupied by one nucleotide pair is 3.4 A (angstrom). What Is the length of the unknown DNA fragment?
3. A human has 10” cells and each human cell has about 6.4 x 10° nucleotide pairs of DNA. What is the length of double helix that could be formed from this amount of DNA In a human individual?

24 STANDARD STUDENT PROGRAM 3MODERNBIO.COM
exPerImenT 302Restriction Nuclease Mapping of DNA
Viruses are a unique group of parasitic organisms that grow only In the cells of bacteria, plants and animals. A virus that Infects bacteria is called a bacteriophage, or simply, a phage. Viruses have proved to be Invaluable tools for the study of molecular biology because they possess the essential properties of life yet are simpler than bacteria or eukaryotic cells in their structures and life cycles.
Bacteriophage lambda, which infects E. coN, Is probably the best understood of the double•stranded DNA phages. The protein component of this phge consists of a protective coat that forms the tail assembly and the outer shell of the head. A single molecule of double•stranded DNA Is located In the core of the phage head. The DNA molecule contains 48,502 base-pairs (molecular weight ~ 3 x 10⁷) that code for approximately 50 different phage proteins. The sequence of nucleotides along the entire lambda genome is known and the nucleotide sequences that comprise the major control regions for transcription and replication have been identified. Because of the vast amount of Information about the biology of this phage, lambda has become a common cloning vector In genetic engineering.
Figure 2-1. A Diagram of a Lambda Phage DNA Molecule
The lambda DNA molecule has an unusual structure. Single-stranded segments of DNA containing 12 nucleotides are found at both ends of the phage DNA molecule (Figure 2-1). The base sequence of these terminal regions, which are

25 STANDARD STUDENT PROGRAM 3MODERNBIO.COM
known as cohesive or sticky ends, are complementary to each other. Thus, by forming base pairs between the cohesive ends, the linear DNA molecule will circularize,as shown In Figure 2-1. This circularization Is readily demonstrated in the laboratory. When lambda DNA is incubated at 37°C, the cohesive ends will anneal (bind) to each other by base-pairing and the circular DNA molecule wil form. When this circular lambda molecule Is heated to 75°C, the cohesive ends come apart and the DNA molecule is converted to a linear form. The disruption of base-pairing by heal treatment is known as denaturation.
The circularization of the lambda DNA molecule also occurs in an infected bacterial cell. When lambda infects an E.coli host, the phage DNA is injected Into the bacterium and the cohesive ends anneal or stick together to form a circular molecule. Transcription and replication of the phage DNA occurs and the newly formed DNA molecules are packaged into newly synthesized phage particles. About 100 lambda particles are then released into the medium when the bacterial cell is broken open (lysed). As a result of this lytic infection, the bacterium dies. less commonly, the circular DNA phage molecule attaches and Integrates Into the E.coli DNA. After integration, the bacterial cell behaves normally and the lambda DNA is replicated as part of the bacterial chromosome. However, when the bacterium is subjected to an environmental insult, such as exposure to ultraviolet light, the lambda DNA is excised from the host chromo some and begins a normal cycle of viral replication.
Figure 2-2 shows a map of phage lambda DNA. The DNA of phage lambda may be divided into three regions. The left-hand region includes all the genes (A through J) whose products are necessary to produce phage head and tail proteins and to package the DNA into the virus. The central region contains elements involved in integration of the DNA into the E. coN chromosome. The remaining portion of the genome Includes the major control region for transcription and replication and the genes necessary lor cell lysis.
Restriction nucleases are enzymes that cut DNA at specific sites (See Part A-1). In this exercise, you will study phage lambda DNA using the restriction enzymes EcoR1 and BamH1. The position of the restriction sites for these enzymes in lambda DNA Is shown In Figure 2-2. Cleavage of lambda DNA by either EcoR1 or BamH1 produces six DNA fragments, the sizes of which are Indicated in the figure. The fragments derived from the termini contain the cohesive ends and will anneal together under the appropriate conditions.

26 STANDARD STUDENT PROGRAM 3MODERNBIO.COM
Figure 2-2. Genetic and Restriction Map of Phage Lambda DNA

27 STANDARD STUDENT PROGRAM 3MODERNBIO.COM
ObjectiveTo study the effects of EcoR1 and BamH1 on phage lambda DNA and to Identify restriction fragments that contain the cohesive ends.
MaterialsA. The solutions and materials required lor electrophoresis, sample handling
and gel staining (see Appendices 1 and 2).B The samples below are provided In the container marked Experiment
302:1. Phage Lambda DNA.2. EcoR1: The restriction enzyme to be used In this laboratory should
be made up Immediately before the laboratory session as described In Appendix 2 of the Instructor Manual and stored in the refrigerator before use. The solution contains the enzyme suspended in a nuclease digestion buffer. The solution of enzyme and DNA must not be contaminated, so use a fresh micropipet whenever you remove the enzyme and DNA from the stocks.
3. EcoR1 +Bam H1: This mixture contains both restriction enzymes suspended in a nuclease digestion buffer and should be made up as described In Appendix 2 of the Instructor Manual.
4. Electrophoresis sample buffer.
Materials Not Provided1. Water baths lor tube incubation maintained at 37°C and 70”C: A beaker
containing water heated to 70”C with a Bunsen burner can serve as the latter bath.
2. Ice bath: Ice chips In a beaker can be used.
ProcedureThe experiment was designed lor B students working Individually or 16 students working in teams of two.
A. Preparing the DNA samples
1. Number lour small tubes 1 to 4 with a water-proof marking pen.
2. Place 10μl of distilled water into tube 1, 10μl of the EcoR1-buffer solution into tube 2 and 10μl of the EcoR1 + Bam H1 mixture Into tubes 3 and 4.
3. Add 5μl of lambda phage DNA to each tube. Gently tap the tubes with the tip of your index finger to mix the solutions. Incubate the tubes tor 50 minutes at 37°C. During this Incubation, the fragments containing the cohesive ends (the fragments derived from the termini) should anneal together.

28 STANDARD STUDENT PROGRAM 3MODERNBIO.COM
4. While the tubes are incubating, prepare 1.2% agarose gels as described in Section IV.
5. At the end of the 50 minute incubation period, add 5μl of electrophoresis sample buffer to each of the lour tubes.
6. Transfer tube #4 to the 70°C water bath and, after 5 minutes, place this tube in an ice bath. This heat treatment will separate the two fragments containing the cohesive ends. Thus, in tube #4, the cohesive end fragments should be separated while they should be together in tubes 1 to 3.
B. Electrophoresis 1. Load 15μl of the following samples from the above section into the
sample wells.
sample Well sample
1 Tube 12 Tube 23 Tube 34 Tube 45 Tube 16 Tube 27 Tube 38 Tube 4
2. Seal the wells with agarose and electrophorese until the bromophenol blue in the samples has migrated to within 2 mm of the positive electrode end of the gel.
3. Remove the gels from the unit and stain them as described in Section IV.
4. Measure the distance of the DNA bands (in cm) from the sample wells and draw a picture of the DNA bands in each gel lane. Note the relative intensity and positions of the DNA bands in lane 3 and lane 4. Note especially the intensity of the next to the largest DNA band.
Study Questions1. The sizes of the DNA bands in lanes 2 and 6 should be 21.2, 7.4, 5.8,
5.6, 4.8 and 3.5 kilobase pairs (see Figure 2-2). From the map of phage lambda given In Figure 2-2, identify the DNA bands that contain the genes lor the head proteins and the genes that control lysis of the host cell.

29 STANDARD STUDENT PROGRAM 3MODERNBIO.COM
2. Maps of the restriction sHes lor EcoR1 and BamH1 in lambda DNA are given in Figure 2-2. With this information:
A. Calculate the length of DNA fragments that should have been produced when lambda DNA was digested with both EcoR1 and BamH1. List these values below and indicate the two fragments that contain the cohesive ends.
dna fragment length (base-pairs)
1. ________________2. ________________3. ________________4. ________________ 5. ________________6. ________________7. ________________8. ________________9. ________________10. _______________11. _______________
B. Identify the above fragments on lanes 3 and 4 of your gels.
3. A comparison of the result of lanes 3 and 4 on your gels can be used to identify the DNA terminal fragments of phage lambda without a knowledge of the map shown in Figure 2-2. Explain.
4. In DNA of uniform composition, a specific hexanucleotide occurs by chance once in every 4096 base-pairs. The recognition sequence lor EcoR1 Is a hexanucleotide (sea Part A-1, Table 1). How many restriction sites lor EcoR1 would you expect to exist in lambda DNA H the phage DNA were of uniform composition? There are law restriction sites for a number of enzymes including EcoR1 and Hpal in the left 20 kilobase of lambda DNA. Explain. (Hint: The left region of lambda DNA Is rich In G+C base pairs.)

30 STANDARD STUDENT PROGRAM 3MODERNBIO.COM
exPerImenT 303Plasmid DNA Structure
Plasmids are circular extra chromosomal DNA molecules that replicate in bacteria (see Section 1-E). A plasmid DNA molecule can exist in three quite different structural states: linear, relaxed circular and supercoiled circular (see Figure 3-1).
LinearWhen a plasmid is treated whit a restriction nuclease that cleaves the DNA in only one site, the circular forms of the plasmid are converted lo a linear molecule.
Relaxed CircularThe two ends of a linear DNA helix can be brought together and joined lo form a circle. When this occurs, without rotating or twisting the DNA molecule, the circle is said to be relaxed because the DNA helix within exists in a nonstrained state similar to that found in the linear molecule.
Supercoiled CircularWhen one end of a double helix, which is itself a twisted structure, is rotated 360 degrees with respect to the other end, and then the two ends are joined, supercoils are introduced into the resulting circle. A common analogy is to consider the structures introduced into a rubber band when it is twisted. When a loosely twisted heavy rubber band (the double helix) is twisted far enough,as when a model airplane is being prepared for flight, the rubber band crosses over itself in space and supercoiling takes place. When the DNA is twisted clockwise in the same direction as the right-handed double helix, positive supercoiling occurs and the torsional pressure serves lo wind the double helix more lightly. This DNA is said lo be overwound. In contrast, negative supercoils twist the DNA in the opposite direction from the turns of the double helix. DNA with negative supercoils is said to be underwound. The degree of twisting is often referred to as the superhelix density.
A supercoiled DNA molecule Is under strain because it has acquired excess energy as a result of the supercoiling. In a negatively supercoiled molecule, the strain can be partially relieved by limited disruption of the DNA double helix to form single-stranded sites at specific locations along the molecule. Thus,in a supercoiled plasmid, the fraction of the molecule that Is single-stranded at any given moment is greater than in a relaxed circular or linear molecule. S1 nuclease is an enzyme that is isolated from the mold Aspergillus oryzae. This enzyme attacks single-stranded DNA and RNA but not double-stranded nucleic acid molecules. When a negatively supercoiled plasmid is treated with S1 nuclease, the enzyme will introduce breaks in the DNA at regions that have a single-stranded character. As a result of this nicking action, supercoiling is lost and the plasmid is converted to a relaxed circular form.

31 STANDARD STUDENT PROGRAM 3MODERNBIO.COM
Figure 3-1. States of a Plasmid DNA Molecule
It is likely that all DNA within a cell is under the influence of negative supercoiling at some time during the lifetime of the cell. In fact, the natural condition for plasmid DNA, most viral DNA and the DNA in bacterial and perhaps even eukaryotic chromosomes,is generally in an underwound state as a result of negative supercoiling. Although positive supercoiling can be induced in vitro by treatment with certain chemicals, it probably does not occur as a natural state. A number of enzymes that remove and introduce supercoils in DNA, called DNA topoisomerases, have been isolated from different organisms. The degree of negative supercoiling Is a key factor in determining the higher-order structure of DNA within a cell. Higher-order DNA structure, In turn, is thought to be important in the regulation of chromosome structure, gene activity, and DNA replication. For example, DNA supercoiling facilitates transcription of genes In bacteria and, perhaps,in eukaryotic organisms as well.
As was noted above, DNA molecules are thought to cycle through various structural states during the lifetime of many, and perhaps all, organisms. Several laboratory techniques have been used to distinguish these structural forms. Electron microscopy is one method that can be used to distinguish between linear, circular and supercoiled DNA molecules. Another method is gel electrophoresis. As we have seen in Exercise t, linear double-stranded DNA molecules migrate through agarose gels at rates that are inversely proportional to the log10 of their molecular weights. However,supercoiled circular, relaxed circular and linear DNA fragments containing the same number of base-pairs migrate differently on agarose gels because of the differences in their shapes (see Figure 3- t ). The relative mobilities of the three forms are dependent on a number of factors, including agarose concentration and Ionic strength of the buffer.

32 STANDARD STUDENT PROGRAM 3MODERNBIO.COM
In today’s experiment, you will compare the electrophoretic migration of super coiled circular, relaxed circular and linear forms of the plasmid pUC18. Plasmid pUC18 is a small E.coli plasmid that contains 2686 base-pairs. This plasmid contains a single restriction se for EcoR1. Under the conditions that will be used in this experiment, the supercoiled form of pUC18 will migrate from slightly faster to slightly slower than the linear form, and it’s migration will vary somewhat in different preparations of plasmid DNA. The supercoiled and linear forms of pUC18 will migrate taster than the relaxed circular forms. When pUC18 is isolated from E.coli, most of the plasmid molecules are in the supercoiled and the relaxed circular forms. Nicking of the supercoiled plasmid with S1-nuclease will result in the formation of the relaxed circular forms, while treatment of the plasmid with EcoR1 will convert the supercoiled and relaxed circular forms to the linear form.
ObjectiveTo compare the electrophoretic mobility of supercoiled circular, relaxed circular and linear plasmid DNA.
MaterialsA. The solutions and materials required for electrophoresis, sample handling
and gel staining (see Appendices 1 and 2 of the Instructor Manual).B. The samples provided in the container marked Experiment 303: Plasmid DNA: Plasmid pUC18 is 2686 base-pairs in length and is
cleaved at one site by EcoR1 EcoR1:The enzyme should be made up immediately before the laboratory
session as described in Appendix 2 and stored in the refrigerator before use
Electrophoresis Sample Buffer, Dye Mixture: A mixture of xylene cyanol, bromophenol blue and
orange-G. S1-Nuclease: The enzyme should be made up immediately before
the laboratory session as described in Appendix 2 and stored in the refrigerator before use.
Materials Not Provided1. A water bath for tube incubation maintained at 37°C.
ProcedureThe experiment was designed tor 8 students working individually or 16 students working in teams of two.
33 STANDARD STUDENT PROGRAM 3MODERNBIO.COM
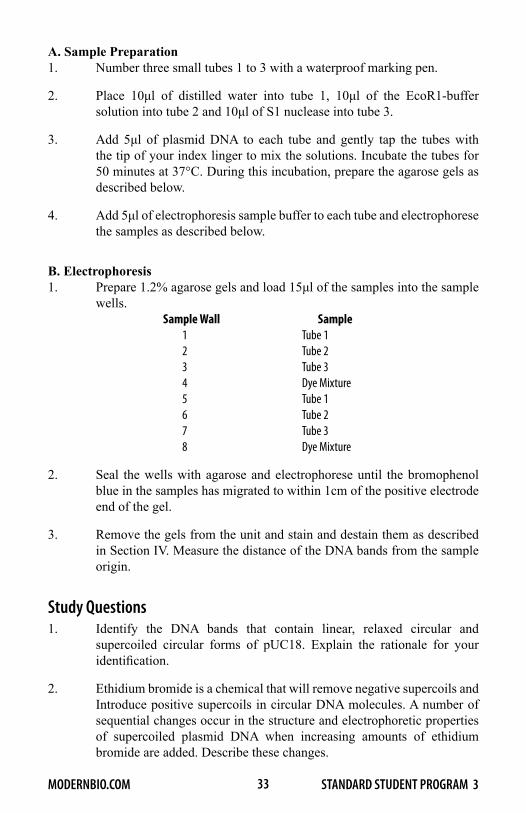
A. Sample Preparation1. Number three small tubes 1 to 3 with a waterproof marking pen.
2. Place 10μl of distilled water into tube 1, 10μl of the EcoR1-buffer solution into tube 2 and 10μl of S1 nuclease into tube 3.
3. Add 5μl of plasmid DNA to each tube and gently tap the tubes with the tip of your index linger to mix the solutions. Incubate the tubes for 50 minutes at 37°C. During this incubation, prepare the agarose gels as described below.
4. Add 5μl of electrophoresis sample buffer to each tube and electrophorese the samples as described below.
B. Electrophoresis1. Prepare 1.2% agarose gels and load 15μl of the samples into the sample
wells. sample Wall sample
1 Tube 12 Tube 23 Tube 34 Dye Mixture5 Tube 16 Tube 27 Tube 38 Dye Mixture
2. Seal the wells with agarose and electrophorese until the bromophenol blue in the samples has migrated to within 1cm of the positive electrode end of the gel.
3. Remove the gels from the unit and stain and destain them as described in Section IV. Measure the distance of the DNA bands from the sample origin.
Study Questions1. Identify the DNA bands that contain linear, relaxed circular and
supercoiled circular forms of pUC18. Explain the rationale for your identification.
2. Ethidium bromide is a chemical that will remove negative supercoils and Introduce positive supercoils in circular DNA molecules. A number of sequential changes occur in the structure and electrophoretic properties of supercoiled plasmid DNA when increasing amounts of ethidium bromide are added. Describe these changes.

34 STANDARD STUDENT PROGRAM 3MODERNBIO.COM
exPerImenT 304Molecular Cloning
A. Introducing Plasmid DNA Into E.coliPenicillin is one of the most Important anti-Infective agents used In clinical medicine because n Is Inexpensive, bactericidal and its toxicity lor human cells Is almost nonexistent. Penicillin Interferes with the synthesis of the bacterial call wall and will thus cause osmotic lysis of susceptible microbes. Penicillin Is not a single compound but a group of compounds with related structures and activities. Many of these compounds are semi-synthetic In that part of each molecule is made by a mold to which the chemist adds another chemical group. Over 500 semi-synthetic penicillins have been made during the past 30 years. Ampicillin is abroad-spectrum semi-synthetic penicillin that will kill a number of gram-positive and gram-negative bacteria, including Salmonella and Escherichia coli. Occasionally, E.coli cells are found in nature that are resistant to the toxic effects of ampicillin. In today’s laboratory, you will create such an ampicillin-resistant population of E.coli.
Plasmids are small circular DNA molecules that exist apart from the chromosomes In most bacterial species. Under normal circumstances, plasmids are not essential for survival of the host bacteria. However, many plasmids contain genes that enable bacteria to survive and to prosper In certain environments. For example, soma plasmids carry one or more genes that confer resistance to antibiotics. A bacterial cell containing such a plasmid can live and multiply In the presence of the drug. Indeed, antibiotic-resistant E.coli isolated In many parts of the world contain plasmids that carry the genetic information for protein products that interfere with the action of many different antibiotics. In this laboratory, you will introduce a plasmid that contains an ampicillin resistance gene Into E.coli.
Characteristics of pUC18The plasmid that you will use in today’s laboratory is called pUC18. A map of plasmid pUC18 is shown in Figure 4-1 and a discussion of some of the features of this plasmid is given below.
Antibiotic ResistancePlasmid pUC18 contains an ampicillin-resistance gene that enables E.coli containing this plasmid to grow In the presence of the antibiotic. Thus,bacteria lacking this plasmid,or bacteria that lose the plasmid,generally will not grow In the presence of this antibiotic. The ampicillin-resistance gene of pUC18 codes lor the enzyme beta-lactamase (penicillinase), which inactivates ampicillin and other penicillins.

35 STANDARD STUDENT PROGRAM 3MODERNBIO.COM
StructureLike all plasmids, pUC18 Is a supercoiled circular DNA molecule (Experiment 303).
SizeA small plasmid, pUC18 contains only 2686 base-pairs (molecular weight = 2 x 10⁶). The small size of this plasmid makes H less susceptible to physical damage during handling. In addition, smaller plasmids generally replicate more efficiently in bacteria and produce larger numbers of plasmids per cell.
Restriction SitesTo be useful as a cloning vector, a plasmid should possess a single recognition site for one or more restriction enzymes into which foreign DNA can be inserted. One way to Increase the number of such restriction sites Is to add a polylinker, a segment of synthetic DNA that contains closely spaced restriction sites. Plasmid pUC18 contains a polylinker and a site for EcoR1 is in this region.
ReplicationReplication of plasmid DNA requires a plasmid replication origin and a number of replication enzymes. The replication enzymes are usually provided by the host bacterial cell. The replication of some plasmids is coupled to that of the host cell. As a result of this so-called “stringent control,” only one or at most a few copies of the plasmid will be present In each bacterial cell. In plasmids under “relaxed control,” replication of plasmid DNA Is not coupled to replication of the host chromosome and more than 500 copies of the plasmid may be present In a single host cell. Plasmid pUC18, as well as other common plasmid-cloning vectors,are under relaxed control.
Lac Z geneThe lac Z gene, which codes for the enzyme beta-galactosidase, breaks down lactose and other beta-galactosides Into component sugars. Plasmid pUC18 contains a portion of the lac Z gene from E.coli.
Figure 4-1. Partial Genetic and Restriction Enzyme Map of Plasmid pUC18

36 STANDARD STUDENT PROGRAM 3MODERNBIO.COM
In this exercise, pUC18 will be Introduced Into E.coli by a process known as transformation. A common procedure for transformation entails:
1. The treatment of bacterial cells with calcium chloride in order to enhance the uptake of plasmid DNA. Such calcium chloride treated cells are said to be competent.
2. The incubation of the competent cells with plasmid DNA and the uptake of the DNA into a small fraction of the cells.
3. The selection of those cells that have taken up the plasmid DNA by growth on an antibiotic-containing medium.
ObjectiveTo introduce plasmid pUC18 into E.coli in order to create a population of bacterial cells resistant to the antibiotic ampicillin.
Materials°Plasmid pUC18 (180μl) - (300μg/rnl)*16 Ampicillin-Nutrient Agar platesNutrient Broth (10μl)25 Inoculating loops19 large sterile Transfer pipets•One pipet should be used for the bacteria, one
for the nutrient broth and 16 for step III.16 Sterile tubesCaCl2 solution (5ml) - 100mM CaCl2E.coli (0.3ml)* Prepared as described in Appendix 2 of the Instructor Manual - Note:
These plates must be made up at least one day before this lab session.
Materials Not ProvidedWater bath maintained at 37°C • If a temperature regulated water bath Is not
available, a beaker containing tap water at 37°C (98°F) will suffice.Ice bath • Ice chips in a large beaker are suitable.Air Incubator maintained at 37°C (OPTIONAL - see below)
ProcedureStep I should be performed by the Instructor before or during the laboratory session. Eight students or eight teams of students should then perform steps II and III.

37 STANDARD STUDENT PROGRAM 3MODERNBIO.COM
I. Preparation of Competent Celts (This step should be performed by the Instructor).
1. Place the vial of CaCl2, and the tube of E.coli in the ice bath.
2. Using a sterile pipet, transfer about 1/2ml of the CaCl2 containing the bacteria solution to the tube
3. Using the same pipet, transfer the contents of this tube back Into the larger vial that contains most of the CaCl2, solution.
4. Tap the vial with the tip of your Index finger to mix the solution.
5. Incubate the cells for about 20 minutes on ice. The cells are then called competent because they can take up DNA from the medium. If desired, the cells can be stored in the CaCl2 solution for up to 12 hours on ice before use.
II. Uptake of DNA by competent cells
1. One member from each of the eight groups should label one small tube “plus DNA” and one tube “minus DNA”.
2. Place the two tubes in an ice bath.
3. Use an inoculating loop to add the plasmid DNA to the tube labeled “plus” DNA. Immerse the loop into the plasmid DNA solution and transfer one loop full (about 10μl) of DNA to the “plus” DNA tube.
4. Gently tap the vial of competent cells with the tip of your Index finger to ensure that the cells are In suspension. Then, using a sterile transfer pipet, add 5 drops (5 drops ~ 100μl) of the competent cells to each of the two tubes. Tap each of these tubes with the tip of your Index finger to mix these solutions and store both tubes on ice lor 20 minutes. The competent cells, which are suspended In CaCl2, will now begin to take up the plasmid DNA.
5. Transfer the tubes to a water bath, preheated to 37°C, lor 5 minutes. This heat shock facilitates the uptake of plasmid DNA.
6. Add about 0.7ml of nutrient broth to each tube and incubate at 37°C lor 30 minutes. The nutrient broth should be dispensed with the sterile pipet provided with the Experiment package. This incubation period allows the bacteria time to recover from the CaCl2 treatment and to begin to express the ampicillin-resistance gene on the plasmid.

38 STANDARD STUDENT PROGRAM 3MODERNBIO.COM
III. Selection of cells that have taken up the plasmid by growth on an ampicillin-containing medium.
1. Obtain two ampicillin-nutrient agar plates from your Instructor and label one plate “plus DNA” and the other plate “minus DNA”.
2. Using a sterile pipet remove 0.25ml of the mixed bacterial suspension from the “minus DNA” tube. remove the lid from the “minus DNA” plate and dispense the bacteria onto the agar. Use an Inoculating loop to spread the bacteria evenly onto the agar surface.
3. Transfer 0.25ml of the bacterial suspension from the “plus DNA” tube to the “plus DNA” plate and spread these cells onto the agar surface as described above.
4. Replace the lids on the plates and leave the platesat room temperature until the liquid has been absorbed (about 10-15 minutes).
5. Invert the plates and incubate at 37°C or room temperature.
6. Colonies should appear in about 15 hours at 37°C or 48 hours at room temperature. Count the number of visible colonies on each plate and record these values below.
Number of colonies on “minus DNA” plate __________
Number of colonies on “plus DNA” plate __________
Study Questions1. Given that each colony is the progeny of a single bacterial cell, determine
the number of cells in the transformation mixture that express ampicillin resistance in the original “plus DNA” tube.
2. Why are these cells resistant to ampicillin?

39 STANDARD STUDENT PROGRAM 3MODERNBIO.COM
exPerImenT 304Molecular Cloning
B. Isolating and Analyses of a PlasmidA strain of E.coli containing the plasmid pUC18 is provided for this exercise where you will grow the bacterial cells, isolate tho plasmid from the bacterial culture, digest the plasmid with EcoR1 and analyze h by electrophoresis.
Bacterial GrowthGrowth of E.coli in a liquid medium can be divided into four stages (Figure 4-2). When nongrowing cells are introduced into a liquid growth medium, they require time to adapt before cell division occurs. This period,called the lag phase, usually lasts 10-90 minutes at 37°C. The cells in the culture will then enter tho exponential phase in which the cell concentration Increases as an exponential or logarithmic function of time. The length of time (generation time) necessary for the culture to double remains constant during this growth phase. In rich medium at 37°C, approximately 20 minutes is required for most E.coli strains to double in cell number. Exponential growth continues until a lack of oxygen becomes a limiting factor or until a change in the composition of the medium occurs. At this time,growth ceases and the culture enters the stationary phase. The growth rate of the cells and tho density of the population in the stationary phase are dependent on a number of factors, including the medium, temperature, degree of aeration and E.coli strain.
The three major techniques used to quantity the growth of a bacterial population in a liquid culture are total cell count, viable count and cell mass. A total cell count is determined from microscopic enumeration of bacteria in a set volume of the culture. This method does not distinguish between live (viable) and dead cells. The viable count is based on the premise that each bacterial colony that results when a given volume of the liquid culture Is placed on a solid culture media,is the progeny of a single bacterial cell. The cell mass of the culture can easily be calculated by measuring the optical density (OD) of tho culture at a wavelength of 600nm. This measurement provides an index of the turbidity (cloudiness) of the culture solution which is related to cell mass and, more indirectly,to cell number. As a general guide;
10D600 _ 8 x 10⁸ cells/ml
Plasmid IsolationBacterial cells that have been transformed by plasmid pUC18 can grow on an ampicillin-containing medium (Experiment 304 A). This observation provides evidence, at the phenotypic level, that tho cells contain plasmid pUC18 and express the ampicillin-resistance gene. In this exercise, you will verify plasmid uptake at the molecular level by isolating the plasmid from transformed bacterial cells.

40 STANDARD STUDENT PROGRAM 3MODERNBIO.COM
Figure 4-2. Growth of E.coli in a Liquid Culture
Although there are many different methods available for plasmid isolation, most have the following steps In common:
1. Growth and Harvesting of Plasmid-Containing Bacterial Cells - The cells from an antibiotic-resistant colony are usually grown overnight in a liquid culture to stationary phase and then harvested as a pellet by centrifugation.
2. Lysis of the Bacteria-Lysis (breaking open) of the bacteria is frequently brought about by agents that destroy the bacterial cell wall and plasma membrane.
3. Purification of the Plasmid DNA•Isolating the plasmid DNA from the lysate often involves differential precipitation, where tho bacterial components ( DNA, proteins, and membrane fragments) are removed by centrifugation,while the smaller plasmid DNA remains in solution.
4. Concentrating Plasmid DNA•Nucleic acids including plasmid DNA can be precipitated by alcohol (e.g. ethanol, isopropanol), and alcohol precipitation is fre quently used to concentrate plasmid DNA following purification.

41 STANDARD STUDENT PROGRAM 3MODERNBIO.COM
Materials ProvidedElectrophoresis Sample BufferDye Mixture: A mix of xylene cyanol, bromophenol blue and orange-G,*EcoR1: This restriction enzyme should be made up as described in the
Instructor Guide and stored in the refrigerator before use.Plasmid DNA: Plasmid pUC18 (from Experiment 304 A)Nutrient Broth Plus Ampicillin (100ml),Solution I - Tris Buffer and Ribonuclease ASolution II - Sodium Dodecyl Sulphate and Sodium Hydroxide Solution III - Guanidinium Chloride and Acetic Acid Equilibration Buffer - Sodium HydroxideBuffer HB - Guanidinium Chloride and Isopropanol*Wash Buffer - Tris Buffer, Sodium Chloride and Ethanol Note: The ethanol
must be added to this buffer prior to use.Elution Buffer - Tris BufferHiBind DNA ColumnsCollection Tubes**E.coli -pUC18 (1ml)Calibrated 1ml transfer pipets - The pipets used in Experiment 304 A should
be washed with soapy water and then with distilled or deionized water. Alternatively, 5ml glass pipets can be used.
* Made up as described in the Instructor Guide** This culture must be started about one day before the laboratory.
Materials Not Provided1. An incubator maintained at 37°C for bacterial growth. It is preferable
that the incubator be of the shaking type.2. A microcentrifuge and 1.5 ml centrifuge tubes.3. Spectrophotometer and accessories (optional).4. A 37°C water incubator
Procedure (Laboratory Session 1)A. Growing E.coli Containing the Plasmid pUC18
One bacterial culture will be used by the entire class and the instructor should start the culture one day prior to the class meeting.
1. Carefully pour the entire (1ml) E.coli -pUC18 starter culture into the flask containing the I 00 Nutrient Broth and replace the cap. Alternatively, E.coli containing pUC18 can be obtained from a plate containing transformed colonies (Exercise 304 A). If this option is chosen, touch an inoculating loop to a single, well-isolated bacterial colony and transfer the colony to the I 00 ml of liquid medium. Ampicillin has been added to the broth to ensure that the bacteria will not lose the plasmid during the growth phase.

42 STANDARD STUDENT PROGRAM 3MODERNBIO.COM
2. Pour a few mls of the inoculated culture into a test tube and measure the OD at 600nm. Omit this step if a spectrophotometer is not available.
3. Incubate the flask at 37°C for 14-24 hours. Samples may be removed at various times after inoculation to monitor cell growth. The flask should be shaken during the incubation, if possible, since aeration will increase the final cell density.
4. At the end of the incubation period, remove a few mls of the culture and read the OD at 600nm. It will probably be necessary to dilute this sample by about I 0 fold in order to obtain an accurate measurement.
5. Divide the culture into eight portions, each containing about 6-10 mls, and place each portion into tubes. The eight tubes will be processed by eight groups of students.
B. Harvesting the Bacteria
1. Transfer about 1.5 ml of the culture to a labeled 1.5 ml microcentrifuge tubes and centrifuge at maximal speed for 1-2 minutes to pellet the bacteria.
2. Discard the supernatant, fill the tube again with the culture and centrifuge for 1-2 minutes. Repeat this step one time.
3. Carefully remove and discard the supernatant fluid. Invert the tube and allow the cell pellet to dry for a minute.
C. Preparing the Plasmid DNA
1. Add 250μl of Solution I to the tube and suspend the pellet in the solution by vigorous shaking or by using a vortex mixer. This solution contains RNAse, which destroys RNA. Complete re-suspension (no visible clumps) is important in order to have high plasmid yield.
2. Incubate the tube at room temperature for 2 minutes.
3. Add 250μl of Solution II, cap the tube and mix by inversion several times until the contents are mixed thoroughly. The solution should become clear and viscous within 1-2 minutes. Solution II contains the detergent sodium dodecyl sulfate (SDS) and sodium hydroxide, which dissolve the bacterial membranes and causes cell lysis. The sodium hydroxide also denatures the DNA. Upon neutralization in the step below, the plasmid DNA strands renature because of their proximity while the bacterial DNA does not.

43 STANDARD STUDENT PROGRAM 3MODERNBIO.COM
4. Add 350μl of Solution III to the tube, cap the tube and shake until the contents are mixed thoroughly. A white flocculent precipitate should form. The acetic acid in Solution III will neutralize the solution. The Guanidinium Chloride in Solution III and the SDS from the previous step produce a tangled network of long strands of bacterial chromosomal DNA and cell debris, and this matrix can be separated from the smaller plasmid DNA by centrifugation.
5. Centrifuge the tube for 10 minutes at maximal speed. After centrifugation, plasmid DNA and small amounts of cellular proteins are in the supernatant, and bacterial chromosomal DNA and most of the proteins are in the pellet. This supernatant is known as a “cleared lysate”. A common procedure that is used to remove the proteins, SDS and salts that are present in the cleared lysate involves the use silica, which binds to the DNA but not to the contaminants. The silica is packed into the bottom of a column that you will use, and the lysate is added to the column over the silica. The column is then washed by centrifugation to remove the contaminants and the plasmid DNA is eluted by using a low salt buffer.
6. Obtain a blue column, and a collection tube, label each, and insert the column into the collection tube. Add 100μl of Equilibration Buffer to the column and centrifuge for 1 minute at maximal speed.
7. Carefully pour the cleared lysate from step 5 into the column making sure that the pellet is not dislodged. Centrifuge the column with collecting tube for 1 minute at maximal speed.
8. Discard the liquid in the collection tube, place the column back into the collection tube and add 500μl of HB Buffer to the columns. Centrifuge the column/collecting tube for I minute.
9. Discard the liquid in the collection tube, place the column back into the collection tube and add 700 ul of Wash Buffer to the column. Centrifuge the column/collecting tube for 1 minute.
10. Discard the liquid in the collection tube, place the column back into the collection tube and centrifuge for 2 minutes to dry the column.
11. Discard the collection tube and insert your column into a clean labeled 1.5-2 ml centrifuge tube. Place 25μl of Elution Buffer onto the center of the silica in the column and incubate for 2 minutes. Centrifuge for 2 minutes, discard the column and cap the tube that contains the eluted purified plasmid DNA. The plasmid DNA can be stored in the freezer until the next laboratory or processed as described below.

44 STANDARD STUDENT PROGRAM 3MODERNBIO.COM
D. Preparing DNA Samples (Laboratory Session 2)
The plasmid DNA that you have isolated should consist of circular molecules. In order to characterize the DNA by electrophoresis, the plasmid should be in a linear form. Therefore, you will digest some of the isolated pUC18 with EcoRI which will generate a linear DNA molecule containing 2686 base pairs.
1. Number two small tubes 1 and 2 with a waterproof marking pen.
2. Place 20μl of distilled water into tube #I and 20μl of the EcoR1 buffer solution into tube #2.
3. Add 10μl of your plasmid to each tube and tap the tubes with the tip of your index finger to mix the solutions. *
4. Incubate the tubes for 60 minutes at 37°C. During this incubation, prepare 1.2% agarose gels.
E. Electrophoresis
1. Add 70μl of sample buffer to the pUC18 DNA tube supplied with Experiment 304 A.
2. Load 15μl of the following samples into the sample wells of the agarose gels.
sample Well sample1. Dye Mixture2. DNA Sample from tube #13. DNA Sample from tube #24. pUC18 DNA5 Dye Mixture6. DNA Sample from tube #17. DNA Sample from tube #28. pUC18 DNA
3. Electrophoreses until the bromophenol blue in the samples has migrated to within 2 mm of the positive electrode end of the gel.
4. Remove the gels from the unit and measure the distance of the xylene cyanol (blue-green) dye from the sample origin. This marker dye should comigrate with DNA fragments that are about 2800 base-pairs in length which is the approximate size of the linear pUC18 molecule. Stain and destain the gels and measure the distance of the DNA bands from the sample origin.

45 STANDARD STUDENT PROGRAM 3MODERNBIO.COM
Study Questions1. Describe the stained nucleic acid pattern you observe in lanes 2 and 3
and 6 and 7. What do these patterns represent?
2. The SDS-Ammonium Acetate step and the RNAse in the sample buffer serve to remove bacterial nucleic acids. Why do you think these steps were necessary? Discuss your answer in terms of the electrophoretic patterns you might have observed had these steps been omitted.
3. Construct a plot of the log of the OD at 600nm vs. time on semi-log paper and compute the generation time. Calculate the number of cells in your culture at each time point. Assuming that each cell contains 100 pUC18 molecules, determine the number of plasmid DNA molecules present in the culture at the beginning and at the end of the culture period.

46 STANDARD STUDENT PROGRAM 3MODERNBIO.COM
exPerImenT 305Identifying Satellite Sequences
Genetic and biochemical studies suggest that there are only about 25,000-50,000 essential genes in the eukaryotic genome. However, there is enough DNA In the vertebrate genome to code for over one million different proteins. There are three major reasons for this apparent discrepancy. First, most eukaryotic genes contain introns which are Insertions of DNA that do not code for mRNA or protein. During transcription, these genes give rise to RNA species that are precursors to mRNAs. The intron sequences are then removed from the precursor and destroyed and the remaining segments of the precursor are spliced together to form mRNA which can then be translated Into protein. Second, many protein-coding genes are found in multiple copies within the genome. For example, there are approximately 10-20 genes that code for the protein,growth hormone, in humans. Third, a large fraction of the DNA in eukaryoties does not contain protein-coding information and these DNA stretches are often repeated thousands or more times in the genome. Satellite DNA is one class of these repeated DNA sequences. The two methods that are commonly used to detect satellite DNA are described below.
Equilibrium UltracentrifugationA common method used in the molecular biology laboratory is equilibrium centrifugation in a density gradient. In this procedure, macromolecules having different densities can be separated. The procedure Is the method of choice for separating DNA fragments that have different base compositions because such fragments also differ in their densities.
If E.coli DNA is fragmented into 500-1000 pieces and then centrifuged in a density gradient, the DNA forms a single, narrow zone (Figure 5-1). The reason is that the buoyant density of DNA is proportional to the (G+C) content, and the (G+C) content of most of the E.coli DNA fragments is similar. On the other hand, if DNA from the crab Cancer borealis is subjected to the procedure,two bands are observed (Figure 5-1). The major band contains the bull of the crab DNA and has a base composition of about 58% (A+T). The minor band, which is 97% (A+T), is the (A+T)-rich satellite DNA of the crab. This DNA is called satellite DNA because it can be separated from the bulk of the cellular DNA as a minor component (or “satellite”).

47 STANDARD STUDENT PROGRAM 3MODERNBIO.COM
Figure 5-1. Equilibrium Density Gradients of E.coli and Crab DNA
Separation of Restriction Fragments by ElectrophoresisThere are approximately 106 restriction sites lor the enzyme EcoR1, in the genome of a typical vertebrate. Therefore, about 106 DNA fragments,which usually differ In length, are generated following digestion of vertebrate DNA with this enzyme. When this DNA is separated by electrophoresis according to size, the large number of differently-sized fragments will appear as a background smear on the gel lane. However,fragments derived from highly repeated sequences such as satellite DNA will often form discrete bands. For example, the (G+C)-rich satellite DNA from cow, which comprises about 20% of the total cow genome, can be detected as discrete bands following the electrophoresis of EcoR1-digested cow DNA. This experiment will be performed in today’s laboratory.
Satellite DNA is not found in bacteria but is found In the genomes of most eukaryotic organisms. In soma vertebrates, (e.g., chickens and humans), satellite sequences occur in very low concentrations and are difficult to detect by the standard methods described above. In other species (e.g.,kangaroo rats), these sequences can make up as much as 50% of the genome.
The function of satellite DNA sequences is not known. However, n is known that most satellites,including those from cow, are not transcribed into RNA. In addition, most satellites are localized in discrete regions along the chromosomes. For example, many of them are found In the centromeres of each chromosome. Centromeres are the sites of attachment of the chromosomes to the mitotic spindle. However, not all satellite DNA sequences are found within the centromere regions and there is no universally accepted hypothesis available lor the function of these sequences.
ObjectiveTo identify the major satellite sequence in cow DNA and to characterize the effects of EcoR1 on DNA from cow and chicken.

48 STANDARD STUDENT PROGRAM 3MODERNBIO.COM
MaterialsA. The solutions and materials required lor electrophoresis, sample handling
and gel staining (see Appendices 1 and 2).B. The samples below are provided in the container marked Experiment 305:
Calf DNA: from calf thymus, Chicken DNA: from chicken erythrocytes, EcoR1: this restriction enzyme should be made up as described in Appendix 2 and stored in the refrigerator before use, Electrophoresis sample buffer, Dye mixture: A mixture of xylene cyanol, bromophenol blue, and orange-G.
Materials Not ProvidedWater bath for tube incubation maintained at 37°C.
ProcedureThe experiment was designed for 8 students working individually or 16 students working in teams of two.
A. Preparation of DNA samples
1. Number three small tubes 1-3 with a waterproof marking pen.
2. Place 10μl of distilled water into tube 1 and 10μl of the EcoR1-buffer solution into tubes 2 and 3.
3. Add 5μl of calf DNA to tubes 1 and 2 and 5μl of chicken DNA to tube 3. Tap the tubes with the tip of your index finger to mix the solution. Incubate the tubes for 50 minutes at 37°C. During this incubation, prepare the gels as described below.
4. Add 5μl of electrophoresis sample buffer to each tube and electrophorese the samples as described below.
B. Electrophoresis
1. Prepare 1.2% agarose gels as described in Section IV and load 15μl of the following samples from the above section into the sample wells.
sample Well number sample1 DNA Sample from Tube 12 DNA Sample from Tube 23 DNA Sample from Tube 34 Dye Mixture5 DNA Sample from Tube 16 DNA Sample from Tube 27 DNA Sample from Tube 38 Dye Mixture

49 STANDARD STUDENT PROGRAM 3MODERNBIO.COM
2. Seal the wells with agarose and electrophorese until the bromophenol blue in the sample has migrated to within 1 em of the positive electrode end of the gel.
3. Remove the gels from the unit and mark the position of the xylene cyanol(blue green dye) and bromophenol blue (purple-blue dye) in the dye mixture with a razor blade or similar sharp object. Stain and destain the gels as described in Section IV and measure the distance of the DNA bands (in em) from the sample origin.
Study Questions1. The major satellite band from cow is 1400 base-pairs In length. Identify
this band on your gel. Note that the band migrates between the xylene cyanol and bromophenol blue. Can you identify other discrete bands In cow or chicken DNA?
2. The 1400 base-pair satellite band can be recovered from the agarose gel after electrophoresis. Outline the steps that you would follow to amplify this satellite DNA in E.coli

50 STANDARD STUDENT PROGRAM 3MODERNBIO.COM
exPerImenT 306The Nucleosome Structure of Chromatin
A. General StudiesIn the nucleus of a typical eukaryotic cell, Individual chromosomes can be Identified during cell division. Each chromosome probably contains a single, very long molecule of DNA folded In a highly ordered fashion. The chromosome also contains chromosomal proteins that are Involved In this folding process.
A eukaryotic cell spends most of the life cycle in Interphase, which Is the stage between cell divisions. In Interphase, the chromosomes are highly diffuse and the chromosomal material Is called chromatin. Chromatin contains the general compo nents listed in Table 6-1.
Table 6-1. Chromatin Components components relative amount by Weight
DNA 1RNA 0.5-3Histone: Basic Proteins 1Nonhistone Proteins 0.5-2
In addition to DNA, the chromatin contains RNA as well as chromosomal proteins in two types. The histone chromosomal proteins are basic in nature and are associated with the acidic DNA backbone in the chromatin. There are 5 major histones in eukaryotes (histones H1, H2A, H2B, H3 and H4), four of which are the most highly conserved proteins known. With few exceptions, the same 5 histone proteins are found In all cell types in both plants and animals. The nonhistone chromosomal protein group contains at least 500 different proteins and is thought to play a variety of roles including the regulation of gene activity.
If the DNA double helix from a single chromosome were to be stretched out, l would be about 4cm long. The histone proteins are the major elements responsible for packing this long DNA molecule Into chromosomes and chromatin. There are several levels of DNA packaging, each of which serves to condense the DNA In an ordered manner. The primary, or lowest, level of compaction occurs when the DNA double helix is wrapped around histones into particles called nucleosomes (Figure 6-1). In the nucleosome, 145 base pairs of DNA are folded about 1.7 times around eight histone molecules (2 each of histone H2A, H2B, H3 and H4). The DNA between adjacent nucleosomes, called the nuclaosomal linker, is thought to be associated wh a single molecule of histone H1. Each linker segment usually contains between 25-60 base pairs of DNA. More than 95% of the DNA in all eukaryotic cells is packaged in this manner, and a single human cell contains
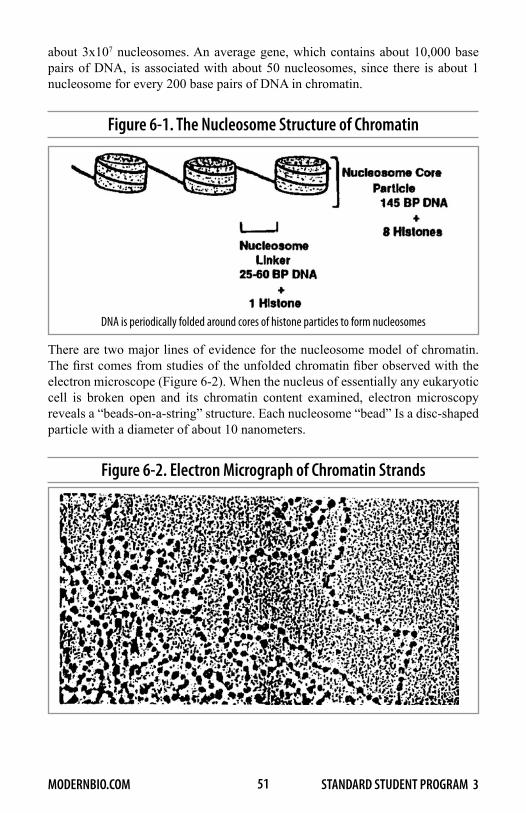
51 STANDARD STUDENT PROGRAM 3MODERNBIO.COM
about 3x10⁷ nucleo somes. An average gene, which contains about 10,000 base pairs of DNA, is associated with about 50 nucleosomes, since there is about 1 nucleosome for every 200 base pairs of DNA in chromatin.
Figure 6-1. The Nucleosome Structure of Chromatin
DNA is periodically folded around cores of histone particles to form nucleosomes
There are two major lines of evidence for the nucleosome model of chromatin. The first comes from studies of the unfolded chromatin fiber observed with the electron microscope (Figure 6-2). When the nucleus of essentially any eukaryotic cell is broken open and its chromatin content examined, electron microscopy reveals a “beads-on-a-string” structure. Each nucleosome “bead” Is a disc-shaped particle with a diameter of about 10 nanometers.
Figure 6-2. Electron Micrograph of Chromatin Strands

52 STANDARD STUDENT PROGRAM 3MODERNBIO.COM
Additional evidence for the nucleosome model of chromatin is derived from nuclease digestion studies. A nuclease is an enzyme that breaks down DNA or RNA. Micrococcal nuclease is a bacterial enzyme that is often used for chromatin studies. This enzyme, unlike restriction nucleases, does not recognize a specific DNA sequence, but cleaves DNA that is not protected from digestion by proteins such as nucleosomal core histones. When nuclei are Isolated and Incubated with this nuclease, the enzyme crosses the nuclear membrane and cleaves the nucleosomal linker DNA but not the nucleosomal core DNA. If large amounts of this enzyme are added, essentially all of the linker regions are broken, but the nucleosomal cores remain Intact. When the DNA isolated from these nuclei Is electrophoresed on agarose gels, a single 145-base-pair band derived from these nucleosomal core particles is observed. If, in contrast, the nuclei are incubated with low amounts of micrococcal nuclease,only some of the linkers are cleaved. As a result, the DNA will exhibit ladder pattern on the gel, with the length of each band representing a multiple of the nucleosomal unit of about 200 base-pairs. The sequential breakdown of chromatin by micrococcal nuclease is illustrated in Figure 6-3. The analysis of DNA from micrococcal-nuclease-digested nuclei Is diagrammed In Figure 6-4.
Figure 6-3. Sequential Breakdown of Chromatin by Micrococcal Nuclease

53 STANDARD STUDENT PROGRAM 3MODERNBIO.COM
Figure 6-4. Analysts of DNA from Micrococcal-Nuclease-Digested Nuclei
ObjectiveTo examine DNA obtained from micrococcal-nuclease-digested nuclei. The digested DNA Is provided in the Experiment Package. The nuclei were obtained from calf thymus. In Parts B and C (below) you will analyze nucleosomal DNA in nuclei that you prepare.
MaterialsA. The solutions and materials required for electrophoresis, sample handling
and gel staining (see Appendices 1 and 2).B. The samples below are provided in the container marked Experiment
306: Dye mixture: A mixture of xylene cyanol, bromophenol blue, and
orange-G. Nucleosome 1, Nucleosome 2, Nucleosome 3. These three DNA samples ware prepared from calf thymus nuclei,as
outlined in Figure 6-4 using low (nudeosome 1), medium (nucleosome 2) and high (nucleo some 3) concentrations of micrococcal nuclease.

54 STANDARD STUDENT PROGRAM 3MODERNBIO.COM
Procedure1. Prepare agarose gels as described In Section IV and Experiment 301 and
load 15μl of the following samples Into the sample wells.
sample Well number sample1 DNA Sample from Nucleosome Tube 12 DNA Sample from Nucleosome Tube 23 DNA Sample from Nucleosome Tube 34 Dye Mixture5 DNA Sample from Nucleosome Tube 16 DNA Sample from Nucleosome Tube 27 DNA Sample from Nucleosome Tube 38 Dye Mixture
2. Seal the wells with agarose and electrophorese until the orange-G has migrated to within 2cm of the positive electrode end of the gel.
3. Remove the gels from the unit, mark the positions of the marker dyes with a razor blade and slain and destain the gels as described In Section IV.
4. Measure the distance of the DNA bands (in em) from the sample origin and note the positions of the DNA bands.
Study Questions1. Identify the DNA bands derived from one nucleosome
(mononucleosomes), two nucleosomes (dinucleosomes) and three nucleosomes (trinucleosomes).
2. Note that the mononucleosomes bands become slightly smaller with Increasing micrococcal nuclease digestion. Why? (Hint: see Figure 6-3).
B. Structure or Plant ChromatinThe wheat kernel consists of three parts: (1) The embryo or germ that produces the new plant; (2) the starchy endosperm, which serves as a food source for the embryo; and (3) covering layers which protect the grain. The average wheat grain is composed of about 85% endosperm, 13% covering layers and 2% germ, by weight. The endosperm Is the raw material for flour production,and the wheat germ Is used in food products as a source of vitamins. Wheat germ Is also frequently used In the molecular biology laboratory as a source of protein synthesizing extracts as well as plant cell proteins and nucleic acids. In today’s laboratory, you will analyze the structure of wheat germ chromatin.

55 STANDARD STUDENT PROGRAM 3MODERNBIO.COM
ObjectiveTo Isolate nuclei from wheat germ,to digest the nuclear chromatin with micrococ-cal nuclease and to analyze the chromatin DNA by electrophoresis. This exercise requires two sessions of two hours or one session lasting three to four hours.
MaterialsA. The solutions and materials required for electrophoresis,sample handling
and gel staining (see Appendices 1 and 2).B. The samples below are provided In the container marked Experiment
306: Nuclear Incubation buffer: This buffer should be made up before the laboratory session as described In Appendix 2 and stored in the refrigerator,
Sample buffer,Dye mixture: A mixture of xylene cyanol, bromophenol blue, and orange-G,
Wheat germ,Micrococcal nuclease: The enzyme should be made up before the laboratory
session as described In Appendix 2 and stored In the refrigerator,Cheese cloth,Graduated pipets.
Materials Not ProvidedA water bath for tube Incubation maintained at 37°C. Ice bath.Refrigerated centrifuge and small (10ml capacity) centrifuge tubes (A small
clinical centrifuge placed in the refrigerator is suitable for this exercise).Four small beakers.
Procedure - Laboratory Session 1Preparing the DNA SamplesThis procedure is designed such that the preparation of the samples will be performed by four groups of students. Unless otherwise indicated, all steps should be performed at 4’C.
1. Place 3g of wheat germ into a beaker, add 10 ml of pre-cooled nuclear incubation buffer and stir for a few minutes The buffer contains the detergent NP-40, which will disrupt the plasma membrane and cause cell lysis.
2. Filter the material through three layers of cheese cloth into a centrifuge tube and squeeze the cheese cloth to ensure that all of the liquid is collected in the tube. Centrifuge the tube at 4’C for 5 minutes at 500-1000 x G to pellet the nuclei.
3. Carefully pour off and discard the supernatant. Add 5ml of nuclear incubation buffer to the nuclear pellet and mix well.
56 STANDARD STUDENT PROGRAM 3MODERNBIO.COM
4. Centrifuge at 4°C for 5 minutes at 500-1000 x G.
5. Carefully pour off and discard the supernatant. Add 1ml of nuclear incubation buffer to the nuclear pellet using a graduated pipet provided with the Chemical Package. Draw the nuclei into the pipet several times until a homogeneous suspension is formed.
6. Divide the nuclear suspension into 3 approximately equal portions containing about 0.3 ml each and place each portion into a small centrifuge tube located in an ice bath.
7. Label the tubes 1-3 with a waterproof marking pen.
8. Place 5μl of micrococcal nuclease into tube 2 and 30μl of the enzyme into tube 3.
9. Transfer the tubes to a 37°C incubator.
10. After 10 minutes, remove the tubes from the incubator and centrifuge for 5 minutes at 500-1000 x G. Small chromatin fragments produced by the action of micrococcal nuclease, should be liberated into the supernatant fractions.
11. Carefully pour the supernatant from each tube into clean tubes labeled 1-3. These supernatants should contain soluble chromatin particles (mono-, di-, and tri nucleosomes).
12. Each student or student pair should transfer 40μl of these solutions into 3 small tubes provided with the Chemical Package.
13. Add 20μl of sample buffer to each tube and incubate the tubes for 15 minutes at 37°C. This sample buffer contains RNase which serves to destroy RNA in the samples. The sample buffer also contains the detergent, Sarkosyl, which will disrupt the histone-DNA interactions, liberating the DNA in a form that can be analyzed by electrophoresis.
14. The samples can then be stored at -20’C until the next laboratory session or analyzed by electrophoresis as described below.

57 STANDARD STUDENT PROGRAM 3MODERNBIO.COM
Laboratory Session 2
Electrophoretic Analysis of DNA1. Prepare 1.5% agarose gels as described in Section IV.
2. Load 15μl of each sample into the sample wells as indicated below. sample Well number sample
1 Tube 12 Tube 23 Tube 34 Dye Mixture5 Tube 16 Tube 27 Tube 38 Dye Mixture
3. Electrophorese until the orange-G has migrated to within 2 em of the positive electrode end of the gel.
4. Remove the gels from the unit mark the positions of the marker dyes, and stain and destain the gels as described in Section IV.
C. Chromatin DNA Breakdown by Cell Nucleases (Optional)The nuclei of most, if not all, eukaryotic cells contain a number of different nucleases. The physiological role of most of these enzymes is pearly understood. One such enzyme, or group of enzymes, is similar to micrococcal nuclease in that it attacks linker DNA between nucleosomes. The enzyme in rat liver nuclei has been characterized extensively. When liver nuclei are incubated at 37°C for various times up to 30 minutes, the progressive breakdown of chromatin occurs. DNA from this chromatin will exhibit the typical nucleosome “ladder” appearance upon electro phoresis. Although nuclei isolated from vertebrate liver contain large amounts of this enzyme, the enzyme activity is also found in nuclei from other animal and plant tissues.
ObjectiveTo study the sequential breakdown of DNA In chromatin during Incubation of Isolated nuclei. This Is an optional exercise that requires two laboratory sessions. In the first session, you will, prepare nuclease-digested chromatin. In the second session, you will use electrophoresis to analyze the DNA from this chromatin. This experiment Is optional because a tissue must be provided for the preparation of nuclei.

58 STANDARD STUDENT PROGRAM 3MODERNBIO.COM
MaterialsA. The solutions and materials required for electrophoresis,sample handling
and gel staining (see Appendices 1 and 2).B. The samples below are provided in the container marked Experiment
306: Nuclear Incubation Buffer: This buffer should be made up before
the laboratory session as described In Appendix 2,and stored in the refrigerator,
Sample Buffer, Dye Mixture: A mixture of xylene cyanol, bromophenol blue, and
orange-G.
Materials Not ProvidedWater Bath for Tube Incubation Maintained at 37 •cIce BathRefrigerated centrifuge and small (3-10ml capacity) centrifuge tubes. A small
clinical centrifuge placed in the refrigerator is suitable for this exercise.A device for tissue disruption. A commercial glass homogenizer is preferred.
However, a pre-cooled mortar with pestle is a suitable alternative.Four grams of tissue. Although nuclei from vertebrate liver contain large
quantities of the desired enzyme activity, nuclei from other tissue sources can also be used. Possible tissues include:
a. Calf or chicken liver obtained from animals recently butchered at you local slaughter house.
b. Rodent liver, frog liver.
There are sufficient materials provided with the Chemical Package for you to perform this exercise with more than one tissue type.
Procedure - Laboratory Session 1
Preparing the DNA SamplesThe procedure Is designed so that the preparation of the samples with be performed by the entire class as a group. However, there is sufficient buffer provided lor 4 groups of students to conduct the experiment. Unless otherwise indicated, an steps should be performed at 4°C.
1. Place 4g of tissue into a pre-cooled mortar and add t 0 ml of pre-cooled nuclear incubation buffer.
2. Cut the tissue into small (about 1mm2) sections with scissors and grind the sections with the pestle until a homogeneous suspension is formed. The mechani cal action of the pestle as well as the chemical action of the detergent, NP-40, which is present In the buffer, will serve to disrupt the plasma membranes and to cause cell lysis.

59 STANDARD STUDENT PROGRAM 3MODERNBIO.COM
3. Transfer this cell homogenate to a centrifuge tube and centrifuge at 4°C for 5 minutes at 500-1000 x G to pellet the nuclei.
4. Carefully pour off and discard the supernatant. Add 3ml of nuclear digestion buffer to the nuclear pellet and mix well.
5. Divide the nuclear suspension into 3 approximately equal portions and place each portion into a small centrifuge tube located in an ice bath.
6. Label the tubes 1-3 with a waterproof marking pen.
7. Transfer tubes 2 and 3 from the ice bath to a 37°C incubator.
8. After 5 minutes, remove tube 2 from the incubator and return it to the ice bath.
9. After 30 minutes,remove tube 3 from the incubator and return it to the ice bath.
10. Centrifuge tubes 1-3 for 5 minutes at 500-1000 x G. Small chromatin fragments produced by the action of the nuclear enzymes, should be liberated Into the supernatant fractions.
11. Carefully pour the supernatant from each tube into clean tubes labeled 1-3. These supernatants should contain soluble chromatin particles (mono-,di-, and tri- nucleosomes).
12. Each student or student pair should transfer 40μl of these solutions into 3 small tubes provided with the Chemical Package.
13. Add 20μl of sample buffer to each tube and Incubate the tubes for 15 minutes at 37°C. This sample buffer contains RNase which serves to destroy RNA in the samples. The sample buffer also contains the detergent, Sarkosyl,which with disrupt the histone-DNA Interactions, liberating the DNA In a form that can be analyzed by electrophoresis.
14. The samples can then be stored at -20°C until the next laboratory session.

60 STANDARD STUDENT PROGRAM 3MODERNBIO.COM
Laboratory Session 2
Electrophoretic Analysis of DNA1. Prepare 1.5% agarose gels as described in Section IV.
2. Load 15μl of each sample into the sample wens as indicated below.
sample Well number sample1 Tube l2 Tube 23 Tube 34 Dye Mixture5 Tube 16 Tube 27 Tube 38 Dye Mixture
3. Electrophorese until the orange-G has migrated to within 2 em of the positive electrode end of the gel.
4. Remove the gels from the unit, mark the positions of the marker dyes and stain and destain the gels as described in Section IV.
Suggested Reading and References for Part B
Laboratory Methods:Hames, B.D. and Richwood, D. Gel Electrophoresis of Nucleic Acids. Oxford: IAL Press, 1982.
Hackel, P.B., Fuchs, J.A. and Messing, J.W. An Introduction to Recombinant DNA Techniques. Menlo Park: The Benjamin/Cummings Publishing Co., 1984.
Manialis, T., Fritsch, E.F. and Sambrook, J. Molecular Cloning, A Laboratory Manual. Cold Spring Harbor Laboratory Publications, 1982.
General References:Alberts, B., Bray,L., lewis,J., Ra1f, M., Roberts,A. and Watson. Molecular Biology of the Cell. New York and London: Garland, 1983.
Freifelder, D. Molecular Biology. Portola: Science Books Int., 1983.
Metzler, D.E. Biochemistry. New York: Academic Press, 1977.
Lewin, B. Genes. John Wiley and Sons, Inc.: New York, 1983.

61 STANDARD STUDENT PROGRAM 3MODERNBIO.COM
aPPendIxThe Metric System
length english equivalent
1 meter (m) = 100 centimeters = 0.3937 inches1 centimeter (em) = 10 millimeters (mm)2.5 centimeter = 1.0 inch
Volume
1 liter (1) = 1000 milliliter = 1.06 quarts1 milliliter (ml) = 1000 microliters1 microliter (μl) = 10-3ml
mass
1 kilogram (kg) = 1000 grams = 2.2046 pounds1 gram (g) = 10-3kg1 milligram (mg) = 10-3g1 microgram (μg) = 10-6g1 nanogram (ng) = 10-9g

modern bIologY3700 East 700 SouthLafayette, IN 47909Call Toll Free: 1-800-733-6544FAX: 1-765-523-3397