Standard Response Evaluation Criteria in Solid Tumors (RECIST) using 3D Slicer
35
Standard Response Evaluation Criteria in Solid Tumors (RECIST) using 3D Slicer Slicer3 Training Compendium Jeffrey Yap, PhD Ron Kikinis, MD Wendy Plesniak, PhD
-
Upload
piper-jacobs -
Category
Documents
-
view
43 -
download
1
description
Slicer3 Training Compendium. Standard Response Evaluation Criteria in Solid Tumors (RECIST) using 3D Slicer. Jeffrey Yap, PhD Ron Kikinis, MD Wendy Plesniak, PhD. Materials. This tutorial requires the following installation: - PowerPoint PPT Presentation
Transcript of Standard Response Evaluation Criteria in Solid Tumors (RECIST) using 3D Slicer
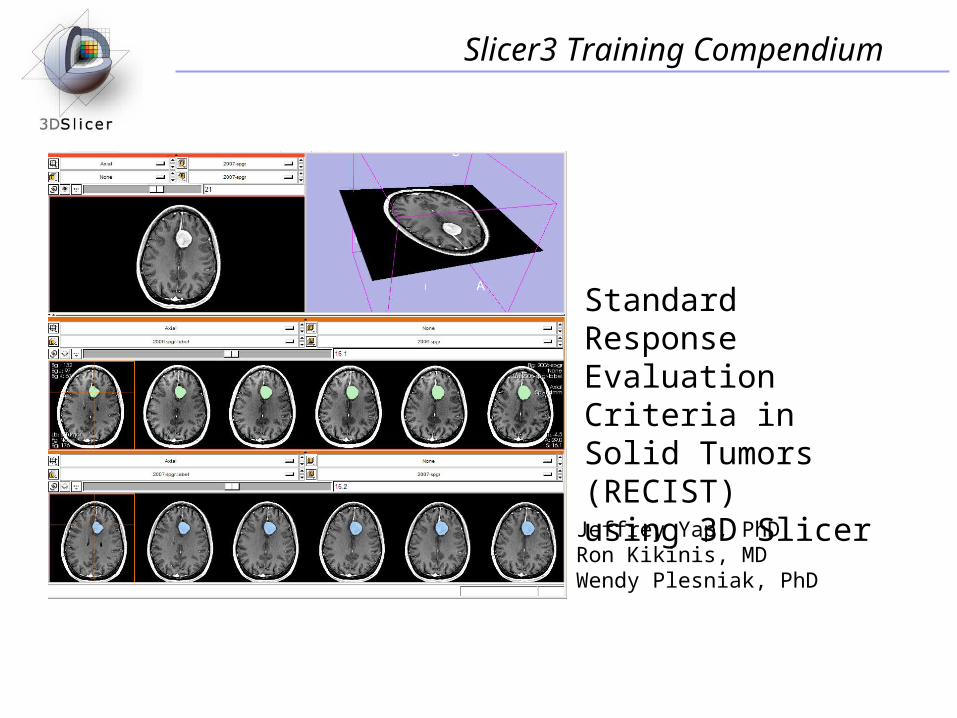
Standard Response Evaluation Criteria in Solid Tumors (RECIST) using 3D Slicer
Slicer3 Training Compendium
Jeffrey Yap, PhDRon Kikinis, MDWendy Plesniak, PhD
Materials
This tutorial requires the following installation:
• 3D Slicer version 3.5 Software, which can be installed fromhttp://www.na-mic.org/Slicer/Download/Snapshots/win32/Slicer3-3.5-RSNA-2009-11-06-win32.exe
• Tutorial data can be downloaded from:http://wiki.na-mic.org/Wiki/images/d/de/RECIST-Tutorial-Data.zip
DisclaimerIt is the responsibility of the user of 3DSlicer to comply with both the terms of the license and with the applicable laws, regulations and rules.
Yap J, Kikinis R, Plesniak W: Harvard CTSC at RSNA2009 -1-
Tutorial data
Yap J, Kikinis R, Plesniak W: Harvard CTSC at RSNA2009 -2-
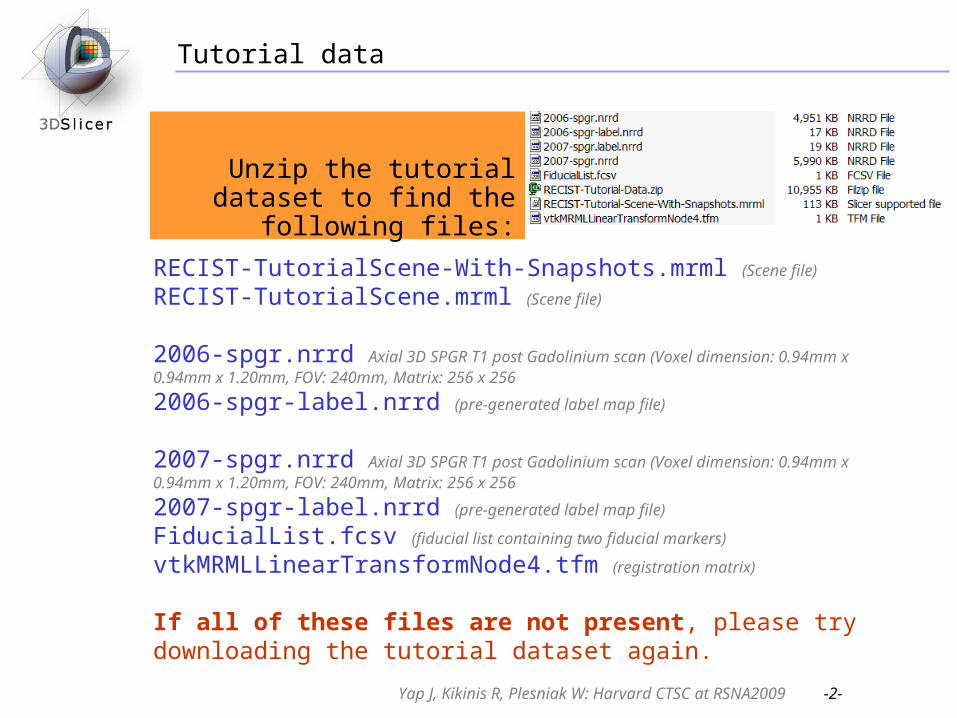
Unzip the tutorial dataset to find the following files:
RECIST-TutorialScene-With-Snapshots.mrml (Scene file) RECIST-TutorialScene.mrml (Scene file)
2006-spgr.nrrd Axial 3D SPGR T1 post Gadolinium scan (Voxel dimension: 0.94mm x 0.94mm x 1.20mm, FOV: 240mm, Matrix: 256 x 256
2006-spgr-label.nrrd (pre-generated label map file)
2007-spgr.nrrd Axial 3D SPGR T1 post Gadolinium scan (Voxel dimension: 0.94mm x 0.94mm x 1.20mm, FOV: 240mm, Matrix: 256 x 256
2007-spgr-label.nrrd (pre-generated label map file)
FiducialList.fcsv (fiducial list containing two fiducial markers)
vtkMRMLLinearTransformNode4.tfm (registration matrix)
If all of these files are not present, please try downloading the tutorial dataset again.
Clinical context
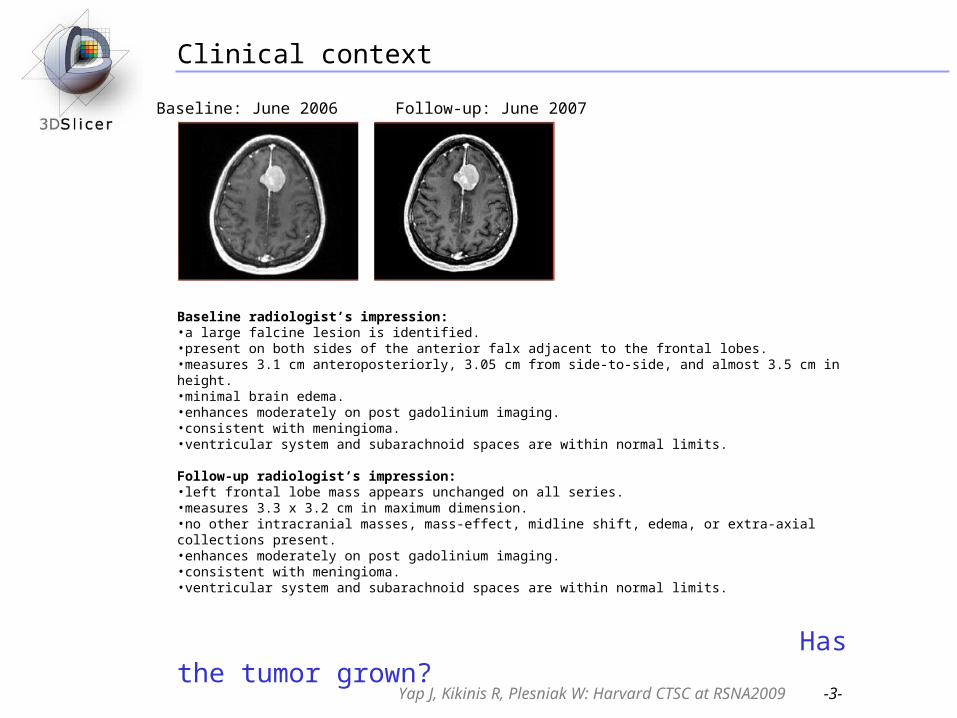
Baseline radiologist’s impression:•a large falcine lesion is identified. •present on both sides of the anterior falx adjacent to the frontal lobes.•measures 3.1 cm anteroposteriorly, 3.05 cm from side-to-side, and almost 3.5 cm in height. •minimal brain edema. •enhances moderately on post gadolinium imaging. •consistent with meningioma.•ventricular system and subarachnoid spaces are within normal limits.
Follow-up radiologist’s impression: •left frontal lobe mass appears unchanged on all series. •measures 3.3 x 3.2 cm in maximum dimension. •no other intracranial masses, mass-effect, midline shift, edema, or extra-axial collections present. •enhances moderately on post gadolinium imaging. •consistent with meningioma.•ventricular system and subarachnoid spaces are within normal limits.
Has the tumor grown?
Yap J, Kikinis R, Plesniak W: Harvard CTSC at RSNA2009 -3-
Baseline: June 2006 Follow-up: June 2007
Response Evaluation Criteria in Solid Tumors (RECIST)
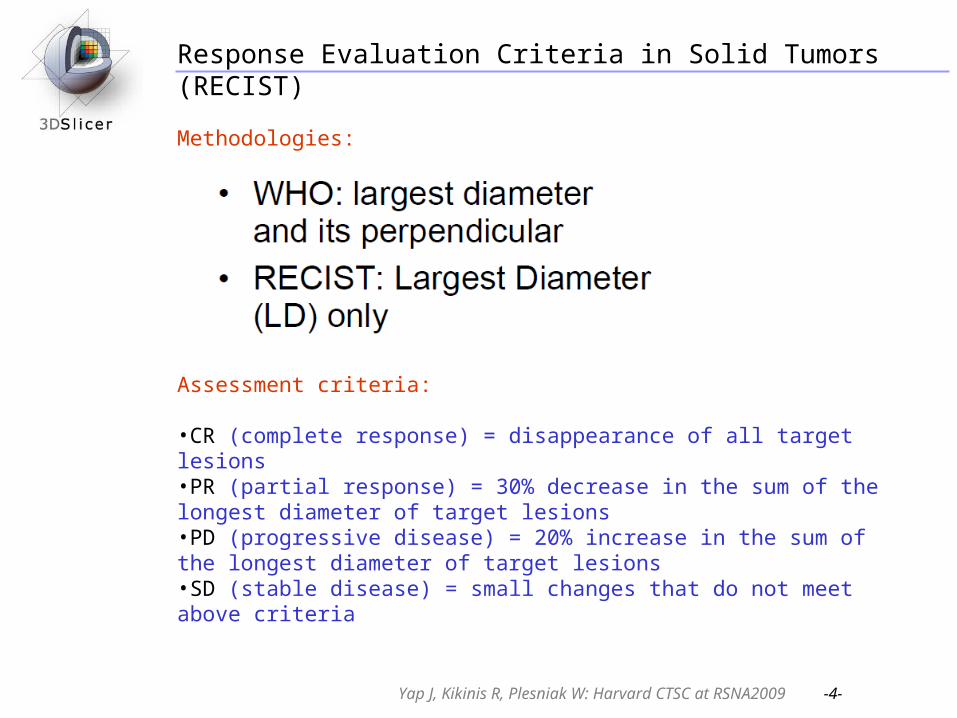
Methodologies:
Assessment criteria:
•CR (complete response) = disappearance of all target lesions•PR (partial response) = 30% decrease in the sum of the longest diameter of target lesions•PD (progressive disease) = 20% increase in the sum of the longest diameter of target lesions•SD (stable disease) = small changes that do not meet above criteria
Yap J, Kikinis R, Plesniak W: Harvard CTSC at RSNA2009 -4-
Learning objective
Following this tutorial, you’ll be able to use 3D Slicer to:
Load a MRML Scene file,
Visually assess the response to therapy,
Make quantitative linear measurements across tumor cross sections, and
Make quantitative volume measurements of tumor anatomy
Assess according to RECIST criteria.
Yap J, Kikinis R, Plesniak W: Harvard CTSC at RSNA2009 -5-
Workflow Overview
1. Load two post-treatment datasets
2. Compare volumetric measures of tumor using label map statistics.
3. Identify tumor cross section containing largest diameter
4. Compare opposing diameters of largest tumor cross section using fiducial markers.
5. Assess changes.
Workflow for linear and volumetric measurements
Yap J, Kikinis R, Plesniak W: Harvard CTSC at RSNA2009 -6-
* Load a MRML scene* Compare volumetric measurements* Switch layouts & make linear measurements* Switch layouts & analyze follow-up* Assessment* Summary
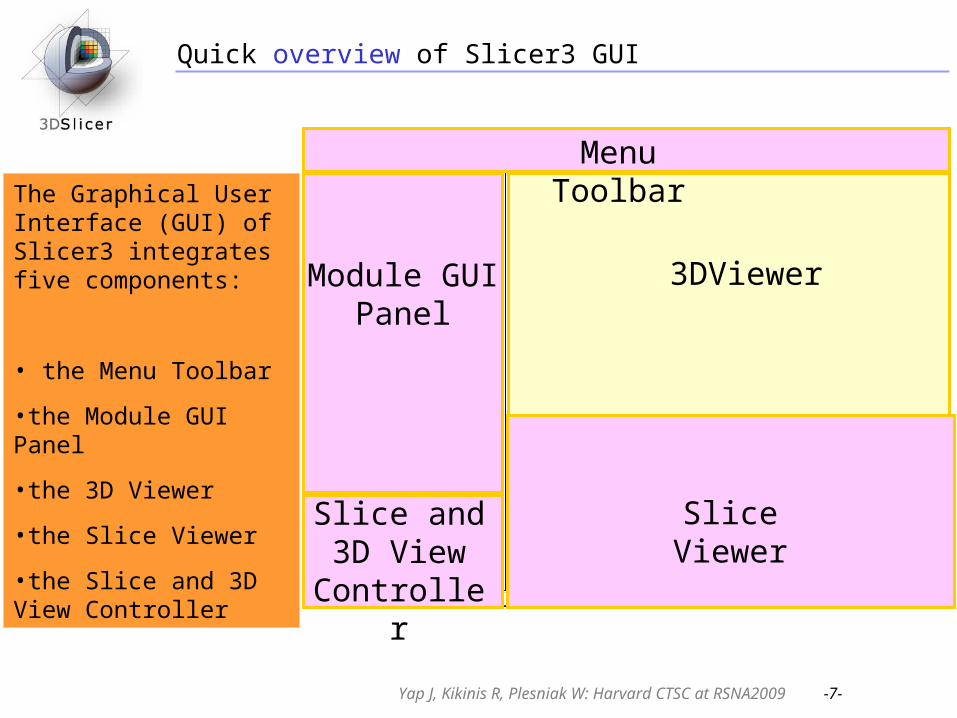
The Graphical User Interface (GUI) of Slicer3 integrates five components:
• the Menu Toolbar
•the Module GUI Panel
•the 3D Viewer
•the Slice Viewer
•the Slice and 3D View Controller
Slice Viewer
3DViewerModule GUI Panel
Slice and 3D View
Controller
Menu Toolbar
Quick overview of Slicer3 GUI
Yap J, Kikinis R, Plesniak W: Harvard CTSC at RSNA2009 -7-
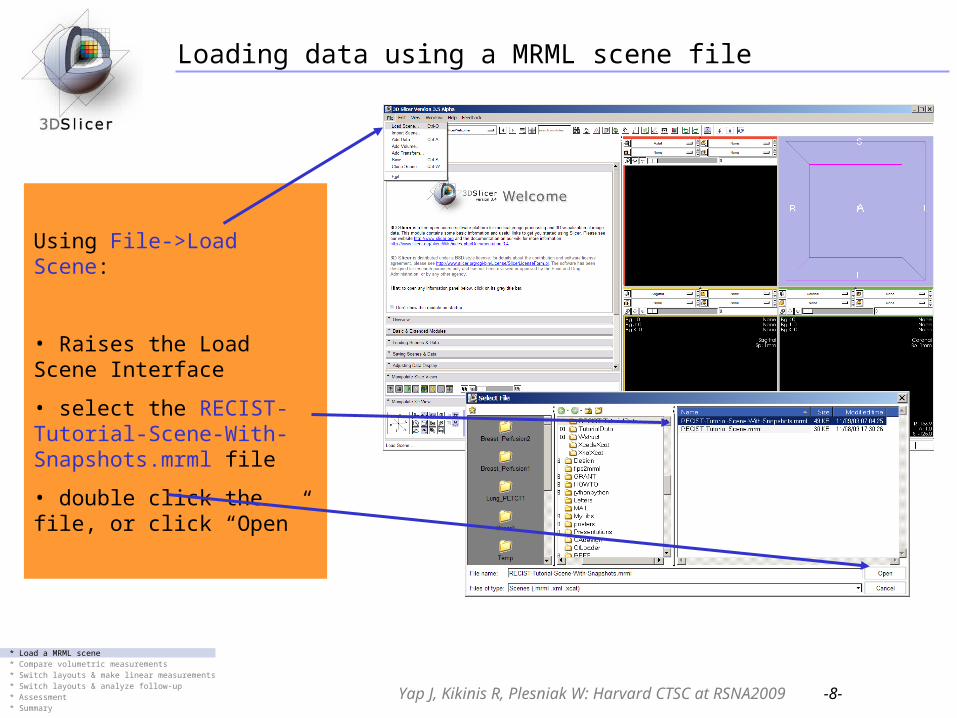
Loading data using a MRML scene file
Yap J, Kikinis R, Plesniak W: Harvard CTSC at RSNA2009 -8-
Using File->Load Scene:
• Raises the Load Scene Interface
• select the RECIST-Tutorial-Scene-With-Snapshots.mrml file
• double click the file, or click “Open”
* Load a MRML scene* Compare volumetric measurements* Switch layouts & make linear measurements* Switch layouts & analyze follow-up* Assessment* Summary
fyi: What is “MRML”?
•MRML (pronounced mur-muhl) stands for the "Medical Reality Markup Language"; and is an XML-based representation of a MRML Scene.
MRML Scene is the collection of datasets and their current state, viewing parameters, semantic descriptions, and algorithm parameterization.
Yap J, Kikinis R, Plesniak W: Harvard CTSC at RSNA2009 -9-
* Load a MRML scene* Compare volumetric measurements* Switch layouts & make linear measurements* Switch layouts & analyze follow-up* Assessment* Summary

Loading data: quick look at both image volumes
Yap J, Kikinis R, Plesniak W: Harvard CTSC at RSNA2009 -10-
* Load a MRML scene* Compare volumetric measurements* Switch layouts & make linear measurements* Switch layouts & analyze follow-up* Assessment* Summary
The image volume “2006-spgr” should be displayed in the background (BG) layer.
The image volume “2007-spgr” should be displayed in the foreground (FG) layer.
Use the FG/BG toggle button and the Fade Slider to see both volumes.
Toggle BGonly Fade FGonly

Make volume measurements
Yap J, Kikinis R, Plesniak W: Harvard CTSC at RSNA2009 -11-
Using Modules Menubutton:
Expose the menu and select the “LabelStatistics” module under the “Statistics” group.
* Load a MRML scene* Compare volumetric measurements* Switch layouts & make linear measurements* Switch layouts & analyze follow-up* Assessment* Summary

Make volume measurements: Baseline study
Yap J, Kikinis R, Plesniak W: Harvard CTSC at RSNA2009 -12-
Use the “Scene Snapshots” menubutton to restore the “2006FourUp” snapshot.
This snapshot displays the baseline study and a tumor mask in the label layer.
* Load a MRML scene* Compare volumetric measurements* Switch layouts & make linear measurements* Switch layouts & analyze follow-up* Assessment* Summary
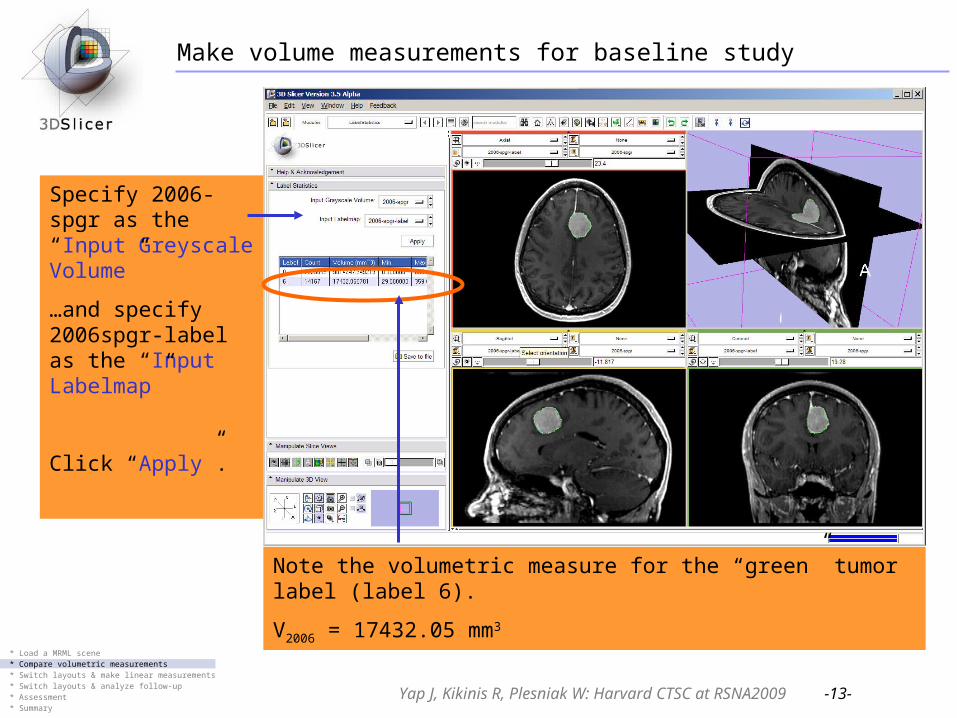
Make volume measurements for baseline study
Yap J, Kikinis R, Plesniak W: Harvard CTSC at RSNA2009 -13-
Specify 2006-spgr as the “Input Greyscale Volume”
…and specify 2006spgr-label as the “Input Labelmap”
Click “Apply”.
Note the volumetric measure for the “green” tumor label (label 6).
V2006 = 17432.05 mm3
* Load a MRML scene* Compare volumetric measurements* Switch layouts & make linear measurements* Switch layouts & analyze follow-up* Assessment* Summary
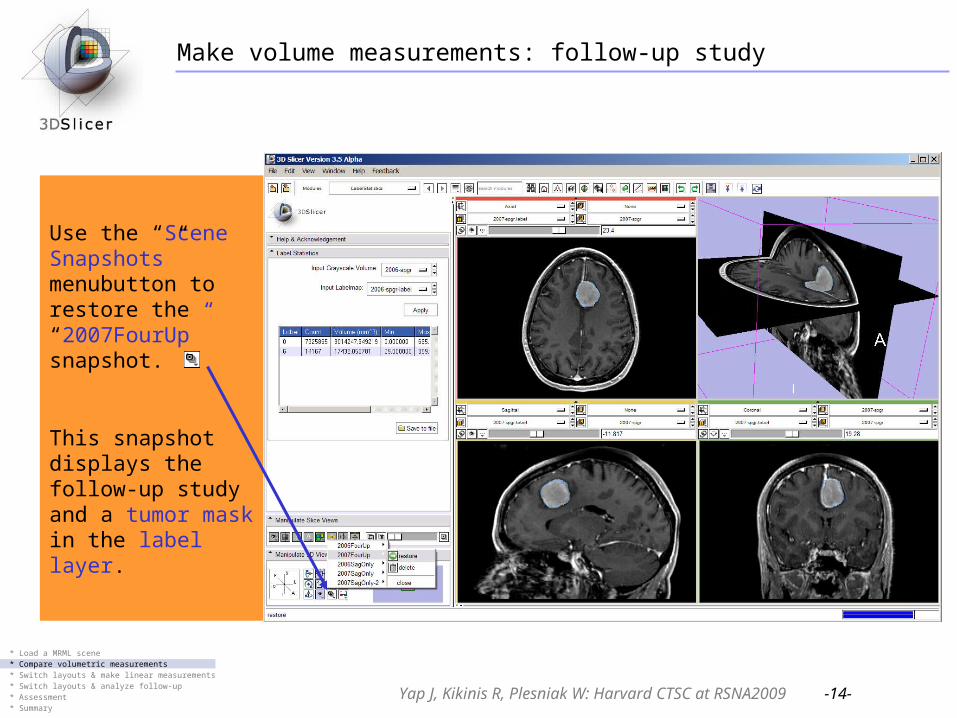
Make volume measurements: follow-up study
Yap J, Kikinis R, Plesniak W: Harvard CTSC at RSNA2009 -14-
Use the “Scene Snapshots” menubutton to restore the “2007FourUp” snapshot.
This snapshot displays the follow-up study and a tumor mask in the label layer.
* Load a MRML scene* Compare volumetric measurements* Switch layouts & make linear measurements* Switch layouts & analyze follow-up* Assessment* Summary
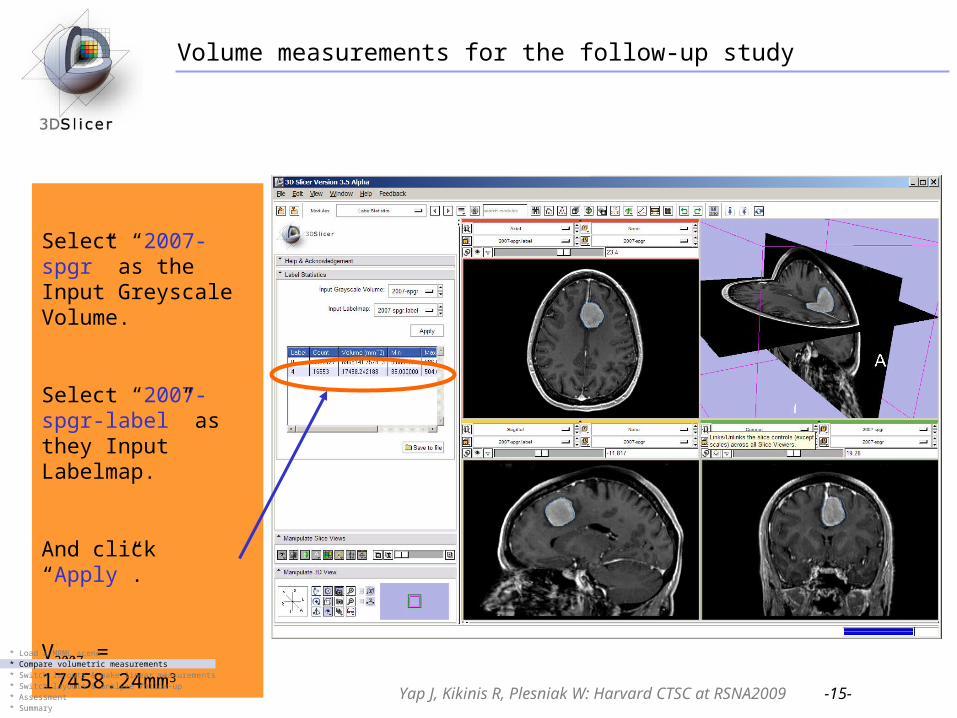
Volume measurements for the follow-up study
Yap J, Kikinis R, Plesniak W: Harvard CTSC at RSNA2009 -15-
Select “2007-spgr” as the Input Greyscale Volume.
Select “2007-spgr-label” as they Input Labelmap.
And click “Apply”.
V2007 = 17458.24mm3
* Load a MRML scene* Compare volumetric measurements* Switch layouts & make linear measurements* Switch layouts & analyze follow-up* Assessment* Summary
Record changes for assessment
Yap J, Kikinis R, Plesniak W: Harvard CTSC at RSNA2009 -16-
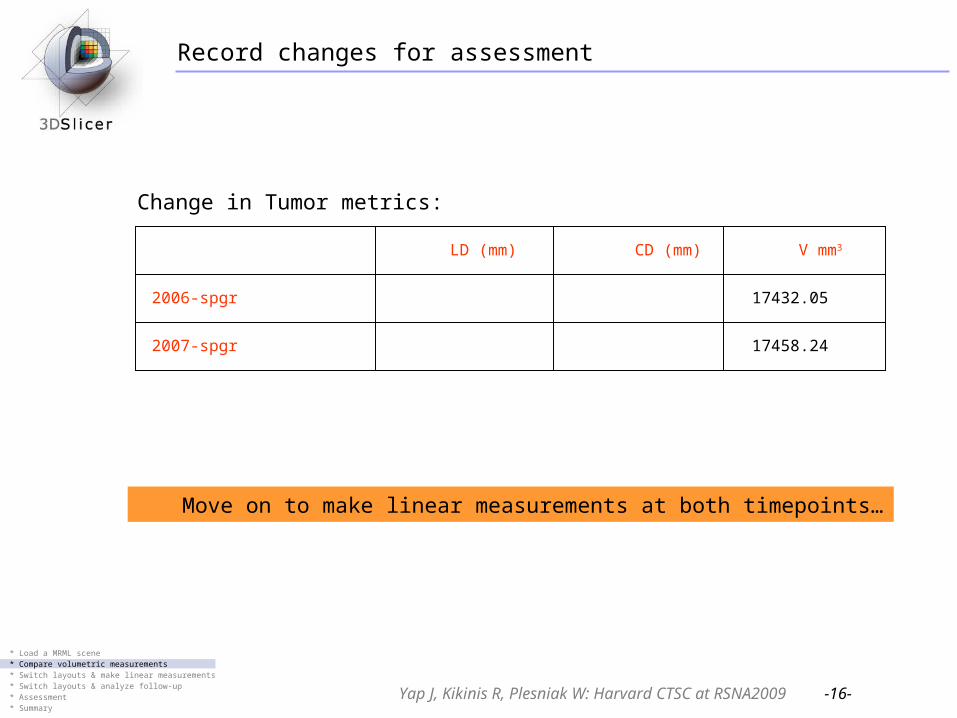
Change in Tumor metrics:
2007-spgr
2006-spgr
V mm3CD (mm)LD (mm)
17458.24
17432.05
Move on to make linear measurements at both timepoints…
* Load a MRML scene* Compare volumetric measurements* Switch layouts & make linear measurements* Switch layouts & analyze follow-up* Assessment* Summary
Linear measurements: exploring baseline data
Yap J, Kikinis R, Plesniak W: Harvard CTSC at RSNA2009 -17-
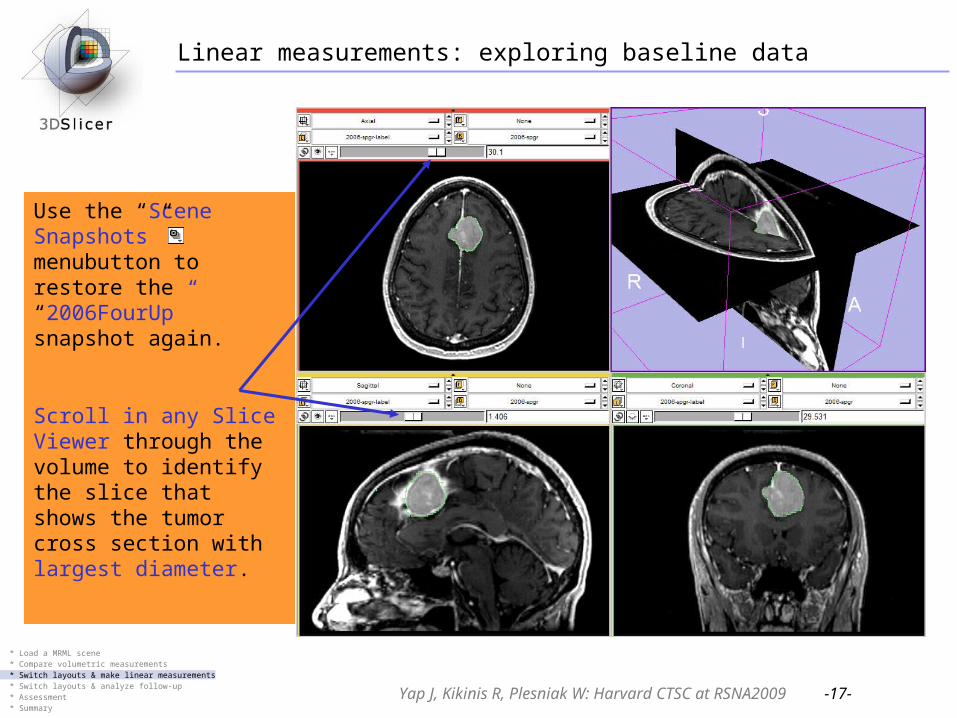
Use the “Scene Snapshots” menubutton to restore the “2006FourUp” snapshot again.
Scroll in any Slice Viewer through the volume to identify the slice that shows the tumor cross section with largest diameter.
* Load a MRML scene* Compare volumetric measurements* Switch layouts & make linear measurements* Switch layouts & analyze follow-up* Assessment* Summary

Linear measurements: exploring baseline data
Yap J, Kikinis R, Plesniak W: Harvard CTSC at RSNA2009 -18-
Zoom in/out by clicking the right mouse button inside a Viewer and moving the mouse toward/away from you.
Translate by clicking and dragging the middle mouse button in a Viewer.
* Load a MRML scene* Compare volumetric measurements* Switch layouts & make linear measurements* Switch layouts & analyze follow-up* Assessment* Summary
Linear measurements: exploring baseline data
Yap J, Kikinis R, Plesniak W: Harvard CTSC at RSNA2009 -19-
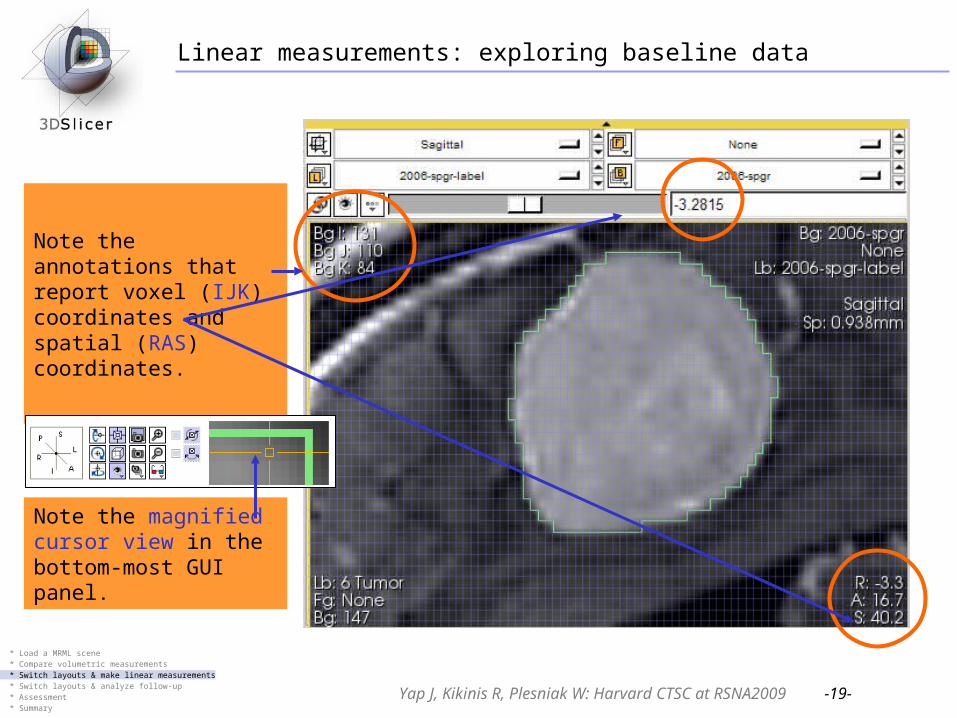
Note the annotations that report voxel (IJK) coordinates and spatial (RAS) coordinates.
Note the magnified cursor view in the bottom-most GUI panel.
* Load a MRML scene* Compare volumetric measurements* Switch layouts & make linear measurements* Switch layouts & analyze follow-up* Assessment* Summary
Linear measurements
Yap J, Kikinis R, Plesniak W: Harvard CTSC at RSNA2009 -20-
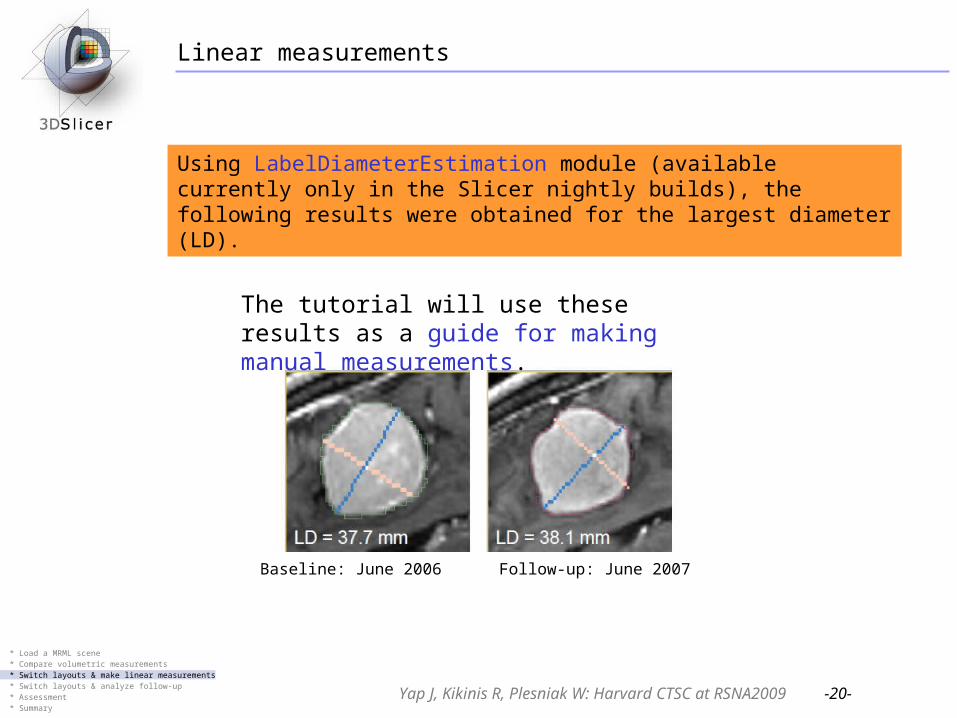
Using LabelDiameterEstimation module (available currently only in the Slicer nightly builds), the following results were obtained for the largest diameter (LD).
Baseline: June 2006 Follow-up: June 2007
The tutorial will use these results as a guide for making manual measurements.
* Load a MRML scene* Compare volumetric measurements* Switch layouts & make linear measurements* Switch layouts & analyze follow-up* Assessment* Summary

Change layouts (shortcut using scene snapshot)
Yap J, Kikinis R, Plesniak W: Harvard CTSC at RSNA2009 -21-
Use the “Scene Snapshots” menubutton to restore the “2006SagOnly” snapshot.
This changes the layout to display only the Saggital (Yellow) Slice Viewer…
* Load a MRML scene* Compare volumetric measurements* Switch layouts & make linear measurements* Switch layouts & analyze follow-up* Assessment* Summary
Make linear measurements
Yap J, Kikinis R, Plesniak W: Harvard CTSC at RSNA2009 -22-
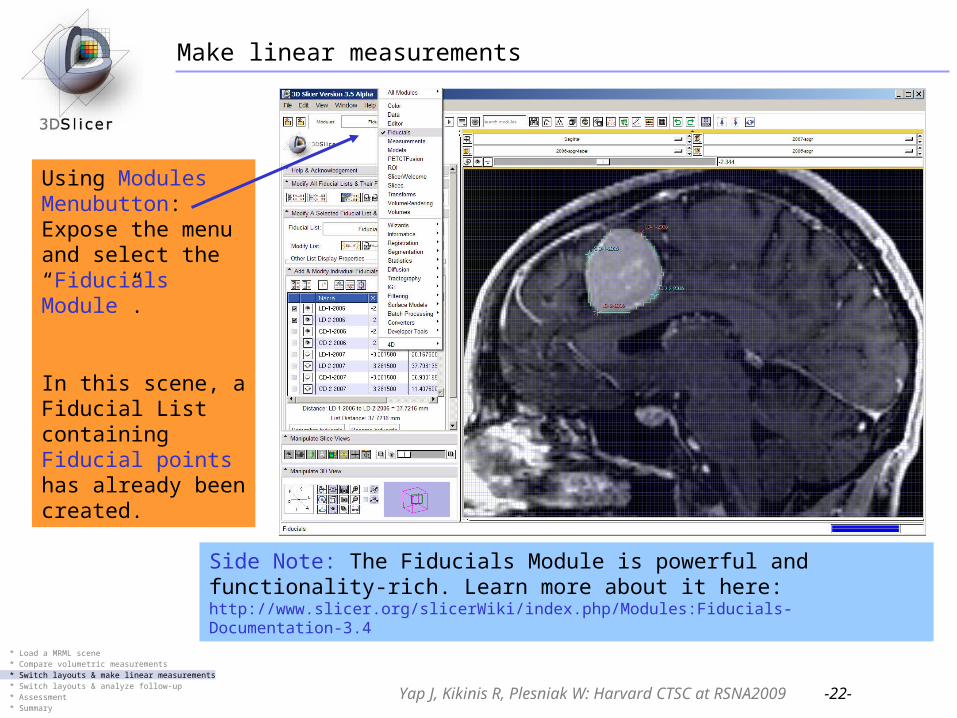
Using Modules Menubutton: Expose the menu and select the “Fiducials Module”.
In this scene, a Fiducial List containing Fiducial points has already been created.
Side Note: The Fiducials Module is powerful and functionality-rich. Learn more about it here: http://www.slicer.org/slicerWiki/index.php/Modules:Fiducials-Documentation-3.4
* Load a MRML scene* Compare volumetric measurements* Switch layouts & make linear measurements* Switch layouts & analyze follow-up* Assessment* Summary
Make linear measurements
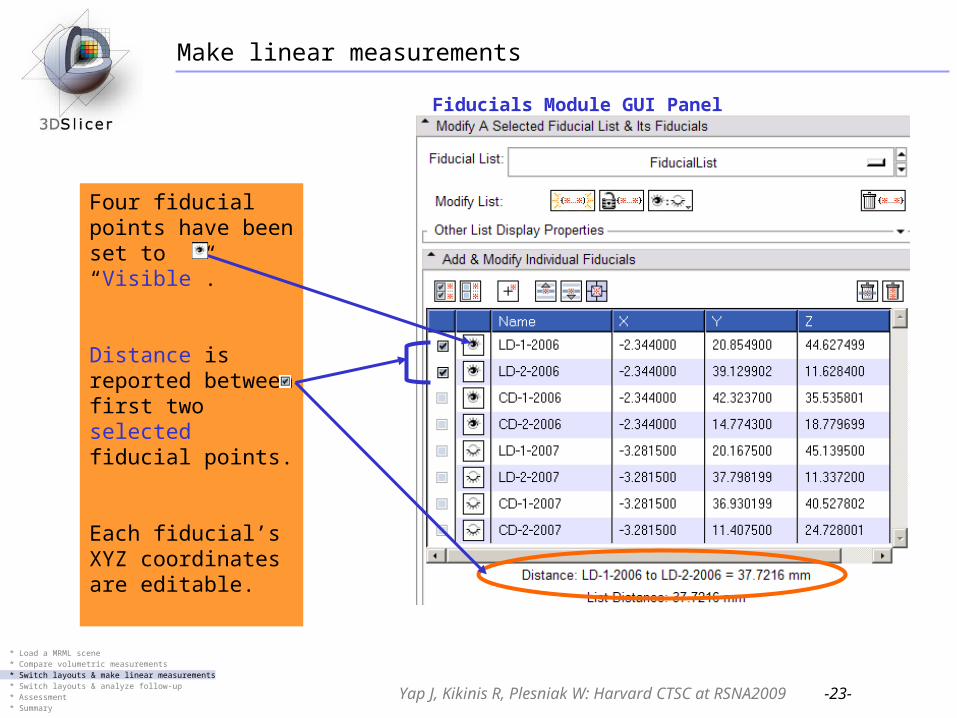
Four fiducial points have been set to “Visible”.
Distance is reported between first two selected fiducial points.
Each fiducial’s XYZ coordinates are editable.
Yap J, Kikinis R, Plesniak W: Harvard CTSC at RSNA2009 -23-
Fiducials Module GUI Panel
* Load a MRML scene* Compare volumetric measurements* Switch layouts & make linear measurements* Switch layouts & analyze follow-up* Assessment* Summary
Make linear measurements
Yap J, Kikinis R, Plesniak W: Harvard CTSC at RSNA2009 -24-
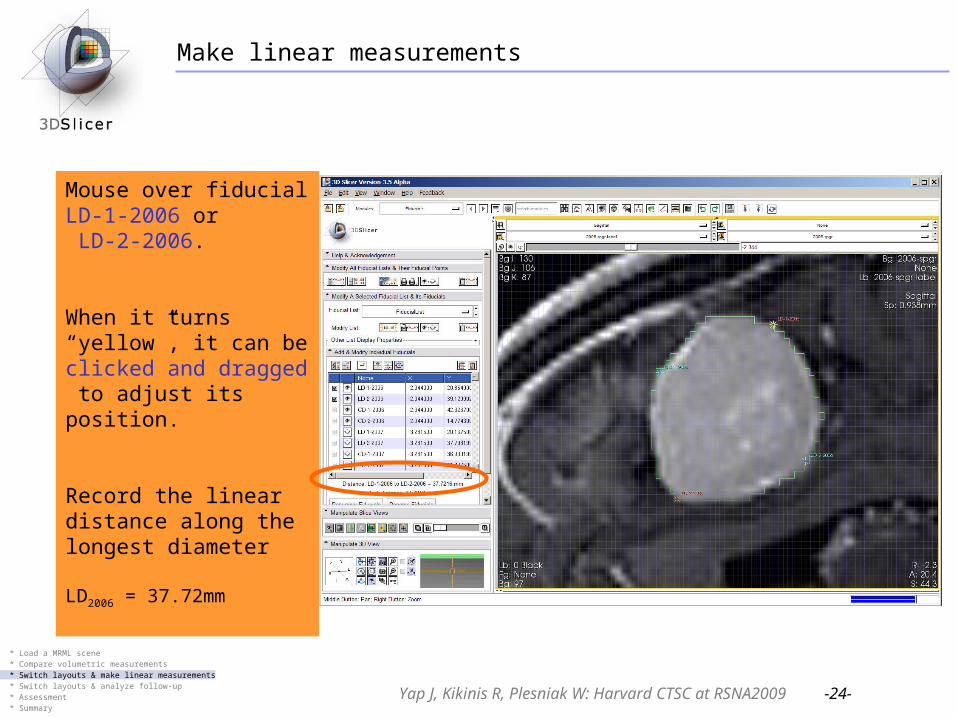
Mouse over fiducial LD-1-2006 or LD-2-2006.
When it turns “yellow”, it can be clicked and dragged to adjust its position.
Record the linear distance along the longest diameter
LD2006 = 37.72mm
* Load a MRML scene* Compare volumetric measurements* Switch layouts & make linear measurements* Switch layouts & analyze follow-up* Assessment* Summary
Make linear measurements
Yap J, Kikinis R, Plesniak W: Harvard CTSC at RSNA2009 -25-
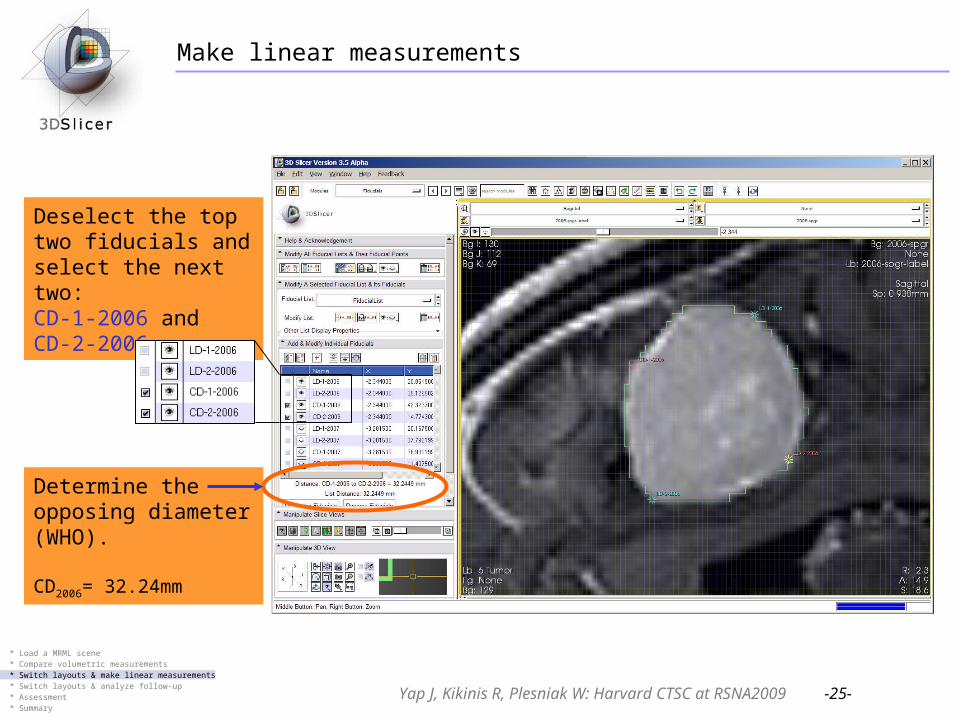
Determine the opposing diameter (WHO).
CD2006= 32.24mm
Deselect the top two fiducials and select the next two:CD-1-2006 and CD-2-2006
* Load a MRML scene* Compare volumetric measurements* Switch layouts & make linear measurements* Switch layouts & analyze follow-up* Assessment* Summary
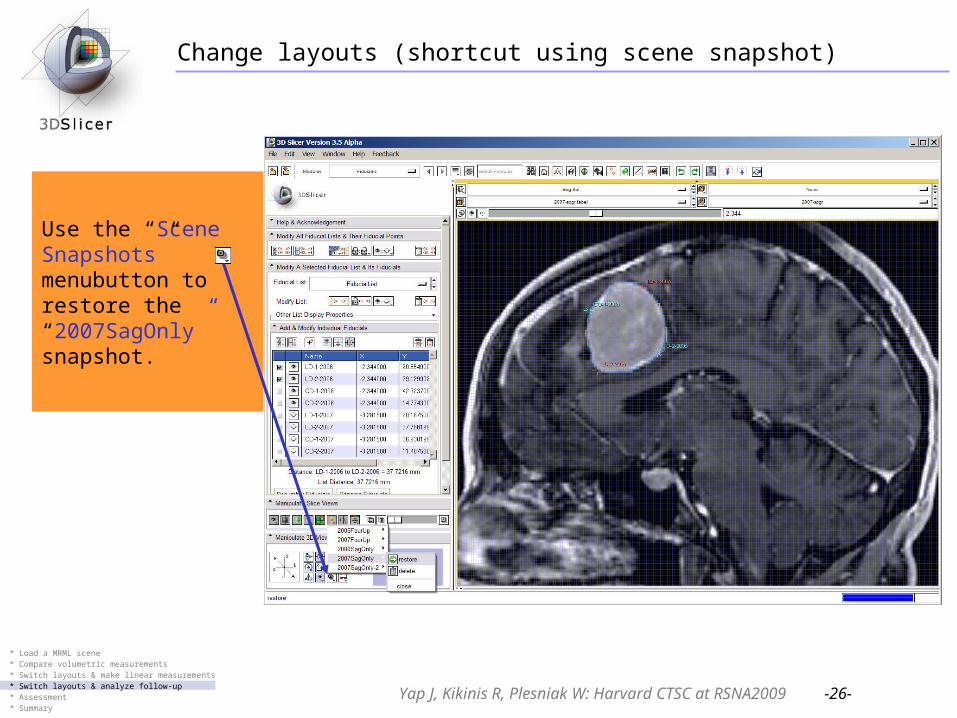
Change layouts (shortcut using scene snapshot)
Yap J, Kikinis R, Plesniak W: Harvard CTSC at RSNA2009 -26-
Use the “Scene Snapshots” menubutton to restore the “2007SagOnly” snapshot.
* Load a MRML scene* Compare volumetric measurements* Switch layouts & make linear measurements* Switch layouts & analyze follow-up* Assessment* Summary
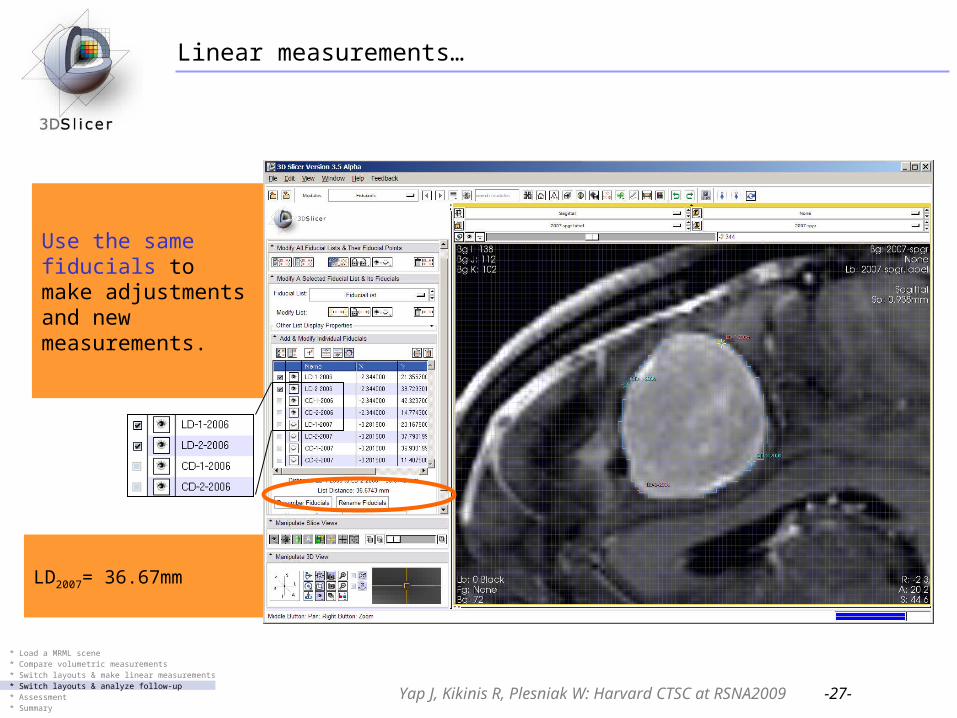
Linear measurements…
Yap J, Kikinis R, Plesniak W: Harvard CTSC at RSNA2009 -27-
Use the same fiducials to make adjustments and new measurements.
LD2007= 36.67mm
* Load a MRML scene* Compare volumetric measurements* Switch layouts & make linear measurements* Switch layouts & analyze follow-up* Assessment* Summary
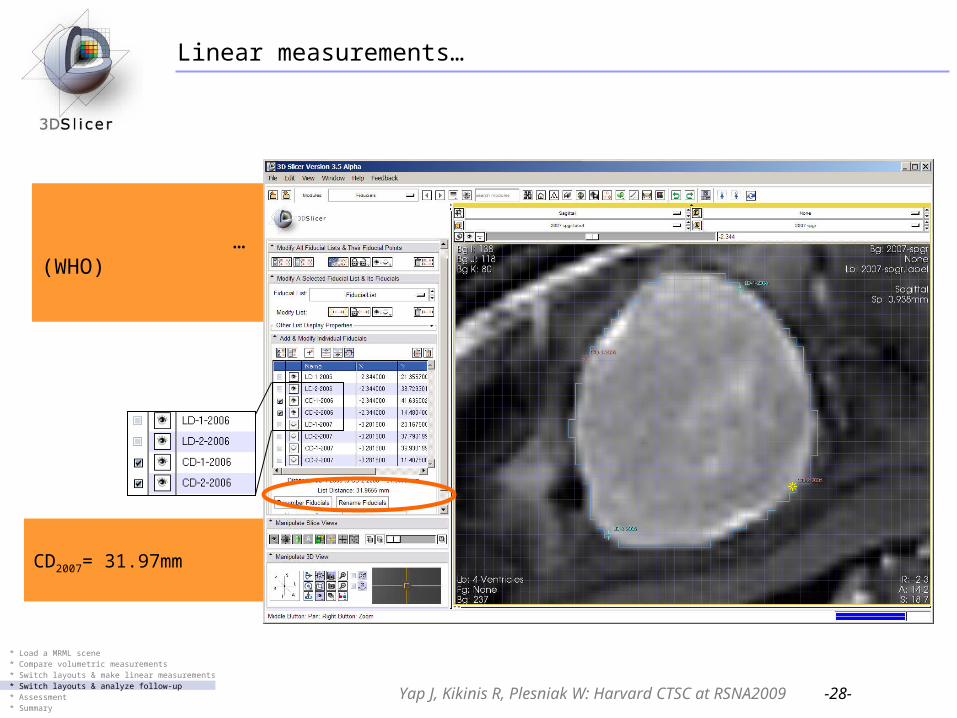
Linear measurements…
Yap J, Kikinis R, Plesniak W: Harvard CTSC at RSNA2009 -28-
CD2007= 31.97mm
…(WHO)
* Load a MRML scene* Compare volumetric measurements* Switch layouts & make linear measurements* Switch layouts & analyze follow-up* Assessment* Summary
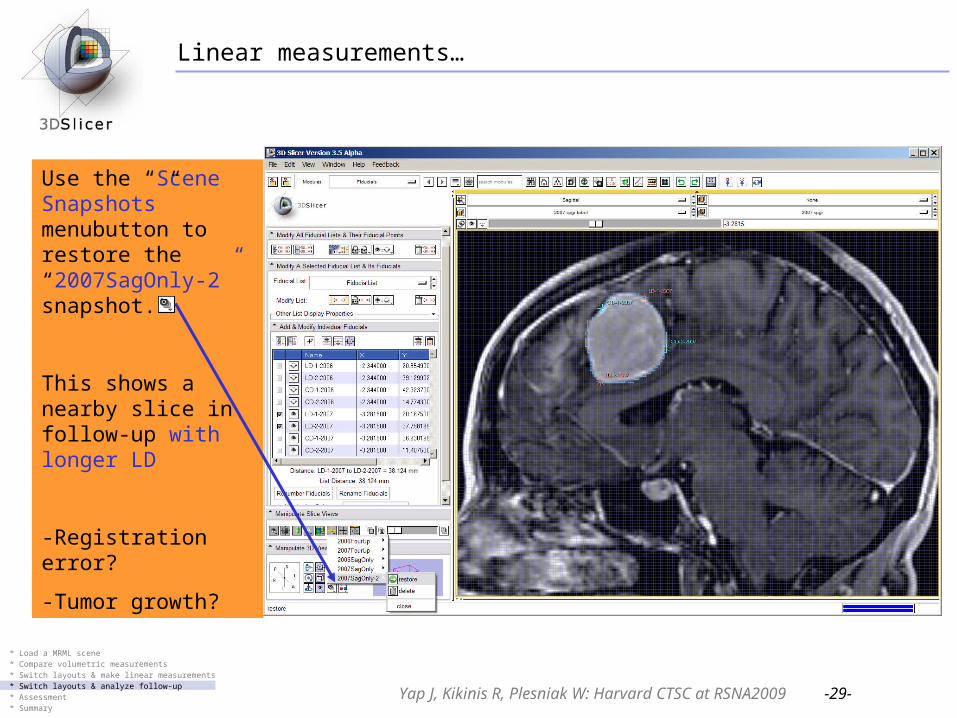
Linear measurements…
Yap J, Kikinis R, Plesniak W: Harvard CTSC at RSNA2009 -29-
Use the “Scene Snapshots” menubutton to restore the “2007SagOnly-2” snapshot.
This shows a nearby slice in follow-up with longer LD
-Registration error?
-Tumor growth?
* Load a MRML scene* Compare volumetric measurements* Switch layouts & make linear measurements* Switch layouts & analyze follow-up* Assessment* Summary
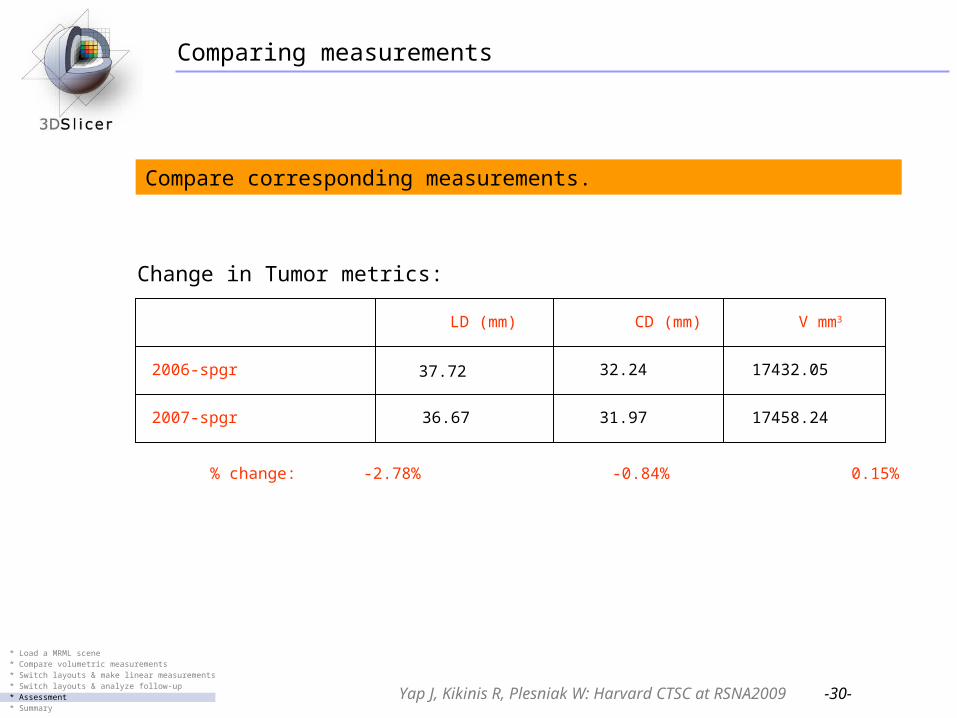
Comparing measurements
Yap J, Kikinis R, Plesniak W: Harvard CTSC at RSNA2009 -30-
Compare corresponding measurements.
Change in Tumor metrics:
2007-spgr
2006-spgr
V mm3CD (mm)LD (mm)
17458.24
17432.05
31.9736.67
32.2437.72
% change: -2.78% -0.84% 0.15%
* Load a MRML scene* Compare volumetric measurements* Switch layouts & make linear measurements* Switch layouts & analyze follow-up* Assessment* Summary
Assessment
Using the RECIST assessment criteria:SD (stable disease) = small changes that do not meet above criteria
Say something here about efficacy and limitations of RECIST.
What can it capture,
What does it not capture as well.
Yap J, Kikinis R, Plesniak W: Harvard CTSC at RSNA2009 -31-
(Develop content here: discuss)
* Load a MRML scene* Compare volumetric measurements* Switch layouts & make linear measurements* Switch layouts & analyze follow-up* Assessment* Summary
Assessment: Other tools to assess changes in tumor metrics
Yap J, Kikinis R, Plesniak W: Harvard CTSC at RSNA2009 -32-
Segue into Change Tracker tutorial.
Provide a link to the tutorial and tutorial data.
(Develop content here: discuss)
* Load a MRML scene* Compare volumetric measurements* Switch layouts & make linear measurements* Switch layouts & analyze follow-up* Assessment* Summary
SummarySummary of activity:
• Used interactive interface to load a scene• Performed a workflow to make quantitative measures of tumor response to therapy including:
--linear measurements --volume measurements
Yap J, Kikinis R, Plesniak W: Harvard CTSC at RSNA2009 -32-
* Load a MRML scene* Compare volumetric measurements* Switch layouts & make linear measurements* Switch layouts & analyze follow-up* Assessment* Summary
Acknowledgments
Harvard Clinical and Translational Science Center
National Alliance for Medical Image ComputingNIH U54EB005149
Neuroimage Analysis Center (NAC)
National Center for Image-Guided Therapy (NCIGT)
Surgical Planning Laboratory, Brigham and Women’s Hospital