
STANDARD PRESENTATION COVER LOREM IPSUM DOLOR - Merrill Lynch€¦ · rebound. BofA Merrill Lynch...
52
Life’s better when we’re connected® Market Quarterly CIO Reports Q2 2015
Transcript of STANDARD PRESENTATION COVER LOREM IPSUM DOLOR - Merrill Lynch€¦ · rebound. BofA Merrill Lynch...
Life’s better when we’re connected®
Market Quarterly
CIO Reports
Q2 2015
2 Q2 - 2015 Market Quarterly – CIO Reports
The opinions expressed in this material are strictly those of Merrill Lynch Investment Management & Guidance Group (IMG), are made as of the date of this material and are subject to change without notice. Other affiliates may have opinions that are different from and/or inconsistent with the opinions expressed herein and may have banking, lending, and/or commercial relationships with the companies that are mentioned here.
This material was prepared by IMG and is not a publication of BofA Merrill Lynch Global Research. The views expressed are those of IMG only and are subject to change. This information should not be construed as investment advice. It is presented for information purposes only and is not intended to be either a specific offer by any Merrill Lynch entity to sell or provide, or a specific invitation for a consumer to apply for, any particular retail financial product or service that may be available.
Merrill Lynch makes available products and services offered by Merrill Lynch, Pierce, Fenner & Smith Incorporated (“MLPF&S”), a registered broker-dealer, member SIPC and a wholly owned subsidiary of Bank of America Corporation (“BofA Corp”), and other subsidiaries of BofA Corp. Merrill Lynch Life Agency Inc. (“MLLA“) is a licensed insurance agency and a wholly owned subsidiary of BofA Corp.
Investment products offered through MLPF&S and insurance and annuity products offered through MLLA:
© 2015 Bank of America Corporation. All rights reserved.
Are Not FDIC Insured Are Not Bank Guaranteed May Lose Value
Are Not Deposits Are Not Insured By Any Federal Government Agency Are Not a Condition to Any Banking Service or Activity
ARGT36PL
3 Q2 - 2015 Market Quarterly – CIO Reports
Table of Contents
Overview
Executive Summary 4
Market Outlook 5
Market Review 6
In Focus
The Wealth Allocation Framework 7
Office of the CIO Outlook 8
Global growth remains stable 9
Equities and bond yields rally 10
Volatility is picking up 11
Municipal bonds look attractive for taxable investors 12
A Transforming World
Five macro themes 13
Investment themes 14
The hunt for yield has pushed investors out on the risk curve 15
U.S. innovation is a source of competitive advantage 16
U.S. energy independence is a long-term theme 17
The Longevity Revolution shifts consumer spending 18
Emerging Market reforms remain in focus 19
Macro
The labor market continues to heal 20
Interest rates should stay lower for longer 21
U.S. fiscal health improves 22
Consumer net worth strengthens 23
Housing sector continues to heal 24
Companies are putting cash to use 25
Equities
U.S. equity returns may be lower going forward 26
International developed markets provide opportunities 27
The U.S. earnings outlook has weakened 28
Health Care led in Q2, while Utilities suffered 29
Technology is favored, and Health Care offers opportunities 30
Winners and losers in Emerging Markets 31
Fixed Income
Yields rallied in Q2 32
Interest rates should remain lower for longer 33
Alternative Investments
Hedge funds can provide diversification 34
Private equity deal volume is rising 35
Commodities face headwinds 36
Currencies – the dollar is expected to remain firm 37
Portfolio Management
Core Asset Allocation Changes 38
Merrill Lynch Asset Class Return Assumptions 39
Historical Asset Class Performance 40
Appendix 41
4 Q2 - 2015 Market Quarterly – CIO Reports
0 3 6 9
12 15 18
2015 2016
Number of participants who believe the first rate hike will be in the specified year
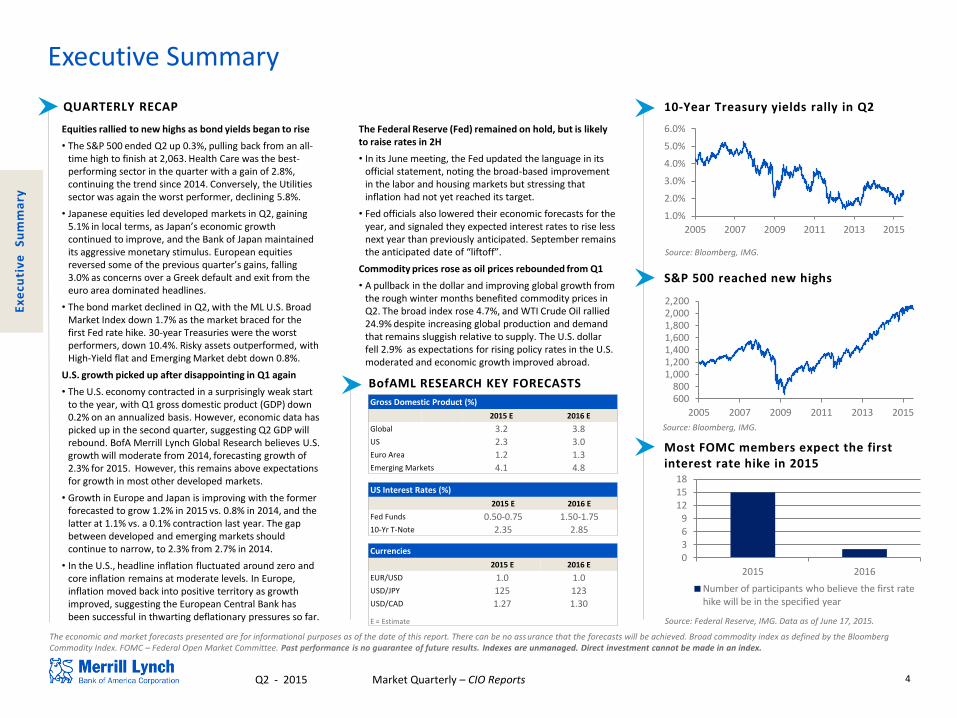
Equities rallied to new highs as bond yields began to rise
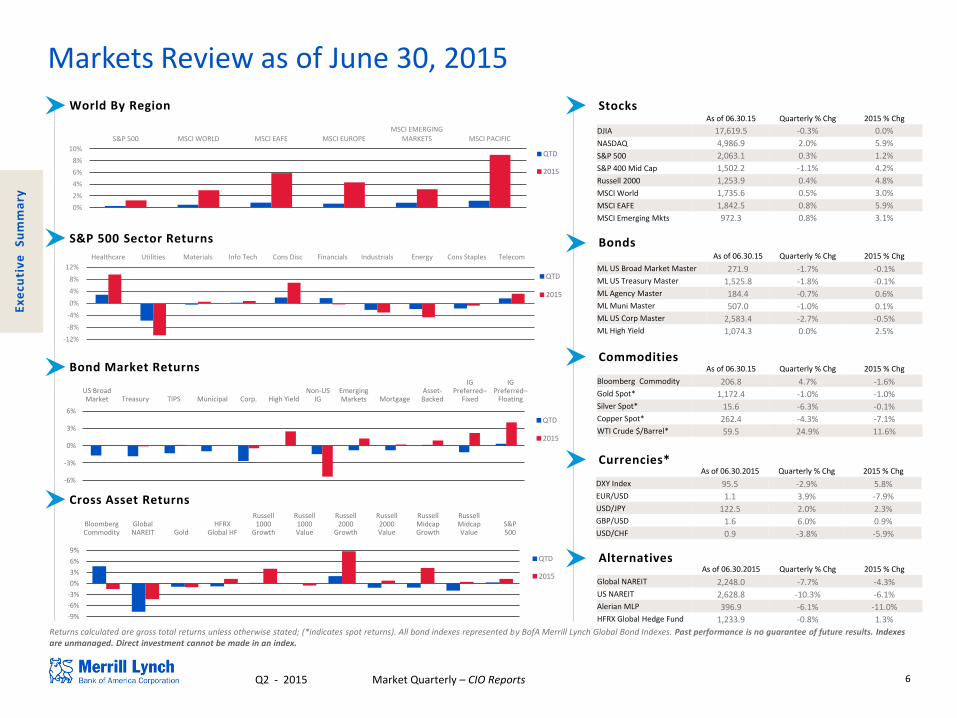
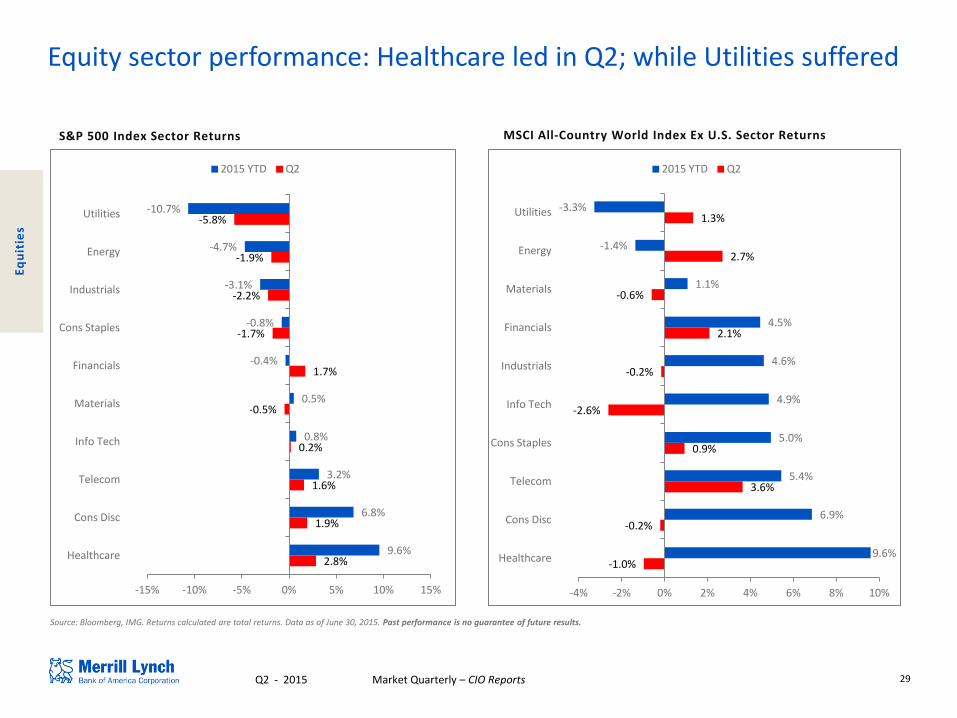
• The S&P 500 ended Q2 up 0.3%, pulling back from an all-time high to finish at 2,063. Health Care was the best-performing sector in the quarter with a gain of 2.8%, continuing the trend since 2014. Conversely, the Utilities sector was again the worst performer, declining 5.8%.
• Japanese equities led developed markets in Q2, gaining 5.1% in local terms, as Japan’s economic growth continued to improve, and the Bank of Japan maintained its aggressive monetary stimulus. European equities reversed some of the previous quarter’s gains, falling 3.0% as concerns over a Greek default and exit from the euro area dominated headlines.
• The bond market declined in Q2, with the ML U.S. Broad Market Index down 1.7% as the market braced for the first Fed rate hike. 30-year Treasuries were the worst performers, down 10.4%. Risky assets outperformed, with High-Yield flat and Emerging Market debt down 0.8%.
U.S. growth picked up after disappointing in Q1 again
• The U.S. economy contracted in a surprisingly weak start to the year, with Q1 gross domestic product (GDP) down 0.2% on an annualized basis. However, economic data has picked up in the second quarter, suggesting Q2 GDP will rebound. BofA Merrill Lynch Global Research believes U.S. growth will moderate from 2014, forecasting growth of 2.3% for 2015. However, this remains above expectations for growth in most other developed markets.
• Growth in Europe and Japan is improving with the former forecasted to grow 1.2% in 2015 vs. 0.8% in 2014, and the latter at 1.1% vs. a 0.1% contraction last year. The gap between developed and emerging markets should continue to narrow, to 2.3% from 2.7% in 2014.
• In the U.S., headline inflation fluctuated around zero and core inflation remains at moderate levels. In Europe, inflation moved back into positive territory as growth improved, suggesting the European Central Bank has been successful in thwarting deflationary pressures so far.
The Federal Reserve (Fed) remained on hold, but is likely to raise rates in 2H
• In its June meeting, the Fed updated the language in its official statement, noting the broad-based improvement in the labor and housing markets but stressing that inflation had not yet reached its target.
• Fed officials also lowered their economic forecasts for the year, and signaled they expected interest rates to rise less next year than previously anticipated. September remains the anticipated date of “liftoff”.
Commodity prices rose as oil prices rebounded from Q1
• A pullback in the dollar and improving global growth from the rough winter months benefited commodity prices in Q2. The broad index rose 4.7%, and WTI Crude Oil rallied 24.9% despite increasing global production and demand that remains sluggish relative to supply. The U.S. dollar fell 2.9% as expectations for rising policy rates in the U.S. moderated and economic growth improved abroad.
Most FOMC members expect the first interest rate hike in 2015
QUARTERLY RECAP 10-Year Treasury yields rally in Q2
BofAML RESEARCH KEY FORECASTS
S&P 500 reached new highs
Gross Domestic Product (%)
2015 E 2016 E
Global 3.2 3.8 US 2.3 3.0 Euro Area 1.2 1.3 Emerging Markets 4.1 4.8
US Interest Rates (%)
2015 E 2016 E
Fed Funds 0.50-0.75 1.50-1.75 10-Yr T-Note 2.35 2.85
Currencies
2015 E 2016 E
EUR/USD 1.0 1.0 USD/JPY 125 123 USD/CAD 1.27 1.30
E = Estimate Source: Federal Reserve, IMG. Data as of June 17, 2015.
Source: Bloomberg, IMG.
Source: Bloomberg, IMG.
Ex
ecu
tiv
e
Su
mm
ary
Executive Summary
The economic and market forecasts presented are for informational purposes as of the date of this report. There can be no assurance that the forecasts will be achieved. Broad commodity index as defined by the Bloomberg Commodity Index. FOMC – Federal Open Market Committee. Past performance is no guarantee of future results. Indexes are unmanaged. Direct investment cannot be made in an index.
600 800
1,000 1,200 1,400 1,600 1,800 2,000 2,200
2005 2007 2009 2011 2013 2015
1.0%
2.0%
3.0%
4.0%
5.0%
6.0%
2005 2007 2009 2011 2013 2015
5 Q2 - 2015 Market Quarterly – CIO Reports
CIO Market Outlook
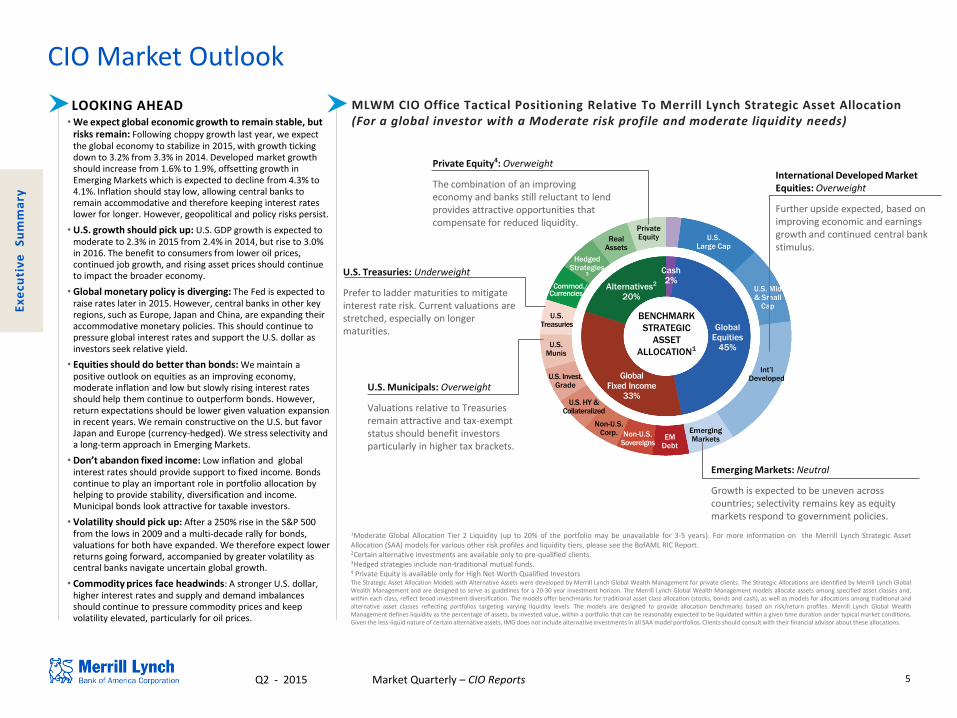
• We expect global economic growth to remain stable, but risks remain: Following choppy growth last year, we expect the global economy to stabilize in 2015, with growth ticking down to 3.2% from 3.3% in 2014. Developed market growth should increase from 1.6% to 1.9%, offsetting growth in Emerging Markets which is expected to decline from 4.3% to 4.1%. Inflation should stay low, allowing central banks to remain accommodative and therefore keeping interest rates lower for longer. However, geopolitical and policy risks persist.
• U.S. growth should pick up: U.S. GDP growth is expected to moderate to 2.3% in 2015 from 2.4% in 2014, but rise to 3.0% in 2016. The benefit to consumers from lower oil prices, continued job growth, and rising asset prices should continue to impact the broader economy.
• Global monetary policy is diverging: The Fed is expected to raise rates later in 2015. However, central banks in other key regions, such as Europe, Japan and China, are expanding their accommodative monetary policies. This should continue to pressure global interest rates and support the U.S. dollar as investors seek relative yield.
• Equities should do better than bonds: We maintain a positive outlook on equities as an improving economy, moderate inflation and low but slowly rising interest rates should help them continue to outperform bonds. However, return expectations should be lower given valuation expansion in recent years. We remain constructive on the U.S. but favor Japan and Europe (currency-hedged). We stress selectivity and a long-term approach in Emerging Markets.
• Don’t abandon fixed income: Low inflation and global interest rates should provide support to fixed income. Bonds continue to play an important role in portfolio allocation by helping to provide stability, diversification and income. Municipal bonds look attractive for taxable investors.
• Volatility should pick up: After a 250% rise in the S&P 500 from the lows in 2009 and a multi-decade rally for bonds, valuations for both have expanded. We therefore expect lower returns going forward, accompanied by greater volatility as central banks navigate uncertain global growth.
• Commodity prices face headwinds: A stronger U.S. dollar, higher interest rates and supply and demand imbalances should continue to pressure commodity prices and keep volatility elevated, particularly for oil prices.
LOOKING AHEAD
1Moderate Global Allocation Tier 2 Liquidity (up to 20% of the portfolio may be unavailable for 3-5 years). For more information on the Merrill Lynch Strategic Asset Allocation (SAA) models for various other risk profiles and liquidity tiers, please see the BofAML RIC Report. 2Certain alternative investments are available only to pre-qualified clients. 3Hedged strategies include non-traditional mutual funds. 4 Private Equity is available only for High Net Worth Qualified Investors
The Strategic Asset Allocation Models with Alternative Assets were developed by Merrill Lynch Global Wealth Management for private clients. The Strategic Allocations are identified by Merrill Lynch Global Wealth Management and are designed to serve as guidelines for a 20-30 year investment horizon. The Merrill Lynch Global Wealth Management models allocate assets among specified asset classes and, within each class, reflect broad investment diversification. The models offer benchmarks for traditional asset class allocation (stocks, bonds and cash), as well as models for allocations among traditional and alternative asset classes reflecting portfolios targeting varying liquidity levels. The models are designed to provide allocation benchmarks based on risk/return profiles. Merrill Lynch Global Wealth Management defines liquidity as the percentage of assets, by invested value, within a portfolio that can be reasonably expected to be liquidated within a given time duration under typical market conditions. Given the less-liquid nature of certain alternative assets, IMG does not include alternative investments in all SAA model portfolios. Clients should consult with their financial advisor about these allocations.
Ex
ecu
tiv
e
Su
mm
ary
MLWM CIO Office Tactical Positioning Relative To Merrill Lynch Strategic Asset Allocation (For a global investor with a Moderate risk profile and moderate liquidity needs)
BENCHMARK
STRATEGIC
ASSET
ALLOCATION1
Alternatives2
20%
Cash 2%
Global Equities
45%
Global Fixed Income
33%
International Developed Market Equities: Overweight
Further upside expected, based on improving economic and earnings growth and continued central bank stimulus.
Private Equity4: Overweight
The combination of an improving economy and banks still reluctant to lend provides attractive opportunities that compensate for reduced liquidity.
U.S. Treasuries: Underweight
Prefer to ladder maturities to mitigate interest rate risk. Current valuations are stretched, especially on longer maturities.
U.S. Municipals: Overweight
Valuations relative to Treasuries remain attractive and tax-exempt status should benefit investors particularly in higher tax brackets.
Emerging Markets: Neutral
Growth is expected to be uneven across countries; selectivity remains key as equity markets respond to government policies.
U.S. Large Cap
U.S. Mid & Small
Cap
U.S. Treasuries
U.S. Munis
U.S. Invest. Grade
U.S. HY & Collateralized
Non-U.S. Corp. Non-U.S.
Sovereigns EM
Debt
Emerging Markets
Int’l Developed
Commod./
Private Equity Real
Assets
Hedged Strategies
3
Currencies
6 Q2 - 2015 Market Quarterly – CIO Reports
S&P 500 Sector Returns
Bond Market Returns
Bonds
Commodities
Currencies*
Alternatives
Cross Asset Returns
Returns calculated are gross total returns unless otherwise stated; (*indicates spot returns). All bond indexes represented by BofA Merrill Lynch Global Bond Indexes. Past performance is no guarantee of future results. Indexes are unmanaged. Direct investment cannot be made in an index.
Stocks World By Region
US Broad Market Treasury TIPS Municipal Corp. High Yield
Non-US IG
Emerging Markets Mortgage
Asset-Backed
IG Preferred–
Fixed
IG Preferred–
Floating
Bloomberg Commodity
Global NAREIT Gold
HFRX Global HF
Russell 1000
Growth
Russell 1000 Value
Russell 2000
Growth
Russell 2000 Value
Russell Midcap Growth
Russell Midcap Value
S&P 500
Markets Review as of June 30, 2015
Ex
ecu
tiv
e
Su
mm
ary
As of 06.30.15 Quarterly % Chg 2015 % Chg
DJIA 17,619.5 -0.3% 0.0%
NASDAQ 4,986.9 2.0% 5.9%
S&P 500 2,063.1 0.3% 1.2%
S&P 400 Mid Cap 1,502.2 -1.1% 4.2%
Russell 2000 1,253.9 0.4% 4.8%
MSCI World 1,735.6 0.5% 3.0%
MSCI EAFE 1,842.5 0.8% 5.9%
MSCI Emerging Mkts 972.3 0.8% 3.1%
As of 06.30.15 Quarterly % Chg 2015 % Chg
ML US Broad Market Master 271.9 -1.7% -0.1%
ML US Treasury Master 1,525.8 -1.8% -0.1%
ML Agency Master 184.4 -0.7% 0.6%
ML Muni Master 507.0 -1.0% 0.1%
ML US Corp Master 2,583.4 -2.7% -0.5%
ML High Yield 1,074.3 0.0% 2.5%
As of 06.30.15 Quarterly % Chg 2015 % Chg
Bloomberg Commodity 206.8 4.7% -1.6%
Gold Spot* 1,172.4 -1.0% -1.0%
Silver Spot* 15.6 -6.3% -0.1%
Copper Spot* 262.4 -4.3% -7.1%
WTI Crude $/Barrel* 59.5 24.9% 11.6%
As of 06.30.2015 Quarterly % Chg 2015 % Chg
DXY Index 95.5 -2.9% 5.8%
EUR/USD 1.1 3.9% -7.9%
USD/JPY 122.5 2.0% 2.3%
GBP/USD 1.6 6.0% 0.9%
USD/CHF 0.9 -3.8% -5.9%
As of 06.30.2015 Quarterly % Chg 2015 % Chg
Global NAREIT 2,248.0 -7.7% -4.3%
US NAREIT 2,628.8 -10.3% -6.1%
Alerian MLP 396.9 -6.1% -11.0%
HFRX Global Hedge Fund 1,233.9 -0.8% 1.3%
0%
2%
4%
6%
8%
10%
S&P 500 MSCI WORLD MSCI EAFE MSCI EUROPE MSCI EMERGING
MARKETS MSCI PACIFIC
QTD
2015
-12%
-8%
-4%
0%
4%
8%
12%
Healthcare Utilities Materials Info Tech Cons Disc Financials Industrials Energy Cons Staples Telecom
QTD
2015
-6%
-3%
0%
3%
6% QTD
2015
-9%
-6%
-3%
0%
3%
6%
9% QTD
2015
7 Q2 - 2015 Market Quarterly – CIO Reports
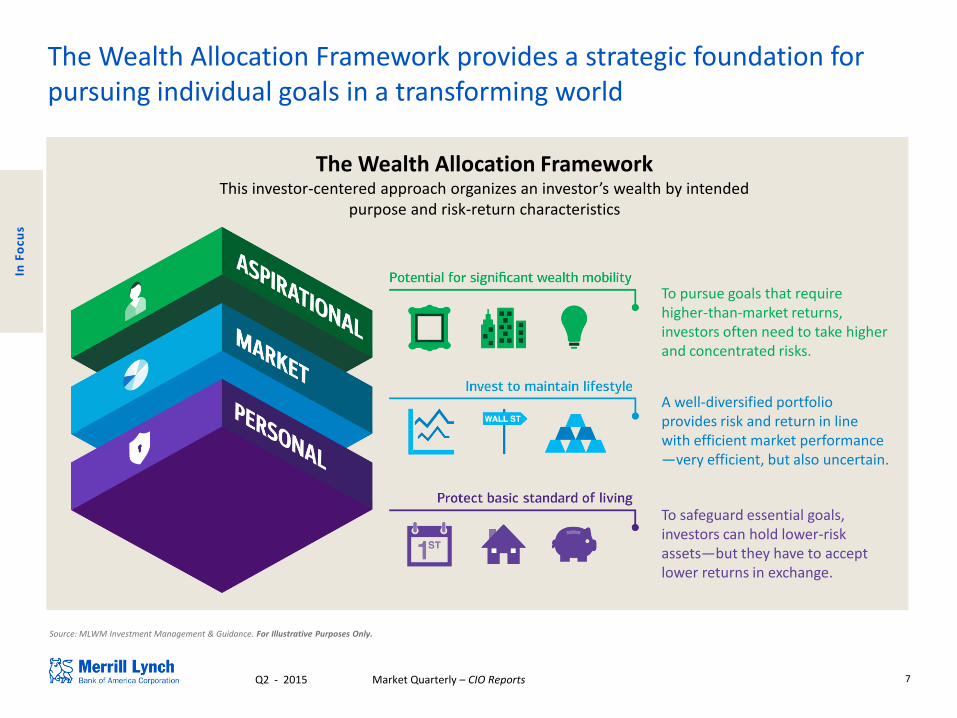
The Wealth Allocation Framework provides a strategic foundation for pursuing individual goals in a transforming world
The Wealth Allocation Framework This investor-centered approach organizes an investor’s wealth by intended
purpose and risk-return characteristics
To pursue goals that require higher-than-market returns, investors often need to take higher and concentrated risks.
A well-diversified portfolio provides risk and return in line with efficient market performance —very efficient, but also uncertain.
To safeguard essential goals, investors can hold lower-risk assets—but they have to accept lower returns in exchange.
Source: MLWM Investment Management & Guidance. For Illustrative Purposes Only.
In F
ocu
s
8 Q2 - 2015 Market Quarterly – CIO Reports
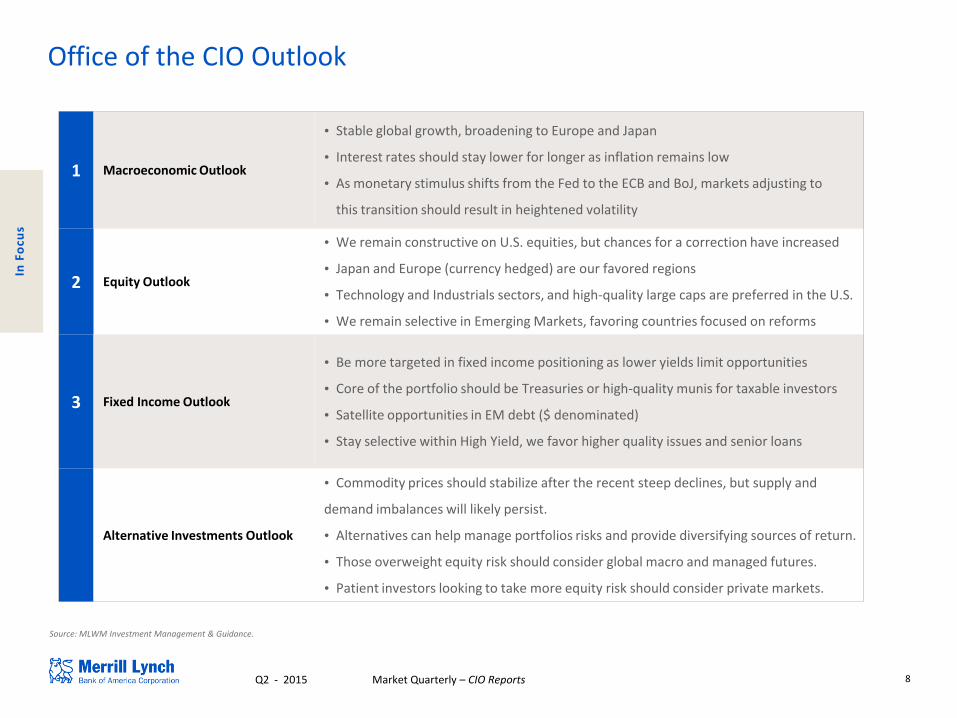
Office of the CIO Outlook
1 Macroeconomic Outlook
• Stable global growth, broadening to Europe and Japan
• Interest rates should stay lower for longer as inflation remains low
• As monetary stimulus shifts from the Fed to the ECB and BoJ, markets adjusting to
this transition should result in heightened volatility
2 Equity Outlook
• We remain constructive on U.S. equities, but chances for a correction have increased
• Japan and Europe (currency hedged) are our favored regions
• Technology and Industrials sectors, and high-quality large caps are preferred in the U.S.
• We remain selective in Emerging Markets, favoring countries focused on reforms
3 Fixed Income Outlook
• Be more targeted in fixed income positioning as lower yields limit opportunities
• Core of the portfolio should be Treasuries or high-quality munis for taxable investors
• Satellite opportunities in EM debt ($ denominated)
• Stay selective within High Yield, we favor higher quality issues and senior loans
Alternative Investments Outlook
• Commodity prices should stabilize after the recent steep declines, but supply and
demand imbalances will likely persist.
• Alternatives can help manage portfolios risks and provide diversifying sources of return.
• Those overweight equity risk should consider global macro and managed futures.
• Patient investors looking to take more equity risk should consider private markets.
In F
ocu
s
Source: MLWM Investment Management & Guidance.
9 Q2 - 2015 Market Quarterly – CIO Reports
-1.0
0.0
1.0
2.0
3.0
4.0
5.0
2012 2013 2014 2015 2016
Co
nsu
mer
Pri
ce In
dex
(Yo
Y, %
)
U.S. Japan Eurozone
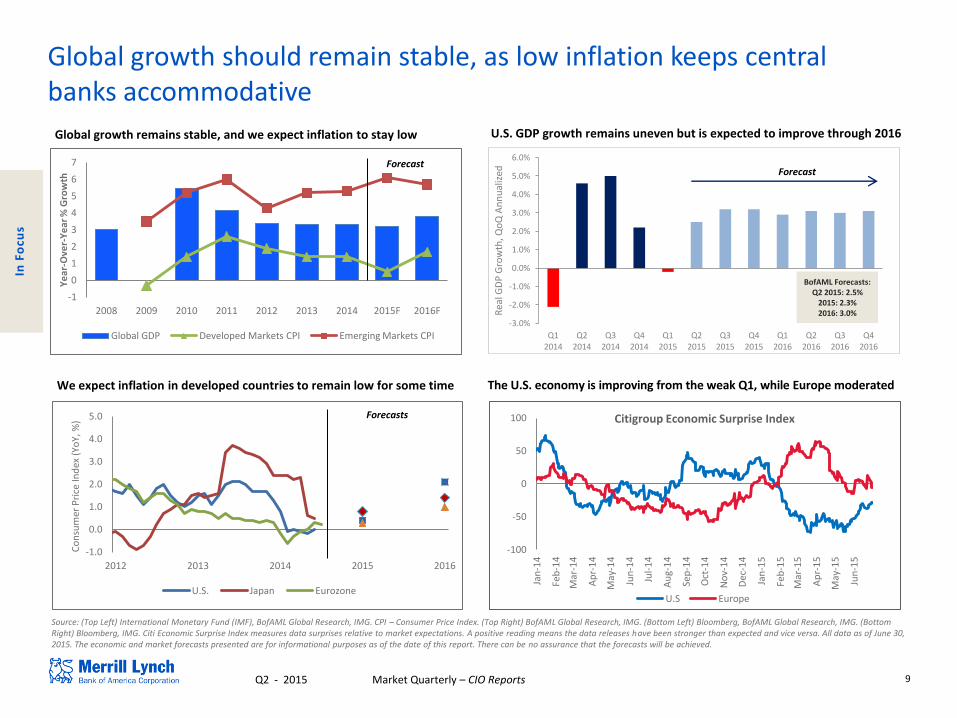
Global growth remains stable, and we expect inflation to stay low U.S. GDP growth remains uneven but is expected to improve through 2016
The U.S. economy is improving from the weak Q1, while Europe moderated
Source: (Top Left) International Monetary Fund (IMF), BofAML Global Research, IMG. CPI – Consumer Price Index. (Top Right) BofAML Global Research, IMG. (Bottom Left) Bloomberg, BofAML Global Research, IMG. (Bottom Right) Bloomberg, IMG. Citi Economic Surprise Index measures data surprises relative to market expectations. A positive reading means the data releases have been stronger than expected and vice versa. All data as of June 30, 2015. The economic and market forecasts presented are for informational purposes as of the date of this report. There can be no assurance that the forecasts will be achieved.
In F
ocu
s
We expect inflation in developed countries to remain low for some time
Forecasts
Global growth should remain stable, as low inflation keeps central banks accommodative
BofAML Forecasts: Q2 2015: 2.5%
2015: 2.3% 2016: 3.0%
-1
0
1
2
3
4
5
6
7
2008 2009 2010 2011 2012 2013 2014 2015F 2016F
Ye
ar-O
ver-
Ye
ar %
Gro
wth
Global GDP Developed Markets CPI Emerging Markets CPI
Forecast
-3.0%
-2.0%
-1.0%
0.0%
1.0%
2.0%
3.0%
4.0%
5.0%
6.0%
Q1 2014
Q2 2014
Q3 2014
Q4 2014
Q1 2015
Q2 2015
Q3 2015
Q4 2015
Q1 2016
Q2 2016
Q3 2016
Q4 2016
Rea
l GD
P G
row
th, Q
oQ
An
nu
aliz
ed
Forecast
-100
-50
0
50
100
Jan
-14
Feb
-14
Mar
-14
Ap
r-1
4
May
-14
Jun
-14
Jul-
14
Au
g-1
4
Sep
-14
Oct
-14
No
v-1
4
Dec
-14
Jan
-15
Feb
-15
Mar
-15
Ap
r-1
5
May
-15
Jun
-15
U.S Europe
Citigroup Economic Surprise Index
10 Q2 - 2015 Market Quarterly – CIO Reports
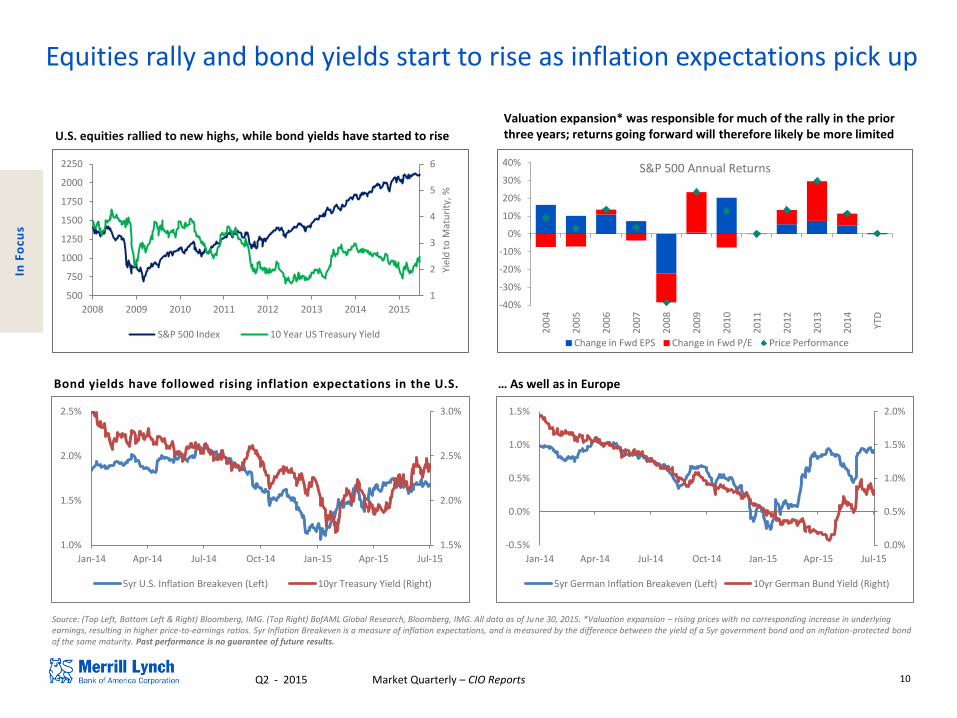
Source: (Top Left, Bottom Left & Right) Bloomberg, IMG. (Top Right) BofAML Global Research, Bloomberg, IMG. All data as of June 30, 2015. *Valuation expansion – rising prices with no corresponding increase in underlying earnings, resulting in higher price-to-earnings ratios. 5yr Inflation Breakeven is a measure of inflation expectations, and is measured by the difference between the yield of a 5yr government bond and an inflation-protected bond of the same maturity. Past performance is no guarantee of future results.
Valuation expansion* was responsible for much of the rally in the prior three years; returns going forward will therefore likely be more limited U.S. equities rallied to new highs, while bond yields have started to rise
In F
ocu
s
Equities rally and bond yields start to rise as inflation expectations pick up
… As well as in Europe Bond yields have followed rising inflation expectations in the U.S.
1.5%
2.0%
2.5%
3.0%
1.0%
1.5%
2.0%
2.5%
Jan-14 Apr-14 Jul-14 Oct-14 Jan-15 Apr-15 Jul-15
5yr U.S. Inflation Breakeven (Left) 10yr Treasury Yield (Right)
0.0%
0.5%
1.0%
1.5%
2.0%
-0.5%
0.0%
0.5%
1.0%
1.5%
Jan-14 Apr-14 Jul-14 Oct-14 Jan-15 Apr-15 Jul-15
5yr German Inflation Breakeven (Left) 10yr German Bund Yield (Right)
1
2
3
4
5
6
500
750
1000
1250
1500
1750
2000
2250
2008 2009 2010 2011 2012 2013 2014 2015
Yiel
d t
o M
atu
rity
, %
S&P 500 Index 10 Year US Treasury Yield
-40%
-30%
-20%
-10%
0%
10%
20%
30%
40%
20
04
20
05
20
06
20
07
20
08
20
09
20
10
20
11
20
12
20
13
20
14
YTD
S&P 500 Annual Returns
Change in Fwd EPS Change in Fwd P/E Price Performance
11 Q2 - 2015 Market Quarterly – CIO Reports
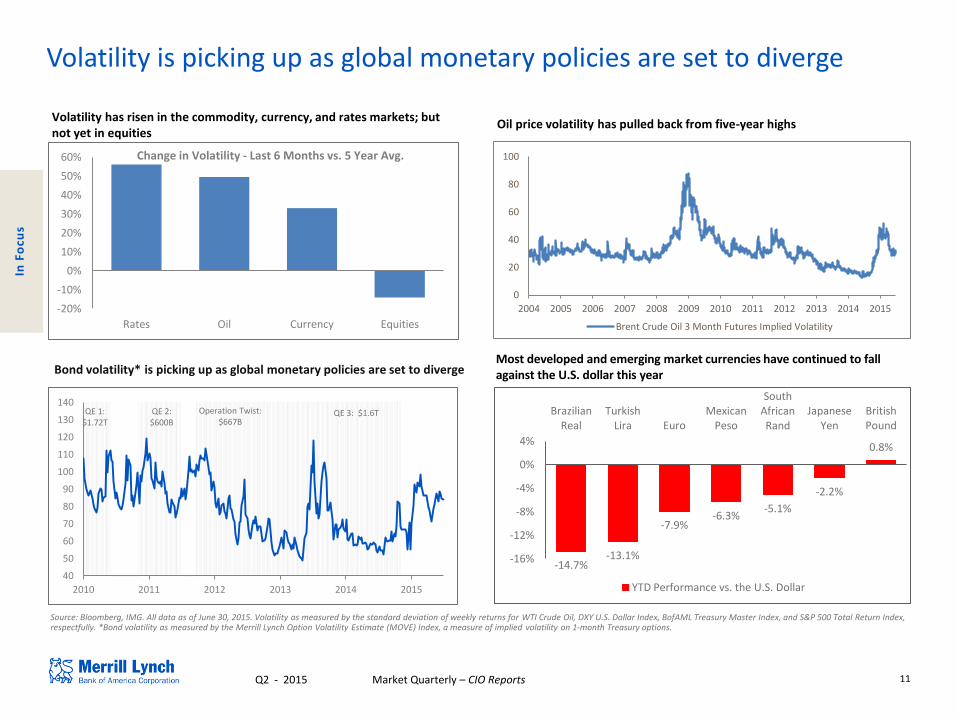
Volatility is picking up as global monetary policies are set to diverge
Source: Bloomberg, IMG. All data as of June 30, 2015. Volatility as measured by the standard deviation of weekly returns for WTI Crude Oil, DXY U.S. Dollar Index, BofAML Treasury Master Index, and S&P 500 Total Return Index, respectfully. *Bond volatility as measured by the Merrill Lynch Option Volatility Estimate (MOVE) Index, a measure of implied volatility on 1-month Treasury options.
Oil price volatility has pulled back from five-year highs
Bond volatility* is picking up as global monetary policies are set to diverge
In F
ocu
s
0
20
40
60
80
100
2004 2005 2006 2007 2008 2009 2010 2011 2012 2013 2014 2015
Brent Crude Oil 3 Month Futures Implied Volatility
Volatility has risen in the commodity, currency, and rates markets; but not yet in equities
Most developed and emerging market currencies have continued to fall against the U.S. dollar this year
-20%
-10%
0%
10%
20%
30%
40%
50%
60%
Rates Oil Currency Equities
Change in Volatility - Last 6 Months vs. 5 Year Avg.
40
50
60
70
80
90
100
110
120
130
140
2010 2011 2012 2013 2014 2015
QE 1: $1.72T
QE 2: $600B
Operation Twist: $667B
QE 3: $1.6T
-14.7% -13.1%
-7.9% -6.3%
-5.1%
-2.2%
0.8%
-16%
-12%
-8%
-4%
0%
4%
Brazilian Real
Turkish Lira Euro
Mexican Peso
South African Rand
Japanese Yen
British Pound
YTD Performance vs. the U.S. Dollar
12 Q2 - 2015 Market Quarterly – CIO Reports
0
200
400
600
800
1000
1200
1400
1600
1800
2000
0
100
200
300
400
500
600
700
2001 2003 2005 2007 2009 2011 2013 2015
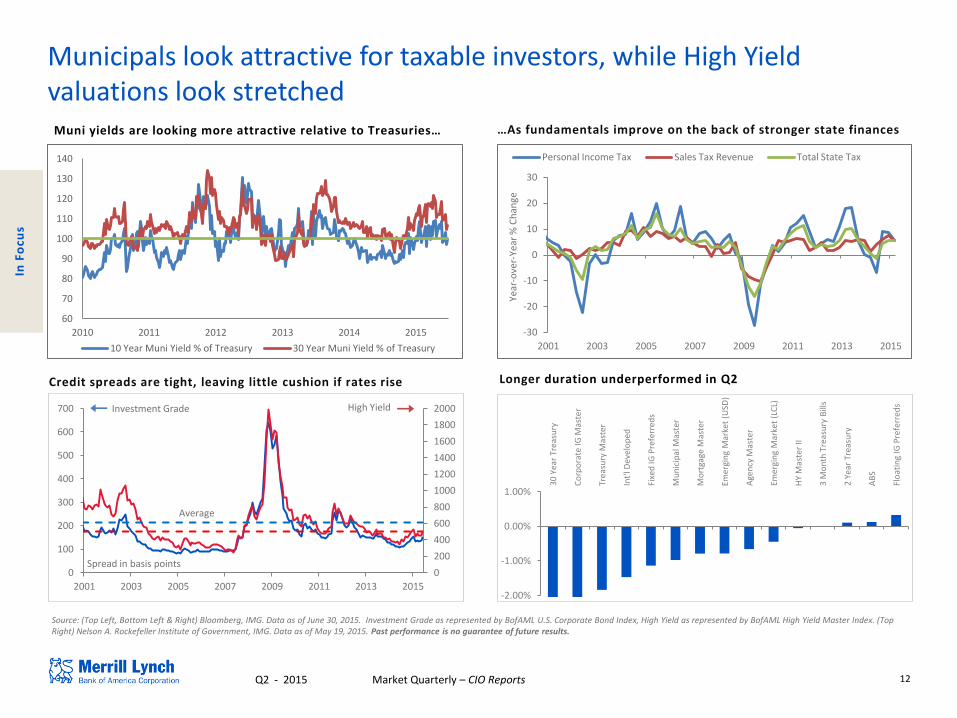
Municipals look attractive for taxable investors, while High Yield valuations look stretched
…As fundamentals improve on the back of stronger state finances Muni yields are looking more attractive relative to Treasuries…
Credit spreads are tight, leaving little cushion if rates rise
High Yield Investment Grade
Spread in basis points
Source: (Top Left, Bottom Left & Right) Bloomberg, IMG. Data as of June 30, 2015. Investment Grade as represented by BofAML U.S. Corporate Bond Index, High Yield as represented by BofAML High Yield Master Index. (Top Right) Nelson A. Rockefeller Institute of Government, IMG. Data as of May 19, 2015. Past performance is no guarantee of future results.
Longer duration underperformed in Q2
In F
ocu
s
Average
-30
-20
-10
0
10
20
30
2001 2003 2005 2007 2009 2011 2013 2015
Year
-ove
r-Ye
ar %
Ch
ange
Personal Income Tax Sales Tax Revenue Total State Tax
60
70
80
90
100
110
120
130
140
2010 2011 2012 2013 2014 2015
10 Year Muni Yield % of Treasury 30 Year Muni Yield % of Treasury
-2.00%
-1.00%
0.00%
1.00%
30 Y
ear
Trea
sury
Co
rpo
rate
IG M
aste
r
Trea
sury
Mas
ter
Int'
l Dev
elo
ped
Fixe
d IG
Pre
ferr
eds
Mu
nic
ipal
Mas
ter
Mo
rtga
ge M
aste
r
Emer
gin
g M
arke
t (U
SD)
Age
ncy
Mas
ter
Emer
gin
g M
arke
t (L
CL)
HY
Mas
ter
II
3 M
on
th T
reas
ury
Bill
s
2 Ye
ar T
reas
ury
AB
S
Flo
atin
g IG
Pre
ferr
eds
13 Q2 - 2015 Market Quarterly – CIO Reports
Source: BofA Merrill Lynch Research, IMG
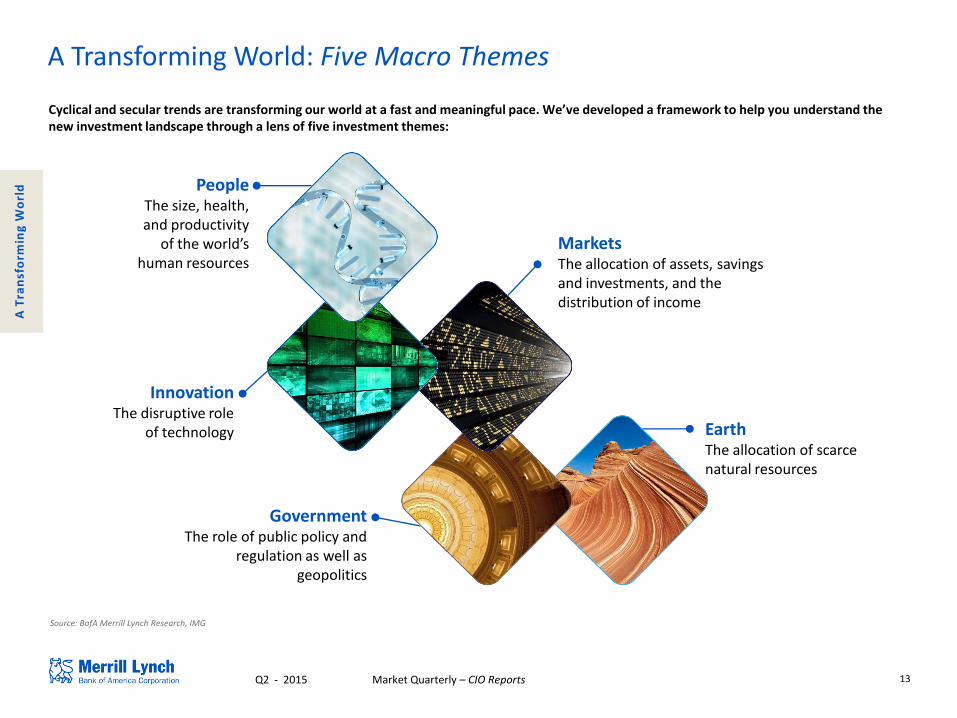
People The size, health, and productivity
of the world’s human resources
Innovation The disruptive role
of technology
Government The role of public policy and
regulation as well as geopolitics
Markets The allocation of assets, savings and investments, and the distribution of income
Earth The allocation of scarce natural resources
A Transforming World: Five Macro Themes
Cyclical and secular trends are transforming our world at a fast and meaningful pace. We’ve developed a framework to help you understand the new investment landscape through a lens of five investment themes:
A T
ran
sfo
rmin
g W
orl
d
14 Q2 - 2015 Market Quarterly – CIO Reports
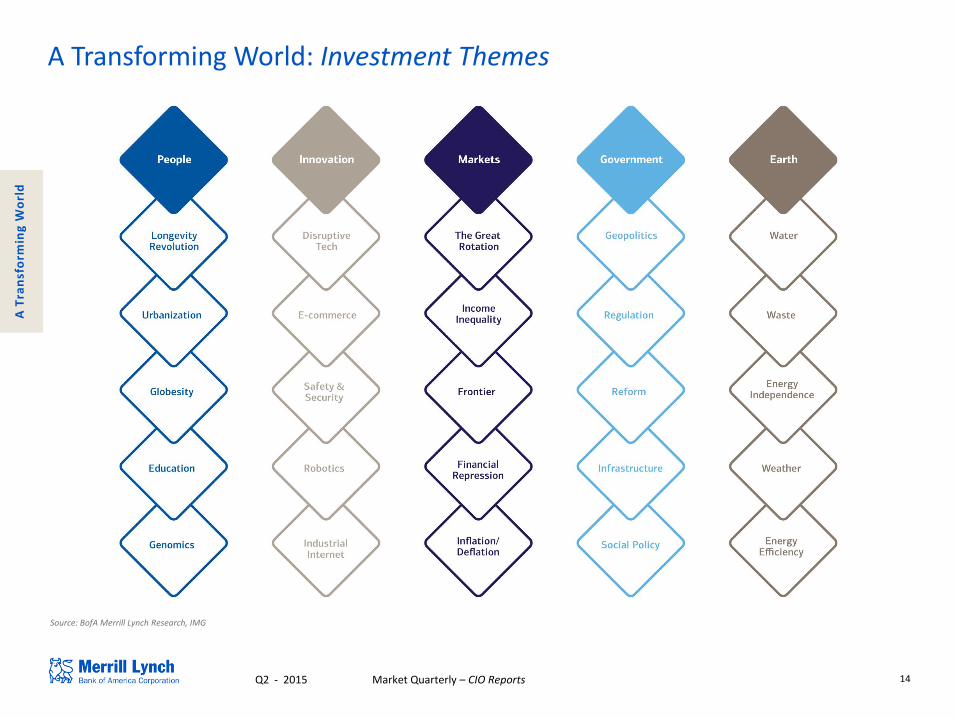
A Transforming World: Investment Themes
Source: BofA Merrill Lynch Research, IMG
A T
ran
sfo
rmin
g W
orl
d
15 Q2 - 2015 Market Quarterly – CIO Reports
Source: (Left) Bloomberg, IMG. Data as of June 30, 2015. (Top Right) BofAML Global Research, IMG. Data as of July 3rd, 2015. *Current dividend yield measured from trailing 12 month dividends. (Bottom Right) IMG. Options are complex instruments that are not suitable for every investor, may involve a high degree of risk, and may be appropriate investments only for sophisticated investors who are capable of understanding and assuming the risks involved. Clients must be options-approved.
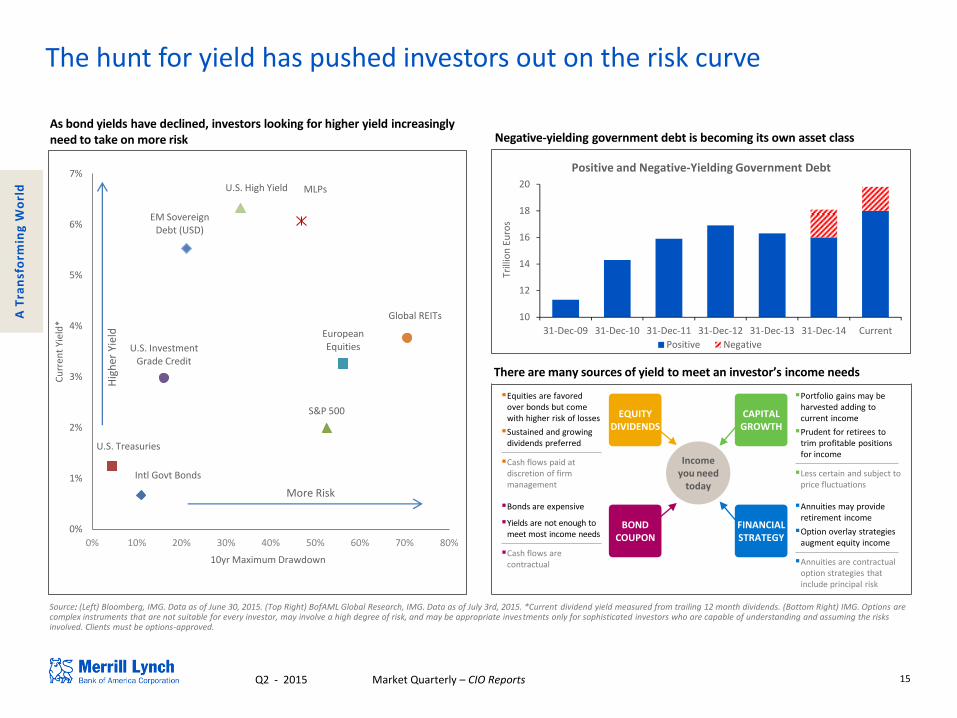
The hunt for yield has pushed investors out on the risk curve
Negative-yielding government debt is becoming its own asset class
10
12
14
16
18
20
31-Dec-09 31-Dec-10 31-Dec-11 31-Dec-12 31-Dec-13 31-Dec-14 Current
Trill
ion
Eu
ros
Positive and Negative-Yielding Government Debt
Positive Negative
As bond yields have declined, investors looking for higher yield increasingly need to take on more risk
Intl Govt Bonds
U.S. Treasuries
S&P 500
U.S. Investment Grade Credit
European Equities
Global REITs
EM Sovereign Debt (USD)
MLPs U.S. High Yield
0%
1%
2%
3%
4%
5%
6%
7%
0% 10% 20% 30% 40% 50% 60% 70% 80%
Cu
rren
t Yi
eld
*
10yr Maximum Drawdown
More Risk
Hig
her
Yie
ld
A T
ran
sfo
rmin
g W
orl
d
There are many sources of yield to meet an investor’s income needs
Equities are favored over bonds but come with higher risk of losses
Sustained and growing dividends preferred
Cash flows paid at discretion of firm management
Bonds are expensive
Yields are not enough to meet most income needs
Cash flows are contractual
Portfolio gains may be harvested adding to current income
Prudent for retirees to trim profitable positions for income
Less certain and subject to price fluctuations
Annuities may provide retirement income
Option overlay strategies augment equity income
Annuities are contractual option strategies that include principal risk
Income you need
today
EQUITY DIVIDENDS
CAPITAL GROWTH
BOND COUPON
FINANCIAL STRATEGY
16 Q2 - 2015 Market Quarterly – CIO Reports
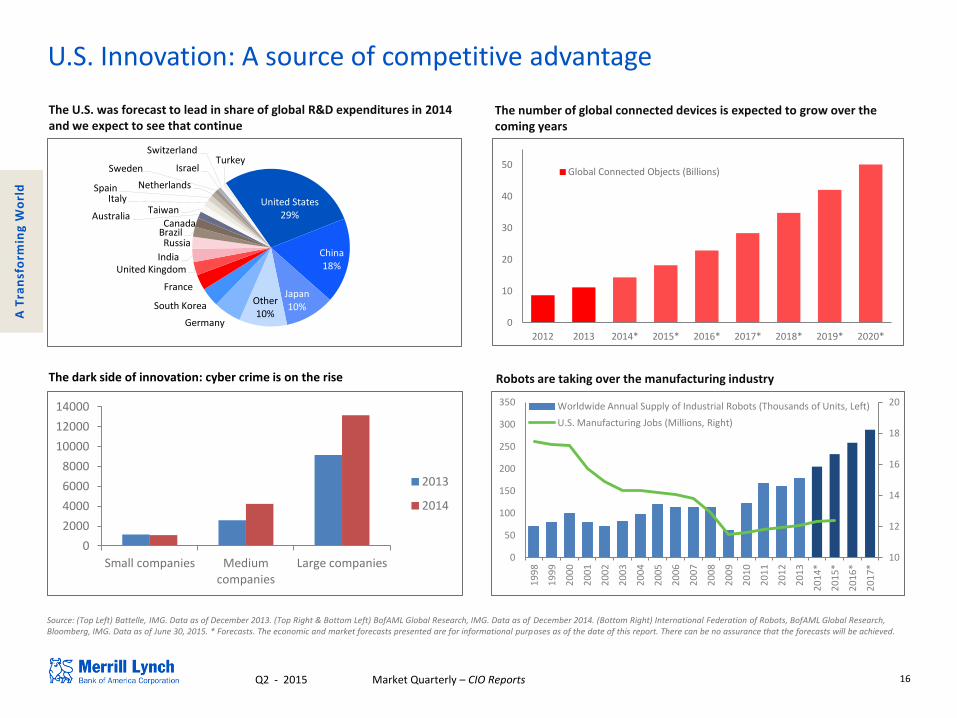
U.S. Innovation: A source of competitive advantage
Source: (Top Left) Battelle, IMG. Data as of December 2013. (Top Right & Bottom Left) BofAML Global Research, IMG. Data as of December 2014. (Bottom Right) International Federation of Robots, BofAML Global Research, Bloomberg, IMG. Data as of June 30, 2015. * Forecasts. The economic and market forecasts presented are for informational purposes as of the date of this report. There can be no assurance that the forecasts will be achieved.
The number of global connected devices is expected to grow over the coming years
The U.S. was forecast to lead in share of global R&D expenditures in 2014 and we expect to see that continue
Robots are taking over the manufacturing industry
United States 29%
China 18%
Japan 10%
Other 10%
Germany
South Korea
France
United Kingdom India
Russia Brazil Canada
Australia Taiwan
Italy Spain Netherlands
Sweden Israel
Switzerland Turkey
A T
ran
sfo
rmin
g W
orl
d
0
10
20
30
40
50
2012 2013 2014* 2015* 2016* 2017* 2018* 2019* 2020*
Global Connected Objects (Billions)
0
2000
4000
6000
8000
10000
12000
14000
Small companies Medium companies
Large companies
2013
2014
The dark side of innovation: cyber crime is on the rise
10
12
14
16
18
20
0
50
100
150
200
250
300
350
19
98
19
99
20
00
20
01
20
02
20
03
20
04
20
05
20
06
20
07
20
08
20
09
20
10
20
11
20
12
20
13
20
14
*
20
15
*
20
16
*
20
17
*
Worldwide Annual Supply of Industrial Robots (Thousands of Units, Left)
U.S. Manufacturing Jobs (Millions, Right)
17 Q2 - 2015 Market Quarterly – CIO Reports
88,000
89,000
90,000
91,000
92,000
93,000
94,000
95,000
96,000
Total World Supply Total World Demand
Barrels/day, Thousands Forecast
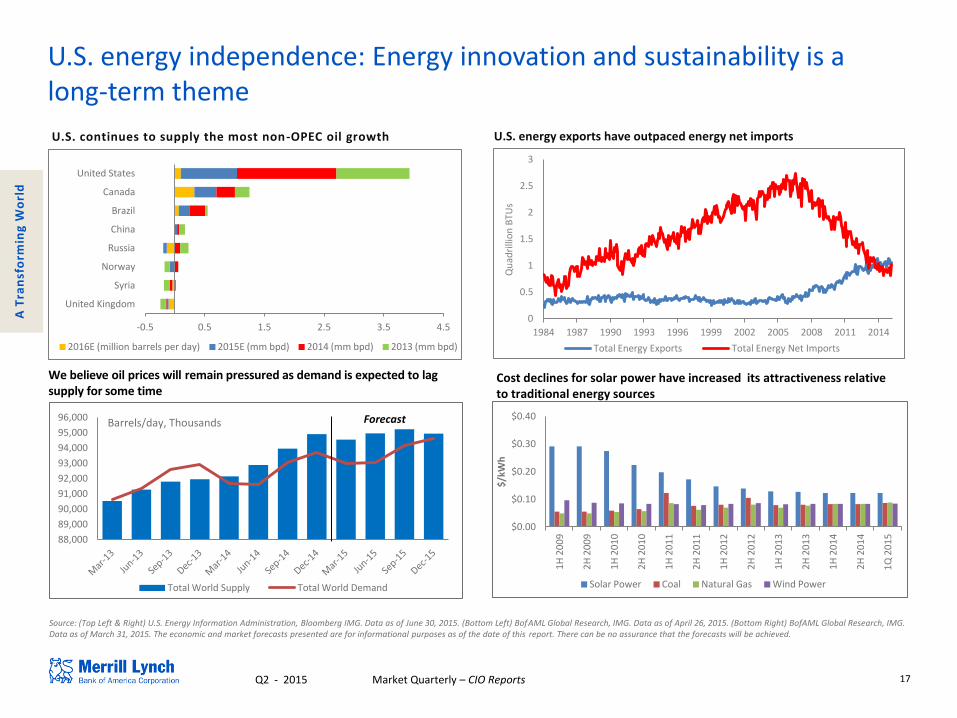
U.S. energy independence: Energy innovation and sustainability is a long-term theme
U.S. energy exports have outpaced energy net imports
Source: (Top Left & Right) U.S. Energy Information Administration, Bloomberg IMG. Data as of June 30, 2015. (Bottom Left) BofAML Global Research, IMG. Data as of April 26, 2015. (Bottom Right) BofAML Global Research, IMG. Data as of March 31, 2015. The economic and market forecasts presented are for informational purposes as of the date of this report. There can be no assurance that the forecasts will be achieved.
Cost declines for solar power have increased its attractiveness relative to traditional energy sources
A T
ran
sfo
rmin
g W
orl
d
U.S. continues to supply the most non-OPEC oil growth
$0.00
$0.10
$0.20
$0.30
$0.40
1H
20
09
2H
20
09
1H
20
10
2H
20
10
1H
20
11
2H
20
11
1H
20
12
2H
20
12
1H
20
13
2H
20
13
1H
20
14
2H
20
14
1Q
20
15
$/k
Wh
Solar Power Coal Natural Gas Wind Power
We believe oil prices will remain pressured as demand is expected to lag supply for some time
0
0.5
1
1.5
2
2.5
3
1984 1987 1990 1993 1996 1999 2002 2005 2008 2011 2014
Qu
adri
llio
n B
TUs
Total Energy Exports Total Energy Net Imports
-0.5 0.5 1.5 2.5 3.5 4.5
United Kingdom
Syria
Norway
Russia
China
Brazil
Canada
United States
2016E (million barrels per day) 2015E (mm bpd) 2014 (mm bpd) 2013 (mm bpd)
18 Q2 - 2015 Market Quarterly – CIO Reports
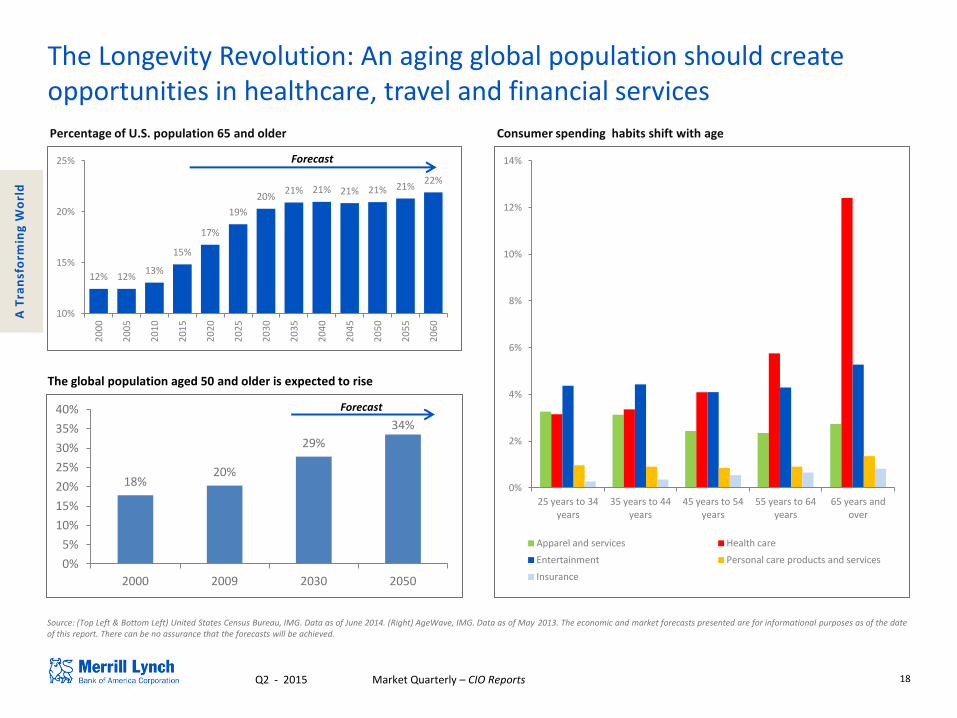
The Longevity Revolution: An aging global population should create opportunities in healthcare, travel and financial services
Percentage of U.S. population 65 and older
Source: (Top Left & Bottom Left) United States Census Bureau, IMG. Data as of June 2014. (Right) AgeWave, IMG. Data as of May 2013. The economic and market forecasts presented are for informational purposes as of the date of this report. There can be no assurance that the forecasts will be achieved.
Consumer spending habits shift with age
0%
2%
4%
6%
8%
10%
12%
14%
25 years to 34 years
35 years to 44 years
45 years to 54 years
55 years to 64 years
65 years and over
Apparel and services Health care
Entertainment Personal care products and services
Insurance
A T
ran
sfo
rmin
g W
orl
d
12% 12% 13%
15%
17%
19%
20% 21% 21% 21% 21% 21%
22%
10%
15%
20%
25%
20
00
20
05
20
10
20
15
20
20
20
25
20
30
20
35
20
40
20
45
20
50
20
55
20
60
Forecast
18% 20%
29%
34%
0%
5%
10%
15%
20%
25%
30%
35%
40%
2000 2009 2030 2050
Forecast
The global population aged 50 and older is expected to rise
19 Q2 - 2015 Market Quarterly – CIO Reports
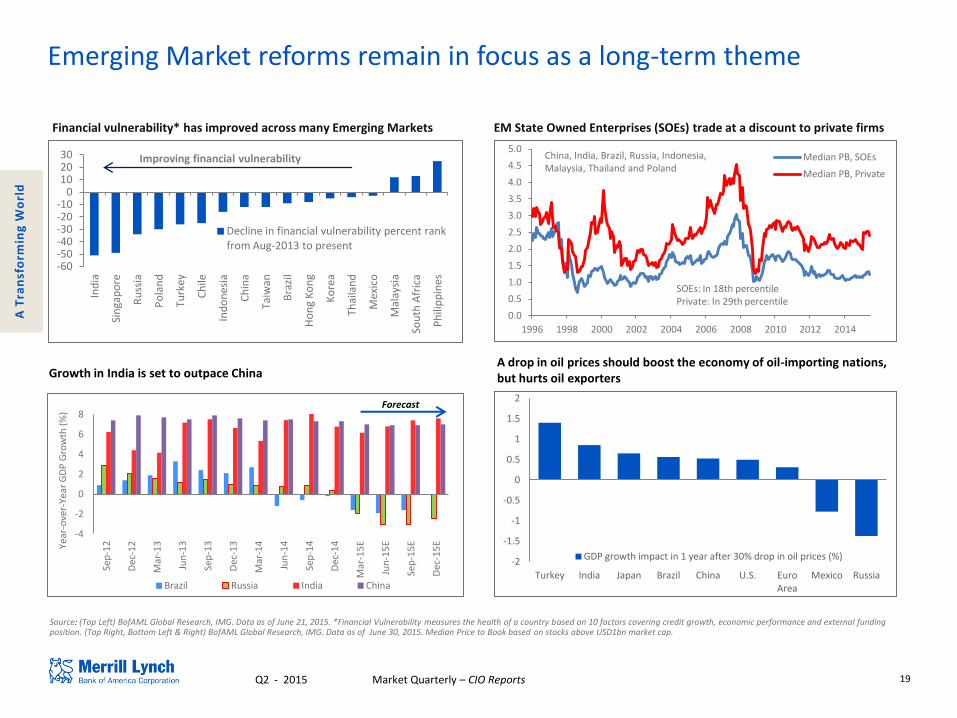
Emerging Market reforms remain in focus as a long-term theme
Financial vulnerability* has improved across many Emerging Markets
Source: (Top Left) BofAML Global Research, IMG. Data as of June 21, 2015. *Financial Vulnerability measures the health of a country based on 10 factors covering credit growth, economic performance and external funding position. (Top Right, Bottom Left & Right) BofAML Global Research, IMG. Data as of June 30, 2015. Median Price to Book based on stocks above USD1bn market cap.
Growth in India is set to outpace China
EM State Owned Enterprises (SOEs) trade at a discount to private firms
A T
ran
sfo
rmin
g W
orl
d
A drop in oil prices should boost the economy of oil-importing nations, but hurts oil exporters
-2
-1.5
-1
-0.5
0
0.5
1
1.5
2
Turkey India Japan Brazil China U.S. Euro Area
Mexico Russia
GDP growth impact in 1 year after 30% drop in oil prices (%)
-60 -50 -40 -30 -20 -10
0 10 20 30
Ind
ia
Sin
gap
ore
Ru
ssia
Po
lan
d
Turk
ey
Ch
ile
Ind
on
esia
Ch
ina
Taiw
an
Bra
zil
Ho
ng
Ko
ng
Ko
rea
Thai
lan
d
Mex
ico
Mal
aysi
a
Sou
th A
fric
a
Ph
ilip
pin
es
Decline in financial vulnerability percent rank from Aug-2013 to present
Improving financial vulnerability
0.0
0.5
1.0
1.5
2.0
2.5
3.0
3.5
4.0
4.5
5.0
1996 1998 2000 2002 2004 2006 2008 2010 2012 2014
Median PB, SOEs
Median PB, Private
SOEs: In 18th percentile Private: In 29th percentile
China, India, Brazil, Russia, Indonesia, Malaysia, Thailand and Poland
-4
-2
0
2
4
6
8
Sep
-12
Dec
-12
Mar
-13
Jun
-13
Sep
-13
Dec
-13
Mar
-14
Jun
-14
Sep
-14
Dec
-14
Mar
-15
E
Jun
-15
E
Sep
-15
E
Dec
-15
E Year
-ove
r-Ye
ar G
DP
Gro
wth
(%
)
Brazil Russia India China
Forecast
20 Q2 - 2015 Market Quarterly – CIO Reports
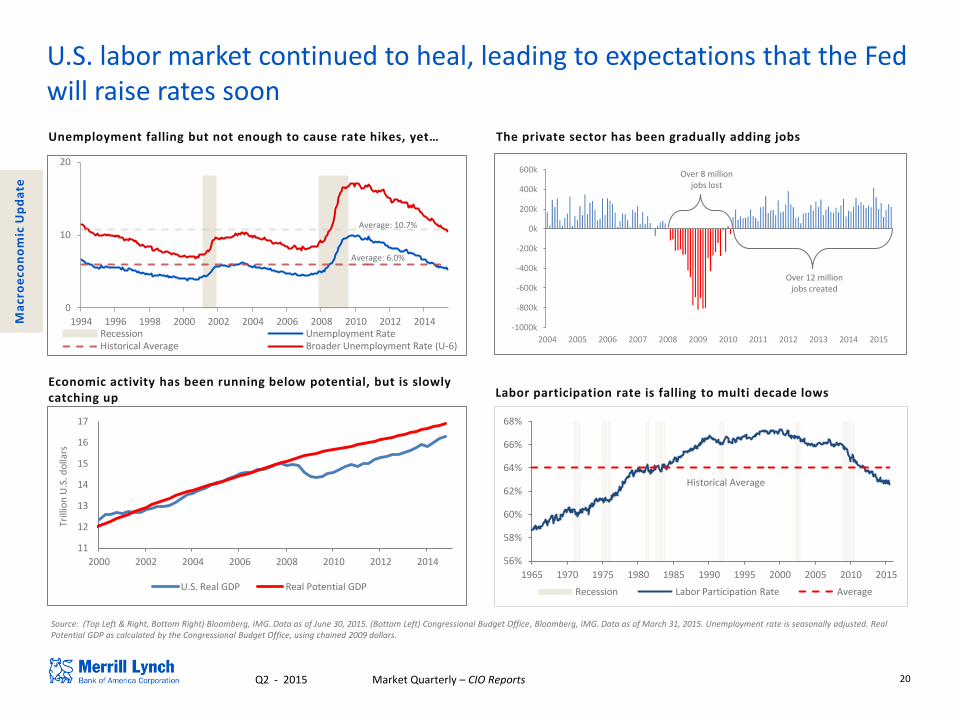
Source: (Top Left & Right, Bottom Right) Bloomberg, IMG. Data as of June 30, 2015. (Bottom Left) Congressional Budget Office, Bloomberg, IMG. Data as of March 31, 2015. Unemployment rate is seasonally adjusted. Real Potential GDP as calculated by the Congressional Budget Office, using chained 2009 dollars.
U.S. labor market continued to heal, leading to expectations that the Fed will raise rates soon
Labor participation rate is falling to multi decade lows
Average: 10.7%
Average: 6.0%
Unemployment falling but not enough to cause rate hikes, yet… The private sector has been gradually adding jobs
Ma
cro
eco
no
mic
Up
da
te
Economic activity has been running below potential, but is slowly catching up
0
10
20
1994 1996 1998 2000 2002 2004 2006 2008 2010 2012 2014 Recession Unemployment Rate Historical Average Broader Unemployment Rate (U-6)
11
12
13
14
15
16
17
2000 2002 2004 2006 2008 2010 2012 2014
Trill
ion
U.S
. do
llars
U.S. Real GDP Real Potential GDP
-1000k
-800k
-600k
-400k
-200k
0k
200k
400k
600k
2004 2005 2006 2007 2008 2009 2010 2011 2012 2013 2014 2015
Over 12 million jobs created
Over 8 million jobs lost
56%
58%
60%
62%
64%
66%
68%
1965 1970 1975 1980 1985 1990 1995 2000 2005 2010 2015
Recession Labor Participation Rate Average
Historical Average
21 Q2 - 2015 Market Quarterly – CIO Reports
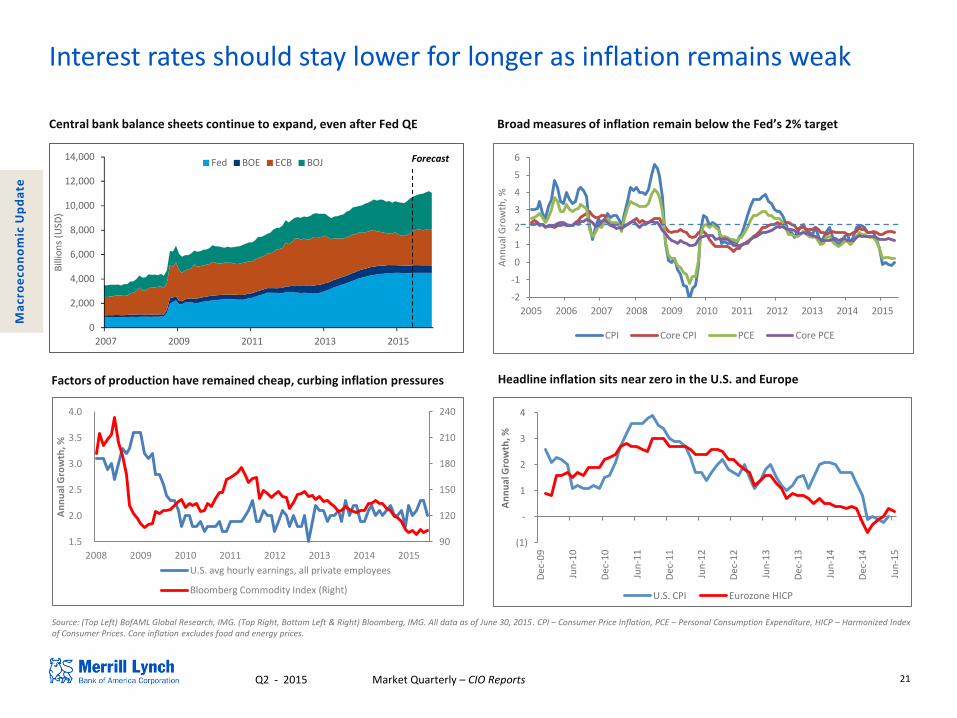
Interest rates should stay lower for longer as inflation remains weak
Headline inflation sits near zero in the U.S. and Europe
Source: (Top Left) BofAML Global Research, IMG. (Top Right, Bottom Left & Right) Bloomberg, IMG. All data as of June 30, 2015. CPI – Consumer Price Inflation, PCE – Personal Consumption Expenditure, HICP – Harmonized Index of Consumer Prices. Core inflation excludes food and energy prices.
Broad measures of inflation remain below the Fed’s 2% target Central bank balance sheets continue to expand, even after Fed QE
Factors of production have remained cheap, curbing inflation pressures
Ma
cro
eco
no
mic
Up
da
te
0
2,000
4,000
6,000
8,000
10,000
12,000
14,000
2007 2009 2011 2013 2015
Bill
ion
s (U
SD)
Fed BOE ECB BOJ Forecast
90
120
150
180
210
240
1.5
2.0
2.5
3.0
3.5
4.0
2008 2009 2010 2011 2012 2013 2014 2015
An
nu
al G
row
th, %
U.S. avg hourly earnings, all private employees
Bloomberg Commodity Index (Right)
-2
-1
0
1
2
3
4
5
6
2005 2006 2007 2008 2009 2010 2011 2012 2013 2014 2015
An
nu
al G
row
th, %
CPI Core CPI PCE Core PCE
(1)
-
1
2
3
4
Dec
-09
Jun
-10
Dec
-10
Jun
-11
Dec
-11
Jun
-12
Dec
-12
Jun
-13
Dec
-13
Jun
-14
Dec
-14
Jun
-15
An
nu
al G
row
th, %
U.S. CPI Eurozone HICP
22 Q2 - 2015 Market Quarterly – CIO Reports
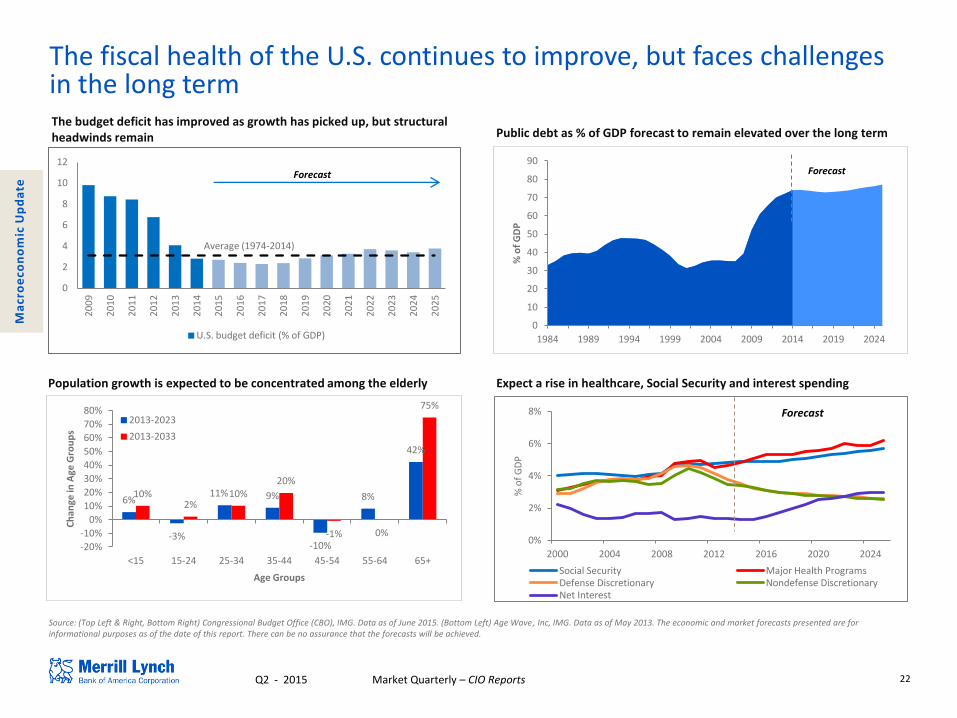
The fiscal health of the U.S. continues to improve, but faces challenges in the long term
Public debt as % of GDP forecast to remain elevated over the long term The budget deficit has improved as growth has picked up, but structural headwinds remain
Source: (Top Left & Right, Bottom Right) Congressional Budget Office (CBO), IMG. Data as of June 2015. (Bottom Left) Age Wave, Inc, IMG. Data as of May 2013. The economic and market forecasts presented are for informational purposes as of the date of this report. There can be no assurance that the forecasts will be achieved.
Population growth is expected to be concentrated among the elderly Expect a rise in healthcare, Social Security and interest spending
6%
-3%
11% 9%
-10%
8%
42%
10% 2%
10% 20%
-1% 0%
75%
-20%
-10%
0%
10%
20%
30%
40%
50%
60%
70%
80%
<15 15-24 25-34 35-44 45-54 55-64 65+
Ch
ange
in A
ge G
rou
ps
Age Groups
2013-2023
2013-2033
Ma
cro
eco
no
mic
Up
da
te
0
10
20
30
40
50
60
70
80
90
1984 1989 1994 1999 2004 2009 2014 2019 2024
% o
f G
DP
Forecast
0
2
4
6
8
10
12
20
09
20
10
20
11
20
12
20
13
20
14
20
15
20
16
20
17
20
18
20
19
20
20
20
21
20
22
20
23
20
24
20
25
U.S. budget deficit (% of GDP)
Average (1974-2014)
Forecast
0%
2%
4%
6%
8%
2000 2004 2008 2012 2016 2020 2024
% o
f G
DP
Social Security Major Health Programs Defense Discretionary Nondefense Discretionary Net Interest
Forecast
23 Q2 - 2015 Market Quarterly – CIO Reports
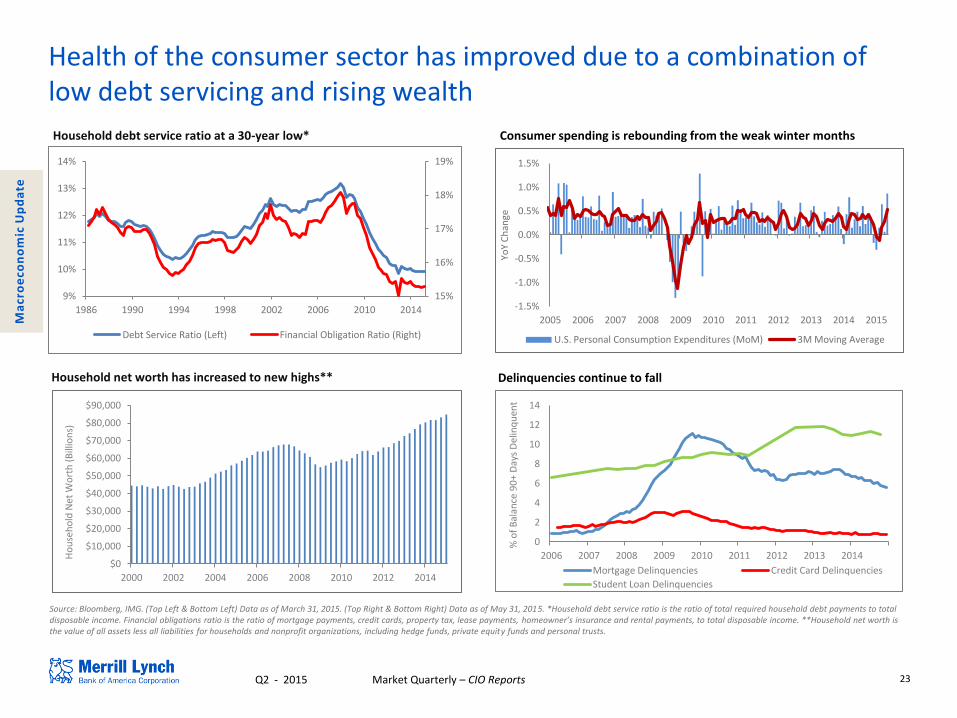
Health of the consumer sector has improved due to a combination of low debt servicing and rising wealth
Household debt service ratio at a 30-year low*
Household net worth has increased to new highs**
Ma
cro
eco
no
mic
Up
da
te
Consumer spending is rebounding from the weak winter months
Delinquencies continue to fall
-1.5%
-1.0%
-0.5%
0.0%
0.5%
1.0%
1.5%
2005 2006 2007 2008 2009 2010 2011 2012 2013 2014 2015
YoY
Ch
ange
U.S. Personal Consumption Expenditures (MoM) 3M Moving Average
0
2
4
6
8
10
12
14
2006 2007 2008 2009 2010 2011 2012 2013 2014
% o
f B
alan
ce 9
0+
Day
s D
elin
qu
ent
Mortgage Delinquencies Credit Card Delinquencies
Student Loan Delinquencies
15%
16%
17%
18%
19%
9%
10%
11%
12%
13%
14%
1986 1990 1994 1998 2002 2006 2010 2014
Debt Service Ratio (Left) Financial Obligation Ratio (Right)
$0
$10,000
$20,000
$30,000
$40,000
$50,000
$60,000
$70,000
$80,000
$90,000
2000 2002 2004 2006 2008 2010 2012 2014
Ho
use
ho
ld N
et W
ort
h (
Bill
ion
s)
Source: Bloomberg, IMG. (Top Left & Bottom Left) Data as of March 31, 2015. (Top Right & Bottom Right) Data as of May 31, 2015. *Household debt service ratio is the ratio of total required household debt payments to total disposable income. Financial obligations ratio is the ratio of mortgage payments, credit cards, property tax, lease payments, homeowner’s insurance and rental payments, to total disposable income. **Household net worth is the value of all assets less all liabilities for households and nonprofit organizations, including hedge funds, private equity funds and personal trusts.
24 Q2 - 2015 Market Quarterly – CIO Reports
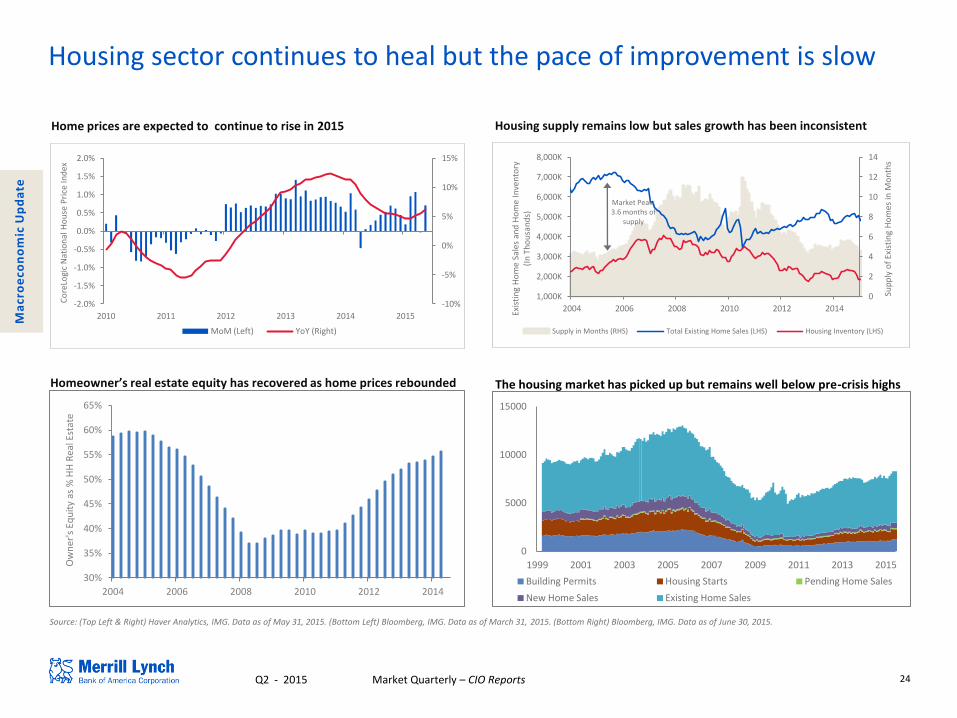
Housing sector continues to heal but the pace of improvement is slow
Source: (Top Left & Right) Haver Analytics, IMG. Data as of May 31, 2015. (Bottom Left) Bloomberg, IMG. Data as of March 31, 2015. (Bottom Right) Bloomberg, IMG. Data as of June 30, 2015.
Home prices are expected to continue to rise in 2015 Housing supply remains low but sales growth has been inconsistent
The housing market has picked up but remains well below pre-crisis highs
Ma
cro
eco
no
mic
Up
da
te
Homeowner’s real estate equity has recovered as home prices rebounded
0
2
4
6
8
10
12
14
2004 2006 2008 2010 2012 2014
1,000K
2,000K
3,000K
4,000K
5,000K
6,000K
7,000K
8,000K
Sup
ply
of
Exis
tin
g H
om
es in
Mo
nth
s
Exis
tin
g H
om
e Sa
les
and
Ho
me
Inve
nto
ry
(In
Th
ou
san
ds)
Supply in Months (RHS) Total Existing Home Sales (LHS) Housing Inventory (LHS)
Market Peak: 3.6 months of
supply
-10%
-5%
0%
5%
10%
15%
-2.0%
-1.5%
-1.0%
-0.5%
0.0%
0.5%
1.0%
1.5%
2.0%
2010 2011 2012 2013 2014 2015
Co
reLo
gic
Nat
ion
al H
ou
se P
rice
Ind
ex
MoM (Left) YoY (Right)
30%
35%
40%
45%
50%
55%
60%
65%
2004 2006 2008 2010 2012 2014
Ow
ner
's E
qu
ity
as %
HH
Rea
l Est
ate
0
5000
10000
15000
1999 2001 2003 2005 2007 2009 2011 2013 2015
Building Permits Housing Starts Pending Home Sales
New Home Sales Existing Home Sales
25 Q2 - 2015 Market Quarterly – CIO Reports
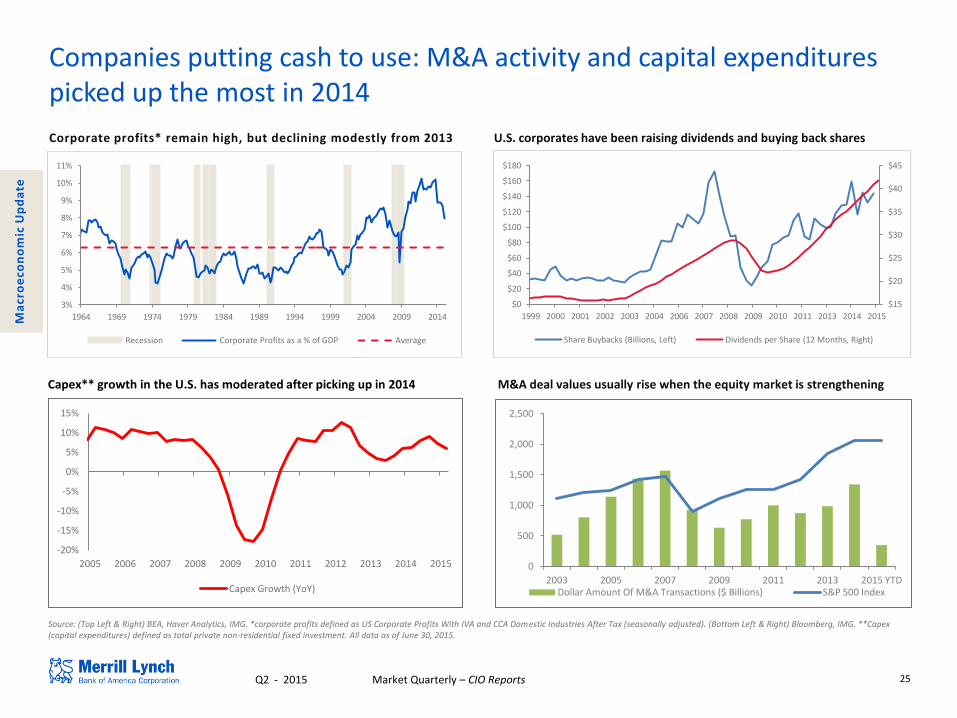
Companies putting cash to use: M&A activity and capital expenditures picked up the most in 2014
Source: (Top Left & Right) BEA, Haver Analytics, IMG. *corporate profits defined as US Corporate Profits With IVA and CCA Domestic Industries After Tax (seasonally adjusted). (Bottom Left & Right) Bloomberg, IMG. **Capex (capital expenditures) defined as total private non-residential fixed investment. All data as of June 30, 2015.
M&A deal values usually rise when the equity market is strengthening
Corporate profits* remain high, but declining modestly from 2013 U.S. corporates have been raising dividends and buying back shares
Capex** growth in the U.S. has moderated after picking up in 2014
Ma
cro
eco
no
mic
Up
da
te
3%
4%
5%
6%
7%
8%
9%
10%
11%
1964 1969 1974 1979 1984 1989 1994 1999 2004 2009 2014
Recession Corporate Profits as a % of GDP Average
$15
$20
$25
$30
$35
$40
$45
$0
$20
$40
$60
$80
$100
$120
$140
$160
$180
1999 2000 2001 2002 2003 2004 2006 2007 2008 2009 2010 2011 2013 2014 2015
Share Buybacks (Billions, Left) Dividends per Share (12 Months, Right)
-20%
-15%
-10%
-5%
0%
5%
10%
15%
2005 2006 2007 2008 2009 2010 2011 2012 2013 2014 2015
Capex Growth (YoY)
0
500
1,000
1,500
2,000
2,500
2003 2005 2007 2009 2011 2013 2015 YTD Dollar Amount Of M&A Transactions ($ Billions) S&P 500 Index
26 Q2 - 2015 Market Quarterly – CIO Reports
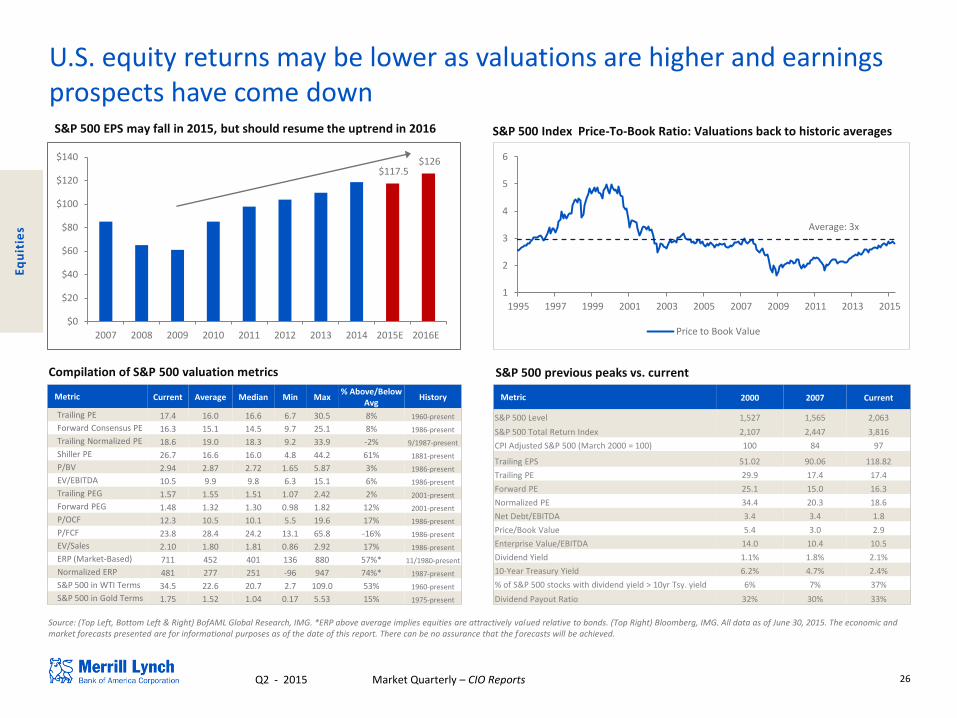
U.S. equity returns may be lower as valuations are higher and earnings prospects have come down
S&P 500 Index Price-To-Book Ratio: Valuations back to historic averages
Compilation of S&P 500 valuation metrics
Source: (Top Left, Bottom Left & Right) BofAML Global Research, IMG. *ERP above average implies equities are attractively valued relative to bonds. (Top Right) Bloomberg, IMG. All data as of June 30, 2015. The economic and market forecasts presented are for informational purposes as of the date of this report. There can be no assurance that the forecasts will be achieved.
S&P 500 EPS may fall in 2015, but should resume the uptrend in 2016
S&P 500 previous peaks vs. current
Metric 2000 2007 Current
S&P 500 Level 1,527 1,565 2,063
S&P 500 Total Return Index 2,107 2,447 3,816
CPI Adjusted S&P 500 (March 2000 = 100) 100 84 97
Trailing EPS 51.02 90.06 118.82
Trailing PE 29.9 17.4 17.4
Forward PE 25.1 15.0 16.3
Normalized PE 34.4 20.3 18.6
Net Debt/EBITDA 3.4 3.4 1.8
Price/Book Value 5.4 3.0 2.9
Enterprise Value/EBITDA 14.0 10.4 10.5
Dividend Yield 1.1% 1.8% 2.1%
10-Year Treasury Yield 6.2% 4.7% 2.4%
% of S&P 500 stocks with dividend yield > 10yr Tsy. yield 6% 7% 37%
Dividend Payout Ratio 32% 30% 33%
Metric Current Average Median Min Max % Above/Below
Avg History
Trailing PE 17.4 16.0 16.6 6.7 30.5 8% 1960-present
Forward Consensus PE 16.3 15.1 14.5 9.7 25.1 8% 1986-present
Trailing Normalized PE 18.6 19.0 18.3 9.2 33.9 -2% 9/1987-present
Shiller PE 26.7 16.6 16.0 4.8 44.2 61% 1881-present
P/BV 2.94 2.87 2.72 1.65 5.87 3% 1986-present
EV/EBITDA 10.5 9.9 9.8 6.3 15.1 6% 1986-present
Trailing PEG 1.57 1.55 1.51 1.07 2.42 2% 2001-present
Forward PEG 1.48 1.32 1.30 0.98 1.82 12% 2001-present
P/OCF 12.3 10.5 10.1 5.5 19.6 17% 1986-present
P/FCF 23.8 28.4 24.2 13.1 65.8 -16% 1986-present
EV/Sales 2.10 1.80 1.81 0.86 2.92 17% 1986-present
ERP (Market-Based) 711 452 401 136 880 57%* 11/1980-present
Normalized ERP 481 277 251 -96 947 74%* 1987-present
S&P 500 in WTI Terms 34.5 22.6 20.7 2.7 109.0 53% 1960-present
S&P 500 in Gold Terms 1.75 1.52 1.04 0.17 5.53 15% 1975-present
Eq
uit
ies
$117.5 $126
$0
$20
$40
$60
$80
$100
$120
$140
2007 2008 2009 2010 2011 2012 2013 2014 2015E 2016E
Average: 3x
1
2
3
4
5
6
1995 1997 1999 2001 2003 2005 2007 2009 2011 2013 2015
Price to Book Value
27 Q2 - 2015 Market Quarterly – CIO Reports
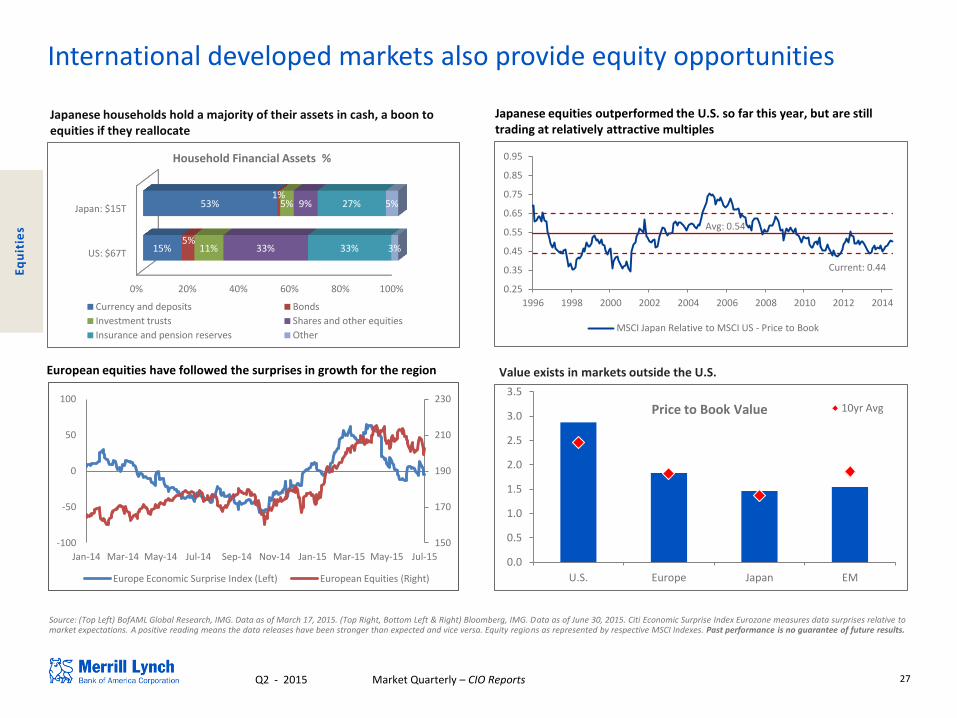
International developed markets also provide equity opportunities
Source: (Top Left) BofAML Global Research, IMG. Data as of March 17, 2015. (Top Right, Bottom Left & Right) Bloomberg, IMG. Data as of June 30, 2015. Citi Economic Surprise Index Eurozone measures data surprises relative to market expectations. A positive reading means the data releases have been stronger than expected and vice versa. Equity regions as represented by respective MSCI Indexes. Past performance is no guarantee of future results.
Japanese households hold a majority of their assets in cash, a boon to equities if they reallocate
Japanese equities outperformed the U.S. so far this year, but are still trading at relatively attractive multiples
Value exists in markets outside the U.S.
0.0
0.5
1.0
1.5
2.0
2.5
3.0
3.5
U.S. Europe Japan EM
Price to Book Value 10yr Avg
Eq
uit
ies
0% 20% 40% 60% 80% 100%
US: $67T
Japan: $15T
15%
53%
5%
1%
11%
5%
33%
9%
33%
27%
3%
5%
Household Financial Assets %
Currency and deposits Bonds
Investment trusts Shares and other equities
Insurance and pension reserves Other
European equities have followed the surprises in growth for the region
150
170
190
210
230
-100
-50
0
50
100
Jan-14 Mar-14 May-14 Jul-14 Sep-14 Nov-14 Jan-15 Mar-15 May-15 Jul-15
Europe Economic Surprise Index (Left) European Equities (Right)
Current: 0.44
Avg: 0.54
0.25
0.35
0.45
0.55
0.65
0.75
0.85
0.95
1996 1998 2000 2002 2004 2006 2008 2010 2012 2014
MSCI Japan Relative to MSCI US - Price to Book
28 Q2 - 2015 Market Quarterly – CIO Reports
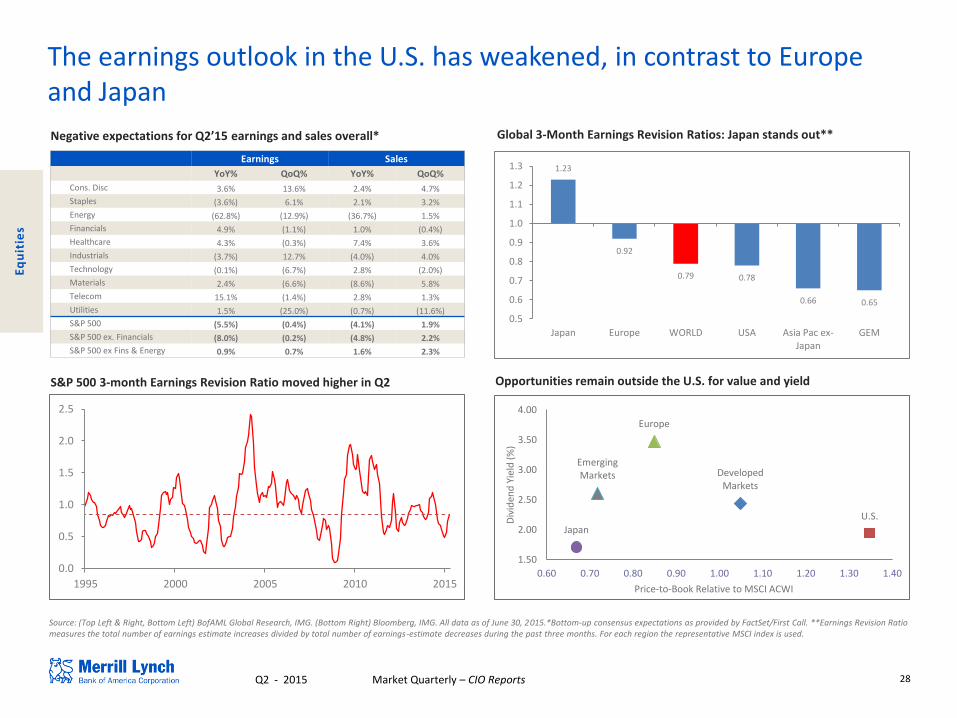
The earnings outlook in the U.S. has weakened, in contrast to Europe and Japan
Earnings Sales
YoY% QoQ% YoY% QoQ%
Cons. Disc 3.6% 13.6% 2.4% 4.7%
Staples (3.6%) 6.1% 2.1% 3.2%
Energy (62.8%) (12.9%) (36.7%) 1.5%
Financials 4.9% (1.1%) 1.0% (0.4%)
Healthcare 4.3% (0.3%) 7.4% 3.6%
Industrials (3.7%) 12.7% (4.0%) 4.0%
Technology (0.1%) (6.7%) 2.8% (2.0%)
Materials 2.4% (6.6%) (8.6%) 5.8%
Telecom 15.1% (1.4%) 2.8% 1.3%
Utilities 1.5% (25.0%) (0.7%) (11.6%)
S&P 500 (5.5%) (0.4%) (4.1%) 1.9%
S&P 500 ex. Financials (8.0%) (0.2%) (4.8%) 2.2%
S&P 500 ex Fins & Energy 0.9% 0.7% 1.6% 2.3%
S&P 500 3-month Earnings Revision Ratio moved higher in Q2 Opportunities remain outside the U.S. for value and yield
Source: (Top Left & Right, Bottom Left) BofAML Global Research, IMG. (Bottom Right) Bloomberg, IMG. All data as of June 30, 2015.*Bottom-up consensus expectations as provided by FactSet/First Call. **Earnings Revision Ratio measures the total number of earnings estimate increases divided by total number of earnings-estimate decreases during the past three months. For each region the representative MSCI index is used.
Negative expectations for Q2’15 earnings and sales overall* Global 3-Month Earnings Revision Ratios: Japan stands out**
Eq
uit
ies
1.23
0.92
0.79 0.78
0.66 0.65
0.5
0.6
0.7
0.8
0.9
1.0
1.1
1.2
1.3
Japan Europe WORLD USA Asia Pac ex-Japan
GEM
Developed Markets
U.S.
Europe
Japan
Emerging Markets
1.50
2.00
2.50
3.00
3.50
4.00
0.60 0.70 0.80 0.90 1.00 1.10 1.20 1.30 1.40
Div
iden
d Y
ield
(%
)
Price-to-Book Relative to MSCI ACWI
0.0
0.5
1.0
1.5
2.0
2.5
1995 2000 2005 2010 2015
29 Q2 - 2015 Market Quarterly – CIO Reports
Equity sector performance: Healthcare led in Q2; while Utilities suffered
S&P 500 Index Sector Returns MSCI All-Country World Index Ex U.S. Sector Returns
Source: Bloomberg, IMG. Returns calculated are total returns. Data as of June 30, 2015. Past performance is no guarantee of future results.
Eq
uit
ies
2.8%
1.9%
1.6%
0.2%
-0.5%
1.7%
-1.7%
-2.2%
-1.9%
-5.8%
9.6%
6.8%
3.2%
0.8%
0.5%
-0.4%
-0.8%
-3.1%
-4.7%
-10.7%
-15% -10% -5% 0% 5% 10% 15%
Healthcare
Cons Disc
Telecom
Info Tech
Materials
Financials
Cons Staples
Industrials
Energy
Utilities
2015 YTD Q2
-1.0%
-0.2%
3.6%
0.9%
-2.6%
-0.2%
2.1%
-0.6%
2.7%
1.3%
9.6%
6.9%
5.4%
5.0%
4.9%
4.6%
4.5%
1.1%
-1.4%
-3.3%
-4% -2% 0% 2% 4% 6% 8% 10%
Healthcare
Cons Disc
Telecom
Cons Staples
Info Tech
Industrials
Financials
Materials
Energy
Utilities
2015 YTD Q2
30 Q2 - 2015 Market Quarterly – CIO Reports
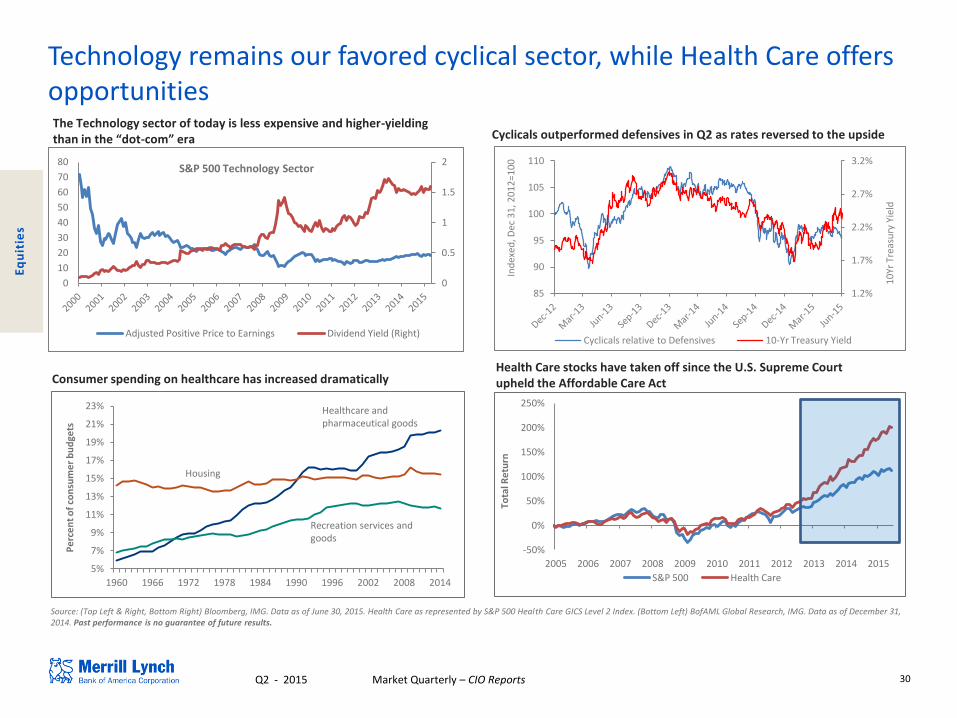
Technology remains our favored cyclical sector, while Health Care offers opportunities
Source: (Top Left & Right, Bottom Right) Bloomberg, IMG. Data as of June 30, 2015. Health Care as represented by S&P 500 Health Care GICS Level 2 Index. (Bottom Left) BofAML Global Research, IMG. Data as of December 31, 2014. Past performance is no guarantee of future results.
The Technology sector of today is less expensive and higher-yielding than in the “dot-com” era Cyclicals outperformed defensives in Q2 as rates reversed to the upside
Consumer spending on healthcare has increased dramatically Health Care stocks have taken off since the U.S. Supreme Court upheld the Affordable Care Act
Eq
uit
ies
5%
7%
9%
11%
13%
15%
17%
19%
21%
23%
1960 1966 1972 1978 1984 1990 1996 2002 2008 2014
Pe
rce
nt
of
con
sum
er
bu
dge
ts
Healthcare and pharmaceutical goods
Recreation services and goods
Housing
1.2%
1.7%
2.2%
2.7%
3.2%
85
90
95
100
105
110
10
Yr T
reas
ury
Yie
ld
Ind
exed
, Dec
31
, 20
12
=10
0
Cyclicals relative to Defensives 10-Yr Treasury Yield
0
0.5
1
1.5
2
0
10
20
30
40
50
60
70
80
Adjusted Positive Price to Earnings Dividend Yield (Right)
S&P 500 Technology Sector
-50%
0%
50%
100%
150%
200%
250%
2005 2006 2007 2008 2009 2010 2011 2012 2013 2014 2015
Tota
l Re
turn
S&P 500 Health Care
31 Q2 - 2015 Market Quarterly – CIO Reports
8.2 8.6
5.8
3.1
7.5
6.2
5.1 5.0 4.6
4.3 4.7
2.0
3.0
4.0
5.0
6.0
7.0
8.0
9.0
2006 2007 2008 2009 2010 2011 2012 2013 2014 2015 2016
Emerging and Developing Economies GDP Growth Rate (%)
Forecast
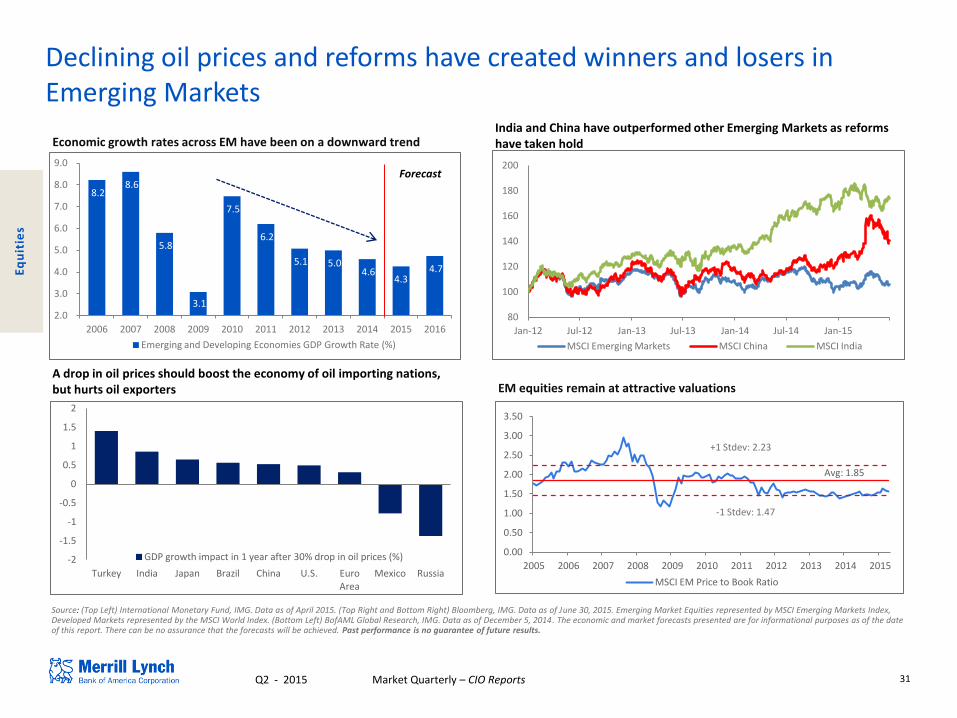
Declining oil prices and reforms have created winners and losers in Emerging Markets
Source: (Top Left) International Monetary Fund, IMG. Data as of April 2015. (Top Right and Bottom Right) Bloomberg, IMG. Data as of June 30, 2015. Emerging Market Equities represented by MSCI Emerging Markets Index, Developed Markets represented by the MSCI World Index. (Bottom Left) BofAML Global Research, IMG. Data as of December 5, 2014. The economic and market forecasts presented are for informational purposes as of the date of this report. There can be no assurance that the forecasts will be achieved. Past performance is no guarantee of future results.
Economic growth rates across EM have been on a downward trend
EM equities remain at attractive valuations A drop in oil prices should boost the economy of oil importing nations, but hurts oil exporters
Eq
uit
ies
-2
-1.5
-1
-0.5
0
0.5
1
1.5
2
Turkey India Japan Brazil China U.S. Euro Area
Mexico Russia
GDP growth impact in 1 year after 30% drop in oil prices (%)
India and China have outperformed other Emerging Markets as reforms have taken hold
Avg: 1.85
0.00
0.50
1.00
1.50
2.00
2.50
3.00
3.50
2005 2006 2007 2008 2009 2010 2011 2012 2013 2014 2015
MSCI EM Price to Book Ratio
-1 Stdev: 1.47
+1 Stdev: 2.23
80
100
120
140
160
180
200
Jan-12 Jul-12 Jan-13 Jul-13 Jan-14 Jul-14 Jan-15
MSCI Emerging Markets MSCI China MSCI India
32 Q2 - 2015 Market Quarterly – CIO Reports
0%
1%
2%
3%
4%
5%
3 Month 6 Month 2 Year 5 Year 10 Year 30 Year
As of 6/30/15 As of 12/31/14 As of 12/31/13
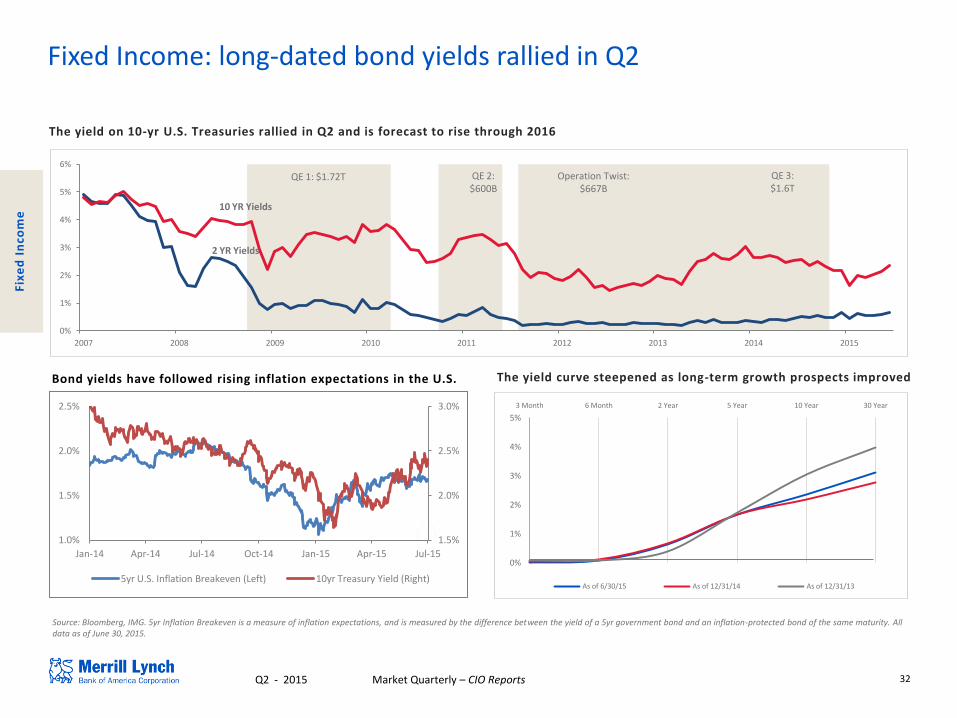
Fixed Income: long-dated bond yields rallied in Q2
The yield curve steepened as long-term growth prospects improved
Source: Bloomberg, IMG. 5yr Inflation Breakeven is a measure of inflation expectations, and is measured by the difference between the yield of a 5yr government bond and an inflation-protected bond of the same maturity. All data as of June 30, 2015.
The yield on 10-yr U.S. Treasuries rallied in Q2 and is forecast to rise through 2016
Fix
ed
In
com
e
Bond yields have followed rising inflation expectations in the U.S.
1.5%
2.0%
2.5%
3.0%
1.0%
1.5%
2.0%
2.5%
Jan-14 Apr-14 Jul-14 Oct-14 Jan-15 Apr-15 Jul-15
5yr U.S. Inflation Breakeven (Left) 10yr Treasury Yield (Right)
0%
1%
2%
3%
4%
5%
6%
2007 2008 2009 2010 2011 2012 2013 2014 2015
2 YR Yields
10 YR Yields
QE 1: $1.72T QE 2: $600B
Operation Twist: $667B
QE 3: $1.6T
33 Q2 - 2015 Market Quarterly – CIO Reports
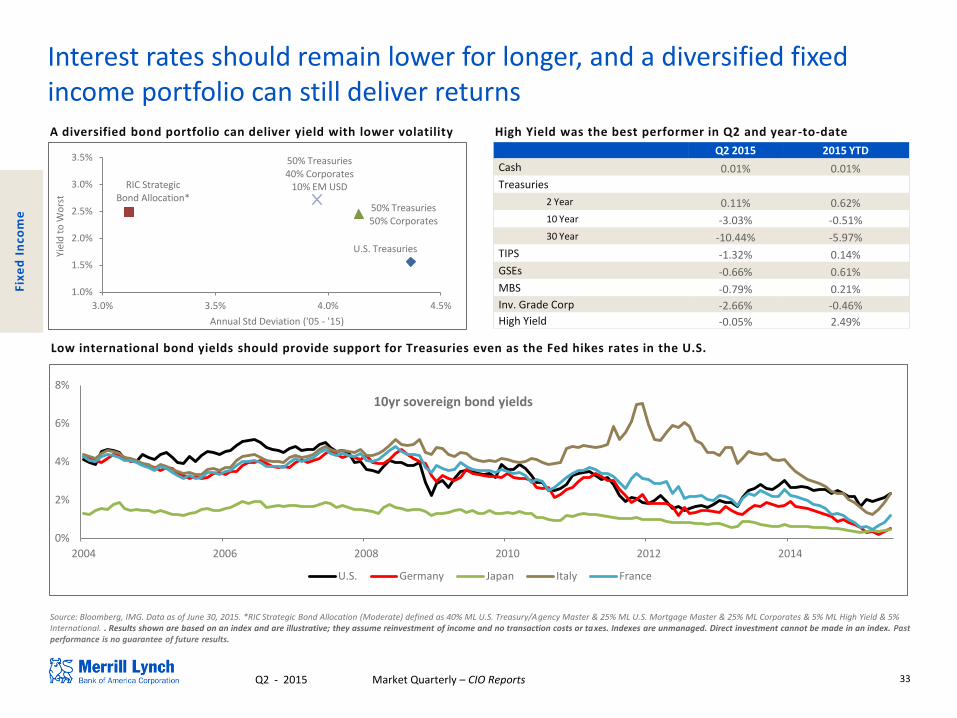
Interest rates should remain lower for longer, and a diversified fixed income portfolio can still deliver returns
Source: Bloomberg, IMG. Data as of June 30, 2015. *RIC Strategic Bond Allocation (Moderate) defined as 40% ML U.S. Treasury/Agency Master & 25% ML U.S. Mortgage Master & 25% ML Corporates & 5% ML High Yield & 5% International. . Results shown are based on an index and are illustrative; they assume reinvestment of income and no transaction costs or taxes. Indexes are unmanaged. Direct investment cannot be made in an index. Past performance is no guarantee of future results.
High Yield was the best performer in Q2 and year -to-date
Low international bond yields should provide support for Treasuries even as the Fed hikes rates in the U.S.
Q2 2015 2015 YTD
Cash 0.01% 0.01%
Treasuries
2 Year 0.11% 0.62%
10 Year -3.03% -0.51%
30 Year -10.44% -5.97%
TIPS -1.32% 0.14%
GSEs -0.66% 0.61%
MBS -0.79% 0.21%
Inv. Grade Corp -2.66% -0.46%
High Yield -0.05% 2.49%
Fix
ed
In
com
e
A diversified bond portfolio can deliver yield with lower volatility
U.S. Treasuries
RIC Strategic Bond Allocation*
50% Treasuries 50% Corporates
50% Treasuries 40% Corporates
10% EM USD
1.0%
1.5%
2.0%
2.5%
3.0%
3.5%
3.0% 3.5% 4.0% 4.5%
Yie
ld t
o W
ors
t
Annual Std Deviation ('05 - '15)
0%
2%
4%
6%
8%
2004 2006 2008 2010 2012 2014
10yr sovereign bond yields
U.S. Germany Japan Italy France
34 Q2 - 2015 Market Quarterly – CIO Reports
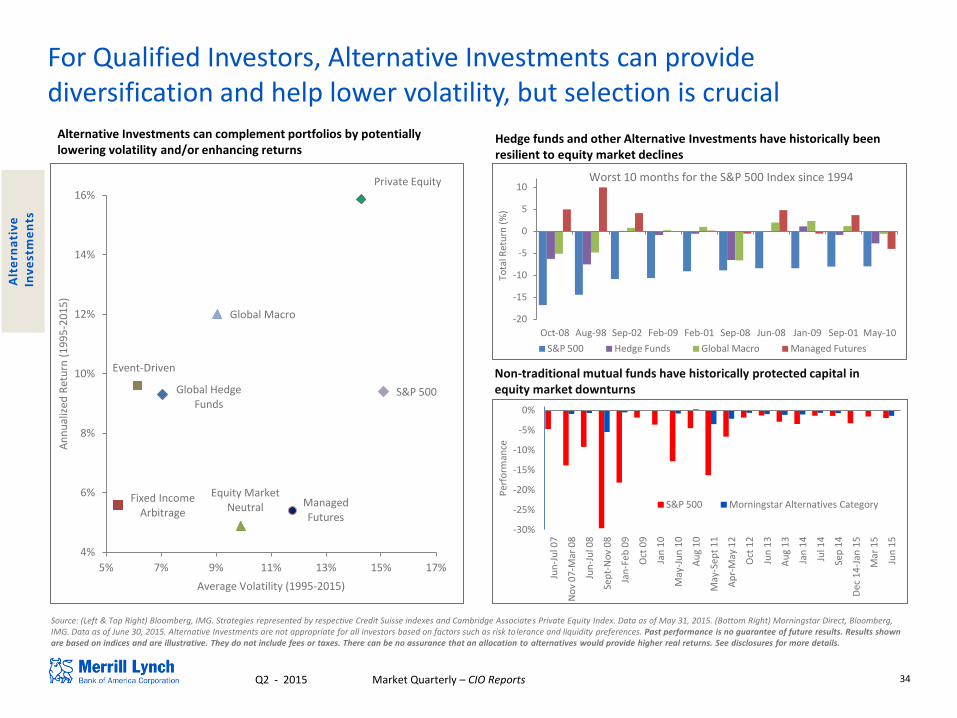
For Qualified Investors, Alternative Investments can provide diversification and help lower volatility, but selection is crucial
Alternative Investments can complement portfolios by potentially lowering volatility and/or enhancing returns
Source: (Left & Top Right) Bloomberg, IMG. Strategies represented by respective Credit Suisse indexes and Cambridge Associates Private Equity Index. Data as of May 31, 2015. (Bottom Right) Morningstar Direct, Bloomberg, IMG. Data as of June 30, 2015. Alternative Investments are not appropriate for all investors based on factors such as risk tolerance and liquidity preferences. Past performance is no guarantee of future results. Results shown are based on indices and are illustrative. They do not include fees or taxes. There can be no assurance that an allocation to alternatives would provide higher real returns. See disclosures for more details.
Hedge funds and other Alternative Investments have historically been resilient to equity market declines
Non-traditional mutual funds have historically protected capital in equity market downturns
Alt
ern
ati
ve
I
nv
est
me
nts
-20
-15
-10
-5
0
5
10
Oct-08 Aug-98 Sep-02 Feb-09 Feb-01 Sep-08 Jun-08 Jan-09 Sep-01 May-10
Tota
l Ret
urn
(%
)
Worst 10 months for the S&P 500 Index since 1994
S&P 500 Hedge Funds Global Macro Managed Futures
-30%
-25%
-20%
-15%
-10%
-5%
0%
Jun
-Ju
l 07
No
v 0
7-M
ar 0
8
Jun
-Ju
l 08
Sep
t-N
ov
08
Jan
-Feb
09
Oct
09
Jan
10
May
-Ju
n 1
0
Au
g 1
0
May
-Sep
t 1
1
Ap
r-M
ay 1
2
Oct
12
Jun
13
Au
g 1
3
Jan
14
Jul 1
4
Sep
14
Dec
14
-Jan
15
Mar
15
Jun
15
Per
form
ance
S&P 500 Morningstar Alternatives Category
Global Hedge Funds
Fixed Income Arbitrage
Equity Market Neutral
Event-Driven
Global Macro
Managed Futures
S&P 500
Private Equity
4%
6%
8%
10%
12%
14%
16%
5% 7% 9% 11% 13% 15% 17%
An
nu
aliz
ed R
etu
rn (
19
95
-20
15
)
Average Volatility (1995-2015)
35 Q2 - 2015 Market Quarterly – CIO Reports
$0
$100
$200
$300
$400
$500
$600
$700
$800
2001 2002 2003 2004 2005 2006 2007 2008 2009 2010 2011 2012 2013 2014
Bu
you
t D
eal V
olu
me
($ B
illio
ns)
Average
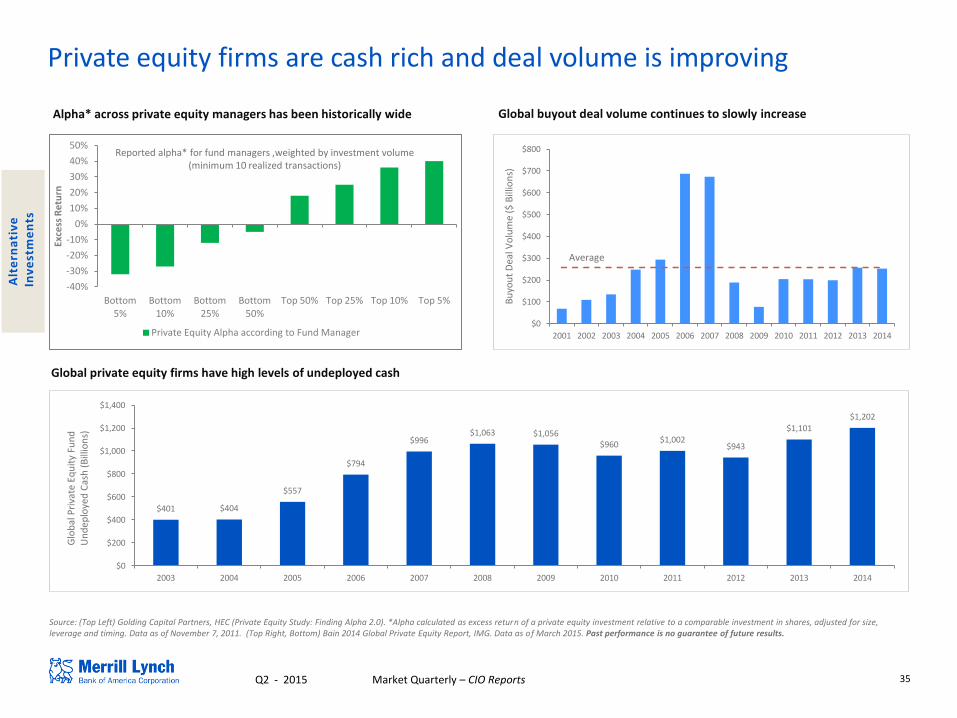
Private equity firms are cash rich and deal volume is improving
Global buyout deal volume continues to slowly increase
Source: (Top Left) Golding Capital Partners, HEC (Private Equity Study: Finding Alpha 2.0). *Alpha calculated as excess return of a private equity investment relative to a comparable investment in shares, adjusted for size, leverage and timing. Data as of November 7, 2011. (Top Right, Bottom) Bain 2014 Global Private Equity Report, IMG. Data as of March 2015. Past performance is no guarantee of future results.
Alpha* across private equity managers has been historically wide
Global private equity firms have high levels of undeployed cash
Alt
ern
ati
ve
I
nv
est
me
nts
-40%
-30%
-20%
-10%
0%
10%
20%
30%
40%
50%
Bottom 5%
Bottom 10%
Bottom 25%
Bottom 50%
Top 50% Top 25% Top 10% Top 5%
Exce
ss R
etu
rn
Private Equity Alpha according to Fund Manager
Reported alpha* for fund managers ,weighted by investment volume (minimum 10 realized transactions)
$401 $404
$557
$794
$996 $1,063 $1,056
$960 $1,002
$943
$1,101
$1,202
$0
$200
$400
$600
$800
$1,000
$1,200
$1,400
2003 2004 2005 2006 2007 2008 2009 2010 2011 2012 2013 2014
Glo
bal
Pri
vate
Eq
uit
y Fu
nd
U
nd
eplo
yed
Cas
h (
Bill
ion
s)
36 Q2 - 2015 Market Quarterly – CIO Reports
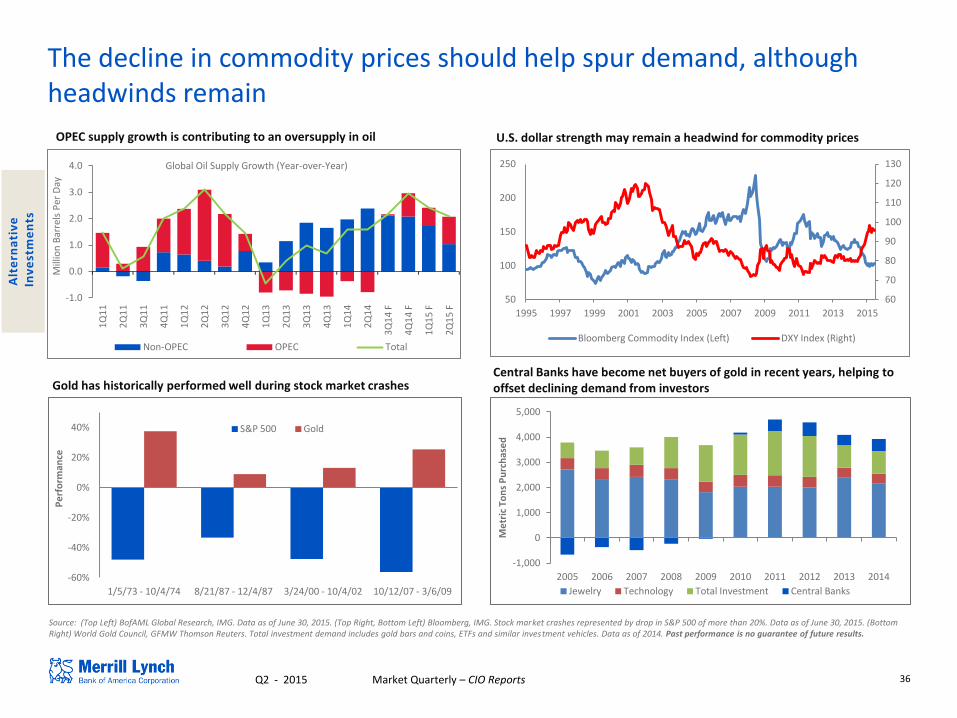
The decline in commodity prices should help spur demand, although headwinds remain
OPEC supply growth is contributing to an oversupply in oil
Gold has historically performed well during stock market crashes
Source: (Top Left) BofAML Global Research, IMG. Data as of June 30, 2015. (Top Right, Bottom Left) Bloomberg, IMG. Stock market crashes represented by drop in S&P 500 of more than 20%. Data as of June 30, 2015. (Bottom Right) World Gold Council, GFMW Thomson Reuters. Total investment demand includes gold bars and coins, ETFs and similar investment vehicles. Data as of 2014. Past performance is no guarantee of future results.
Alt
ern
ati
ve
I
nv
est
me
nts
-60%
-40%
-20%
0%
20%
40%
1/5/73 - 10/4/74 8/21/87 - 12/4/87 3/24/00 - 10/4/02 10/12/07 - 3/6/09
Pe
rfo
rman
ce
S&P 500 Gold
Central Banks have become net buyers of gold in recent years, helping to offset declining demand from investors
-1,000
0
1,000
2,000
3,000
4,000
5,000
2005 2006 2007 2008 2009 2010 2011 2012 2013 2014
Me
tric
To
ns
Pu
rch
ase
d
Jewelry Technology Total Investment Central Banks
U.S. dollar strength may remain a headwind for commodity prices
-1.0
0.0
1.0
2.0
3.0
4.0
1Q
11
2Q
11
3Q
11
4Q
11
1Q
12
2Q
12
3Q
12
4Q
12
1Q
13
2Q
13
3Q
13
4Q
13
1Q
14
2Q
14
3Q
14
F
4Q
14
F
1Q
15
F
2Q
15
F
Mill
ion
Bar
rels
Per
Day
Global Oil Supply Growth (Year-over-Year)
Non-OPEC OPEC Total
60
70
80
90
100
110
120
130
50
100
150
200
250
1995 1997 1999 2001 2003 2005 2007 2009 2011 2013 2015
Bloomberg Commodity Index (Left) DXY Index (Right)
37 Q2 - 2015 Market Quarterly – CIO Reports
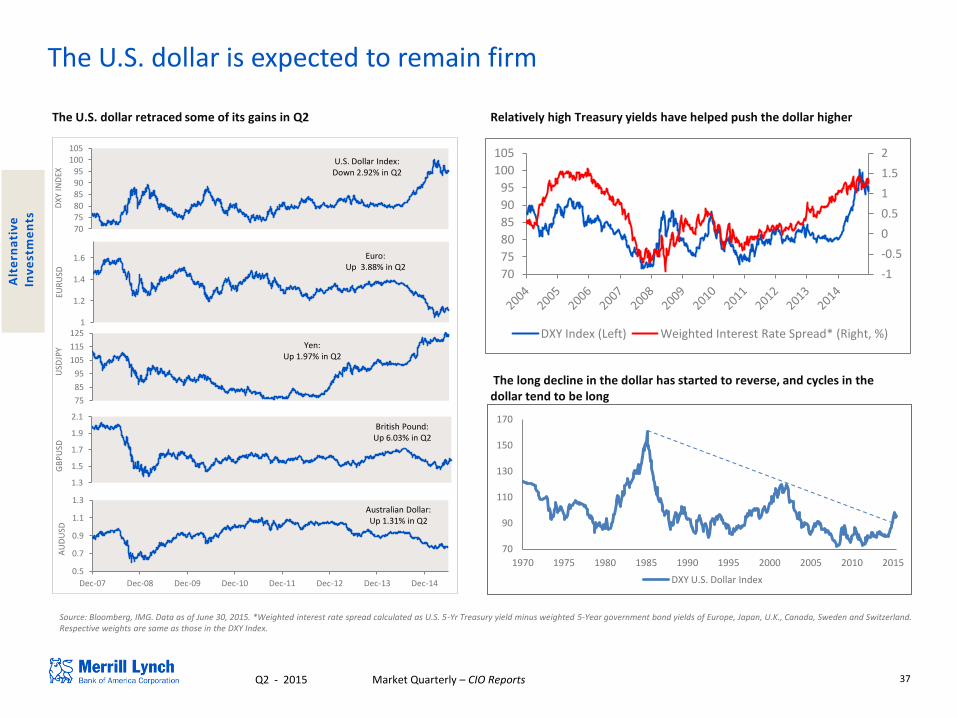
The U.S. dollar is expected to remain firm
The long decline in the dollar has started to reverse, and cycles in the dollar tend to be long
Relatively high Treasury yields have helped push the dollar higher
Source: Bloomberg, IMG. Data as of June 30, 2015. *Weighted interest rate spread calculated as U.S. 5-Yr Treasury yield minus weighted 5-Year government bond yields of Europe, Japan, U.K., Canada, Sweden and Switzerland. Respective weights are same as those in the DXY Index.
Alt
ern
ati
ve
I
nv
est
me
nts
-1
-0.5
0
0.5
1
1.5
2
70
75
80
85
90
95
100
105
DXY Index (Left) Weighted Interest Rate Spread* (Right, %)
70
90
110
130
150
170
1970 1975 1980 1985 1990 1995 2000 2005 2010 2015
DXY U.S. Dollar Index
The U.S. dollar retraced some of its gains in Q2
U.S. Dollar Index: Up 9.0% in Q1
Euro: Down 11.3% in Q1
Yen: Down 0.3% in Q1
British Pound: Down 4.9% in Q1
Australian Dollar: Down 7.0% in Q1
70 75 80 85 90 95
100 105
DX
Y IN
DEX
U.S. Dollar Index: Down 2.92% in Q2
1
1.2
1.4
1.6
EUR
USD
Euro: Up 3.88% in Q2
0.5
0.7
0.9
1.1
1.3
Dec-07 Dec-08 Dec-09 Dec-10 Dec-11 Dec-12 Dec-13 Dec-14
AU
DU
SD
Australian Dollar: Up 1.31% in Q2
75
85
95
105
115
125
USD
JPY Yen:
Up 1.97% in Q2
1.3
1.5
1.7
1.9
2.1
GB
PU
SD
British Pound: Up 6.03% in Q2
38 Q2 - 2015 Market Quarterly – CIO Reports
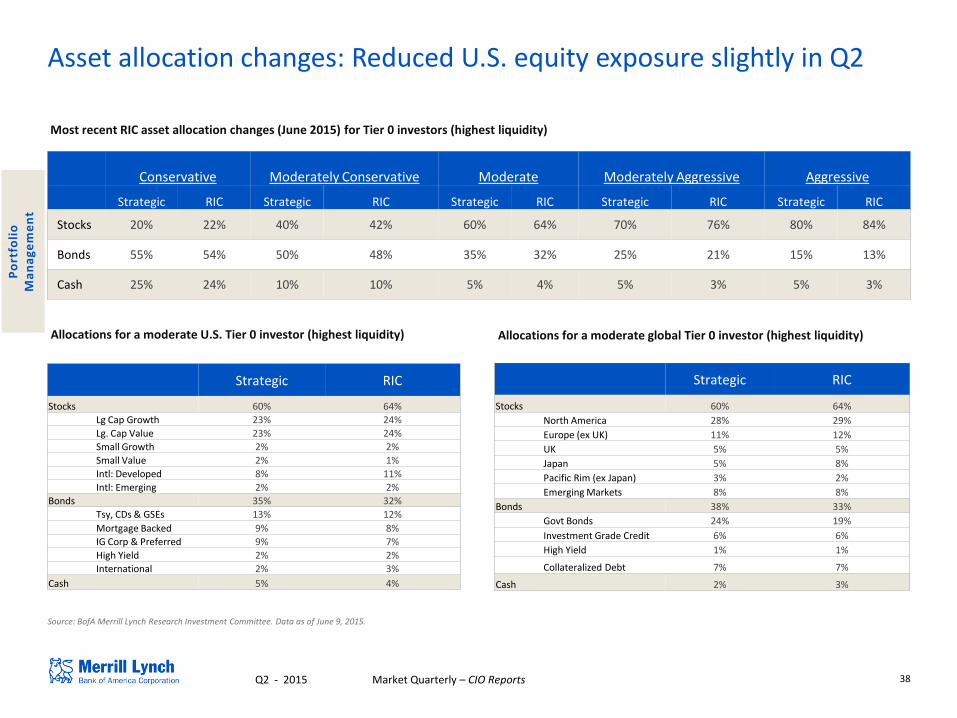
Asset allocation changes: Reduced U.S. equity exposure slightly in Q2
Source: BofA Merrill Lynch Research Investment Committee. Data as of June 9, 2015.
Most recent RIC asset allocation changes (June 2015) for Tier 0 investors (highest liquidity)
Conservative Moderately Conservative Moderate Moderately Aggressive Aggressive
Strategic RIC Strategic RIC Strategic RIC Strategic RIC Strategic RIC
Stocks 20% 22% 40% 42% 60% 64% 70% 76% 80% 84%
Bonds 55% 54% 50% 48% 35% 32% 25% 21% 15% 13%
Cash 25% 24% 10% 10% 5% 4% 5% 3% 5% 3%
Strategic RIC
Stocks 60% 64%
Lg Cap Growth 23% 24%
Lg. Cap Value 23% 24%
Small Growth 2% 2%
Small Value 2% 1%
Intl: Developed 8% 11%
Intl: Emerging 2% 2%
Bonds 35% 32%
Tsy, CDs & GSEs 13% 12%
Mortgage Backed 9% 8%
IG Corp & Preferred 9% 7%
High Yield 2% 2%
International 2% 3%
Cash 5% 4%
Allocations for a moderate U.S. Tier 0 investor (highest liquidity) Allocations for a moderate global Tier 0 investor (highest liquidity)
Strategic RIC
Stocks 60% 64%
North America 28% 29%
Europe (ex UK) 11% 12%
UK 5% 5%
Japan 5% 8%
Pacific Rim (ex Japan) 3% 2%
Emerging Markets 8% 8%
Bonds 38% 33%
Govt Bonds 24% 19%
Investment Grade Credit 6% 6%
High Yield 1% 1%
Collateralized Debt 7% 7%
Cash 2% 3%
Po
rtfo
lio
M
an
ag
em
en
t
39 Q2 - 2015 Market Quarterly – CIO Reports
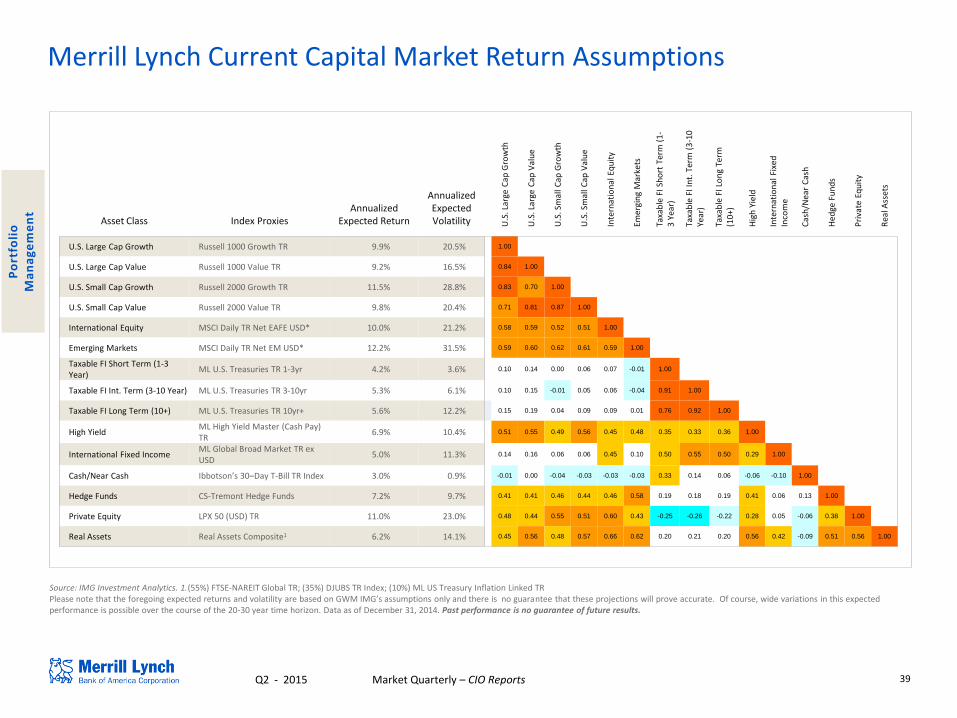
Merrill Lynch Current Capital Market Return Assumptions
Source: IMG Investment Analytics. 1.(55%) FTSE-NAREIT Global TR; (35%) DJUBS TR Index; (10%) ML US Treasury Inflation Linked TR Please note that the foregoing expected returns and volatility are based on GWM IMG’s assumptions only and there is no guarantee that these projections will prove accurate. Of course, wide variations in this expected performance is possible over the course of the 20-30 year time horizon. Data as of December 31, 2014. Past performance is no guarantee of future results.
Asset Class Index Proxies Annualized
Expected Return
Annualized Expected Volatility
U.S
. Lar
ge C
ap G
row
th
U.S
. Lar
ge C
ap V
alu
e
U.S
. Sm
all C
ap G
row
th
U.S
. Sm
all C
ap V
alu
e
Inte
rnat
ion
al E
qu
ity
Emer
gin
g M
arke
ts
Taxa
ble
FI S
ho
rt T
erm
(1
-3
Yea
r)
Taxa
ble
FI I
nt.
Ter
m (
3-1
0
Year
)
Taxa
ble
FI L
on
g Te
rm
(10
+)
Hig
h Y
ield
Inte
rnat
ion
al F
ixed
In
com
e
Cas
h/N
ear
Cas
h
Hed
ge F
un
ds
Pri
vate
Eq
uit
y
Rea
l Ass
ets
U.S. Large Cap Growth Russell 1000 Growth TR 9.9% 20.5%
1.00 0.84 0.83 0.71 0.58 0.59 0.10 0.10 0.15 0.51 0.14 -0.01 0.41 0.48 0.45
U.S. Large Cap Value Russell 1000 Value TR 9.2% 16.5%
0.84 1.00 0.70 0.81 0.59 0.60 0.14 0.15 0.19 0.55 0.16 0.00 0.41 0.44 0.56
U.S. Small Cap Growth Russell 2000 Growth TR 11.5% 28.8%
0.83 0.70 1.00 0.87 0.52 0.62 0.00 -0.01 0.04 0.49 0.06 -0.04 0.46 0.55 0.48
U.S. Small Cap Value Russell 2000 Value TR 9.8% 20.4%
0.71 0.81 0.87 1.00 0.51 0.61 0.06 0.05 0.09 0.56 0.06 -0.03 0.44 0.51 0.57
International Equity MSCI Daily TR Net EAFE USD* 10.0% 21.2%
0.58 0.59 0.52 0.51 1.00 0.59 0.07 0.06 0.09 0.45 0.45 -0.03 0.46 0.60 0.66
Emerging Markets MSCI Daily TR Net EM USD* 12.2% 31.5%
0.59 0.60 0.62 0.61 0.59 1.00 -0.01 -0.04 0.01 0.48 0.10 -0.03 0.58 0.43 0.62
Taxable FI Short Term (1-3 Year)
ML U.S. Treasuries TR 1-3yr 4.2% 3.6%
0.10 0.14 0.00 0.06 0.07 -0.01 1.00 0.91 0.76 0.35 0.50 0.33 0.19 -0.25 0.20
Taxable FI Int. Term (3-10 Year) ML U.S. Treasuries TR 3-10yr 5.3% 6.1%
0.10 0.15 -0.01 0.05 0.06 -0.04 0.91 1.00 0.92 0.33 0.55 0.14 0.18 -0.26 0.21
Taxable FI Long Term (10+) ML U.S. Treasuries TR 10yr+ 5.6% 12.2%
0.15 0.19 0.04 0.09 0.09 0.01 0.76 0.92 1.00 0.36 0.50 0.06 0.19 -0.22 0.20
High Yield ML High Yield Master (Cash Pay) TR
6.9% 10.4%
0.51 0.55 0.49 0.56 0.45 0.48 0.35 0.33 0.36 1.00 0.29 -0.06 0.41 0.28 0.56
International Fixed Income ML Global Broad Market TR ex USD
5.0% 11.3%
0.14 0.16 0.06 0.06 0.45 0.10 0.50 0.55 0.50 0.29 1.00 -0.10 0.06 0.05 0.42
Cash/Near Cash Ibbotson’s 30–Day T-Bill TR Index 3.0% 0.9%
-0.01 0.00 -0.04 -0.03 -0.03 -0.03 0.33 0.14 0.06 -0.06 -0.10 1.00 0.13 -0.06 -0.09
Hedge Funds CS-Tremont Hedge Funds 7.2% 9.7%
0.41 0.41 0.46 0.44 0.46 0.58 0.19 0.18 0.19 0.41 0.06 0.13 1.00 0.38 0.51
Private Equity LPX 50 (USD) TR 11.0% 23.0%
0.48 0.44 0.55 0.51 0.60 0.43 -0.25 -0.26 -0.22 0.28 0.05 -0.06 0.38 1.00 0.56
Real Assets Real Assets Composite1 6.2% 14.1%
0.45 0.56 0.48 0.57 0.66 0.62 0.20 0.21 0.20 0.56 0.42 -0.09 0.51 0.56 1.00
Po
rtfo
lio
M
an
ag
em
en
t
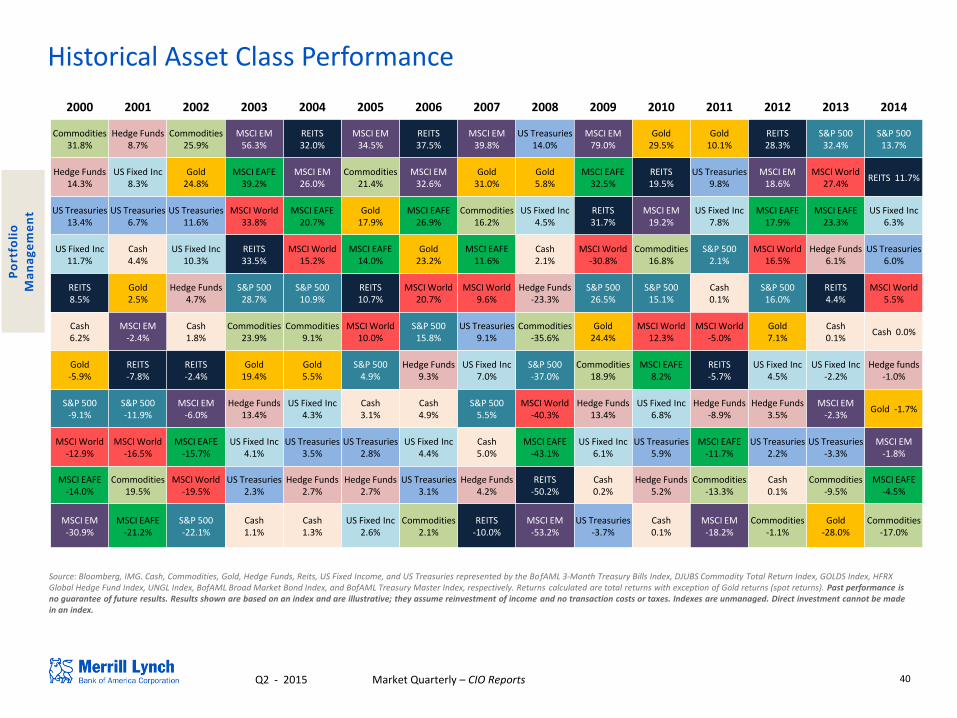
40 Q2 - 2015 Market Quarterly – CIO Reports
Source: Bloomberg, IMG. Cash, Commodities, Gold, Hedge Funds, Reits, US Fixed Income, and US Treasuries represented by the BofAML 3-Month Treasury Bills Index, DJUBS Commodity Total Return Index, GOLDS Index, HFRX Global Hedge Fund Index, UNGL Index, BofAML Broad Market Bond Index, and BofAML Treasury Master Index, respectively. Returns calculated are total returns with exception of Gold returns (spot returns). Past performance is no guarantee of future results. Results shown are based on an index and are illustrative; they assume reinvestment of income and no transaction costs or taxes. Indexes are unmanaged. Direct investment cannot be made in an index.
2000 2001 2002 2003 2004 2005 2006 2007 2008 2009 2010 2011 2012 2013 2014
Commodities 31.8%
Hedge Funds 8.7%
Commodities 25.9%
MSCI EM 56.3%
REITS 32.0%
MSCI EM 34.5%
REITS 37.5%
MSCI EM 39.8%
US Treasuries 14.0%
MSCI EM 79.0%
Gold 29.5%
Gold 10.1%
REITS 28.3%
S&P 500 32.4%
S&P 500 13.7%
Hedge Funds 14.3%
US Fixed Inc 8.3%
Gold 24.8%
MSCI EAFE 39.2%
MSCI EM 26.0%
Commodities 21.4%
MSCI EM 32.6%
Gold 31.0%
Gold 5.8%
MSCI EAFE 32.5%
REITS 19.5%
US Treasuries 9.8%
MSCI EM 18.6%
MSCI World 27.4%
REITS 11.7%
US Treasuries 13.4%
US Treasuries 6.7%
US Treasuries 11.6%
MSCI World 33.8%
MSCI EAFE 20.7%
Gold 17.9%
MSCI EAFE 26.9%
Commodities 16.2%
US Fixed Inc 4.5%
REITS 31.7%
MSCI EM 19.2%
US Fixed Inc 7.8%
MSCI EAFE 17.9%
MSCI EAFE 23.3%
US Fixed Inc 6.3%
US Fixed Inc 11.7%
Cash 4.4%
US Fixed Inc 10.3%
REITS 33.5%
MSCI World 15.2%
MSCI EAFE 14.0%
Gold 23.2%
MSCI EAFE 11.6%
Cash 2.1%
MSCI World -30.8%
Commodities 16.8%
S&P 500 2.1%
MSCI World 16.5%
Hedge Funds 6.1%
US Treasuries 6.0%
REITS 8.5%
Gold 2.5%
Hedge Funds 4.7%
S&P 500 28.7%
S&P 500 10.9%
REITS 10.7%
MSCI World 20.7%
MSCI World 9.6%
Hedge Funds -23.3%
S&P 500 26.5%
S&P 500 15.1%
Cash 0.1%
S&P 500 16.0%
REITS 4.4%
MSCI World 5.5%
Cash 6.2%
MSCI EM -2.4%
Cash 1.8%
Commodities 23.9%
Commodities 9.1%
MSCI World 10.0%
S&P 500 15.8%
US Treasuries 9.1%
Commodities -35.6%
Gold 24.4%
MSCI World 12.3%
MSCI World -5.0%
Gold 7.1%
Cash 0.1%
Cash 0.0%
Gold -5.9%
REITS -7.8%
REITS -2.4%
Gold 19.4%
Gold 5.5%
S&P 500 4.9%
Hedge Funds 9.3%
US Fixed Inc 7.0%
S&P 500 -37.0%
Commodities 18.9%
MSCI EAFE 8.2%
REITS -5.7%
US Fixed Inc 4.5%
US Fixed Inc -2.2%
Hedge funds -1.0%
S&P 500 -9.1%
S&P 500 -11.9%
MSCI EM -6.0%
Hedge Funds 13.4%
US Fixed Inc 4.3%
Cash 3.1%
Cash 4.9%
S&P 500 5.5%
MSCI World -40.3%
Hedge Funds 13.4%
US Fixed Inc 6.8%
Hedge Funds -8.9%
Hedge Funds 3.5%
MSCI EM -2.3%
Gold -1.7%
MSCI World -12.9%
MSCI World -16.5%
MSCI EAFE -15.7%
US Fixed Inc 4.1%
US Treasuries 3.5%
US Treasuries 2.8%
US Fixed Inc 4.4%
Cash 5.0%
MSCI EAFE -43.1%
US Fixed Inc 6.1%
US Treasuries 5.9%
MSCI EAFE -11.7%
US Treasuries 2.2%
US Treasuries -3.3%
MSCI EM -1.8%
MSCI EAFE -14.0%
Commodities 19.5%
MSCI World -19.5%
US Treasuries 2.3%
Hedge Funds 2.7%
Hedge Funds 2.7%
US Treasuries 3.1%
Hedge Funds 4.2%
REITS -50.2%
Cash 0.2%
Hedge Funds 5.2%
Commodities -13.3%
Cash 0.1%
Commodities -9.5%
MSCI EAFE -4.5%
MSCI EM -30.9%
MSCI EAFE -21.2%
S&P 500 -22.1%
Cash 1.1%
Cash 1.3%
US Fixed Inc 2.6%
Commodities 2.1%
REITS -10.0%
MSCI EM -53.2%
US Treasuries -3.7%
Cash 0.1%
MSCI EM -18.2%
Commodities -1.1%
Gold -28.0%
Commodities -17.0%
Historical Asset Class Performance
Po
rtfo
lio
M
an
ag
em
en
t

Life’s better when we’re connected®
Appendix
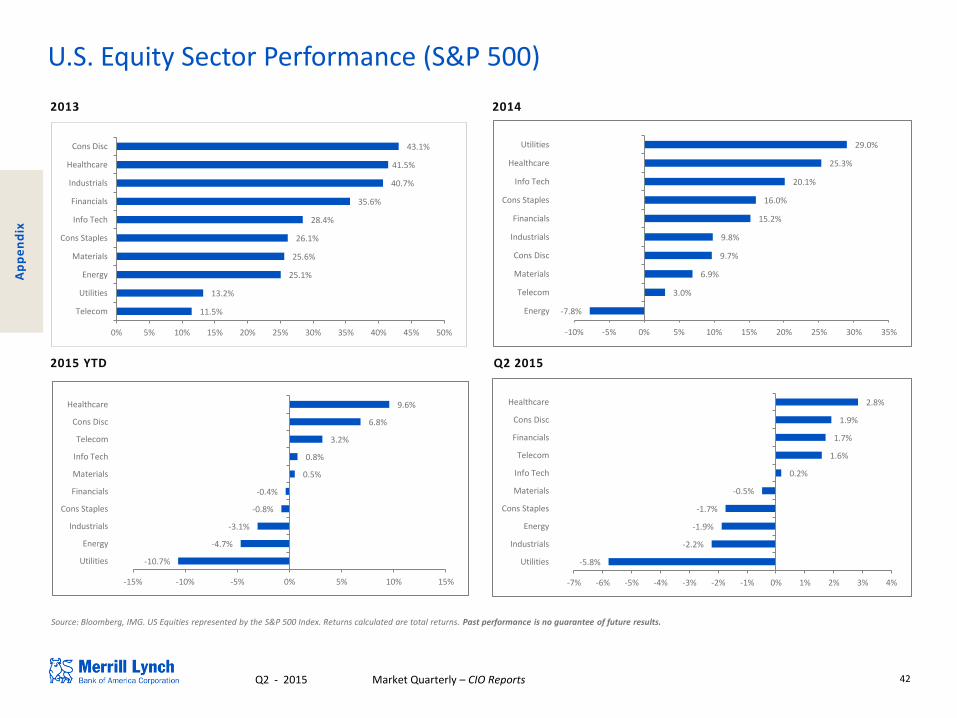
42 Q2 - 2015 Market Quarterly – CIO Reports
U.S. Equity Sector Performance (S&P 500)
Ap
pe
nd
ix
Source: Bloomberg, IMG. US Equities represented by the S&P 500 Index. Returns calculated are total returns. Past performance is no guarantee of future results.
2013 2014
2015 YTD Q2 2015
11.5%
13.2%
25.1%
25.6%
26.1%
28.4%
35.6%
40.7%
41.5%
43.1%
0% 5% 10% 15% 20% 25% 30% 35% 40% 45% 50%
Telecom
Utilities
Energy
Materials
Cons Staples
Info Tech
Financials
Industrials
Healthcare
Cons Disc
-7.8%
3.0%
6.9%
9.7%
9.8%
15.2%
16.0%
20.1%
25.3%
29.0%
-10% -5% 0% 5% 10% 15% 20% 25% 30% 35%
Energy
Telecom
Materials
Cons Disc
Industrials
Financials
Cons Staples
Info Tech
Healthcare
Utilities
-5.8%
-2.2%
-1.9%
-1.7%
-0.5%
0.2%
1.6%
1.7%
1.9%
2.8%
-7% -6% -5% -4% -3% -2% -1% 0% 1% 2% 3% 4%
Utilities
Industrials
Energy
Cons Staples
Materials
Info Tech
Telecom
Financials
Cons Disc
Healthcare
-10.7%
-4.7%
-3.1%
-0.8%
-0.4%
0.5%
0.8%
3.2%
6.8%
9.6%
-15% -10% -5% 0% 5% 10% 15%
Utilities
Energy
Industrials
Cons Staples
Financials
Materials
Info Tech
Telecom
Cons Disc
Healthcare
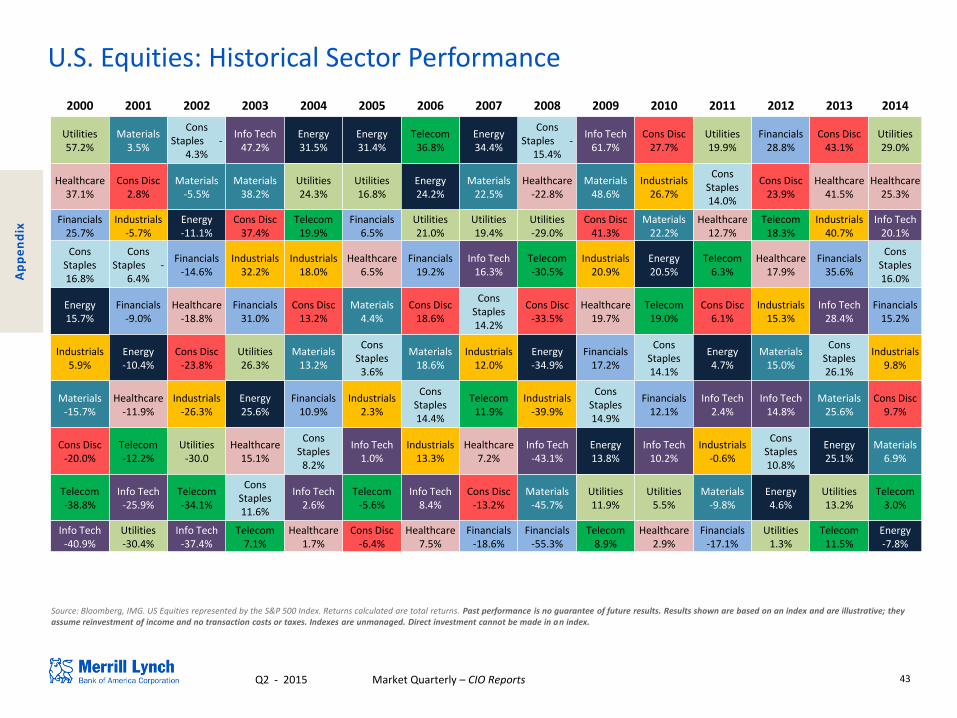
43 Q2 - 2015 Market Quarterly – CIO Reports
Source: Bloomberg, IMG. US Equities represented by the S&P 500 Index. Returns calculated are total returns. Past performance is no guarantee of future results. Results shown are based on an index and are illustrative; they assume reinvestment of income and no transaction costs or taxes. Indexes are unmanaged. Direct investment cannot be made in an index.
Ap
pe
nd
ix
2000 2001 2002 2003 2004 2005 2006 2007 2008 2009 2010 2011 2012 2013 2014
Utilities 57.2%
Materials 3.5%
Cons Staples -
4.3%
Info Tech 47.2%
Energy 31.5%
Energy 31.4%
Telecom 36.8%
Energy 34.4%
Cons Staples -
15.4%
Info Tech 61.7%
Cons Disc 27.7%
Utilities 19.9%
Financials 28.8%
Cons Disc 43.1%
Utilities 29.0%
Healthcare 37.1%
Cons Disc 2.8%
Materials -5.5%
Materials 38.2%
Utilities 24.3%
Utilities 16.8%
Energy 24.2%
Materials 22.5%
Healthcare -22.8%
Materials 48.6%
Industrials 26.7%
Cons Staples 14.0%
Cons Disc 23.9%
Healthcare 41.5%
Healthcare 25.3%
Financials 25.7%
Industrials -5.7%
Energy -11.1%
Cons Disc 37.4%
Telecom 19.9%
Financials 6.5%
Utilities 21.0%
Utilities 19.4%
Utilities -29.0%
Cons Disc 41.3%
Materials 22.2%
Healthcare 12.7%
Telecom 18.3%
Industrials 40.7%
Info Tech 20.1%
Cons Staples 16.8%
Cons Staples -
6.4%
Financials -14.6%
Industrials 32.2%
Industrials 18.0%
Healthcare 6.5%
Financials 19.2%
Info Tech 16.3%
Telecom -30.5%
Industrials 20.9%
Energy 20.5%
Telecom 6.3%
Healthcare 17.9%
Financials 35.6%
Cons Staples 16.0%
Energy 15.7%
Financials -9.0%
Healthcare -18.8%
Financials 31.0%
Cons Disc 13.2%
Materials 4.4%
Cons Disc 18.6%
Cons Staples 14.2%
Cons Disc -33.5%
Healthcare 19.7%
Telecom 19.0%
Cons Disc 6.1%
Industrials 15.3%
Info Tech 28.4%
Financials 15.2%
Industrials 5.9%
Energy -10.4%
Cons Disc -23.8%
Utilities 26.3%
Materials 13.2%
Cons Staples
3.6%
Materials 18.6%
Industrials 12.0%
Energy -34.9%
Financials 17.2%
Cons Staples 14.1%
Energy 4.7%
Materials 15.0%
Cons Staples 26.1%
Industrials 9.8%
Materials -15.7%
Healthcare -11.9%
Industrials -26.3%
Energy 25.6%
Financials 10.9%
Industrials 2.3%
Cons Staples 14.4%
Telecom 11.9%
Industrials -39.9%
Cons Staples 14.9%
Financials 12.1%
Info Tech 2.4%
Info Tech 14.8%
Materials 25.6%
Cons Disc 9.7%
Cons Disc -20.0%
Telecom -12.2%
Utilities -30.0
Healthcare 15.1%
Cons Staples
8.2%
Info Tech 1.0%
Industrials 13.3%
Healthcare 7.2%
Info Tech -43.1%
Energy 13.8%
Info Tech 10.2%
Industrials -0.6%
Cons Staples 10.8%
Energy 25.1%
Materials 6.9%
Telecom -38.8%
Info Tech -25.9%
Telecom -34.1%
Cons Staples 11.6%
Info Tech 2.6%
Telecom -5.6%
Info Tech 8.4%
Cons Disc -13.2%
Materials -45.7%
Utilities 11.9%
Utilities 5.5%
Materials -9.8%
Energy 4.6%
Utilities 13.2%
Telecom 3.0%
Info Tech -40.9%
Utilities -30.4%
Info Tech -37.4%
Telecom 7.1%
Healthcare 1.7%
Cons Disc -6.4%
Healthcare 7.5%
Financials -18.6%
Financials -55.3%
Telecom 8.9%
Healthcare 2.9%
Financials -17.1%
Utilities 1.3%
Telecom 11.5%
Energy -7.8%
U.S. Equities: Historical Sector Performance
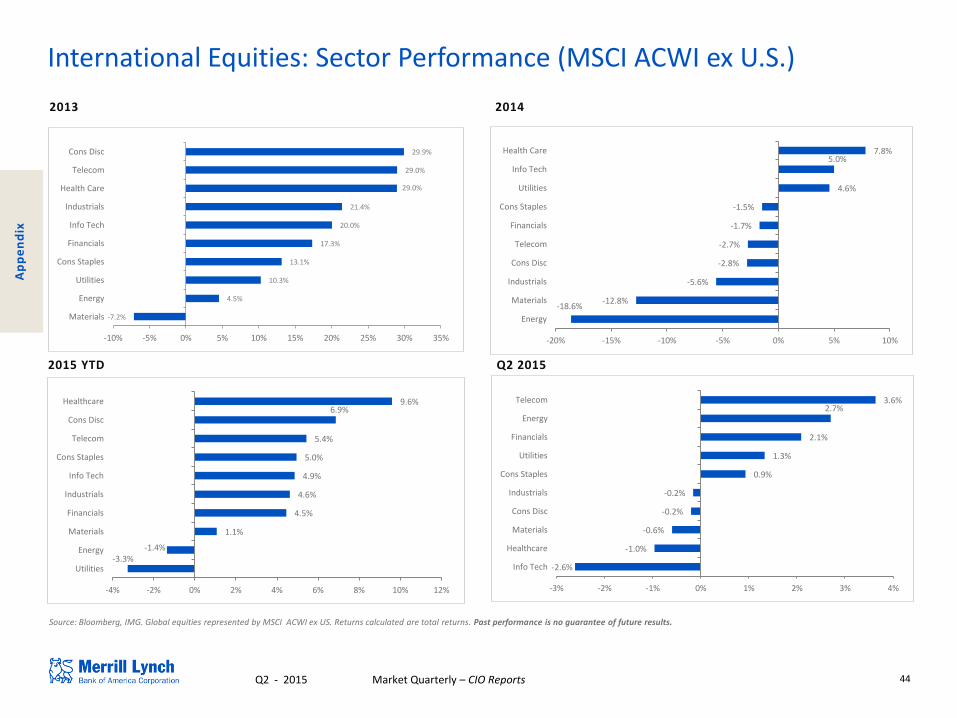
44 Q2 - 2015 Market Quarterly – CIO Reports
International Equities: Sector Performance (MSCI ACWI ex U.S.)
Ap
pe
nd
ix
Source: Bloomberg, IMG. Global equities represented by MSCI ACWI ex US. Returns calculated are total returns. Past performance is no guarantee of future results.
2013
2015 YTD
2014
Q2 2015
-7.2%
4.5%
10.3%
13.1%
17.3%
20.0%
21.4%
29.0%
29.0%
29.9%
-10% -5% 0% 5% 10% 15% 20% 25% 30% 35%
Materials
Energy
Utilities
Cons Staples
Financials
Info Tech
Industrials
Health Care
Telecom
Cons Disc
-18.6% -12.8%
-5.6%
-2.8%
-2.7%
-1.7%
-1.5%
4.6%
5.0% 7.8%
-20% -15% -10% -5% 0% 5% 10%
Energy
Materials
Industrials
Cons Disc
Telecom
Financials
Cons Staples
Utilities
Info Tech
Health Care
-2.6%
-1.0%
-0.6%
-0.2%
-0.2%
0.9%
1.3%
2.1%
2.7% 3.6%
-3% -2% -1% 0% 1% 2% 3% 4%
Info Tech
Healthcare
Materials
Cons Disc
Industrials
Cons Staples
Utilities
Financials
Energy
Telecom
-3.3% -1.4%
1.1%
4.5%
4.6%
4.9%
5.0%
5.4%
6.9% 9.6%
-4% -2% 0% 2% 4% 6% 8% 10% 12%
Utilities
Energy
Materials
Financials
Industrials
Info Tech
Cons Staples
Telecom
Cons Disc
Healthcare
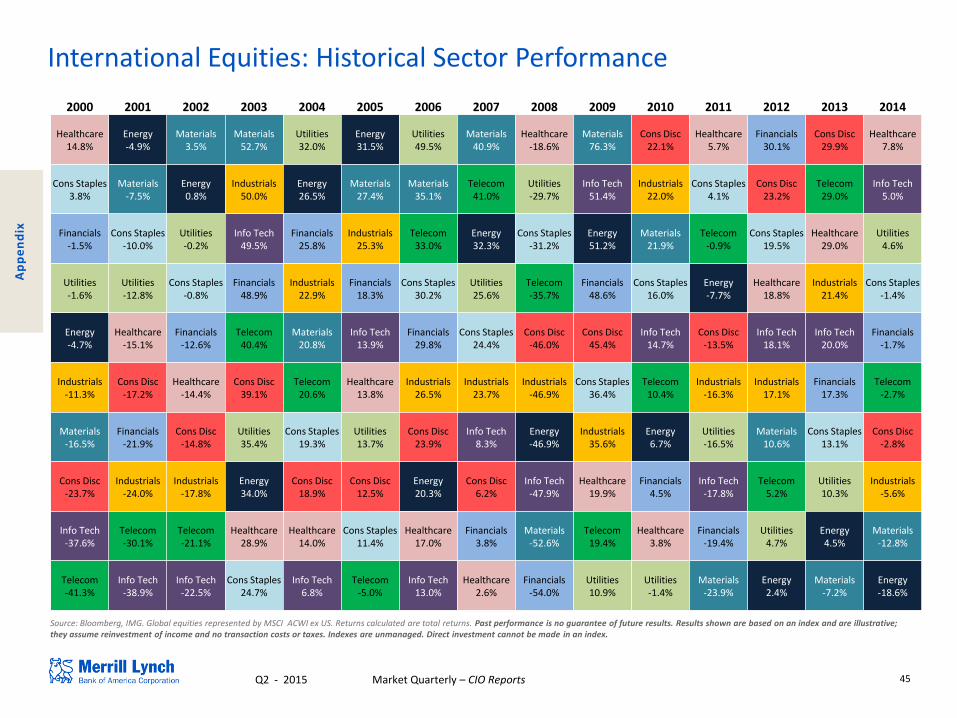
45 Q2 - 2015 Market Quarterly – CIO Reports
International Equities: Historical Sector Performance
Source: Bloomberg, IMG. Global equities represented by MSCI ACWI ex US. Returns calculated are total returns. Past performance is no guarantee of future results. Results shown are based on an index and are illustrative; they assume reinvestment of income and no transaction costs or taxes. Indexes are unmanaged. Direct investment cannot be made in an index.
Ap
pe
nd
ix
2000 2001 2002 2003 2004 2005 2006 2007 2008 2009 2010 2011 2012 2013 2014
Healthcare 14.8%
Energy -4.9%
Materials 3.5%
Materials 52.7%
Utilities 32.0%
Energy 31.5%
Utilities 49.5%
Materials 40.9%
Healthcare -18.6%
Materials 76.3%
Cons Disc 22.1%
Healthcare 5.7%
Financials 30.1%
Cons Disc 29.9%
Healthcare 7.8%
Cons Staples 3.8%
Materials -7.5%
Energy 0.8%
Industrials 50.0%
Energy 26.5%
Materials 27.4%
Materials 35.1%
Telecom 41.0%
Utilities -29.7%
Info Tech 51.4%
Industrials 22.0%
Cons Staples 4.1%
Cons Disc 23.2%
Telecom 29.0%
Info Tech 5.0%
Financials -1.5%
Cons Staples -10.0%
Utilities -0.2%
Info Tech 49.5%
Financials 25.8%
Industrials 25.3%
Telecom 33.0%
Energy 32.3%
Cons Staples -31.2%
Energy 51.2%
Materials 21.9%
Telecom -0.9%
Cons Staples 19.5%
Healthcare 29.0%
Utilities 4.6%
Utilities -1.6%
Utilities -12.8%
Cons Staples -0.8%
Financials 48.9%
Industrials 22.9%
Financials 18.3%
Cons Staples 30.2%
Utilities 25.6%
Telecom -35.7%
Financials 48.6%
Cons Staples 16.0%
Energy -7.7%
Healthcare 18.8%
Industrials 21.4%
Cons Staples -1.4%
Energy -4.7%
Healthcare -15.1%
Financials -12.6%
Telecom 40.4%
Materials 20.8%
Info Tech 13.9%
Financials 29.8%
Cons Staples 24.4%
Cons Disc -46.0%
Cons Disc 45.4%
Info Tech 14.7%
Cons Disc -13.5%
Info Tech 18.1%
Info Tech 20.0%
Financials -1.7%
Industrials -11.3%
Cons Disc -17.2%
Healthcare -14.4%
Cons Disc 39.1%
Telecom 20.6%
Healthcare 13.8%
Industrials 26.5%
Industrials 23.7%
Industrials -46.9%
Cons Staples 36.4%
Telecom 10.4%
Industrials -16.3%
Industrials 17.1%
Financials 17.3%
Telecom -2.7%
Materials -16.5%
Financials -21.9%
Cons Disc -14.8%
Utilities 35.4%
Cons Staples 19.3%
Utilities 13.7%
Cons Disc 23.9%
Info Tech 8.3%
Energy -46.9%
Industrials 35.6%
Energy 6.7%
Utilities -16.5%
Materials 10.6%
Cons Staples 13.1%
Cons Disc -2.8%
Cons Disc -23.7%
Industrials -24.0%
Industrials -17.8%
Energy 34.0%
Cons Disc 18.9%
Cons Disc 12.5%
Energy 20.3%
Cons Disc 6.2%
Info Tech -47.9%
Healthcare 19.9%
Financials 4.5%
Info Tech -17.8%
Telecom 5.2%
Utilities 10.3%
Industrials -5.6%
Info Tech -37.6%
Telecom -30.1%
Telecom -21.1%
Healthcare 28.9%
Healthcare 14.0%
Cons Staples 11.4%
Healthcare 17.0%
Financials 3.8%
Materials -52.6%
Telecom 19.4%
Healthcare 3.8%
Financials -19.4%
Utilities 4.7%
Energy 4.5%
Materials -12.8%
Telecom -41.3%
Info Tech -38.9%
Info Tech -22.5%
Cons Staples 24.7%
Info Tech 6.8%
Telecom -5.0%
Info Tech 13.0%
Healthcare 2.6%
Financials -54.0%
Utilities 10.9%
Utilities -1.4%
Materials -23.9%
Energy 2.4%
Materials -7.2%
Energy -18.6%
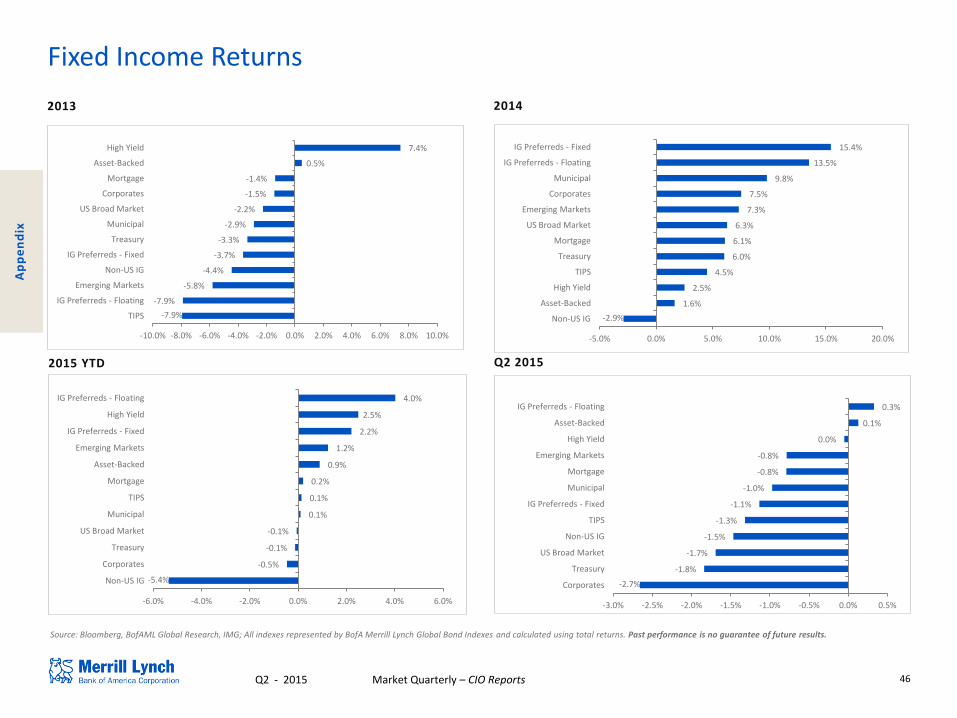
46 Q2 - 2015 Market Quarterly – CIO Reports
Fixed Income Returns
Source: Bloomberg, BofAML Global Research, IMG; All indexes represented by BofA Merrill Lynch Global Bond Indexes and calculated using total returns. Past performance is no guarantee of future results.
Ap
pe
nd
ix
2013 2014
-7.9%
-7.9%
-5.8%
-4.4%
-3.7%
-3.3%
-2.9%
-2.2%
-1.5%
-1.4%
0.5%
7.4%
-10.0% -8.0% -6.0% -4.0% -2.0% 0.0% 2.0% 4.0% 6.0% 8.0% 10.0%
TIPS
IG Preferreds - Floating
Emerging Markets
Non-US IG
IG Preferreds - Fixed
Treasury
Municipal
US Broad Market
Corporates
Mortgage
Asset-Backed
High Yield
2015 YTD Q2 2015
-2.9%
1.6%
2.5%
4.5%
6.0%
6.1%
6.3%
7.3%
7.5%
9.8%
13.5%
15.4%
-5.0% 0.0% 5.0% 10.0% 15.0% 20.0%
Non-US IG
Asset-Backed
High Yield
TIPS
Treasury
Mortgage
US Broad Market
Emerging Markets
Corporates
Municipal
IG Preferreds - Floating
IG Preferreds - Fixed
-2.7%
-1.8%
-1.7%
-1.5%
-1.3%
-1.1%
-1.0%
-0.8%
-0.8%
0.0%
0.1%
0.3%
-3.0% -2.5% -2.0% -1.5% -1.0% -0.5% 0.0% 0.5%
Corporates
Treasury
US Broad Market
Non-US IG
TIPS
IG Preferreds - Fixed
Municipal
Mortgage
Emerging Markets
High Yield
Asset-Backed
IG Preferreds - Floating
-5.4%
-0.5%
-0.1%
-0.1%
0.1%
0.1%
0.2%
0.9%
1.2%
2.2%
2.5%
4.0%
-6.0% -4.0% -2.0% 0.0% 2.0% 4.0% 6.0%
Non-US IG
Corporates
Treasury
US Broad Market
Municipal
TIPS
Mortgage
Asset-Backed
Emerging Markets
IG Preferreds - Fixed
High Yield
IG Preferreds - Floating
47 Q2 - 2015 Market Quarterly – CIO Reports
Consumer Price Index (CPI) Level: Base Year 1982-84: 100. The CPI represents changes in prices of all good and services purchased for consumption by urban households. User fees and sales and excised taxes paid by the consumer are also included. Income taxes and investment items are not included.
CPI Core Index Level: Base year 1982-84; it excludes food and energy items from the Consumer Price Index Level.
Current Account Deficit: Occurs when a country's total import of goods, services and transfers is greater than the country's total export of goods, services and transfers; this situation makes a country a net debtor to the rest of the world.
Developed Markets: a country that is most developed in terms of its economy and capital markets. The country must be high income, but this also includes openness to foreign ownership, ease of capital movement, and efficiency of market institutions.
Emerging Markets: a country that is progressing toward becoming advanced, as shown by some liquidity in local debt and equity markets and the existence of some form of market exchange and regulatory body.
GDP Nominal: Gross Domestic Product (GDP) equals the total income of everyone in the economy or the total expenditure on the economy’s good and services. GDP includes only the value of final goods and services. Nominal GDP measures the value of goods and services at current dollar prices.
GDP Real: The chain weighted GDP measure of good and services at constant dollar prices. The base year changes continuously over time (e.g., 1995, process measures real growth from 1995-1996). The figures are then linked to a chain that can compare goods and services in any two years. Chain weighted figures never let prices get too far out of date.
Jobless Claims: Average weekly initial claims for unemployment insurance: measures the average number of new claims for unemployment compensation per week.
US Employees Non-Farm Private Payrolls: A statistic that represents the total number of paid US workers except for farm workers, general government employees, employees of nonprofit organizations that provide assistance to individuals, and private household employees. The Non-Farm Private Payroll represents about 80% of the workers who produce the US Gross Domestic Product.
Glossary
Ap
pe
nd
ix
48 Q2 - 2015 Market Quarterly – CIO Reports
Alerian MLP Index is a composite of the 50 most prominent energy master limited partnerships and will be calculated by Standard & Poor’s using a float-adjusted, market capitalization-weighted methodology. The total return index is calculated on an end-of-day basis and will be disseminated daily through its ticker symbol, “AMZX” on the New York Stock Exchange.
Barclays Capital US Aggregate Index is a broad-based benchmark that measures the investment grade, US dollar-denominated, fixed-rate taxable bond market, including Treasuries, government-related and corporate securities, MBS (agency fixed rated and hybrid ARM pass throughs), ABS, and CMBS.
Bloomberg Commodity Index is made up of 22 exchange-traded futures on physical commodities, which are weighted to account for economic significance and market liquidity.
Cambridge Associates Private Equity US Total Return: Performance data is calculated quarterly by Cambridge Associates and published by Thomson Reuters Venture Economics’ Private Equity Performance Database which tracks the performance of thousands of US and European venture capital and buyout funds formed since 1969. Sources are financial documents and schedules from Limited Partners investors and General Partners. All returns are calculated net to investors (net of fees and carried interest) by Thomson Venture Economics from the underlying financial cash-flows using both cash on cash returns (distributions and capital calls) and the unrealized net asset value of funds as reported by private equity fund managers. The “US” category includes only US funds.
DJ Credit Suisse AllHedge Index is an asset-weighted hedge fund index derived from the market leading Dow Jones Credit Suisse Hedge Fund Index. The Dow Jones Credit Suisse AllHedge Index provides a rules-based measure of an investable portfolio. Index performance data is published monthly and constituents are rebalanced semi-annually according to the sector weights of the Dow Jones Credit Suisse Hedge Fund Index
DJ Credit Suisse AllHedge Convertible Arbitrage Index measures the aggregate performance of convertible arbitrage funds. Convertible arbitrage funds typically aim to profit from the purchase of convertible securities and the subsequent shorting of the corresponding stock when there is a pricing error made in the conversion factor of the security.
DJ Credit Suisse AllHedge Equity Market Neutral Index measures the aggregate performance of equity market neutral funds. Equity market neutral funds typically take both long and short positions in stocks while seeking to reduce exposure to the systematic risk of the market (i.e., a beta of zero is desired).
DJ Credit Suisse AllHedge Event Driven Index measures the aggregate performance of event driven funds. Event driven funds typically invest in various asset classes and seek to profit from potential mispricing of securities related to a specific corporate or market event. Such events can include: mergers, bankruptcies, financial or operational stress, restructurings, asset sales, recapitalizations, spin-offs, litigation, regulatory and legislative changes as well as other types of corporate events.
DJ Credit Suisse AllHedge Emerging Markets Index measures the aggregate performance of emerging markets funds. Emerging markets funds typically invest in currencies, debt instruments, equities and other instruments of countries with “emerging” or developing markets (typically measured by GDP per capita). Such countries are considered to be in a transitional phase between developing and developed status.
DJ Credit Suisse AllHedge Fixed Income Arbitrage Index measures the aggregate performance of fixed income arbitrage funds. Fixed income arbitrage funds typically attempt to generate profits by exploiting inefficiencies and price anomalies between related fixed income securities. Fixed income arbitrage funds seek to limit volatility by hedging out exposure to the market and interest rate risk.
DJ Credit Suisse AllHedge Long Short Equity Index measures the aggregate performance of long/short equity funds. Long/short equity funds typically invest in both long and short sides of equity markets, generally focusing on diversifying or hedging across particular sectors, regions or market capitalizations.
DJ Credit Suisse AllHedge Global Macro Index measures the aggregate performance of global macro funds. Global macro funds typically focus on identifying extreme price valuations and leverage is often applied on the anticipated price movements in equity, currency, interest rate and commodity markets.
Index Definitions
Ap
pe
nd
ix
49 Q2 - 2015 Market Quarterly – CIO Reports
DJ Credit Suisse AllHedge Managed Futures Index measures the aggregate performance of managed futures funds. Managed futures funds (often referred to as CTAs or Commodity Trading Advisors) typically focus on investing in listed bond, equity, commodity futures and currency markets, globally.
Dow Jones Industrial Average (DJIA) measures the performance of 30 leading US blue-chip companies.
DXY Index indicates the general international value of the USD. The Index does this by averaging the exchange rates between the USD and major world currencies.
FTSE NAREIT US Real Estate Index is a performance index based on publicly traded real estate investment trusts (REITs), that span commercial real estate space across the US economy. The index series provides investors with exposure to all investment and property sectors. A REIT is a company that owns, and in most cases, operates income-producing real estate such as apartments, shopping centers, offices, hotels and warehouses. Some REITs also engage in financing real estate. To qualify as a REIT, a company must distribute at least 90 percent of its taxable income to its shareholders annually. A company that qualifies as a REIT is permitted to deduct dividends paid to its shareholders from its corporate taxable income. As a result, most REITs remit at least 100 percent of their taxable income to their shareholders and therefore owe no corporate tax.
FTSE®EPRA®/NAREIT® Global Index is a free float, market capitalization-weighted real estate index designed to represent publicly traded equity REITs and listed property companies globally.
Gold reflects the gold spot price and is quoted in USD per Troy Ounce.
HFRX Global Hedge Fund Index is an asset-weighted index that includes over 55 constituent funds. All funds must be open to new investments, have at least $50 Million under management and have a 24-month track record. The index is rebalanced quarterly. The HFRX Global Hedge Fund Index is designed to be representative of the overall composition of the hedge fund universe.
JPMorgan Global FX Volatility Index tracks the implied volatility on three-month options on G7 and emerging market economy currencices, with individual weightings based on Bank of International Settlements (BIS) daily turnover percentages
ML US Broad Market Index tracks the performance of US dollar denominated investment grade Government and Corporate public debt issued in the US Domestic bond market, including collateralized products such as Mortgage Pass-Through and Asset Backed securities.
ML US Corporate Master Index tracks the performance of US dollar-denominated investment grade corporate public debt issued in the US domestic bond market. Qualifying bonds must have at least one year remaining term to maturity, a fixed coupon schedule and a minimum amount outstanding of $150 million. Bonds must be rated investment grade based on a composite of Moody’s and S&P.
ML Municipal Masters Index tracks the performance of the investment grade US tax-exempt bond market.
ML Global Sovereign Broad Market Index tracks the performance of local currency denominated debt of investment grade rated Sovereign issuers.
ML Global Emerging Markets Sovereign Index tracks the performance of US dollar denominated debt of sovereign issuers domiciled in countries with a BB or lower foreign currency long-term sovereign debt rating.
ML High Yield Master Index tracks the performance of below investment grade US dollar-denominated corporate bonds publicly issued in the US domestic market. “Yankee” bonds (debt of foreign issuers issued in the US domestic market) are included in the Index provided the issuer is domiciled in a country having an investment grade foreign currency long-term debt rating (based on a composite of Moody’s and S&P).
Index Definitions
Ap
pe
nd
ix
50 Q2 - 2015 Market Quarterly – CIO Reports
ML Mortgage Master Index tracks the performance of US dollar denominated 30-year, 15-year and balloon pass-through mortgage securities having at least $150 million outstanding per generic production year.
MSCI® World Index is a free float-adjusted market capitalization index that is designed to measure global developed market equity performance. As of July 2009 the MSCI World Index consisted of the following 23 developed market country indexes: Australia, Austria, Belgium, Canada, Denmark, Finland, France, Germany, Greece, Hong Kong, Ireland, Italy, Japan, Netherlands, New Zealand, Norway, Portugal, Singapore, Spain, Sweden, Switzerland, the United Kingdom and the United States.
MSCI® EAFE (Europe, Australasia, and Far East) Index comprises 21 MSCI country indexes, representing the developed markets outside of North America.
MSCI® Emerging Markets Index is a free float-adjusted market capitalization index that is designed to measure equity market performance in the global emerging markets. As of July 2009, the MSCI Emerging Markets Index consisted of the following 25 emerging market country indexes: Brazil, Chile, China, Colombia, Czech Republic, Egypt, Hungary, India, Indonesia, Israel, Korea, Malaysia, Mexico, Morocco, Peru, Philippines, Poland, Russia, South Africa, Taiwan, Thailand, and Turkey.
MSCI® Europe non-UK Index is a free float-adjusted market capitalization index that is designed to measure developed market equity performance in Europe. As of July 2009, the MSCI Europe Index consisted of the following 15 developed market country indexes: Austria, Belgium, Denmark, Finland, France, Germany, Greece, Ireland, Italy, the Netherlands, Norway, Portugal, Spain, Sweden, and Switzerland.
Muni Yields uses the Moody’s Municipal Bond Yield Average AAA 10 Year. Derived from pricing data on unenhanced newly issued general obligation bonds each observation is an unweighted average.
WTI Crude Oil reflects the Bloomberg West Texas Intermediate Crushing Crude Oil Spot Price. The price is derived by adding spot market spreads to the NYMEX contract. Units are in USD per barrel and is traded intraday.
Russell 1000 Growth Index® measures the performance of those Russell 1000 companies with higher price-to-book ratios and higher forecasted growth values.
Russell 1000 Value Index® measures the performance of those Russell 1000 companies with lower price-to-book ratios and lower forecasted growth values.
Russell 2000 Index® measures the performance of the 2,000 smallest companies in the Russell 3000 Index.
Russell 2000 Growth Index. The index measures the performance of those Russell 2000 companies with higher price-to-book ratios and higher forecasted growth values
Russell 2000 Value Index. The index measures the performance of those Russell 2000 companies with lower price-to-book ratios and lower forecasted growth values.
Silver reflects the silver spot price and is quoted in USD per Troy Ounce.
S&P 500 Index is widely regarded as the best single gauge of the US equities market, this world-renowned index includes a representative sample of 500 leading companies in leading industries of the US economy. Although the S&P 500 focuses on the large-cap segment of the market, with approximately 75% coverage of US equities, it is also an ideal proxy for the total market. An investor cannot invest directly in an index.
S&P 400 Mid Cap Index is representative of 400 stocks in the mid-range sector of the domestic stock market, representing all major industries
Ten-Year Treasury relates the yield on a security to its time to maturity and is based on the closing market bid yields on actively traded Treasury securities in the over-the-counter market.
VIX Index is the Chicago Board Options Exchange Standard and Poor’s Volatility Index reflects a market estimate of future volatility, based on the weighted average of the implied volatilities for a wide range of strikes.
Index Definitions
Ap
pe
nd
ix
51 Q2 - 2015 Market Quarterly – CIO Reports
Reference to indices, or other measures of relative market performance over a specified period of time (each, an “index”) are provided for illustrative purposes only, do not represent a benchmark or proxy for the return or volatility of any particular product, portfolio, security holding, or AI. Indices are unmanaged. The figures for the index reflect the reinvestment of dividends but do not reflect the deduction of any fees or expenses which would reduce returns. Investors cannot invest directly in indices. We strongly recommend that these factors be taken into consideration before an investment decision is made. Neither Merrill Lynch nor the index sponsor can verify the validity or accuracy of the self reported returns of the managers used to calculate the index returns. Merrill Lynch does not guarantee the accuracy of the index returns and does not recommend any investment or other decision based on the results presented. The indices referred in the presentation do not reflect the performance of any account or fund managed by Merrill Lynch or its affiliates, or of any other specific fund or account, and do not reflect the deduction of any management or performance fees or expenses. The hedge fund universe from which the components of the indices are selected is based on funds which have continued to report results for a minimum period of time. This prerequisite for fund selection interjects a significant element of “survivor bias” into the reported levels of the indices, as generally only successful funds will continue to report for the required period, so that the funds from which the statistical analysis or the performance of the indices to date is derived necessarily tend to have been successful. There can, however, be no assurance that such funds will continue to be successful in the future. Indices are unmanaged and results shown are not reduced by taxes or transaction costs such as fees. It is not possible to invest directly in an Index.
Alternative Investments are speculative and subject to a high degree of risk. Although risk management policies and procedures can be effective in reducing or mitigating the effects of certain risks, no risk management policy can completely eliminate the possibility of sudden and severe losses, illiquidity and the occurrence of other material adverse effects. Some or all alternative investment programs may not be suitable for certain investors. Many alternative investment products, specifically private equity and most hedge funds, require purchasers to be “qualified purchasers” within the meaning of the federal securities laws (generally, individuals who own at least $5 million in “investments” and institutional investors who own at least $25 million in “investments,” as such term is defined in the federal securities laws). No assurance can be given that any alternative investment’s investment objectives will be achieved. In addition to certain general risks, each product will be subject to its own specific risks, including strategy and market risk.
Alternative Investments such as derivatives, hedge funds, private equity funds, and funds of funds can result in higher return potential but also higher loss potential. Changes in economic conditions or other circumstances may adversely affect your investments. Before you invest in alternative investments, you should consider your overall financial situation, how much money you have to invest, your need for liquidity, and your tolerance for risk.
Investors should bear in mind that the global financial markets are subject to periods of extraordinary disruption and distress. During the financial crisis of 2008-2009, many private investment funds incurred significant or even total losses, suspended redemptions or otherwise severely restricted investor liquidity, including increasing the notice period required for redemptions, instituting gates on the percentage of fund interests that could be redeemed in any given period and creating side-pockets and special purpose vehicles to hold illiquid securities as they are liquidated. Other funds may take similar steps in the future to prevent forced liquidation of their portfolios into a distressed market. In addition, investment funds implementing alternative investment strategies are subject to the risk of ruin and may become illiquid under a variety of circumstances, irrespective of general market conditions.
There may be conflicts of interest relating to the alternative investment and its service providers, including Bank of America, and its affiliates, who are engaged in businesses and have clear interests other than that of managing, distributing and otherwise providing services to the alternative investment. These activities and interests include potential multiple advisory, transactional and financial and other interests in securities and instruments that may purchase or sell such securities and instruments. These are considerations of which investors in the alternative investments should be aware. Additional information relating to these conflicts is set forth in the offering materials for the alternative investment.
The opinions expressed herein are those of the Merrill Lynch GWM Investment Management & Guidance as of the date of this material and are subject to change. It is provided as general market commentary only, and it does not consider the specific investment objectives, financial situation or particular needs of any one client. It should not be considered a recommendation or solicitation to purchase or sell any security. There is no guarantee that any future event discussed herein will come to pass. When reading this commentary, you should consider that investments in securities involve risk and you could lose some or all of the amounts you have invested. The information herein was obtained from various sources, which we believe to be reliable, but we do not guarantee its accuracy or completeness. The indexes referenced herein are unmanaged and are not available for direct investment; returns assume no management, transaction or other expenses and also assume reinvestment of dividends, interest and/or capital gains. Past performance does not guarantee or indicate future results.
Merrill Lynch assumes no responsibility for any of the foregoing performance information, which has been provided by the index sponsor. Neither Merrill Lynch nor the index sponsor can verify the validity or accuracy of the self-reported returns of the managers used to calculate the index returns. Merrill Lynch does not guarantee the accuracy of the index returns and does not recommend any investment or other decision based on the results presented.
The investments discussed have varying degrees of risk. Some of the risks involved with equities include the possibility that the value of the stocks may fluctuate in response to events specific to the companies or markets, as well as economic, political or social events in the U.S. or abroad. Bonds are subject to interest rate, inflation and credit risks. Investments in high-yield bonds may be subject to greater market fluctuations and risk of loss of income and principal than securities in higher rated categories. Investments in foreign securities involve special risks, including foreign currency risk and the possibility of substantial volatility due to adverse political, economic or other developments. These risks are magnified for investments made in emerging markets. Investments in a certain industry or sector may pose additional risk due to lack of diversification and sector concentration. Investments in real estate securities can be subject to fluctuations in the value of the underlying properties, the effect of economic conditions on real estate values, changes in interest rates, and risk related to renting properties, such as rental defaults. There are special risks associated with an investment in commodities, including market price fluctuations, regulatory changes, interest rate changes, credit risk, economic changes and the impact of adverse political or financial factors.

Life’s better when we’re connected®