Standard Chartered PLC 3Q’20 Results
51
Standard Chartered PLC 3Q’21 Results Standard Chartered PLC 3Q’21 Results 2 November 2021 Registered in England under company No. 966425 Registered Office: 1 Basinghall Avenue, London, EC2V 5DD, UK
Transcript of Standard Chartered PLC 3Q’20 Results

Standard Chartered PLC 3Q’21 Results
Standard Chartered PLC 3Q’21 Results
2 November 2021
Registered in England under company No. 966425 Registered Office: 1 Basinghall Avenue, London, EC2V 5DD, UK
Standard Chartered PLC – third quarter 2021 results
Standard Chartered PLC 3Q’21 Results
Table of contents Performance highlights 1 Statement of results 2 Group Chief Financial Officer’s review 3 Supplementary financial information 11 Underlying versus statutory results reconciliations 25 Risk review 31 Capital review 36 Financial statements 41 Other supplementary financial information 46
Forward-looking statements This document may contain ‘forward-looking statements’ that are based on current expectations or beliefs, as well as assumptions about future events. These forward-looking statements can be identified by the fact that they do not relate only to historical or current facts. Forward-looking statements often use words such as ‘may’, ‘could’, ‘will’, ‘expect’, ‘intend’, ‘estimate’, ‘anticipate’, ‘believe’, ‘plan’, ‘seek’, ‘continue’ or other words of similar meaning. By their very nature, forward-looking statements are subject to known and unknown risks and uncertainties and can be affected by other factors that could cause actual results, and the Group’s plans and objectives, to differ materially from those expressed or implied in the forward-looking statements. Recipients should not place reliance on, and are cautioned about relying on, any forward-looking statements. There are several factors which could cause actual results to differ materially from those expressed or implied in forward-looking statements. The factors that could cause actual results to differ materially from those described in the forward-looking statements include (but are not limited to) changes in global, political, economic, business, competitive, market and regulatory forces or conditions, future exchange and interest rates, changes in tax rates, future business combinations or dispositions and other factors specific to the Group. Any forward- looking statement contained in this document is based on past or current trends and/or activities of the Group and should not be taken as a representation that such trends or activities will continue in the future. No statement in this document is intended to be a profit forecast or to imply that the earnings of the Group for the current year or future years will necessarily match or exceed the historical or published earnings of the Group. Each forward-looking statement speaks only as of the date of the particular statement. Except as required by any applicable laws or regulations, the Group expressly disclaims any obligation to revise or update any forward-looking statement contained within this document, regardless of whether those statements are affected as a result of new information, future events or otherwise. Please refer to the Group’s 2020 Annual Report and the 2021 Half-Year Report for a discussion of certain risks and factors that could cause actual results, and the Group’s plans and objectives, to differ materially from those expressed or implied in the forward-looking statements. Nothing in this document shall constitute, in any jurisdiction, an offer or solicitation to sell or purchase any securities or other financial instruments, nor shall it constitute a recommendation or advice in respect of any securities or other financial instruments or any other matter.
Unless another currency is specified, the word ‘dollar’ or symbol ‘$’ in this document means US dollar and the word ‘cent’ or symbol ‘c’ means one-hundredth of one US dollar.
The information within this report is unaudited.
Unless the context requires, within this document, ‘China’ refers to the People’s Republic of China and, for the purposes of this document only, excludes Hong Kong Special Administrative Region (Hong Kong), Macau Special Administrative Region (Macau) and Taiwan. ‘Korea’ or ‘South Korea’ refers to the Republic of Korea. Asia includes Australia, Bangladesh, Brunei, Cambodia, Mainland China, Hong Kong, India, Indonesia, Japan, Korea, Laos, Macau, Malaysia, Myanmar, Nepal, Philippines, Singapore, Sri Lanka, Taiwan, Thailand and Vietnam; Africa & Middle East (AME) includes Angola, Bahrain, Botswana, Cameroon, Cote d’Ivoire, Egypt, The Gambia, Ghana, Iraq, Jordan, Kenya, Lebanon, Mauritius, Nigeria, Oman, Pakistan, Qatar, Saudi Arabia, Sierra Leone, South Africa, Tanzania, the United Arab Emirates (UAE), Uganda, Zambia and Zimbabwe; and Europe & Americas (EA) includes Argentina, Brazil, Colombia, Falkland Islands, France, Germany, Ireland, Jersey, Poland, Sweden, Turkey, the UK and the US.
Within the tables in this report, blank spaces indicate that the number is not disclosed, dashes indicate that the number is zero and ‘nm’ stands for ‘not meaningful’.
Standard Chartered PLC is incorporated in England and Wales with limited liability. Standard Chartered PLC is headquartered in London. The Group’s head office provides guidance on governance and regulatory standards. Standard Chartered PLC stock codes are: HKSE 02888 and LSE STAN.LN.

Standard Chartered PLC – third quarter 2021 performance highlights
Standard Chartered PLC 3Q’21 Results 1
All figures are presented on an underlying basis and comparisons are made to the third quarter 2020 on a reported currency basis, unless otherwise stated. A reconciliation of restructuring and other items excluded from underlying results is set out on pages 25-30.
Bill Winters, Group Chief Executive, said: “We delivered a return to top-line growth in the third quarter and achieved further progress against our strategic priorities, with strong performance in our Financial Markets and Trade businesses and ongoing positive momentum in Wealth Management. We continue to transform how we serve our customers in the world’s most dynamic markets through innovation, partnerships and new ventures. Last week, we were also pleased to deliver on our sustainability commitment to set out a clear path to achieve net zero by 2050.”
Update on strategic priorities • Primary performance measure return on tangible equity improved 270bps to 7.1% • Continued good progress on strategic priorities
– Network: The proportion of digital transactions in our Corporate, Commercial & Institutional business is up 9%pts in 2021 to 50% – Sustainability: Year-to-date Sustainable Finance income has more than doubled YoY – Affluent: Net New Money of $11bn for the first nine months of the year, more than 70% higher YoY, – Mass retail: Continued growth in sales executed digitally by our clients, up 7%pts in 2021 to 76%
Selected information concerning financial performance (3Q’21 unless otherwise stated) • Income 7% higher at $3.8bn, up 5% at constant currency (ccy) and excluding normalisation adjustments
– Trade income up 13% at ccy and excluding normalising adjustments, the strongest quarter since 1Q’18 – Strong performance in Financial Markets, up 4% at ccy and excluding normalising adjustments – Wealth Management ex-Bancassurance up 3% and up 18% YoY for the nine months to September – Net interest margin (NIM) in 3Q'21 of 1.23%, up 1bp on 2Q’21, benefiting from a 7bps or $96m IFRS9 interest income adjustment
• Expenses increased 5% to $2.6bn, up 3% at ccy, and flat compared to 2Q’21 – Positive income-to-cost jaws of 3% at ccy excluding DVA
• Credit impairment of $107m, down $246m YoY; up $174m QoQ – CCIB $24m, with no significant new exposures in 3Q’21 and a small reduction in management overlay from $170m to $166m – CPBB $74m, with no change in management overlay remaining stable at $140m – High-risk assets: reduced for the fifth consecutive quarter in 3Q’21, down $1.5bn in the quarter and down $6.1bn YoY
• Underlying profit before tax up 44% to $1.1bn; statutory profit before tax up 129% to $1.0bn • Tax charge of $229m: underlying year-to-date effective tax rate of 23.5% down 7.8%pts due to change in geographic mix and
higher profits diluting the impact of non-deductible costs • Earnings per share increased 9.5 cents or 70% to 23.1 cents • The Group’s balance sheet continues to grow and remains strong, liquid and well diversified
– Customer loans and advances up 2% or $4bn since 30.06.21 and up 7% since 31.12.20 – Advances-to-deposit ratio 61.9% (30.06.21: 64.0%); liquidity coverage ratio 145% (30.06.21: 146%)
• Risk-weighted assets (RWA) of $268bn down 5% or $13bn since 30.06.21 and broadly flat to 31.12.20 – Credit RWA down $10bn in 3Q’21: asset growth offset by model changes, improvement in asset quality, asset mix changes and FX – Market risk RWA down $3bn in 3Q’21: reduced charges for Internal Models Approach (IMA) risks not in Value at Risk (VaR)
• The Group remains strongly capitalised – Common equity tier 1 (CET 1) ratio 14.6% (30.06.21: 14.1%), above the 13-14% target range; includes 34 bps software relief which
will cease from 01.01.2022 – An update on capital management actions will be provided at FY’21 results
Outlook The economic recovery from the COVID-19 pandemic has continued to be uneven and punctuated by supply-chain disruption. However, we are encouraged by robust levels of export growth across many of our markets in Asia. Against this backdrop: • We continue to expect FY’21 income to be similar to that achieved in FY’20 on a constant currency basis, with 4Q’21 being
sequentially lower, reflecting seasonality comparable to prior years, and normalising for the IFRS9 interest income adjustment. Strong underlying business momentum throughout 2021 should enable income growth to return to our 5-7% guidance range from FY’22
• We continue to expect FY’21 operating expenses, including the impact of currency translation and performance-related pay, to be at or below $10.4bn
• Excluding the impact of any unforeseeable events, we expect credit impairment to remain at low levels in 4Q’21 • We expect FY’21 CET1 to be around the top of the 13-14% target range on a pro-forma basis, excluding software relief
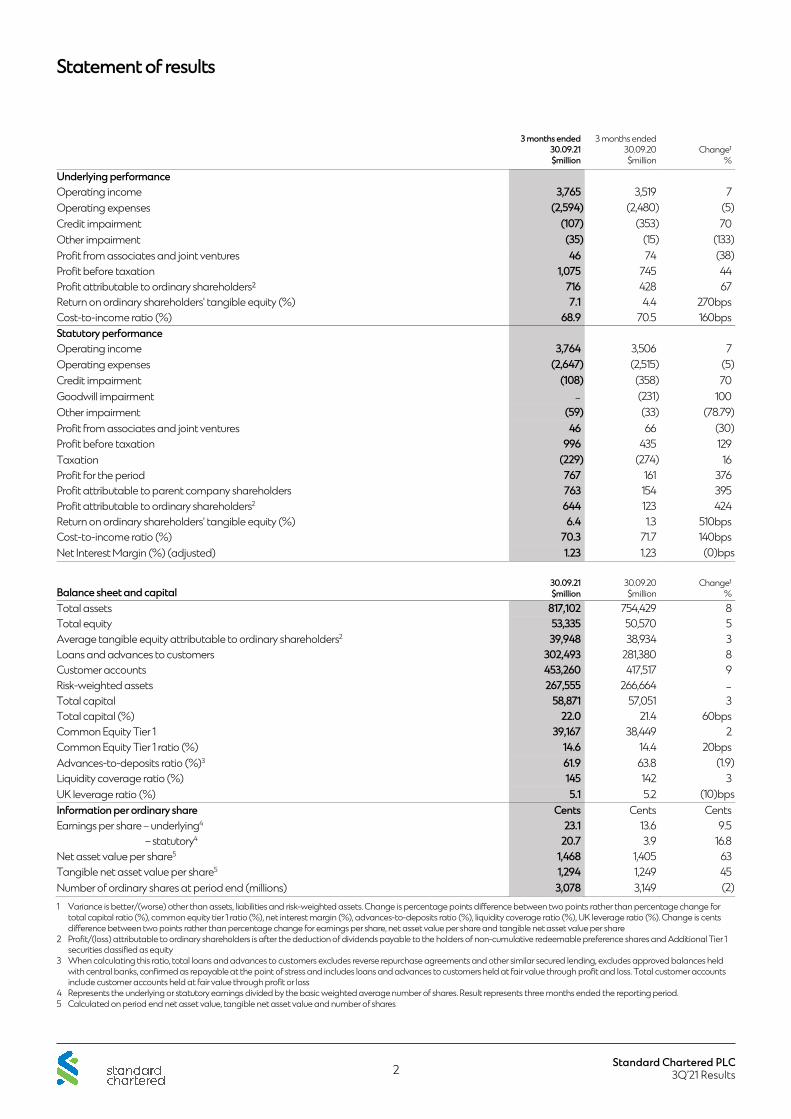
Statement of results
Standard Chartered PLC 3Q’21 Results 2
3 months ended 30.09.21$million
3 months ended 30.09.20
$millionChange¹
%
Underlying performance Operating income 3,765 3,519 7Operating expenses (2,594) (2,480) (5)Credit impairment (107) (353) 70Other impairment (35) (15) (133)Profit from associates and joint ventures 46 74 (38)Profit before taxation 1,075 745 44Profit attributable to ordinary shareholders² 716 428 67Return on ordinary shareholders' tangible equity (%) 7.1 4.4 270bpsCost-to-income ratio (%) 68.9 70.5 160bpsStatutory performance Operating income 3,764 3,506 7Operating expenses (2,647) (2,515) (5)Credit impairment (108) (358) 70Goodwill impairment – (231) 100Other impairment (59) (33) (78.79)Profit from associates and joint ventures 46 66 (30)Profit before taxation 996 435 129Taxation (229) (274) 16Profit for the period 767 161 376Profit attributable to parent company shareholders 763 154 395Profit attributable to ordinary shareholders2 644 123 424Return on ordinary shareholders' tangible equity (%) 6.4 1.3 510bpsCost-to-income ratio (%) 70.3 71.7 140bpsNet Interest Margin (%) (adjusted) 1.23 1.23 (0)bps
Balance sheet and capital 30.09.21$million
30.09.20$million
Change¹%
Total assets 817,102 754,429 8Total equity 53,335 50,570 5Average tangible equity attributable to ordinary shareholders2 39,948 38,934 3Loans and advances to customers 302,493 281,380 8Customer accounts 453,260 417,517 9Risk-weighted assets 267,555 266,664 –
Total capital 58,871 57,051 3Total capital (%) 22.0 21.4 60bpsCommon Equity Tier 1 39,167 38,449 2Common Equity Tier 1 ratio (%) 14.6 14.4 20bpsAdvances-to-deposits ratio (%)3 61.9 63.8 (1.9)Liquidity coverage ratio (%) 145 142 3UK leverage ratio (%) 5.1 5.2 (10)bpsInformation per ordinary share Cents Cents CentsEarnings per share – underlying4 23.1 13.6 9.5
– statutory4 20.7 3.9 16.8Net asset value per share5 1,468 1,405 63Tangible net asset value per share5 1,294 1,249 45Number of ordinary shares at period end (millions) 3,078 3,149 (2)1 Variance is better/(worse) other than assets, liabilities and risk-weighted assets. Change is percentage points difference between two points rather than percentage change for
total capital ratio (%), common equity tier 1 ratio (%), net interest margin (%), advances-to-deposits ratio (%), liquidity coverage ratio (%), UK leverage ratio (%). Change is cents difference between two points rather than percentage change for earnings per share, net asset value per share and tangible net asset value per share
2 Profit/(loss) attributable to ordinary shareholders is after the deduction of dividends payable to the holders of non-cumulative redeemable preference shares and Additional Tier 1 securities classified as equity
3 When calculating this ratio, total loans and advances to customers excludes reverse repurchase agreements and other similar secured lending, excludes approved balances held with central banks, confirmed as repayable at the point of stress and includes loans and advances to customers held at fair value through profit and loss. Total customer accounts include customer accounts held at fair value through profit or loss
4 Represents the underlying or statutory earnings divided by the basic weighted average number of shares. Result represents three months ended the reporting period. 5 Calculated on period end net asset value, tangible net asset value and number of shares

Group Chief Financial Officer’s review
Standard Chartered PLC 3Q’21 Results 3
The Group delivered a strong performance in 3Q’21
Summary of financial performance
3Q'21$million
3Q'20$million
Change%
Constant currency change¹
%2Q'21
$millionChange
%
Constant currency change¹
%YTD'21
$millionYTD'20$million
Change%
Constant currency change¹
%
Net interest income 1,735 1,620 7 6 1,713 1 2 5,110 5,122 – (2)Other income 2,030 1,899 7 7 1,976 3 4 6,273 6,444 (3) (4)
Underlying operating income 3,765 3,519 7 7 3,689 2 3 11,383 11,566 (2) (3)Other operating expenses (2,594) (2,480) (5) (3) (2,592) – (1) (7,680) (7,193) (7) (4)UK bank levy – – nm³ nm³ (6) 100 100 (6) – nm³ nm³
Underlying operating expenses (2,594) (2,480) (5) (3) (2,598) – (1) (7,686) (7,193) (7) (4)Underlying operating profit before impairment and taxation 1,171 1,039 13 16 1,091 7 8 3,697 4,373 (15) (14)Credit impairment (107) (353) 70 71 67 nm³ nm³ (60) (1,920) 97 97Other impairment (35) (15) (133) (150) (9) nm³ nm³ (60) 97 (162) (162)Profit from associates and joint ventures 46 74 (38) (38) 87 (47) (47) 180 150 20 21Underlying profit before taxation 1,075 745 44 50 1,236 (13) (13) 3,757 2,700 39 43Restructuring (99) (44) (125) (122) (90) (10) (11) (222) (134) (66) (65)Goodwill impairment – (231) 100 100 – nm³ nm³ – (489) 100 100Other items 20 (35) nm³ 157 – nm³ nm³ 20 (15) nm³ nm³Statutory profit before taxation 996 435 129 146 1,146 (13) (13) 3,555 2,062 72 79Taxation (229) (274) 16 17 (317) 28 27 (860) (835) (3) (2)Profit for the period 767 161 nm³ nm³ 829 (8) (7) 2,695 1,227 120 137Net interest margin (%)2 1.23 1.23 – 1.22 1 1.23 1.34 (11)Underlying return on tangible equity (%)2 7.1 4.4 270 7.8 (70) 8.6 5.5 310Underlying earnings per share (cents) 23.1 13.6 70 24.8 (7) 81.4 49.5 64Statutory return on tangible equity (%)2 6.4 1.3 510 7.0 (60) 7.9 3.3 460Statutory earnings per share (cents) 20.7 3.9 nm³ 22.1 (6) 75.6 29.7 1551 Comparisons presented on the basis of the current period’s transactional currency rate, ensuring like-for-like currency rates between the two periods 2 Change is the basis points (bps) difference between the two periods rather than the percentage change 3 Not meaningful
The Group delivered a strong performance in the third quarter of 2021, in what remained challenging conditions, with underlying profit before tax improving 44 per cent. Income returned to growth, increasing 5 per cent, on a constant currency basis and excluding normalisation adjustments, with continued strong underlying business momentum more than offsetting the impact of a 7 basis point decline in net interest margin on a normalised basis. Expenses grew 3 per cent at constant currency, mainly from increased investment in strategic initiatives. Credit impairment charges remain at low levels reflecting the improving economic backdrop. The Group remains well capitalised and highly liquid with a common equity tier 1 (CET1) ratio of 14.6 per cent, above the 13 to 14 per cent target range, with an advances-to-deposits ratio of 61.9 per cent and a liquidity coverage ratio of 145 per cent. All commentary that follows is on an underlying basis and comparisons are made to the equivalent period in 2020 on a reported currency basis, unless otherwise stated. • Operating income increased 7 per cent and was up 5 per cent on a constant currency basis and excluding normalisation
adjustments. The impact of the lower underlying net interest margin was more than offset by balance sheet growth and strong performances in Financial Markets and Trade
• Net interest income increased 7 per cent, benefiting from a positive $96 million IFRS9 interest income catch-up adjustment in respect of interest earned on historically impaired assets. Excluding this adjustment, net interest income increased 1 per cent with a 6 per cent increase in average interest-earning assets, partly offset by a 7 basis points decline in the normalised net interest margin. Excluding the impact of IFRS9 adjustments in both the second and third quarter, net interest income was flat quarter-on-quarter while the net interest margin declined 1 basis point to 116 basis points on a normalised basis
• Other income increased 7 per cent and 9 per cent excluding the positive impact of a $21 million increase in DVA and the non-repeat of a $53 million accelerated recognition of an annual Bancassurance bonus in 3Q‘20, with broad-based growth across multiple products
Group Chief Financial Officer’s review continued
Standard Chartered PLC 3Q’21 Results 4
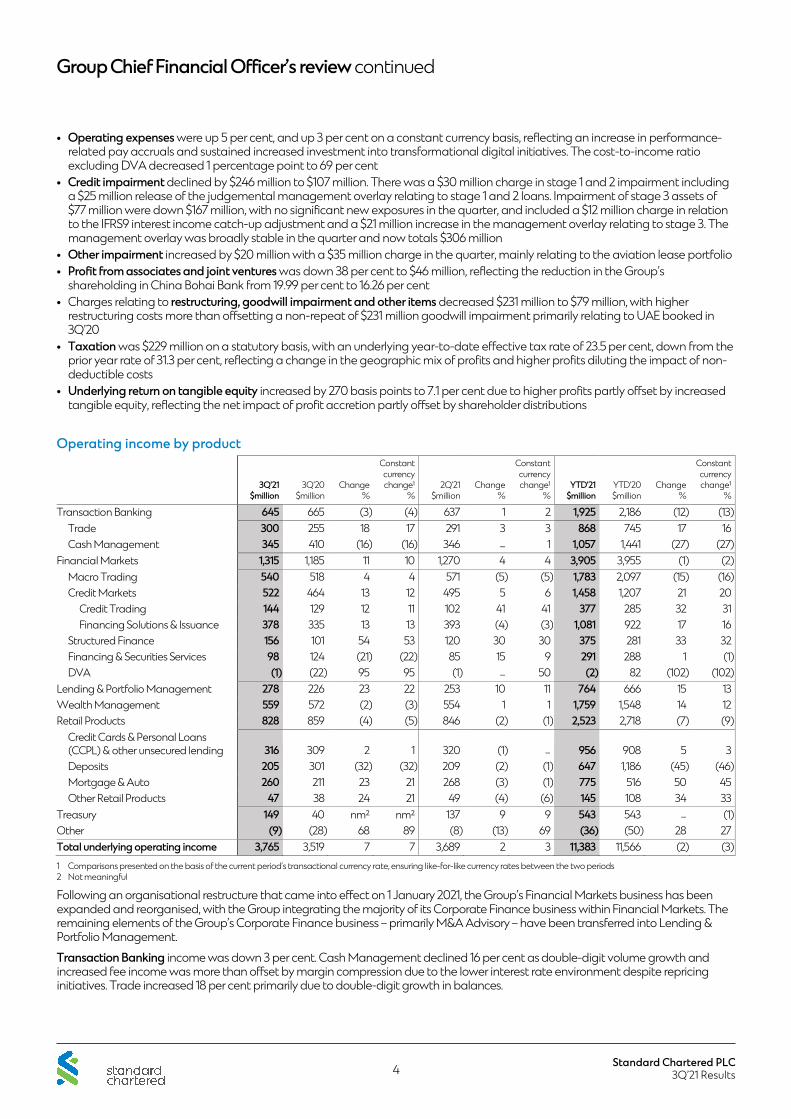
• Operating expenses were up 5 per cent, and up 3 per cent on a constant currency basis, reflecting an increase in performance-related pay accruals and sustained increased investment into transformational digital initiatives. The cost-to-income ratio excluding DVA decreased 1 percentage point to 69 per cent
• Credit impairment declined by $246 million to $107 million. There was a $30 million charge in stage 1 and 2 impairment including a $25 million release of the judgemental management overlay relating to stage 1 and 2 loans. Impairment of stage 3 assets of $77 million were down $167 million, with no significant new exposures in the quarter, and included a $12 million charge in relation to the IFRS9 interest income catch-up adjustment and a $21 million increase in the management overlay relating to stage 3. The management overlay was broadly stable in the quarter and now totals $306 million
• Other impairment increased by $20 million with a $35 million charge in the quarter, mainly relating to the aviation lease portfolio • Profit from associates and joint ventures was down 38 per cent to $46 million, reflecting the reduction in the Group’s
shareholding in China Bohai Bank from 19.99 per cent to 16.26 per cent • Charges relating to restructuring, goodwill impairment and other items decreased $231 million to $79 million, with higher
restructuring costs more than offsetting a non-repeat of $231 million goodwill impairment primarily relating to UAE booked in 3Q’20
• Taxation was $229 million on a statutory basis, with an underlying year-to-date effective tax rate of 23.5 per cent, down from the prior year rate of 31.3 per cent, reflecting a change in the geographic mix of profits and higher profits diluting the impact of non-deductible costs
• Underlying return on tangible equity increased by 270 basis points to 7.1 per cent due to higher profits partly offset by increased tangible equity, reflecting the net impact of profit accretion partly offset by shareholder distributions
Operating income by product
3Q'21$million
3Q'20$million
Change%
Constant currency change¹
%2Q'21
$millionChange
%
Constant currency change¹
%YTD'21
$millionYTD'20$million
Change%
Constant currency change¹
%
Transaction Banking 645 665 (3) (4) 637 1 2 1,925 2,186 (12) (13)Trade 300 255 18 17 291 3 3 868 745 17 16Cash Management 345 410 (16) (16) 346 – 1 1,057 1,441 (27) (27)
Financial Markets 1,315 1,185 11 10 1,270 4 4 3,905 3,955 (1) (2)Macro Trading 540 518 4 4 571 (5) (5) 1,783 2,097 (15) (16)Credit Markets 522 464 13 12 495 5 6 1,458 1,207 21 20
Credit Trading 144 129 12 11 102 41 41 377 285 32 31Financing Solutions & Issuance 378 335 13 13 393 (4) (3) 1,081 922 17 16
Structured Finance 156 101 54 53 120 30 30 375 281 33 32Financing & Securities Services 98 124 (21) (22) 85 15 9 291 288 1 (1)DVA (1) (22) 95 95 (1) – 50 (2) 82 (102) (102)
Lending & Portfolio Management 278 226 23 22 253 10 11 764 666 15 13Wealth Management 559 572 (2) (3) 554 1 1 1,759 1,548 14 12Retail Products 828 859 (4) (5) 846 (2) (1) 2,523 2,718 (7) (9)
Credit Cards & Personal Loans (CCPL) & other unsecured lending 316 309 2 1 320 (1) – 956 908 5 3Deposits 205 301 (32) (32) 209 (2) (1) 647 1,186 (45) (46)Mortgage & Auto 260 211 23 21 268 (3) (1) 775 516 50 45Other Retail Products 47 38 24 21 49 (4) (6) 145 108 34 33
Treasury 149 40 nm² nm² 137 9 9 543 543 – (1)Other (9) (28) 68 89 (8) (13) 69 (36) (50) 28 27Total underlying operating income 3,765 3,519 7 7 3,689 2 3 11,383 11,566 (2) (3)1 Comparisons presented on the basis of the current period’s transactional currency rate, ensuring like-for-like currency rates between the two periods 2 Not meaningful
Following an organisational restructure that came into effect on 1 January 2021, the Group’s Financial Markets business has been expanded and reorganised, with the Group integrating the majority of its Corporate Finance business within Financial Markets. The remaining elements of the Group’s Corporate Finance business – primarily M&A Advisory – have been transferred into Lending & Portfolio Management. Transaction Banking income was down 3 per cent. Cash Management declined 16 per cent as double-digit volume growth and increased fee income was more than offset by margin compression due to the lower interest rate environment despite repricing initiatives. Trade increased 18 per cent primarily due to double-digit growth in balances.
Group Chief Financial Officer’s review continued
Standard Chartered PLC 3Q’21 Results 5
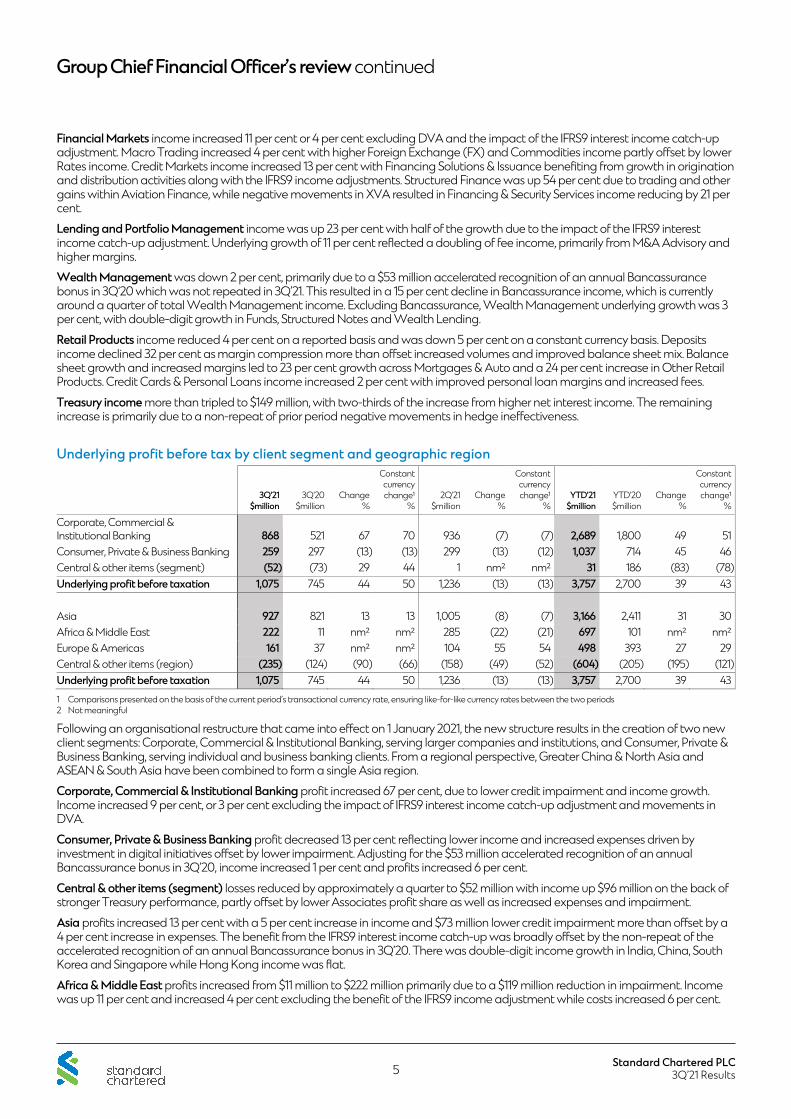
Financial Markets income increased 11 per cent or 4 per cent excluding DVA and the impact of the IFRS9 interest income catch-up adjustment. Macro Trading increased 4 per cent with higher Foreign Exchange (FX) and Commodities income partly offset by lower Rates income. Credit Markets income increased 13 per cent with Financing Solutions & Issuance benefiting from growth in origination and distribution activities along with the IFRS9 income adjustments. Structured Finance was up 54 per cent due to trading and other gains within Aviation Finance, while negative movements in XVA resulted in Financing & Security Services income reducing by 21 per cent. Lending and Portfolio Management income was up 23 per cent with half of the growth due to the impact of the IFRS9 interest income catch-up adjustment. Underlying growth of 11 per cent reflected a doubling of fee income, primarily from M&A Advisory and higher margins. Wealth Management was down 2 per cent, primarily due to a $53 million accelerated recognition of an annual Bancassurance bonus in 3Q‘20 which was not repeated in 3Q’21. This resulted in a 15 per cent decline in Bancassurance income, which is currently around a quarter of total Wealth Management income. Excluding Bancassurance, Wealth Management underlying growth was 3 per cent, with double-digit growth in Funds, Structured Notes and Wealth Lending. Retail Products income reduced 4 per cent on a reported basis and was down 5 per cent on a constant currency basis. Deposits income declined 32 per cent as margin compression more than offset increased volumes and improved balance sheet mix. Balance sheet growth and increased margins led to 23 per cent growth across Mortgages & Auto and a 24 per cent increase in Other Retail Products. Credit Cards & Personal Loans income increased 2 per cent with improved personal loan margins and increased fees. Treasury income more than tripled to $149 million, with two-thirds of the increase from higher net interest income. The remaining increase is primarily due to a non-repeat of prior period negative movements in hedge ineffectiveness.
Underlying profit before tax by client segment and geographic region
3Q'21$million
3Q'20$million
Change%
Constant currency change¹
%2Q'21
$millionChange
%
Constant currency change¹
%YTD'21
$millionYTD'20$million
Change%
Constant currency change¹
%
Corporate, Commercial & Institutional Banking 868 521 67 70 936 (7) (7) 2,689 1,800 49 51Consumer, Private & Business Banking 259 297 (13) (13) 299 (13) (12) 1,037 714 45 46Central & other items (segment) (52) (73) 29 44 1 nm² nm² 31 186 (83) (78)Underlying profit before taxation 1,075 745 44 50 1,236 (13) (13) 3,757 2,700 39 43
Asia 927 821 13 13 1,005 (8) (7) 3,166 2,411 31 30Africa & Middle East 222 11 nm² nm² 285 (22) (21) 697 101 nm² nm²Europe & Americas 161 37 nm² nm² 104 55 54 498 393 27 29Central & other items (region) (235) (124) (90) (66) (158) (49) (52) (604) (205) (195) (121)Underlying profit before taxation 1,075 745 44 50 1,236 (13) (13) 3,757 2,700 39 431 Comparisons presented on the basis of the current period’s transactional currency rate, ensuring like-for-like currency rates between the two periods 2 Not meaningful
Following an organisational restructure that came into effect on 1 January 2021, the new structure results in the creation of two new client segments: Corporate, Commercial & Institutional Banking, serving larger companies and institutions, and Consumer, Private & Business Banking, serving individual and business banking clients. From a regional perspective, Greater China & North Asia and ASEAN & South Asia have been combined to form a single Asia region. Corporate, Commercial & Institutional Banking profit increased 67 per cent, due to lower credit impairment and income growth. Income increased 9 per cent, or 3 per cent excluding the impact of IFRS9 interest income catch-up adjustment and movements in DVA. Consumer, Private & Business Banking profit decreased 13 per cent reflecting lower income and increased expenses driven by investment in digital initiatives offset by lower impairment. Adjusting for the $53 million accelerated recognition of an annual Bancassurance bonus in 3Q’20, income increased 1 per cent and profits increased 6 per cent. Central & other items (segment) losses reduced by approximately a quarter to $52 million with income up $96 million on the back of stronger Treasury performance, partly offset by lower Associates profit share as well as increased expenses and impairment. Asia profits increased 13 per cent with a 5 per cent increase in income and $73 million lower credit impairment more than offset by a 4 per cent increase in expenses. The benefit from the IFRS9 interest income catch-up was broadly offset by the non-repeat of the accelerated recognition of an annual Bancassurance bonus in 3Q’20. There was double-digit income growth in India, China, South Korea and Singapore while Hong Kong income was flat. Africa & Middle East profits increased from $11 million to $222 million primarily due to a $119 million reduction in impairment. Income was up 11 per cent and increased 4 per cent excluding the benefit of the IFRS9 income adjustment while costs increased 6 per cent.

Group Chief Financial Officer’s review continued
Standard Chartered PLC 3Q’21 Results 6
Europe & Americas income increased 22 per cent, with strong double-digit growth in Financial Markets, which along with $23 million lower impairment, resulted in profits increasing more than four-fold. Central & other items (region) recorded a loss of $235 million with increased expenses reflecting an increase in performance-related pay accruals and an increase in investment spend in digital ventures while income declined $36 million due to lower returns paid to Treasury on the equity provided to the regions in a lower interest rate environment.
Adjusted net interest income and margin 3Q'21
$million3Q'20
$millionChange¹
%2Q'21
$millionChange¹
%YTD'21
$millionYTD'20$million
Change¹%
Adjusted net interest income2 1,732 1,626 7 1,705 2 5,107 5,245 (3)Average interest-earning assets 557,416 524,921 6 558,089 – 557,283 522,251 7Average interest-bearing liabilities 512,406 477,688 7 517,939 (1) 513,333 473,778 8
Gross yield (%)3 1.84 2.07 (23) 1.86 (2) 1.85 2.46 (61)Rate paid (%)3 0.66 0.92 (26) 0.69 (3) 0.68 1.23 (55)Net yield (%)3 1.18 1.15 3 1.17 1 1.17 1.23 (6)Net interest margin (%)3,4 1.23 1.23 – 1.22 1 1.23 1.34 (11)1 Variance is better/(worse) other than assets and liabilities which is increase/(decrease) 2 Adjusted net interest income is statutory net interest income less funding costs for the trading book and financial guarantee fees on interest-earning assets 3 Change is the basis points (bps) difference between the two periods rather than the percentage change 4 Adjusted net interest income divided by average interest-earning assets, annualised
Adjusted net interest income increased 7 per cent and 1 per cent excluding the benefit of a $96 million IFRS9 interest income catch-up adjustment. On a headline basis, adjusted net interest income was up 2 per cent quarter-on-quarter but was flat excluding the IFRS9 income adjustment (2Q’21: $73 million). The net interest margin on a headline basis was flat year-on-year and up 1 basis point quarter-on-quarter. Excluding the IFRS9 income adjustment, net interest margin on a normalised basis was 116 basis points in the third quarter, down 7 basis points year-on-year and down 1 basis point quarter-on-quarter: • Average interest-earning assets were flat in the quarter, with reduced balances in Treasury Markets offsetting growth in
Mortgages, Wealth Management and Trade. Gross yields declined 2 basis points compared with the average in the prior quarter, and were down 4 basis points excluding the impact of the IFRS9 income adjustment, reflecting the impact of further falls in HIBOR and a shift from credit cards to lower yielding personal loans
• Average interest-bearing liabilities declined 1 per cent in the quarter. The deposit mix continued to improve with a reduction in Retail Products time deposits and growth in corporate operating accounts. The rate paid on liabilities decreased 3 basis points compared with the average in the prior quarter, reflecting interest rate movements, repricing initiatives and improvement in the liability mix
Credit risk summary Income statement
3Q'21$million
3Q'20$million
Change1
%2Q'21
$millionChange1
%YTD'21
$millionYTD'20$million
Change1
%
Total credit impairment charge/(release) 107 353 (70) (67) (260) 60 1,920 (97)Of which stage 1 and 2 30 109 (72) (70) (143) (75) 777 (110)Of which stage 3 77 244 (68) 3 2,467 135 1,143 (88)
1 Variance is increase/(decrease) comparing current reporting period to prior reporting periods

Group Chief Financial Officer’s review continued
Standard Chartered PLC 3Q’21 Results 7
Balance sheet 30.09.21$million
30.06.21$million
Change1
%31.12.20
$millionChange1
%30.09.20$million
Change1
%
Gross loans and advances to customers2 308,083 303,982 1 288,312 7 288,046 7Of which stage 1 284,140 277,290 2 256,437 11 251,113 13Of which stage 2 15,759 17,634 (11) 22,661 (30) 27,597 (43)Of which stage 3 8,184 9,058 (10) 9,214 (11) 9,336 (12)
Expected credit loss provisions (5,590) (5,979) (7) (6,613) (15) (6,666) (16)Of which stage 1 (411) (447) (8) (534) (23) (571) (28)Of which stage 2 (535) (544) (2) (738) (28) (706) (24)Of which stage 3 (4,644) (4,988) (7) (5,341) (13) (5,389) (14)
Net loans and advances to customers 302,493 298,003 2 281,699 7 281,380 8Of which stage 1 283,729 276,843 2 255,903 11 250,542 13Of which stage 2 15,224 17,090 (11) 21,923 (31) 26,891 (43)Of which stage 3 3,540 4,070 (13) 3,873 (9) 3,947 (10)
Cover ratio of stage 3 before/after collateral (%)3 57 / 77 55 / 75 2 / 2 58 / 76 (1) / 1 58 / 76 (1) / 1Credit grade 12 accounts ($million) 2,175 1,623 34 2,164 1 1,954 11Early alerts ($million) 7,478 8,970 (17) 10,692 (30) 13,407 (44)Investment grade corporate exposures (%)3 68 63 5 62 6 59 91 Variance is increase/(decrease) comparing current reporting period to prior reporting periods 2 Includes reverse repurchase agreements and other similar secured lending held at amortised cost of $8,836 million at 30 September 2021, $4,584 million at 30 June 2021, $2,919 million
at 31 December 2020 and $4,330 million at 30 September 2020 3 Change is the percentage points difference between the two points rather than the percentage change
While credit risk remains elevated, we have seen improvements in a number of metrics with high-risk assets lower for the fifth successive quarter, and the overall portfolio remains stable and resilient. The Group is well-positioned to support our clients as economies recover but continues to remain vigilant to the continued impact of COVID-19 including vaccination progress and the likelihood of uneven economic recovery across markets and industries. Credit impairment was a $107 million charge in the quarter, with a $30 million charge relating to stage 1 and 2 impairment and a $77 million charge relating to stage 3 impairment. The $30 million charge in stage 1 and 2 impairment reflects the impact of a sovereign ratings downgrade in one of our smaller markets and changes in the macroeconomic variables used in the expected credit loss (ECL) models partly offset by a $25 million release of the judgemental stage 1 and 2 management overlay. The management overlay relating to stage 1 and 2 assets totals $277 million as at 30 September 2021. Stage 3 impairment of $77 million primarily relate to charge-offs within Consumer, Private & Business Banking (CPBB) with no significant new exposures within Corporate, Commercial & Institutional Banking (CCIB) in the quarter. There was a $12 million charge relating to the catch-up of interest earned on historically impaired assets and a $21 million increase in the management overlay of stage 3 assets in CPBB, to a total overlay of $29 million. Gross stage 3 loans and advances to customers of $8.2 billion were 10 per cent lower compared to 30 June 2021, primarily due to repayments and write-offs more than offsetting new inflows, which were 87 per cent lower in CCIB, compared to the previous quarter. Credit-impaired loans represented 2.7 per cent of gross loans and advances, a decrease of 32 basis points compared to 30 June 2021. The stage 3 cover ratio of 57 per cent was up 2 percentage points compared with the position as at 30 June 2021, and the cover ratio post collateral at 77 per cent also increased by 2 percentage points, both benefiting from significant repayments on stage 3 assets with low levels of provisions. Credit grade 12 balances have increased by $0.5 billion since 30 June 2021, mainly due to the sovereign ratings downgrade partly offset by client upgrades and repayments. Early Alert accounts of $7.5 billion have reduced by $1.5 billion since 30 June 2021, reflecting the net impact of downgrades into credit grade 12 including the sovereign ratings downgrade, exposure reductions and regularisations of accounts back into non-high-risk categories. Excluding the Aviation sector, Early Alert accounts are now broadly in-line with pre-COVID-19 levels. The Group is continuing to monitor its exposures in the Aviation, Metals & Mining and Oil & Gas sectors particularly carefully, given the unusual stresses caused by the effects of COVID-19, as well as its exposure to Commercial Real Estate, which, with a total exposure of $18.5 billion is just 6 per cent of the Group’s total loans and advances to customers. The recent rises in commodity prices have eased credit pressure for certain sectors. The proportion of investment grade corporate exposures has increased by 5 percentage points since 30 June 2021 to 68 per cent.

Group Chief Financial Officer’s review continued
Standard Chartered PLC 3Q’21 Results 8
Restructuring, goodwill impairment and other items 3Q'21 3Q'20 2Q'21
Restructuring$million
Goodwill Impairment
$millionOther items
$millionRestructuring
$million
Goodwill Impairment
$millionOther items
$millionRestructuring
$million
Goodwill Impairment
$millionOther items
$million
Operating income (21) – 20 22 – (35) – – –
Operating expenses (53) – – (35) – – (95) – –
Credit impairment (1) – – (5) – – 1 – –
Other impairment (24) – – (18) (231) – (3) – –
Profit from associates and joint ventures – – – (8) – – 7 – –
Profit/(loss) before taxation (99) – 20 (44) (231) (35) (90) – –
The Group’s statutory performance is adjusted for profits or losses of a capital nature, amounts consequent to investment transactions driven by strategic intent, other infrequent and/or exceptional transactions that are significant or material in the context of the Group’s normal business earnings for the period and items which management and investors would ordinarily identify separately when assessing underlying performance period by period. Restructuring charges of $99 million primarily relate to the discontinued Principal Finance business, redundancies, and impairment on property as the Group adapts to new ways of working post-pandemic. Other items include a $20 million fair-value gain relating to a SC Ventures investment.
Balance sheet and liquidity 30.09.21$million
30.06.21$million
Change%
31.12.20$million
Change1
%30.09.20$million
Change1
%
Assets Loans and advances to banks 45,754 45,188 1 44,347 3 49,040 (7)Loans and advances to customers 302,493 298,003 2 281,699 7 281,380 8Other assets 468,855 452,719 4 463,004 1 424,009 11Total assets 817,102 795,910 3 789,050 4 754,429 8Liabilities Deposits by banks 34,480 30,567 13 30,255 14 28,138 23Customer accounts 453,260 441,147 3 439,339 3 417,517 9Other liabilities 276,027 271,339 2 268,727 3 258,204 7Total liabilities 763,767 743,053 3 738,321 3 703,859 9Equity 53,335 52,857 1 50,729 5 50,570 5Total equity and liabilities 817,102 795,910 3 789,050 4 754,429 8
Advances-to-deposits ratio (%)2 61.9% 64.0% 61.1% 63.8%Liquidity coverage ratio (%) 145% 146% 143% 142%1 Variance is increase/(decrease)comparing current reporting period to prior reporting periods 2 The Group now excludes $16,986 million held with central banks (30.06.21: $16,213 million, 31.12.20: $14,296 million, 30.09.20: $14,363 million) that has been confirmed as repayable at
the point of stress
The Group’s balance sheet remains strong, liquid and well diversified: • Loans and advances to customers increased 2 per cent since 30 June 2021 to $302 billion despite the impact of adverse FX
movements. The majority of the growth was due to growth in Financial Markets. Underlying growth in Retail Mortgage balances was predominately offset by negative FX movements, while the completion of loan syndications in progress at 30 June 2021 led to a reduction in the corporate lending book
• Customer accounts of $453 billion increased 3 per cent since 30 June 2021, primarily driven by an increase in corporate operating account balances while retail deposits remained broadly stable despite being negatively impacted by FX movements
• Other assets increased 4 per cent since 30 June 2021 with increased unsettled trade balances, balances at central banks and investment securities. Other liabilities increased 2 per cent from increased repurchase agreements, partly offset by a reduction in issued debt securities
The advances-to-deposits ratio reduced to 61.9 per cent from 64.0 per cent at 30 June 2021, reflecting the strong growth in customer accounts in the quarter. The point-in-time liquidity coverage ratio (LCR) decreased 1 percentage point to 145 per cent and remains well above the minimum regulatory requirement of 100 per cent.

Group Chief Financial Officer’s review continued
Standard Chartered PLC 3Q’21 Results 9
Risk-weighted assets 30.09.21$million
30.06.21$million
Change1
%31.12.20
$millionChange1
%30.09.20$million
Change1
%
By risk type Credit risk 219,628 229,348 (4) 220,441 – 217,720 1Operational risk 27,116 27,116 – 26,800 1 26,800 1Market risk 20,811 23,763 (12) 21,593 (4) 22,144 (6)Total risk-weighted assets (RWA) 267,555 280,227 (5) 268,834 – 266,664 –
1 Variance is increase/(decrease) comparing current reporting period to prior reporting periods
Total risk-weighted assets (RWA) decreased 5 per cent or $12.7 billion since 30 June 2021 to $267.6 billion: • Credit risk RWA decreased by $9.7 billion in the third quarter to $219.6 billion, with asset growth more than offset by the benefit of
model upgrades relating to Korea personal loans, improvements in asset quality including actions concerning specific stage 3 exposures, the impact of lower RWA density and FX
• Operational risk RWA remained unchanged at $27.1 billion
• Market risk RWA decreased by $3.0 billion to $20.8 billion due to reduced internal models approach (IMA) positions and charges for IMA risks not in value at risk (VaR)
Capital base and ratios 30.09.21$million
30.06.21$million
Change¹%
31.12.20$million
Change¹%
30.09.20$million
Change¹%
CET1 capital 39,167 39,589 (1) 38,779 1 38,449 2Additional Tier 1 capital (AT1) 6,791 6,293 8 5,612 21 5,611 21Tier 1 capital 45,958 45,882 – 44,391 4 44,060 4Tier 2 capital 12,913 13,279 (3) 12,657 2 12,991 (1)Total capital 58,871 59,161 – 57,048 3 57,051 3CET1 capital ratio (%)2 14.6 14.1 0.5 14.4 0.2 14.4 0.2Total capital ratio (%)2 22.0 21.1 0.9 21.2 0.8 21.4 0.6UK leverage ratio (%)2 5.1 5.2 (0.1) 5.2 (0.1) 5.2 (0.1)1 Variance is increase/(decrease) comparing current reporting period to prior reporting periods 2 Change is percentage points difference between two points rather than percentage change
The Group’s CET1 ratio of 14.6 per cent was 51 basis points higher than at 30 June 2021, 4.6 percentage points above the Group’s current regulatory minimum of 10.0 per cent and above the 13-14 per cent medium-term target range. The primary driver of the increase in the CET1 ratio was the decrease in RWA, principally from favourable model changes, asset quality improvements, a reduction in RWA density and lower market risk RWA, which in aggregate resulted in an increase in the CET1 ratio of approximately 60 basis points. Profits in the quarter contributed approximately 30 basis points of CET1 accretion in the quarter. There was a 3 basis points increase in the value of the revised treatment of software assets in CET1, reflecting an increase in capitalised software assets. The total benefit to CET1 from the revised treatment of software assets is now 34 basis points. The Prudential Regulatory Authority (PRA) has confirmed that qualifying software assets will be deducted from CET1 from 1 January 2022. The Group spent $251 million purchasing 40 million ordinary shares of $0.50 each, representing a volume-weighted average price per share of £4.54. These shares were subsequently cancelled, reducing the total issued share capital by 1.3 per cent and the CET1 ratio by 9 basis points. The Group is accruing a foreseeable dividend in respect of the final 2021 ordinary share dividend in the third quarter. This is not an indication of the Group’s final 2021 ordinary share dividend, which will be proposed by the Board at the presentation of the 2021 full-year results. The Group’s Pillar 2A requirement is expected to increase in the fourth quarter by a total of 38 basis points, of which 22 basis points must be held in CET1. Accordingly, the Group’s minimum CET1 requirement is expected to increase to 10.2 per cent from 10.0 per cent. The Group will also be subject to a regulatory change in the treatment of structural FX risk in the fourth quarter. Structural FX risk is currently assessed through the Group’s Pillar 2A requirement. The PRA has clarified that this should be a Pillar 1 requirement and therefore requires the Group to risk-weight its unhedged structural FX positions. The Group currently expects this change to result in between $3 billion to $4 billion of additional market risk RWA in the fourth quarter post hedging which would reduce the CET1 ratio by between 15 and 20 basis points on a pro-forma basis. The Group may benefit from a subsequent reduction in its Pillar 2A requirement reflecting the move of structural FX risk from Pillar 2A to Pillar 1. The Group’s UK leverage ratio of 5.1 per cent is slightly lower than the 5.2 per cent ratio as at 30 June 2021. The Group’s leverage ratio remains significantly above its minimum requirement of 3.7 per cent.

Group Chief Financial Officer’s review continued
Standard Chartered PLC 3Q’21 Results 10
Outlook The economic recovery from the COVID-19 pandemic has continued to be uneven and punctuated by supply-chain disruption. However, we are encouraged by robust levels of export growth across many of our markets in Asia. Against this backdrop: • We continue to expect FY'21 income to be similar to that achieved in FY'20 on a constant currency basis, with 4Q'21 being
sequentially lower, reflecting seasonality comparable to prior years, and normalising for the IFRS9 interest income adjustment. Strong underlying business momentum throughout 2021 should enable income growth to return to our 5-7% guidance range from FY'22
• We continue to expect FY’21 operating expenses, including the impact of currency translation and performance-related pay, to be at or below $10.4 billion
• Excluding the impact of any unforeseeable events, we expect credit impairment to remain at low levels in 4Q’21
• We expect FY’21 CET1 to be around the top of the 13-14 per cent target range on a pro-forma basis, excluding software relief
Andy Halford Group Chief Financial Officer 2 November 2021

Supplementary financial information
Standard Chartered PLC 3Q’21 Results 11
Underlying performance by client segment 3Q'21
Corporate, Commercial &
Institutional Banking$million
Consumer,Private &BusinessBanking$million
Central &other items
$millionTotal
$millionOperating income 2,226 1,430 109 3,765
External 2,115 1,348 302 3,765Inter-segment 111 82 (193) –
Operating expenses (1,304) (1,097) (193) (2,594)Operating profit/(loss) before impairment losses and taxation 922 333 (84) 1,171Credit impairment (24) (74) (9) (107)Other impairment (30) – (5) (35)Profit from associates and joint ventures – – 46 46Underlying profit/(loss) before taxation 868 259 (52) 1,075Restructuring (32) (10) (57) (99)Goodwill impairment – – – –
Other Items – – 20 20Statutory profit/(loss) before taxation 836 249 (89) 996Total assets 390,837 138,546 287,719 817,102
Of which: loans and advances to customers 197,121 135,375 31,272 363,768loans and advances to customers 137,936 135,293 29,264 302,493loans held at fair value through profit or loss (FVTPL) 59,185 82 2,008 61,275
Total liabilities 468,431 180,188 115,148 763,767Of which: customer accounts2 320,516 175,999 16,477 512,992
Risk-weighted assets 162,016 52,587 52,952 267,555Underlying return on tangible equity (%) 10.6 9.9 (6.7) 7.1Cost-to-income ratio (%) 58.6 76.7 177.1 68.9
3Q'20 Corporate,
Commercial & Institutional
Banking1
$million
Consumer,Private &BusinessBanking1
$million
Central &other items
$millionTotal
$millionOperating income 2,044 1,462 13 3,519
External 1,975 1,266 278 3,519Inter-segment 69 196 (265) –
Operating expenses (1,281) (1,039) (160) (2,480)Operating profit/(loss) before impairment losses and taxation 763 423 (147) 1,039Credit impairment (230) (126) 3 (353)Other impairment (12) – (3) (15)Profit from associates and joint ventures – – 74 74Underlying profit/(loss) before taxation 521 297 (73) 745Restructuring (18) (12) (14) (44)Goodwill impairment – – (231) (231)Other Items – – (35) (35)Statutory profit/(loss) before taxation 503 285 (353) 435Total assets 371,535 124,901 257,993 754,429
Of which: loans and advances to customers 194,368 122,356 19,087 335,811loans and advances to customers 140,109 122,196 19,075 281,380loans held at fair value through profit or loss (FVTPL) 54,259 160 12 54,431
Total liabilities 447,304 171,919 84,636 703,859Of which: customer accounts2 297,051 168,300 6,694 472,045
Risk-weighted assets 168,907 51,096 46,661 266,664Underlying return on tangible equity (%) 6.1 11.5 (9.3) 4.4Cost-to-income ratio (%) 62.7 71.1 nm³ 70.51 Following the Group’s change in organisational structure, there has been an integration of Corporate & Institutional Banking and Commercial Banking to Corporate, Commercial &
Institutional Banking; Private Banking and Retail Banking to Consumer, Private & Business Banking. Further, certain clients have been moved between the two new client segments. Prior period has been restated
2 Customer accounts includes FVTPL and repurchase agreements 3 Not meaningful

Supplementary financial information continued
Standard Chartered PLC 3Q’21 Results 12
Corporate, Commercial & Institutional Banking1
3Q'21$million
3Q'20$million
Change3
%
Constant currency
change2,3
%2Q'21
$millionChange3
%
Constant currency
change2,3
%YTD'21
$millionYTD'20$million
Change3
%
Constant currency
change2,3
%
Operating income 2,226 2,044 9 8 2,131 4 5 6,518 6,699 (3) (4)Transaction Banking 625 642 (3) (3) 615 2 2 1,862 2,115 (12) (13)
Trade 288 244 18 17 278 4 4 831 714 16 16Cash Management 337 398 (15) (16) 337 – – 1,031 1,401 (26) (27)Financial Markets 1,315 1,185 11 10 1,270 4 4 3,905 3,955 (1) (2)
Macro Trading 540 518 4 4 571 (5) (5) 1,783 2,097 (15) (16)Credit Markets 522 464 13 12 495 5 6 1,458 1,207 21 20
Credit Trading 144 129 12 11 102 41 41 377 285 32 31Financing Solutions & Issuance 378 335 13 13 393 (4) (3) 1,081 922 17 16
Structured Finance 156 101 54 53 120 30 30 375 281 33 32Financing & Securities Services 98 124 (21) (22) 85 15 9 291 288 1 (1)DVA (1) (22) 95 95 (1) – 50 (2) 82 (102) (102)
Lending & Portfolio Management 268 217 24 23 243 10 12 734 638 15 13Wealth Management 1 – – 1 –
Retail Products – – – – 1 (100) (100)Deposits 1 – – 1 1 – (100)
Other 17 – 3 16 (10)Operating expenses (1,304) (1,281) (2) – (1,294) (1) (1) (3,886) (3,665) (6) (4)Operating profit before impairment losses and taxation 922 763 21 22 837 10 10 2,632 3,034 (13) (13)Credit impairment (24) (230) 90 90 108 (122) (121) 112 (1,337) 108 108Other impairment (30) (12) (150) (164) (9) nm (190) (55) 103 (153) (153)Underlying profit before taxation 868 521 67 70 936 (7) (7) 2,689 1,800 49 51Restructuring (32) (18) (78) (68) (39) 18 20 (70) (92) 24 24Statutory profit before taxation 836 503 66 70 897 (7) (6) 2,619 1,708 53 56Total assets 390,837 371,535 5 5 387,689 1 1 390,837 371,535 5 5
Of which: loans and advances to customers4 197,121 194,368 1 1 197,732 – – 197,121 194,368 1 1
Total liabilities 468,431 447,304 5 5 452,449 4 4 468,431 447,304 5 5Of which: customer accounts4 320,516 297,051 8 8 307,619 4 5 320,516 297,051 8 8
Risk-weighted assets 162,016 168,907 (4) 174,613 (7) 162,016 168,907 (4)Underlying return on risk-weighted assets (%)5 2.0 1.2 80bps 2.2 (20)bps 2.1 1.4 70bpsUnderlying return on tangible equity (%)5 10.6 6.1 450bps 11.2 (60)bps 11.0 7.1 390bpsCost-to-income ratio (%)6 58.6 62.7 4.1 4.7 60.7 2.1 2.1 59.6 54.7 (4.9) (4.2)1 Following the Group’s change in organisational structure, there has been an integration of Corporate & Institutional Banking and Commercial Banking to Corporate, Commercial &
Institutional Banking; Private Banking and Retail Banking to Consumer, Private & Business Banking. Further, certain clients have been moved between the two new client segments. Prior periods have been restated
2 Comparisons presented on the basis of the current period’s transactional currency rate, ensuring like-for-like currency rates between the two periods 3 Variance is better/(worse) other than risk-weighted assets, assets and liabilities which is increase/(decrease) 4 Loans and advances to customers includes FVTPL and customer accounts includes FVTPL and repurchase agreements 5 Change is the basis points (bps) difference between the two periods rather than the percentage change 6 Change is the percentage points difference between the two periods rather than the percentage change 7 Not meaningful

Supplementary financial information continued
Standard Chartered PLC 3Q’21 Results 13
Performance highlights • Underlying profit before tax of $868 million was up 67 per cent driven by lower credit impairment and an improvement in
income, which included a $94 million benefit in the quarter relating to a IFRS9 interest income catch-up adjustment, partially offset by higher expenses
• Underlying operating income of $2,226 million increased 9 per cent and was up 3 per cent excluding both DVA and the IFRS9 interest income catch-up adjustment, both primarily in Financial Markets, mainly due to an increase in Lending and Trade income as global demand continues to recover from COVID-19 related impacts
• Loans and advances to customers were flat since 30 June 2021
• Risk-weighted assets down $13 billion since 30 June 2021 mainly as a result of decreased credit risk RWA, with asset growth more than offset by reductions from lower RWA density, improvements in asset quality including actions concerning specific stage 3 exposures and FX
• Return on tangible equity (RoTE) increased to 10.6 per cent from 6.1 per cent

Supplementary financial information continued
Standard Chartered PLC 3Q’21 Results 14
Consumer, Private & Business Banking1
3Q'21$million
3Q'20$million
Change3
%
Constant currency
change2,3
%2Q'21
$millionChange3
%
Constant currency
change2,3
%YTD'21
$millionYTD'20$million
Change3
%
Constant currency
change2,3
%
Operating income 1,430 1,462 (2) (3) 1,438 (1) – 4,399 4,371 1 (1)Transaction Banking 20 23 (13) (9) 22 (9) – 63 71 (11) (13)
Trade 12 11 9 9 13 (8) (8) 37 31 19 16Cash Management 8 12 (33) (25) 9 (11) 13 26 40 (35) (35)
Lending & Portfolio Management 10 9 11 – 10 – – 30 28 7 3Wealth Management 558 572 (2) (3) 554 1 1 1,758 1,548 14 12Retail Products 828 859 (4) (5) 846 (2) (1) 2,523 2,717 (7) (9)
CCPL & other unsecured lending 316 309 2 1 320 (1) – 956 908 5 3Deposits 204 301 (32) (32) 209 (2) (1) 646 1,185 (45) (46)Mortgage & Auto 260 211 23 21 268 (3) (1) 775 516 50 45Other Retail Products 48 38 26 21 49 (2) (6) 146 108 35 33
Other 14 (1) 6 133 133 25 7Operating expenses (1,097) (1,039) (6) (4) (1,093) – (1) (3,195) (3,080) (4) (1)Operating profit before impairment losses and taxation 333 423 (21) (21) 345 (3) (2) 1,204 1,291 (7) (7)Credit impairment (74) (126) 41 41 (46) (61) (57) (167) (576) 71 72Other impairment – – – – (1) 100 100Underlying profit before taxation 259 297 (13) (13) 299 (13) (12) 1,037 714 45 46Restructuring (10) (12) 17 – (13) 23 8 (32) (18) (78) (94)Statutory profit before taxation 249 285 (13) (13) 286 (13) (12) 1,005 696 44 45Total assets 138,546 124,901 11 11 137,452 1 2 138,546 124,901 11 11
Of which: loans and advances to customers4 135,375 122,356 11 11 134,291 1 2 135,375 122,356 11 11
Total liabilities 180,188 171,919 5 5 179,967 – 1 180,188 171,919 5 5Of which: customer accounts4 175,999 168,300 5 4 175,556 – 1 175,999 168,300 5 4
Risk-weighted assets 52,587 51,096 3 56,164 (6) 52,587 51,096 3Underlying return on risk-weighted assets (%)5 1.9 2.3 (40)bps 2.1 (20)bps 2.5 1.9 60bpsUnderlying return on tangible equity (%)5 9.9 11.5 (160)bps 11.0 (110)bps 13.0 9.3 370bpsCost-to-income ratio (%)6 76.7 71.1 (5.6) (5.4) 76.0 (0.7) (0.7) 72.6 70.5 (2.1) (1.8)1 Following the Group’s change in organisational structure, there has been an integration of Corporate & Institutional Banking and Commercial Banking to Corporate, Commercial &
Institutional Banking; Private Banking and Retail Banking to Consumer, Private & Business Banking. Further, certain clients have been moved between the two new client segments. Prior periods have been restated
2 Comparisons presented on the basis of the current period’s transactional currency rate, ensuring like-for-like currency rates between the two periods 3 Variance is better/(worse) other than risk-weighted assets, assets and liabilities which is increase/(decrease) 4 Loans and advances to customers includes FVTPL and customer accounts includes FVTPL and repurchase agreements 5 Change is the basis points (bps) difference between the two periods rather than the percentage change 6 Change is the percentage points difference between the two periods rather than the percentage change 7 Not meaningful
Performance highlights • Underlying profit before tax of $259 million was down 13 per cent driven by lower income and higher expenses, partially offset by
lower credit impairment, but was up 6 per cent excluding a $53 million accelerated recognition of an annual Bancassurance bonus in 3Q’20
• Underlying operating income of $1,430 million was down 2 per cent, mainly due to the impact of lower interest rates on Retail Deposits, offset by the continued strong performance in Mortgage & Auto income in Asia, but was up 1 per cent excluding a $53 million accelerated recognition of an annual Bancassurance bonus in 3Q’20
• Loans and advances to customers increased 1 per cent (up 2 per cent on a constant currency basis) since 30 June 2021
• Return on tangible equity (RoTE) decreased from 11.5 per cent to 9.9 per cent

Supplementary financial information continued
Standard Chartered PLC 3Q’21 Results 15
Central & other items (segment)
3Q'21$million
3Q'20$million
Change2
%
Constant currency
change1,2
%2Q'21
$millionChange2
%
Constant currency
change1,2
%YTD'21
$millionYTD'20$million
Change2
%
Constant currency
change1,2
%
Operating income 109 13 120 (9) (3) 466 496 (6) (7)Treasury 149 40 137 9 9 543 543 – (1)Other (40) (27) (48) (6) (17) (135) (71) (77) (47) (64) (69)Operating expenses (193) (160) (21) (15) (211) 9 4 (605) (448) (35) (20)Operating profit/(loss) before impairment losses and taxation (84) (147) 43 49 (91) 8 5 (139) 48Credit impairment (9) 3 5 (5) (7) 29 –
Other impairment (5) (3) (67) (100) – (5) (5) – –
Profit from associates and joint ventures 46 74 (38) (38) 87 (47) (47) 180 150 20 21Underlying profit/(loss) before taxation (52) (73) 29 43 1 31 186 (83) (78)Restructuring (57) (14) (38) (50) (50) (120) (24)Goodwill impairment – (231) 100 100 – – (489) 100 100Other items 20 (35) 157 157 – 20 (15)Statutory profit/(loss) before taxation (89) (353) 75 76 (37) (141) (156) (69) (342) 80 82Total assets 287,719 257,993 12 12 270,769 6 7 287,719 257,993 12 12
Of which: loans and advances to customers3 31,272 19,087 64 63 23,153 35 37 31,272 19,087 64 63
Total liabilities 115,148 84,636 36 36 110,637 4 4 115,148 84,636 36 36Of which: customer accounts3 16,477 6,694 146 146 8,417 96 97 16,477 6,694 146 146
Risk-weighted assets 52,952 46,661 13 49,450 7 52,952 46,661 13Underlying return on risk-weighted assets (%)4 (0.4) (0.6) 20bps – (40)bps 0.1 0.5 (40)bpsUnderlying return on tangible equity (%)4 (6.7) (9.3) 260bps (9.3) 260bps (4.7) (5.0) 30bpsCost-to-income ratio (%) (excluding UK bank levy)5 177.1 170.8 (6.3) (2.8) 128.5 90.3 (38.2) (29.2)1 Comparisons presented on the basis of the current period’s transactional currency rate, ensuring like-for-like currency rates between the two periods 2 Variance is better/(worse) other than risk-weighted assets, assets and liabilities which is increase/(decrease) 3 Loans and advances to customers includes FVTPL and customer accounts includes FVTPL and repurchase agreements 4 Change is the basis points (bps) difference between the two periods rather than the percentage change 5 Change is the percentage points difference between the two periods rather than the percentage change 6 Not meaningful
Performance highlights • Underlying loss before tax of $52 million compared to 3Q’20 loss of $73 million primarily due to increased Treasury income partly
offset by lower Associates profit share as well as increased expenses and impairment
• Expenses increased 21 per cent with an increase in performance-related pay accruals
• Profit from associates and joint ventures, was down 38 per cent to $46 million primarily reflecting the reduction in the Group’s reduced shareholding in China Bohai Bank from 19.99 per cent to 16.26 per cent

Supplementary financial information continued
Standard Chartered PLC 3Q’21 Results 16
Underlying performance by region 3Q'21
Asia$million
Africa &Middle East
$million
Europe &Americas
$million
Central &other items
$millionTotal
$million
Operating income 2,629 657 514 (35) 3,765Operating expenses (1,661) (401) (350) (182) (2,594)Operating profit/(loss) before impairment losses and taxation 968 256 164 (217) 1,171Credit impairment (84) (33) 11 (1) (107)Other impairment (2) (1) (14) (18) (35)Profit from associates and joint ventures 45 – – 1 46Underlying profit/(loss) before taxation 927 222 161 (235) 1,075Restructuring (36) (7) (27) (29) (99)Goodwill impairment – – – – –
Other items – – – 20 20Statutory profit/(loss) before taxation 891 215 134 (244) 996Total assets 475,407 56,609 275,427 9,659 817,102
Of which: loans and advances to customers 263,296 28,415 72,057 – 363,768loans and advances to customers 246,226 25,914 30,353 – 302,493loans held at fair value through profit or loss (FVTPL) 17,070 2,501 41,704 – 61,275
Total liabilities 428,911 40,276 228,363 66,217 763,767Of which: customer accounts2 343,425 33,307 136,260 – 512,992
Risk-weighted assets 172,205 49,040 48,476 (2,166) 267,555Cost-to-income ratio (%) 63.2 61.0 68.1 nm³ 68.9
3Q'20
Asia1
$million
Africa &Middle East
$million
Europe &Americas
$million
Central &other items
$millionTotal
$million
Operating income 2,505 590 423 1 3,519Operating expenses (1,601) (426) (360) (93) (2,480)Operating profit/(loss) before impairment losses and taxation 904 164 63 (92) 1,039Credit impairment (157) (154) (37) (5) (353)Other impairment – 1 11 (27) (15)Profit from associates and joint ventures 74 – – – 74Underlying profit/(loss) before taxation 821 11 37 (124) 745Restructuring (22) (11) (8) (3) (44)Goodwill impairment – – – (231) (231)Other items (35) – – – (35)Statutory profit/(loss) before taxation 764 – 29 (358) 435Total assets 449,081 61,472 233,772 10,104 754,429
Of which: loans and advances to customers 237,138 31,408 67,265 – 335,811loans and advances to customers 224,338 29,567 27,475 – 281,380loans held at fair value through profit or loss (FVTPL) 12,800 1,841 39,790 – 54,431
Total liabilities 397,411 40,275 225,332 40,841 703,859Of which: customer accounts2 316,667 32,630 122,748 – 472,045
Risk-weighted assets 172,986 52,524 43,818 (2,664) 266,664Cost-to-income ratio (%) 63.9 72.2 85.1 nm³ 70.51 Following the Group’s change in organisational structure, there has been an integration of Greater China & North Asia and ASEAN & South Asia to Asia. Prior period has been
restated 2 Customer accounts includes FVTPL and repurchase agreements 3 Not meaningful

Supplementary financial information continued
Standard Chartered PLC 3Q’21 Results 17
Asia1
3Q'21$million
3Q'20$million
Change3
%
Constant currency
change2,3
%2Q'21
$millionChange3
%
Constant currency
change2,3
%YTD'21
$millionYTD'20$million
Change3
%
Constant currency
change2,3
%
Operating income 2,629 2,505 5 4 2,646 (1) – 8,092 8,025 1 (1)Operating expenses (1,661) (1,601) (4) (2) (1,726) 4 3 (4,959) (4,628) (7) (4)Operating profit before impairment losses and taxation 968 904 7 7 920 5 6 3,133 3,397 (8) (9)Credit impairment (84) (157) 46 46 11 (131) (1,284) 90 90Other impairment (2) – (15) 87 88 (17) 150 (111) (111)Profit from associates and joint ventures 45 74 (39) (39) 89 (49) (48) 181 148 22 22Underlying profit before taxation 927 821 13 13 1,005 (8) (7) 3,166 2,411 31 30Restructuring (36) (22) (64) (48) (22) (64) (48) (63) (72) 13 15Other items – (35) 100 100 – – (35) 100 100Statutory profit before taxation 891 764 17 17 983 (9) (8) 3,103 2,304 35 34Total assets 475,407 449,081 6 6 467,933 2 3 475,407 449,081 6 6
Of which: loans and advances to customers4 263,296 237,138 11 11 255,630 3 4 263,296 237,138 11 11
Total liabilities 428,911 397,411 8 8 418,583 2 3 428,911 397,411 8 8Of which: customer accounts4 343,425 316,667 8 8 334,639 3 4 343,425 316,667 8 8
Risk-weighted assets 172,205 172,986 – 182,172 (5) 172,205 172,986 –
Cost-to-income ratio (%)5 63.2 63.9 0.7 1.1 65.2 2.0 2.1 61.3 57.7 (3.6) (3.3)1 Following the Group’s change in organisational structure, there has been an integration of Greater China & North Asia and ASEAN & South Asia to Asia. Prior periods have been
restated 2 Comparisons presented on the basis of the current period’s transactional currency rate, ensuring like-for-like currency rates between the two periods 3 Variance is better/(worse) other than risk-weighted assets, assets and liabilities which is increase/(decrease) 4 Loans and advances to customers includes FVTPL and customer accounts includes FVTPL and repurchase agreements 5 Change is the percentage points difference between the two periods rather than the percentage change 6 Not meaningful
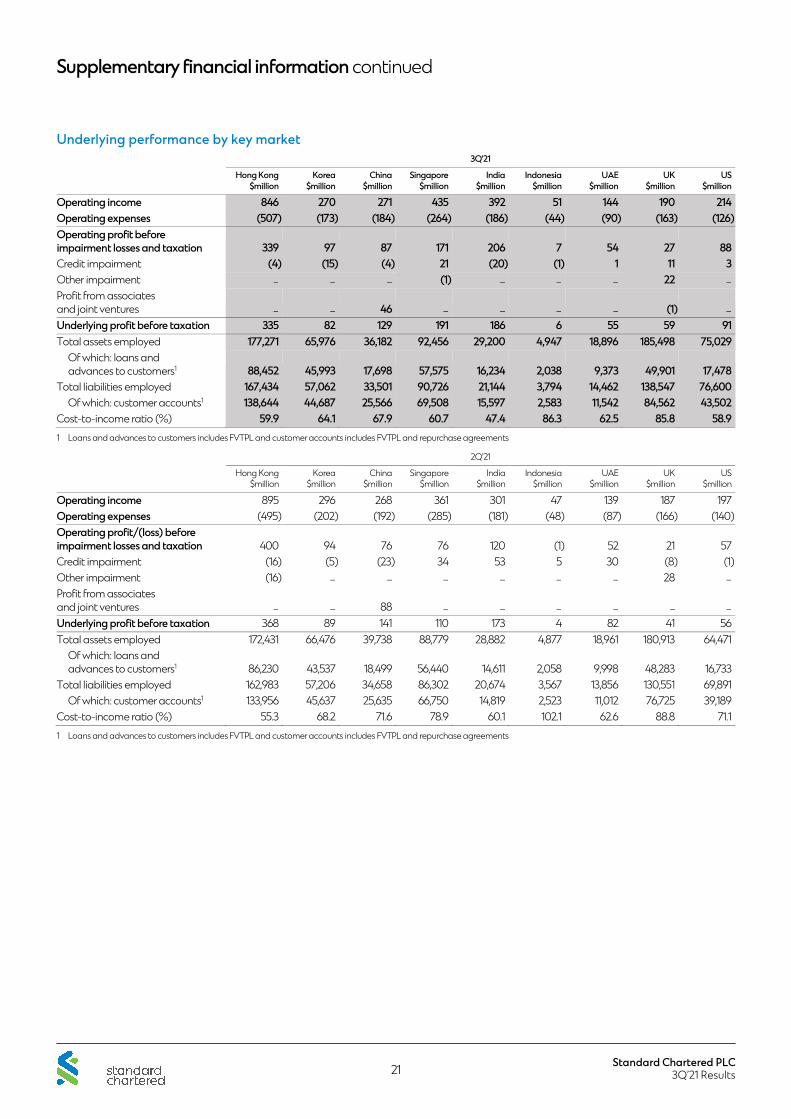
Performance highlights • Underlying profit before tax of $927 million was up 13 per cent as significantly lower credit impairment and higher income more
than offset the higher expenses
• Underlying operating income of $2,629 million was up 5 per cent, with the benefit from the IFRS9 interest income catch-up broadly offset by the non-repeat of the accelerated recognition of an annual Bancassurance bonus in 3Q’20.
• Loans and advances to customers were up 3 per cent since 30 June 2021, driven by growth in Trade in Hong Kong and Korea, Lending in Hong Kong and Mortgages in Korea, Hong Kong, and Singapore
• Risk-weighted assets were down $10 billion since 30 June 2021, mainly from Korea and India driven by model changes and improvements in asset quality following client repayments
Supplementary financial information continued
Standard Chartered PLC 3Q’21 Results 18
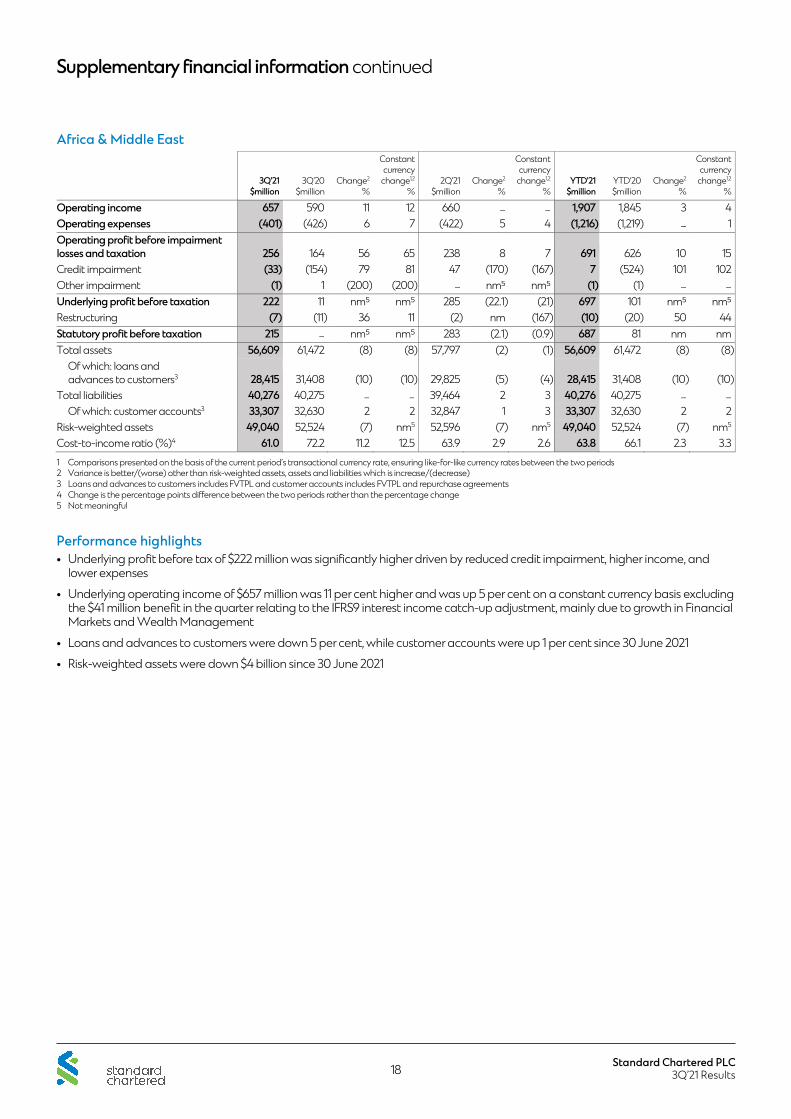
Africa & Middle East
3Q'21$million
3Q'20$million
Change2
%
Constant currency
change1,2
%2Q'21
$millionChange2
%
Constant currency
change1,2
%YTD'21
$millionYTD'20$million
Change2
%
Constant currency
change1,2
%
Operating income 657 590 11 12 660 – – 1,907 1,845 3 4Operating expenses (401) (426) 6 7 (422) 5 4 (1,216) (1,219) – 1Operating profit before impairment losses and taxation 256 164 56 65 238 8 7 691 626 10 15Credit impairment (33) (154) 79 81 47 (170) (167) 7 (524) 101 102Other impairment (1) 1 (200) (200) – (1) (1) – –
Underlying profit before taxation 222 11 285 (22.1) (21) 697 101Restructuring (7) (11) 36 11 (2) nm (167) (10) (20) 50 44Statutory profit before taxation 215 – 283 (2.1) (0.9) 687 81 nm nmTotal assets 56,609 61,472 (8) (8) 57,797 (2) (1) 56,609 61,472 (8) (8)
Of which: loans and advances to customers3 28,415 31,408 (10) (10) 29,825 (5) (4) 28,415 31,408 (10) (10)
Total liabilities 40,276 40,275 – – 39,464 2 3 40,276 40,275 – –
Of which: customer accounts3 33,307 32,630 2 2 32,847 1 3 33,307 32,630 2 2Risk-weighted assets 49,040 52,524 (7) nm5 52,596 (7) nm5 49,040 52,524 (7) nm5
Cost-to-income ratio (%)4 61.0 72.2 11.2 12.5 63.9 2.9 2.6 63.8 66.1 2.3 3.31 Comparisons presented on the basis of the current period’s transactional currency rate, ensuring like-for-like currency rates between the two periods 2 Variance is better/(worse) other than risk-weighted assets, assets and liabilities which is increase/(decrease) 3 Loans and advances to customers includes FVTPL and customer accounts includes FVTPL and repurchase agreements 4 Change is the percentage points difference between the two periods rather than the percentage change 5 Not meaningful
Performance highlights • Underlying profit before tax of $222 million was significantly higher driven by reduced credit impairment, higher income, and
lower expenses
• Underlying operating income of $657 million was 11 per cent higher and was up 5 per cent on a constant currency basis excluding the $41 million benefit in the quarter relating to the IFRS9 interest income catch-up adjustment, mainly due to growth in Financial Markets and Wealth Management
• Loans and advances to customers were down 5 per cent, while customer accounts were up 1 per cent since 30 June 2021
• Risk-weighted assets were down $4 billion since 30 June 2021
Supplementary financial information continued
Standard Chartered PLC 3Q’21 Results 19
Europe & Americas
3Q'21$million
3Q'20$million
Change2
%
Constant currency
change1,2
%2Q'21
$millionChange2
%
Constant currency
change1,2
%YTD'21
$millionYTD'20$million
Change2
%
Constant currency
change1,2
%
Operating income 514 423 22 21 443 16 17 1,507 1,518 (1) (2)Operating expenses (350) (360) 3 4 (359) 3 2 (1,075) (1,021) (5) (3)Operating profit before impairment losses and taxation 164 63 160 165 84 95 95 432 497 (13) (12)Credit impairment 11 (37) 130 126 15 (27) (29) 73 (117) 162 161Other impairment (14) 11 5 (7) 13 (154) (154)Underlying profit before taxation 161 37 104 55 54 498 393 27 29Restructuring (27) (8) (1) (47) (18) (161) (161)Statutory profit before taxation 134 29 103 30 27 451 375 20 23Total assets 275,427 233,772 18 18 261,041 6 6 275,427 233,772 18 18
Of which: loans and advances to customers3 72,057 67,265 7 7 69,721 3 4 72,057 67,265 7 7
Total liabilities 228,363 225,332 1 1 213,713 7 7 228,363 225,332 1 1Of which: customer accounts3 136,260 122,748 11 11 124,106 10 10 136,260 122,748 11 11
Risk-weighted assets 48,476 43,818 11 nm5 48,556 – nm5 48,476 43,818 11 nm5
Cost-to-income ratio (%)4 68.1 85.1 17.0 17.3 81.0 12.9 12.8 71.3 67.3 (4.0) (3.3)1 Comparisons presented on the basis of the current period’s transactional currency rate, ensuring like-for-like currency rates between the two periods 2 Variance is better/(worse) other than risk-weighted assets, assets and liabilities which is increase/(decrease) 3 Loans and advances to customers includes FVTPL and customer accounts includes FVTPL and repurchase agreements 4 Change is the percentage points difference between the two periods rather than the percentage change 5 Not meaningful
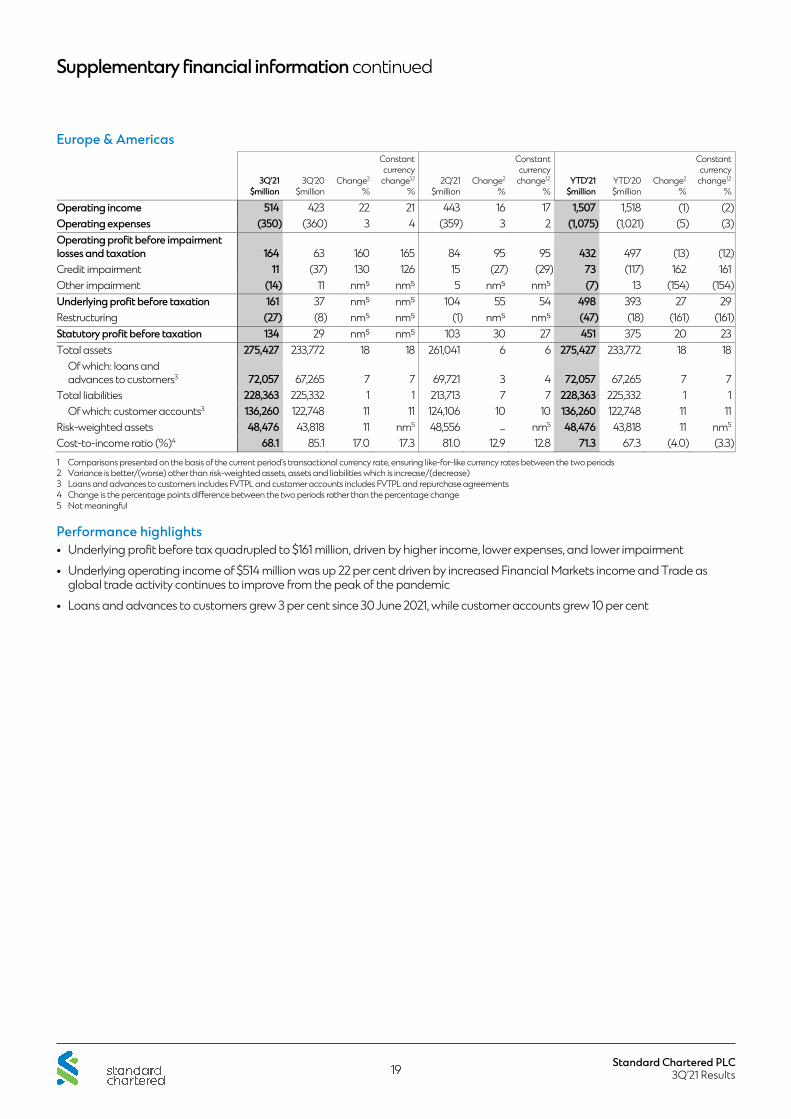
Performance highlights • Underlying profit before tax quadrupled to $161 million, driven by higher income, lower expenses, and lower impairment
• Underlying operating income of $514 million was up 22 per cent driven by increased Financial Markets income and Trade as global trade activity continues to improve from the peak of the pandemic
• Loans and advances to customers grew 3 per cent since 30 June 2021, while customer accounts grew 10 per cent

Supplementary financial information continued
Standard Chartered PLC 3Q’21 Results 20
Central & other items (region)
3Q'21$million
3Q'20$million
Change²%
Constant currency
change1,2
%2Q'21
$millionChange²
%
Constant currency
change1,2
%YTD'21
$millionYTD'20$million
Change²%
Constant currency
change1,2
%
Operating income (35) 1 (60) 42 46 (123) 178 (169) (169)Operating expenses (182) (93) (96) (71) (91) (100) (111) (436) (325) (34) (12)Operating loss before impairment losses and taxation (217) (92) (136) (103) (151) (44) (47) (559) (147) (162)Credit impairment (1) (5) 80 100 (6) 83 100 (9) 5Other impairment (18) (27) 33 36 1 (35) (65) 46 46Profit from associates and joint ventures 1 – 200 (2) 150 200 (1) 2 (150) (200)Underlying loss before taxation (235) (124) (90) (66) (158) (49) (52) (604) (205) (195) (121)Restructuring (29) (3) nm nm (65) 55 53 (102) (24)Goodwill impairment – (231) 100 100 – – (489) 100 100Other items 20 – – 20 20 – –
Statutory loss before taxation (244) (358) 32 35 (223) (9) (12) (686) (698) 2 10Total assets 9,659 10,104 (4) (4) 9,139 6 6 9,659 10,104 (4) (4)Total liabilities 66,217 40,841 62 62 71,293 (7) (7) 66,217 40,841 62 62Risk-weighted assets (2,166) (2,664) 19 (3,097) 30 (2,166) (2,664) 19Cost-to-income ratio (%) (excluding UK bank levy)3 nm4
1 Comparisons presented on the basis of the current period’s transactional currency rate, ensuring like-for-like currency rates between the two periods 2 Variance is better/(worse) other than risk-weighted assets, assets and liabilities which is increase/(decrease) 3 Change is the percentage points difference between the two periods rather than the percentage change 4 Not meaningful
Performance highlights • Underlying loss before tax of $235 million compared to 3Q’20 loss of $124 million, with income declining $36 million due to lower
returns paid to Treasury on the equity provided to the regions in a lower interest rate environment and increased expenses reflecting an increase in performance-related pay accruals and an increase in investment spend in digital ventures
Supplementary financial information continued
Standard Chartered PLC 3Q’21 Results 21
Underlying performance by key market 3Q'21
Hong Kong$million
Korea$million
China$million
Singapore$million
India$million
Indonesia$million
UAE$million
UK$million
US$million
Operating income 846 270 271 435 392 51 144 190 214Operating expenses (507) (173) (184) (264) (186) (44) (90) (163) (126)Operating profit before impairment losses and taxation 339 97 87 171 206 7 54 27 88Credit impairment (4) (15) (4) 21 (20) (1) 1 11 3Other impairment – – – (1) – – – 22 –
Profit from associates and joint ventures – – 46 – – – – (1) –
Underlying profit before taxation 335 82 129 191 186 6 55 59 91Total assets employed 177,271 65,976 36,182 92,456 29,200 4,947 18,896 185,498 75,029
Of which: loans and advances to customers1 88,452 45,993 17,698 57,575 16,234 2,038 9,373 49,901 17,478
Total liabilities employed 167,434 57,062 33,501 90,726 21,144 3,794 14,462 138,547 76,600Of which: customer accounts1 138,644 44,687 25,566 69,508 15,597 2,583 11,542 84,562 43,502
Cost-to-income ratio (%) 59.9 64.1 67.9 60.7 47.4 86.3 62.5 85.8 58.91 Loans and advances to customers includes FVTPL and customer accounts includes FVTPL and repurchase agreements
2Q'21
Hong Kong$million
Korea$million
China$million
Singapore$million
India$million
Indonesia$million
UAE$million
UK$million
US$million
Operating income 895 296 268 361 301 47 139 187 197Operating expenses (495) (202) (192) (285) (181) (48) (87) (166) (140)Operating profit/(loss) before impairment losses and taxation 400 94 76 76 120 (1) 52 21 57Credit impairment (16) (5) (23) 34 53 5 30 (8) (1)Other impairment (16) – – – – – – 28 –
Profit from associates and joint ventures – – 88 – – – – – –
Underlying profit before taxation 368 89 141 110 173 4 82 41 56Total assets employed 172,431 66,476 39,738 88,779 28,882 4,877 18,961 180,913 64,471
Of which: loans and advances to customers1 86,230 43,537 18,499 56,440 14,611 2,058 9,998 48,283 16,733
Total liabilities employed 162,983 57,206 34,658 86,302 20,674 3,567 13,856 130,551 69,891Of which: customer accounts1 133,956 45,637 25,635 66,750 14,819 2,523 11,012 76,725 39,189
Cost-to-income ratio (%) 55.3 68.2 71.6 78.9 60.1 102.1 62.6 88.8 71.11 Loans and advances to customers includes FVTPL and customer accounts includes FVTPL and repurchase agreements
Supplementary financial information continued
Standard Chartered PLC 3Q’21 Results 22
3Q'20
Hong Kong$million
Korea$million
China$million
Singapore$million
India$million
Indonesia$million
UAE$million
UK$million
US$million
Operating income 842 243 231 380 287 59 137 203 174Operating expenses (483) (183) (163) (241) (174) (39) (103) (184) (135)Operating profit before impairment losses and taxation 359 60 68 139 113 20 34 19 39Credit impairment (27) (8) 1 (12) (18) (11) (73) (46) 11Other impairment – – – – – – – 12 –
Profit from associates and joint ventures – – 74 – – – – – –
Underlying profit/(loss) before taxation 332 52 143 127 95 9 (39) (15) 50Total assets employed 167,971 60,223 36,614 84,548 28,139 5,081 21,940 157,167 62,079
Of which: loans and advances to customers1 81,175 38,908 16,562 51,674 15,348 2,394 11,074 43,804 19,699
Total liabilities employed 157,611 52,560 30,394 81,822 19,629 3,449 14,224 150,049 64,411Of which: customer accounts1 128,328 40,715 23,727 62,976 14,860 2,513 11,488 79,203 37,350
Cost-to-income ratio (%) 57.4 75.3 70.6 63.4 60.6 66.1 75.2 90.6 77.61 Loans and advances to customers includes FVTPL and customer accounts includes FVTPL and repurchase agreements
Quarterly underlying operating income by product 3Q'21
$million2Q'21
$million1Q'21
$million4Q'20
$million3Q'20
$million2Q'20
$million1Q'20
$million4Q'19
$million
Transaction Banking 645 637 643 652 665 721 800 834Trade 300 291 277 249 255 230 260 259Cash Management 345 346 366 403 410 491 540 575
Financial Markets 1,315 1,270 1,320 957 1,185 1,230 1,540 1,038Macro Trading 540 571 672 435 518 754 825 458Credit Markets 522 495 441 414 464 476 267 376
Credit Trading 144 102 131 119 129 181 (25) 83Financing Solutions & Issuance 378 393 310 295 335 295 292 293
Structured Finance 156 120 99 101 101 88 92 160Financing & Securities Services 98 85 108 76 124 113 51 116DVA (1) (1) – (69) (22) (201) 305 (72)
Lending & Portfolio Management 278 253 233 218 226 235 205 207Wealth Management 559 554 646 442 572 440 536 415Retail Products 828 846 849 848 859 913 946 960
CCPL & other unsecured lending 316 320 320 303 309 295 304 311Deposits 205 209 233 271 301 413 472 484Mortgage & Auto 260 268 247 234 211 169 136 130Other Retail Products 47 49 49 40 38 36 34 35
Treasury 149 137 257 92 40 178 325 196Other (9) (8) (19) (10) (28) 3 (25) (53)Total underlying operating income 3,765 3,689 3,929 3,199 3,519 3,720 4,327 3,597

Supplementary financial information continued
Standard Chartered PLC 3Q’21 Results 23
Earnings per ordinary share 3Q'21
$million3Q'20
$millionChange
%2Q'21
$millionChange
%YTD'21
$millionYTD'20$million
Change%
Profit/(loss) for the period attributable to equity holders 767 161 nm¹ 829 (7) 2,695 1,227 120Non-controlling interest (4) (7) 43 (6) 33 (18) (25) 28Dividend payable on preference shares and AT1 classified as equity (119) (31) nm¹ (132) 10 (315) (263) (20)Profit/(loss) for the period attributable to ordinary shareholders 644 123 nm¹ 691 (7) 2,362 939 152
Items normalised: Provision for regulatory matters – – nm¹ – nm¹ – (14) nm¹Restructuring 99 44 125 90 10 222 134 66Goodwill impairment – 231 nm¹ – nm¹ – 489 nm¹Net (gain)/loss on sale of businesses (20) 35 nm¹ – nm¹ (20) 29 nm¹Tax on normalised items (7) (5) (40) (8) 13 (22) (11) (100)Underlying profit/(loss) 716 428 67 773 (7) 2,542 1,566 62
Basic – Weighted average number of shares (millions) 3,105 3,151 nm¹ 3,121 nm¹ 3,124 3,162 nm1Diluted – Weighted average number of shares (millions) 3,152 3,192 nm¹ 3,169 nm¹ 3,174 3,200 nm1
Basic earnings per ordinary share (cents)² 20.7 3.9 16.8 22.1 (1.4) 75.6 29.7 45.9Diluted earnings per ordinary share (cents)² 20.4 3.9 16.5 21.8 (1.4) 74.4 29.3 45.1Underlying basic earnings per ordinary share (cents)² 23.1 13.6 9.5 24.8 (1.7) 81.4 49.5 31.9Underlying diluted earnings per ordinary share (cents)² 22.7 13.4 9.3 24.4 (1.7) 80.1 48.9 31.21 Not meaningful 2 Change is the percentage points difference between the two periods rather than the percentage change
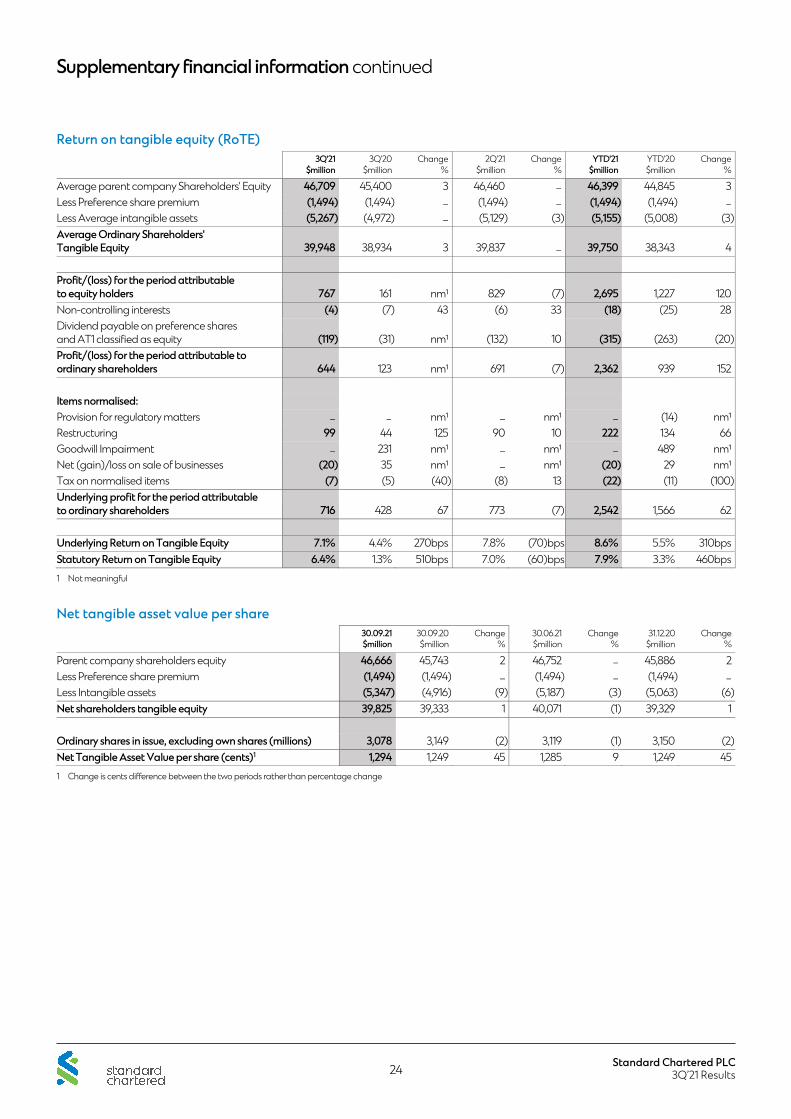
Supplementary financial information continued
Standard Chartered PLC 3Q’21 Results 24
Return on tangible equity (RoTE) 3Q'21
$million3Q'20
$millionChange
%2Q'21
$millionChange
%YTD'21
$millionYTD'20$million
Change%
Average parent company Shareholders' Equity 46,709 45,400 3 46,460 – 46,399 44,845 3Less Preference share premium (1,494) (1,494) – (1,494) – (1,494) (1,494) –
Less Average intangible assets (5,267) (4,972) – (5,129) (3) (5,155) (5,008) (3)Average Ordinary Shareholders' Tangible Equity 39,948 38,934 3 39,837 – 39,750 38,343 4
Profit/(loss) for the period attributable to equity holders 767 161 nm¹ 829 (7) 2,695 1,227 120Non-controlling interests (4) (7) 43 (6) 33 (18) (25) 28Dividend payable on preference shares and AT1 classified as equity (119) (31) nm¹ (132) 10 (315) (263) (20)Profit/(loss) for the period attributable to ordinary shareholders 644 123 nm¹ 691 (7) 2,362 939 152
Items normalised: Provision for regulatory matters – – nm¹ – nm¹ – (14) nm¹Restructuring 99 44 125 90 10 222 134 66Goodwill Impairment – 231 nm¹ – nm¹ – 489 nm¹Net (gain)/loss on sale of businesses (20) 35 nm¹ – nm¹ (20) 29 nm¹Tax on normalised items (7) (5) (40) (8) 13 (22) (11) (100)Underlying profit for the period attributable to ordinary shareholders 716 428 67 773 (7) 2,542 1,566 62
Underlying Return on Tangible Equity 7.1% 4.4% 270bps 7.8% (70)bps 8.6% 5.5% 310bpsStatutory Return on Tangible Equity 6.4% 1.3% 510bps 7.0% (60)bps 7.9% 3.3% 460bps1 Not meaningful
Net tangible asset value per share 30.09.21$million
30.09.20$million
Change%
30.06.21$million
Change%
31.12.20$million
Change%
Parent company shareholders equity 46,666 45,743 2 46,752 – 45,886 2Less Preference share premium (1,494) (1,494) – (1,494) – (1,494) –
Less Intangible assets (5,347) (4,916) (9) (5,187) (3) (5,063) (6)Net shareholders tangible equity 39,825 39,333 1 40,071 (1) 39,329 1
Ordinary shares in issue, excluding own shares (millions) 3,078 3,149 (2) 3,119 (1) 3,150 (2)Net Tangible Asset Value per share (cents)1 1,294 1,249 45 1,285 9 1,249 451 Change is cents difference between the two periods rather than percentage change
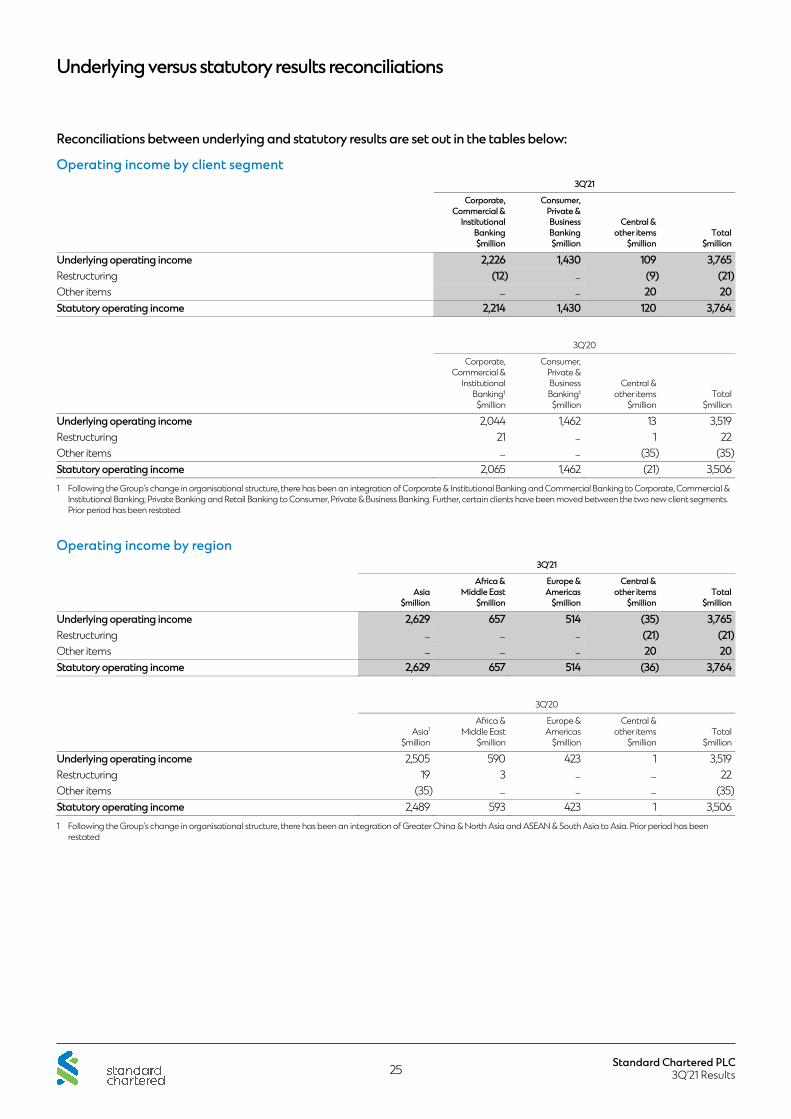
Underlying versus statutory results reconciliations
Standard Chartered PLC 3Q’21 Results 25
Reconciliations between underlying and statutory results are set out in the tables below:
Operating income by client segment 3Q'21
Corporate, Commercial &
Institutional Banking$million
Consumer,Private &BusinessBanking$million
Central &other items
$millionTotal
$million
Underlying operating income 2,226 1,430 109 3,765Restructuring (12) – (9) (21)Other items – – 20 20Statutory operating income 2,214 1,430 120 3,764
3Q'20
Corporate, Commercial &
Institutional Banking¹
$million
Consumer,Private &BusinessBanking¹
$million
Central &other items
$millionTotal
$million
Underlying operating income 2,044 1,462 13 3,519Restructuring 21 – 1 22Other items – – (35) (35)Statutory operating income 2,065 1,462 (21) 3,5061 Following the Group’s change in organisational structure, there has been an integration of Corporate & Institutional Banking and Commercial Banking to Corporate, Commercial &
Institutional Banking; Private Banking and Retail Banking to Consumer, Private & Business Banking. Further, certain clients have been moved between the two new client segments. Prior period has been restated
Operating income by region 3Q'21
Asia$million
Africa &Middle East
$million
Europe &Americas
$million
Central &other items
$millionTotal
$million
Underlying operating income 2,629 657 514 (35) 3,765Restructuring – – – (21) (21)Other items – – – 20 20Statutory operating income 2,629 657 514 (36) 3,764
3Q'20
Asia1
$million
Africa &Middle East
$million
Europe &Americas
$million
Central &other items
$millionTotal
$million
Underlying operating income 2,505 590 423 1 3,519Restructuring 19 3 – – 22Other items (35) – – – (35)Statutory operating income 2,489 593 423 1 3,5061 Following the Group’s change in organisational structure, there has been an integration of Greater China & North Asia and ASEAN & South Asia to Asia. Prior period has been
restated

Underlying versus statutory results reconciliations continued
Standard Chartered PLC 3Q’21 Results 26
Profit before taxation 3Q'21
Underlying$million
Provision for regulatory
matters$million
Restructuring$million
Goodwill impairment
$million
Net gain on businesses
disposed/ heldfor sale$million
Statutory$million
Operating income 3,765 – (21) – 20 3,764Operating expenses (2,594) – (53) – – (2,647)Operating profit/(loss) before impairment losses and taxation 1,171 – (74) – 20 1,117Credit impairment (107) – (1) – – (108)Other impairment (35) – (24) – – (59)Profit from associates and joint ventures 46 – – – – 46Profit/(loss) before taxation 1,075 – (99) – 20 996
3Q'20
Underlying$million
Provision for regulatory
matters$million
Restructuring$million
Goodwill impairment
$million
Net loss on businesses
disposed/ heldfor sale$million
Statutory$million
Operating income 3,519 – 22 – (35) 3,506Operating expenses (2,480) – (35) – – (2,515)Operating profit/(loss) before impairment losses and taxation 1,039 – (13) – (35) 991Credit impairment (353) – (5) – – (358)Other impairment (15) – (18) (231) – (264)Profit from associates and joint ventures 74 – (8) – – 66Profit/(loss) before taxation 745 – (44) (231) (35) 435
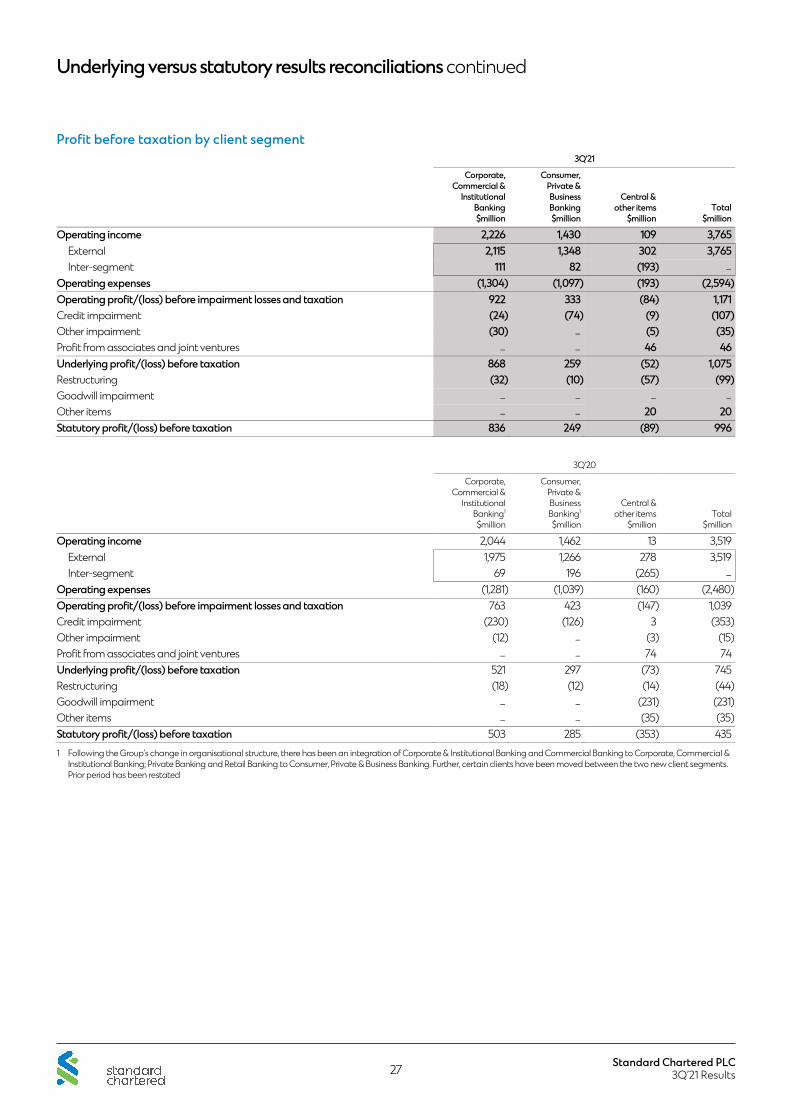
Underlying versus statutory results reconciliations continued
Standard Chartered PLC 3Q’21 Results 27
Profit before taxation by client segment 3Q'21
Corporate, Commercial &
Institutional Banking$million
Consumer,Private &BusinessBanking$million
Central &other items
$millionTotal
$million
Operating income 2,226 1,430 109 3,765External 2,115 1,348 302 3,765Inter-segment 111 82 (193) –
Operating expenses (1,304) (1,097) (193) (2,594)Operating profit/(loss) before impairment losses and taxation 922 333 (84) 1,171Credit impairment (24) (74) (9) (107)Other impairment (30) – (5) (35)Profit from associates and joint ventures – – 46 46Underlying profit/(loss) before taxation 868 259 (52) 1,075Restructuring (32) (10) (57) (99)Goodwill impairment – – – –
Other items – – 20 20Statutory profit/(loss) before taxation 836 249 (89) 996
3Q'20
Corporate, Commercial &
Institutional Banking1
$million
Consumer,Private &BusinessBanking1
$million
Central &other items
$millionTotal
$million
Operating income 2,044 1,462 13 3,519External 1,975 1,266 278 3,519Inter-segment 69 196 (265) –
Operating expenses (1,281) (1,039) (160) (2,480)Operating profit/(loss) before impairment losses and taxation 763 423 (147) 1,039Credit impairment (230) (126) 3 (353)Other impairment (12) – (3) (15)Profit from associates and joint ventures – – 74 74Underlying profit/(loss) before taxation 521 297 (73) 745Restructuring (18) (12) (14) (44)Goodwill impairment – – (231) (231)Other items – – (35) (35)Statutory profit/(loss) before taxation 503 285 (353) 4351 Following the Group’s change in organisational structure, there has been an integration of Corporate & Institutional Banking and Commercial Banking to Corporate, Commercial &
Institutional Banking; Private Banking and Retail Banking to Consumer, Private & Business Banking. Further, certain clients have been moved between the two new client segments. Prior period has been restated

Underlying versus statutory results reconciliations continued
Standard Chartered PLC 3Q’21 Results 28
Profit before taxation by region 3Q'21
Asia$million
Africa &Middle East
$million
Europe &Americas
$million
Central &other items
$millionTotal
$million
Operating income 2,629 657 514 (35) 3,765Operating expenses (1,661) (401) (350) (182) (2,594)Operating profit/(loss) before impairment losses and taxation 968 256 164 (217) 1,171Credit impairment (84) (33) 11 (1) (107)Other impairment (2) (1) (14) (18) (35)Profit from associates and joint ventures 45 – – 1 46Underlying profit/(loss) before taxation 927 222 161 (235) 1,075Restructuring (36) (7) (27) (29) (99)Goodwill impairment – – – – –
Other items – – – 20 20Statutory profit/(loss) before taxation 891 215 134 (244) 996
3Q'20
Asia1
$million
Africa &Middle East
$million
Europe &Americas
$million
Central &other items
$millionTotal
$million
Operating income 2,505 590 423 1 3,519Operating expenses (1,601) (426) (360) (93) (2,480)Operating profit/(loss) before impairment losses and taxation 904 164 63 (92) 1,039Credit impairment (157) (154) (37) (5) (353)Other impairment – 1 11 (27) (15)Profit from associates and joint ventures 74 – – – 74Underlying profit/(loss) before taxation 821 11 37 (124) 745Restructuring (22) (11) (8) (3) (44)Goodwill impairment – – – (231) (231)Other items (35) – – – (35)Statutory profit/(loss) before taxation 764 – 29 (358) 4351 Following the Group’s change in organisational structure, there has been an integration of Greater China & North Asia and ASEAN & South Asia to Asia. Prior period has been restated
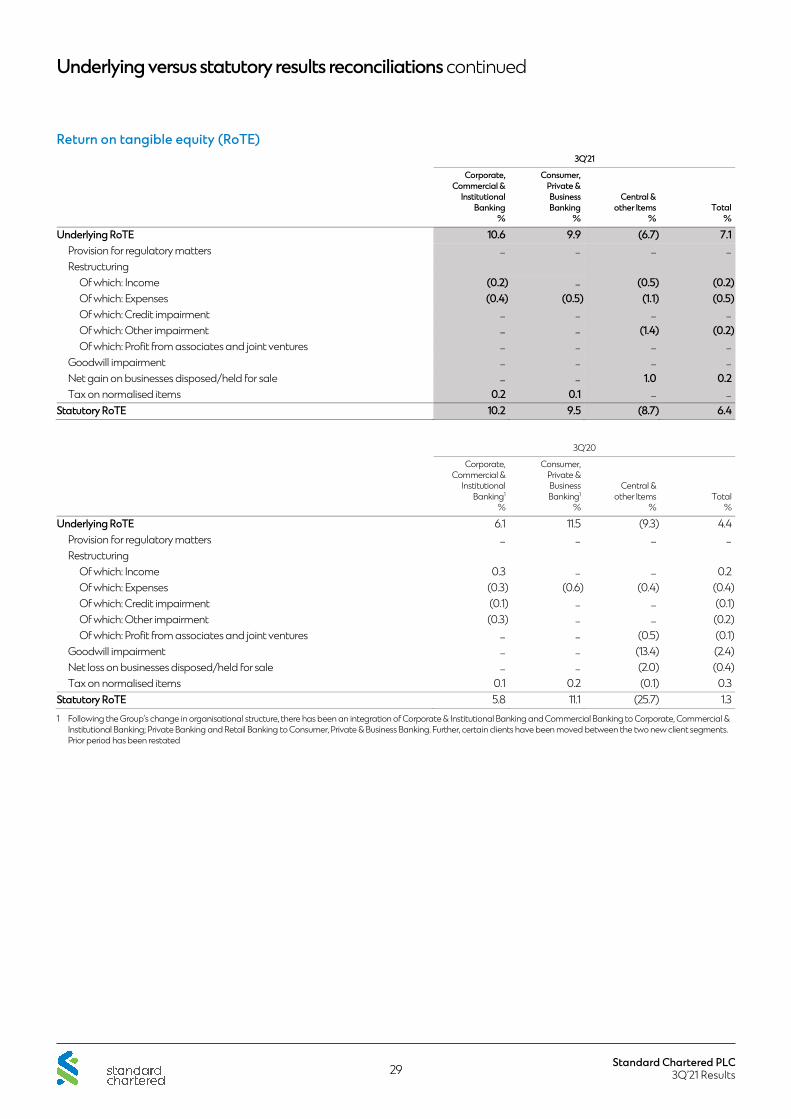
Underlying versus statutory results reconciliations continued
Standard Chartered PLC 3Q’21 Results 29
Return on tangible equity (RoTE) 3Q'21
Corporate, Commercial &
Institutional Banking
%
Consumer,Private &BusinessBanking
%
Central &other Items
%Total
%
Underlying RoTE 10.6 9.9 (6.7) 7.1Provision for regulatory matters – – – –
Restructuring Of which: Income (0.2) – (0.5) (0.2)Of which: Expenses (0.4) (0.5) (1.1) (0.5)Of which: Credit impairment – – – –
Of which: Other impairment – – (1.4) (0.2)Of which: Profit from associates and joint ventures – – – –
Goodwill impairment – – – –
Net gain on businesses disposed/held for sale – – 1.0 0.2Tax on normalised items 0.2 0.1 – –
Statutory RoTE 10.2 9.5 (8.7) 6.4
3Q'20
Corporate, Commercial &
Institutional Banking1
%
Consumer,Private &BusinessBanking1
%
Central &other Items
%Total
%
Underlying RoTE 6.1 11.5 (9.3) 4.4Provision for regulatory matters – – – –
Restructuring Of which: Income 0.3 – – 0.2Of which: Expenses (0.3) (0.6) (0.4) (0.4)Of which: Credit impairment (0.1) – – (0.1)Of which: Other impairment (0.3) – – (0.2)Of which: Profit from associates and joint ventures – – (0.5) (0.1)
Goodwill impairment – – (13.4) (2.4)Net loss on businesses disposed/held for sale – – (2.0) (0.4)Tax on normalised items 0.1 0.2 (0.1) 0.3
Statutory RoTE 5.8 11.1 (25.7) 1.31 Following the Group’s change in organisational structure, there has been an integration of Corporate & Institutional Banking and Commercial Banking to Corporate, Commercial &
Institutional Banking; Private Banking and Retail Banking to Consumer, Private & Business Banking. Further, certain clients have been moved between the two new client segments. Prior period has been restated

Underlying versus statutory results reconciliations continued
Standard Chartered PLC 3Q’21 Results 30
Earnings per ordinary share (EPS) 3Q'21
Underlying$ million
Provision for regulatory
matters$ million
Restructuring$ million
Profit from joint venture
$ million
Gainsarising on
repurchase of senior and
subordinated liabilities$ million
Net gain on Sale of
Businesses$ million
Goodwill impairment
$ million
Tax on normalised
items$ million
Statutory$ million
Profit for the year attributable to ordinary shareholders 716 – (99) – – 20 – 7 644Basic – Weighted average number of shares (millions) 3,105 3,105Basic earnings per ordinary share (cents) 23.1 20.7
3Q'20
Underlying$ million
Provision for regulatory
matters$ million
Restructuring$ million
Profit from joint venture
$ million
Gainsarising on
repurchase of senior and
subordinated liabilities$ million
Net loss on Sale of
Businesses$ million
Goodwill impairment
$ million
Tax on normalised
items$ million
Statutory$ million
Profit for the year attributable to ordinary shareholders 428 – (44) – – (35) (231) 5 123Basic – Weighted average number of shares (millions) 3,151 3,151Basic earnings per ordinary share (cents) 13.6 3.9

Risk review
Standard Chartered PLC 3Q’21 Results 31
Credit quality by client segment 30.09.21
Customers
Amortised cost Banks
$million
Corporate, Commercial &
Institutional Banking$million
Consumer,Private &BusinessBanking$million
Central &other items
$million
CustomerTotal
$million
Undrawn commitments
$million
Financial guarantees
$millionStage 1 45,042 123,108 132,872 28,160 284,140 145,383 53,517
- Strong 34,102 73,563 127,499 28,010 229,072 128,243 35,812- Satisfactory 10,940 49,545 5,373 150 55,068 17,140 17,705
Stage 2 730 13,513 2,080 166 15,759 9,979 2,616- Strong 115 2,133 1,432 – 3,565 3,180 367- Satisfactory 42 9,944 295 – 10,239 5,742 1,680- Higher risk 573 1,436 353 166 1,955 1,057 569
Of which (stage 2): - Less than 30 days past due 2 142 291 – 433 – –- More than 30 days past due 23 18 357 – 375 – –
Stage 3, credit-impaired financial assets – 6,503 1,681 – 8,184 14 939Gross balance¹ 45,772 143,124 136,633 28,326 308,083 155,376 57,072Stage 1 (11) (51) (358) (2) (411) (33) (8)
- Strong (3) (12) (287) (2) (301) (20) (2)- Satisfactory (8) (39) (71) – (110) (13) (6)
Stage 2 (7) (367) (168) – (535) (63) (30)- Strong – (34) (89) – (123) (4) (7)- Satisfactory (3) (234) (30) – (264) (47) (13)- Higher risk (4) (99) (49) – (148) (12) (10)
Of which (stage 2): - Less than 30 days past due – (3) (30) – (33) – –- More than 30 days past due – (3) (49) – (52) – –
Stage 3, credit-impaired financial assets – (3,837) (807) – (4,644) – (211)Total credit impairment (18) (4,255) (1,333) (2) (5,590) (96) (249)Net carrying value 45,754 138,869 135,300 28,324 302,493Stage 1 0.0% 0.0% 0.3% 0.0% 0.1% 0.0% 0.0%
- Strong 0.0% 0.0% 0.2% 0.0% 0.1% 0.0% 0.0%- Satisfactory 0.1% 0.1% 1.3% 0.0% 0.2% 0.1% 0.0%
Stage 2 1.0% 2.7% 8.1% 0.0% 3.4% 0.6% 1.1%- Strong 0.0% 1.6% 6.2% 0.0% 3.5% 0.1% 1.9%- Satisfactory 7.1% 2.4% 10.2% 0.0% 2.6% 0.8% 0.8%- Higher risk 0.7% 6.9% 13.9% 0.0% 7.6% 1.1% 1.8%
Of which (stage 2): - Less than 30 days past due 0.0% 2.1% 10.3% 0.0% 7.6% 0.0% 0.0%- More than 30 days past due 0.0% 16.7% 13.7% 0.0% 13.9% 0.0% 0.0%
Stage 3, credit-impaired financial assets (S3) 0.0% 59.0% 48.0% 0.0% 56.7% 0.0% 22.5%Cover ratio 0.0% 3.0% 1.0% 0.0% 1.8% 0.1% 0.4%
Fair value through profit or loss (FVTPL) Performing 21,832 59,115 82 2,008 61,205 – –
- Strong 18,092 40,077 82 2,005 42,164 – –- Satisfactory 3,740 19,038 – 3 19,041 – –- Higher risk – – – – – – –
Defaulted (CG13-14) – 70 – – 70 – –
Gross balance (FVTPL)2 21,832 59,185 82 2,008 61,275 – –
Net carrying value (incl FVTPL) 67,586 198,054 135,382 30,332 363,768 – –
1 Loans and advances includes reverse repurchase agreements and other similar secured lending of $8,836 million under Customers and of $501 million under Banks, held at amortised cost
2 Loans and advances includes reverse repurchase agreements and other similar secured lending of $51,687 million under Customers and of $17,723 million under Banks, held at fair value through profit or loss

Risk review continued
Standard Chartered PLC 3Q’21 Results 32
30.06.21
Customers
Amortised cost Banks
$million
Corporate, Commercial &
Institutional Banking$million
Consumer, Private & Business Banking$million
Central &other items
$million
CustomerTotal
$million
Undrawn commitments
$million
Financial Guarantees
$million
Stage 1 44,989 124,382 131,690 21,218 277,290 139,795 51,171- Strong 33,591 74,198 126,179 21,019 221,396 120,626 34,374- Satisfactory 11,398 50,184 5,511 199 55,894 19,169 16,797
Stage 2 212 15,440 2,194 – 17,634 10,620 2,585- Strong 120 2,138 1,491 – 3,629 4,181 485- Satisfactory 62 11,709 323 – 12,032 5,369 1,602- Higher risk 30 1,593 380 – 1,973 1,070 498
Of which (stage 2): - Less than 30 days past due – 175 319 – 494 – –
- More than 30 days past due – 170 384 – 554 – –
Stage 3, credit-impaired financial assets – 7,430 1,628 – 9,058 6 920Gross balance¹ 45,201 147,252 135,512 21,218 303,982 150,421 54,676Stage 1 (11) (74) (371) (2) (447) (31) (20)
- Strong (3) (24) (310) (2) (336) (18) (13)- Satisfactory (8) (50) (61) – (111) (13) (7)
Stage 2 (2) (357) (187) – (544) (48) (27)- Strong – (44) (90) – (134) (6) (1)- Satisfactory (2) (217) (35) – (252) (31) (14)- Higher risk – (96) (62) – (158) (11) (12)
Of which (stage 2): - Less than 30 days past due – – (35) – (35) – –
- More than 30 days past due – (8) (62) – (70) – –
Stage 3, credit-impaired financial assets – (4,230) (758) – (4,988) (1) (191)Total credit impairment (13) (4,661) (1,316) (2) (5,979) (80) (238)Net carrying value 45,188 142,591 134,196 21,216 298,003Stage 1 0.0% 0.1% 0.3% 0.0% 0.2% 0.0% 0.0%
- Strong 0.0% 0.0% 0.2% 0.0% 0.2% 0.0% 0.0%- Satisfactory 0.1% 0.1% 1.1% 0.0% 0.2% 0.1% 0.0%
Stage 2 0.9% 2.3% 8.5% 0.0% 3.1% 0.5% 1.0%- Strong 0.0% 2.1% 6.0% 0.0% 3.7% 0.1% 0.2%- Satisfactory 3.2% 1.9% 10.8% 0.0% 2.1% 0.6% 0.9%- Higher risk 0.0% 6.0% 16.3% 0.0% 8.0% 1.0% 2.4%
Of which (stage 2): - Less than 30 days past due 0.0% 0.0% 11.0% 0.0% 7.1% 0.0% 0.0%- More than 30 days past due 0.0% 4.7% 16.1% 0.0% 12.6% 0.0% 0.0%
Stage 3, credit-impaired financial assets (S3) 0.0% 56.9% 46.6% 0.0% 55.1% 16.7% 20.8%Cover ratio 0.0% 3.2% 1.0% 0.0% 2.0% 0.1% 0.4%
Fair value through profit or loss (FVTPL) Performing 22,388 56,448 99 547 57,094 – –
- Strong 18,919 37,076 98 544 37,718 – –
- Satisfactory 3,469 19,357 1 3 19,361 – –
- Higher risk – 15 – – 15 – –
Defaulted (CG13-14) – 79 – – 79 – –
Gross balance (FVTPL)2 22,388 56,527 99 547 57,173 – –
Net carrying value (incl FVTPL) 67,576 199,118 134,295 21,763 355,176 – –
1 Loans and advances includes reverse repurchase agreements and other similar secured lending of $4,584 million under Customers and of $620 million under Banks, held at amortised cost
2 Loans and advances includes reverse repurchase agreements and other similar secured lending of $46,788 million under Customers and of $17,563 million under Banks, held at fair value through profit or loss

Risk review continued
Standard Chartered PLC 3Q’21 Results 33
Credit impairment charge (restated)1
9 months ended 30.09.21 9 months ended 30.09.20
Stage 1 & 2$million
Stage 3$million
Total$million
Stage 1 & 2$million
Stage 3$million
Total$million
Ongoing business portfolio Corporate, Commercial & Institutional Banking1 (51) (61) (112) 446 891 1,337Consumer, Private & Business Banking1 (30) 197 167 322 254 576Central & others 6 (1) 5 9 (2) 7Credit impairment charge (75) 135 60 777 1,143 1,920
Restructuring business portfolio Others (3) – (3) – 14 14Credit impairment charge (3) – (3) – 14 14
Total credit impairment charge (78) 135 57 777 1,157 1,9341 Following the Group’s change in organisational structure, there has been an integration of Corporate & Institutional Banking and Commercial Banking to Corporate, Commercial &
Institutional Banking; Private Banking and Retail Banking to Consumer, Private & Business Banking. Further, certain clients have been moved between the two new client segments. Prior period has been restated
COVID-19 relief measures Asia Africa & Middle East Europe & Americas
Segment Outstanding
$million% of
portfolio1Outstanding
$million% of
portfolio1Outstanding
$million% of
portfolio1Outstanding
$million% of
portfolio1
Credit card & Personal loans 235 2% 69 1% 166 8%Mortgages & Auto 672 1% 660 1% 12 1%Business Banking 371 4% 371 4%Total Consumer, Private & Business Banking 1,278 1% 1,100 1% 178 6%Corporate, Commercial & Institutional Banking 675 457 208 10Total at 30 September 2021 1,953 1% 1,557 386 101 Percentage of portfolio represents the outstanding amount as a percentage of the gross loans and advances to banks and customers by product and segment and total loans and
advances to banks and customers

Risk review continued
Standard Chartered PLC 3Q’21 Results 34
Vulnerable sectors Maximum Exposure
30.09.21
Amortised Cost
Maximum on-balance sheet
exposure (net of credit impairment)
$millionCollateral
$million
Net on-balance sheet exposure
$million
Undrawn commitments
(net of credit impairment)
$million
Financial guarantees
(net of credit impairment)
$million
Net off-balance sheet exposure
$million
Total on &off-balance
sheet netexposure
$million
Industry: Aviation¹ 3,798 2,164 1,634 1,233 456 1,689 3,323Commodity Traders 9,708 350 9,358 2,365 6,418 8,783 18,141Metals & Mining 3,811 558 3,253 2,822 687 3,509 6,762Commercial Real Estate 18,506 6,395 12,111 6,403 279 6,682 18,793Hotels & Tourism 2,435 981 1,454 1,258 112 1,370 2,824Oil & Gas 7,350 1,146 6,204 8,132 5,625 13,757 19,961Total 45,608 11,594 34,014 22,213 13,577 35,790 69,804Total Corporate, Commercial & Institutional Banking 138,869 26,268 112,601 93,435 49,344 142,779 255,380Total Group 348,247 136,005 212,242 155,280 56,823 212,103 424,345
30.06.21
Amortised Cost
Maximum on-balance sheet
exposure (net of credit impairment)
$millionCollateral
$million
Net on-balance sheet exposure
$million
Undrawn commitments
(net of credit impairment)
$million
Financial guarantees
(net of credit impairment)
$million
Net off-balance sheet exposure
$million
Total on &off-balance
sheet netexposure
$million
Industry: Aviation¹ 4,033 2,068 1,965 1,422 455 1,877 3,842Commodity Traders 9,732 594 9,138 1,800 5,554 7,354 16,492Metals & Mining 4,138 415 3,723 2,774 708 3,482 7,205Commercial Real Estate 18,904 7,985 10,919 5,197 298 5,495 16,414Hotels & Tourism 2,585 1,150 1,435 1,262 98 1,360 2,795Oil & Gas 8,590 981 7,609 7,236 4,925 12,161 19,770Total 47,982 13,193 34,789 19,691 12,038 31,729 66,518Total Corporate, Commercial & Institutional Banking 142,591 27,730 114,861 86,568 47,471 134,039 248,900Total Group 343,191 134,731 208,460 150,341 54,438 204,779 413,2391 In addition to the aviation sector loan exposures, the Group owns $3.3 billion (30 June 2021: $3.4 billion) of aircraft under operating leases.

Risk review continued
Standard Chartered PLC 3Q’21 Results 35
Loans and advances by stage 30.09.21
Stage 1 Stage 2 Stage 3 Total
Amortised Cost
Gross Balance$million
Total Credit Impairment
$million
Net Carrying Amount$million
Gross Balance$million
Total Credit Impairment
$million
Net Carrying Amount$million
Gross Balance$million
Total Credit Impairment
$million
Net Carrying Amount$million
Gross Balance$million
Total Credit Impairment
$million
Net Carrying Amount$million
Industry: Aviation 1,636 – 1,636 1,979 (16) 1,963 256 (57) 199 3,871 (73) 3,798Commodity Traders 9,186 (2) 9,184 208 (5) 203 977 (656) 321 10,371 (663) 9,708Metals & Mining 3,279 – 3,279 447 (24) 423 225 (116) 109 3,951 (140) 3,811Commercial Real Estate 16,898 (10) 16,888 1,384 (16) 1,368 442 (192) 250 18,724 (218) 18,506Hotels & Tourism 1,199 – 1,199 1,124 (27) 1,097 189 (50) 139 2,512 (77) 2,435Oil & Gas 5,592 (6) 5,586 1,528 (53) 1,475 505 (216) 289 7,625 (275) 7,350Total 37,790 (18) 37,772 6,670 (141) 6,529 2,594 (1,287) 1,307 47,054 (1,446) 45,608Total Corporate, Commercial & Institutional Banking 123,108 (51) 123,057 13,513 (367) 13,146 6,503 (3,837) 2,666 143,124 (4,255) 138,869Total Group 329,182 (422) 328,760 16,489 (542) 15,947 8,184 (4,644) 3,540 353,855 (5,608) 348,247
30.06.21
Stage 1 Stage 2 Stage 3 Total
Amortised Cost
Gross Balance$million
Total Credit Impairment
$million
Net Carrying Amount$million
Gross Balance$million
Total Credit Impairment
$million
Net Carrying Amount$million
Gross Balance$million
Total Credit Impairment
$million
Net Carrying Amount$million
Gross Balance$million
Total Credit Impairment
$million
Net Carrying Amount$million
Industry: Aviation 1,992 – 1,992 1,887 (11) 1,876 225 (60) 165 4,104 (71) 4,033Commodity Traders 9,346 (3) 9,343 240 (2) 238 842 (691) 151 10,428 (696) 9,732Metals & Mining 3,337 (3) 3,334 714 (25) 689 210 (95) 115 4,261 (123) 4,138Commercial Real Estate 16,995 (17) 16,978 1,720 (20) 1,700 434 (208) 226 19,149 (245) 18,904Hotels & Tourism 1,188 (1) 1,187 1,336 (40) 1,296 136 (34) 102 2,660 (75) 2,585Oil & Gas 6,821 (4) 6,817 1,587 (58) 1,529 469 (225) 244 8,877 (287) 8,590Total 39,679 (28) 39,651 7,484 (156) 7,328 2,316 (1,313) 1,003 49,479 (1,497) 47,982Total Corporate, Commercial & Institutional Banking 124,382 (74) 124,308 15,440 (357) 15,083 7,430 (4,230) 3,200 147,252 (4,661) 142,591Total Group 322,279 (458) 321,821 17,846 (546) 17,300 9,058 (4,988) 4,070 349,183 (5,992) 343,191

Capital review
Standard Chartered PLC 3Q’21 Results 36
Capital ratios 30.09.21 30.06.21 Change4 31.12.20 Change4
CET1 14.6% 14.1% 0.5 14.4% 0.2Tier 1 capital 17.2% 16.4% 0.8 16.5% 0.7Total capital 22.0% 21.1% 0.9 21.2% 0.8
CRD Capital base1
30.09.21$million
30.06.21$million
Change5
%31.12.20
$millionChange5
%
CET1 instruments and reserves Capital instruments and the related share premium accounts 5,528 5,548 – 5,564 (1)Of which: share premium accounts 3,989 3,989 – 3,989 –
Retained earnings2 25,210 25,695 (2) 25,723 (2)Accumulated other comprehensive income (and other reserves) 11,936 12,278 (3) 12,688 (6)Non-controlling interests (amount allowed in consolidated CET1) 197 191 3 180 9Independently reviewed interim and year-end profits 2,691 1,924 40 718 275Foreseeable dividends (744) (315) (136) (481) (55)CET1 capital before regulatory adjustments 44,818 45,321 (1) 44,392 1CET1 regulatory adjustments –
Additional value adjustments (prudential valuation adjustments) (569) (632) 10 (490) (16)Intangible assets (net of related tax liability)3 (4,164) (4,072) (2) (4,274) 3Deferred tax assets that rely on future profitability (excludes those arising from temporary differences) (152) (109) (39) (138) (10)Fair value reserves related to net losses on cash flow hedges 24 38 (37) 52 (54)Deduction of amounts resulting from the calculation of excess expected loss (696) (864) 19 (701) 1Net gains on liabilities at fair value resulting from changes in own credit risk 45 53 (15) 52 (13)Defined-benefit pension fund assets (62) (60) (3) (40) (55)Fair value gains arising from the institution’s own credit risk related to derivative liabilities (45) (46) 2 (48) 6Exposure amounts which could qualify for risk weighting of 1250% (32) (40) 20 (26) (23)Total regulatory adjustments to CET1 (5,651) (5,732) 1 (5,613) (1)CET1 capital 39,167 39,589 (1) 38,779 1Additional Tier 1 capital (AT1) instruments 6,811 6,313 8 5,632 21AT1 regulatory adjustments (20) (20) – (20) –
Tier 1 capital 45,958 45,882 – 44,391 4–
Tier 2 capital instruments 12,943 13,309 (3) 12,687 2Tier 2 regulatory adjustments (30) (30) – (30) –
Tier 2 capital 12,913 13,279 (3) 12,657 2Total capital 58,871 59,161 – 57,048 3Total risk-weighted assets 267,555 280,227 (5) 268,834 –
1 CRD capital is prepared on the regulatory scope of consolidation 2 Retained earnings includes IFRS9 capital relief (transitional) of $278 million, including dynamic relief of $67 million 3 Deduction for intangible assets includes software deduction relief of $1,054 million as the CRR ‘Quick Fix’ measures 4 Change is percentage points difference between two points rather than percentage change 5 Variance is increase/(decrease) comparing current reporting period to prior reporting periods

Capital review continued
Standard Chartered PLC 3Q’21 Results 37
Movement in total capital 9 months ended
30.09.21$million
Year ended 31.12.20
$million
CET1 at 1 January 38,779 36,513Ordinary shares issued in the period and share premium – –
Share buy-back (506) (242)Profit for the period 2,691 718Foreseeable dividends deducted from CET1 (744) (481)Difference between dividends paid and foreseeable dividends (209) 476Movement in goodwill and other intangible assets 110 1,044Foreign currency translation differences (625) 700Non-controlling interests 17 (543)Movement in eligible other comprehensive income (117) 324Deferred tax assets that rely on future profitability (14) (9)Decrease/(increase) in excess expected loss 5 121Additional value adjustments (prudential valuation adjustment) (79) 125IFRS 9 transitional impact on regulatory reserves including day one (116) 35Exposure amounts which could qualify for risk weighting (6) 36Fair value gains arising from the institution's own Credit Risk related to derivative liabilities 3 (10)Other (22) (28)CET1 at 30 September/31 December 39,167 38,779
AT1 at 1 January 5,612 7,164Net issuances (redemptions) 1,736 (995)Foreign currency translation difference (3) 8Excess on AT1 grandfathered limit (ineligible) (554) (565)AT1 at 30 September/31 December 6,791 5,612
Tier 2 capital at 1 January 12,657 12,288Regulatory amortisation (779) (463)Net issuances (redemptions) 638 (69)Foreign currency translation difference (158) 257Tier 2 ineligible minority interest 1 82Recognition of ineligible AT1 554 565Other – (3)Tier 2 capital at 30 September/31 December 12,913 12,657Total capital at 30 September/31 December 58,871 57,048

Capital review continued
Standard Chartered PLC 3Q’21 Results 38
Risk-weighted assets by business 30.09.21
Credit risk$million
Operational risk$million
Market risk$million
Total risk$million
Corporate, Commercial & Institutional Banking 124,699 16,595 20,722 162,016Consumer, Private & Business Banking 44,083 8,504 – 52,587Central & other items 50,846 2,017 89 52,952Total risk-weighted assets 219,628 27,116 20,811 267,555
30.06.21
Credit risk$million
Operational risk$million
Market risk$million
Total risk$million
Corporate, Commercial & Institutional Banking 134,328 16,595 23,690 174,613Consumer, Private & Business Banking 47,660 8,504 – 56,164Central & other items 47,360 2,017 73 49,450Total risk-weighted assets 229,348 27,116 23,763 280,227
31.12.201
Credit risk$million
Operational risk$million
Market risk$million
Total risk$million
Corporate, Commercial & Institutional Banking 127,663 15,963 21,465 165,091Consumer, Private & Business Banking 44,755 8,338 – 53,093Central & other items 48,023 2,499 128 50,650Total risk-weighted assets 220,441 26,800 21,593 268,8341 Following the Group’s change in organisational structure, there has been an integration of Corporate & Institutional Banking and Commercial Banking to Corporate, Commercial &
Institutional Banking; Private Banking and Retail Banking to Consumer, Private & Business Banking. Prior period has been restated.
Risk-weighted assets by geographic region 30.09.21$million
30.06.21$million
Change1
%31.12.202
$millionChange1
%
Asia 172,205 182,172 (5) 174,283 (1)Africa & Middle East 49,040 52,596 (7) 51,149 (4)Europe & Americas 48,476 48,556 – 45,758 6Central & other items (2,166) (3,097) 30 (2,356) 8Total risk-weighted assets 267,555 280,227 (5) 268,834 –
1 Variance is increase/(decrease) comparing current reporting period to prior reporting periods 2 Following the Group’s change in organisational structure, there has been an integration of Greater China & North Asia and ASEAN & South Asia to Asia. Prior period has been
restated

Capital review continued
Standard Chartered PLC 3Q’21 Results 39
Movement in risk-weighted assets Credit risk
Corporate, Commercial &
Institutional Banking$million
Consumer,Private &BusinessBanking$million
Central &other items
$millionTotal
$million
Operationalrisk
$millionMarket risk
$millionTotal risk
$million
At 31 December 2019 123,667 42,819 49,178 215,664 27,620 20,806 264,090At 01 January 20201 123,611 42,875 49,178 215,664 27,620 20,806 264,090Assets (decline)/growth (9,743) 520 3,711 (5,512) – – (5,512)Asset quality 12,190 323 2,409 14,922 – – 14,922Risk-weighted assets efficiencies (71) – – (71) – – (71)Model, methodology and policy changes 247 134 661 1,042 – (1,500) (458)Disposals – – (7,859) (7,859) (1,003) (159) (9,021)Foreign currency translation 1,429 903 (77) 2,255 – – 2,255Other, including non-credit risk movements – – – – 183 2,446 2,629At 31 December 2020 127,663 44,755 48,023 220,441 26,800 21,593 268,834Assets (decline)/growth 999 4,729 3,944 9,672 – – 9,672Asset quality (1,790) (461) (60) (2,311) – – (2,311)Risk-weighted assets efficiencies (415) (30) (657) (1,102) – – (1,102)Model, methodology and policy changes – (3,701) – (3,701) – – (3,701)Acquisitions/Disposals – – – – – – –
Foreign currency translation (1,758) (1,209) (781) (3,748) – – (3,748)Other, including non-credit risk movements – – 377 377 316 (782) (89)At 30 September 2021 124,699 44,083 50,846 219,628 27,116 20,811 267,5551 Following a reorganisation of certain clients, there has been a reclassification of balances across client segments. 1 January 2020 balances have been restated.

Capital review continued
Standard Chartered PLC 3Q’21 Results 40
UK leverage ratio 30.09.21$million
30.06.21$million
Change3
%31.12.20
$millionChange3
%
Tier 1 capital (transitional) 45,958 45,882 – 44,391 4Additional Tier 1 capital subject to phase out (557) (557) – (1,114) 50Tier 1 capital (end point)1 45,401 45,325 – 43,277 5Derivative financial instruments 52,668 52,254 1 69,467 (24)Derivative cash collateral 10,639 9,832 8 11,759 (10)Securities financing transactions (SFTs) 78,747 69,555 13 67,570 17Loans and advances and other assets 675,048 664,269 2 640,254 5Total on-balance sheet assets 817,102 795,910 3 789,050 4Regulatory consolidation adjustments2 (72,047) (67,508) (7) (60,059) (20)Derivatives adjustments – –
Derivatives netting (33,996) (33,043) (3) (44,257) 23Adjustments to cash collateral (18,089) (16,784) (8) (21,278) 15Net written credit protection 1,551 1,505 3 1,284 21Potential future exposure on derivatives 51,199 49,471 3 42,410 21Total derivatives adjustments 665 1,149 (42) (21,841) 103Counterparty risk leverage exposure measure for SFTs 14,711 9,178 60 4,969 196Off-balance sheet items 135,572 133,785 1 128,167 6Regulatory deductions from Tier 1 capital (5,584) (5,682) 2 (5,521) (1)UK leverage exposure (end point) 890,419 866,832 3 834,765 7UK leverage ratio (end point)4 5.1% 5.2% (0.1) 5.2% (0.1)UK leverage exposure quarterly average 873,156 879,678 (1) 837,147 4UK leverage ratio quarterly average4 5.2% 5.1% 0.1 5.2% –
Countercyclical leverage ratio buffer4 0.1% 0.1% – 0.0% 0.1G-SII additional leverage ratio buffer4 0.4% 0.4% – 0.4% –
1 Tier 1 Capital (end point) is adjusted only for Grandfathered Additional Tier 1 instruments 2 Includes adjustment for qualifying central bank claims 3 Variance is increase/(decrease) comparing current reporting period to prior reporting periods 4 Change is the percentage point difference between the two periods, rather than the percentage change
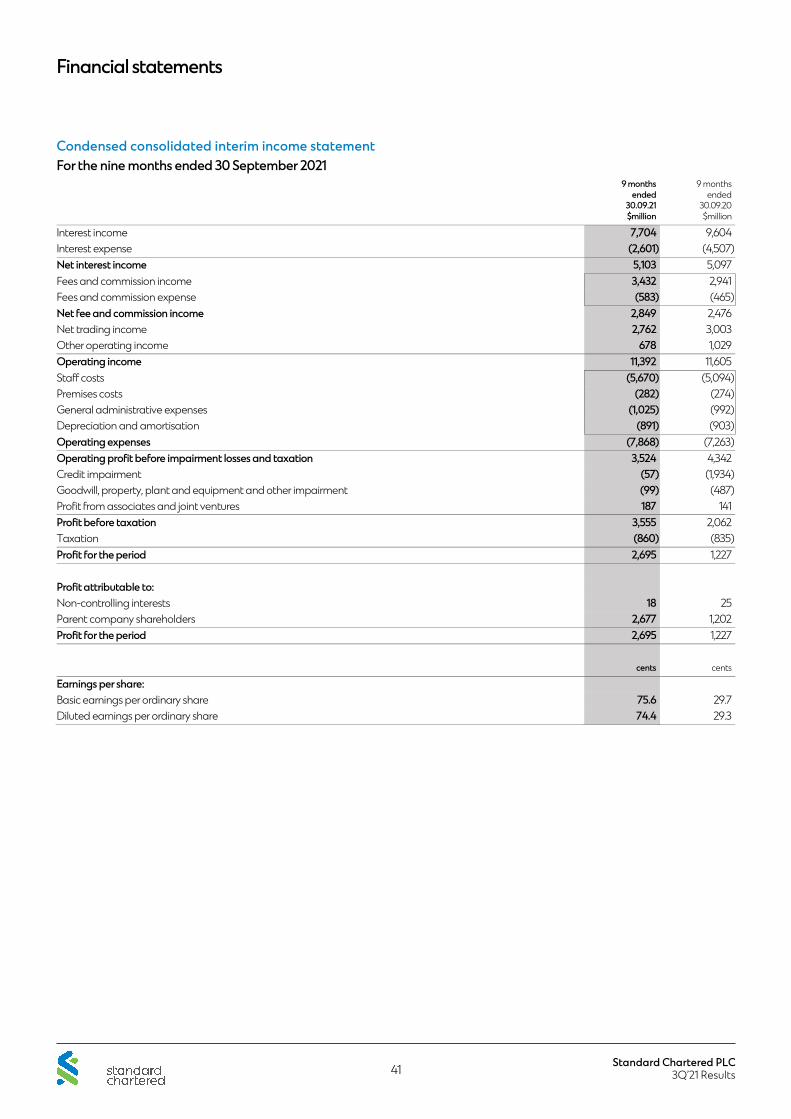
Financial statements
Standard Chartered PLC 3Q’21 Results 41
Condensed consolidated interim income statement For the nine months ended 30 September 2021
9 monthsended
30.09.21$million
9 monthsended
30.09.20$million
Interest income 7,704 9,604Interest expense (2,601) (4,507)Net interest income 5,103 5,097Fees and commission income 3,432 2,941Fees and commission expense (583) (465)Net fee and commission income 2,849 2,476Net trading income 2,762 3,003Other operating income 678 1,029Operating income 11,392 11,605Staff costs (5,670) (5,094)Premises costs (282) (274)General administrative expenses (1,025) (992)Depreciation and amortisation (891) (903)Operating expenses (7,868) (7,263)Operating profit before impairment losses and taxation 3,524 4,342Credit impairment (57) (1,934)Goodwill, property, plant and equipment and other impairment (99) (487)Profit from associates and joint ventures 187 141Profit before taxation 3,555 2,062Taxation (860) (835)Profit for the period 2,695 1,227
Profit attributable to: Non-controlling interests 18 25Parent company shareholders 2,677 1,202Profit for the period 2,695 1,227
cents cents
Earnings per share: Basic earnings per ordinary share 75.6 29.7Diluted earnings per ordinary share 74.4 29.3

Financial statements continued
Standard Chartered PLC 3Q’21 Results 42
Condensed consolidated interim statement of comprehensive income For the nine months ended 30 September 2021
9 monthsended
30.09.21$million
9 monthsended
30.09.20$million
Profit for the period 2,695 1,227Other comprehensive (loss)/income
Items that will not be reclassified to income statement: 227 1Own credit gains on financial liabilities designated at fair value through profit or loss 7 21Equity instruments at fair value through other comprehensive income 152 65Actuarial gains/(losses) on retirement benefit obligations 128 (52)Taxation relating to components of other comprehensive income (60) (33)Items that may be reclassified subsequently to income statement: (896) 192Exchange differences on translation of foreign operations:
Net losses taken to equity (781) (248)Net gains/(losses) on net investment hedges 151 (20)Reclassified to income statement on sale of joint venture – 246
Share of other comprehensive income/(loss) from associates and joint ventures 3 (20)Debt instruments at fair value through other comprehensive income:
Net valuation (losses)/gains taken to equity (202) 852Reclassified to income statement (164) (562)Net impact of expected credit losses 8 8
Cash flow hedges: Net gains/(losses) taken to equity 15 (45)Reclassified to income statement 17 14
Taxation relating to components of other comprehensive income 57 (33)Other comprehensive (loss)/income for the period, net of taxation (669) 193Total comprehensive income for the period 2,026 1,420
Total comprehensive income attributable to: Non-controlling interests 14 19Parent company shareholders 2,012 1,401Total comprehensive income for the period 2,026 1,420

Financial statements continued
Standard Chartered PLC 3Q’21 Results 43
Condensed consolidated interim balance sheet As at 30 September 2021
30.09.21$million
31.12.20$million
Assets Cash and balances at central banks 75,617 66,712Financial assets held at fair value through profit or loss 112,782 106,787Derivative financial instruments 52,668 69,467Loans and advances to banks 45,754 44,347Loans and advances to customers 302,493 281,699Investment securities 152,422 153,315Other assets 57,681 48,688Current tax assets 629 808Prepayments and accrued income 2,114 2,122Interests in associates and joint ventures 2,334 2,162Goodwill and intangible assets 5,347 5,063Property, plant and equipment 5,860 6,515Deferred tax assets 837 919Assets classified as held for sale 564 446Total assets 817,102 789,050Liabilities Deposits by banks 34,480 30,255Customer accounts 453,260 439,339Repurchase agreements and other similar secured borrowing 11,569 1,903Financial liabilities held at fair value through profit or loss 76,252 68,373Derivative financial instruments 52,130 71,533Debt securities in issue 53,424 55,550Other liabilities 59,618 47,904Current tax liabilities 375 660Accruals and deferred income 4,314 4,546Subordinated liabilities and other borrowed funds 16,819 16,654Deferred tax liabilities 748 695Provisions for liabilities and charges 446 466Retirement benefit obligations 332 443Total liabilities 763,767 738,321Equity Share capital and share premium account 7,022 7,058Other reserves 11,936 12,688Retained earnings 27,708 26,140Total parent company shareholders’ equity 46,666 45,886Other equity instruments 6,254 4,518Total equity excluding non-controlling interests 52,920 50,404Non-controlling interests 415 325Total equity 53,335 50,729Total equity and liabilities 817,102 789,050

Financial statements continued
Standard Chartered PLC 3Q’21 Results 44
Condensed consolidated statement of changes in equity For the nine months ended 30 September 2021
Ordinary share
capital and share
premium account$million
Preference share capital
and share premium account$million
Capital and
merger reserves1
$million
Own credit adjustment
reserve$million
Fair valuethrough other
comprehensive income reserve
– debt$million
Fair valuethrough other
comprehensive income reserve
– equity$million
Cash flow hedge
reserve$million
Translation reserve$million
Retained earnings$million
Parent company
shareholders' equity
$million
Other equity instruments
$million
Non-controlling
interests$million
Total$million
As at 1 January 2020 5,584 1,494 17,187 2 197 150 (59) (5,792) 26,072 44,835 5,513 313 50,661Profit for the period – – – – – – – – 724 724 – 27 751Other comprehensive (loss)/income – – – (54) 332 (2) 7 631 112 925 – (12) 913Distributions – – – – – – – – – – – (20) (20)Other equity instruments issued, net of expenses – – – – – – – – – – 992 – 992Redemption of other equity instruments – – – – – – – – (13) (13) (1,987) – (2,000)Treasury shares net movement – – – – – – – – (90) (90) – – (90)Share option expense, net of taxation – – – – – – – – 133 133 – – 133Dividends on preference shares and AT1 securities – – – – – – – – (395) (395) – – (395)Share buy-back3 (20) – 20 – – – – – (242) (242) – – (242)Other movements – – – – – – – 69 (60)4 9 – 175 26As at 31 December 2020 5,564 1,494 17,207 (52) 529 148 (52) (5,092) 26,140 45,886 4,518 325 50,729Profit for the period – – – – – – – – 2,677 2,677 – 18 2,695Other comprehensive income/(loss) – – – 7 (295) 94 28 (625) 1262 (665) – (4) (669)Distributions – – – – – – – – – – – (25) (25)Other equity instruments issued, net of expenses – – – – – – – – – – 2,728 – 2,728Redemption of other equity instruments – – – – – – – – (50) (50) (992) – (1,042)Treasury shares net movement – – – – – – – – (136) (136) – – (136)Share option expense, net of taxation – – – – – – – – 128 128 – – 128Dividends on ordinary shares – – – – – – – – (375) (375) – – (375)Dividends on preference shares and AT1 securities – – – – – – – – (315) (315) – – (315)Share buy-back6,7 (39) – 39 – – – – – (506) (506) – – (506)Other movements 3 – – – – – – – 198 22 – 1019 123As at 30 September 2021 5,528 1,494 17,246 (45) 234 242 (24) (5,717) 27,708 46,666 6,254 415 53,335
1 Includes capital reserve of $5 million, capital redemption reserve of $130 million and merger reserve of $17,111 million 2 Comprises actuarial gain, net of taxation, and share from associates and joint ventures $126 million ($11 million for the year ended 31 December 2020) 3 On 28 February 2020, the Group announced the buy-back programme for a share buy-back of its ordinary shares of $0.50 each. Nominal value of share purchases was $20 million,
and the total consideration paid was $242 million. The total number of shares purchased was 40,029,585 representing 1.25 per cent of the ordinary shares in issue. The nominal value of the shares was transferred from the share capital to the capital redemption reserve account. On 1 April 2020, the Group announced that, in response to a request from the Prudential Regulation Authority and as a consequence of the unprecedented challenges facing the world due to the COVID-19 pandemic, its board had decided after careful consideration to withdraw the recommendation to pay a final dividend for 2019 of 20 cents per ordinary share, and to suspend the buy-back programme
4 Includes $69 million related to prior period adjustments to reclass FX movements from translation reserve to retained earnings ($45 million related to FX movements of the hedging instruments for net investment hedges and $24 million related to FX movements for monetary items, which were considered structural positions), and $9 million increase related to revenue reserves of PT Bank Permata Tbk
5 Movement related to non-controlling interest from Mox Bank Limited 6 On 25 February 2021, the Group announced the buy-back programme for a share buy-back of its ordinary shares of $0.50 each. Nominal value of share purchases was $19 million,
and the total consideration paid was $255 million (including $1.5 million of fees and stamp duty). The total number of shares purchased was 37,148,399 representing 1.18 per cent of the ordinary shares in issue. The nominal value of the shares was transferred from the share capital to the capital redemption reserve account
7 On 3 August 2021, the Group announced the buy-back programme for a share buy-back of its ordinary shares of $0.50 each. Nominal value of share purchases was $20 million, and the total consideration paid was $251 million (including $1.5 million of fees and stamp duty). The total number of shares purchased was 39,914,763 representing 1.28 per cent of the ordinary shares in issue. The nominal value of the shares was transferred from the share capital to the capital redemption reserve account
8 Movement mainly related to increase in non-controlling interest from SC Digital Solutions (SG) Ltd 9 Movements related to non-controlling interest from Mox Bank Limited ($21 million), SC Digital Solutions (SG) Ltd ($55 million), Currency Fair Ltd ($22 million)

Financial statements continued
Standard Chartered PLC 3Q’21 Results 45
Basis of preparation This statement covers the results of Standard Chartered PLC together with its subsidiaries and equity accounted interest in associates and jointly controlled entities (the Group) for the nine months ended 30 September 2021. The financial information on which this statement is based, and the data set out in the appendix to this statement, are unaudited and have been prepared in accordance with the Group’s accounting policies. The Group’s significant accounting policies are described in the Annual Report 2020, which have been prepared in accordance with international accounting standards in conformity with the requirements of the Companies Act 2006 and International Financial Reporting Standards adopted pursuant to Regulation (EC) No. 1606/2002 as it applies in the European Union (EU). The Group’s Annual Report 2021 will be prepared in accordance with United Kingdom (UK) adopted international accounting standards. The interim financial information does not constitute a full or condensed set of financial statements under IAS 34 ‘Interim Financial Reporting’ as contained in UK-adopted international accounting standards. The interim financial information has been prepared in accordance with the recognition and measurement principles, but not the disclosure requirements under UK-adopted international accounting standards. The information in this document does not comprise statutory accounts within the meaning of Section 434 of the Companies Act 2006. Statutory accounts for the year ended 31 December 2020, which contained an unqualified audit report under Section 495 of the Companies Act 2006 (which did not make any statements under Section 498 of the Companies Act 2006) have been delivered to the Registrar of Companies in accordance with Section 441 of the Companies Act 2006.
Comparatives The Group meets the criteria to offset its derivative assets and liabilities and the related variation margin for the Group’s (house) trades cleared with LCH Forexclear. The impact of this as at 30 September 2021 is a decrease in the derivative assets and other assets (variation margin) of $1.6 bn and derivative liabilities of $1.6bn. Prior period comparative information have not been restated as the effect would not be material. The impact at 31 December 2020 would have been a decrease in the derivative assets of $1.8bn, derivative liabilities and other liabilities (variation margin) of $1.8bn.
Going concern The directors have assessed the Group’s ability to continue as a going concern. This assessment has been made having considered the impact of COVID-19, macroeconomic and geopolitical headwinds, including: • A review of the Group Corporate Plan
• An assessment of the actual performance to date, loan book quality, credit impairment, legal, regulatory and compliance matters, and the annual budget
• Consideration of stress testing performed, including both the Bank of England annual stress test and a Group Recovery and Resolution Plan (RRP) as submitted to the PRA, which demonstrate that the Group has sufficient capital and liquidity to continue as a going concern and meet minimum regulatory capital and liquidity requirements
• Analysis of the capital, funding and liquidity position of the Group, including the capital, liquidity and leverage ratios
• The level of debt in issue, including redemptions and issuances during the year, debt falling due for repayment in the next 12 months and further planned debt issuances, including the appetite in the market for the Group’s debt
• A detailed review of all principal and emerging risks
Based on the analysis performed, the directors confirm they are satisfied that the Group has adequate resources to continue in business for the period from 2 November 2021 to 2 November 2022. For this reason, the Group continues to adopt the going concern basis of accounting for preparing the financial statements.

Other supplementary financial information
Standard Chartered PLC 3Q’21 Results 46
Average balance sheets and yields Average assets
9 months ended 30.09.21
Average non-interest earning
balance$million
Average interest earning balance
$millionInterest income
$million
Gross yield interest earning balance
%
Gross yield total balance
%
Cash and balances at central banks 22,945 57,362 69 0.16 0.11Gross loans and advances to banks 23,512 46,091 369 1.07 0.71Gross loans and advances to customers 54,632 306,924 5,721 2.49 2.12Impairment provisions against loans and advances to banks and customers – (6,374) – – –
Investment securities 31,746 153,280 1,545 1.35 1.12Property, plant and equipment and intangible assets 8,916 – – – –Prepayments, accrued income and other assets 110,815 – – – –Investment associates and joint ventures 2,297 – – – –Total average assets 254,863 557,283 7,704 1.85 1.27
6 months ended 30.06.21
Average non-interest earning
balance$million
Average interest earning balance
$millionInterest income
$million
Gross yield interest earning balance
%
Gross yield total balance
%
Cash and balances at central banks 23,174 56,473 42 0.15 0.11Gross loans and advances to banks 22,809 46,623 247 1.07 0.72Gross loans and advances to customers 53,335 305,302 3,780 2.50 2.13Impairment provisions against loans and advances to banks and customers – (6,451) – – –
Investment securities 31,605 155,268 1,053 1.37 1.14Property, plant and equipment and intangible assets 8,960 – – - -Prepayments, accrued income and other assets 113,672 – – - -Investment associates and joint ventures 2,267 – – - -Total average assets 255,822 557,215 5,122 1.85 1.27
9 months ended 30.09.20
Average non-interest earning
balance$million
Average interest earning balance
$millionInterest income
$million
Gross yield interest earning balance
%
Gross yield total balance
%
Cash and balances at central banks 17,051 41,386 93 0.30 0.21Gross loans and advances to banks 28,221 54,750 646 1.58 1.04Gross loans and advances to customers 50,504 289,387 6,663 3.08 2.62Impairment provisions against loans and advances to banks and customers – (6,341) – – –
Investment securities 27,775 143,069 2,202 2.06 1.72Property, plant and equipment and intangible assets 10,235 – – - -Prepayments, accrued income and other assets 113,718 – – - -Investment associates and joint ventures 2,118 – – - -Total average assets 249,622 522,251 9,604 2.46 1.66

Other supplementary financial information continued
Standard Chartered PLC 3Q’21 Results 47
Average liabilities 9 months ended 30.09.21
Average non-interest bearing
balance$million
Average interest bearing balance
$millionInterest expense
$million
Rate paid interest bearing balance
%
Rate paid total balance
%
Deposits by banks 19,094 26,530 104 0.52 0.30Customer accounts:
Current accounts and savings deposits 49,937 259,389 608 0.31 0.26Time and other deposits 52,444 149,719 1,046 0.93 0.69
Debt securities in issue 6,337 60,006 425 0.95 0.86Accruals, deferred income and other liabilities 115,108 1,164 40 4.59 0.05Subordinated liabilities and other borrowed funds – 16,525 378 3.06 3.06Non-controlling interests 370 – – – –Shareholders’ funds 51,662 – – – –
294,952 513,333 2,601 0.68 0.43
Adjustment for Financial Markets funding costs (77)Financial guarantee fees on interest earning assets 73Total average liabilities and shareholders’ funds 294,952 513,333 2,597 0.68 0.43
6 months ended 30.06.21
Average non-interest bearing
balance$million
Average interest bearing balance
$millionInterest expense
$million
Rate paid interest bearing balance
%
Rate paid total balance
%
Deposits by banks 17,261 26,599 74 0.56 0.34Customer accounts:
Current accounts and savings deposits 48,934 257,233 388 0.30 0.26Time and other deposits 53,606 151,262 733 0.98 0.72
Debt securities in issue 6,129 61,232 284 0.94 0.85Accruals, deferred income and other liabilities 118,293 1,093 27 4.98 0.05Subordinated liabilities and other borrowed funds – 16,386 246 3.03 3.03Non-controlling interests 330 – – - -Shareholders’ funds 51,085 – – - -
295,638 513,805 1,752 0.69 0.44
Adjustment for Financial Markets funding costs (52)Financial guarantee fees on interest earning assets 47Total average liabilities and shareholders’ funds 295,638 513,805 1,747 0.69 0.44
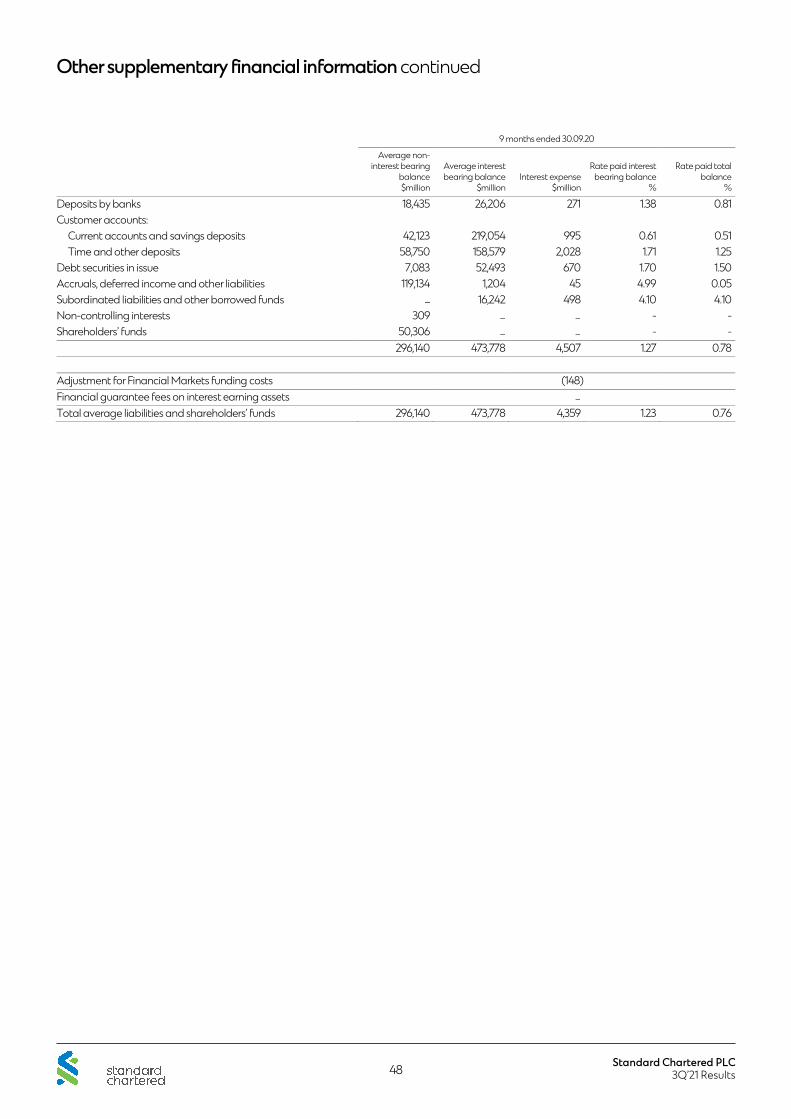
Other supplementary financial information continued
Standard Chartered PLC 3Q’21 Results 48
9 months ended 30.09.20
Average non-interest bearing
balance$million
Average interest bearing balance
$millionInterest expense
$million
Rate paid interest bearing balance
%
Rate paid total balance
%
Deposits by banks 18,435 26,206 271 1.38 0.81Customer accounts:
Current accounts and savings deposits 42,123 219,054 995 0.61 0.51Time and other deposits 58,750 158,579 2,028 1.71 1.25
Debt securities in issue 7,083 52,493 670 1.70 1.50Accruals, deferred income and other liabilities 119,134 1,204 45 4.99 0.05Subordinated liabilities and other borrowed funds – 16,242 498 4.10 4.10Non-controlling interests 309 – – - -Shareholders’ funds 50,306 – – - -
296,140 473,778 4,507 1.27 0.78
Adjustment for Financial Markets funding costs (148)Financial guarantee fees on interest earning assets –
Total average liabilities and shareholders’ funds 296,140 473,778 4,359 1.23 0.76

Standard Chartered PLC 3Q’21 Results
CONTACT INFORMATION Global headquarters Standard Chartered Group 1 Basinghall Avenue London, EC2V 5DD United Kingdom telephone: +44 (0)20 7885 8888 facsimile: +44 (0)20 7885 9999
Shareholder enquiries ShareCare information website: sc.com/shareholders helpline: +44 (0)370 702 0138 ShareGift information website: ShareGift.org helpline: +44 (0)20 7930 3737
Registrar information UK Computershare Investor Services PLC The Pavilions Bridgwater Road Bristol, BS99 6ZZ helpline: +44 (0)370 702 0138
Hong Kong Computershare Hong Kong Investor Services Limited 17M Floor, Hopewell Centre 183 Queen’s Road East Wan Chai Hong Kong website: computershare.com/hk/investors
Chinese translation Computershare Hong Kong Investor Services Limited 17M Floor, Hopewell Centre 183 Queen’s Road East Wan Chai Hong Kong
Register for electronic communications website: investorcentre.co.uk For further information, please contact: Gregg Powell, Head of Investor Relations +852 2820 3050 LSE Stock code: STAN.LN HKSE Stock code: 02888