
Standard calculation of costs - echa.europa.eu · Standard calculation of costs Advanced Course in...
22
http://echa.europa.eu Standard calculation of costs Advanced Course in SEA and Benefit-Cost Analysis 31 August - 3 September 2009 Matti Vainio, ECHA
Transcript of Standard calculation of costs - echa.europa.eu · Standard calculation of costs Advanced Course in...

http://echa.europa.eu
Standard calculation of costs
Advanced Course in SEA and Benefit-Cost Analysis31 August - 3 September 2009
Matti Vainio, ECHA

http://echa.europa.eu
Outline1. Objective2. Key issues3. Example
� Baseline, temporal scope, representative year� Two scenarios� Scenario 1: use of Substance B � Scenario 2: importation of wire� Sensitivity analysis� Summary results
4. Conclusions5. Discussion

http://echa.europa.eu
1. Objectives
• Learn from nut and bots calculation differencebetween private and social costs
• Get feedback on the need for such approach- helpful ?
• Caveat: will use the example of cost calculationto illustrate the points made in the ”Informationon how to calculate compliance costs of Chemical Regulation”

http://echa.europa.eu
2. Key issues: Direct vs indirect costs
Direct costs• RMO on the costs of
producing or using a good or a service
• e.g. costs due to higher investment needs, labouror energy needs
Indirect costs• Reduction in welfare due
to a policy-induced change in behaviour– eg. welfare decrease as a
downstream user switches from one product to another (originally less preferred one) due to a policy change
– Need price elasticities
Splitting direct and indirect costs depends on the point of view- Here split made between price and substitution effect (based on DG ENV)

http://echa.europa.eu
Key issues: Stock or flow?
• Discount rate needed in both cases• Is ”stock” i.e. cumulative approach better
– Theoretically yes – in particular if there is an inreasing ordecreasing trend
– Need to specify time period (e.g. 2010-2024)– Present value depends on this, too– NPV can be used even when comparing complex income/cost
streams– In reality, will we have such information?
• Annualized costs easier to calculate– Also intuitive (e.g. vs GDP or turnover of a sector)– In reality, is this enough?

http://echa.europa.eu
3. Example• Substance A
– used in coating wires in motors of washing machines– Without coating lifetime of the washing machine reduced from 10 to 2
years– causes human health problems in manufacturing coated wires– Substitute exists – ”Substance B”
• The chain:– Manufacturers supply Substance A – Formulators prepare a mixture using the substance– The mixture is used by downstream users for coating wires – Wires are used in motors for washing machines.
• Total number of washing machines on the market is 50m/y. Restriction affects 2% of them, i.e. 1m/y. – In the authorisation case, the 1 million represents the supply chain of all
applicants. • Analyst has access to real (after tax) prices.
http://echa.europa.eu
Baseline, temporal scope, representative year
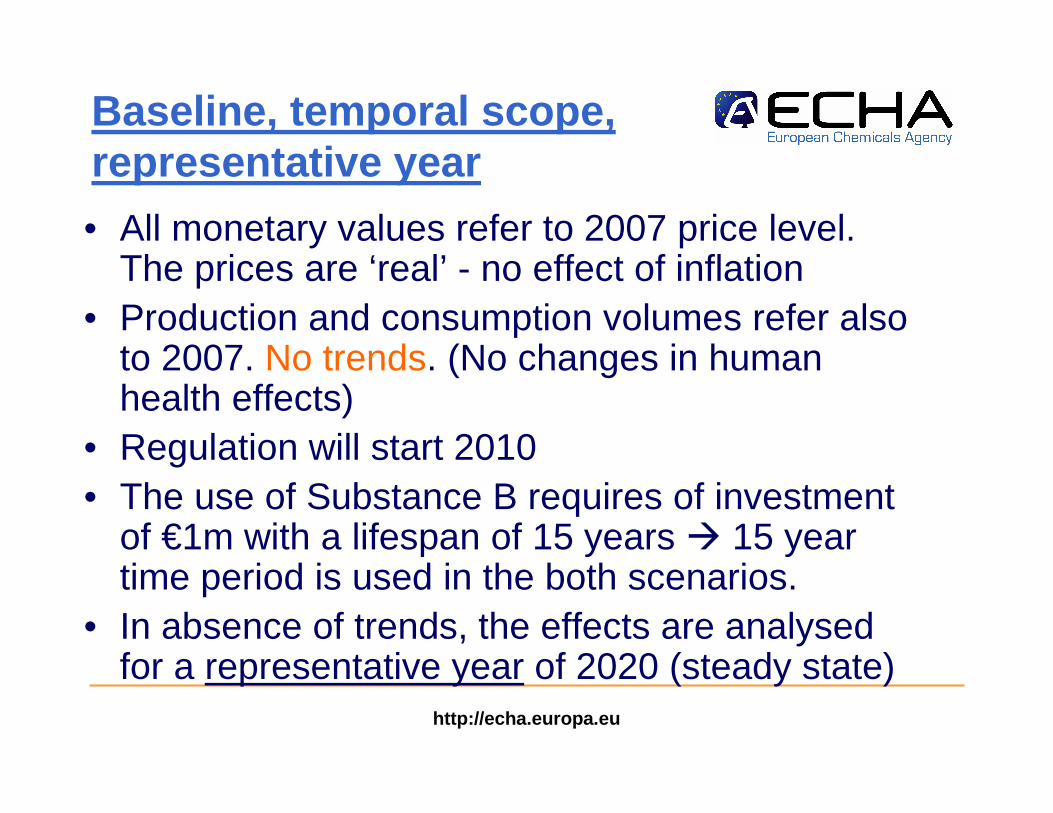
• All monetary values refer to 2007 price level. The prices are ‘real’ - no effect of inflation
• Production and consumption volumes refer also to 2007. No trends. (No changes in human health effects)
• Regulation will start 2010• The use of Substance B requires of investment
of €1m with a lifespan of 15 years � 15 yeartime period is used in the both scenarios.
• In absence of trends, the effects are analysed for a representative year of 2020 (steady state)
http://echa.europa.eu
Two scenarios
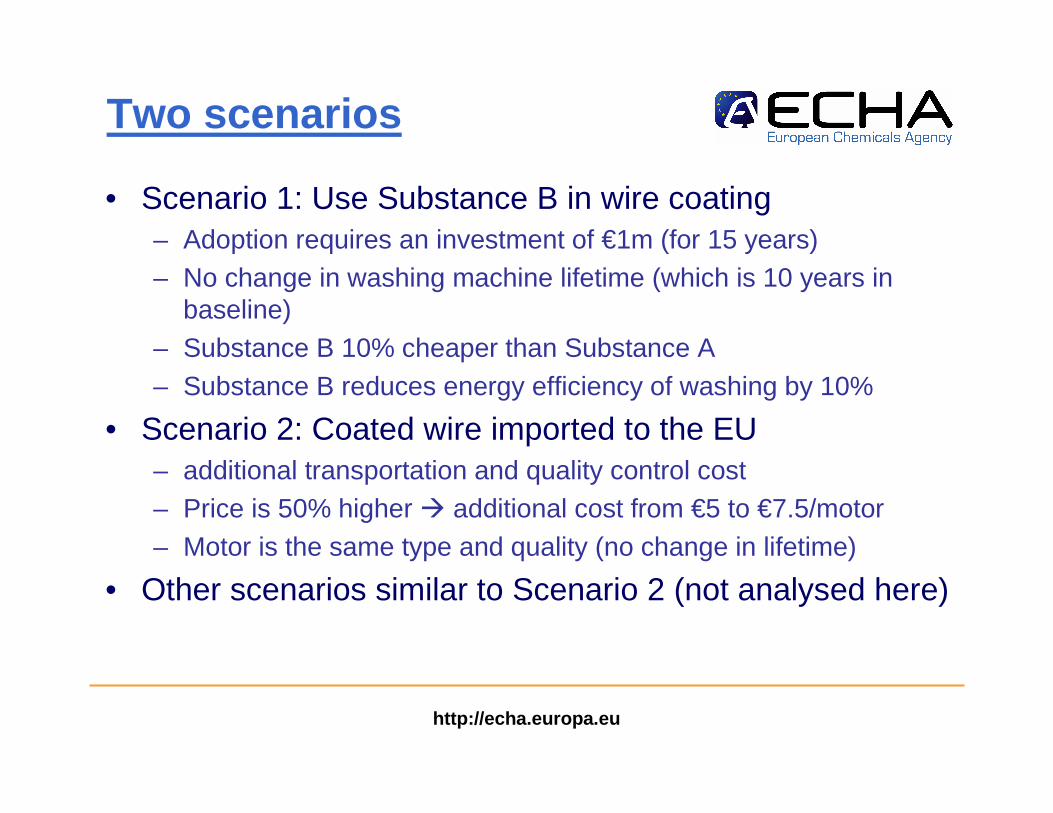
• Scenario 1: Use Substance B in wire coating – Adoption requires an investment of €1m (for 15 years)– No change in washing machine lifetime (which is 10 years in
baseline) – Substance B 10% cheaper than Substance A– Substance B reduces energy efficiency of washing by 10%
• Scenario 2: Coated wire imported to the EU– additional transportation and quality control cost – Price is 50% higher � additional cost from €5 to €7.5/motor– Motor is the same type and quality (no change in lifetime)
• Other scenarios similar to Scenario 2 (not analysed here)

http://echa.europa.eu
Scenario 1: use Substance B- Effects
• Change in investment costs – the production costs of washing machines are
increased due to investment needs
• Change in recurrent costs– Material cost down due to lower price of Substance B
• Change in recurrent costs– annual operating costs of a washing machine are
increased due to higher energy usage

http://echa.europa.eu
Parameters
– Quantity used is 0.058 kg / motor and machine;– Price of Substance A is €10/kg; – Price of Substance B is 10% less, i.e. €9/kg;– Investment cost for adopting Substance B is €1m;– Additional electricity consumption is 20
kWh/year/machine using Substance B;– Price of electricity is €0.12/kWh;– The lifetime of investment is 15 years, and the
discount rate is 4%

http://echa.europa.eu
Additional unit cost
€ per washing machine
produced Annualised investment cost to shift from A to B (lifetime of equipment 15 years) 0.089 Annualised effect of Substance B being 10% less expensive -0.058 Annualised energy cost per washing machine (€0.12 / kWh x 200 kWh) 2.400 Total 2.432

http://echa.europa.eu
Aggregate cost
• Given that the cost per annum in 2010 was €2.43 per washing machine, the impact for 10 million washing machines in 2020 would be €24.32 million using the representative year approach
• Concerning the investment cycle of 15 years for 1 million washing machines annually 2010-2024 yields the present value costs of €175.26 million in 2010 using the cumulative approach

http://echa.europa.eu
Scenario 2 – Importation of wire
• Increase of costs due to the higher price of the imported coated wire
• Parameters:– Production cost of the coated wire per motor = €5– The importation costs 50% more, i.e. €2.5 per motor
for 10 years– Annualise the above with 4%
• €0.308 per motor per year

http://echa.europa.eu
Sunk costs
• Regulation would cause wire producers not to be able to realise all of their current capital assets � sunk cost
• In this example sunk costs dominate– responsible for 2/3 of the total costs

http://echa.europa.eu
Additional unit cost with sunk costs
€ per washing machine
produced Annualised cost of wire being €2.5 more expensive (10 years lifetime)
0.308
Sunk costs Annualised cost of lost capital of 1 million due to buildings for wire producer (8 years lifetime left) 0.149
Annualised cost of lost capital of 2 million due to scrapped production equipment for wire producer (5 years lifetime left)
0.449
Sunk costs sub-total 0.598 Total (including sunk costs) 0.906 Total (excluding sunk costs) 0.308

http://echa.europa.eu
Aggregate cost with sunk costs
Cost per washing machine per
annum (€)
# of washing machines placed on the market (millions)
total cost (€millions)
2010 0.91 1 0.91 2011 0.91 2 1.81 2012 0.91 3 2.72 2013 0.91 4 3.62 2014 0.91 5 4.53 2015 0.91 6 5.44 2016 0.91 7 6.34 2017 0.91 8 7.25 2018 0.91 9 8.15 2019 0.91 10 9.06 2020 0.91 10 9.06 2021 0.91 10 9.06 2022 0.91 10 9.06 2023 0.91 10 9.06 2024 0.91 10 9.06
Present Value for 2010-24 65.29

http://echa.europa.eu
Aggregate cost without sunk costs
Cost per washing machine per
annum (€)
# of washing machines placed on the market (million)
Total cost (€million)
2010 0.31 1 0.31 2011 0.31 2 0.62 2012 0.31 3 0.92 2013 0.31 4 1.23 2014 0.31 5 1.54 2015 0.31 6 1.85 2016 0.31 7 2.16 2017 0.31 8 2.47 2018 0.31 9 2.77 2019 0.31 10 3.08 2020 0.31 10 3.08 2021 0.31 10 3.08 2022 0.31 10 3.08 2023 0.31 10 3.08 2024 0.31 10 3.08 Present Value for 2010-24 22.21

http://echa.europa.eu
Sensitivity analysis
• There is uncertainty about number of washing cycles per year and thus, the related electricity consumption. – Assume the uncertainty is +/- 25% – 10 million x (+/-) 25% x €2.4/y = €6 million/year– €18.32 to €30.32 m per annum (mean €24.32m) in
2020– PV (2010-24) €132.02 to €218.50 m (mean €175.3m)
• Can be done as a standard practice to uncertainparameters e.g. to price, discount rate
• Example

http://echa.europa.eu
per year165,26 €Difference
per year219,58 €Option 2
per year54,32 €Option 1
Total
1 320 €1 720,15 €400,00 €Present valueper year2,50 €Difference
163 €212,08 €49,32 €2019per year7,50 €Option 2
163 €212,08 €49,32 €2018per year5,00 €Option 1
163 €212,08 €49,32 €2017Recurrent costs
163 €212,08 €49,32 €2016162,76 €Difference
163 €212,08 €49,32 €2015per year212,08 €Annualised investment 2
163 €212,08 €49,32 €2014per year49,32 €Annualised investment 1
163 €212,08 €49,32 €2013years2Lifetime 2
163 €212,08 €49,32 €2012years10Lifetime 1
163 €212,08 €49,32 €2011400,00 €Investment 2
163 €212,08 €49,32 €2010400,00 €Investment 1
difference2104 %Discount rate
YearsYearsInvestment costs
Check investmentSensitivity analysis
Example

http://echa.europa.eu
Summary
Scenario 2
Scenario
1 w/ sunk costs
w/o sunk costs
Annual cost in 2020 Minimum estimate (25% lower energy costs) €18.32 €9.06 €3.08
Central estimate €24.32 €9.06 €3.08 Maximum estimate (25% higher energy costs) €30.32 €9.06 €3.08
Cumulative cost in 2010-24 (Present Value)
Minimum estimate (25% lower energy costs) €132.02 €65.29 €22.21
Central estimate €175.26 €65.29 €22.21 Maximum estimate (25% higher energy costs) €218.50 €65.29 €22.21

http://echa.europa.eu
4. Conclusions
• Uncertainty (energy-efficiency) affects only Scenario 1 (costing €24.32 per year in 2020)
• Scenario 2 (import coated wire) likely– €9.06 (with sunk costs) or €3.08 (without sunk
costs) per annum in 2020– Scenario 2 relocates costs and risks

http://echa.europa.eu
5. Discussion• Is additional info (including the example) on how to
calculate costs needed?– Is the ”pitch” right?
• Difficult issues– Sunk costs (include or exclude?)– Direct vs. indirect costs
• Any split is artificial as this depends on the point of view– Work with stock (PV/cumulative) or flow (annualised
costs/representative year)• Annualised a bit easier and much more intuitive• Benefits are not (usually) discounted• Clear preference for flow
– Timing of entry into force of the scenario • does not affect steady state (i.e. annualised cost) if sunk
costs are not included• does affect PV


![Welcome [edwinlondono.com]edwinlondono.com/phoenixcontact/marking/01 CLIP PROJECT_EN.pdf · Illustrative cost calculation 0,40 € Price for terminal block 1,30 € Engineering costs](https://static.fdocuments.in/doc/165x107/5b6dffa67f8b9a0b558db275/welcome-clip-projectenpdf-illustrative-cost-calculation-040-price.jpg)


![Calculation of cost-optimal levels of the minimum energy ......Calculation of the global cost expressed in net present value [2]. The global costs in this study of cost-optimal levels](https://static.fdocuments.in/doc/165x107/60401058dc6996594b11f8ee/calculation-of-cost-optimal-levels-of-the-minimum-energy-calculation-of.jpg)
