STANBIC IBTC HOLDINGS PLC - thevault.exchange
50
[ADD PRESENTATION TITLE IN SLIDE MASTER MODE] / PAGE 1 STANBIC IBTC HOLDINGS PLC PRESENTATION / PAGE 1 / STANBIC IBTC HOLDINGS PLC HALF YEAR 2021 FINANCIAL RESULTS PRESENTATION September 2021
Transcript of STANBIC IBTC HOLDINGS PLC - thevault.exchange
[ADD PRESENTATION TITLE IN SLIDE MASTER MODE] / PAGE 1
STANBIC IBTC HOLDINGS PLC PRESENTATION / PAGE 1 /
STANBIC IBTC HOLDINGS PLCHALF YEAR 2021 FINANCIAL RESULTS PRESENTATION
September 2021

[ADD PRESENTATION TITLE IN SLIDE MASTER MODE] / PAGE 2
STANBIC IBTC HOLDINGS PLC PRESENTATION / PAGE 2 /
Financial review – H1 2021
Page 3Background and the operating environment
Business Transformation
Guidance
1
2
4
Page 37
Page 39
3
TABLE OF CONTENT
Page 29
Wealth
Page 32Personal and Business Banking
Page 26
Corporate and Investment Banking
5
7
6
Page 11
Appendix Page 438

[ADD PRESENTATION TITLE IN SLIDE MASTER MODE] / PAGE 3
STANBIC IBTC HOLDINGS PLC PRESENTATION / PAGE 3 /
BACKGROUND AND THE OPERATING ENVIRONMENT

[ADD PRESENTATION TITLE IN SLIDE MASTER MODE] / PAGE 4
STANBIC IBTC HOLDINGS PLC PRESENTATION / PAGE 4 /
STRATEGIC FOCUS
Committed to solutions that drive your progress.Missionthe reason we exist
Visionwhat we aspire to be
To be the leading end-to-end financial solutions provider in Nigeria through innovative and customer focused people.
Transform client experience
Execute with excellence
Drive sustainable growth and value
Our strategic priorities:
What we need to do to deliver our purpose
Strategic Intent: To be within the top 5 in market share, ROE and service across our lines of business –Consumer & HNW, Business & Commercial and Wholesale clients – by 2025.
[ADD PRESENTATION TITLE IN SLIDE MASTER MODE] / PAGE 5
STANBIC IBTC HOLDINGS PLC PRESENTATION / PAGE 5 /
Inflation %
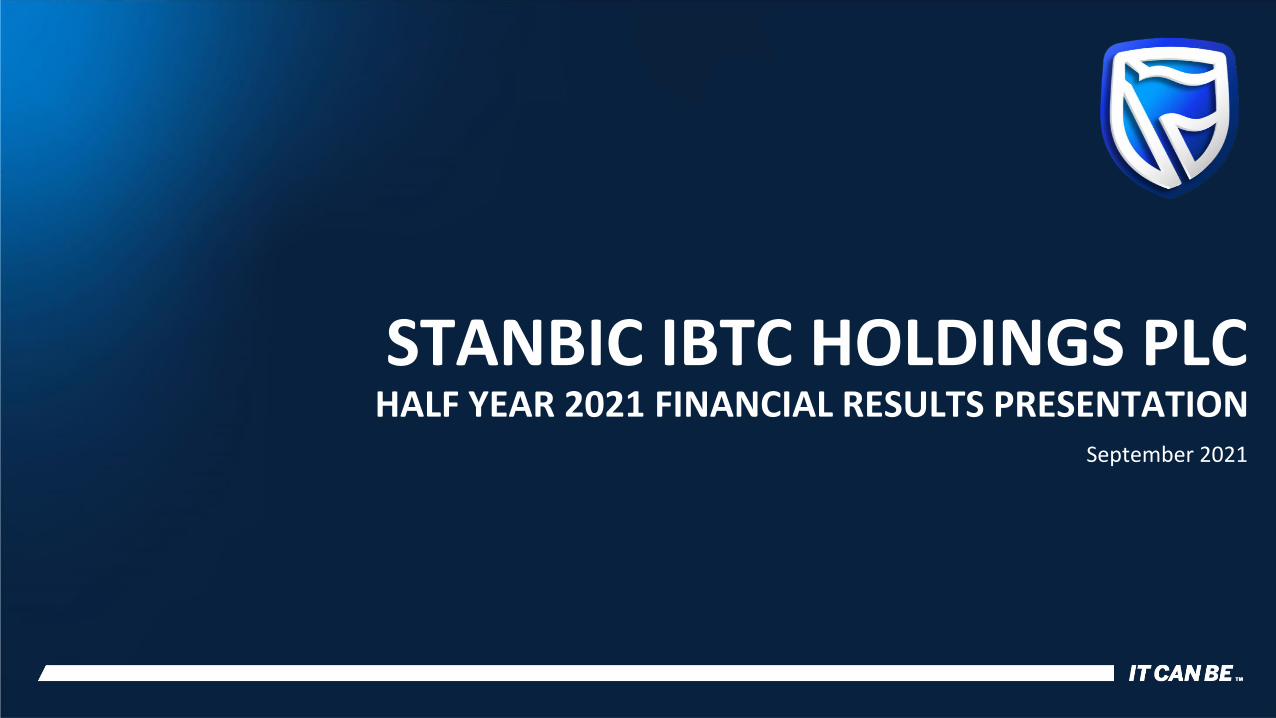
Real GDP %❖ The Nigerian economy grew by 5.01% year-on-year (YoY) inQ2 2021, which is a third consecutive quarter of growth,after having exited recession in Q4 2020 with the growth of0.11% YoY. This growth was mainly driven by the growth inTrade, ICT, Agriculture, and Manufacturing sectors, amongothers. Economic activity had improved after the easing ofpublic health restrictions, spurring increased demand forservices such as outdoor dining and domestic travel.
❖ Interest rates have been increasing steadily since the end ofNovember 2020, increasing by over 8% from a bottom of0.15%.
❖ The steady liquidity tightening by the CBN in a bid to reducedollar demand has kept naira liquidity and the interbank ratetight. This has driven fixed deposit and interbank rates higher.
❖ Headline inflation rose from 16.5% year-on-year (YoY) inJanuary 2021 to 18.2% YoY in March 2021 but saw a gradualmoderation in Q2 2021, taking it to 17.4% YoY in July 2021.The moderation is mainly attributed to the high base effectfrom 2020.
MACRO-ECONOMIC AND OPERATING ENVIRONMENT
-6.10
-3.62
0.110.51
5.01
-8
-6
-4
-2
0
2
4
6
Q2 2020 Q3 2020 Q4 2020 Q1 2021 Q2 2022
12.56 12.8213.22
13.7114.23
14.89
15.7516.47
17.3318.17 18.12 17.93 17.75
17.38
10
11
12
13
14
15
16
17
18
19

[ADD PRESENTATION TITLE IN SLIDE MASTER MODE] / PAGE 6
STANBIC IBTC HOLDINGS PLC PRESENTATION / PAGE 6 /
MACRO-ECONOMIC AND OPERATING ENVIRONMENT (Cont’d)
❖ Oil prices have followed an increasing trend, currentlyabove $70 per barrel, driven by demand recovery andsupply curbs by OPEC+.
❖ The country’s foreign exchange (FX) reserves declinedfrom $36.3 billion as of 31 January 2021 to $33.3 billionin June 2021. This was attributed to the payment forforeign debt obligations that matured during theperiod. FX reserves have however gained 2% since thento close at $34.0 billion as of 31 August 2021.
❖ While the CBN resumed FX sales to foreign portfolioinvestors in late April 2021, we saw the average dailyturnover in the IEFX window in June 2021 increase to$143.3 million, compared to an average of $60 millionrecorded from January till April 2021. The IEFX dailyturnover averaged $129.6 million in August 2021.
❖ In May 2021, CBN adjusted the official exchange rate toalign with the exchange rate at the Investors’ andExporters’ window, from ₦380/$1 at the beginning ofthe year to the current ₦410/$1.
Brent crude oil price and reserves
Exchange rate movement
36.2 35.9 35.7 35.7 35.7 35.4 35.4 36.3 35.1 34.8 34.9 34.2 33.3 33.4 34.0
41.2 43.3 45.341.0
37.5
47.651.8
55.9
66.163.5
66.769.3
74.9 76.373.0
-
10
20
30
40
50
60
70
80
Jun-20 Jul-20 Aug-20 Sep-20 Oct-20 Nov-20 Dec-20 Jan-21 Feb-21 Mar-21 Apr-21 May-21 Jun-21 Jul-21 Aug-21
Reserves (US$ billions) Brent Crude oil (US$).Month end price
250
300
350
400
450
500
550
Jun-20 Jul-20 Aug-20 Sep-20 Oct-20 Nov-20 Dec-20 Jan-21 Feb-21 Mar-21 Apr-21 May-21 Jun-21 Jul-21 Aug-21
NG
N /
USD
rat
e
CBN Official Parallel market NAFEX I&E FX Window

[ADD PRESENTATION TITLE IN SLIDE MASTER MODE] / PAGE 7
STANBIC IBTC HOLDINGS PLC PRESENTATION / PAGE 7 /
❖ The Coronavirus has infected 195,890 people andcaused 2,556 deaths in Nigeria as of 6 September 2021while 184,882 cases have been discharged. We haveseen a surge in the daily new infections in the countrysince July 2021, following the detection of the SARS-CoV-2 Delta variant in the country.
❖ Consequently, the Government placed six statesincluding Lagos, Oyo, Rivers, Kaduna, Kano, Plateauand the Federal Capital Territory (Abuja), on red alertas part of preventive measures against the pandemic.
❖ As a responsible institution, we continue to observethe necessary safety protocols to ensure the protectionof our employees, clients and the society at large.
❖ Nigeria officially ended its first phase of the COVID-19vaccination early July 2021 as the country hadexpended its available vaccine doses. A number of ouremployees voluntarily participated in the vaccinationexercise.
❖ The second phase of the vaccination commenced on 16August 2021. This phase would capture older adultsaged 50 years and above and those with comorbiditiesaged between 18 and 49 years of age.
Map shows the total confirmed cases by States as of 6 September 2021
COVID-19 UPDATEREPORTED CASES AND VACCINATION UPDATE
Cross River
516
Akwa Ibom
4,153
FCT
20,710
Lagos
74,044Ebonyi
2,048
Abia
1,736
Anambra
2,043
Kebbi
458
Kwara
3,653
Ondo
4,148
Yobe
501Kano
4,102Bauchi
1,568
Active cases4%
Discharged cases95%
Deaths1%
[ADD PRESENTATION TITLE IN SLIDE MASTER MODE] / PAGE 8
STANBIC IBTC HOLDINGS PLC PRESENTATION / PAGE 8 /
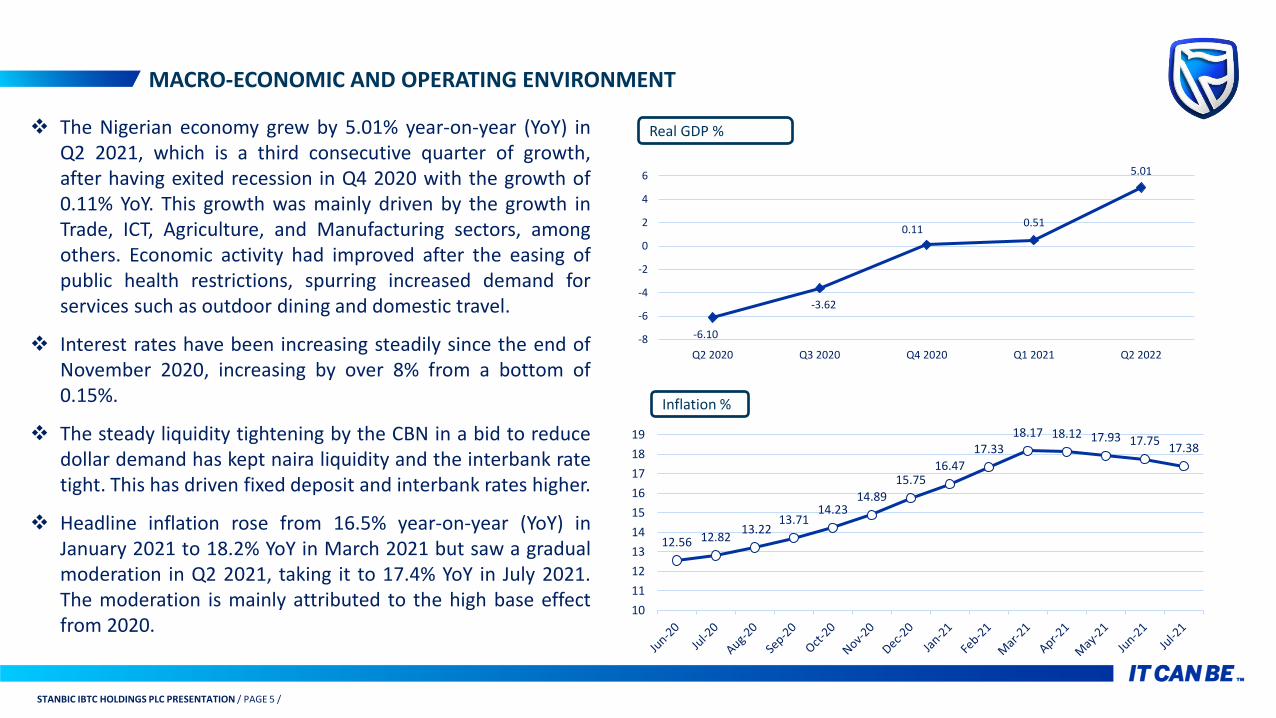
COVID-19 UPDATECLIENT FOCUS: ACTIONS TAKEN
❖ Granted loan moratorium andextension to customersranging from schools to smallscale businesses and fewcorporates.
❖ Total outstanding value ofloans restructured as a resultof COVID-19 amounted to₦6.97 billion in H1 2021 (FY2020: ₦50.97 billion).
Restructured Loans Trade Tenor Extension
❖ Extension of the repaymentperiod of trade obligationsdue to FX constraints andincreased receivablesperiod.
❖ Affected trade obligationsamounted to ₦3.2 billionas at H1 2021 (FY 2020:₦1.2 billion)
Intervention Facilities
❖ Extended moratorium andreduced interest rate by 400basis points on the on-lending funds in line with theCBN directive.
❖ Total value of theintervention facilities was₦31 billion as of H1 2021 (FY2020: ₦26 billion) with netinterest income impact of₦665 million.
At Stanbic IBTC, we reviewed our business continuity plan and activated our level three plans which took effect on 06 August 2021

[ADD PRESENTATION TITLE IN SLIDE MASTER MODE] / PAGE 9
STANBIC IBTC HOLDINGS PLC PRESENTATION / PAGE 9 /
INVESTING IN OUR COMMUNITY, FRANCHISE AND CAPABILITIES
Agents recruited for our Agency Banking.
1,478Wallets
1.26mn N1.28bnCSI & donations
ACQUIRING CLIENTS THROUGH CLIENT ECOSYSTEMS
Customer growth YTD%
EmployeesClients
Client
4%2%1.82mn RSA 2.49mn Banking
customers
Digital onboarding
DELIVERING ENHANCED EXPERIENCE
Total amount paid to Retirees in H1 2021
N72.7bn Loans disbursed via EZ Cash to over 130,000 customers
N40bnDividend paid to shareholders for FY 2020 which symbolize wealth creation and cash returns to shareholders
N44.4bn
Dividend
Digital
Face-to-Face
98%transaction volumes
through digital channels
26%
12%
Retiree Benefits
KEY HIGHLIGHTS
55%Payout ratio
[ADD PRESENTATION TITLE IN SLIDE MASTER MODE] / PAGE 10
STANBIC IBTC HOLDINGS PLC PRESENTATION / PAGE 10 /
HIGHLIGHTS
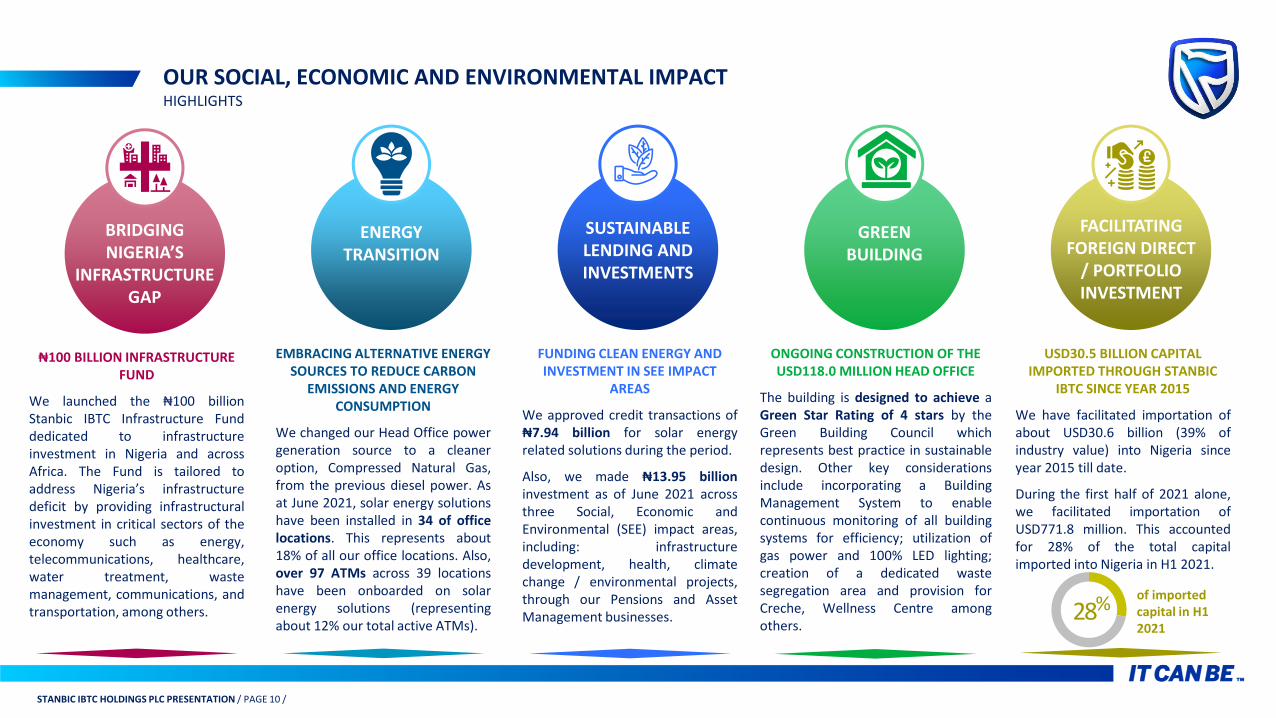
OUR SOCIAL, ECONOMIC AND ENVIRONMENTAL IMPACT
BRIDGING NIGERIA’S
INFRASTRUCTURE GAP
₦100 BILLION INFRASTRUCTURE FUND
We launched the ₦100 billionStanbic IBTC Infrastructure Funddedicated to infrastructureinvestment in Nigeria and acrossAfrica. The Fund is tailored toaddress Nigeria’s infrastructuredeficit by providing infrastructuralinvestment in critical sectors of theeconomy such as energy,telecommunications, healthcare,water treatment, wastemanagement, communications, andtransportation, among others.
ENERGY TRANSITION
EMBRACING ALTERNATIVE ENERGY SOURCES TO REDUCE CARBON
EMISSIONS AND ENERGY CONSUMPTION
We changed our Head Office powergeneration source to a cleaneroption, Compressed Natural Gas,from the previous diesel power. Asat June 2021, solar energy solutionshave been installed in 34 of officelocations. This represents about18% of all our office locations. Also,over 97 ATMs across 39 locationshave been onboarded on solarenergy solutions (representingabout 12% our total active ATMs).
SUSTAINABLE LENDING AND INVESTMENTS
FUNDING CLEAN ENERGY AND INVESTMENT IN SEE IMPACT
AREAS
We approved credit transactions of₦7.94 billion for solar energyrelated solutions during the period.
Also, we made ₦13.95 billioninvestment as of June 2021 acrossthree Social, Economic andEnvironmental (SEE) impact areas,including: infrastructuredevelopment, health, climatechange / environmental projects,through our Pensions and AssetManagement businesses.
GREEN BUILDING
ONGOING CONSTRUCTION OF THE USD118.0 MILLION HEAD OFFICE
The building is designed to achieve aGreen Star Rating of 4 stars by theGreen Building Council whichrepresents best practice in sustainabledesign. Other key considerationsinclude incorporating a BuildingManagement System to enablecontinuous monitoring of all buildingsystems for efficiency; utilization ofgas power and 100% LED lighting;creation of a dedicated wastesegregation area and provision forCreche, Wellness Centre amongothers.
FACILITATING FOREIGN DIRECT
/ PORTFOLIO INVESTMENT
USD30.5 BILLION CAPITAL IMPORTED THROUGH STANBIC
IBTC SINCE YEAR 2015
We have facilitated importation ofabout USD30.6 billion (39% ofindustry value) into Nigeria sinceyear 2015 till date.
During the first half of 2021 alone,we facilitated importation ofUSD771.8 million. This accountedfor 28% of the total capitalimported into Nigeria in H1 2021.
28%of imported capital in H1 2021

[ADD PRESENTATION TITLE IN SLIDE MASTER MODE] / PAGE 11
STANBIC IBTC HOLDINGS PLC PRESENTATION / PAGE 11 /
FINANCIAL REVIEW H1 2021

[ADD PRESENTATION TITLE IN SLIDE MASTER MODE] / PAGE 12
STANBIC IBTC HOLDINGS PLC PRESENTATION / PAGE 12 /
RETURN ON ASSETS GROSS NPL RATIO CASA RATIO
TOTAL ASSETS
2%
H1 21: N2.43trnFY 20: N2.49trn
CUSTOMER DEPOSITS
17%
H1 21: N958.4bnFY 20: N819.9bn
NET LOANS AND ADVANCES
22%
H1 21: N759.6bnFY 20: N625.1bn
4.0%
3.2%
FY 20
H1 21
82.8%
73.4%
FY 20
H1 21
SUMMARY OF H1 2021 PERFORMANCE – FINANCIAL POSITION ITEMS
3.8%
1.8%
FY 20
H1 21

[ADD PRESENTATION TITLE IN SLIDE MASTER MODE] / PAGE 13
STANBIC IBTC HOLDINGS PLC PRESENTATION / PAGE 13 /
28.3%
12.1%
H1 20
H1 21
RETURN ON EQUITY CREDIT LOSS RATIO COST-TO-INCOME RATIO
GROSS EARNINGS
26%
H1 21: N93.6bnH1 20: N126.6bn
EARNINGS PER SHARE
54%
H1 21: 192koboH1 20: 419kobo
PROFIT AFTER TAX
50%
H1 21: N22.5bnH1 20: N45.2bn
2.2%
(0.1%)
H1 20
H1 21
45.2%
70.3%
H1 20
H1 21
SUMMARY OF H1 2021 PERFORMANCE – INCOME STATEMENT

[ADD PRESENTATION TITLE IN SLIDE MASTER MODE] / PAGE 14
STANBIC IBTC HOLDINGS PLC PRESENTATION / PAGE 14 /
OVERVIEW OF INCOME STATEMENT FOR H1 2021 VS H1 2020
55,130
(17,581)
69,796
(6,404)
(48,535)
52,406(7,202) 45,204
Interest income Interest expense Non-interest revenue Credit impairmentcharges
Operating expenses Profit before taxation Taxes Profit after taxation
H1 2021
H1 2020
44,229
(11,350)
45,909
1,284
(55,365)
24,707
(2,164)
22,543
Interest income Interest expense Non-interest revenue Credit impairmentcharges
Operating expenses Profit before taxation Taxes Profit after taxation
Nmillion

[ADD PRESENTATION TITLE IN SLIDE MASTER MODE] / PAGE 15
STANBIC IBTC HOLDINGS PLC PRESENTATION / PAGE 15 /
NET INTEREST INCOME❖ Interest income declined by 20% to ₦44.2 billion in H1 2021 from ₦55.1 billion
achieved in H1 2020 largely due to the reduction in interest earned on investmentsecurities as the bulk of higher yielding securities matured in December 2020.The reduction in interest income was partly cushioned by the increase in interestearned on loans following growth in customer loans.
❖ Interest expense also declined by 35%, benefiting from the growth in cheapdeposits and deposits repricing done during the period to manage cost of funds,leading to the moderation in cost of funds to 1.5% from 2.8% in H1 2020.
❖ Consequently, net interest income contracted by 12%, resulting in the decline innet interest margin* to 2.7% (H1 2020: 3.2%).
N 'billion
N 'billion
%
41.0 40.2 39.3 37.5 32.9
7.2%
5.9%4.9%
3.2% 2.7%4.8%
6.8%
5.0%
2.6% 2.8%
0.0%
2.0%
4.0%
6.0%
8.0%
-
10.0
20.0
30.0
40.0
50.0
H1 2017 H1 2018 H1 2019 H1 2020 H1 2021
Net interest incomeNet interest margin before impairment chargesNet interest margin after impairment charges
N ‘billion
16.9 16.0
12.6 11.2
6.0
4.1 4.2 4.1 2.8
1.5
7.2 5.9
4.9 3.2
2.7
0
2
4
6
8
10
12
14
16
18
H1 2017 H1 2018 H1 2019 H1 2020 H1 2021
Asset yield Cost of funds Net interest margin
56.7 59.9 60.8 55.1 44.2
-
50.0
100.0
H1 2017 H1 2018 H1 2019 H1 2020 H1 2021
Interest based revenue
15.7 19.8 21.5
17.6 11.4
-
10.0
20.0
30.0
H1 2017 H1 2018 H1 2019 H1 2020 H1 2021
Interest expense
*Net interest margin = Total assets excluding derivative assets
Net interest income
[ADD PRESENTATION TITLE IN SLIDE MASTER MODE] / PAGE 16
STANBIC IBTC HOLDINGS PLC PRESENTATION / PAGE 16 /
NON-INTEREST REVENUE (NIR)
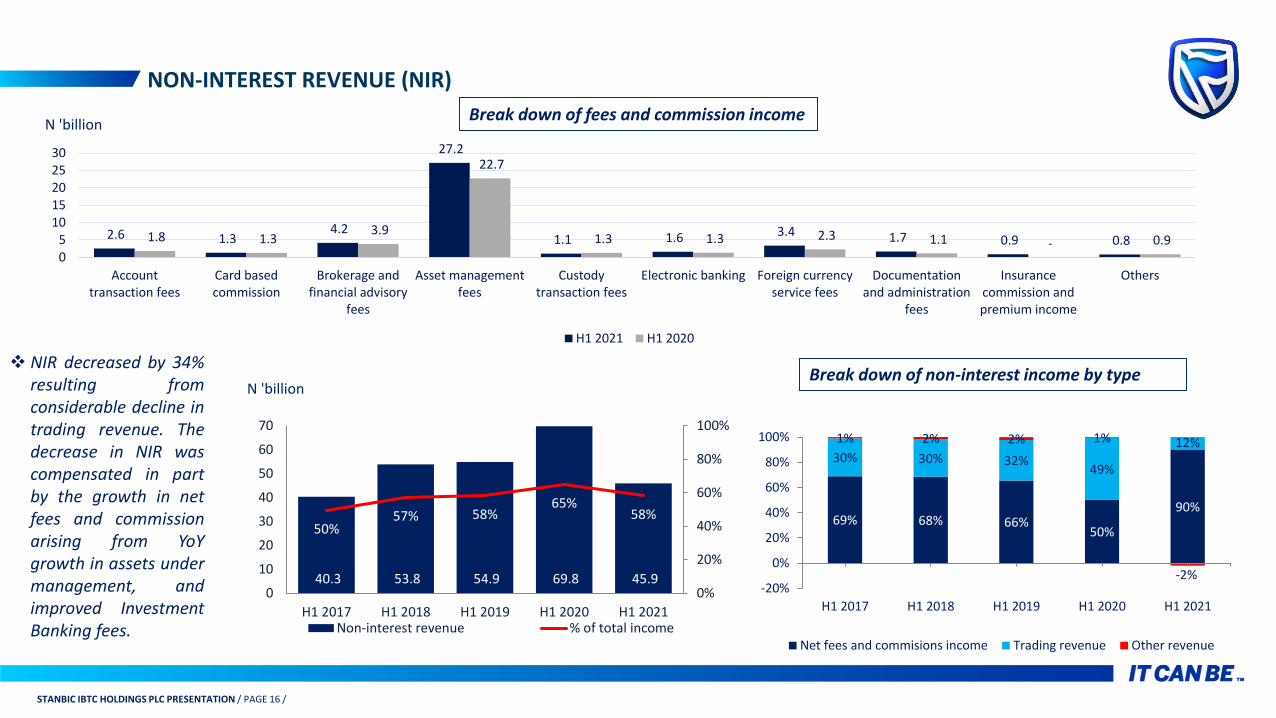
❖ NIR decreased by 34%resulting fromconsiderable decline intrading revenue. Thedecrease in NIR wascompensated in partby the growth in netfees and commissionarising from YoYgrowth in assets undermanagement, andimproved InvestmentBanking fees.
Break down of fees and commission income
Break down of non-interest income by typeN 'billion
N 'billion
2.6 1.3 4.2
27.2
1.1 1.6 3.4 1.7 0.9 0.8 1.8 1.3 3.9
22.7
1.3 1.3 2.3 1.1 - 0.9 05
1015202530
Accounttransaction fees
Card basedcommission
Brokerage andfinancial advisory
fees
Asset managementfees
Custodytransaction fees
Electronic banking Foreign currencyservice fees
Documentationand administration
fees
Insurancecommission andpremium income
Others
H1 2021 H1 2020
69% 68% 66%50%
90%
30% 30% 32%49%
12%1% 2% 2% 1%
-2%-20%
0%
20%
40%
60%
80%
100%
H1 2017 H1 2018 H1 2019 H1 2020 H1 2021
Net fees and commisions income Trading revenue Other revenue
40.3 53.8 54.9 69.8 45.9
50%57% 58%
65%58%
0%
20%
40%
60%
80%
100%
0
10
20
30
40
50
60
70
H1 2017 H1 2018 H1 2019 H1 2020 H1 2021Non-interest revenue % of total income

[ADD PRESENTATION TITLE IN SLIDE MASTER MODE] / PAGE 17
STANBIC IBTC HOLDINGS PLC PRESENTATION / PAGE 17 /
INCOME STATEMENT - CREDIT IMPAIRMENT
CLR 2.2% (0.1%)
N ‘millionN ‘million
❖Credit impairment onfinancial assets was apositive outcome of₦1.3bn compared to acharge of ₦6.4bn in H12020.
❖The write-back resultedfrom recoveries onpreviously written-offloans. This moderated theimpact of expected creditloss recognized on newloans booked during theperiod.
❖Credit loss ratio was(0.1%) for H1 2021.
H1 2020
H1 2021
N ‘million
6,404
(1,284)
H1 2020 H1 2021
660 (498)123 1,452
(3,021) (1,284)
-2 000
-1 000
0
1 000
2 000
Stage 1 -Customer
loan &advances
Stage 1 -Others
Stage 2 Stage 3 Recoveries H1 2021
1,623
251
(3,210)
9,362
(2,958)
6,404
-3 000 0
3 0006 0009 000
12 000
Stage 1 -Customer
loan &advances
Stage 1 -Others
Stage 2 Stage 3 Recoveries H1 2021

[ADD PRESENTATION TITLE IN SLIDE MASTER MODE] / PAGE 18
STANBIC IBTC HOLDINGS PLC PRESENTATION / PAGE 18 /
OPERATING EXPENSES AND TAXATION
❖Operating expenses increased by 14% year-on-year.
❖Staff cost increased by 1% year-on-year due to theinflation adjusted salary increase.
❖The increase in other operating costs arose largelyfrom regulatory induced costs including AMCONand deposit insurance premium. Also, the impact ofcurrency depreciation and the resumption ofbusiness activities led to increased informationtechnology, premises and maintenance costs.
❖Cost savings were recorded from energy efficiencyinitiatives and new way of working.
❖Therefore, the cost-to-income ratio deteriorated to70.3% from 45.2% recorded in H1 2020.
❖Effective tax rate decreased to 8.8% from 13.7% inH1 2020 due to the reversal of excess tax provision.
38,202 48,775 50,069 48,535 55,365
47.0%
51.9%53.2%
45.2%
70.3%
0%
20%
40%
60%
80%
100%
-
10,000
20,000
30,000
40,000
50,000
60,000
H1 2017 H1 2018 H1 2019 H1 2020 H1 2021
Operating expenses (N'm) Cost-to-income ratio
Nmillion
5,057 7,646 8,405 7,202 2,164
17.3%15.1%
18.8%
13.7% 8.8%
0%
5%
10%
15%
20%
-
2,000
4,000
6,000
8,000
10,000
H1 2017 H1 2018 H1 2019 H1 2020 H1 2021
Taxation Effective tax rate
Nmillion

[ADD PRESENTATION TITLE IN SLIDE MASTER MODE] / PAGE 19
STANBIC IBTC HOLDINGS PLC PRESENTATION / PAGE 19 /
TOTAL ASSETS
N 'billion
N ‘million
2,427,364
529,623 144,063 152,101
650,958
759,595 152,73138,293
Total Assets Cash and loans tobank
Trading andderivative assets
Pledged assets Financialinvestments
Loans and advancesto customers
Other assets Intangible assets,property andequipment
1,619.3 1,876.5 3,022.3 2,486.3 2,427.4
4.5% 4.2%3.7%
3.8%
1.8%
0.0%
1.0%
2.0%
3.0%
4.0%
5.0%
0
500
1,000
1,500
2,000
2,500
3,000
3,500
H1 2019 FY 2019 H1 2020 FY 2020 H1 2021
Total Asset Return on assets
28% 24%37%
26% 22%
15%14%
10%
9%7%
4% 13%16%
7%5%
17% 8%
8%
25%27%
28% 28%19% 25% 31%
6% 10% 8% 8% 6%2% 2% 1% 1% 1%
H1 2019 FY 2019 H1 2020 FY 2020 H1 2021
Cash & loans to banks Pledged & derivative assets
Trading assets Financial investments
Loans & advances to customers Other assets
Intangible assets, property & equipment
[ADD PRESENTATION TITLE IN SLIDE MASTER MODE] / PAGE 20
STANBIC IBTC HOLDINGS PLC PRESENTATION / PAGE 20 /
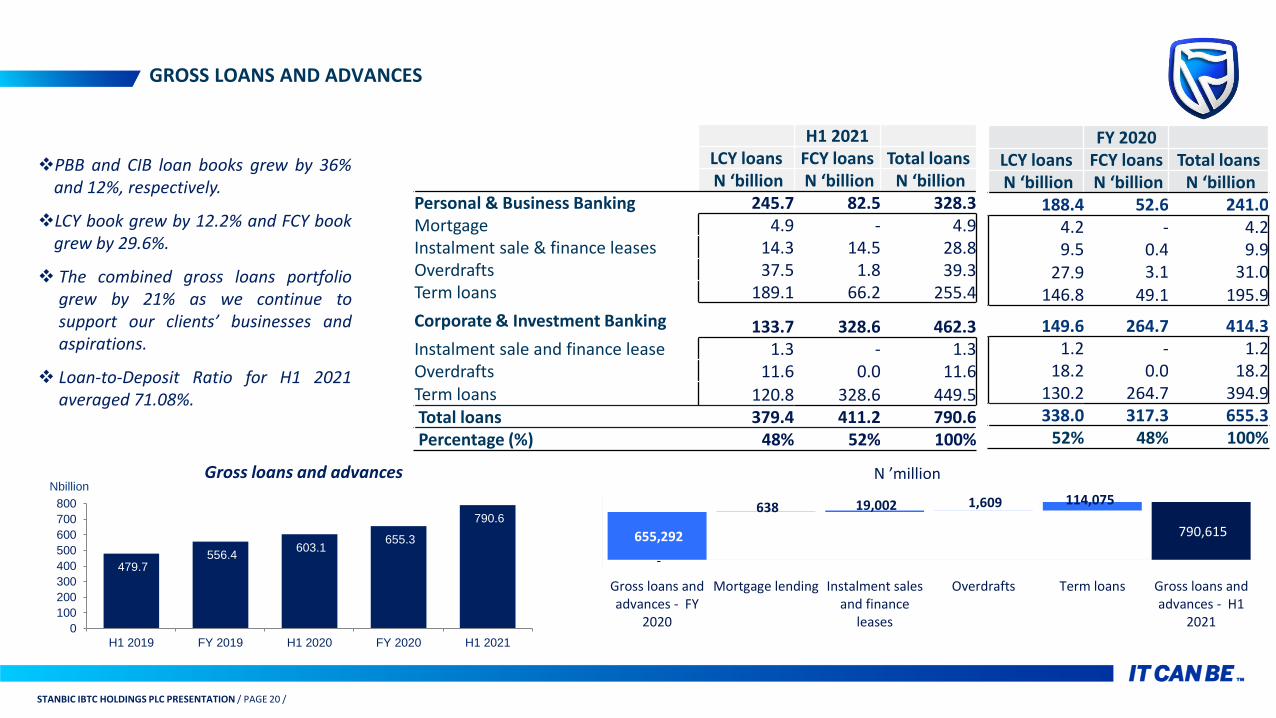
GROSS LOANS AND ADVANCES
H1 2021LCY loans FCY loans Total loans N ‘billion N ‘billion N ‘billion
Personal & Business Banking 245.7 82.5 328.3 Mortgage 4.9 - 4.9 Instalment sale & finance leases 14.3 14.5 28.8 Overdrafts 37.5 1.8 39.3 Term loans 189.1 66.2 255.4
Corporate & Investment Banking 133.7 328.6 462.3 Instalment sale and finance lease 1.3 - 1.3Overdrafts 11.6 0.0 11.6 Term loans 120.8 328.6 449.5 Total loans 379.4 411.2 790.6 Percentage (%) 48% 52% 100%
FY 2020LCY loans FCY loans Total loans N ‘billion N ‘billion N ‘billion
188.4 52.6 241.0 4.2 - 4.2 9.5 0.4 9.9
27.9 3.1 31.0 146.8 49.1 195.9
149.6 264.7 414.3 1.2 - 1.2
18.2 0.0 18.2 130.2 264.7 394.9 338.0 317.3 655.3
52% 48% 100%
❖PBB and CIB loan books grew by 36%and 12%, respectively.
❖LCY book grew by 12.2% and FCY bookgrew by 29.6%.
❖ The combined gross loans portfoliogrew by 21% as we continue tosupport our clients’ businesses andaspirations.
❖ Loan-to-Deposit Ratio for H1 2021averaged 71.08%.
Gross loans and advances N ’million
479.7 556.4
603.1 655.3
790.6
0
100
200
300
400
500
600
700
800
H1 2019 FY 2019 H1 2020 FY 2020 H1 2021
Nbillion
-
790,615 655,292
638 19,002 1,609 114,075
Gross loans andadvances - FY
2020
Mortgage lending Instalment salesand finance
leases
Overdrafts Term loans Gross loans andadvances - H1
2021

[ADD PRESENTATION TITLE IN SLIDE MASTER MODE] / PAGE 21
STANBIC IBTC HOLDINGS PLC PRESENTATION / PAGE 21 /
LOAN GROWTH WITH FOCUS ON RESILIENT NON-CYCLICAL SECTORS
LOANS AND ADVANCES BY SECTOR
H1 2021 FY 2020
Agriculture5% Construction and
real estate9%
Consumer loans9% Electricity, Gas &
Water Supply 0.23%
Financial intermedi
aries & insurance
5%
General commerce
10%
Government6%
Manufacturing26%
Oil & gas services
4%
Downstream oil & gas11%
Upstream oil & gas11%
Transportation & communication
4%
Agriculture4%
Construction and real estate
8%
Consumer loans9%
Electricity, Gas & Water Supply
0.4%
Financial intermediaries &
insurance4%
General commerce10%
Government8%
Manufacturing27%
Oil & gas services
5%
Downstream oil & gas10%
Upstream oil & gas11%
Transportation & communication
4%

[ADD PRESENTATION TITLE IN SLIDE MASTER MODE] / PAGE 22
STANBIC IBTC HOLDINGS PLC PRESENTATION / PAGE 22 /
LOAN PERFORMANCE
H1 2021 FY 2020
Sector% of Total
NPL NPL ratio
(%)% of Total
NPL NPL ratio (%)
Agriculture 16.8% 12.6% 20.4% 15.4%
Construction and real estate 35.4% 14.4% 33.5% 15.4%
Consumer credit 8.4% 2.9% 9.1% 4.1%
General commerce 3.8% 1.2% 4.1% 1.6%
Manufacturing 2.1% 0.3% 2.3% 0.4%
Oil & gas services 4.0% 2.8% 3.5% 3.4%
Oil & gas Downstream 24.6% 7.7% 22.0% 8.1%
Transportation & Communication
4.9% 3.9% 5.1% 4.9%
Grand Total 100% 3.2% 100% 4.0%
H1 2021(₦ ‘million)
% of total NPLs
FY 2020(₦ ‘million)
% of total NPLs
Local currency 20,369 80% 19,579 74%
Foreign currency 5,102 20% 6,914 26%
Total NPLs 25,471 100% 26,492 100%
SectorCovid-19 Related
(₦ ’million)
Non Covid-19 Related
(₦ ’million)Total
(₦’ million)Restructured to Total Loan
Agriculture - 34 34 0.1%
Construction & Real Estate 598 384 982 1.6%
Consumer Loans 1,230 553 1,784 2.4%
General Commerce - 386 386 0.5%
Government - - - -
Manufacturing 4,401 1,423 5,824 2.8%
Oil & Gas Service 737 5,884 6,621 17.8%
Oil & Gas Downstream - 367 367 0.4%
Transport & Communication - 1,060 1,060 3.3%
Grand Total 6,967 10,092 17,059 2.2%
FY 2020 50,972 11,685 62,658 9.6%
Non-Performing Loans Restructured Loans as at H1 2021
18.8 21.6 29.5 26.5 25.5
3.9% 3.9%4.9%
4.0%3.2%
0.0%
2.0%
4.0%
6.0%
8.0%
10.0%
0
10
20
30
H1 2019 FY 2019 H1 2020 FY 2020 H1 2021
Gross non-performing loans NPL/ total loans
N ‘billion

[ADD PRESENTATION TITLE IN SLIDE MASTER MODE] / PAGE 23
STANBIC IBTC HOLDINGS PLC PRESENTATION / PAGE 23 /
SECTORIAL STAGES OF THE GROSS LOAN BOOK AND PROVISION COVERAGE RATIO
GROSS LOAN STAGES
Sectors
Performing Loans Non-Performing Loans
Stage 1 Stage 2 Stage 3 Gross Loan₦’ million
Provision coverage
Gross Loan₦’ million
Provision coverage
Gross Loan₦’ million
Provision coverage
Agriculture 21,006 1.50% 8,701 6.50% 4,290 86.17%
Construction & Real Estate 53,271 1.54% 143 22.03% 9,004 79.92%
Consumer Credit 69,239 1.03% 2,693 9.34% 2,149 73.35%
Electricity, Gas & Water Supply 3,553 0.44% - - - -
Financial Intermediaries & Insurance 29,029 0.51% - - - -
General Commerce 76,076 1.53% 1,766 10.83% 957 76.95%
Government 65,817 0.98% - - - -
Manufacturing 200,071 0.56% 9,437 6.23% 535 78.56%
Oil & Gas Service 35,376 1.74% 834 10.11% 1,026 94.02%
Oil & Gas Downstream 73,357 0.69% 1,575 9.61% 6,273 99.43%
Oil & Gas Upstream 82,649 1.07% - - - -
Transport & Communication 30,523 0.48% 28 22.03% 1,233 97.20%
Grand Total 739,966 0.96% 25,178 7.42% 25,471 86.56%

[ADD PRESENTATION TITLE IN SLIDE MASTER MODE] / PAGE 24
STANBIC IBTC HOLDINGS PLC PRESENTATION / PAGE 24 /
CUSTOMER DEPOSITS
FY 2020
LCY FCY TotalN ’billion N ‘billion N ‘billion
408.5 161.5 570.1 217.3 136.5 353.8
150.6 - 150.6
16.9 0.8 17.6
23.8 24.2 48.0
167.7 82.2 249.9105.5 69.0 174.5
23.5 1,7 25.138.7 11.6 50.3
576.2 243.7 819.9
70% 30% 100%
❖ Customer deposits increased by17% in H1 2021 from the FY2020 position, driven byincreases across the depositclasses.
❖ Thus, the CASA ratio contractedfrom 82.8% in FY 2020 to 73.4%in H1 2021 due to slowergrowth pace in low-costdeposits as compared to otherdeposit classes.
H1 2021LCY FCY Total
N ’billion N ’billion N ’billion Personal & Business Banking 424.2 191.6 615.9
Current Accounts 234.3 166.5 400.8 Savings Accounts 153.3 - 153.3 Call Deposits 12.1 0.6 12.7
Term Deposits 24.5 24.5 49.0
Corporate & Investment Banking 231.1 111.4 342.5 Current accounts 52.0 97.1 149.1 Call deposits 59.2 1.1 60.2 Term deposits 120.0 13.2 133.2
Total deposits 655.4 303.0 958.4 68% 32% 100%
N ’million
-
819,944 841,574 871,752 874,449 958,370 819,944
21,630 30,178 2,697
Customerdeposits FY
2020
Currentaccounts
Call deposits Savingsaccounts
Term deposits Customerdeposits H1
2021
693.5 637.8 769.3 819.9 958.4
68.9%71.1%
80.4% 82.8%73.4%
0%
20%
40%
60%
80%
100%
0
200
400
600
800
1,000
H1 2019 FY 2019 H1 2020 FY 2020 H1 2021
Customer deposits CASA mix
Nbillion
83,921

[ADD PRESENTATION TITLE IN SLIDE MASTER MODE] / PAGE 25
STANBIC IBTC HOLDINGS PLC PRESENTATION / PAGE 25 /
CAPITAL AND SHAREHOLDERS’ FUND
N ’billion
23.6%21.9% 23.0% 23.1% 21.8%
27.3%24.6% 26.1% 24.7%
22.5%
0%
5%
10%
15%
20%
25%
30%
H1 2019 FY 2019 H1 2020 FY 2020 H1 2021
Tier 1 capital adequacy Total capital adequacy Statutory minimum
2,536 2,821 3,142 3,341 3,047
1.6 1.5
1.0 1.3
1.3
0.0
0.5
1.0
1.5
2.0
0400800
1,2001,6002,0002,4002,8003,2003,600
H1 2019 FY 2019 H1 2020 FY 2020 H1 2021
Net asset value per share Price- to-book
Kobo Times
247.5 265.9 313.2 333.7 354.7
28.5% 27.3% 28.3%
24.3%
12.1%
0.0%
5.0%
10.0%
15.0%
20.0%
25.0%
30.0%
-
50.0
100.0
150.0
200.0
250.0
300.0
350.0
400.0
H1 2019 FY 2019 H1 2020 FY 2020 H1 2021
Shareholders' fund (average) Return on average equity

[ADD PRESENTATION TITLE IN SLIDE MASTER MODE] / PAGE 26
STANBIC IBTC HOLDINGS PLC PRESENTATION / PAGE 26 /
WEALTH

[ADD PRESENTATION TITLE IN SLIDE MASTER MODE] / PAGE 27
STANBIC IBTC HOLDINGS PLC PRESENTATION / PAGE 27 /
WEALTH FINANCIAL ANALYSIS – H1 2021
Performance highlightsH1 2021 Change H1 2020
Income statement N’million % N’million
Net interest income 1,658 (26) 2,232
Non-interest revenue 28,238 21 23,366 Total income 29,896 17 25,598
Gain / (loss) on financial assets 32 >(100) (4)
Operating expenses (7,823) 10 (7,123)
Profit before tax 22,105 20 18,471 Profit after tax 15,264 21 12,646
H1 2021 FY 2020Asset under Management (N ’million) 4,754,154 3 4,630,883
Key selected ratios H1 2021 H1 2020Cost to income ratio % 26.2 27.8
Return on Equity % 35.1 44.2
❖ The 17% growth in total income of the Wealthbusiness was supported by the increase in non-interest revenue (NIR).
❖ NIR growth is on account of growth in incentivefees earned from higher investment returns andcontributions that led to the continued growth inassets under management.
❖ Asset under Management grew by 3% year-to-date.
❖ Operating expenses rose by 10% due to increasesin pension administration expenses as well asmarketing and premises expenses following theuptick in business activities. That said, cost-to-income ratio improved to 26.2% from 27.8%recorded in H1 2020 due to faster growth inincome as against costs.

[ADD PRESENTATION TITLE IN SLIDE MASTER MODE] / PAGE 28
STANBIC IBTC HOLDINGS PLC PRESENTATION / PAGE 28 /
WEALTH –2021 FOCUS
Collaborate with regulators and other stakeholders to develop initiatives that will entrench best practice, support industry growth and improve customer experience.
Focus on employee engagement to ensure improved employee value proposition and deepen future ready capabilities among our workforce for increased productivity.
We will design new products and solutions and leverage customer insights and emerging technology to deliver refined value propositions and experiences for our clients.
We will continue to deepen the level of digitization especially across clients onboarding, redemption, infuse the use of robotics and artificial intelligence with the overall intent of improving transactional and processing efficiencies across our businesses.
Lorem IpsumEmployee Engagement
Lorem Ipsum Digitization
21 3 4
CollaborationCustomer Experience

[ADD PRESENTATION TITLE IN SLIDE MASTER MODE] / PAGE 29
STANBIC IBTC HOLDINGS PLC PRESENTATION / PAGE 29 /
CORPORATE & INVESTMENT BANKING (CIB)

[ADD PRESENTATION TITLE IN SLIDE MASTER MODE] / PAGE 30
STANBIC IBTC HOLDINGS PLC PRESENTATION / PAGE 30 /
CIB FINANCIAL ANALYSIS – H1 2021
Performance highlights
H1 2021 Change H1 2020
Income statement N ’million % N ’million
Net interest income 15,887 (22) 20,346
Non-interest revenue 11,734 (71) 40,685
Total income 27,621 (55) 61,031
Credit impairment charges 487 >(100) (3,930)
Operating expenses (21,533) 7 (20,192)
Profit before tax 6,575 (82) 36,908
Profit after tax 9,713 (73) 35,772
Balance sheet H1 2021 FY 2020
Gross loans & advances 462,346 12 414,284
Deposit liabilities 342,511 37 249,884
Key selected ratios H1 2021 H1 2020
Cost to income ratio % 78.0 33.1
CASA ratio % 43.5 61.5
Return on Equity % 10.3 41.0
Credit loss ratio % (0.5) 2.1
NPL/total loan ratio % 3.3 3.4
❖ Net interest income growth was constrained by the continuedpressure on loan yields – despite increase in loan volume –resulting in lower average yield on assets during H1 2021compared to prior year. This was partly cushioned by the decline ininterest expense.
❖ The decrease in non-interest revenue is attributable to thesignificant decline in trading revenue due to low trading activities,as market volumes and foreign portfolio inflows were largelymuted. This was compensated in part by increased advisory feesfrom the Investment Banking space, fees from new loan bookingsand commission on increased trade assets.
❖ Credit impairment charge of the business was a write-back of₦487 million following positive outcome on after write-offrecoveries during the period.
❖ The rise in operating expenses is due to growth in regulatory costsincluding AMCON levy and NDIC premium.
❖ Loan book growth was driven by opportunities to support clientexpansion requirements.
❖ The growth in customer deposits was on account of the stronggrowth in call and term deposits to fund liquidity requirements.

[ADD PRESENTATION TITLE IN SLIDE MASTER MODE] / PAGE 31
STANBIC IBTC HOLDINGS PLC PRESENTATION / PAGE 31 /
CIB 2021 FOCUS
❖ Grow Asset underCustody whileexploring newcorporate financeopportunities
Lorem IpsumVolume Growth
Lorem IpsumCost Management
21 3 4
Risk Asset Growth
Global Markets
❖ Unlock the tradeopportunities
₦
❖ Improve theCLR/NPL ratio.
❖ Grow a resilientLCY loan book
❖ Develop structuredproducts in theGlobal Marketsspace to targetforeign fixed incomesector clients
❖ Leverage ourstrength in FX
❖ Ensure costefficiency
❖ Optimize depositmix to minimizecost of funds
₦

[ADD PRESENTATION TITLE IN SLIDE MASTER MODE] / PAGE 32
STANBIC IBTC HOLDINGS PLC PRESENTATION / PAGE 32 /
PERSONAL & BUSINESS BANKING (PBB)

[ADD PRESENTATION TITLE IN SLIDE MASTER MODE] / PAGE 33
STANBIC IBTC HOLDINGS PLC PRESENTATION / PAGE 33 /
PBB FINANCIAL ANALYSIS – H1 2021
❖PBB’s total income increased by 3% due to growth in bothnet interest income and non-interest revenue.
❖Net interest income increased by 2%, as the decrease ininterest expense more than offset the decrease in interestincome. The business benefited from the decline in interestexpenses following accelerated growth in cheap depositswhich helped reduce the cost of funds.
❖Transactional volumes growth impacted NIR positively.
❖ Provision for credit losses was a net benefit of ₦765 millionas against the ₦2.5 billion charge in H1 2020, on account ofsignificant recoveries and provision releases.
❖The business continued to drive earning assets growthresulting in the 36% year-to-date growth in gross loans andpartly funded by the 8% year-to-date increase in deposits.
Performance highlights
H1 2021 Change H1 2020
Income statement N ’million % N ’million
Net interest income 15,334 2 14,971
Non-interest revenue 5,937 3 5,745
Total income 21,271 3 20,716
Credit impairment charges 765 >100 (2,470)
Operating expenses (26,009) (23) (21,220)
Loss before tax (3,973) (34) (2,974)
Loss after tax (2,434) 24 (3,215)
Balance sheet H1 2021 FY 2020
Gross loans & advances 328,269 36 241,008
Deposit liabilities 615,859 8 570,060
Key selected ratios H1 2021 H1 2020
Cost to income ratio % 122.3 102.4
CASA ratio % 90.0 83.9
Return on Equity % (6.5%) (8.1%)
Credit loss ratio % (0.5) 2.4
NPL/total loan ratio % 3.2 7.7

[ADD PRESENTATION TITLE IN SLIDE MASTER MODE] / PAGE 34
STANBIC IBTC HOLDINGS PLC PRESENTATION / PAGE 34 /
DIGITAL CHANNELS
54,241,61469,731,427
85,799,528
108,413,176
H1 2018 H1 2019 H1 2020 H1 2021
Digital Transaction Trend Y-o-Y
26%
1,494,384
421,180465,923
836,062
876,684804,470
Q1-20 Q2-20 Q3-20 Q4-20 Q1-21 Q2-21
Branch Transaction Trend Q-o-Q
46,693,274 39,106,254
48,457,779 49,723,575 52,372,968 56,040,208
Q1-20 Q2-20 Q3-20 Q4-20 Q1-21 Q2-21
Digital Transaction Trend Q-o-Q
❖ Digital transactions grew by 26% YoY as customers continuedto migrate to our digital platforms rapidly.
❖ Digital transactions accounted for 98% of total transactions asat H1 2021 while just 2% are processed through the branches.
❖ Branch transactions continue to dissipate reflecting theincreasing preference for alternative service platforms.

[ADD PRESENTATION TITLE IN SLIDE MASTER MODE] / PAGE 35
STANBIC IBTC HOLDINGS PLC PRESENTATION / PAGE 35 /
DIGITAL CHANNEL PERFORMANCE
10,796,764
11,323,141
22,119,905
17,453,818
18,116,197
35,570,015
Q1 2020
Q2 2020
H1 2020
Q1 2021
Q2 2021
H1 2021
USSD Banking
6,819,274
6,723,562
13,542,836
8,942,996
11,629,790
20,572,786
Q1 2020
Q2 2020
H1 2020
Q1 2021
Q2 2021
H1 2021
Mobile Banking
3,777,959
2,921,774
6,699,733
4,172,059
4,406,163
8,578,222
Q1 2020
Q2 2020
H1 2020
Q1 2021
Q2 2021
H1 2021
POS
317,567
301,905
619,472
398,331
441,055
839,386
Q1 2020
Q2 2020
H1 2020
Q1 2021
Q2 2021
H1 2021
SME Internet Banking
14,667,839
9,834,215
24,502,054
13,988,431
13,834,575
27,823,006
Q1 2020
Q2 2020
H1 2020
Q1 2021
Q2 2021
H1 2021
ATM
31,030
13,225
44,255
8,621
11,123
19,744
Q1 2020
Q2 2020
H1 2020
Q1 2021
Q2 2021
H1 2021
BNA
61%52%
28%
36% 14%

[ADD PRESENTATION TITLE IN SLIDE MASTER MODE] / PAGE 36
STANBIC IBTC HOLDINGS PLC PRESENTATION / PAGE 36 /
PBB –2021 FOCUS
Improve operational efficiency through effective channel management and implementation of cost saving initiatives.
Accelerate customer growth through new-to-bank acquisition.
1
Grow NIR via clients’ transactional velocity growth in all business segments.
2
Grow the balance sheet in a sustainable manner by focusing on resilient sectors within our risk appetite.
3 4
Transactional Velocity Growth
Cost Management
Growing Scale
Risk Asset Growth

[ADD PRESENTATION TITLE IN SLIDE MASTER MODE] / PAGE 37
STANBIC IBTC HOLDINGS PLC PRESENTATION / PAGE 37 /
GUIDANCE
[ADD PRESENTATION TITLE IN SLIDE MASTER MODE] / PAGE 38
STANBIC IBTC HOLDINGS PLC PRESENTATION / PAGE 38 /
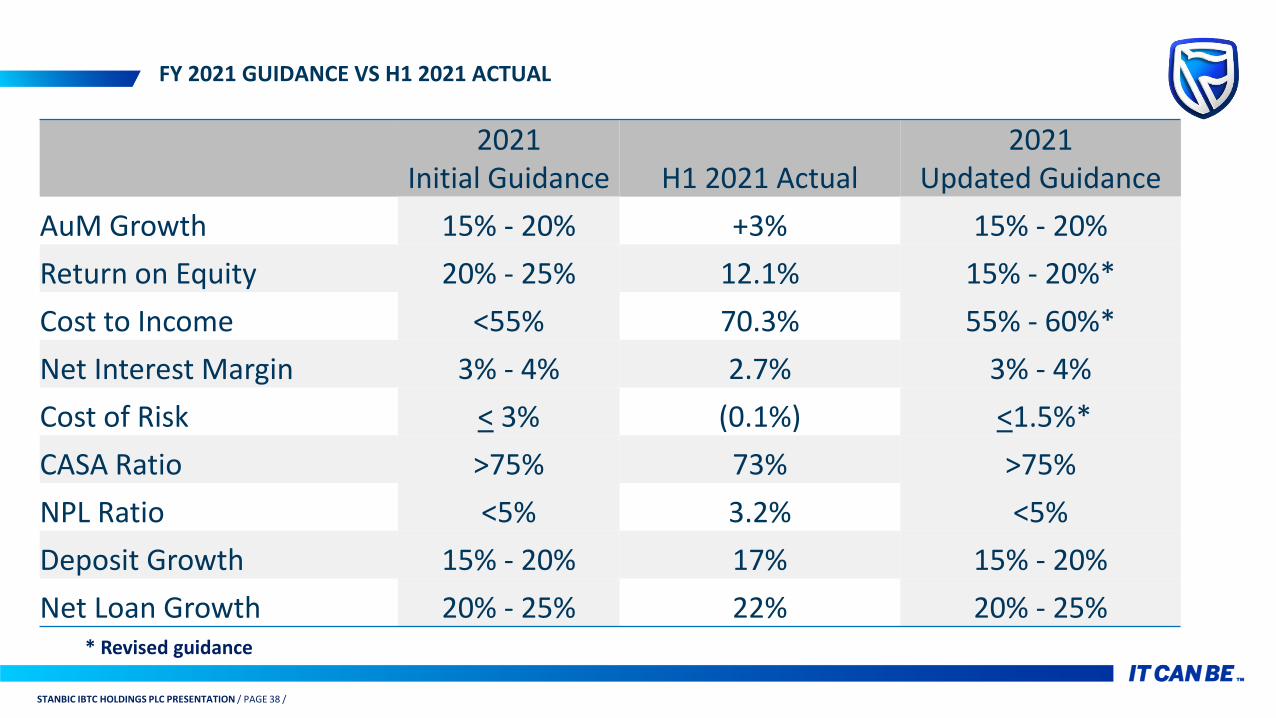
2021 Initial Guidance H1 2021 Actual
2021 Updated Guidance
AuM Growth 15% - 20% +3% 15% - 20%
Return on Equity 20% - 25% 12.1% 15% - 20%*
Cost to Income <55% 70.3% 55% - 60%*
Net Interest Margin 3% - 4% 2.7% 3% - 4%
Cost of Risk < 3% (0.1%) <1.5%*
CASA Ratio >75% 73% >75%
NPL Ratio <5% 3.2% <5%
Deposit Growth 15% - 20% 17% 15% - 20%
Net Loan Growth 20% - 25% 22% 20% - 25%
FY 2021 GUIDANCE VS H1 2021 ACTUAL
* Revised guidance

[ADD PRESENTATION TITLE IN SLIDE MASTER MODE] / PAGE 39
STANBIC IBTC HOLDINGS PLC PRESENTATION / PAGE 39 /
BUSINESS TRANSFORMATION

[ADD PRESENTATION TITLE IN SLIDE MASTER MODE] / PAGE 40
STANBIC IBTC HOLDINGS PLC PRESENTATION / PAGE 40 /
Global
Markets
Client
Coverage
MM
Relationship
Banking
Direct
Banking
Personal and
Business Banking
Asset
Management
Life
Insurance
Insurance
Brokerage
Pensions
Trustee
Services
Investment
Banking
TPS
FUTURE READY TRANSFORMATION PROGRAMME
SBG Platform

[ADD PRESENTATION TITLE IN SLIDE MASTER MODE] / PAGE 41
STANBIC IBTC HOLDINGS PLC PRESENTATION / PAGE 41 /
FORCES TRANSFORMING FINANCIAL SERVICESWHY PLATFORM BUSINESS
❖ The environment in which we operate is evolving, driving the need to evolve focus areas and accelerate our delivery to clients.
❖ This all means we need to serve our clients in a new way. We have to be where our customers are – on the digital platforms where they are shopping, socialising, hanging out and doing business.
2. REGULATORY & LEGAL CHANGES• New regulations
- Basel 4- Depositor insurance- Open banking- Debt forgiveness- Margin caps
• Legal challenges
Environmental and social threats
Technological advancement
Economy
Regulatory environment
Competitive landscape
Political and geopolitical shifts
1.DATA & TECHNOLOGY INNOVATION• Technology advancement
- Digitisation of firms, sectors and economies
- Data, automation, IoT & Blockchain- Artificial intelligence & cloud
• Rise of BigTech and FinTech
3. SOCIOPOLITICAL & MACRO SHIFTS• Rise of corporates in society; shared value• Sustainability & climate change• Political volatility• Populism & protectionism• Skills shortage

[ADD PRESENTATION TITLE IN SLIDE MASTER MODE] / PAGE 42
STANBIC IBTC HOLDINGS PLC PRESENTATION / PAGE 42 /
QUESTIONS

[ADD PRESENTATION TITLE IN SLIDE MASTER MODE] / PAGE 43
STANBIC IBTC HOLDINGS PLC PRESENTATION / PAGE 43 /
APPENDIX

[ADD PRESENTATION TITLE IN SLIDE MASTER MODE] / PAGE 44
STANBIC IBTC HOLDINGS PLC PRESENTATION / PAGE 44 /
Stanbic IBTC Trustees Limited
Stanbic IBTC Nominees Limited
Stanbic IBTCVentures Limited
Stanbic IBTC Financial Services Limited
99.9%
Stanbic IBTCBank PLC
99.9%
Stanbic IBTC Holdings PLC
88.24%99.9%99.9% 99.9% 99.9%
99.9% 99.9%99.9%
Stanbic IBTC Pension Managers Limited
Stanbic IBTC Insurance Limited
Stanbic IBTC Asset Management Limited
Stanbic IBTC Capital Limited
Stanbic IBTC Stockbrokers Limited
ABOUT STANBIC IBTC HOLDINGS PLC
Stanbic IBTC Insurance Brokers Limited
75%
1989 2001 2005 2007 2012
Incorporated as Investment Banking & Trust Company Limited and commenced operations as a Merchant bank
Obtained Universal Banking Licence in Nigeria
Listed on The NSE on 25 April 2005
Merged with Chartered Bank & Regent Bank and changed name to IBTC Chartered Bank PLC
Merged with Stanbic Nigeria and Standard Bank gained control of the combined entity in a US$1bn transaction
Holding Company Structure was adopted
2020
Standard Bank increased its stake in Stanbic IBTC to 67.02%
ABOUT STANBIC IBTC HOLDINGS PLC
[ADD PRESENTATION TITLE IN SLIDE MASTER MODE] / PAGE 45
STANBIC IBTC HOLDINGS PLC PRESENTATION / PAGE 45 /
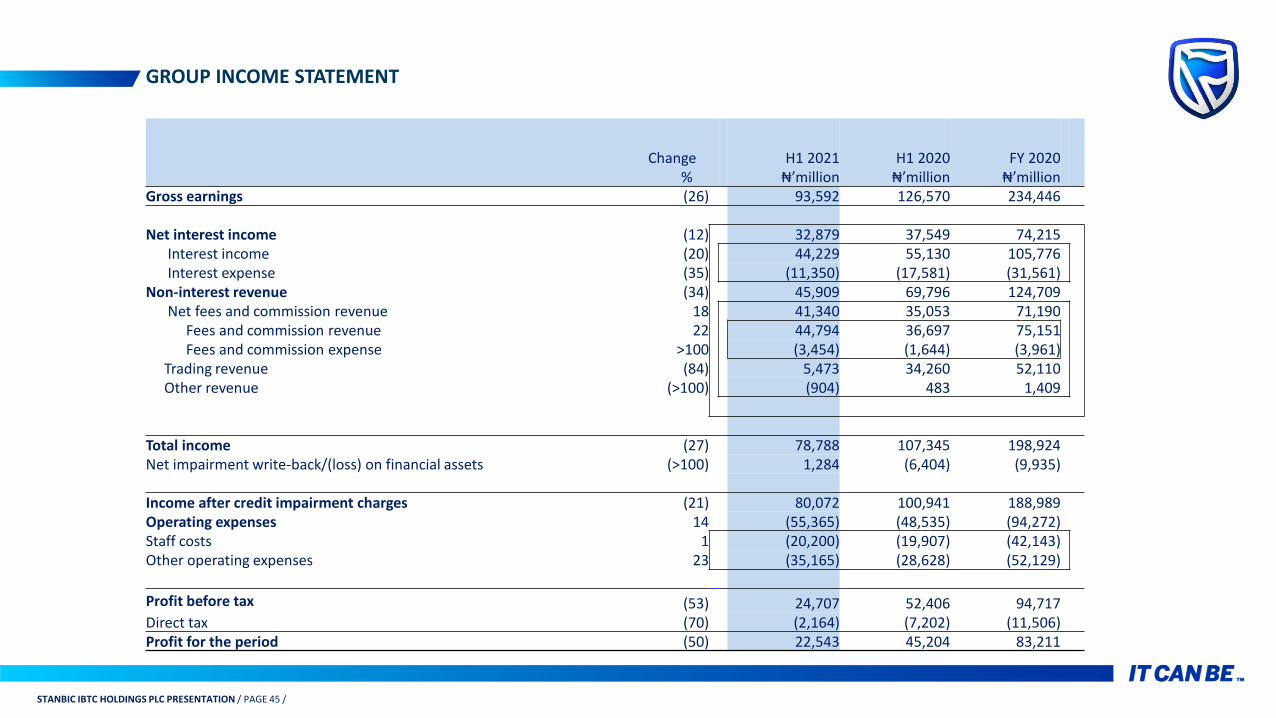
Group income statementGROUP INCOME STATEMENT
Change %
H1 2021₦’million
H1 2020₦’million
FY 2020₦’million
Gross earnings (26) 93,592 126,570 234,446
Net interest income (12) 32,879 37,549 74,215 Interest income (20) 44,229 55,130 105,776 Interest expense (35) (11,350) (17,581) (31,561)
Non-interest revenue (34) 45,909 69,796 124,709 Net fees and commission revenue 18 41,340 35,053 71,190
Fees and commission revenue 22 44,794 36,697 75,151 Fees and commission expense >100 (3,454) (1,644) (3,961)
Trading revenue (84) 5,473 34,260 52,110 Other revenue (>100) (904) 483 1,409
Total income (27) 78,788 107,345 198,924 Net impairment write-back/(loss) on financial assets (>100) 1,284 (6,404) (9,935)
Income after credit impairment charges (21) 80,072 100,941 188,989 Operating expenses 14 (55,365) (48,535) (94,272)Staff costs 1 (20,200) (19,907) (42,143)Other operating expenses 23 (35,165) (28,628) (52,129)
Profit before tax (53) 24,707 52,406 94,717 Direct tax (70) (2,164) (7,202) (11,506)Profit for the period (50) 22,543 45,204 83,211

[ADD PRESENTATION TITLE IN SLIDE MASTER MODE] / PAGE 46
STANBIC IBTC HOLDINGS PLC PRESENTATION / PAGE 46 /
Group quarterly income statement GROUP QUARTERLY INCOME STATEMENT
QoQ Group Group Group Change Q2 2021 Q1 2021 H1 2021
% ₦million ₦million ₦million
Gross earnings 5 47,866 45,726 93,592 Net interest income 7 17,019 15,860 32,879
Interest income 10 23,215 21,014 44,229 Interest expense 20 (6,196) (5,154) (11,350)
45,909 Non-interest revenue (1) 22,826 23,083 45,909 Net fee and commission revenue (1) 20,528 20,812 41,340
Fee and commission revenue (0) 22,353 22,441 44,794 Fee and commission expense 12 (1,825) (1,629) (3,454)
Trading revenue (30) 2,250 3,223 5,473 Other revenue (105) 48 (952) (904)
Total income 2 39,845 38,943 78,788 Net impairment write-back/(loss) on financial assets >100 1,129 155 1,284 Income after credit impairment charges 5 40,974 39,098 80,072 Operating expenses 5 (28,409) (26,956) (55,365)
Staff costs 13 (10,720) (9,480) (20,200)Other operating expenses 1 (17,689) (17,476) (35,165)
-Profit before taxation 3 12,565 12,142 24,707 Taxation 44 (1,278) (886) (2,164)
Profit for the period 0 11,287 11,256 22,543

[ADD PRESENTATION TITLE IN SLIDE MASTER MODE] / PAGE 47
STANBIC IBTC HOLDINGS PLC PRESENTATION / PAGE 47 /
GROUP STATEMENT OF FINANCIAL POSITION
YTD Change%
H1 2021N ’million
FY 2020N ’million
YTD Change
% H1 2021₦million
FY 2020₦million
Assets
Cash and cash equivalents (17) 521,401 627,111
Pledged assets (11) 152,101 170,578
Trading assets (30) 119,219 169,655
Derivative assets (46) 24,844 46,233
Financial investments 6 650,958 612,276
Loans and advances 21 767,817 632,967
Loans and advances to banks 5 8,222 7,828
Loans and advances to customers 22 759,595 625,139
Other assets (20) 140,081 175,980
Property and equipment (0) 30,645 30,728
Intangible assets (6) 4,377 4,640
Right of use assets 10 3,271 2,975
Deferred tax assets (4) 12,650 13,163
Total assets (2) 2,427,364 2,486,306
Equity and liabilities
Equity (8) 346,441 378,601
Equity attributable to ordinary shareholders (9) 338,430 371,023 Ordinary share capital - 5,553 5,553 Ordinary share premium - 102,780 102,780 Reserves (12) 230,097 262,690 Non-controlling interest 6 8,011 7,578
Liabilities(1) 2,080,923 2,107,705
Trading liabilities (15) 160,550 188,500 Derivative liabilities (64) 13,571 37,382 Current tax liabilities (55) 9,147 20,270 Deposit and current accounts 2 1,350,926 1,325,566 Deposits from banks (22) 392,556 505,622
Deposits from customers 17 958,370 819,944
Other borrowings (13) 97,420 112,031 Debts securities issued 6 72,128 68,269 Provisions (6) 8,780 9,354
Other liabilities 6 368,401 346,333
Total equity and liabilities (2) 2,427,364 2,486,306

[ADD PRESENTATION TITLE IN SLIDE MASTER MODE] / PAGE 48
STANBIC IBTC HOLDINGS PLC PRESENTATION / PAGE 48 /
OUR SOCIAL, ECONOMIC AND ENVIRONMENTAL IMPACT IN H1 2021THROUGH THE LENS OF OUR SUSTAINABILITY PILLARS
Efficient waste management
❖ Installed waste segregation bins across our Head Officelocations to help sort waste at source
❖ Recycled 5.4 tonnes of waste papers in H1 2021
BUILDING ENVIRONMENTAL RESILIENCE1
Energy management to reduce carbon emissions and reduceenergy consumption
❖ Installed solar energy solutions in 34 (18%) of our officelocations so far, as at June 2021
❖ Onboarded over 97 ATMs (12% of total) across 39 locationson solar energy solutions so far, as at June 2021
ENHANCING SOCIAL RELATIONSHIPS2
Empowering communities through sustainable finance andinvestment solutions and community programs
❖ Invested ₦102.0 million on Corporate Social Investments and₦1.2 billion on donations / grants during H1 2021
❖ Modified 95 office locations and 47 ATM locations foraccessibility to the physically challenged as at June 2021
Employee engagement and well-being
❖ Continued to conduct health sessions and roadshowsacross the Group to educate staff on healthy living

[ADD PRESENTATION TITLE IN SLIDE MASTER MODE] / PAGE 49
STANBIC IBTC HOLDINGS PLC PRESENTATION / PAGE 49 /
EXPANDING BUSINESS MODEL AND INNOVATION3
Finance and investment in clean energy technology
Approved ₦7.9 billion credit for solar energy related solutions
Made ₦14.4 billion investment in SEE impact areas – Infrastructuredevelopment, Health, Climate Change/environmental sustainability
Environmental and social (E&S) risk management in lending
Screened 100% of our commercial lending applications for E&Srisk during the period
Sustainability driven supply chain
Organized a webinar tagged ‘Understanding Sustainability and What itMeans for Your Business’ to further drive sustainability awarenessamongst our vendors
Financial inclusion solutions and gender-based offerings
Launched a women specific financial product – Blue BlossomAccount to the market.
Opened 80,330 @ease accounts during H1 2021
STRENGTHENING LEADERSHIP FOR SUSTAINABILITY GOVERNANCE4
Embedding sustainability considerations in applicable processes andpolicies
Constituted the Sustainability Steering Committee to furtherintegrate sustainability into our strategy and operations
Organized internal sustainability training sessions for staff members(233 participants in H1 2021)
Reporting of sustainability activities
Published our 2020 annual sustainability report detailing ouroverall alignment with the above principles during the period
Adopting international sustainability reporting framework
Aligned our sustainability policies and practices to the NigeriaSustainable Banking Principles; Nigerian Sustainable Finance Principlesand the Principles of Responsible Banking
Proactive compliance approaches to applicable frameworks andregulations
Continued to maintain good corporate governance practices
OUR SOCIAL, ECONOMIC AND ENVIRONMENTAL IMPACT IN H1 2021THROUGH THE LENS OF OUR SUSTAINABILITY PILLARS
[ADD PRESENTATION TITLE IN SLIDE MASTER MODE] / PAGE 50
STANBIC IBTC HOLDINGS PLC PRESENTATION / PAGE 50 /
If you received this document in error, please immediately return the document and other related documents to Standard Bank Group / Stanbic IBTC Holdings PLC.
On receipt of this document, you agree to be bound and are deemed to understand that:
This presentation is provided to you for information purposes only on the understanding that such information is strictly confidential. This presentation must not bedelivered or its contents disclosed to anyone other than the entity (including its employees) to which it is provided and must not be used or reproduced, in whole or part,for any purpose other than for information.
This presentation is intended to be a commercial communication and is not to be construed as a recommendation or the constitution or solicitation of an offer for the saleand purchase of any financial product, service, investment or security. The information, investments and/or strategies discussed in this presentation may not be suitable forall investors and where you have any concerns you should approach an investment advisor.
We do not accept liability for any loss (direct or consequential) arising from use of this presentation. You must not rely on any communication (written or oral) from us asinvestment advice, a recommendation to enter into a transaction (which includes the information and explanations related to the terms and conditions of a transaction) ordeem it to be an assurance or guarantee as to the expected results of a transaction. Investments discussed in this presentation may fluctuate in price or value over time andpast performance is not indicative of future results. While we have taken care in preparing this presentation, we give no representation, warranty or undertaking andaccept no responsibility or liability as to the accuracy or completeness of the information set out in this presentation. This presentation does not represent an offer offunding and any facility to be granted in terms of this presentation is subject to us obtaining the requisite internal and external approvals.
Our duties and responsibilities do not include tax advisory, legal, regulatory accounting or other specialist or technical advice or services. You must procure and rely onindependent assessments and investigations into all matters contemplated in this presentation.
© 2021 Standard Bank Group / Stanbic IBTC Holding PLC. All rights reserved.
Disclaimer