STAMP is an Unsound Tool for Gauging the Economic Impact ...
33
STAMP is an Unsound Tool for Gauging the Economic Impact of Taxes Institute on Taxation and Economic Policy May 2014 1616 P Street, NW Suite 200 • Washington, DC 20036 202.299.1066 • www.itep.org
Transcript of STAMP is an Unsound Tool for Gauging the Economic Impact ...

STAMP is an Unsound Tool for Gauging the Economic Impact of Taxes
Institute on Taxation and Economic Policy May 2014
1616 P Street, NW Suite 200 • Washington, DC 20036
202.299.1066 • www.itep.org

1 Executive Summary
3 Introduction
3 An “Efficient” Simplification
6 Inadequate Data
8 Published STAMP Results Go Beyond Intended Purpose of CGE Models
9 Undervaluing Government Services
13 Hypersensitivity to Income Tax Rates
15 Hypersensitivity in Businesses’ Decision-Making
16 Consumers’ Decision-Making in STAMP Bears Little Resemblance to Reality
18 Immediate Impacts are Ignored
21 STAMP Results Out of Line with Other Studies, Past Experience
25 Conclusion
26 References: Beacon Hill Institute Reports and Analyses
29 Additional References
CONTENTS

EXECUTIVE SUMMARY
•TheBeaconHillInstitute(BHI),afree-marketthinktanklocatedatSuffolkUniversity,frequentlyusesitsStateTaxAnalysisModelingProgram(STAMP)toperformanalysespurportingtoshowthatloweringtaxes,ornotraisingthem,willbenefitstateeconomies.ButSTAMPsuffersfromanumberofseriousmethodologicalproblemsandshouldnotberelieduponbyanybodyseekingtounder-standtheeconomicimpactsofstatetaxpolicies.
•Asa“computablegeneralequilibrium”(CGE)model,STAMPisgroundedinaconceptofperfecteconomicefficiencythatbearslittleresemblancetoreality.Moreover,thethousandsoflinkagesbetweeneconomicsectorsbuiltintoSTAMPareinmanycasesnotwell-studiedandnotsubjecttostatisticaltesting.
• STAMP’sunrealisticdepictionofthepublicsectorcausesittoconcludethatpublicinvestmentslikeeducationandinfrastructureareofrelativelylittlevaluetostateeconomiesinboththeshort-andlong-term.Governmentismodeledasasimplistic“pass-through”devicethatdistributestaxdollarstohouseholdsanddiscouragesthemfromworkingintheprocess.ThisconstructionfitsneatlywithBHI’sstatedmissiontopromote“limitedgovernment,”butithasalsocausedSTAMPtoproduceestimatesfaroutoflinewithmoremainstreameconomicmodels.
•BHIstudiestypicallydevotelittleifanyattentiontotheimpactoftaxchangesongovernmentem-ployees.InthosefewcaseswhereBHIhaspublishedsufficientdatatoallowforanassessmentofSTAMP’smodelingofpublicsectoremployment,theresultshavebeenextremelyinconsistent.STAMPhasconcludedthata$1millioncut(orincrease)willresultinthefiring(orhiring)ofany-wherefrom1to37governmentemployees.Thishugedegreeofvariationraisesquestionsaboutthemodel’srobustness.
•BHIhasbuiltintoSTAMPanassumptionthathigh-incomeworkersareextremelysensitivetochangesinincometaxrates,andthatthoseworkersarefarmoresensitivethantheirlower-incomeneighborstosuchchanges.BothoftheseassumptionsconflictwiththefindingsofthenonpartisanCongressionalBudgetOffice(CBO)andotherexperts.
• STAMPassumesthatbusinesses’choicebetweenhiringadditionalemployeesversuspurchasingmoremachineryisheavilyinfluencedbytaxpolicy.Again,thedegreeofsensitivitytotaxesassumedinSTAMPisoutoflinewiththebestavailableestimates.
STAMP is an Unsound Tool 1

2 Institute on Taxation & Economic Policy I May 2014
•STAMPalsoassumesthatconsumerswillquicklyanddramaticallyshifttheirconsumptiontowardout-of-stategoodsandservicesifpricesintheirownstateriseasaresultofataxincrease.Thisas-sumptionisverylooselybasedonapairofstudiespublishedovertwodecadesagothatreliedonnationalandinternationaleconomicdata.Itignoresnewer,state-leveldatathatindicateasubstan-tiallylowerlevelofresponsiveness.BHIalsoassumesthatconsumersindifferentindustriesbehaveverysimilarlytooneanother,despiteevidenceintheliterature(includingthestudiescitedbyBHI)thatindicatethisisnotthecase.
• STAMPisincapableofestimatinghowataxchangewillaffectastate’seconomyinthetimeperiodimmediatelyfollowingitsenactment.ThewayinwhichBHIpresentsitsresultsoftengivestheim-pressionthattheeconomicimpactwillbeinstantaneous,whichmakestaxcuts,forexample,appearlesscostlythantheyactuallyareintheshort-term.ThishasalsoallowedBHItomaskthefactthatsometaxplanstheybelievewouldbeeconomicallybeneficialareguaranteedtoshrinktheeconomyintheshort-term.
•STAMP’smethodologicalshortcomingsarereflectedinitsunreliableresults.STAMP’sfindingshavebeencontradictedbyacademicresearchers,staterevenueoffices,andtheactualtrackrecordofstatesthathavefollowedBHI’srecommendedlow-taxpath.

STAMP is an Unsound Tool 3
INTRODUCTION
Inrecentyears,theBeaconHillInstitute(BHI)hasuseditsStateTaxAnalysisModelingProgram(STAMP)toarguethatstateeconomiescouldbeimprovedbycuttingincometaxes(inKansas,Loui-siana,Maine,Massachusetts,NorthCarolina,andVirginia),propertytaxes(NorthDakota),salestaxes(RhodeIsland),andestatetaxes(NorthCarolina).STAMPhasalsobeenusedtoargueagainstincreasesinsalestaxes(Arizona,Massachusetts,Michigan,andNorthCarolina),incometaxes(MassachusettsandWashington),cigarettetaxes(MassachusettsandSouthCarolina),gasolinetaxes(Massachusetts),andeventaxesonplasticshoppingbags(DistrictofColumbia).ButwhileBHIroutinelymakesveryspecificclaimsaboutthejobgainsorlossesassociatedwithparticularpolicies,italsoconcedesthatits“economicmodelingisasmuchartasscience”(Haughtonetal.,2003).Unfortunatelyforanybodyinterestedinthetrueeconomicimpactofstatetaxes,acarefulexaminationofBHI’smethodologyrevealsthatitsartisticvisionhasgreatlydistorteditsanalyses.
AN “EFFICIENT” SIMPLIFICATION
STAMPisatypeof“computablegeneralequilibrium”(CGE)model.CGEmodelbuildersattempttoap-proximatetheworkingsofaneconomybygatheringdataondifferenteconomicsectors(roughly80sec-torsinthecaseofSTAMP)andthenlinkingthosesectorstogetherthroughmathematicalrelationships.Theuserthen“shocks”theeconomybyintroducingsomepolicychangeintothemodel,andexamineshowthatchangereverberatesthroughoutthemodeleconomy.
Attheircore,CGEmodelsarelimitedbythefactthattheycanonlycalculatetheeconomiceffectsthatpolicychangeswouldhaveiftheywereenactedinaperfectlyefficientmarketplacethatiscapableofreachingastableequilibrium(Johnson,2013andAckermanetal.,2013).Asmoststudentsofeconom-icsknow,however,“perfectefficiency”isanextremelysimplifiedversionofrealitythatdoesnotexistoutsidethepagesoftheeconomicsliterature.Moreover,theveryexistenceofastablemarketequilib-rium—theendresultthatCGEmodelsareintendedtocalculate—hasbeendrawnintoseriousquestion.Inotherwords,thehypotheticaleconomycontainedwithinSTAMPbearslittleresemblancetoanyrealworldeconomy.
STAMPisevenmorelimitedthansomeCGEmodelsinthatitassumestheeconomyisnotonlyper-fectlyefficient,butalsooperatingatitsfullpotential.AmongthemostglaringofSTAMP’sdeparturesfromrealityisthat:“theeconomyisassumed…torunatfullemployment(bywhichwemeanthatthereisnoinvoluntaryunemployment)”(BHI,WhatisSTAMP?).ThisisinsharpcontrasttoothereconomicmodelslikethosebuiltbyRegionalEconomicModels,Inc.(REMI),whichcanaccountforthefactthat

thereisoftensome“slack”intheeconomy1.AckermanandGallagher(2004)putthisshortcomingintocontext:thefactthatCGEmodelslikeSTAMPfindit“impossibletomodelunemploymentandreces-sions”isjustoneexampleofhow“mathematicalconvenience…has…wonoutoverrealismaboutmarketimperfections”inCGEmodeling.Inpractice,thisassumptionmeansthatalmostanyeconomi-callyproductiveroleforgovernmentisoutofthequestion,inpartbecausethereisneveralackofcon-sumerdemand,oralackofjobs,thatlocalizedgovernmentinitiativescanhelpaddress.
Ackermanetal.(2013)offerarevealingdiscussionoftheproblemswiththis“fullemployment”assumption:
This strange assumption greatly simplifies the model’s calculations, and it may not be too far from the truth at times of very high employment, such as the late 1990s. Under today’s economic conditions, however, the full employment assumption misses reality by a mile. In the world according to STAMP, the auto industry bailout of 2009 – or any other stimulus measure – couldn’t possibly save any jobs, because no one who wants a job is ever out of work. So why not save taxpayers’ money by letting the auto companies fend for themselves? Viewing pub-lic policy from this perspective, STAMP compares every proposed policy to an imaginary world of full employ-ment. If you think you’re starting from the top of the mountain, there’s nowhere to go but down. In general, any model that assumes automatic full employment is irrelevant to real‐world concerns about job creation at a time when unemployment is a pressing problem.
“Fullemployment”isnottheonlyjarringlyunrealisticfeatureoftheeconomydepictedinSTAMP.Ack-ermanandGallagher(2004),forexample,notethatthemodel’sassumptionof“perfectcompetition…doesnotdescribethemarketeconomyasitactuallyexists;perfectcompetitionamongsmall,powerlessfirmsdoesnotcharacterizethelikesofMicrosoft,GeneralMotors,AOLTimeWarner,andExxonMo-bil.”
Asimilarlimitationexistsontheconsumersideofthemodel.WhiletheeconomictheoryunderlyingCGEmodelsassertsthatthemultitudeofconsumersinaneconomyeachbehavera-tionallyandindependentlyofoneanother,therealityisthatthepreferencesofindividualconsumersareofteninterrelatedandcanthereforeshiftindramaticanddestabilizingways.Thisisevidencedbytheoccurrenceofeconomicbubbles,forexample(Ackerman,2002).
In STAMP, almost any economically productive role for government is out of the question, in part because there is never a lack of consumer demand, or a lack of jobs, that localized government initiatives can help address.
4 Institute on Taxation & Economic Policy I May 2014
...............1PresentationbyPaulL.Dion,Ph.D.MeetingoftheSpecialJointLegislativeCommissiontoStudytheSalesTaxRepealActof2013.December3,2013.Availableat:http://www.rilin.state.ri.us/CapTV/Pages/default.aspx.Thisdiscussionbeginsatminute13:24.

STAMP is an Unsound Tool 5
Moreover,“perfectefficiency”alsoimpliesthattaxpayersareall-knowing,orhave“perfectinformation”aboutthealternativesavailabletothem.TheomniscientemployeesinaCGEmodelknow,forexample,theexactmarginalincometaxratesleviedintheirhomestateandinotherlocations,takingintoaccountcom-plextaxruleslikethephase-outofdeductionsandcredits,andgenerousfederaltaxwrite-offsforstatetaxpayments.Theyarealsofullyawareofthepost-taxpriceofeverygoodsoldintheirhomestate,andontheothersideofthestateline.Ofcourse,thisassumptionof“unlimitedcomputingpower”bearslittleresem-blancetoreality(Bell,2009).AndStiglitz(2000)showsthatthissimplificationhasseriousimplicationsforanymodel’susefulnessintherealworld:“thelong-standinghypothesisthateconomieswithimperfectinfor-mationwouldbesimilartoeconomieswithperfectinformation—atleastsolongasthedegreeofinforma-tionimperfectionwasnottoolarge—hasnotheoreticalbasis.”
Partiallyasaresultofsomeofthemarketimperfectionsdescribedabove,seriousdoubtsexistastowhetherthemarketisevencapableofreachingthekindofunique,stableequilibriumonitsownthatCGEmodelsaimtocomputeinthewakeofanypolicychange.Kirman(1989)arguesthat“theunderlyingassumptionsofuniquenessandstability…havenotheoreticaljustification.”Andasaresult,“generalequilibriummodels…are,inreality,nomorethanspecialexampleswithnobasisineconomictheoryasitstands.”
Ackerman(2002)makesasimilarobservation,summarizinganumberofstudiesfindingthat“cyclesofanylength,chaos,oranythingelseyoucandescribe,willariseinageneralequilibriummodelforsomesetofconsumerpreferencesandinitialendowments.”Healsospeculatesthatintherealworld,socialandpoliticalforcesnotcapturedbyCGEmodelsmaybejustasimportantasthe“invisiblehand”inbringingaboutthestabilitythatoftencharacterizestheeconomybetweenperiodsofeconomicupheaval.Butveryfewread-ersofBHI’sreportshaveanyideaofthedegreetowhichSTAMP’smodeleconomyisdivorcedfromreality.Mitra-Kahn(2008)explainsthatwhenconstructingaCGEmodel,“anydebateontheempiricalvalidityof…longrunequilibriumisignored.”

6 Institute on Taxation & Economic Policy I May 2014
INADEQUATE DATA
ThebreadthoftheSTAMPmodel—whichattemptstoapproximatetheworkingsofentirestateecono-mies—leavesitvulnerabletoadditionalweaknesses.
STAMPseekstoquantifyhowroughly6,000relationships(or“flows”)areplayingoutbetweenroughly80differenteconomicsectors.2Unfortunately,thequalityofdataavailableonthesethou-sandsofrelationshipsoftenleavesmuchtobedesired.AckermanandGallagher(2004)observethatCGEmodelsareoften“forcedtorelyonopaqueandarbitraryapproximationsofnumerouspoorlyunderstoodrelationships.…Everyonedoingrocketscienceusesexactlythesamemodelofgravity–buteconomicsisnotrocketsci-ence,andeveryCGEmodelhasitsownpictureoflaborandproductmarkets.”
STAMP’ssupportingdocumentsmakeclearthatthisisnotanissueBHIhasbeenabletoavoid.Infact,giventhatSTAMPisastate-levelmodel,itisevenmoresusceptibletothisproblemthanthenationalmod-elstowhichAckermanwasreferring.BHIconcedesthat“dataarelessavailableatthesub-nationalthannationallevel.ThisexplainswhyscoresofnationalCGEmodelshavebeenbuilt,butrelativelyfewsub-nationalmodels”(BHI,WhatisSTAMP?).Haetal.(2010)makethesignificanceofthisclearwhentheystatethat“asaresult[ofdatalimitations],thelevelofuncertaintyandthemagnitudeoferrorsinregionalCGEmodelsmaybehigherthanthoseinnational-levelmodels.”
Charney(2010c)observesthatinSTAMP,thelackofnecessarydatahassometimesbeendealtwithbymakingwhatareessentially“arbitrary”assumptionsabouttheresponsivenessofcertainunstudiedpartsoftheeconomytochangesinprices.3
STAMP seeks to quantify how roughly 6,000 relationships (or “flows”) are playing out between roughly 80 different economic sectors. Unfortunately, the quality of data available on these thousands of relationships often leaves much to be desired.
...............2BHIhascreatedSTAMPmodelsforanumberofstates.Whilemostofthosemodelsareidentifiedashaving81sectors(andthus6,561flows),theVirginiamodelhas77sectors(and5,929flows)andtheNorthDakotamodelhas79sectors(and6,241flows).ThereappearstobeatypointhegenericSTAMPmodeldescriptionfoundontheBHIwebsiteasitclaimsthatthereareonly5,929flowsbetweenthe81sectors.Thisisamathematicalimpossibility.See:BHI,WhatisSTAMP?;BHI,2004;Tuercketal.,2012.
3InresponsetoaninitialroundofcriticismbyCharney,BHIinsisted,withminimalexplanation,that“thereisnothingarbitraryaboutthevaluesweassigntoelasticities”(BHI,2010).Charneythenelaboratedonhercriticism,notingthat:“Manufacturingsectorsrepresent14ofthe27non-governmentsectorsintheSTAMPmodel.Therestofthesectors(whichrepresentthebulkoftheeconomy)havenoestimatedimportelasticitiesintheliterature,soBHIarbitrarilysetthem.Theycouldhaveomittedimportelasticitiesforthesectorsforwhichtheyhadnoestimates,butchosenotto”(Charney,2010c).

CharneyalsoexplainsthatthepotentiallyseriousimpactofdatalimitationsislikelytogoundetectedinCGEmodelslikeSTAMP.WhileBHIclaimsthatits“calibration”process,wherebyitassignsvaluestothevariablesthatlinkthemodeleconomytogether“isanon-trivialstep,andisessentiallyawayofcheckingthatthemodelisworkingproperly,”Charneyexplainsthat:
[In CGE models] calibration is merely assigning values that fit the data. This is very different from the use of econometric statistical methods that have a whole assortment of statistical tests that can be used to test the valid-ity of each variable in an equation and the validity of each equation in a model. No such statistical tests exist for numbers determined by ‘calibration.’
ThedescriptionofCGEmodelsprovidedbyPurdueUniversity’sGlobalTradeAnalysisProjectmakesasimilarpoint:
While CGE models are quantitative, they are not empirical in the sense of econometric modeling : they are basi-cally theoretical, with limited possibilities for rigorous testing against experience.4
STAMP is an Unsound Tool 7
...............4GlobalTradeAnalysisProjectatPurdueUniversity.“GTAPModels:ComputableGeneralEquilibriumModelingandGTAP.”Availableat:https://www.gtap.agecon.purdue.edu/models/cge_gtap_n.asp.DownloadedonMay14,2014.

PUBLISHED STAMP RESULTS GO BEYOND INTENDED PURPOSE OF CGE MODELS
GivenallthelimitationsofCGEmodels,itshouldcomeaslittlesurprisethatmanyresearcherscautionagainstusingthemtoproducethekindsofveryspecificeconomicestimatesthatBHIregularlypublishes(andthatpolicyadvocatesandthemediaarelikelytolatchonto).
TheInter-AmericanDevelopmentBank,forexample,cautionsthatwhenworkingwithCGEmodels:“interpretationofresultsshouldbefocusedmoreonmagnitudes,directions,anddistributivepatternsratherthannumericoutcomesthemselves.”5CharltonandStiglitz(2004)similarlystatethat“wedonotplacemuchfaithintheactualvaluesderivedfromCGEanalysis.”AndDevarajanandRobinson(2002)explainthat“whereparticularestimatesfromCGEmodelshavebeeninfluential,theyhaveusuallybeenconfirmedbystudiesfromothermethods.Inothercases,CGEmodelshaveplayedtheroleofuncover-ingaparticularmechanismthathadnotbeenapparentbefore.”
InthecaseofSTAMP,however,the“mechanism”thatBHIbelievestobeofimportancehasalreadybeenprogrammedin:lowertaxesarealwaysaboontotheeconomy,whileincreasesinanytaxwillslowgrowth.Charney(2010c)explainsthat“theSTAMPmodelincorporateseveryconceivablenegativeconsequenceoftaxesthatcanbebuiltintoamodel,regardlessoftheleveloftaxesinthestate.Itisbuilttocomputenegativetaxeffects.”SomeofthewaysinwhichSTAMPhasbeencraftedtoachievethisresultareexplainedinthefollowingsections.
...............5Inter-AmericanDevelopmentBank.“CGEModelingServices,FrequentlyAskedQuestions.”Availableat:http://www.iadb.org/en/topics/trade/frequently-asked-questions-faqs,1284.html.DownloadedonMay14,2014.
8 Institute on Taxation & Economic Policy I May 2014

UNDERVALUING GOVERNMENT SERVICES
Taxesexistfirstandforemostasameansofpayingforpublicserviceslikeeducation,infrastructure,andpublicsafety—allofwhichareessentialtothefunctioningofanymoderneconomy.Becauseofthis,modelsthatseektoquantifytheeconomicimpactoftaxesmustcarefullyconsiderthevalueofpublicservicestotheeconomy,notjusttheircost.Asisexplainedinthissection,STAMP’smodelingofgovern-ment’sroleintheeconomyisunrealisticinwaysthatbiasitagainstanyproposalthatwouldraiserevenueforpublicservices,andinfavorofanyproposalthatwouldreducerevenueandgovernmentspending.
A Passive Role for Government
Charney(2010c)explainsthatSTAMPassignsgovernmentanoddlyindirectroleintheeconomy:“InSTAMP,governmentdoesn’tseemtohiredirectlynordoesitspendmoneyinawaythatwouldproducedirectjobsintheprivatesector.”Wing(2004)makesclearthatthisisacommonprobleminthesetypesofmodels,observingthatgovernment’sroleinCGEmodelsis“oftenpassive:tocollecttaxesanddisbursetheserevenuestofirmsandhouseholdsassubsidiesandlump-sumtransfers.”
Underthisconstruction,theeconomicbenefitoftaxesistrivialindeed.InSTAMP,governmentsimplycollectstaxesfromhouseholdsandthengivesthemoneybacktothem,makingthewholeexerciseessentiallypointless.Dr.PaulL.Dion,ChiefofRevenueAnalysisfortheRhodeIslandDepartmentofRevenue,explainsthatinSTAMP“therearenoindirectorinducedeffectsfromgovern-mentspending”(oreconomicrippleeffects)becausethemoneyisassumedtobespentoutbyhouseholdsinmuchthesamewaythatitwouldhavebeeniftherevenuewasnevercollectedinthefirstplace.6Infact,itappearsthatgovernmentspendinghasanegativeeconomic
impactinSTAMPbecauseBHIassumesthateachofthetransferpaymentsithasdreamedupactuallyreduceshouseholds’workeffort.7
In STAMP, government simply collects taxes from households and then gives the money back to them, making the whole exercise essentially pointless. In fact, it appears that government spending has a negative economic impact in STAMP because BHI assumes that each of the transfer payments it has dreamed up actually reduces households’ work effort.
...............6PresentationbyPaulL.Dion,Ph.D.MeetingoftheSpecialJointLegislativeCommissiontoStudytheSalesTaxRepealActof2013.December3,2013.Availableat:http://www.rilin.state.ri.us/CapTV/Pages/default.aspx.Thisdiscussionbeginsatminute15:40.
7Theelasticityvaluesrepresenting“householdresponsetotransferpayments”rangefrom-0.02to-0.05(BHI,WhatisSTAMP?).
STAMP is an Unsound Tool 9

Mischaracterizing Government Spending
ThissimplisticportrayalofgovernmentisamajorshortcomingoftheSTAMPmodelbecausegovern-mentsspendtheirmoneyonverydifferentthingsthanhouseholds,andthosedifferenceshaveimportantimplicationsfortheeconomiceffectsofthatspending.Mostimportantly,statestypicallydirectmoreoftheirspendingtowardlabor-intensiveservicesthanhouseholdsdo,andtheyconfinemoreoftheirspend-ingtowithinthestate’sborder.Charney(2010c)explainsinresponsetoaSTAMPanalysisofasalestaxchangeproposedinherhomestateofArizona:
[Government] services employ more people per million dollars of expenditures than most other types of house-hold expenditures. I don’t think this is a hard concept for most people to understand. Using an extreme example, a one million dollar purchase of wide screen televisions will not create as many jobs in Arizona as spending one million dollars on education because the televisions aren’t produced here and only the retail margin is retained in the state. STAMP lacks a sufficient mechanism to convert government spending to actual jobs.
A Nearsighted View of Public Services
ButSTAMP’slackofrealismindescribinghowgovernmentspendingactuallyoccursishardlyitsonlyshortcominginthisarea.Charney(2010c)alsoexplainshowSTAMPfailstoacknowledgeanylong-termroleforgovernmentintheeconomy:
Unfortunately, there is complete silence in the [STAMP] document about investment in human capital. They model nothing about the long-term effects of public education expenditures on human capital or on the supply of different labor skills. This is a major shortcoming for a model that is all about incentives, investment decisions and long-run production effects. Education is a major portion of state and local government expenditures and yet its role in long-run accumulation of human capital is totally ignored. Thus they ignore the long-run economic disadvantages of an area that has a poorly educated workforce associated with major reductions in education expenditures.
ThispointwasalsounderscoredbyDr.DionduringahearinginwhichtheSTAMPmodelwasdiscussedindetail:
What about the impact on reductions in, say, education spending on… do you have a human capital function anywhere in there, or the labor force quality, or something that would have a negative impact? … If it’s true that there’s education spending that improves human capital, that’s then used by firms, for example in their labor demand. To the extent that those two are correlated there’s going to be some reduction obviously in the quality of labor as education spending declined. Assuming they are correlated.8
...............8MeetingoftheSpecialJointLegislativeCommissiontoStudytheSalesTaxRepealActof2013.October21,2013.Availableat:http://www.rilin.state.ri.us/CapTV/Pages/default.aspx.Thisdiscussionbeginsatminute52:40.
10 Institute on Taxation & Economic Policy I May 2014

InresponsetoDr.Dion,BHI’sPaulBachmanrespondedthat“wedonot”accountforthisissueinSTAMP,andthatadditionaleducationspending“atthemargin”doesnotactuallyimproveeducationorlaborforcequality.9BHI’sassumptionsonthisissuewerealsohintedatina2013reportinwhichtheyarguedagainstaMassachusettstaxpackagethatwouldhaveboostedinvestmentsineducationandinfra-structure(Candelaetal.,2013):
Infrastructure and education spending are important but beyond a certain level both initiatives meet head on with the law of diminishing returns … increased government spending on transportation and education is not only inefficient, but is also susceptible to politically vested interests, mismanagement, and cost overruns.
Thisassumption,whileperfectlyinlinewithBHI’sstatedmis-siontopromote“limitedgovernment,”isamajorreasonwhySTAMPconsistentlyportraysstatetaxesasbeingharmfultoeconomicgrowth.10InSTAMP,theservicesbeingpaidforwithtaxes,atthemargin,aresimplyunimportanttotheeconomy.
AndtaxplansthatBHIadmitswouldrequireeliminatingasmanyas20,000positionsfilledbyteachers,firefighters,constructionworkers,andothergovernmentemployeesaredepictedasbeingofgreatbenefittostateeconomies(Tuercketal,2008).Byassumingthatspendingcanbecutwithouthavingtomakemeaningfulsacrificesintermsofinfrastructurequalityorthequalityofthelaborpool,STAMPviewstaxcutsasafreelunch,andtaxincreasesasaneconomically“inefficient”waytoreward“politicallyvestedinterests.”
A Murky View of Government Jobs
ThelackofrealisminBHI’smodelingoftheimpactsofpublicsectorspendingisespeciallyapparentinhowitassumestaxchangeswillaffectgovernmentemployment.Inmanyofitsstudies,BHIsimplyavoidsanymentionofthefactthatgovernmentspendingcutswillrequirelayoffsorhiringfreezesthatwillaffectthetotalnumberofjobsavailableinthestate.StudiesproducedbyBHIinMaineandRhodeIslandreportonlytheimpactoftaxchangeson“privatejobs”or“privateemployment,”whileotherstudiesinMassachusetts,Michigan,NorthCarolina,andtheDistrictofColumbiareportonlyan“employment”figure,withoutanyindicationastowhetherthisfigureincludeschangesinpublicsectorjobs.
EquallytroublingisthehighdegreeofinconsistencypresentinthosestudieswhereBHIdoesattempttoesti-matetheimpactoftaxchangesonpublicsectoremployment.AsseeninFigure1onthefollowingpage,dif-ferentSTAMPstudieshavereachedverydifferentconclusionsabouttheimpactthatadollarofgovernmentspendinghasonthepublicsectorworkforce.Specifically,BHIseemstothinkthata$1millioncut(orincrease)ingovernmentspendingcouldresultingovernmenteliminating(oradding)anywherebetween
STAMP views tax cuts as a free lunch, and tax increases as an economically “inefficient” way to reward “politically vested interests.”
...............9Ibid.10StatementofMissionoftheBeaconHillInstituteaslistedontheSuffolkUniversityCollegeofArts&ScienceswebsiteasofMay14,2014.Avail-ableat:http://www.suffolk.edu/college/centers/14500.php.
STAMP is an Unsound Tool 11

1and37jobs.11Therearegoodreasonsthatthisfigureshouldvarybetweenstatesandbetweendifferenttaxpolicies—suchasdifferencesinpublicsectorpay,theshareofpublicbudgetsdevotedtowagesandsalaries,andthededicationofsometaxrevenuestospecificpurposes.ButthehugedegreeofvariationinBHI’sfindingsraisesquestionsabouttheirreliability.
Totakejustafewexamples,a2009studyofMassachu-settsthatusedtheSTAMPmodelfoundthatasalestaxincreaseitbelievedwouldraise$649millioninrevenuewouldleadtothecreationof6,087governmentjobs.AfewyearslaterinneighboringRhodeIsland,however,asalestaxeliminationproposalexpectedtohaveamuchsmallerimpactonrevenuecollections(resultinginjust$163millioninforegonerevenue)wasprojectedbyBHItoresultintheeliminationofaverysimilar6,000governmentjobs.Inotherwords,whileeach$1millioncutfromRhodeIsland’sbudgetwouldrequirelaying-offalmost37employees,each$1milliongainforMassachusetts’cofferswouldresultinthehiringofjust9employees.ThatfindingmayhavemadesenseifitsomehowcostfourtimesasmuchtoemployagovernmentworkerinMassachusettsascomparedtoRhodeIsland,buttherealityisthatgovernmentsalariesareactuallyslightlyhigherinRhodeIsland.12
Thepicturegetsevenmoreincoherentifonecomparesthesestudiestoa“comprehensivebusinesstaxreform”forMassachusettsthatBHIproposedin2008.Thatreformwouldhavecutintocombinedstateandlocalrevenuesbysome$79millionaccordingtoBHI,whilemiraculouslyrequiringjust92layoffs—oralittlemorethanonelostjobpermilliondollarsinspendingcuts.
...............11ThefollowingSTAMPanalyseswerereviewedinconstructingFigure1:Angelinietal.,2008;Tuerck,2008;Bachman,2010;BHI,2009a;BHI,2009b;SCPC,2009;Tuercketal.,2010;RICFP,2010b.NotethatRICFP,2013bdidnotreportthenumberofpublicsectorjoblosses,butPaulBachmanoftheBeaconHillInstitutetoldtheRhodeIslandSpecialJointLegislativeCommissiontoStudytheSalesTaxRepealActof2013thatapproximately6,000governmentjobswouldbelost.
12Maynard,Melissa.“StateWorkers:WhatTheyEarn.”Stateline[Washington,DC]2July2013.Availableat:http://www.pewstates.org/projects/stateline/headlines/comparing-state-salaries-to-private-pay-85899487682.Datafor2012weredownloadedonMay14,2014.
StateYear of
analysis**Govt jobs per $1
millionMassachusetts CY09 1.2Massachusetts CY10 1.2Massachusetts CY11 1.2Massachusetts CY12 1.2Massachusetts CY13 1.2Massachusetts FY11 2.0
Washington CY13 7.4Massachusetts CY10 9.4Massachusetts CY10 9.4South Carolina FY10 10.1North Dakota 2015 13.2North Dakota 2010 14.0North Dakota 2015 14.1North Dakota 2015 14.4North Dakota 2010 15.2North Dakota 2010 15.2Rhode Island FY14 36.8
Figure 1: Government Jobs Created/Destroyed in STAMP Per $1 Million Revenue Gain/Loss*
* See footnote 11 for the list of BHI studies included in this analysis.
** "CY" = calendar year. "FY" = fiscal year. BHI's North Dakota study did not specify whether the years analyzed were calendar or fiscal years.
12 Institute on Taxation & Economic Policy I May 2014
HYPERSENSITIVITY TO INCOME TAX RATES
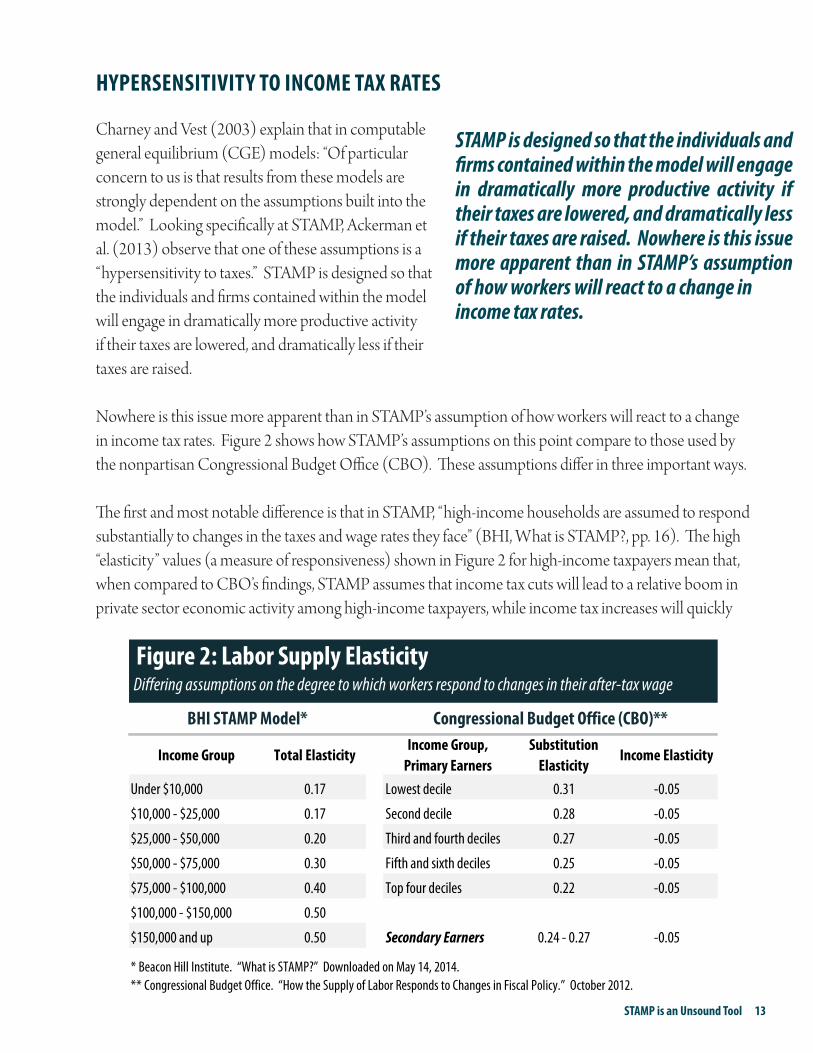
CharneyandVest(2003)explainthatincomputablegeneralequilibrium(CGE)models:“Ofparticularconcerntousisthatresultsfromthesemodelsarestronglydependentontheassumptionsbuiltintothemodel.”LookingspecificallyatSTAMP,Ackermanetal.(2013)observethatoneoftheseassumptionsisa“hypersensitivitytotaxes.”STAMPisdesignedsothattheindividualsandfirmscontainedwithinthemodelwillengageindramaticallymoreproductiveactivityiftheirtaxesarelowered,anddramaticallylessiftheirtaxesareraised.
NowhereisthisissuemoreapparentthaninSTAMP’sassumptionofhowworkerswillreacttoachangeinincometaxrates.Figure2showshowSTAMP’sassumptionsonthispointcomparetothoseusedbythenonpartisanCongressionalBudgetOffice(CBO).Theseassumptionsdifferinthreeimportantways.
ThefirstandmostnotabledifferenceisthatinSTAMP,“high-incomehouseholdsareassumedtorespondsubstantiallytochangesinthetaxesandwageratestheyface”(BHI,WhatisSTAMP?,pp.16).Thehigh“elasticity”values(ameasureofresponsiveness)showninFigure2forhigh-incometaxpayersmeanthat,whencomparedtoCBO’sfindings,STAMPassumesthatincometaxcutswillleadtoarelativeboominprivatesectoreconomicactivityamonghigh-incometaxpayers,whileincometaxincreaseswillquickly
STAMP is designed so that the individuals and firms contained within the model will engage in dramatically more productive activity if their taxes are lowered, and dramatically less if their taxes are raised. Nowhere is this issue more apparent than in STAMP’s assumption of how workers will react to a change in income tax rates.
STAMP is an Unsound Tool 13
Figure 2: Labor Supply Elasticity
Income Group Total ElasticityIncome Group,
Primary EarnersSubstitution
ElasticityIncome Elasticity
Under $10,000 0.17 Lowest decile 0.31 -0.05
$10,000 - $25,000 0.17 Second decile 0.28 -0.05
$25,000 - $50,000 0.20 Third and fourth deciles 0.27 -0.05
$50,000 - $75,000 0.30 Fifth and sixth deciles 0.25 -0.05
$75,000 - $100,000 0.40 Top four deciles 0.22 -0.05
$100,000 - $150,000 0.50
$150,000 and up 0.50 Secondary Earners 0.24 - 0.27 -0.05
* Beacon Hill Institute. “What is STAMP?” Downloaded on May 14, 2014.** Congressional Budget Office. “How the Supply of Labor Responds to Changes in Fiscal Policy.” October 2012.
Congressional Budget Office (CBO)**BHI STAMP Model*
Differing assumptions on the degree to which workers respond to changes in their after-tax wage

dampenthosesamehouseholds’workeffort(CBO,2012).Inexplainingwhytheymadethisassump-tion,BHIsimplycites“theliterature”andtheirown“professionaljudgment”(BHI,WhatisSTAMP?,pp.16,35).CBO,bycontrast,releasedathoroughreviewofmorethantwodozenscholarlyarticles—thir-teenofwhichwerepublishedafterBHIfirstreleasedtheircurrentelasticityestimatesin2004(McClel-landandMok,2012).13
TheseconddifferenceisthatBHIassumesthatupper-incomeworkersaremuchmorelikelythantheirpoorerneighborstoseekoutajob,increasetheirhoursworked,orincreasetheirproductivityiftheirafter-taxwagerateisincreased.CBO’sliteraturereview,bycontrast,ledittoreachexactlytheoppositeconclusion.ThatreviewindicatedthattherelativelyfewstudiessupportingtheBHIpositionhavemis-interpretedaffluenttaxpayers’abilitytochangethetimingoftheirincomewithanactualchangeintheireconomicbehavior.
Thedropinreportedincomeamongupper-incometaxpay-ersthatsometimesfollowsataxincreasemayinitiallyseemtoindicatethatthosetaxpayershavedramaticallyslashedtheirhoursorresignedtheirpositions.Moreoftenthannot,however,thosetaxpayershaven’tchangedtheiractualworkeffort,andhaveinsteadsimplyadjustedtheschedule
bywhichtheycollectcertaintypesofincome,suchasstockoptions.Byinvertingrealityandclaimingthatupper-incometaxpayers,ratherthanthepoor,aremostsensitivetochangesintaxes,STAMPisdesignedtoshowthatregressivetaxproposalsareeconomicallybeneficial.AccordingtoSTAMP,theeconomythriveswhentaxesareshifteddownwardontolow-incomepeopleforwhomBHIallegestaxesmatterverylittle.Theseassumptionshavestackedthemodelnotjustagainstincometaxesingeneral,butalsoagainstprogressiveincometaxesinparticular.
Thirdandfinally,CBOusesamoresophisticatedsystemofelasticitymeasurementsthanBHI,involvingseparatetreatmentof“substitution”and“income”elasticities.SubstitutionelasticityistheissuethatBHItendstoemphasizewhenitclaimsthatraisingthetaxrateappliedtoataxpayer’snextdollarofearningswillreducetheirincentivetoworkforthatdollar.Incomeelasticity,ontheotherhand,worksinexactlytheoppositedirectionandrecognizesthatwhentaxpayersseetheirdisposableincomecutasaresultofataxincrease,theytendtoworkmoreinordertomaintaintheirpreviousstandardofliving.McClellandandMok(2012)pointoutthatsubstitutionandincomeelasticitiescannotsimplybeaddedtogetherintoonetotalelasticitymeasurebecauseanygiventaxpolicychangecanhaveverydifferenteffectsonmar-ginaltaxrates(whichmatterforsubstitutionelasticities)andaveragetaxrates(whichmatterforincomeelasticities).ItappearsthatSTAMPdoesnottakethisnuanceintoconsideration.
...............13Allofthehousehold-relatedelasticitiesfoundinBHI’smostrecentSTAMPbackgroundpaper(BHI,WhatisSTAMP?)areidenticaltothosepublishedintheFebruary2004descriptionoftheVirginia-STAMPmodel(BHI,2004).
These assumptions have stacked the model not just against income taxes in general, but also against progressive income taxes in particular.
14 Institute on Taxation & Economic Policy I May 2014

HYPERSENSITIVITY IN BUSINESSES’ DECISION-MAKING
WorkersarenottheonlygroupthatSTAMPassumesareverysensitivetochangesintheirtaxrates.InSTAMP,businesses’decisionscanbealteredinasimilarlydramaticfashionthroughchangesintaxpolicy.Ofparticularinteresthereiswhatisknownasthe“factorsubstitutionelasticity,”orthetendencyofbusi-nessestoswitchbetweenusingmoreworkers(labor),ormoremachinery(capital),tocarryouttheirbusinesswhenthecostofthoseinputschanges.
Ifthevalueofthiselasticityisassumedtobelarge,raisingthecostoflaborthroughahigherpayrolltaxwillcausebusinessestostartlayingoffworkersandmovingtowardamoreautomatedproductionprocess.Similarly,ifthecostofmachineryisraisedthroughsomethinglikeasalesorpropertytax,thenaccordingtoSTAMPbusinesseswillstopinvestinginnewmachineryandmayoptforamorelow-techapproach.Ineithercase,changesintaxratesareassumedtoproducelargeandharmful“distortions”intobusinesses’decision-makingprocesses.
AsisthecasewithmanyoftheeconomicvariablescontainedinSTAMP,itisnotcompletelyclearwhatvalueforthe“factorsubstitutionelasticity”bestapproximatestheworkingsoftheactualeconomy.BHIadmitsthatthereishugevariationintheliteratureonthispoint,citingvaluesaslowas0.15andashighas1.809(BHI,WhatisSTAMP?).Asinthecaseofthelaborsupplyelasticitiesreviewedintheprevioussection,however,BHIhasonceagainchosentoerronthesideofhighsensitivitytotaxchanges.Specifi-cally,BHI’schosenvaluesof0.8to0.9aresignificantlyhigherthanthe0.4to0.6valuefoundinaverydetailedandwidelycitedliteraturereview(Chirinko,2008).
Furtherresearchindicatesthatthisissueisofsignificantimportance.FoxandFullerton(1991)testedhowtheresultsofaCGEmodelchangedwhenthefactorsubstitutionelasticitywasvariedandfoundthat“theassumedvalueofthiselasticityhasgreaterimpactontheresultsofthepolicysimulationsthanalloftheadditionalmodelingcomplicationscombined.”AndChirinkoetal.(2004),Roegeretal.(2002),andEngen(1997)showedthatraisingthisvaluefrom0.5to1.0canincreasetheapparenteconomicimpactofataxchangebyasmuchas79percent.
STAMP is an Unsound Tool 15

CONSUMERS’ DECISION-MAKING IN STAMP BEARS LITTLE RESEMBLANCE TO REALITY
TheconsumptionhabitsoftheindividualsandfirmsmodeledinSTAMParebothoverlysimplisticandgenerallymoresensitivetotaxchangesthanmostevidencesuggests.OfparticularconcernisthewayinwhichconsumersinSTAMPquicklyanddramaticallyshifttheirconsumptiontowardout-of-stategoodsandservicesifpricesintheirownstateriseasaresultofataxincrease.Thisisnosmallissue,asanalysesofsub-nationaleconomieshaveshownthatthis“importelasticity”assumptioncanhaveasignificantimpactontheresultspro-ducedbyCGEmodels.Haetal.(2010)findthatwhenCGEmodelersuse“outdatedesti-matesfrompastliterature;oronly‘bestguesses’whennopublishedfiguresareavailable…anysimulationresultsarelikelytobeinaccurate.”ThisispreciselythecaseinSTAMP.
Injustifyingtheirchoiceofhowresponsiveconsumerswillbetochangesinprices,BHIcitesReinertandRoland-Holst(1992)andRoland-Holstetal.(1994),bothofwhichusednationalandinternationalleveldatapublishedmorethantwodecadesago.Thisisanoddchoicegiventhatintheyearssincethesestud-ieswerepublished,theU.S.CensusBureau,U.S.DepartmentofCommerce,andtheBureauofTranspor-tationStatisticshavecollaboratedtoproduce—andperiodicallyupdate—anewdatasetthatallowsforthesekindsofanalysestobedoneatthesub-nationallevel.14
Theseneweranalysessuggestthatthedecisiontopurchasegoodsproducedin-stateorout-of-stateisfarlesssensitivetopricechangesthanBHIassumes.Haetal.(2010)examinedhowconsumersrespondtochangesinthepriceofthirteencommoditiesintheIllinoiseconomy.NearlynineintenoftheelasticityvaluesestimatedinthatstudywerelowerthanthevaluethatBHIusesformostindustries(1.5).Infact,two-thirdsoftheelasticitieswerebelow1.0.15Bilgicet.al.(2002)reachedasimilarconclusion,with86percentoftheirelasticityestimatesbelowBHI’s1.5valueandmostfallingbelow1.0.16Inotherwords,BHIhaspluggedintoitsSTAMPmodelanassumptionthatconsumerswillreactmoredramaticallytochangesinpricesthanthemostrelevantstudieshavefound.
In justifying their choice of how respon-sive consumers will be to changes in prices, BHI cites studies using national and international level data published more than two decades ago. This is an odd choice given that newer analyses suggest that the decision to purchase goods produced in-state or out-of-state is far less sensitive to price changes than BHI assumes.
...............14TheCommodityFlowSurveyisavailableat:http://www.rita.dot.gov/bts/sites/rita.dot.gov.bts/files/publications/commodity_flow_survey/index.html.15Importelasticityvaluesforthirteenindustrieswereestimatedusingtwodifferentmodels.Outoftwenty-sixtotalestimatesproducedusingthesemodels,twenty-threefellbelow1.5andseventeenfellbelow1.0.16Outoftwenty-sixtotalelasticityestimates,eighteenfellbelow1.5andtwelvefellbelow1.0.
16 Institute on Taxation & Economic Policy I May 2014

MorepuzzlingthanBHI’sblindspottothenewestliteratureonthistopicisthatReinertandRoland-Holst(1992),whichBHIspecificallyclaimstohaveusedinsettingitselasticityvalues,findsameanimportelasticityofjust0.61(Charney,2010b).BHIobscuresthisfactintheirWhatisSTAMP?back-groundpaperbydrawingthereader’sattentiontowardtheoutliervalueof3.49thatReinertandRoland-Holst(1992)foundonlyforpurchasesof“wine,brandy,andbrandyspirits.”
TheproblemswithSTAMP’simportelasticityassumptionsbecomeevenmoreapparentwhenlookingatspecificcommodities.STAMP’s1.5elasticityforpurchasesoffoodproductsiswellabovethe0.5to1.28rangefoundinthesub-nationalstudiesreferencedabove(Haetal.,2010andBilgicet.al.,2002).STAMP’s1.5assumptionforapparelproductsissimilarlyfarabovethe0.068to0.45valuefoundinthatsub-nationalliterature.Similarly,Charney(2010b)explainsthatthe1.5elasticityvalueusedbySTAMPforutilitypurchasesisclearlyfartoohighbecauseutilityconsumers“can’tjustchoosetoimportmoreoftheirelectricityandnaturalgasfromoutofstate.Theyarestuckbuyingutilitiesfromlocalutilitycom-panies.”AndevenBHIitself,whenpressedbyCharney,concededthattheir1.5valuefor“elasticityofimportsmaybehighforsectorslikeconstruction”(BHI,2010).
STAMPassumesthattheconsumptiondecisionsoccurringinthevastmajorityofindustriescanbemodeledwithauniformelasticityassumptionof1.5.ThislackofvariabilityinSTAMP’selasticityvaluesacrossindustriesisinappropriatebothbecausetherearegoodtheoreticalreasonsthatthesevaluesshouldvaryacrossindustries(asintheexampleofutilitycompanies),andbecausethereareempiricalestimatesthatwouldhaveallowedBHItovarythesevalues(asseenwiththeapparelandfoodindustryvaluesprovidedabove).
STAMP is an Unsound Tool 17

IMMEDIATE IMPACTS ARE IGNORED
BHIfrequentlyreferstoSTAMPasa“five-year”model(BHI,WhatisSTAMP?).ThislabelsuggeststhatSTAMPiscapableofprovidinginformationabouttheimpactthatataxproposalwillhaveonrevenuesandjobcreationduringtheyearsimmediatelyfollowingitsenactment.Thisisnotthecase.
WhileBHIrarelymakesthispointknownintheirownreports,theirclientsattheRhodeIslandCenterforFreedomandProsperity(RICFP)feltitnecessarytoexplainthat“Itisimportanttoacknowledge…thatthedynamiceffectspredictedby[STAMP]derivefroman‘equilibriummodel.’Thatmeansthattheoverallchangeinjobsandtaxrevenueistheeffectonasingleyearofbaselinedataaftertheeconomyhasadjustedtothenewreality.Thatcouldtakesixmonths,oritcouldtake18months”(RICFP,2013b).Infactitcould,andverylikelywould,takesignificantlylongerthan18months.
The“newreality”projectedbySTAMPofteninvolvesmajordevelopmentssuchasthemigrationofasignificantnumberofpeopleintoastate,thecreationofnewbusinesses,thetransformationofexistingbusinesses’productionprocesses(seetheearlierdiscussionof“factorsubstitutionelasticity”),thecon-structionofnewbuildings,andanincreaseinpropertyvalues.17Noneoftheseeventstendtohappenveryquicklyintherealworld.18
UsingtheREMIPI+model,RhodeIsland’sOfficeofRevenueAnalysis(ORA)foundthattheimmedi-ate,firstyearimpactonprivatesectorjobsfromrepealingRhodeIsland’ssalestaxwouldbelessthanone-fifththesizeoftheimpactoccurringinthefifthyear,aftermoreoftheeconomicchangesjustdescribedhadtimetounfold.19Evenbythesecondyear(roughlyinlinewiththe18monthtransitionperiodthatRICFPacknowledgedwaspossible),lessthanhalfoftheeventualimpactontheRhodeIslandprivatesectorjobmarketwouldhavebeenrealized.
TakingtheSTAMPresultsatfacevalue,bycontrast,wouldleadthereadertobelievethattherewouldbelittledifferencebetweentheshort-andmedium-termimpactsofsalestaxrepeal.Infact,thefourthyear
...............17PaulBachmanofBHImentionedsomeoftheseeconomiceffectsthatheexpectedtooccurinthewakeofsalestaxrepealduring:MeetingoftheSpecialJointLegislativeCommissiontoStudytheSalesTaxRepealActof2013.October21,2013.Availableat:http://www.rilin.state.ri.usCapTV/Pages/default.aspx.Thisdiscussionbeginsatminute20:10.
18ThiscriticismhasbeenmadeofpreviousBHIreports.Leachmanetal.(2012)discusshowtwoseparateBHIpapers“concludethatifNorthDakotabannedpropertytaxes,newbusinessinvestmentinthestatewouldexplodealmostimmediately,growingbyathirdormoreinthefirstyearafterimplementation.Suchahuge,immediateboominbusinessinvestment…overandaboveNorthDakota’salreadyrapideconomicgrowth—ishighlyunlikely.”
19The926privatejobsgainedinYear1areequalto17.2percentofthe5,383privatesectorjobgainsforecastforYear5.PresentationbyPaulL.Dion,Ph.D.MeetingoftheSpecialJointLegislativeCommissiontoStudytheSalesTaxRepealActof2013.December3,2013.Availableat:http://www.rilin.state.ri.us/CapTV/Pages/default.aspx.
18 Institute on Taxation & Economic Policy I May 2014
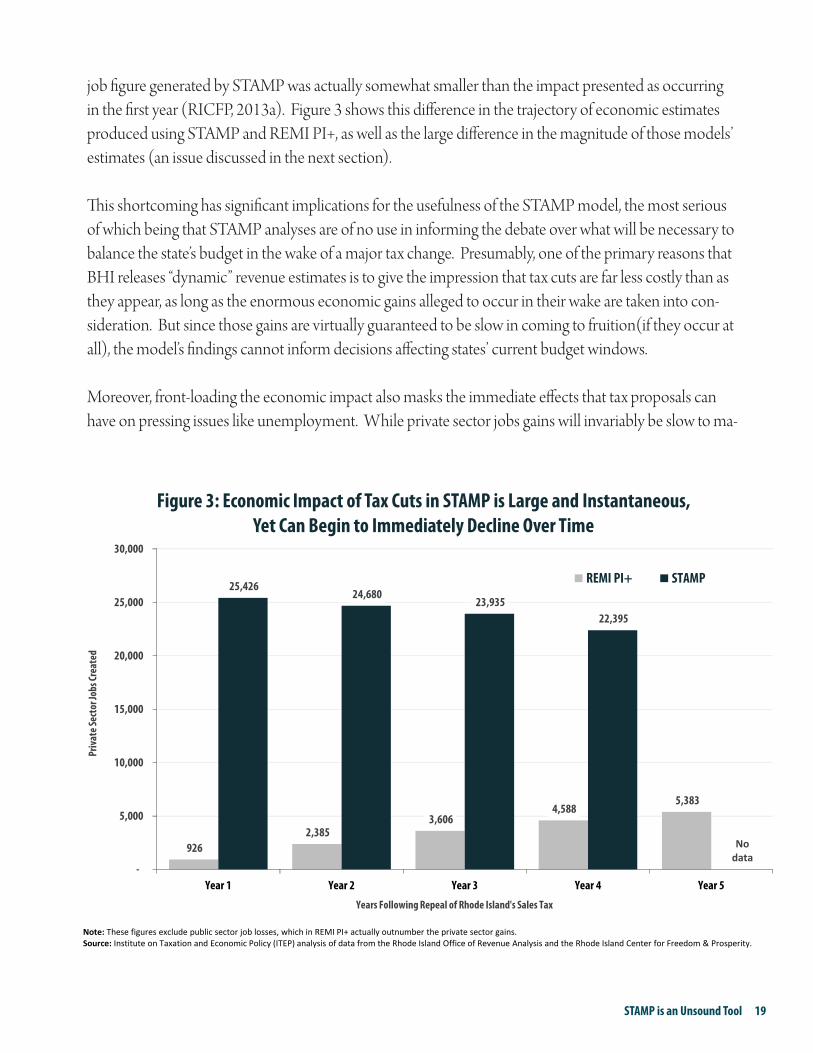
jobfiguregeneratedbySTAMPwasactuallysomewhatsmallerthantheimpactpresentedasoccurringinthefirstyear(RICFP,2013a).Figure3showsthisdifferenceinthetrajectoryofeconomicestimatesproducedusingSTAMPandREMIPI+,aswellasthelargedifferenceinthemagnitudeofthosemodels’estimates(anissuediscussedinthenextsection).
ThisshortcominghassignificantimplicationsfortheusefulnessoftheSTAMPmodel,themostseriousofwhichbeingthatSTAMPanalysesareofnouseininformingthedebateoverwhatwillbenecessarytobalancethestate’sbudgetinthewakeofamajortaxchange.Presumably,oneoftheprimaryreasonsthatBHIreleases“dynamic”revenueestimatesistogivetheimpressionthattaxcutsarefarlesscostlythanastheyappear,aslongastheenormouseconomicgainsallegedtooccurintheirwakearetakenintocon-sideration.Butsincethosegainsarevirtuallyguaranteedtobeslowincomingtofruition(iftheyoccuratall),themodel’sfindingscannotinformdecisionsaffectingstates’currentbudgetwindows.
Moreover,front-loadingtheeconomicimpactalsomaskstheimmediateeffectsthattaxproposalscanhaveonpressingissueslikeunemployment.Whileprivatesectorjobsgainswillinvariablybeslowtoma-
926 2,385
3,606 4,588
5,383
25,426 24,680
23,935 22,395
-
5,000
10,000
15,000
20,000
25,000
30,000
Year 1 Year 2 Year 3 Year 4 Year 5
Priv
ate S
ecto
r Job
s Cre
ated
Years Following Repeal of Rhode Island's Sales Tax
Figure 3: Economic Impact of Tax Cuts in STAMP is Large and Instantaneous, Yet Can Begin to Immediately Decline Over Time
REMI PI+ STAMP
No data
Note: These figures exclude public sector job losses, which in REMI PI+ actually outnumber the private sector gains.Source: Institute on Taxation and Economic Policy (ITEP) analysis of data from the Rhode Island Office of Revenue Analysis and the Rhode Island Center for Freedom & Prosperity.
STAMP is an Unsound Tool 19

20 Institute on Taxation & Economic Policy I May 2014
terializeforthereasonsmentionedabove,thesamecannotbesaidofchangesinpublicsectoremploy-ment.Ifalargetaxcutrequires$900millioninreducedspendinginnextfiscalyear,forexample,publicsectorlayoffs,furloughs,andhiringfreezeswillhavetobeginveryquicklyinordertobringstatespend-ingwithinthelimitsofthenewbudget.Thisisamajorreasonwhy,insharpcontrasttotheSTAMPanalysis,REMIPI+foundthatsalestaxrepealwouldhaveaparticularlyharmfulimpactonemploymentintheyearsimmediatelyfollowingitsenactment.Whilethelong-termimpactofsalestaxrepealwouldbealossof590jobsaccordingtoREMIPI+,theimpactduringthefirsttwelvemonthsafterimplemen-tationwouldbeanetlossofalmost7,500jobs.20
...............20ORA’sYear5estimateisthat5,383newprivatesectorjobswouldbemorethanoffsetbythelossof5,973stateandlocalgovernmentjobs(foranetlossof590jobs).ORA’sYear1estimateisthat926newprivatesectorjobswouldbemorethanoffsetby8,423publicsectorjoblosses(foranetlossof7,497jobs).SeePresentationbyPaulL.Dion,Ph.D.MeetingoftheSpecialJointLegislativeCommissiontoStudytheSalesTaxRepealActof2013.December3,2013.Availableat:http://www.rilin.state.ri.us/CapTV/Pages/default.aspx.
REMI AND STAMP TheeconomicmodelsmaintainedbyRegionalEconomicModels,Inc.(REMI)aremuchmorewidelyusedthanSTAMPforevaluatingtheeconomicimpactofstateandlocaltaxchanges.REMI’speer-reviewedPI+model,forexample,isusedbymoststategovernments,aswellasacademicresearchersandvariousfor-profitandnon-profitinstitutions.
LikeSTAMP,REMIhasacomputablegeneralequilibrium(CGE)component. Asaresult,itissubjecttosomeofthesameshortcomingsexplainedintheopeningsectionsofthispaper,suchasdatalimitationsanditsassumptionthattheeconomyiscapableofreachingastableequilibrium.
But REMI goes farther than STAMP in bringing together othermodeling techniques such as input-outputmodels,econometricmodels,andeconomicgeography. REMIdescribesthisapproachas“incorporatingthestrengthsofeachmethodologywhileovercomingitslimitations.”
Onearea inwhichREMIhasconstructedamorerealisticpictureoftheeconomythanSTAMPis in itsallowancefor“slack”intheeconomy—suchastheexistenceofinvoluntaryunemployment.Asexplainedearlier,STAMPassumesthateverybodywhowantsajobhasone.REMIisnotlimitedinthisway.
REMIalsooutperformsSTAMPinitsallowanceforgradualtransitionsinthewakeofapolicychange.STAMP,bycon-trast,presentseconomic impacts asoccurring instantaneously, evenwhen thoseeconomic impacts involve inherentlylong-runphenomenasuchasworkermigrationorchangesinpropertyvalues.
Perhapsmostimportantlyofall,REMIrecognizesthatgovernmentsandhouseholdsdonotspendmoneyinthesameways,andthatthosedifferencesaffecttheeconomicimpactofeachsector’sspending.STAMP,ontheotherhand,assumesthatgovernmentspendingissimplyredistributedtohouseholdsandthenspentbythosehouseholdsonthetypicalthingstheybuyeveryday.ThisunrealisticdepictionofgovernmentspendingisoneofthemostglaringwaysinwhichSTAMPdepartsfromREMI,andfromreality.
Likeanyeconomicmodel,REMIisanimperfectrepresentationofreality.ButitcomesfarclosertoapproximatingtherealworldthandoesSTAMP.

STAMP RESULTS OUT OF LINE WITH OTHER STUDIES, PAST EXPERIENCE
Inlightoftheinformationcontainedinthisreport,thereiscausetobedeeplyskepticaloftheresultsproducedbyCGEmodelssuchasSTAMP.WritingaboutCGEmodelsingeneral,CharneyandVest(2003)notethat“itisnotclearhowaccuratetheyarequantitatively,”whileAckerman(2001)goesonestepfurther,explainingthat“thereisampleevidencetoshowthatforecastsbasedonCGEmodelshavebeenquiteinaccurate.”WhenthegeneralproblemswithCGEmodelsarecombinedwithadditionallimitationsandbiasescontainedspecificallyinSTAMP,itshouldcomeaslittlesurprisethatanalysespro-ducedusingtheSTAMPmodelhaveroutinelybeencalledintoquestion.
Arizona
InArizona,theproblemswithSTAMPwereonfulldisplaywhenitsresultswerefoundtobeindirectconflictwiththoseproducedusingmoremainstreammodelshousedattheUniversityofArizona(UA)andArizonaStateUniversity(ASU).AccordingtoSTAMP,atemporarysalestaxincreasebackedbyGovernorBrewerwouldresultinalossofover9,000jobs.UA’sIMPLANinput-outputmodelandASU’sREMImodel,however,eachestimatedthattheincreasewouldactuallysavemorethan8,000jobsonnetbyallowingthestatetoavoiddeepbudgetcutsafteritsrevenueswerebatteredbytheGreatRecession(Charney,2010aandHoffmanandRex,2009).VotersapparentlyagreedwiththeUA/ASUassessment,eventuallyapprovingthesalestaxhikebyamarginof64-36percent.21
Rhode Island
InRhodeIsland,thestoryisremarkablysimilar.Dr.PaulL.Dion,theheadofRhodeIsland’sOf-ficeofRevenueAnalysis(ORA),wasvisiblybaf-fleduponlearningthatSTAMPestimatedRhodeIslandcouldcreate19,426jobsbyeliminatingitssalestax.Henotedthat“we’verunmodelsourselvesandwefindverydifferentresultsfromwhatyouhave.”22Usingitsin-houseREMIPI+model,ORAfoundthatrepealingthesalestaxandpayingforitbyscalingbackpublicserviceswouldultimately
In an analysis worthy of the label “voodoo economics,” BHI estimated that a 57 percent sales tax reduction would actually raise $61 million in revenue on net.
...............21StateofArizonaOfficialCanvasforthe2010SpecialElection.Availableat:http://www.azsos.gov/election/2010/may_Special/2010_Spe-cial_Election_Official_Canvass.pdf.DownloadedonMay14,2014.
22BHI’spublishedestimateindicatesthatsalestaxrepealwouldcreate25,426jobs,butthisdoesnotincludetheroughly6,000publicsectorjoblossesthatBHIlaterconcededwouldhavetooccurinordertobalancethestate’sbudget.Dion’scommentwasmadeduring:MeetingoftheSpe-cialJointLegislativeCommissiontoStudytheSalesTaxRepealActof2013.October21,2013.Availableat:http://www.rilin.state.ri.us/CapTV/Pages/default.aspx.Minute45:46
STAMP is an Unsound Tool 21

leadtoalossof590jobsinthestate.23Evenifthesalestaxcouldsomehowberepealedwithoutaffect-ingthestatebudget,ORAfoundthatrepealwouldatmostleadtothecreationof10,649newjobs—orroughlyhalfthenumberthatSTAMPpredicted.
AsubsequentSTAMPanalysisofa57percentsalestaxcutinRhodeIsland(takingtheratefrom7to3percent)producedevenlessplausibleresults(RICFP,2013a).Inananalysisworthyofthelabel“voodooeconomics,”BHIestimatedthatthissharptaxreductionwouldactuallyraise$61millioninrevenueonnet.Specifically,the$516millionrevenuelossexpectedtoresultfromsuchachangewouldbemorethanoffsetbya$468million“dynamic”gaininstateincome,sales,andexcisetaxrevenuesanda$109milliongaininlocaltaxcollectionsasthestate’seconomyboomed.24TheresultwouldbeafreelunchforRhodeIslandtaxpayers:lowertaxeswithoutanyreductioningovernmentservices.25
ORAdidnotuseREMItoestimatethelocalrevenueimpactofcuttingthesalestaxrateto3percent,butitsstate-levelfindingsdifferedsharplyfromSTAMP.WhileSTAMPpredictedthatthestatewouldlosejust$48millioninrevenueaftertakingeconomicgrowthintoaccount,REMIforecastthatthestatelosswouldbemorethansixtimesthatsize,or$305millionperyear.26
Massachusetts
BHI’sanalyseshavealsobeendrawnintoquestioninitshomestateofMassachusetts.In2011,STAMPwasusedbyBHItoclaimthatthe“Romneycare”healthcarereformhadresultedintheeliminationof18,313jobsintheBayState.WhenFactCheck.orgpointedoutthatthestate’slargestbusinessgroup,aswellasDr.JonathanGruberoftheMassachusettsInstituteofTechnology(MIT),wereskepticalofthestudy’sfindings,oneoftheauthorsconcededthattheSTAMPanalysiscouldnotbeverifiedandsaidthatif“youwoulddoasurvey…youwouldprobablygetabetterpicture.”27...............
23ORAfoundthatthegainof5,383privatesectorjobsinYear5wouldbemorethanoffsetbythelossof5,973stateandlocalgovernmentjobsinthatsameyear.MeetingoftheSpecialJointLegislativeCommissiontoStudytheSalesTaxRepealActof2013.December3,2013.Availableat:http://www.rilin.state.ri.us/CapTV/Pages/default.aspx.
24AnadditionalproblemwiththiscalculationarisesinRhodeIslandbecausethisdegreeoflocalrevenuegainwouldlikelybeforbiddenundercur-rentstatewidelimitsonpropertytaxrevenuegrowth.Thisseemstobeaflawinhowthemodelwasused,however,ratherthanaproblemwiththemodelitself.SeeConversationbetweenbyPaulL.Dion,Ph.D.,MikeStenhouse,andJustinKatz.MeetingoftheSpecialJointLegislativeCommis-siontoStudytheSalesTaxRepealActof2013.December3,2013.Availableat:http://www.rilin.state.ri.us/CapTV/Pages/default.aspx.Minute150:39.
25AccordingtoBHI’scalculations,stategovernmentrevenuesareprojectedtodeclineby$48millionperyearunderthisscenario.Sincelocalitiesareprojectedtogain$109millioninrevenue,thestatecouldreducelocalaidbyanyamountbetween$48millionand$109millioninordertoavoidanycutsinpublicservicesateitherthestateorlocallevel.
26PaulL.Dion,Ph.D.“ModelingAlternativeSalesTaxProposals:ResponsetotheJointLegislativeCommissiontoStudytheSalesTaxRepealActof2013.”December13,2013.Slide12.
27Robertson,Lori.“Romney’sHealthCareLawKilledJobs?”FactCheck.org27Sept.2011.Availableat:http://factcheck.org/2011/09/rom-neys-health-care-law-killed-jobs/.
22 Institute on Taxation & Economic Policy I May 2014

Twoyearslater,STAMPfoundthatanincometaxhikeproposedbyGovernorDevalPatrickwouldhavearemarkablynegativeimpactonthestate’seconomy—costingit17,800jobs(Candelaetal.,2013).Drs.AlanClayton-MatthewsandBarryBluestoneofNortheasternUniversitystronglydisagreedwiththisas-sessment,arguingintestimonybeforethestatelegislaturethat:
The spending that is taken out of the private sector through increases in taxes will not result in slower economic growth in the next or coming fiscal years. In fact, the program will have a mild positive economic impact in the short-term. … A back-of-the-envelope multiplier analysis suggests that the short-run effect of the tax and spend-ing plan would be to raise state real gross domestic product by about one-quarter of one percent, not lower it. … these investments in our people and our infrastructure will [also] strengthen the state economy in the long run.28
Kansas
InKansas,aSTAMPanalysisrecentlyconcludedthatsizeableincometaxcutsenactedin2012willresultinthecreationofbetween33,430to41,690newjobs(Davidsonetal,2012).Whileitistooearlytoknowwhatthepreciseeconomiceffectsofthis“realliveexperiment”intaxpolicywillbe,theresultssofarcastseriousdoubtonSTAMP’sconclusions.29LeachmanandMai(2014)observethatgrowthinKansasjobs,incomes,andbusinessestablishmentshaslaggedthecountryasawholefollowingtheimple-mentationofthetaxcuts.Thesetrendshavenotgoneunnoticedinsideoroutsideofthestate.InApril2014,Moody’sInvestorsServicedowngradedthestate’screditrating,citingboththetaxcutsandthelackofrobusteconomicgrowthintheirwake:
The downgrade reflects Kansas’ relatively sluggish recovery compared with its peers, the use of non-recurring measures to balance the budget, revenue reductions (resulting from tax cuts) which have not been fully offset by recurring spending cuts, and an underfunded retirement system for which the state is not making actuarially required contributions. … The phasing in of increasing income tax cuts, along with rising pension costs, will continue to exert pressure on the budget.30
...............28Clayton-Matthews,AlanandBarryBluestone.“TestimonyPresentedtotheJointCommitteeonRevenueRelativetotheNeedtoRaiseRevenuesandRelatedTaxIssues.”Boston,Massachusetts.March26,2013.
29This“realliveexperiment”descriptionofthetaxcutpackagewasfirstusedbyKansasGovernorSamBrownback.SeeRothschild,Scott.“Brown-backgetsheatfor‘realliveexperiment’commentontaxcuts.”LawrenceJournal-World19June2012.Availableat:http://www2.ljworld.com/news/2012/jun/19/brownback-gets-heat-real-live-experiment-comment-t/.
30Moody’sInvestorsService.“RatingAction:Moody’sdowngradesKansasissuerratingtoAa2fromAa1,notchedratingstoAa3fromAa2andKDOThighwayrevenuebondstoAa2fromAa1;outlookstable.”GlobalCreditResearch,NewYork.April30,2014.Availableat:https://www.moodys.com/research/Moodys-downgrades-Kansas-issuer-rating-to-Aa2-from-Aa1-notched--PR_298383.
STAMP is an Unsound Tool 23

Moody’swentontoexplainthatitsanalysiswasnotnarrowlyfocusedonthestate’sshort-termoutlook,andsaidthatgoingforward,Kansas’economy“islikelytounderperformthenationduetosluggishnessinkeymanufacturingsectors.”Theagencyalsocautionedthatfurtherdowngradescouldresultifthestatechoosestorelyon“aggressivegrowthassumptionsbasedoneliminationofincometax.”31Inotherwords,itwouldbefiscallyirresponsibleforlawmakerstoputtheirtrustinthekindsofrosyeconomicprojectionsproducedbySTAMPwhentheyarecraftingfuturestatebudgets.
Other states
TheaboveexamplesshouldcomeaslittlesurprisegiventhatthereisampleevidencethatstatetaxcutshavenotbeenthemagiceconomicelixirthatSTAMPconsistentlypredicts.Lookingbackattheeco-nomicfortunesofthosestatesthatenactedthelargestpersonalincometaxcutsinthe2000’s,Leachmanet.al.(2013)observethat:
Of the six states that enacted large personal income tax cuts in the years before the recession, three states saw their economies grow more slowly than the nation’s in subsequent years, and the other three saw their economies grow more quickly. The three that grew quickly are all major oil-producing states that benefitted from a sharp rise in oil prices in the years after they implemented their tax cuts. In other words, all of the lesser- and non-oil-produc-ing states that enacted big personal income tax cuts in the 2000s grew more slowly than the national average.
Thisfindingisconsistentwithnumerousacademicstudiesthathavefoundstatetaxestohaveeitheranegligibleeffectoneconomicgrowth,ornomeasurableeffectatall(Mazerov,2013).
InunderstandingwhytherelationshipbetweentaxesandgrowthismorecomplexthantheSTAMPmodelsuggests,itisimportanttokeepinmindthattaxesdonotexistfortheirownsake.Lowertaxescomeatthepriceoflessspendingoneducationoralessefficienttransportationnetwork—outcomesthataredetrimentaltoanystate’seconomy.BHI’sSTAMPmodel,however,doesnotallowforthepossi-bilitythattaxesareanythingbutadragoneconomicgrowth.AsCharney(2010c)explains,“theSTAMPmodelincorporateseveryconceivablenegativeconsequenceoftaxesthatcanbebuiltintoamodel,regardlessoftheleveloftaxesinthestate.Itisbuilttocomputenegativetaxeffects.”
...............
31Ibid.
24 Institute on Taxation & Economic Policy I May 2014

CONCLUSION
STAMP’s flimsy foundation, biased assumptions, and highly questionable results are ample reason to avoid using it as a tool for understanding how changes to a state’s tax system will affect its economy. STAMP is designed in such a way that it almost invariably portrays tax cuts as being good for state economies, despite the fact that more mainstream economic models, academic studies, and states’ actual experience with tax cuts do not support such a finding.
STAMP is an Unsound Tool 25

REFERENCES: BEACON HILL INSTITUTE REPORTS AND ANALYSES
Angelini, J. P., F. Conte, Alfonso Sanchez-Penalver, and D. G. Tuerck. (2008). ‘Business Taxes in Massa-chusetts: Toward Fundamental Reform.’ Beacon Hill Institute. Available at: http://www.beaconhill.org/BHIStudies/BizTaxReformMA08/BHICorporateTaxReform080408.pdf.
Bachman, P. (2010). ‘The Economic Impact of Initiative 1098 in Washington State.’ The Evergreen Free-dom Foundation. Available at: http://www.myfreedomfoundation.com/doclib/PHI-1098.pdf.
Beacon Hill Institute (BHI). ‘What is STAMP?’ Available at: http://www.beaconhill.org/STAMP-Meth-od/STAMP.pdf. Downloaded on May 14, 2014.
Beacon Hill Institute (BHI). (2004). ‘Virginia-STAMP: A Sophisticated Tax Model for Virginia.’ Available at: http://www.thomasjeffersoninst.org/pdf/articles/va-stampreport.pdf.
Beacon Hill Institute (BHI). (2009a). ‘Massachusetts Sales Tax Hike Would Destroy 10,000 Jobs and $41 million in Investment.’ BHI FaxSheet. Available at: http://www.beaconhill.org/FaxSheets/2009/MA-SalesTaxHikeProposa090417.pdf.
Beacon Hill Institute (BHI). (2009b). ‘Massachusetts Sales Tax Hike Would Destroy 12,000 Jobs and $51 million in Investment.’ BHI FaxSheet. Available at: http://www.beaconhill.org/FaxSheets/2009/MA-SalesTaxHikeRev0625.pdf.
Beacon Hill Institute (BHI). (2010). ‘The Beacon Hill Institute’s Tax Analysis Modeling Program: A Response to Charney.’ Available at: http://www.beaconhill.org/STAMP-Method/BHIRebuttalToChar-neyAZ10-0422.pdf.
Beacon Hill Institute (BHI). (2011). ‘The Impact of Bill 18-150 on the Economy of Washington, D.C.’ Available at: http://s3.amazonaws.com/atrfiles/files/files/BHI_Report.pdf.
Beacon Hill Institute and Pelican Institute for Public Policy (BHI and PIPP). (2013). ‘The Eco-nomic Benefits of Tax Reform in Louisiana.’ Policy Analysis. Available at: http://www.thepelicanpost.org/2013/03/26/new-study-governor-jindals-tax-reform-plan-benefits-louisiana-economy/.
Candela, R., F. Conte, and P. Bachman. (2013). ‘Proposed Tax Increases for Infrastructure and Education in the Commonwealth: An Economic Analysis.’ Beacon Hill Institute. Available at: http://www.beaconhill.org/BHIStudies/MA-FY2014/PatrickMAGovHiouse-SenateTaxReformProposals2013-0521.pdf.
Davidson, T., D. G. Tuerck, P. Bachman, and M. Head. (2012). ‘Tax Reform Gears Kansas for Growth: A dynamic analysis of additional revenue and jobs generated by tax reform.’ Kansas Policy Institute. Avail-
26 Institute on Taxation & Economic Policy I May 2014

able at: http://www.kansaspolicy.org/ResearchCenters/BudgetandSpending/BudgetandSpendingStud-ies/95638.aspx.
Goldwater Institute. (2010). ‘Lawmakers Consider Sending One-Cent Sales Tax Increase to Voters.’ Press Release. Available at: http://goldwaterinstitute.org/article/lawmakers-consider-sending-one-cent-sales-tax-increase-voters.
Haughton, J., J. Barrett, and S. Codreanu. (2003). ‘The Robustness of Regional Computable General Equilibrium Models.’ Department of Economics and Beacon Hill Institute, Suffolk University. Available at: http://www.beaconhill.org/STAMP-Method/RobustnessPaper1.pdf.
Rhode Island Center for Freedom & Prosperity (RICFP). (2013a). ‘Alternative Sales Tax Reduction Scenarios: Detailed Charts of RI-STAMP Results.’ Available at: http://www.rifreedom.org/wp-content/uploads/salestaxcommission-detailedscenarios-120213.pdf.
Rhode Island Center for Freedom & Prosperity (RICFP). (2013b). ‘Zero.Zero Sales Tax.’ Available at: http://www.rifreedom.org/wp-content/uploads/Zero-point-Zero-2013-final-wattachment.pdf.
South Carolina Policy Council (SCPC). (2009). ‘Proposed Cigarette Tax Increase to Cost SC 4,100 Private-Sector Jobs.’ Available at: http://www.scpolicycouncil.org/research/taxes/proposed-cigarette-tax-increase-to-cost-sc-4100-private-sector-jobs.
Thompson, M. W. (2013). ‘Tax Restructuring in Virginia.’ The Thomas Jefferson Institute for Public Policy. Available at: http://www.thomasjeffersoninst.org/files/3/TaxRestructuring4-13update.pdf.
Tuerck, D., S. Glassman, and P. Bachman. (2007). ‘Tax Changes in Michigan: Measuring the Effects of Expanding the Sales Tax to Services.’ Beacon Hill Institute. Available at: https://www.mackinac.org/ar-chives/2007/bhi%20report.pdf.
Tuerck, D., M. Head, P. Bachman, and A. Sanchez-Penalver. (2008). ‘Question 1: A Best-Case Scenario.’ Beacon Hill Institute Policy Study. Available at: http://www.beaconhill.org/BHIStudies/Question-1PIT-2008/Question1-081020Final.pdf.
Tuerck, D., P. Bachman, M. Head, and B. Narloch. (2010). ‘Eliminating Property Taxes in North Dakota.’ Beacon Hill Institute. Available at: http://www.policynd.org/images/uploads/ND-Stamp_Final.pdf.
Tuerck, D., P. Bachman, and M. Head. (2011a). ‘An Economic Analysis of State Tax Changes in North Carolina.’ Beacon Hill Institute Policy Study. Available at: http://www.johnlocke.org/site-docs/research/BHIpolicystudy050911.pdf.
STAMP is an Unsound Tool 27

Tuerck, D., P. Bachman, and M. Head. (2011b). ‘Maine’s Biennial Budget: Tax Cuts to Spur Job Growth.’ Beacon Hill Institute Policy Study. Available at: http://www.beaconhill.org/BHIStudies/Maine2011/BHI-METaxReport051711.pdf.
Tuerck, D., P. Bachman, and M. Head. (2012). ‘ND-STAMP: Methodology.’ Beacon Hill Institute. Avail-able at: http://www.policynd.org/images/uploads/ND_STAMP_Metho_2012.pdf.
Tuerck, D., P. Bachman, and M. Head. (2013). ‘A Consumed Tax Proposal for North Carolina.’ Beacon Hill Institute Policy Study. Available at: http://s3.amazonaws.com/cjtv-video/USATaxBHIAnalysis0113.pdf.
28 Institute on Taxation & Economic Policy I May 2014

ADDITIONAL REFERENCES
Ackerman, F. (2002). ‘Still dead after all these years: interpreting the failure of general equilibrium theory.’ Journal of Economic Methodology, 9(2): 119-139. Available at: http://ase.tufts.edu/gdae/Pubs/rp/Still-Dead02.pdf.
Ackerman, F., K. Gallagher, and A. Nadal. (2001). ‘The Limits of Economic Modeling in the FTAA Envi-ronmental Review.’ Globalization and Sustainable Development Program Background Paper. Medford, MA: Tufts University, Global Development and Environment Institute. Available at: http://www.ase.tufts.edu/gdae/policy_research/USTRComments&Summary.pdf.
Ackerman, F., and K. P. Gallagher. (2004). ‘Computable abstraction: General equilibrium models of trade and environment.’ In Ackerman, F., and A. Nadal. (eds.), The Flawed Foundations of General Equilibrium: Critical essays on economic theory, London, Routledge. Available at: http://digamo.free.fr/ackerman4.pdf.
Ackerman, F., T. Vitolo, E. A. Stanton, and G. Keith. (2013). ‘Not-so-smart ALEC: Inside the attacks on renewable energy.’ Synapse Energy Economics, Inc. Cambridge, MA. Available at: http://www.kftc.org/sites/default/files/docs/resources/synapse_alec_jan4.13.pdf.
Bell, W. P. (2009). ‘Adaptive interactive expectations: dynamically modeling profit expectation.’ Munich Personal RePEc Archive Paper No. 38260. Available at: http://mpra.ub.uni-muenchen.de/38260/.
Bilgic, A., S. King, A. Lusby, and D. F. Schreiner. (2002). ‘Estimates of U.S. Regional Commodity Trade Elasticities of Substitution.’ The Journal of Regional Analysis and Policy, 32(2): 79-98. Available at: http://www.jrap-journal.org/pastvolumes/2000/v32/32-2-3.pdf.
Charlton, A. H., and J. E. Stiglitz. (2004). ‘A Development-Friendly Prioritization of Doha Round Propos-als.’ Working Paper. Initiative for Policy Dialogue at Columbia University, Task Force on Trade. Available at: http://academiccommons.columbia.edu/catalog/ac:126715.
Charney, A. H. (2010a). ‘Sales Tax Increase vs. Expenditure Cuts: An Economic Impact Study.’ University of Arizona, Eller College of Management, Economic and Business Research Center. March 19, 2010. Avail-able at: http://ebr.eller.arizona.edu/research/articles/2010/sales_tax_increase_vs_expenditure_cuts.asp.
Charney, A. H. (2010b). ‘Comparison of UA, REMI, and STAMP Simulations of Tax/Spending Increases.’ March 30, 2010. Available at: http://ebr.eller.arizona.edu/research/articles/2010/compare_ua_remi_stamp_simulations.asp.
STAMP is an Unsound Tool 29

Charney, A. H. (2010c). ‘Response to: Beacon Hill Institute’s Tax Analysis Modeling Program: A Response to Charney.’ May 6, 2010. Available at: http://ebr.eller.arizona.edu/arizona_fiscal_issues/response%20to%20Beacon_Hill_tax_modeling%20_program.aspx.
Charney, A. H., and M. J. Vest. (2003). ‘Modeling Practices and Their Ability to Assess Tax/Expenditure Economic Impacts.’ Paper prepared for the October 2003 AUBER Conference in New Orleans. Available at: http://ebr.eller.arizona.edu/research/TaxModelingPractices.pdf.
Chirinko, R. S., S. M. Fazzari, and A. P. Meyer. (2004). ‘That elusive elasticity: a long-panel approach to estimating the capital-labor substitution elasticity.’ CESifo working papers, No. 1240. Available at: http://www.econstor.eu/bitstream/10419/18879/1/cesifo1_wp1240.pdf.
Chirinko, R. S. (2008). ‘σ: The Long and Short of It.’ Journal of Macroeconomics, 30(2): 671-686.
Congressional Budget Office (CBO). (2012). ‘How the Supply of Labor Responds to Changes in Fiscal Policy.’ Available at: https://www.cbo.gov/sites/default/files/cbofiles/attachments/10-25-2012-Labor_Supply_and_Fiscal_Policy.pdf.
Devarajan, S., and S. Robinson. (2002). ‘The Influence of Computable General Equilibrium Models on Policy.’ International Food Policy Research Institute, Trade and Macroeconomics Division Discussion Paper No. 98. Available at: http://ageconsearch.umn.edu/bitstream/16267/1/tm020098.pdf.
Engen, E. (1997). ‘Dynamic Tax Models: Why They Do The Things They Do.’ National Tax Journal, 50(3), 657-682. Available at: http://ntj.tax.org/wwtax/ntjrec.nsf/0/a4ae09c03add63d385256863004a5949/$FILE/v50n3657.pdf.
Fox, T., and D. Fullerton. (1991). ‘The irrelevance of detail in a computable general equilibrium model.’ Economics Letters, 36: 67-70. Available at: http://works.bepress.com/don_fullerton/51/.
Ha, S. J., K. Turner, G. Hewings, P. McGregor, and J. K. Swales. (2010). ‘Econometric estimation of Arm-ington import elasticities and their system-wide impact in a regional CGE model of the Illinois economy.’ Stirling Economics Discussion Paper 2010-19. University of Stirling Management School. Available at: https://dspace.stir.ac.uk/handle/1893/2707.
Hoffman, D., and T. Rex. (2009). ‘The Economic Effects of Government Spending Reductions Relative to Other Options: A Report from the Office of the University Economist.’ W.P. Carey School of Business, Arizona State University. Available at: http://wpcarey.asu.edu/seidman/reports/UnivEconomist/EconEf-fects_Feb09.pdf.
Johnson, L. T. (2013). ‘Critiquing the Methodology of the Beacon Hill STAMP Model.’ In White, S. W., C. Steger, and K. Narita, The Renewable Portfolio Standard Works for Kansas: Revealing the Distortion in the Kansas Beacon Hill Report, KEIN and NRDC. Available at: http://www.nrdc.org/energy/renewable-portfolio-standards/files/RPS-KS-rebuttal-IB.pdf.
30 Institute on Taxation & Economic Policy I May 2014

Kirman, A. (1989). ‘The Intrinsic Limits of Modern Economic Theory: The Emperor Has No Clothes.’ The Economic Journal, 99(395): 126-139, Supplement: Conference Papers. Available at: https://server1.tepper.cmu.edu/Phd/GE/kirman.pdf.
Leachman, M., P. Oliff, and A. Heiman. (2012). ‘North Dakota’s Measure 2: High Risk for Little Reward.’ Center on Budget and Policy Priorities. Available at: http://www.cbpp.org/cms/?fa=view&id=3776.
Leachman, M., M. Mazerov, V. Palacios, and C. Mai. (2013). ‘State Personal Income Tax Cuts: A Poor Strat-egy for Economic Growth.’ Center on Budget and Policy Priorities. Available at: http://www.cbpp.org/cms/?fa=view&id=3936.
Leachman, M., and C. Mai. (2014). ‘Lessons for Other States from Kansas’ Massive Tax Cuts.’ Center on Budget and Policy Priorities. Available at: http://www.cbpp.org/cms/index.cfm?fa=view&id=4110.
Mazerov, M. (2013). ‘Academic Research Lacks Consensus on the Impact of State Tax Cuts on Eco-nomic Growth.’ Center on Budget and Policy Priorities. Available at: http://www.cbpp.org/cms/index.cfm?fa=view&id=3975.
McClelland, R., and S. Mok. (2012). ‘A Review of Recent Research on Labor Supply Elasticities.’ Congres-sional Budget Office Working Paper 2012-12. Available at: http://www.cbo.gov/sites/default/files/cbo-files/attachments/10-25-2012-Recent_Research_on_Labor_Supply_Elasticities.pdf.
Mitra-Kahn, B. H. (2008). ‘Debunking the Myths of Computable General Equilibrium Models.’ Schwartz Center for Economic Policy Analysis Working Paper 2008-1. Available at: http://www.newschool.edu/scepa/publications/workingpapers/SCEPA%20Working%20Paper%202008-1%20Kahn.pdf.
Reinert, K. A., and D. Roland-Holst. (1992). ‘Armington Elasticities for United States Manufacturing Sec-tors.’ Journal of Policy Modeling, 14(5): 631-639.
Roeger, W., J. I. T. Veld, and D. I. A. Woehrmann. (2002). ‘Some Equity and Efficiency Considerations of International Tax Competition.’ International Tax and Public Finance, 9(1): 7-31.
Roland-Holst, D. W., K. A. Reinert, and C. R. Shiells. (1994). ‘A General Equilibrium Analysis of North American Economic Integration.’ Modeling Trade Policy: Applied General Equilibrium Assessments of North American Free Trade. Cambridge University Press.
Stiglitz, J. E. (2000). ‘The Contributions of the Economics of Information to Twentieth Century Eco-nomics.’ The Quarterly Journal of Economics, 115(4): 1441-1478. Available at: http://ricardo.ecn.wfu.edu/~cottrell/papers/stiglitz.pdf.
Wing, I. S. (2004). ‘Computable General Equilibrium Models and Their Use in Economy-Wide Policy Analysis.’ MIT Joint Program on Science and Policy of Global Change, Technical Note No. 6. Available at: http://web.mit.edu/globalchange/www/MITJPSPGC_TechNote6.pdf.
STAMP is an Unsound Tool 31