Stage-Discharge Relations for the Colorado River in Glen ... · Stage-Discharge Relations for the...
11
U.S. Department of the Interior U.S. Geological Survey Open-File Report 2006-1243 Stage-Discharge Relations for the Colorado River in Glen, Marble, and Grand Canyons, Arizona, 1990-2005
Transcript of Stage-Discharge Relations for the Colorado River in Glen ... · Stage-Discharge Relations for the...

U.S. Department of the InteriorU.S. Geological Survey
Open-File Report 2006-1243
Stage-Discharge Relations for the Colorado River in Glen, Marble, and Grand Canyons, Arizona, 1990-2005
Stage-Discharge Relations for the Colorado River in Glen, Marble, and Grand Canyons, Arizona, 1990-2005
By Joseph E. Hazel, Jr.1, Matt Kaplinski1, Rod Parnell1, Keith Kohl2, and David J. Topping2
1Department of Geology, Northern Arizona University, Flagstaff, AZ 2U.S. Geological Survey, Flagstaff, AZ
Prepared in cooperation with Northern Arizona University
Open-File Report 2006–1243
U.S. Department of the InteriorU.S. Geological Survey

U.S. Department of the InteriorDIRK KEMPTHORNE, Secretary
U.S. Geological SurveyMark D. Myers, Director
U.S. Geological Survey, Reston, Virginia: 2007
For product and ordering information: World Wide Web: http://www.usgs.gov/pubprod Telephone: 1-888-ASK-USGS
For more information on the USGS—the Federal source for science about the Earth, its natural and living resources, natural hazards, and the environment: World Wide Web: http://www.usgs.gov Telephone: 1-888-ASK-USGS
Any use of trade, product, or firm names is for descriptive purposes only and does not imply endorsement by the U.S. Government.
Although this report is in the public domain, permission must be secured from the individual copyright owners to reproduce any copyrighted materials contained within this report.
Suggested citation:Hazel, Joseph, E., Jr., Kaplinski, M., Parnell, R., Kohl, K., and Topping, D.J., 2006, Stage-Discharge Relations for the Colorado River in Glen, Marble, and Grand Canyons, Arizona: U.S. Geological Survey Open-File Report 2006-1243, 7 p.
iii
Contents
Abstract ...........................................................................................................................................................1Introduction.....................................................................................................................................................1
Purpose and Scope ..............................................................................................................................1Acknowledgments ................................................................................................................................2Physical Setting.....................................................................................................................................2
Data and Method Used in Formulating Stage-Discharge Relations .....................................................4Streamflow-Gaging Data .....................................................................................................................4Water-Surface Elevations ...................................................................................................................4Computation of Stage-Discharge Relations .....................................................................................5
Summary..........................................................................................................................................................6References Cited............................................................................................................................................6
Figures 1. Map showing study area, major tributaries and locations of U.S. Geological
Survey continuous-record streamflow-gaging stations, Colorado River, Glen Canyon Dam to upper Lake Mead, Arizona. ....................................................................2
2. Graph showing stage-discharge relation for the study site located at river mile 122.7R .....................................................................................................................................5
3. Graph showing stage-discharge relation for the study site located at river mile 68.8R .......................................................................................................................................5
Table 1. Site names, locations, and stage-discharge relations, Colorado River,
Glen Canyon Dam to Diamond Creek, Arizona. ........................................................................3
Conversion Factors
SI to Inch/Pound
Multiply By To obtain
Lengthcentimeter (cm) 0.3937 inch (in.)
meter (m) 3.281 foot (ft)
kilometer (km) 0.6214 mile (mi)
Flow ratecubic meter per second (m3/s) 70.07 acre-foot per day (acre-ft/d)
cubic meter per second (m3/s) 35.31 cubic foot per second (ft3/s)
cubic meter per second (m3/s) 22.83 million gallons per day (Mgal/d)
In this report, horizontal and vertical coordinate information is referenced to the North American Datum of 1983 (NAD 83).

AbstractThis report presents stage-discharge relations for 47
discrete locations along the Colorado River, downstream from Glen Canyon Dam. Predicting the river stage that results from changes in flow regime is important for many studies investi-gating the effects of dam operations on resources in and along the Colorado River. The empirically based stage-discharge relations were developed from water-surface elevation data surveyed at known discharges at all 47 locations. The rating curves accurately predict stage at each location for discharges between 141 cubic meters per second and 1,274 cubic meters per second. The coefficient of determination (R2) of the fit to the data ranged from 0.993 to 1.00. Given the various contrib-uting errors to the method, a conservative error estimate of ±0.05 m was assigned to the rating curves.
IntroductionClosure of Glen Canyon Dam in 1963 dramatically
altered the flow regime of the Colorado River in Grand Canyon National Park (GCNP) (U.S. Department of Inte-rior, 1995). The pre-dam flow regime exhibited large annual fluctuations and small daily variations. Operations of the dam intentionally cause daily fluctuations for hydropower genera-tion, while annual flow fluctuations are now substantially reduced. Although seasonal variations in the hydrograph have been flattened, daily discharge fluctuations generally occur over a much greater range than in the pre-dam era (Topping and others, 2003). The altered hydrograph has important con-sequences for the geomorphology and ecology of the Colorado River in GCNP, and the downstream riverine ecosystem is now the subject of a large-scale rehabilitation program called the Glen Canyon Adaptive Management Program (National Research Council, 1999). As part of this program, flow experi-ments are undertaken to benefit downstream resources.
The experimental designs proposed and implemented in the Glen Canyon Adaptive Management Program have increased the need to predict river stage at particular locations. Stage ranges and inundation levels are important for their potential effect on a wide variety of ecosystem components. In 1990, Northern Arizona University, in cooperation with the
U.S. Bureau of Reclamation’s Glen Canyon Environmental Studies (U.S. Department of Interior, 1995), began a project of surveying sandbars located along the Colorado River in GCNP (fig. 1). As part of this project, stage-discharge rating curves were developed by Northern Arizona University, in coopera-tion with the U.S. Geological Survey, from numerous surveys of water-surface elevation at known discharges. The rating curves have been used to (1) quantify changes in sandbar area and volume within specific stage elevation ranges (Kaplinski and others, 1995; Hazel and others, 1999; Hazel and oth-ers, 2006), (2) determine camping area as a function of stage elevation (Kaplinski and others, 2005), (3) calibrate ground water models (Springer and others, 1999; Sabol and Springer, 2005), (4) check the accuracy and set boundary conditions of hydraulic models that predict shoreline water-surface eleva-tions (Magirl and Breedlove, 2005; Wiele and Torrizo, 2003; Wiele and Torrizo, 2005); (5) predict flood-stage elevations and inundation levels at archeological sites (Draut and others, 2005), (6) determine impacts to habitat and associated endan-gered Kanab Ambersnail populations (Meretsky and others, 2000; Cox and others, 2005), (7) examine trout spawning-habitat preference as a function of discharge (Korman and oth-ers, 2005), and (8) investigate near-shore water temperatures (Korman and others, 2006).
Purpose and Scope
The purpose of this report is to present stage-discharge relations for 47 discrete locations in the Colorado River down-stream from Glen Canyon Dam to Diamond Creek, Ariz (table 1). The report describes an empirically based method of for-mulating stage-discharge relations by using surveys of water-surface elevations at known discharges. The results are of value for the prediction and execution of field experiments and other analyses of ecosystem responses to dam operations. The stage range of the relations is limited to the highest discharge in cubic meters per second (1,274 m3/s) observed during the study period, 1990-2005. The rating curves presented in this report predict local stage accurately, but are site-specific and cannot be applied elsewhere. In addition, infrequent rockfall or debris flows that alter channel geometry and river hydrau-lics can potentially alter the stage-discharge relations and by necessity will have to be accounted for.
Stage-Discharge Relations for the Colorado River in Glen, Marble, and Grand Canyons, Arizona, 1990-2005
By Joseph E. Hazel, Jr., Matt Kaplinski, Rod Parnell, Keith Kohl, and David J. Topping
Acknowledgments
We thank Grand Canyon National Park and Glen Canyon National Recreation area for permission to access study sites along the Colorado River. Numerous people provided field assistance, but we thank Eric Kellerup and Greg Sponenburgh in particular. The manuscript benefited from technical reviews by Amy Draut and Stephen Wiele, and thorough editorial reviews and revisions by Cathy Rubin and Keith Lucey.
Physical Setting
Locations on the Colorado River are traditionally defined by the river mile (RM) downstream from Lees Ferry, Arizona (RM 0). In this report, study sites are referred to by river mile location along the river centerline developed by the USGS Grand Canyon Monitoring and Research Center (U.S. Geolog-ical Survey, 2006). This river mile centerline was developed in a geographic information system (GIS) and is considered more accurate than previous river-mile estimates. One site is located in Glen Canyon, the reach between Glen Canyon Dam and Lees Ferry (RM -15 to 0). Twenty-one sites are located in Marble Canyon, the reach between Lees Ferry and the conflu-ence with the Little Colorado River (RM 0 to 61.7). Twenty-five sites are located in Grand Canyon, between the confluence
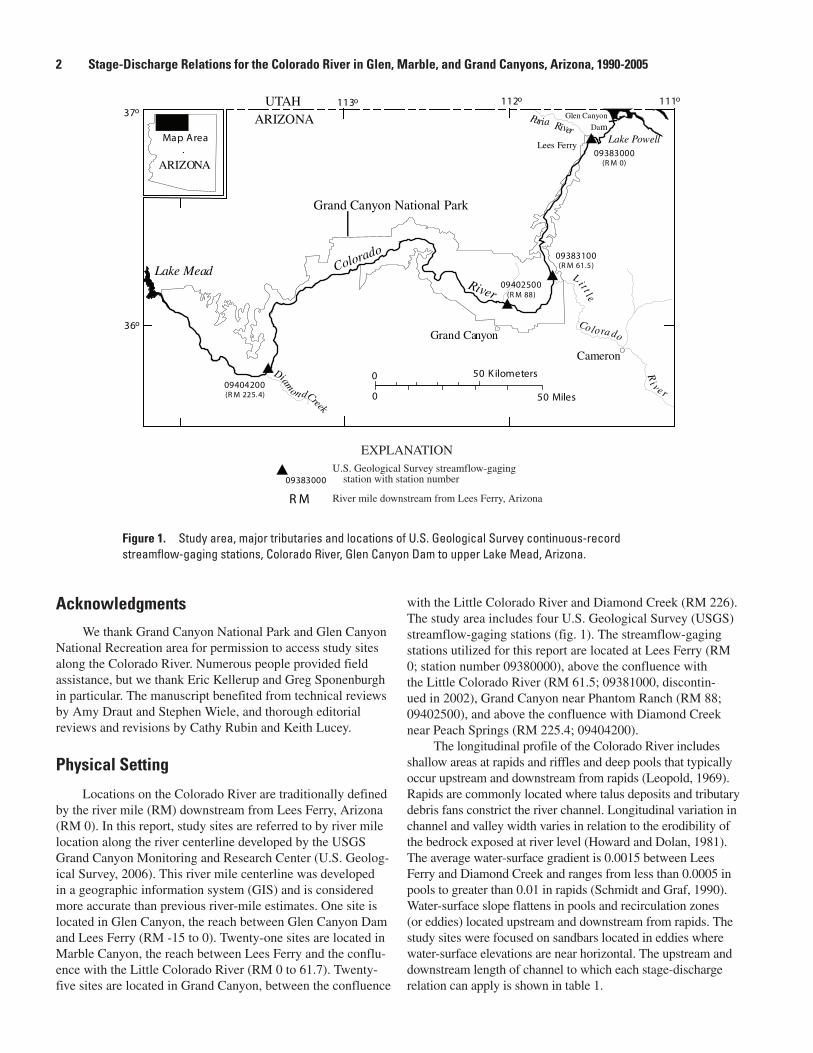
with the Little Colorado River and Diamond Creek (RM 226). The study area includes four U.S. Geological Survey (USGS) streamflow-gaging stations (fig. 1). The streamflow-gaging stations utilized for this report are located at Lees Ferry (RM 0; station number 09380000), above the confluence with the Little Colorado River (RM 61.5; 09381000, discontin-ued in 2002), Grand Canyon near Phantom Ranch (RM 88; 09402500), and above the confluence with Diamond Creek near Peach Springs (RM 225.4; 09404200).
The longitudinal profile of the Colorado River includes shallow areas at rapids and riffles and deep pools that typically occur upstream and downstream from rapids (Leopold, 1969). Rapids are commonly located where talus deposits and tributary debris fans constrict the river channel. Longitudinal variation in channel and valley width varies in relation to the erodibility of the bedrock exposed at river level (Howard and Dolan, 1981). The average water-surface gradient is 0.0015 between Lees Ferry and Diamond Creek and ranges from less than 0.0005 in pools to greater than 0.01 in rapids (Schmidt and Graf, 1990). Water-surface slope flattens in pools and recirculation zones (or eddies) located upstream and downstream from rapids. The study sites were focused on sandbars located in eddies where water-surface elevations are near horizontal. The upstream and downstream length of channel to which each stage-discharge relation can apply is shown in table 1.
37o111o112o113o
36o
Lake Mead
Lake Powell
Paria River
UTAHARIZONA
ARIZONA
Map Area
Grand Canyon National Park
Lit tle
Colora do
Ri v er
Cameron
Grand Canyon
Lees Ferry
Colorado
River
09383000(RM 0)
09383100(RM 61.5)
09402500(RM 88)
09404200(RM 225.4)
09383000
Glen Canyon
Dam
RM
Diam
on dCreek0 50 Miles
0 50 K ilometers
U.S. Geological Survey streamflow-gaging station with station number
River mile downstream from Lees Ferry, Arizona
EXPLANATION
Figure 1. Study area, major tributaries and locations of U.S. Geological Survey continuous-record streamflow-gaging stations, Colorado River, Glen Canyon Dam to upper Lake Mead, Arizona.
2 Stage-Discharge Relations for the Colorado River in Glen, Marble, and Grand Canyons, Arizona, 1990-2005

Table 1. Site names, locations, and stage-discharge relations, Colorado River, Glen Canyon Dam to Diamond Creek, Arizona—Continued
[Site names are given by location along the river mile (RM) centerline (U.S. Geological Survey, 2006) downstream from Lees Ferry, in Grand Canyon National Park except, -6.5R, which is in Glen Canyon National Recreation Area. L and R refer to the left and right bank as viewed in a downstream direction, respectively; extent, channel reach to which stage-discharge relation applies; Z, height in meters above the Geodetic Reference System of 1980/North American Datum of 1983 ellipsoid; Q, discharge; m3/s, cubic meters per second; the predicted stage change is given for the difference in water-surface elevation for discharges between 142 m3/s and 1,274 m3/s, in meters (m)]
Site Name (RM) Upstream Extent (RM) Downstream Extent (RM) Stage-Discharge Relation, Q in m3/s Stage Change (m)
-6.5R -6.70 -6.50 Z = 927.2345 + 0.0046Q - 9.7557x10⁻⁷Q 2 3.64
1.2R 1.10 1.30 Z = 920.1800 + 0.0058Q - 1.8793x10⁻⁶Q2 3.53
2.6L 2.48 2.68 Z = 919.5346 + 0.0060Q - 1.7549x10⁻⁶Q2 3.99
8.2L 8.10 8.35 Z = 912.7481 + 0.0035Q - 2.6250x10⁻⁶Q2 3.51
16.7L 16.65 16.8 Z = 894.5953 + 0.0052Q - 1.4169x10⁻⁶Q2 3.61
22.0R 21.05 22.08 Z = 878.4473 + 0.0103Q – 3.0524x10⁻⁶Q2 6.76
23.6L 23.53 23.65 Z = 873.8798 + 0.0099Q - 3.3402x10⁻⁶Q2 5.86
29.5L 29.43 29.55 Z = 856.3392 + 0.0084Q - 2.4403x10⁻⁶Q2 5.65
30.8R 30.68 30.82 Z = 853.6511 + 0.0085Q - 2.3554x10⁻⁶Q2 5.83
31.9R 31.85 32.05 Z = 853.0456 + 0.0049Q - 1.3643x10⁻⁶Q2 3.41
32.2R 32.18 32.21 Z = 852.2250 + 0.0043Q - 4.5342x10⁻⁷Q2 4.12
33.3L 33.15 33.30 Z = 849.1904 + 0.0065Q - 1.1068x10⁻⁶Q2 5.53
35.1L 35.03 35.20 Z = 846.3659 + 0.0090Q - 2.7067x10⁻⁶Q2 5.87
41.3L 41.20 41.52 Z = 839.6944 + 0.0059Q - 1.1409x10⁻⁶Q2 4.84
43.4L 43.37 43.47 Z = 838.3170 + 0.0072Q - 1.9473x10⁻⁶Q2 4.98
44.5L 44.40 44.72 Z = 835.5083 + 0.0066Q - 1.6682x10⁻⁶Q2 4.76
45.0L 44.87 45.03 Z = 835.2158 + 0.0051Q - 6.9759x10⁻⁷Q2 4.63
47.6R 47.50 47.75 Z = 833.0905 + 0.0059Q - 1.5676x10⁻⁶Q2 4.13
50.2R 50.10 50.25 Z = 829.1319 + 0.0064Q - 1.6577x10⁻⁶Q2 4.59
51.5L 51.32 51.57 Z = 828.5607 + 0.0061Q - 1.7551x10⁻⁶Q2 4.09
55.9R 55.80 56.00 Z = 819.3199 + 0.0044Q - 1.2732x10⁻⁶Q2 2.93
56.6R 56.50 56.57 Z = 816.6207 + 0.0044Q - 1.1396x10⁻⁶Q2 3.19
62.9R 62.82 62.98 Z = 799.8819 + 0.0059Q - 1.3166x10⁻⁶Q2 4.56
65.2R 65.08 65.30 Z = 795.7844 + 0.0043Q - 9.7169x10⁻⁷Q2 3.33
66.1L 66.03 66.25 Z = 793.6146 + 0.0042Q - 1.4984x10⁻⁷Q2 2.37
68.8R 68.65 68.90 Z = 786.0775 + 0.0041Q - 1.1667x10⁻⁶Q2 2.81
81.7L 81.73 81.78 Z = 735.9746 + 0.0059Q - 1.4777x10⁻⁶Q2 4.35
84.6R 84.50 84.60 Z = 724.6525 + 0.0062Q - 1.1833x10⁻⁶Q2 5.15
87.6L 87.50 87.68 Z = 716.0649 + 0.0075Q - 2.5026x10⁻⁶Q2 4.50
88.1R 88.00 88.13 Z = 716.3174 + 0.0059Q - 1.6647x10⁻⁶Q2 3.96
91.8R 91.72 91.80 Z = 699.4004 + 0.0064Q - 1.4437x10⁻⁶Q2 4.93
93.8L 93.75 93.86 Z = 696.9266 + 0.0057Q - 1.8772x10⁻⁶Q2 3.44
Introduction 3

Table 1. Site names, locations, and stage-discharge relations, Colorado River, Glen Canyon Dam to Diamond Creek, Arizona—Continued
[Site names are given by location along the river mile (RM) centerline (U.S. Geological Survey, 2006) downstream from Lees Ferry, in Grand Canyon National Park except, -6.5R, which is in Glen Canyon National Recreation Area. L and R refer to the left and right bank as viewed in a downstream direction, respectively; extent, channel reach to which stage-discharge relation applies; Z, height in meters above the Geodetic Reference System of 1980/North American Datum of 1983 ellipsoid; Q, discharge; m3/s, cubic meters per second; the predicted stage change is given for the difference in water-surface elevation for discharges between 142 m3/s and 1,274 m3/s, in meters (m)]
Site Name (RM) Upstream Extent (RM) Downstream Extent (RM) Stage-Discharge Relation, Q in m3/s Stage Change (m)
104.4R 104.35 104.45 Z = 658.3761 + 0.0066Q - 1.8602 x10⁻⁶Q2 4.51
119.4R 119.33 119.45 Z = 613.6991 + 0.0072Q - 1.7671x10⁻⁶Q2 5.33
122.7R 122.70 122.80 Z = 607.9881 + 0.0073Q - 2.1437x10⁻⁶Q2 4.80
123.3L 123.17 123.30 Z = 607.2691 + 0.0078Q - 2.5742x10⁻⁶Q2 4.70
137.7L 137.65 137.72 Z = 562.4849 + 0.0067Q - 1.8079x10⁻⁶Q2 5.55
139.6R 139.50 139.66 Z = 557.1314 + 0.0075Q - 2.0031x10⁻⁶Q2 5.27
145.8L 145.83 145.90 Z = 539.8538 + 0.0083Q - 2.2142x10⁻⁶Q2 5.83
167.2L 167.10 167.25 Z = 505.4650 + 0.0051Q - 9.7770x10⁻⁷Q2 4.23
172.6L 172.50 172.70 Z = 497.2574 + 0.0061Q - 1.4370x10⁻⁶Q2 4.55
183.3R 183.20 183.38 Z = 470.1667 + 0.0069Q - 1.8743x10⁻⁶Q2 4.84
194.6L 194.50 194.70 Z = 446.8107 + 0.0064Q - 1.7595x10⁻⁶Q2 4.44
202.3R 202.30 202.48 Z = 431.4507 + 0.0059Q - 1.3866x10⁻⁶Q2 4.46
213.3L 213.30 213.28 Z = 403.5871 + 0.0096Q - 2.5109x10⁻⁶Q2 6.80
220.1R 220.05 220.12 Z = 394.3845 + 0.0039Q - 5.3231x10⁻⁷Q2 3.54
225.5R 225.40 225.60 Z = 380.6412 + 0.0065Q - 2.4598x10⁻⁶Q2 3.45
Data and Method Used in Formulating Stage-Discharge Relations
Streamflow-Gaging DataDischarge measurements at the USGS continuous-record
streamflow-gaging stations were used to determine discharge at each study site. The USGS uses a standard method of com-puting discharge by developing a stage-discharge rating curve to convert measured stage to discharge (Rantz and others, 1982). The method employs numerous flow velocity measure-ments and surveyed cross sections at each gage to construct a stage-discharge relation. The accuracies of the continuous-record streamflow-gaging stations in the study area, for the period of study, are considered “good,” which means that 95 percent of the daily mean discharges are within 10 percent of true (McCormack and others, 2003).
Water-Surface ElevationsWater-surface elevations (high and low watermarks from
peak and trough discharges, and strandlines from tributary and
controlled floods) were surveyed with optical total stations located on geodetic control network benchmarks. The bench-marks were referenced to National Spatial Reference System (NSRS) control stations (Doyle, 1994) located along the canyon rim by using static Global Positioning System (GPS) techniques. GPS observations yield heights above the ellipsoid defined by the Geodetic Reference System of 1980 (GRS80) and the North American Datum of 1983 (NAD83). In this report, ellipsoidal heights have not been converted to North American Vertical Datum of 1988 (NAVD88) orthometric heights because the current national geoid model (GEOID03) does not incorporate sufficient gravity measurements in the region to account for the effects of topography (mass/ void) on height measurements. As a result, spatial data collected for resource monitoring in GCNP is, at this time, referenced to the NAD83 ellipsoid (Saleh and others, 2003). When an accurate geoid model of the study area is produced, the stage-discharge relations in this report can readily be converted to NAVD88 orthometric heights.
The control network benchmarks have positioning accu-racies of less than 0.03 meter (m) and ellipsoidal height accu-racies of between 0.01 and 0.10 m at 95 percent confidence (Zilkoski and others, 1997). Precision of optical measurements
� Stage-Discharge Relations for the Colorado River in Glen, Marble, and Grand Canyons, Arizona, 1990-2005
is 0.05 m or better. Points collected along the water surface or along strand lines corresponded to an average density of one point per 1 to 2 linear meters. After verification of positions and heights, the point data were converted to mean values for the stage elevations of interest. The range of elevation differ-ences was typically less than 0.10 m, and standard deviations were at or better than 0.03 m.
Computation of Stage-Discharge Relations
Stage-discharge relations were empirically developed for each site by compiling the stage data and assigning a discharge to each mean elevation by comparing steady discharges and daily peak and trough discharges from the nearest streamflow-gaging station upstream or downstream from each site. Water-surface elevations surveyed during the rising or falling limb of the diurnal discharge wave were discarded. As a result, there was no need to route the relevant portions of the Glen Canyon Dam discharge record to the location of study by using the one-dimensional, unsteady-flow model of Wiele and Griffin (1997). Substantial differences in trough and peak discharges between streamflow-gaging stations were accounted for by interpolating the values between gages. Fitting a line to the data by using a second-order polynomial leads to a stage-discharge relation for a particular site as:
Z = C0 + C1Q + C2Q2, (1)
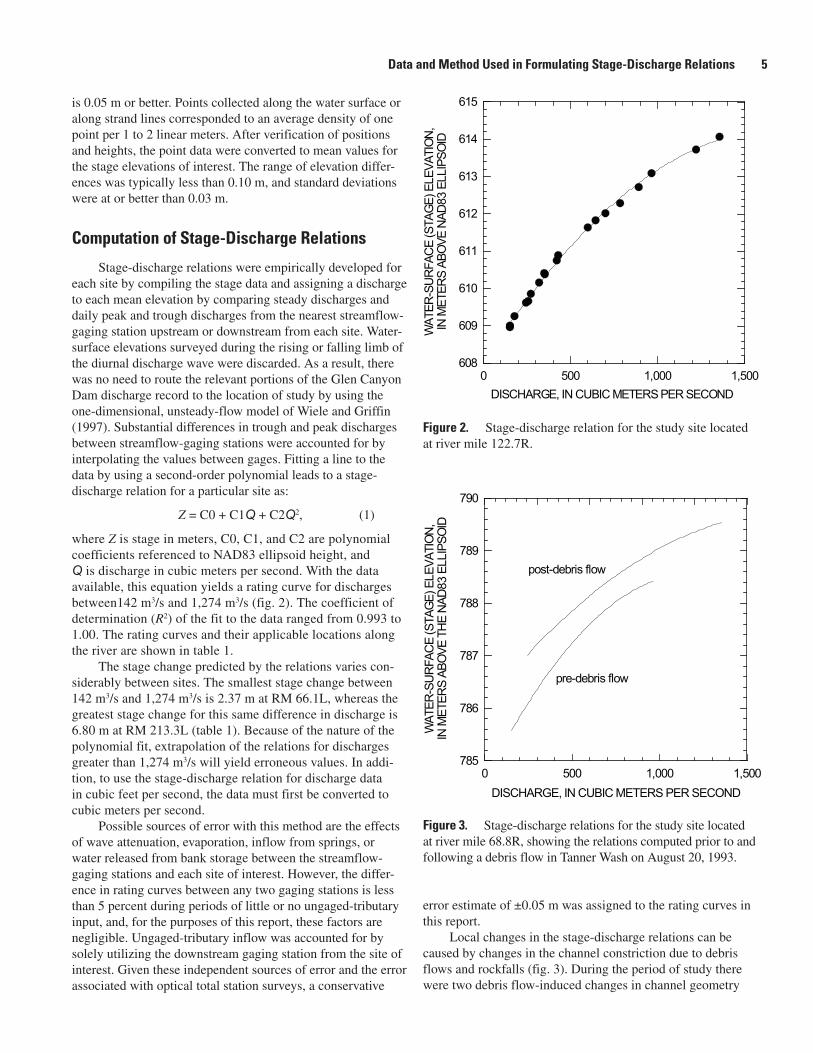
where Z is stage in meters, C0, C1, and C2 are polynomial coefficients referenced to NAD83 ellipsoid height, and Q is discharge in cubic meters per second. With the data available, this equation yields a rating curve for discharges between142 m3/s and 1,274 m3/s (fig. 2). The coefficient of determination (R2) of the fit to the data ranged from 0.993 to 1.00. The rating curves and their applicable locations along the river are shown in table 1.
The stage change predicted by the relations varies con-siderably between sites. The smallest stage change between 142 m3/s and 1,274 m3/s is 2.37 m at RM 66.1L, whereas the greatest stage change for this same difference in discharge is 6.80 m at RM 213.3L (table 1). Because of the nature of the polynomial fit, extrapolation of the relations for discharges greater than 1,274 m3/s will yield erroneous values. In addi-tion, to use the stage-discharge relation for discharge data in cubic feet per second, the data must first be converted to cubic meters per second.
Possible sources of error with this method are the effects of wave attenuation, evaporation, inflow from springs, or water released from bank storage between the streamflow-gaging stations and each site of interest. However, the differ-ence in rating curves between any two gaging stations is less than 5 percent during periods of little or no ungaged-tributary input, and, for the purposes of this report, these factors are negligible. Ungaged-tributary inflow was accounted for by solely utilizing the downstream gaging station from the site of interest. Given these independent sources of error and the error associated with optical total station surveys, a conservative
Figure 3. Stage-discharge relations for the study site located at river mile 68.8R, showing the relations computed prior to and following a debris flow in Tanner Wash on August 20, 1993.
Figure 2. Stage-discharge relation for the study site located at river mile 122.7R.
0 500 1,000 1,500DISCHARGE, IN CUBIC METERS PER SECOND
608
609
610
611
612
613
614
615
WAT
ER-S
UR
FAC
E(S
TAG
E)EL
EVAT
ION
,IN
MET
ERS
ABO
VEN
AD83
ELLI
PSO
ID
0 500 1,000 1,500DISCHARGE, IN CUBIC METERS PER SECOND
785
786
787
788
789
790
WAT
ER-S
UR
FAC
E(S
TAG
E)EL
EVAT
ION
,IN
MET
ERS
ABO
VETH
EN
AD83
ELLI
PSO
ID
post-debris flow
pre-debris flow
error estimate of ±0.05 m was assigned to the rating curves in this report.
Local changes in the stage-discharge relations can be caused by changes in the channel constriction due to debris flows and rockfalls (fig. 3). During the period of study there were two debris flow-induced changes in channel geometry
Data and Method Used in Formulating Stage-Discharge Relations 5

that caused substantial changes in the nearby stage-discharge relation. The first was a debris flow in Tanner Wash on August 20, 1993 (Melis and others, 1994) that increased the water-surface elevation of the pool upstream from Tanner Rapid (RM 69.0) by about 1.2 m at a discharge of 227 m3/s (fig. 3). The second was a debris flow in Lava Canyon (RM 65.8R) on September 11, 2002 that increased the water-surface eleva-tion of the pool upstream from Lava Canyon Rapid (stage-discharge relation at RM 65.2R) by 0.3-0.5 m. Future debris flows in tributaries to the Colorado River could potentially cause hydraulic and geomorphic changes that would affect the stage-discharge relations described in this report.
SummaryStage data collected from 1990-2005 were used to
develop stage-discharge relations at 47 locations along the Colorado River in Glen, Marble, and Grand Canyons. The stage data were compiled and assigned discharge values by comparing steady discharges and daily peak and trough dis-charges from the nearest streamflow-gaging station, upstream or downstream from each site. A second-order polynomial was fit to the data yielding a rating curve for each site. The rating curves accurately predict stage within ±0.05 m, for discharges ranging from 141 m3/s to 1,274 m3/s. The stage change at the sites varied from 2.37 m to 6.80 m for this range of discharge. The relations are convenient to use and require no additional information to produce a stage prediction at a given location. Because of the nature of the polynomial fit, however, the relations are not suited for predicting river stages greater than 1,274 m3/s. In order to use the stage-discharge relation for discharge data in cubic feet per second the data must first be converted to cubic meters per second.
References Cited
Cox, D., Lutz, C., and Nelson, C., 2005, Beach habitat building and status of the endangered Kanab Ambersnail, in Abstracts of the Colorado River Ecosystem Science Symposium, Tempe, Ariz., October 25-27: Grand Canyon Monitoring and Research Center, p. 73.
Doyle, D.R., 1994, Development of the National Spatial Reference System, National Geodetic Survey, Silver Spring, Maryland, USA, http://www.ngs.noaa.gov/PUBS_LIB/develop_NSRS.html.
Draut, A.E., Rubin, D.M., Dierker, J.L., Fairley, H.C., Griffiths, R.E., Hazel, J.E., Jr., Hunter, R.E., Kohl, K., Leap, L.M., Nials, F., Topping, D.J., and Yeatts, M., 2005, Sedimentology and stratigraphy of the Palisades, Lower Comanche, and Arroyo Grande areas of the Colorado River corridor, Grand Canyon, Arizona: U.S. Geological Survey Scientific Investigations Report 2005—5072, 68 p.
Hazel, J.E., Jr., Kaplinski, M., Parnell, R., Manone, M., and Dale, A., 1999, Topographic and bathymetric changes at thirty-three long-term study sites, in R.H. Webb, J.C. Schmidt, G.R. Marzolf, and Valdez, R.A., eds., The con-trolled flood in Grand Canyon: American Geophysical Union Monograph Series, v. 110, p. 161-184.
Hazel, J.E., Jr., Topping, D. J., Schmidt, J.C., and Kaplinski, M., 2006, Influence of a dam on fine-sediment storage in a canyon river: Journal of Geophysical Research, v. 111, F01025, doi: 10.1029/2004JF000193, 16 p.
Howard, A. D., and Dolan, R., 1981, Geomorphology of the Colorado River: Journal of Geology, v. 89, p. 269-298.
Kaplinski, M., Hazel Jr., J. E., and Beus, S. S., 1995, Monitor-ing the effects of Interim Flows from Glen Canyon Dam on sand bars in the Colorado River Corridor, Grand Canyon National Park, Arizona: Final Report to Glen Canyon Envi-ronmental Studies, Northern Arizona University, Flagstaff, Ariz., 62 p.
Kaplinski, M., Hazel Jr., J.E., Kaplinski, M., Parnell, R., 2005, Campsite area monitoring in the Colorado River ecosystem, 1998-2003: Final Report submitted to Grand Canyon Moni-toring and Research Center, Northern Arizona University, Flagstaff, Ariz., 39 p.
Korman, J., Kaplinski, M., Hazel, J.E., Jr., Melis, T., Sneep, J., and Magirl, C., 2005, Effects of 2003-2004 fluctuating flows from Glen Canyon Dam on the early life history stages of rainbow trout in the Colorado River: Final Report submitted to Grand Canyon Monitoring and Research Cen-ter, Flagstaff, Ariz., 183 p.
Korman, J., Kaplinski, M., and Buszowski, J., 2006, Effects of air and mainstem water temperatures, hydraulic isolation, and fluctuating flows from Glen Canyon Dam on water tempera-tures in nearshore and backwater environments in the Colo-rado River in Grand Canyon: Final Report to Grand Canyon Monitoring and Research Center, Flagstaff, Ariz., 57 p.
Leopold, L.B., 1969, The rapids and the pools — Grand Canyon: U.S. Geological Survey Professional Paper 669-D, p. 131-145.
Magirl, C.S., and Breedlove, M.J., 2005, An improved STARS model—predicted Colorado River water-surface elevations and virtual shorelines for flows up to 200,000 ft3/s, Abstracts of the Colorado River Ecosystem Science Symposium, Tempe, Ariz., October 25-27: Grand Canyon Monitoring and Research Center, p. 56.
McCormack, H.H., Fisk, G.G., Duet, N.R., Evans, D.W., Roberts, W.P., and Castillo, N.K., 2003, Water Resources Data for Arizona, Water Year 2002: U.S. Geological Survey Water-Data Report AZ-02-1, 337 p.
Melis, T.S., Webb, R.H., Griffiths, P.G., and Wise, T.J., and others, 1994, Magnitude and frequency data for historic
� Stage-Discharge Relations for the Colorado River in Glen, Marble, and Grand Canyons, Arizona, 1990-2005

debris flows in Grand Canyon National Park and vicinity, Arizona: U.S. Geological Survey Water-Resources Investi-gation Report 94-4214, 285 p.
Meretsky, V.J., Stevens, L.E., and Wegner, D.L., 2000, Balanc-ing endangered species and ecosystems — A case study of adaptive management in Grand Canyon: Environmental Management, v. 25, no. 6, p. 579-586.
National Research Council, 1999, Downstream — Adaptive Management of Glen Canyon Dam and the Colorado River Ecosystem: Washington D.C., National Acadamy Press, 230 p.
Rantz, S.E., and others, 1982, Measurement and computation of streamflow: U.S. Geological Survey Water-Supply Paper 2175, 631 p.
Sabol, T.A., and Springer, A.E., 2005, Simulating the phre-atic surface within new sediments deposited during the November 2004 High Flow Test along the Colorado River, Grand Canyon, Arizona: EOS Transactions, American Geophysical Union, 86(52), Fall Meet. Suppl., Abstract H53B-0472.
Saleh, R.A., Chayes, D.N., Dasler, J.L., Doyle, D.R., Sanchez, R., Renslow, M.S., and Rose, J.J., 2003, Survey protocol evaluation program: Final Report to the Grand Canyon Monitoring and Research Program, http://www.gcmrc.gov/library/reports/GIS/Saleh2003.pdf.
Schmidt, J.C., and Graf, J. B., 1990, Aggradation and degrada-tion of alluvial sand deposits, 1965 to 1986, Colorado River, Grand Canyon National Park, Arizona: U.S. Geological Survey Professional Paper 1493, 74 p.
Springer, A.E., Petroutson,W.D., and Semmens, B.A., 1999, Spatial and temporal variability of hydraulic conductivity in active reattachment bars of the Colorado River, Grand Canyon: Ground Water, v. 37, no. 3, p. 338-344.
Topping, D.J., Schmidt, J.C., and Vierra, Jr., L.E., 2003, Com-putation and analysis of the instantaneous-discharge record for the Colorado River at Lees Ferry, Arizona, May 8, 1921 through September 30, 2000: U.S. Geological Survey Pro-fessional Paper 1677, 118 p.
U.S. Department of the Interior, 1995, Operation of Glen Can-yon Dam—Final Environmental Impact Statement: Bureau of Reclamation, Upper Colorado Region, Salt Lake City, Utah, 337 p., plus appendices.
U.S. Geological Survey, 2006, Grand Canyon Monitoring and Research Center, Colorado Mileage System [Spatial Database, GIS.BASE_GCMRC_TenthMile], 1st Revised Edition, accessed June 16, 2006, at URL http://www.gcmrc.gov/products/ims/ims.htm
Wiele, S.M., and Griffin, E.R., 1997, Modifications to a one-dimensional model of unsteady flow in the Colorado River through the Grand Canyon, Arizona: U.S. Geological Sur-vey Water-Resources Investigation Report 97-4046, 17 p.
Wiele, S.M., and Torrizo, M., 2003, A stage-normalized func-tion for the synthesis of stage-discharge relations for the Colorado River in Grand Canyon, Arizona: U.S. Geological Survey Water-Resources Investigation Report 03-4037, 23 p.
Wiele, S.M. and Torizzo, M., 2005, Modeling of sand depo-sition in archeologically significant reaches of the Colo-rado River in Grand Canyon, USA, in Bates, P., Lane, S., and Ferguson, R., eds., Computational Fluid Dynamics — Applications in Environmental Hydraulics: West Sussex, England, John Wiley and Sons, p. 357-394.
Zilkoski, D.B., D’Onofrio, J.D. and Frakes, S.J., 1997, Guidelines for Establishing GPS-Derived Ellipsoid Heights (Standards: 2 cm and 5 cm), version 4.3, NOAA Technical Memorandum NOS NGS-58, National Geodetic Survey, Silver Springs, MD, USA, 22 p., http://www.ngs.noaa.gov/PUBS_LIB/NGS-58.html.
References Cited �