Staffing Levels NY Nursing Homes - New York State … · 1 Making Choices The Attorney General’s...
98
Staffing Levels in New York Nursing Homes: Important Information for Making Choices Eliot Spitzer Attorney General Office of the Attorney General Medicaid Fraud Control Unit January 2006
Transcript of Staffing Levels NY Nursing Homes - New York State … · 1 Making Choices The Attorney General’s...

Staffing Levels in New York Nursing Homes:
Important Information for Making Choices
Eliot Spitzer Attorney General
Office of the Attorney General Medicaid Fraud Control Unit
January 2006

Staffing Levels in New York Nursing Homes
Making Choices .........................................................................................................1
What the Numbers Mean ...........................................................................................4
Categories of nursing caregivers ......................................................................................... 4
Minimum standards for nurse staffing ............................................................................... 5
How New York homes fare under various standards........................................................ 7
Source of the data in the list................................................................................................. 8
Levels of medical need .......................................................................................................... 9
Some other sources of information.................................................................................... 11
Some viewpoints on staffing levels and quality of care in nursing homes ..................... 12
List of Staffing Levels..............................................................................................15
Appendix A
Nursing Homes Excluded from the Staffing List ............................................................. 83
Appendix B
Staffing Levels and the Quality of Care: The Research................................................. 86
Appendix C
Staffing Levels and the Quality of Care: The Nursing Home Initiative ....................... 91
Appendix D
Staffing Data and Its Sources............................................................................................. 94
1
Making Choices
The Attorney General’s Office presents the following information on
staffing in nursing homes to assist the public in making difficult and personal
decisions in choosing a long term care facility.
Approximately a quarter million New Yorkers receive care in nursing homes
every year. For many near the end of their lives, a nursing home may be their last
home. For those choosing a nursing home, a major concern is that the facility
provide good and safe care. While there is no substitute for personal visits and
close monitoring of the care that a resident is actually receiving, there are certain
criteria to be aware of when choosing a home. One of those criteria is a home’s
staffing level.
Numerous studies have shown a strong relationship between the hours of
care a resident receives and the quality of care a resident receives. If there are too
few professionals caring for residents, then resident health can be dramatically
impaired. A comprehensive federal study has quantified these staffing levels to
certain thresholds below which the quality of care suffers.1 As the literature
shows, experts differ on exactly where the line should be drawn from a public
policy point of view. A number of states have drawn lines by adopting minimum
staffing levels for nursing homes. But only you can decide where the line should
be drawn for you or your family members.
1 To provide information to consumers about the possible effects of low staffing, Appendix B describes the comprehensive federal study and other research.
2
To aid those choosing nursing homes, we have attached a list of staffing
levels in New York nursing homes.2 The staffing levels in the list were reported
by the homes themselves. Each nursing home must undergo periodic inspections
by Department of Health surveyors. In connection with those inspections, the
home must report its staffing levels for a two-week period. The data in the list was
reported in connection with inspections conducted from August 2004 to November
2005.
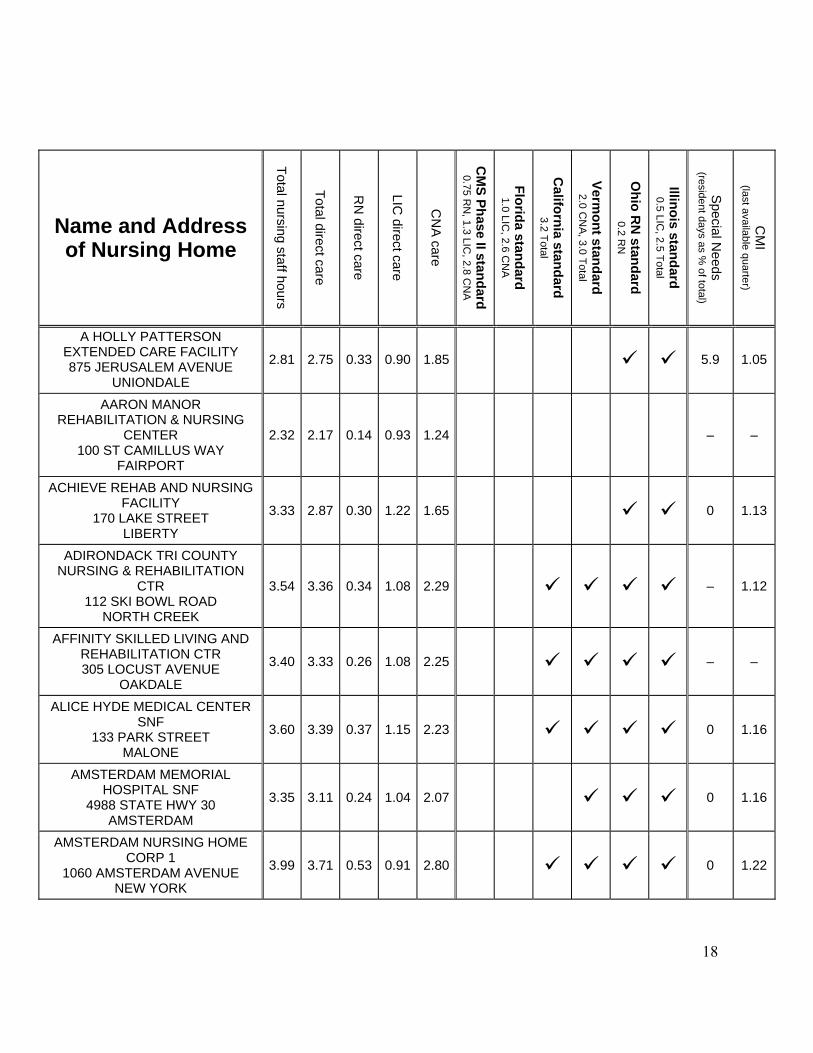
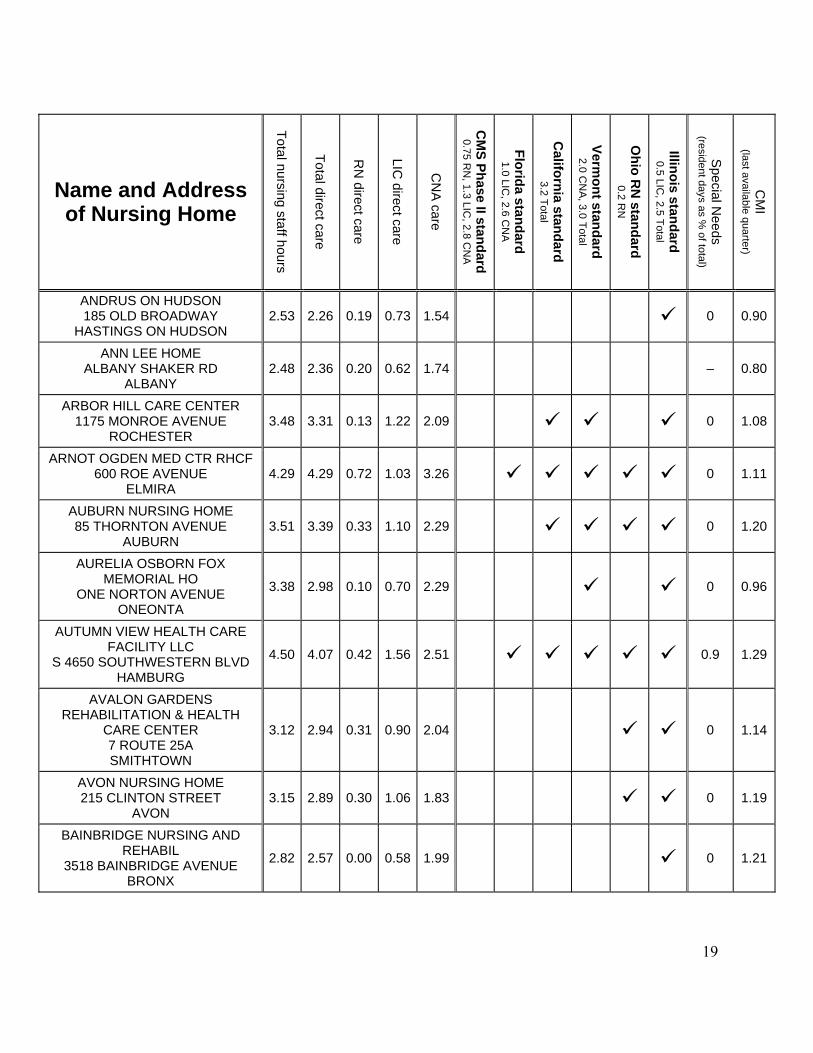
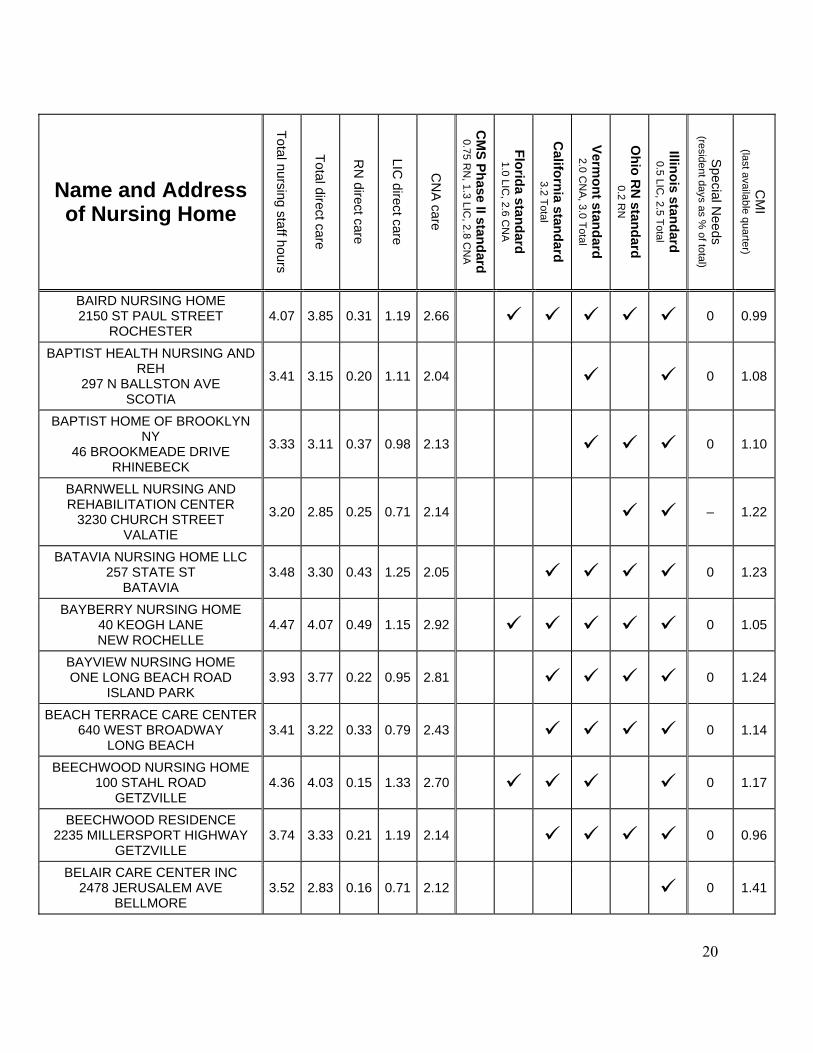
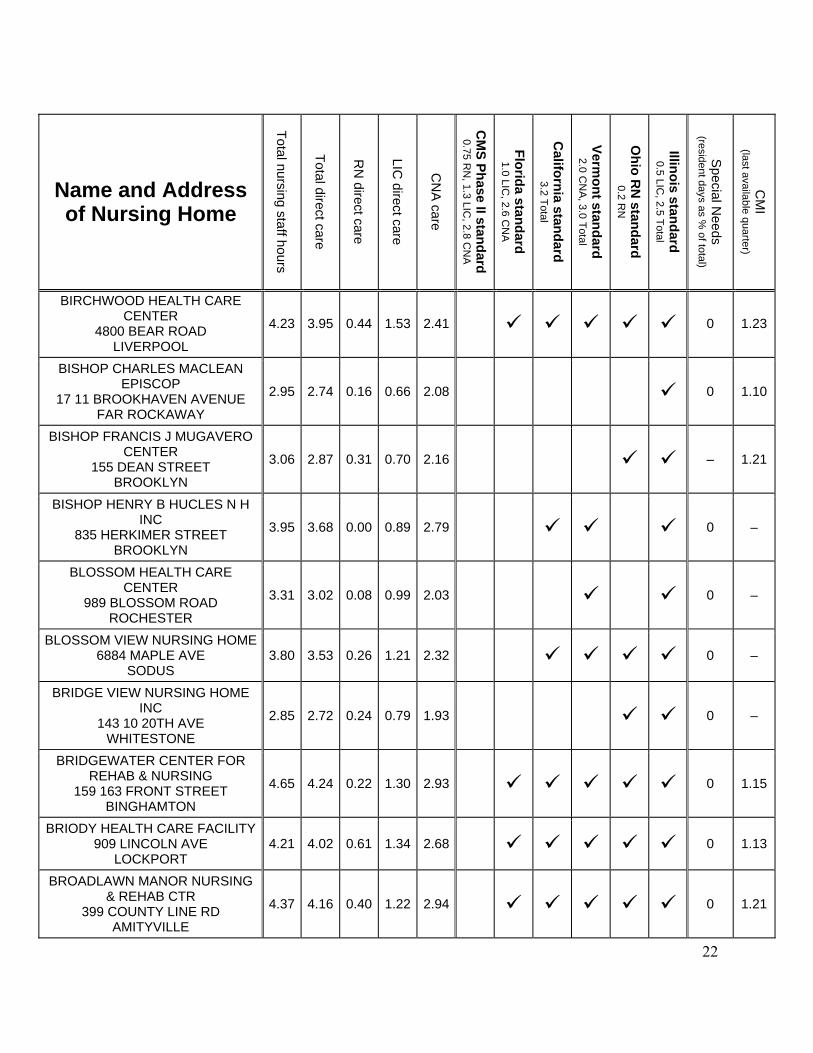
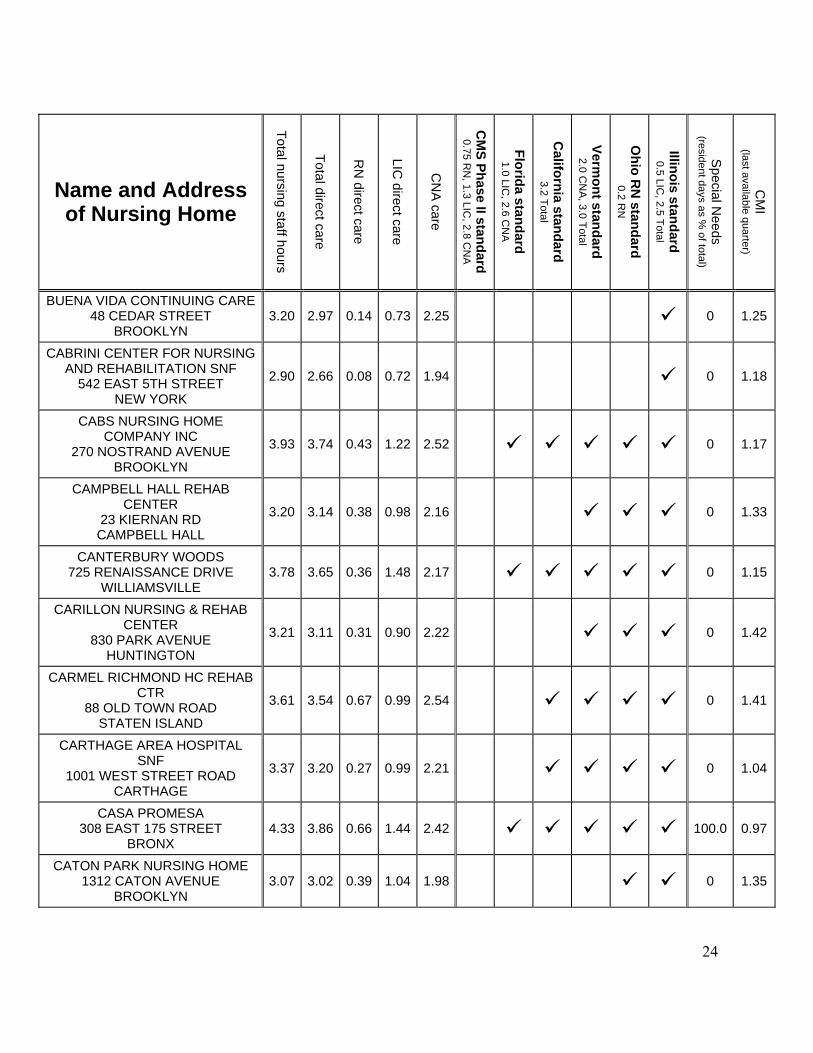
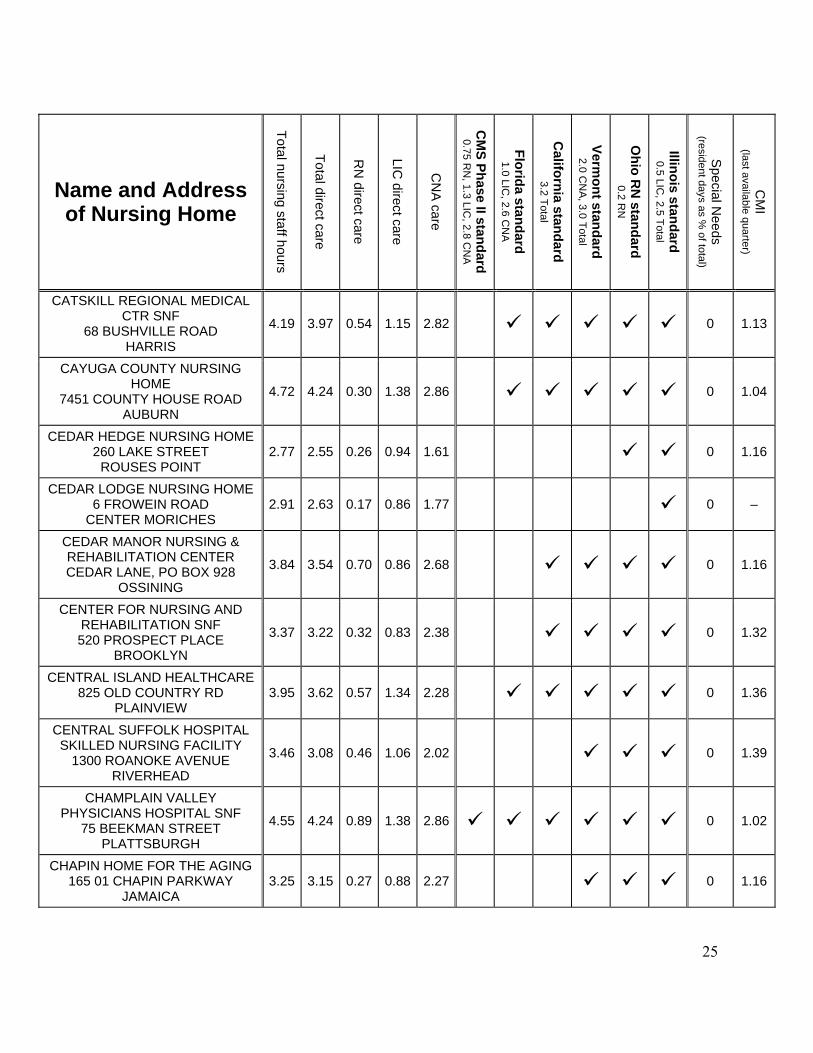
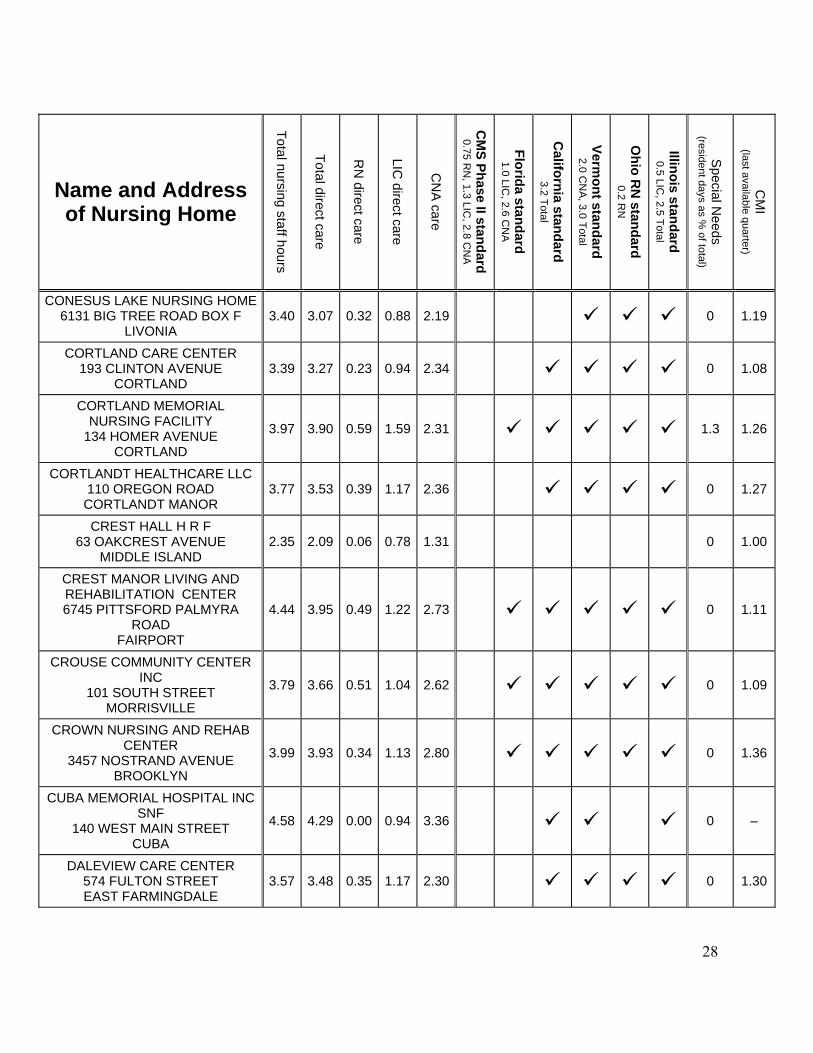
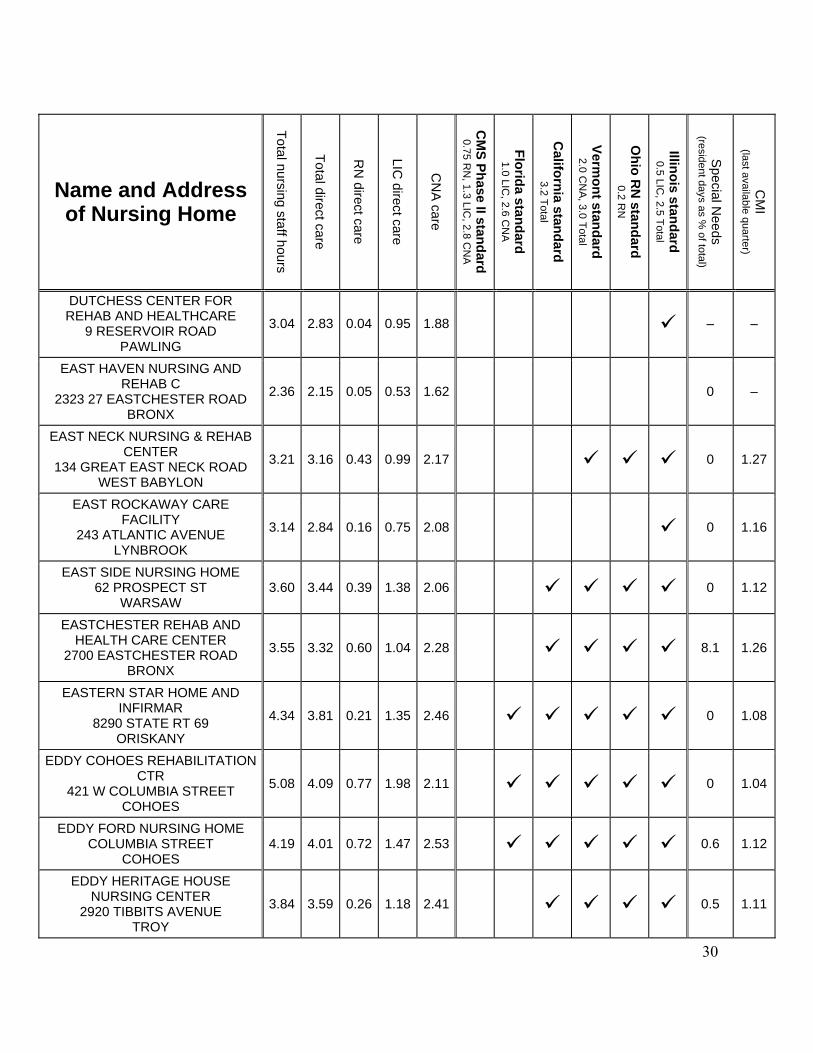
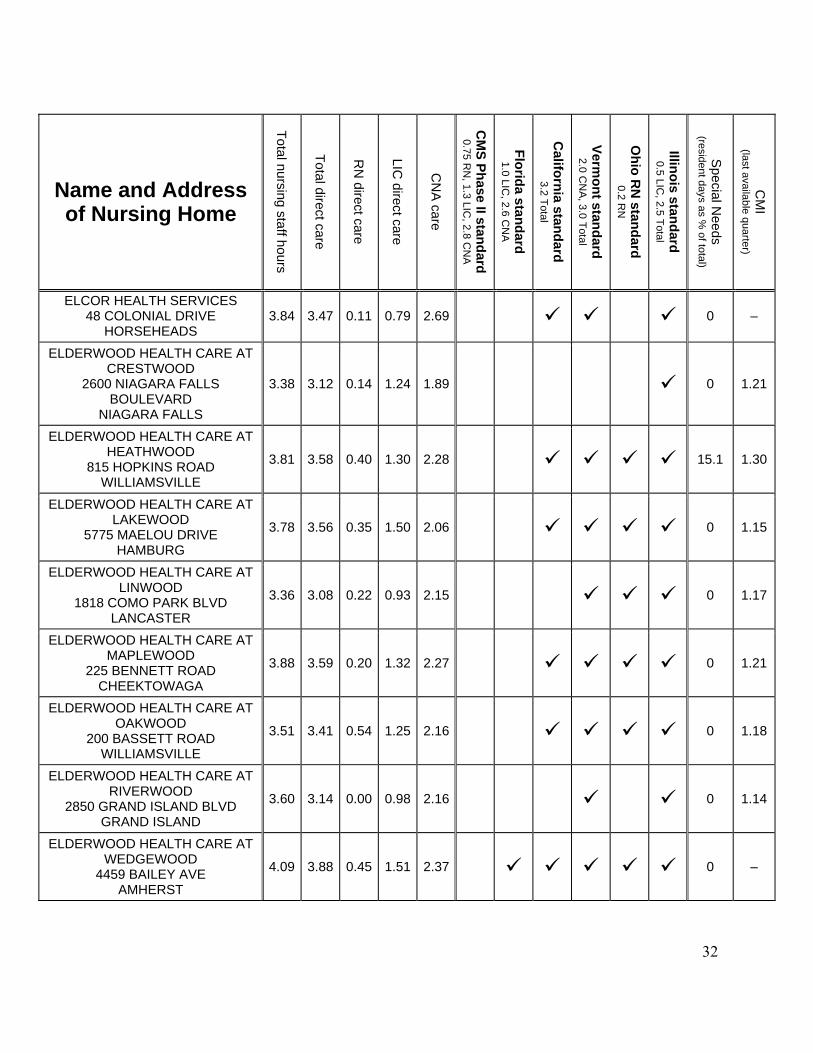
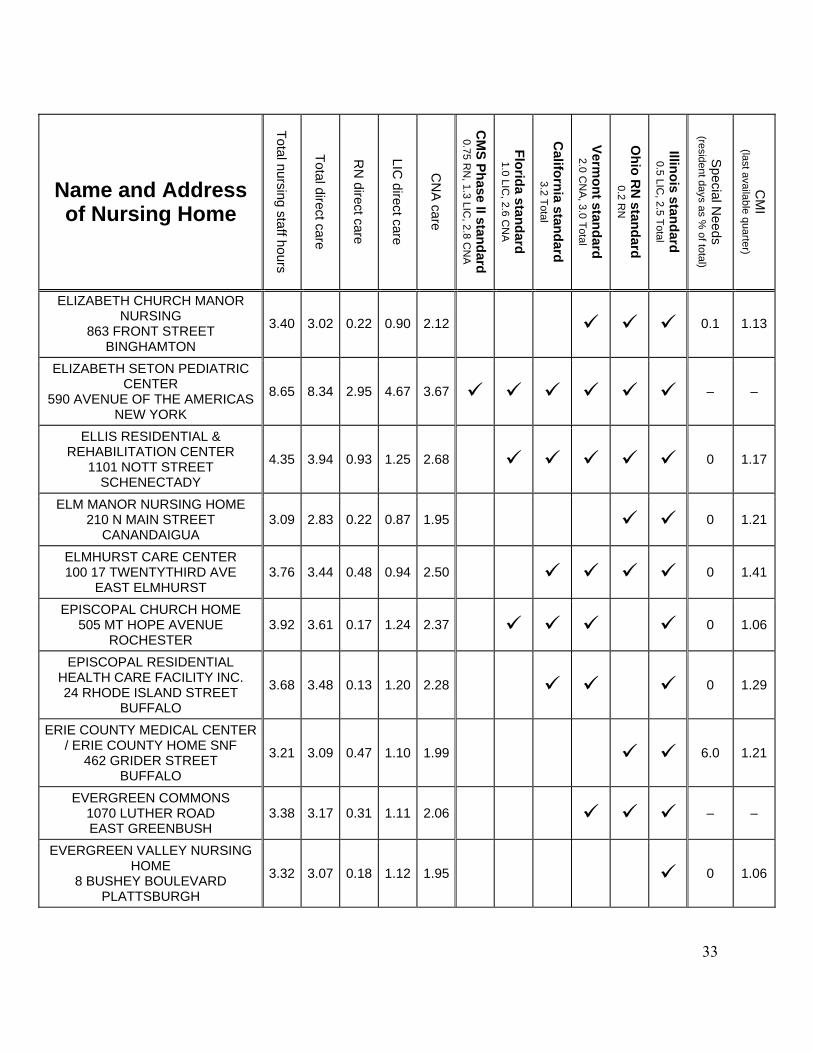
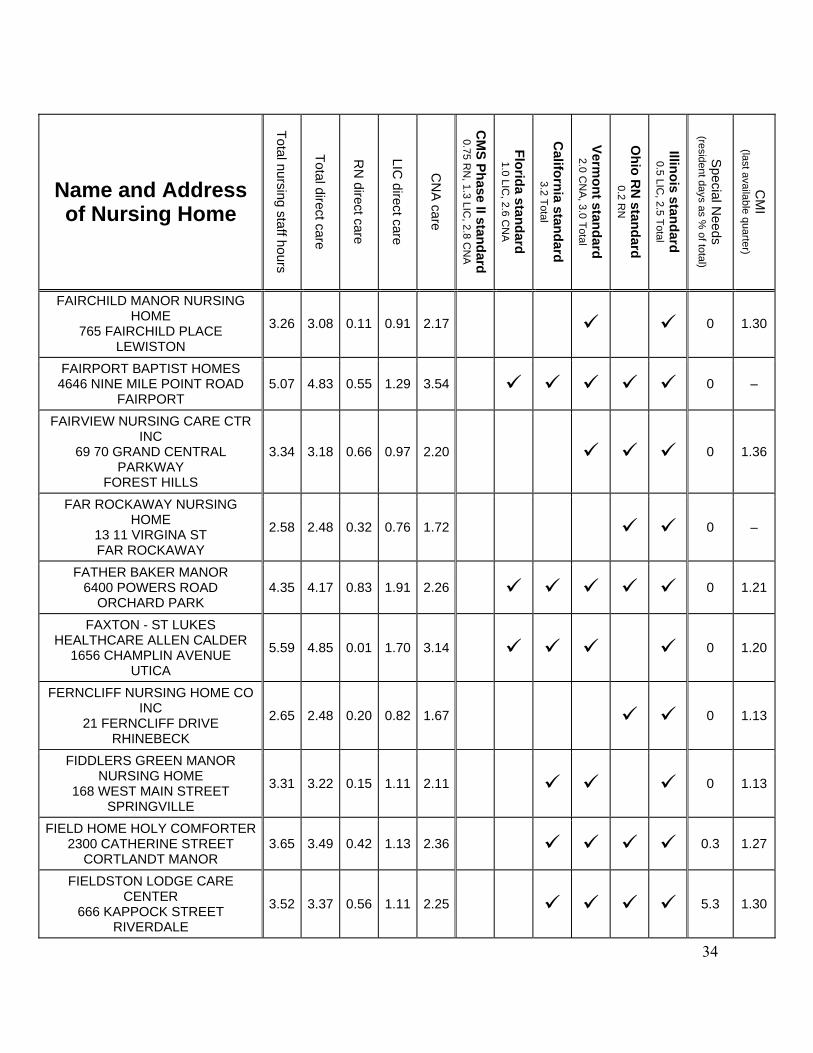
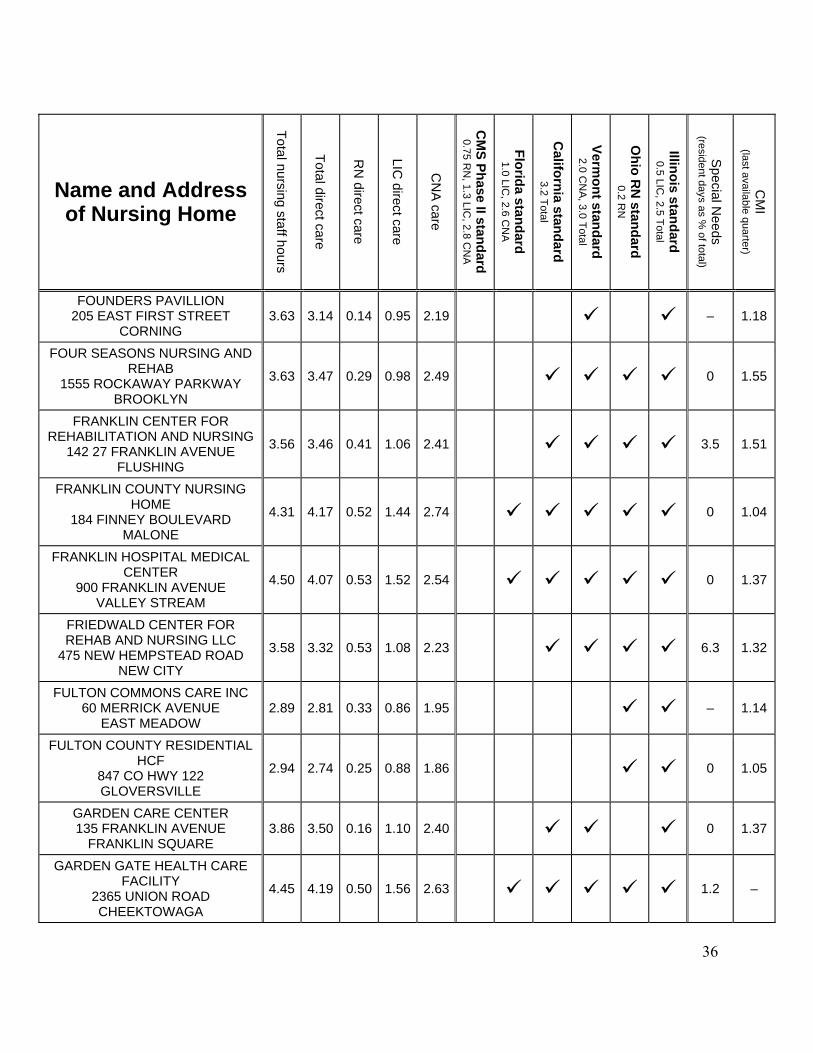
In the list that follows, you will see New York nursing homes listed
alphabetically, with their staffing levels for various categories of direct nursing
care. We applied the standards of five states and the federal study, and placed a
check mark (√) in the appropriate column when the home meets that standard.3 A
blank box in a column means that the staffing levels at the home in question do not
meet that standard.
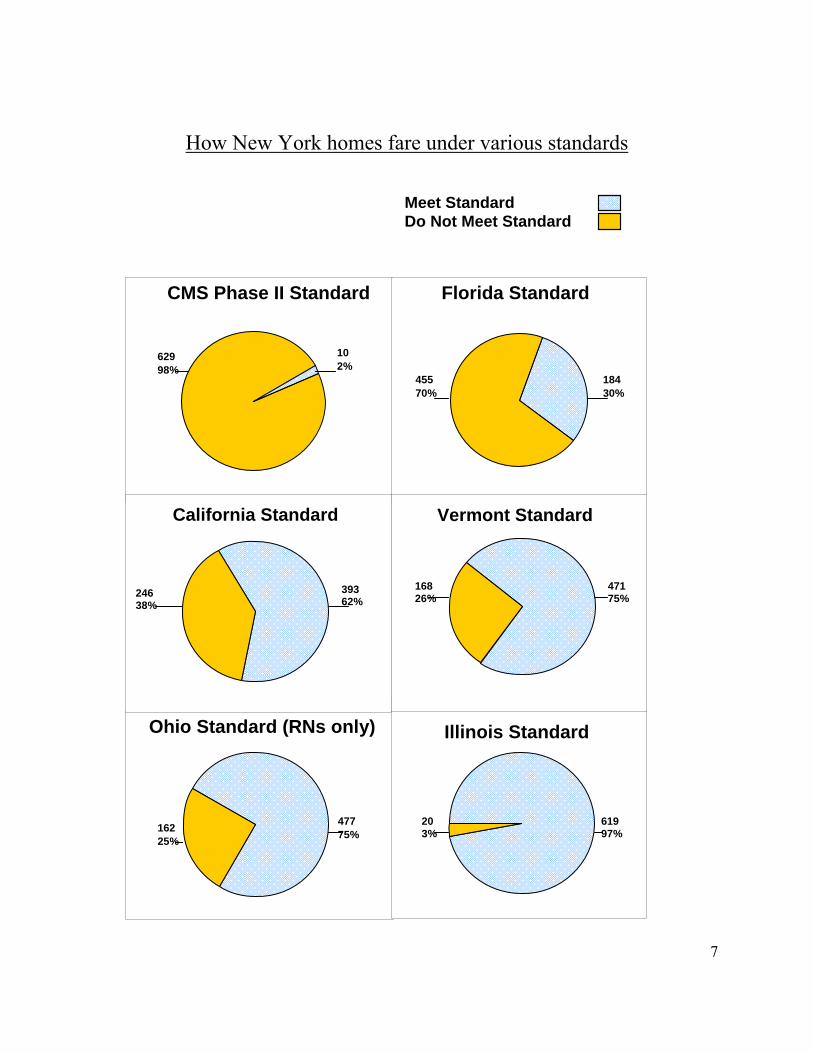
According to these figures, about 98% of New York’s nursing homes fall in
the range at which, in the comprehensive federal study, quality of care for long-
stay residents was shown to suffer. Staffing levels in about 70% of our homes do
not meet the standards set in Florida; about 38% do not meet the standard in
California; about 26% do not meet the Vermont standards; about 25% do not meet
Ohio’s standard for Registered Nurses; and about 3% do not meet the standards in
Illinois.
2 The staffing figures were not available for several nursing homes, which are listed in Appendix A. 3 In any gray areas (as explained in the explanatory notes preceding the list), we made assumptions in favor of the facilities.

3
The consequences of understaffing can sometimes be tragic. The Attorney
General’s Office has prosecuted nursing home owners for failing to provide legally
required care. In 2001 we launched a Nursing Home Initiative. Some of the cases
resulting from that project are described in Appendix C. Although only a small
number of nursing homes deserve criminal sanctions, these are critical efforts and
they must and will continue.
Finally, by issuing this report, we are not suggesting that levels of staffing,
alone, guarantee quality care. Much goes into quality care beyond numbers. Staff
motivation and competence is vitally important. And as we describe below, the
significance of a home’s staffing levels may be affected by the needs of its resident
population; a home with sicker residents may need more staff. In assessing a
nursing home, it is important to consider a full range of information: You should
visit the home and look around. You should learn about the management and staff,
including the level of turnover. You should speak with caregivers. You should
speak with others who have experience with nursing homes in your area, including
knowledgeable professionals.

4
What the Numbers Mean
To make sense of these numbers, it is important to understand the kinds of
professionals who deliver care in nursing homes, and the different staffing levels
evaluated in studies or required by states.
Categories of nursing caregivers
Nursing care is provided by two kinds of licensed nurses, and also by nurse
aides. In New York, the two kinds of licensed nurses are Registered Nurses (RNs)
and Licensed Practical Nurses (LPNs), and the aides are called Certified Nurse
Assistants (CNAs).
Staffing levels for each group are important, because caregivers in different
categories provide different kinds of care. Only RNs can assess patients and
perform certain specialized procedures. Only licensed nurses (LPNs and RNs) can
dispense medications, provide treatments, and supervise the delivery of care. The
CNAs are responsible for crucial but time-consuming services such as feeding,
bathing, dressing, toileting, and transporting the residents. Each of these functions
is vital.
Because each category of nursing staff has its own responsibilities, a
shortage of staff in any category may impede the home’s ability to deliver care.
Thus, some states’ standards include minimum levels not only for overall nursing
hours, but also for staffing levels in specific categories.
5
Minimum standards for nurse staffing
The charts and lists in this report apply standards set by some of the states,
and also those identified by a comprehensive study commissioned by the federal
Centers for Medicare and Medicaid Services (CMS) at the direction of Congress.
Some of the state standards were adopted in the wake of a series of studies
(described in Appendix B) of the significance of nursing care staffing levels.
Those studies, and the state standards, frequently measure care in terms of
the average number of hours of daily care that staff members provide to each
resident of the home (“hours per resident day” or “hprd”). This measure is
calculated by adding up the total number of hours worked by the nursing staff and
dividing it by the number of resident-days during the reporting period.
The CMS study identified three staffing thresholds below which the quality
of care was found to suffer: a threshold of 0.75 hours per resident day (45
minutes) for RNs; a threshold of 1.3 hprd (1 hour, 18 minutes) for total licensed
nursing services (RNs plus LPNs); and a threshold of 2.8 hprd (2 hours, 48
minutes) for CNAs. Any nursing home that meets these standards would provide
at least 4.1 hprd (4 hours, 6 minutes) of total nursing care.4
Many states have set staffing requirements, and in this report we focus on
several of them.5 In 2001, Florida enacted a statute to phase in staffing ratios; it
now requires averages of 1 hprd of licensed nurse care plus 2.6 hprd of nurse aide 4 The Department of Health and Human Services concluded that the study was “insufficient for determining the appropriateness of staffing ratios in a number of respects”; its objections are summarized on page 13 below. However, that department has used the study to measure the adequacy of nursing home staffing in specific instances. See Office of Inspector General, “Adequacy of Medicaid Payments to Albany County Nursing Home” (June 2004).

6
care. California set a minimum staffing level and then twice increased it. The
current California standard, which became effective in 2000, requires an average of
3.2 hprd of total nursing care per resident. Starting in 2001, Vermont required
nursing homes to provide an average of 2 hprd of nurse aide care as part of an
average 3 hprd of overall nursing care. Also starting in 2001, Ohio required
average total care of at least 2.75 hprd, including .2 hprd of RN care and 2 hprd of
nurse aide care. Several states, including Illinois, require 2.5 hprd of average total
nursing care, and various other states have minimum staffing standards as well.6
In the following pie charts, we compare staffing levels in New York nursing
homes to some of the standards set by those states or identified by the CMS study,7
and how many New York homes meet these standards.8
5 More detailed information about these state standards is found in the explanatory notes preceding the list of staffing levels. 6 For example, Delaware adopted a schedule requiring 3 hours of daily care starting in 2001, 3.28 hours starting in 2002, and 3.67 hours starting in 2003 subject to further review and the availability of funds. 16 Del. C. §1162(b), (c), (e). One of the highest standards, adopted by Maine in 2001, is written in different terms from those discussed above. The Maine standard requires one direct care provider for every 5, 10, and 15 residents on the day, evening, and night shifts, respectively. 10-144 CMR ch. 110 sec. 9.A.4. These levels generally require higher staffing than the various state standards written in terms of hours per resident day. 7 A nursing home is counted as meeting a standard only if it meets all the components of that standard that are measured in this report (e.g., both licensed hours and total hours). The procedures we followed to assess compliance with the components, and the reasons we did not assess compliance with some of the components, are discussed in the explanatory notes preceding the list. 8 Our figures may err on the side of the nursing homes. First, our figures are drawn from a set of staffing data (the “OSCAR data”) that is reported by the homes themselves, as described on page 8. For some homes, the OSCAR data may overstate actual staffing levels, and states typically do not use this same OSCAR data in measuring compliance with their standards, but obtain necessary data in other ways. Second, in any gray areas involving application of a standard, we gave the benefit of the doubt to the homes. See “Explanatory Notes” at page 15 below.
7
How New York homes fare under various standards
Meet Standard Do Not Meet Standard
62998%
102%
Florida Standard
184 30%
45570%
CMS Phase II Standard
Ohio Standard (RNs only)
162 25%
47775%
Illinois Standard
203%
619 97%
California Standard
246 38%
393 62%
Vermont Standard
471 75%
16826%
8
Source of the data in the list
All the staffing data in the following list was reported by the homes
themselves. New York State periodically inspects nursing homes. In connection
with each inspection, the facility is required to report certain information, including
its staffing levels for a two-week period. This information is collected in a
database called Online Survey, Certification, and Reporting (OSCAR), and it is the
basis for the Nursing Home Compare website maintained by CMS
(http://www.medicare.gov/NHCompare).
The following list includes OSCAR data showing the staffing hours reported
by New York nursing homes. It includes the homes’ reported levels for various
categories of nursing caregivers (RNs, total licensed nurses, and CNAs), and also
total nursing staff hours, both with and without time spent on administrative
functions.9 The staffing data in the following list was provided to us by CMS in
December 2005.
The list also shows which homes would meet or exceed standards set by
certain other states. While the data contained in this report can be useful in
choosing a nursing home, it should not be the sole information on which
consumers rely. There may be factors limiting the value of this data for comparing
the quality of homes, such as differences in resident populations and medical
acuity, which are discussed below. Consumers should therefore seek additional
information, talk with professionals and others who have had experience with
9 Not every New York nursing home is included, because CMS excludes data that falls outside certain ranges. The CMS criteria for excluding that data, and a list of the nursing homes excluded from the staffing lists on that basis, are set forth in Appendix A.

9
potential homes, and conduct site visits of those homes in order to make such a
choice. And we need not be complacent about the quality of the available data.
Nursing homes, government, academic researchers, consumer advocates and other
stakeholders must also work together to improve and standardize data about other
indicators of nursing home performance so that consumers can have the best
information possible in making such a critical health care decision.
Levels of medical need
Different nursing homes have different kinds of resident populations. Some
have particularly sick residents who need more care, and others have relatively
healthier residents who need less care. Some of the highest-staffed homes in the
state serve residents with specialized needs (like patients on ventilators) who may
require more staff. Consumers should be aware of these varying levels of medical
needs when comparing staffing levels. Seemingly high staffing levels may not be
unusually high for a resident population of high average medical acuity or special
needs, just as seemingly low staffing levels may not be truly low for a resident
population of low average medical acuity and few special needs.
To help consumers assess the staffing levels in the following list, the list also
includes two kinds of information about medical need levels in the various nursing
homes: the nursing home’s Case Mix Index (“CMI”) and the extent to which it
cares for “special needs” patients. Although the staffing levels in the list are taken
from the OSCAR data, these two indicators of medical needs are taken from other
sources. The CMI is a numerical measure of the average medical acuity of its
residents, computed by the Department of Health based on “patient review
instruments” provided by each facility. CMIs can range from .55 to 1.79. A
10
higher number means that the patient population is sicker. We have provided CMI
data from the most recent quarter available to us for each home. For 2003, the
average CMI for New York’s nursing homes was 1.17.
Similarly, as to “special needs,” the six categories of special-needs residents
are pediatric, traumatic brain injury, AIDS, ventilator, respite care, and behavioral.
For each facility, the following list indicates the percentage of that facility’s total
resident days in which care is provided for a resident with one of the special needs
other than respite care.
Higher percentages of such special needs patients, and higher CMIs, may
warrant higher staffing levels. Nevertheless, research described in Appendix B
suggests that staffing levels may have an effect on the quality of care provided
even to relatively healthier residents. For low-acuity residents, the consequences
of understaffing may be less severe, but according to the most comprehensive
study, measurable impairment in the quality of care begins when staffing falls
below certain numerical levels, no matter what the resident acuity.
Medical need is, of course, only one factor that can influence staffing, and
indeed, the data reveals factors that can affect staffing even though they have no
apparent relevance to need. For example, in not-for-profit facilities, there is no
difference in total staffing levels depending on whether the facility has a majority
of Medicaid versus non-Medicaid residents.10 But in for-profit homes, facilities
with more than 50% Medicaid patients provided an average of .54 less total
10 Not-for-profit homes include both private not-for-profits and government owned homes.

11
nursing hours per resident day than for-profit homes with mostly non-Medicaid
residents.11
Some other sources of information
There are many sources of information about nursing homes in New York
and issues of staffing. Here are two that you may wish to consult:
11 This estimate is based on a regression analysis of hours per resident day. In addition to Medicaid reimbursement rate, the analysis controlled for other factors such as facility size, location, private reimbursement levels, CMI and the prevalence of special needs patients.
http://www.health.state.ny.us/facilities/nursing/ -- “Nursing Homes in New York State” is a website maintained by the New York State Department of Health.
http://www.medicare.gov/ -- “Nursing Home Compare” is a website maintained by the Centers for Medicare and Medicaid Services of the United States Department of Health and Human Services. Go to the home site at the above address, and then choose Search Tools and Compare Nursing Homes in Your Area.
In addition to these governmental websites, there are privately maintained sites,
readily accessible on the internet, that you may find helpful.
12
Some viewpoints on staffing levels and quality of care in nursing homes
New York’s residential health care facilities are responsible for the health and well-being of more than 100,000 residents ranging from infants with multiple impairments to young adults suffering from the sequelae of traumatic brain injury to the frail elderly with chronic disabilities. For the vast majority of residents, the residential health care facility is their last home. A license to operate a nursing home carries with it a special obligation to the residents who depend upon the facility to meet every basic human need.
Statement of Purpose in New York’s regulation on minimum standards for nursing homesa
__________________________
Poor staffing levels are the single most important contributor to poor quality of nursing home care in the United States. Over the past 25 years, numerous research studies have documented the important relationship between nurse staffing levels, particularly RN staffing, and the outcomes of care. The benefits of higher staffing levels, especially RN staffing, can include lower mortality rates; improved physical functioning; less antibiotic use; fewer pressure ulcers, catheterized residents, and urinary tract infections; lower hospitalization rates; and less weight loss and dehydration.
From a 2004 article by a professor at the University of Californiab
a 10 N.Y.C.R.R. §415.1. b Harrington, C., “Saving Lives Through Quality of Care: A Blueprint for Elder Justice,” Alzheimer’s Care Quarterly 2004; 5(1):24-38

13
The question of the relationship between the number of staff and quality of care is complex and the Phase I and Phase II studies made good faith efforts at addressing the question. However, the Department has concluded that these studies are insufficient for determining the appropriateness of staffing ratios in a number of respects. Specifically, we have serious reservations about the reliability of staffing data at the nursing home level and with the feasibility of establishing staff ratios to improve quality given the variety of quality measures used and the perpetual shifting of such measures. In addition, the studies do not fully address important related issues such as: the relative importance of other factors, such as management, tenure, and training of staff, in determining nursing home quality; the reality of current nursing shortages; and other operational details such as the difference between new nurses and experienced nurses, staff mix, retention and turnover rates, staff organization, etc. For these reasons and others, it would be improper to conclude that the staffing thresholds described in this Phase II study should be used as staffing standards. Most important, the Phase I and Phase II studies do not provide enough information to address the question posed by Congress regarding the appropriateness of establishing minimum ratios.
HHS Secretary. Tommy Thompson, CMS Phase II Transmittal Letterc
__________________________
“It isn't rocket science to say that you need enough staff to help every resident with eating, drinking and infections. It's not like we need to discover the cure for the Nile virus,” said Catherine Hawes, a professor and director of Texas A&M University's Southwest Rural Health Research Center and a national authority in evaluating nursing home quality. “We know how this is supposed to be done, but in all too many places it’s not.”
From a 2002 story in the St. Louis Post-Dispatchd
c “Appropriateness of Minimum Nurse Staffing Ratios in Nursing Homes: Phase II Final Report” (2001), http://63.240.208.147/medicaid/reports/rp1201home.asp. d Schneider & O’Connor, “Nation’s Nursing Homes Are Quietly Killing Thousands,” St. Louis Post-Dispatch (Oct. 12, 2002).

14
[M]y colleagues and I interviewed state survey agency directors, the managers of the
state nurse aide registries, residents, family members, ombudsmen, and CNAs working in nursing homes. There was universal agreement that inadequate staffing was the major preventable cause of abuse and neglect. … In focus group interviews, CNAs explained why staffing shortages caused or contributed to abuse or neglect. First, the CNAs noted that when they were working short-staffed, there was no way to meet all of the residents’ needs. There was strong agreement among the CNAs that the first things to be neglected were range of motion exercises and other types of restorative nursing care, keeping residents hydrated, and giving residents enough time and assistance with eating. Each of these has dire long-term consequences for residents. The CNAs made it clear that they found such a situation profoundly demoralizing, particularly if it persisted over time. They also noted that this inability to meet resident needs was a major cause of staff turnover among good staff….
Senate testimony in 2002 by the director of the Southwest Rural Health Research Center at Texas A&Me
__________________________
Nurse aide work also is dangerous. Back injuries are common from lifting residents, and aides are exposed to infections. Federal labor statistics show nursing home workers rank fourth in the nation in frequency of injuries and illness, higher even than firefighters. Aides say they are poorly equipped to keep up with the needs of residents when they're overworked at facilities that can't or won't hire enough staff, or when they're floated from one unit of a facility to another where they don't know the residents. “You work in places that aren't interested in quality, yet you're given overwhelming responsibilities and asked to do it short-staffed,” said Mia Williams, an aide who quit the business in disgust this year to return to school.
From a 2001 story in the Buffalo Newsf
e Hawes, “Elder Abuse in Residential Long-Term Care Facilities,” testimony before the U.S. Senate Committee on Finance (June 18, 2002). f “Staffing Shortage Reaches a Crisis; The Lack of Nurse Aides at Homes for the Elderly Hurts Quality, and Mistakes in Care Are Common, Sometimes with Deadly Results,” The Buffalo News (Dec. 11, 2001).

15
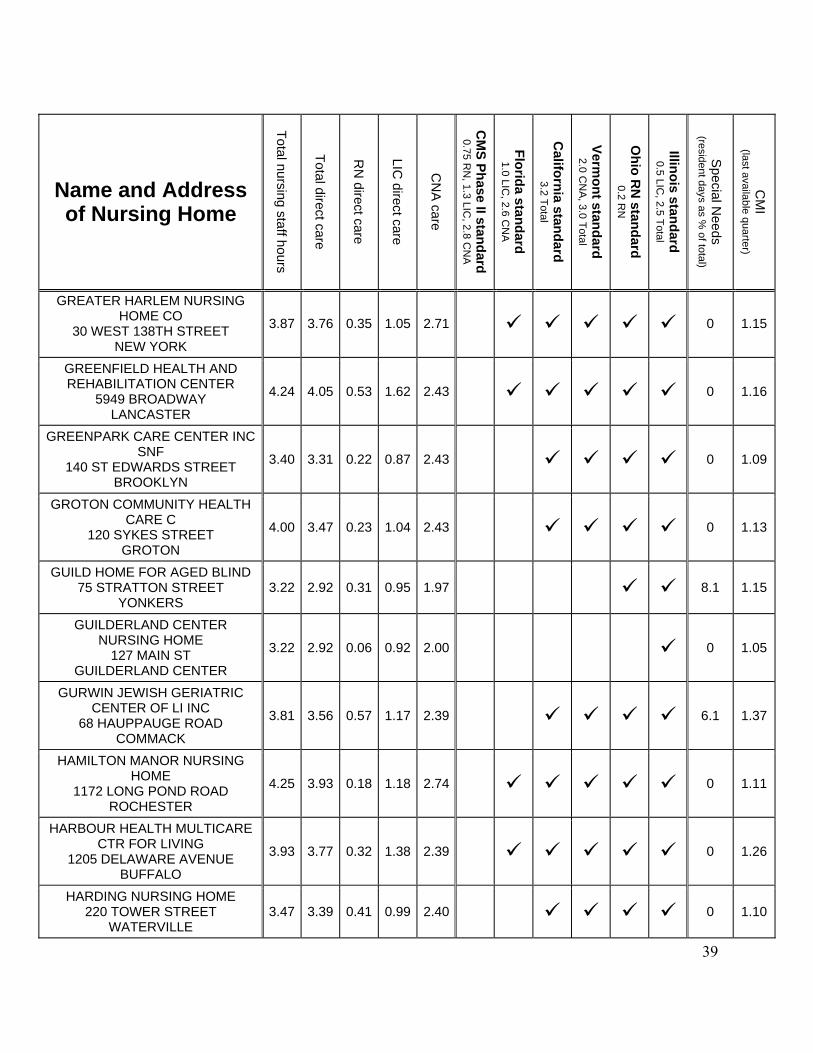
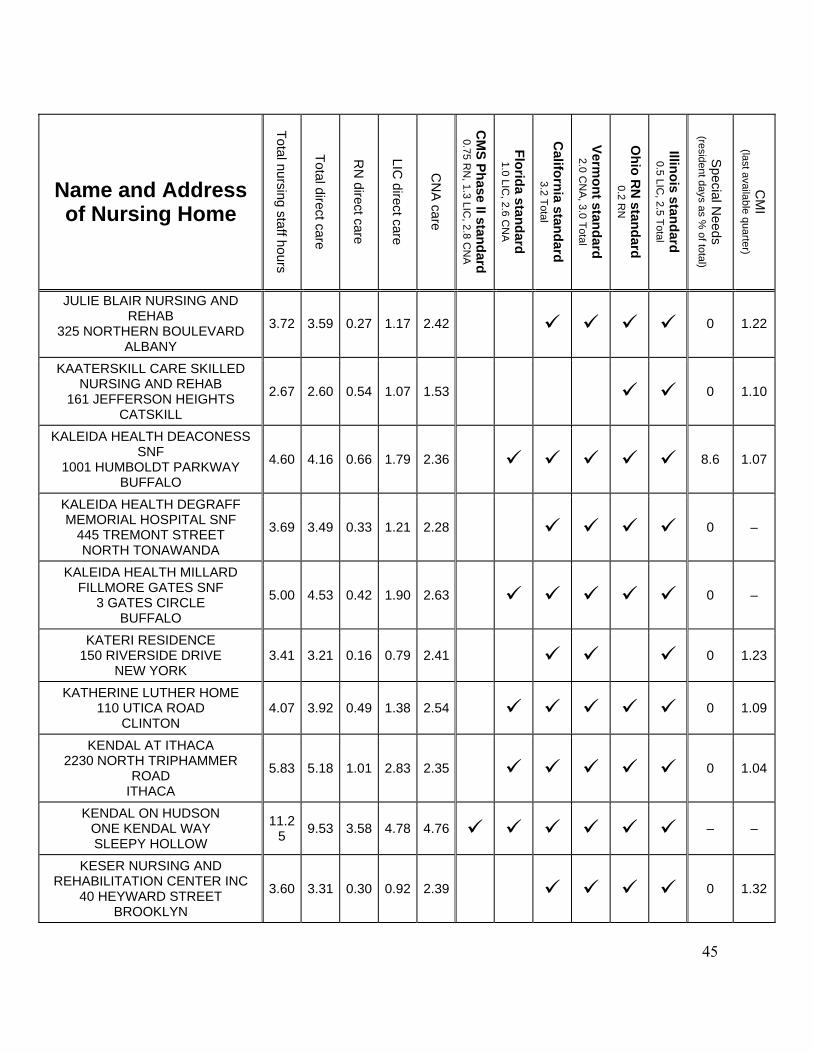
List of Staffing Levels
The list of staffing levels contains the following information:
Column 1: Name and address of nursing home.
Column 2: Total nursing staff hours. Total care is the sum of licensed nursing care plus nurse aide care. Staffing levels in this and the following four columns are expressed in hours per resident day (hprd). This column includes hours spent by nurses on administrative functions as well as on direct (or “hands-on”) care.a
Column 3: Total direct care. This figure includes hands-on care by all nursing caregivers (RNs, LPNs, and CNAs). The figure excludes administrative functions.b Breaking out administrative hours allows comparison to the standards that count only direct care.
Column 4: RN direct care. This includes hands-on care by RNs, and excludes hours reported for the survey categories of DON and Nurses with Administrative Duties. c
Column 5: LIC direct care. “LIC” means licensed nursing care. This includes the hands-on care by RNs plus LPNs, and excludes administrative hours.
Column 6: CNA care. This includes the hours reported for Certified Nurse Aides, all of which is hands-on rather than administrative.
Column 7: CMS Phase II standard. The CMS Phase II study identified the following thresholds: 0.75 hprd of RN care, 1.3 hprd of licensed nursing care, and 2.8 hprd of CNA care. The study measured outcomes against
a Some of the common administrative functions are the preparation of comprehensive resident assessment instruments, quality assurance, infection control, in-service training, and duties of the Director of Nursing and Assistant Director of Nursing. Total hours, including administration, are also included in listings such as the CMS Nursing Home Compare website. b Nurses whose principal duties are administrative may sometimes provide hands-on care, but facilities are to report that care on the appropriate line: Form CMS-671, General Instructions and Definitions at 2 (“If an individual provides service in more than one capacity, separate out the hours in each service performed”). c Some state standards do count certain hours in the DON and administrative categories, and the explanatory notes describe how we give credit for those hours under those standards.
16
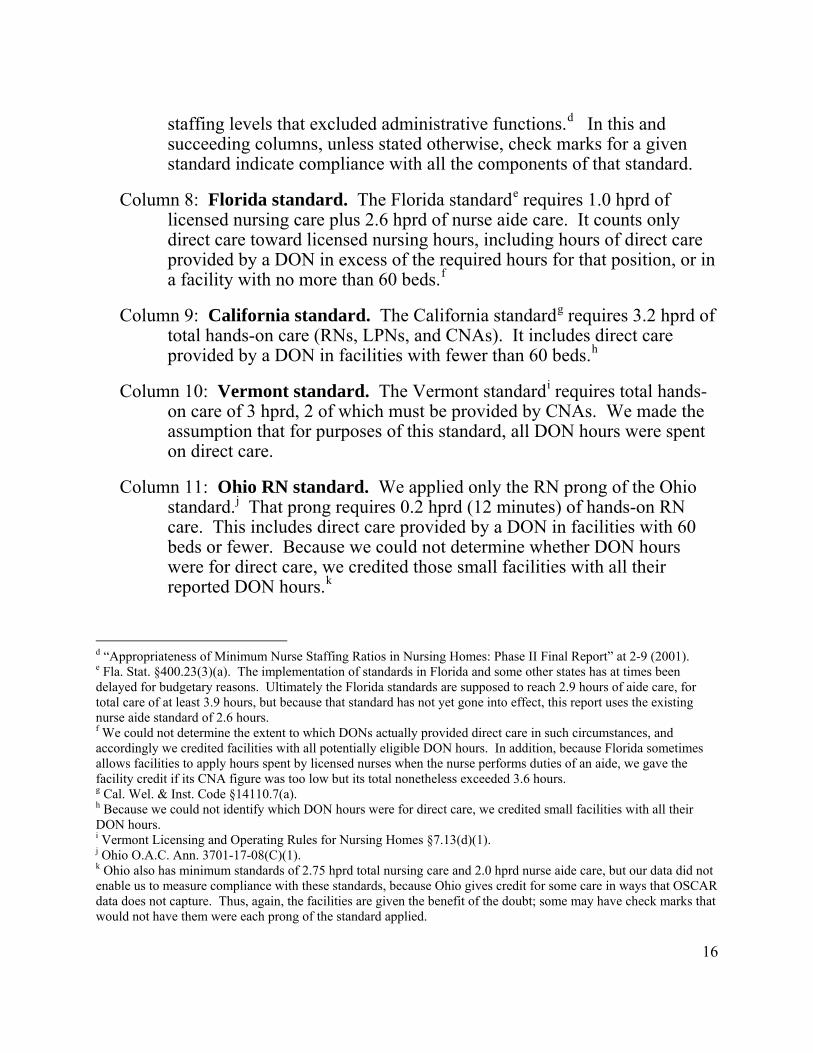
staffing levels that excluded administrative functions.d In this and succeeding columns, unless stated otherwise, check marks for a given standard indicate compliance with all the components of that standard.
Column 8: Florida standard. The Florida standarde requires 1.0 hprd of licensed nursing care plus 2.6 hprd of nurse aide care. It counts only direct care toward licensed nursing hours, including hours of direct care provided by a DON in excess of the required hours for that position, or in a facility with no more than 60 beds.f
Column 9: California standard. The California standardg requires 3.2 hprd of total hands-on care (RNs, LPNs, and CNAs). It includes direct care provided by a DON in facilities with fewer than 60 beds.h
Column 10: Vermont standard. The Vermont standardi requires total hands-on care of 3 hprd, 2 of which must be provided by CNAs. We made the assumption that for purposes of this standard, all DON hours were spent on direct care.
Column 11: Ohio RN standard. We applied only the RN prong of the Ohio standard.j That prong requires 0.2 hprd (12 minutes) of hands-on RN care. This includes direct care provided by a DON in facilities with 60 beds or fewer. Because we could not determine whether DON hours were for direct care, we credited those small facilities with all their reported DON hours.k
d “Appropriateness of Minimum Nurse Staffing Ratios in Nursing Homes: Phase II Final Report” at 2-9 (2001). e Fla. Stat. §400.23(3)(a). The implementation of standards in Florida and some other states has at times been delayed for budgetary reasons. Ultimately the Florida standards are supposed to reach 2.9 hours of aide care, for total care of at least 3.9 hours, but because that standard has not yet gone into effect, this report uses the existing nurse aide standard of 2.6 hours. f We could not determine the extent to which DONs actually provided direct care in such circumstances, and accordingly we credited facilities with all potentially eligible DON hours. In addition, because Florida sometimes allows facilities to apply hours spent by licensed nurses when the nurse performs duties of an aide, we gave the facility credit if its CNA figure was too low but its total nonetheless exceeded 3.6 hours. g Cal. Wel. & Inst. Code §14110.7(a). h Because we could not identify which DON hours were for direct care, we credited small facilities with all their DON hours. i Vermont Licensing and Operating Rules for Nursing Homes §7.13(d)(1). j Ohio O.A.C. Ann. 3701-17-08(C)(1). k Ohio also has minimum standards of 2.75 hprd total nursing care and 2.0 hprd nurse aide care, but our data did not enable us to measure compliance with these standards, because Ohio gives credit for some care in ways that OSCAR data does not capture. Thus, again, the facilities are given the benefit of the doubt; some may have check marks that would not have them were each prong of the standard applied.

17
Column 12: Illinois standard. The Illinois standard requires 2.5 hprd total care, 0.5 of which must be by RNs or LPNs. Illinois does not count DON hours, but we were informed by a representative of the Department of Public Health that hours of all other licensed nurses can be included. We credited each facility with all of its reported hours for nurses with administrative duties.
Column 13: Special Needs. To assist you in determining the gravity of the needs of a facility’s residents, this column shows the percentage of a facility’s total resident days accounted for by special-needs patients.l The columns for Special Needs and CMI have a dash rather than a zero when we did not have the relevant information for the nursing home in question.
Column 14: CMI. Again to assist you in determining the gravity of residents’ needs, this column shows the facility’s Case Mix Index for the last quarter in which the information was available to us. Case mix is a measure of resident acuity as described at page 9 above.
l We include in this calculation pediatric, traumatic brain injury, AIDS, behavioral, and ventilator residents, but exclude respite care.
18
Name and Address of Nursing Home
Total nursing staff hours
Total direct care
RN
direct care
LIC direct care
CN
A care
CM
S Phase II standard 0.75 R
N, 1.3 LIC
, 2.8 CN
A
Florida standard 1.0 LIC
, 2.6 CN
A
California standard
3.2 Total
Vermont standard
2.0 CN
A, 3.0 Total
Ohio R
N standard
0.2 RN
Illinois standard 0.5 LIC
, 2.5 Total
Special N
eeds (resident days as %
of total)
CM
I (last available quarter)
A HOLLY PATTERSON EXTENDED CARE FACILITY 875 JERUSALEM AVENUE
UNIONDALE
2.81 2.75 0.33 0.90 1.85 5.9 1.05
AARON MANOR REHABILITATION & NURSING
CENTER 100 ST CAMILLUS WAY
FAIRPORT
2.32 2.17 0.14 0.93 1.24 – –
ACHIEVE REHAB AND NURSING FACILITY
170 LAKE STREET LIBERTY
3.33 2.87 0.30 1.22 1.65 0 1.13
ADIRONDACK TRI COUNTY NURSING & REHABILITATION
CTR 112 SKI BOWL ROAD
NORTH CREEK
3.54 3.36 0.34 1.08 2.29 – 1.12
AFFINITY SKILLED LIVING AND REHABILITATION CTR 305 LOCUST AVENUE
OAKDALE
3.40 3.33 0.26 1.08 2.25 – –
ALICE HYDE MEDICAL CENTER SNF
133 PARK STREET MALONE
3.60 3.39 0.37 1.15 2.23 0 1.16
AMSTERDAM MEMORIAL HOSPITAL SNF
4988 STATE HWY 30 AMSTERDAM
3.35 3.11 0.24 1.04 2.07 0 1.16
AMSTERDAM NURSING HOME CORP 1
1060 AMSTERDAM AVENUE NEW YORK
3.99 3.71 0.53 0.91 2.80 0 1.22
19
Name and Address of Nursing Home
Total nursing staff hours
Total direct care
RN
direct care
LIC direct care
CN
A care
CM
S Phase II standard 0.75 R
N, 1.3 LIC
, 2.8 CN
A
Florida standard 1.0 LIC
, 2.6 CN
A
California standard
3.2 Total
Vermont standard
2.0 CN
A, 3.0 Total
Ohio R
N standard
0.2 RN
Illinois standard 0.5 LIC
, 2.5 Total
Special N
eeds (resident days as %
of total)
CM
I (last available quarter)
ANDRUS ON HUDSON 185 OLD BROADWAY
HASTINGS ON HUDSON 2.53 2.26 0.19 0.73 1.54 0 0.90
ANN LEE HOME ALBANY SHAKER RD
ALBANY 2.48 2.36 0.20 0.62 1.74 – 0.80
ARBOR HILL CARE CENTER 1175 MONROE AVENUE
ROCHESTER 3.48 3.31 0.13 1.22 2.09 0 1.08
ARNOT OGDEN MED CTR RHCF 600 ROE AVENUE
ELMIRA 4.29 4.29 0.72 1.03 3.26 0 1.11
AUBURN NURSING HOME 85 THORNTON AVENUE
AUBURN 3.51 3.39 0.33 1.10 2.29 0 1.20
AURELIA OSBORN FOX MEMORIAL HO
ONE NORTON AVENUE ONEONTA
3.38 2.98 0.10 0.70 2.29 0 0.96
AUTUMN VIEW HEALTH CARE FACILITY LLC
S 4650 SOUTHWESTERN BLVD HAMBURG
4.50 4.07 0.42 1.56 2.51 0.9 1.29
AVALON GARDENS REHABILITATION & HEALTH
CARE CENTER 7 ROUTE 25A SMITHTOWN
3.12 2.94 0.31 0.90 2.04 0 1.14
AVON NURSING HOME 215 CLINTON STREET
AVON 3.15 2.89 0.30 1.06 1.83 0 1.19
BAINBRIDGE NURSING AND REHABIL
3518 BAINBRIDGE AVENUE BRONX
2.82 2.57 0.00 0.58 1.99 0 1.21
20
Name and Address of Nursing Home
Total nursing staff hours
Total direct care
RN
direct care
LIC direct care
CN
A care
CM
S Phase II standard 0.75 R
N, 1.3 LIC
, 2.8 CN
A
Florida standard 1.0 LIC
, 2.6 CN
A
California standard
3.2 Total
Vermont standard
2.0 CN
A, 3.0 Total
Ohio R
N standard
0.2 RN
Illinois standard 0.5 LIC
, 2.5 Total
Special N
eeds (resident days as %
of total)
CM
I (last available quarter)
BAIRD NURSING HOME 2150 ST PAUL STREET
ROCHESTER 4.07 3.85 0.31 1.19 2.66 0 0.99
BAPTIST HEALTH NURSING AND REH
297 N BALLSTON AVE SCOTIA
3.41 3.15 0.20 1.11 2.04 0 1.08
BAPTIST HOME OF BROOKLYN NY
46 BROOKMEADE DRIVE RHINEBECK
3.33 3.11 0.37 0.98 2.13 0 1.10
BARNWELL NURSING AND REHABILITATION CENTER
3230 CHURCH STREET VALATIE
3.20 2.85 0.25 0.71 2.14 – 1.22
BATAVIA NURSING HOME LLC 257 STATE ST
BATAVIA 3.48 3.30 0.43 1.25 2.05 0 1.23
BAYBERRY NURSING HOME 40 KEOGH LANE NEW ROCHELLE
4.47 4.07 0.49 1.15 2.92 0 1.05
BAYVIEW NURSING HOME ONE LONG BEACH ROAD
ISLAND PARK 3.93 3.77 0.22 0.95 2.81 0 1.24
BEACH TERRACE CARE CENTER 640 WEST BROADWAY
LONG BEACH 3.41 3.22 0.33 0.79 2.43 0 1.14
BEECHWOOD NURSING HOME 100 STAHL ROAD
GETZVILLE 4.36 4.03 0.15 1.33 2.70 0 1.17
BEECHWOOD RESIDENCE 2235 MILLERSPORT HIGHWAY
GETZVILLE 3.74 3.33 0.21 1.19 2.14 0 0.96
BELAIR CARE CENTER INC 2478 JERUSALEM AVE
BELLMORE 3.52 2.83 0.16 0.71 2.12 0 1.41

21
Name and Address of Nursing Home
Total nursing staff hours
Total direct care
RN
direct care
LIC direct care
CN
A care
CM
S Phase II standard 0.75 R
N, 1.3 LIC
, 2.8 CN
A
Florida standard 1.0 LIC
, 2.6 CN
A
California standard
3.2 Total
Vermont standard
2.0 CN
A, 3.0 Total
Ohio R
N standard
0.2 RN
Illinois standard 0.5 LIC
, 2.5 Total
Special N
eeds (resident days as %
of total)
CM
I (last available quarter)
BELLHAVEN NURSING & REHAB CENTER
110 BEAVER DAM ROAD BROOKHAVEN
3.21 3.17 0.20 1.03 2.15 0 1.16
BERKSHIRE NURSING AND REHABILI
10 BERKSHIRE ROAD WEST BABYLON
3.05 2.76 0.21 0.79 1.97 0 1.27
BETHANY GARDENS SKILLED LIVING CENTER
800 WEST CHESTNUT STREET ROME
3.50 3.40 0.15 1.23 2.17 0 1.06
BETHANY NURSING HOME 3005 WATKINS ROAD
HORSEHEADS 3.79 3.52 0.16 1.10 2.42 0 1.21
BETHEL NURSING AND REHABILITAT
67 SPRINGVALE ROAD CROTON ON HUDSON
3.69 3.49 0.29 1.25 2.24 0 1.25
BETHEL NURSING HOME COMPANY IN
17 NARRAGANSETT AVENUE OSSINING
3.28 2.91 0.24 0.94 1.97 0 1.18
BETSY ROSS REHABILITATION CTR
1 ELSIE STREET ROME
3.17 2.87 0.25 0.99 1.88 0 1.13
BEZALEL REHABILITATION AND NURSING CENTER
29 38 FAR ROCKAWAY BLVD FAR ROCKAWAY
3.60 3.33 0.06 0.72 2.61 0 1.40
BIALYSTOKER CENTER FOR NURSING AND REHABILITATION
228 EAST BROADWAY NEW YORK
4.05 3.99 0.41 1.39 2.61 0 –
22
Name and Address of Nursing Home
Total nursing staff hours
Total direct care
RN
direct care
LIC direct care
CN
A care
CM
S Phase II standard 0.75 R
N, 1.3 LIC
, 2.8 CN
A
Florida standard 1.0 LIC
, 2.6 CN
A
California standard
3.2 Total
Vermont standard
2.0 CN
A, 3.0 Total
Ohio R
N standard
0.2 RN
Illinois standard 0.5 LIC
, 2.5 Total
Special N
eeds (resident days as %
of total)
CM
I (last available quarter)
BIRCHWOOD HEALTH CARE CENTER
4800 BEAR ROAD LIVERPOOL
4.23 3.95 0.44 1.53 2.41 0 1.23
BISHOP CHARLES MACLEAN EPISCOP
17 11 BROOKHAVEN AVENUE FAR ROCKAWAY
2.95 2.74 0.16 0.66 2.08 0 1.10
BISHOP FRANCIS J MUGAVERO CENTER
155 DEAN STREET BROOKLYN
3.06 2.87 0.31 0.70 2.16 – 1.21
BISHOP HENRY B HUCLES N H INC
835 HERKIMER STREET BROOKLYN
3.95 3.68 0.00 0.89 2.79 0 –
BLOSSOM HEALTH CARE CENTER
989 BLOSSOM ROAD ROCHESTER
3.31 3.02 0.08 0.99 2.03 0 –
BLOSSOM VIEW NURSING HOME 6884 MAPLE AVE
SODUS 3.80 3.53 0.26 1.21 2.32 0 –
BRIDGE VIEW NURSING HOME INC
143 10 20TH AVE WHITESTONE
2.85 2.72 0.24 0.79 1.93 0 –
BRIDGEWATER CENTER FOR REHAB & NURSING
159 163 FRONT STREET BINGHAMTON
4.65 4.24 0.22 1.30 2.93 0 1.15
BRIODY HEALTH CARE FACILITY 909 LINCOLN AVE
LOCKPORT 4.21 4.02 0.61 1.34 2.68 0 1.13
BROADLAWN MANOR NURSING & REHAB CTR
399 COUNTY LINE RD AMITYVILLE
4.37 4.16 0.40 1.22 2.94 0 1.21

23
Name and Address of Nursing Home
Total nursing staff hours
Total direct care
RN
direct care
LIC direct care
CN
A care
CM
S Phase II standard 0.75 R
N, 1.3 LIC
, 2.8 CN
A
Florida standard 1.0 LIC
, 2.6 CN
A
California standard
3.2 Total
Vermont standard
2.0 CN
A, 3.0 Total
Ohio R
N standard
0.2 RN
Illinois standard 0.5 LIC
, 2.5 Total
Special N
eeds (resident days as %
of total)
CM
I (last available quarter)
BRONX CENTER FOR REHAB HEALTH
1010 UNDERHILL AVE BRONX
3.14 3.06 0.20 0.98 2.07 0 1.23
BRONX LEBANON SPECIAL CARE CEN
1265 FULTON AVENUE BRONX
3.50 3.25 0.42 0.91 2.34 49.4 1.08
BRONX PARK REHABILITATION & NURSING CENTER
3845 CARPENTER AVE BRONX
3.25 3.15 0.31 0.65 2.50 0 –
BROOKHAVEN HEALTH CARE FACILITY, LLC
801 GAZZOLA BLVD EAST PATCHOGUE
3.84 3.43 0.48 0.91 2.52 1.1 1.32
BROOKHAVEN REHAB AND HEALTH CARE CENTER LCC
250 BEACH 17TH STREET FAR ROCKAWAY
2.97 2.74 0.70 0.85 1.89 0 –
BROOKLYN QUEENS NURSING HOME
2749 LINDEN BLVD BROOKLYN
2.20 2.13 0.14 0.74 1.39 0 1.17
BROOKLYN UNITED METHODIST CHURCH HOME
1485 DUMONT AVENUE BROOKLYN
3.61 3.56 0.46 1.30 2.25 0 –
BROTHERS OF MERCY NURSING & REHABILITATION
CENTER 10570 BERGTOLD ROAD
CLARENCE
4.16 3.87 0.34 1.29 2.58 0 1.16
BRUNSWICK NURSING HOME 366 BROADWAY
AMITYVILLE 3.34 3.15 0.16 0.97 2.18 0 1.23
24
Name and Address of Nursing Home
Total nursing staff hours
Total direct care
RN
direct care
LIC direct care
CN
A care
CM
S Phase II standard 0.75 R
N, 1.3 LIC
, 2.8 CN
A
Florida standard 1.0 LIC
, 2.6 CN
A
California standard
3.2 Total
Vermont standard
2.0 CN
A, 3.0 Total
Ohio R
N standard
0.2 RN
Illinois standard 0.5 LIC
, 2.5 Total
Special N
eeds (resident days as %
of total)
CM
I (last available quarter)
BUENA VIDA CONTINUING CARE 48 CEDAR STREET
BROOKLYN 3.20 2.97 0.14 0.73 2.25 0 1.25
CABRINI CENTER FOR NURSING AND REHABILITATION SNF
542 EAST 5TH STREET NEW YORK
2.90 2.66 0.08 0.72 1.94 0 1.18
CABS NURSING HOME COMPANY INC
270 NOSTRAND AVENUE BROOKLYN
3.93 3.74 0.43 1.22 2.52 0 1.17
CAMPBELL HALL REHAB CENTER
23 KIERNAN RD CAMPBELL HALL
3.20 3.14 0.38 0.98 2.16 0 1.33
CANTERBURY WOODS 725 RENAISSANCE DRIVE
WILLIAMSVILLE 3.78 3.65 0.36 1.48 2.17 0 1.15
CARILLON NURSING & REHAB CENTER
830 PARK AVENUE HUNTINGTON
3.21 3.11 0.31 0.90 2.22 0 1.42
CARMEL RICHMOND HC REHAB CTR
88 OLD TOWN ROAD STATEN ISLAND
3.61 3.54 0.67 0.99 2.54 0 1.41
CARTHAGE AREA HOSPITAL SNF
1001 WEST STREET ROAD CARTHAGE
3.37 3.20 0.27 0.99 2.21 0 1.04
CASA PROMESA 308 EAST 175 STREET
BRONX 4.33 3.86 0.66 1.44 2.42 100.0 0.97
CATON PARK NURSING HOME 1312 CATON AVENUE
BROOKLYN 3.07 3.02 0.39 1.04 1.98 0 1.35
25
Name and Address of Nursing Home
Total nursing staff hours
Total direct care
RN
direct care
LIC direct care
CN
A care
CM
S Phase II standard 0.75 R
N, 1.3 LIC
, 2.8 CN
A
Florida standard 1.0 LIC
, 2.6 CN
A
California standard
3.2 Total
Vermont standard
2.0 CN
A, 3.0 Total
Ohio R
N standard
0.2 RN
Illinois standard 0.5 LIC
, 2.5 Total
Special N
eeds (resident days as %
of total)
CM
I (last available quarter)
CATSKILL REGIONAL MEDICAL CTR SNF
68 BUSHVILLE ROAD HARRIS
4.19 3.97 0.54 1.15 2.82 0 1.13
CAYUGA COUNTY NURSING HOME
7451 COUNTY HOUSE ROAD AUBURN
4.72 4.24 0.30 1.38 2.86 0 1.04
CEDAR HEDGE NURSING HOME 260 LAKE STREET
ROUSES POINT 2.77 2.55 0.26 0.94 1.61 0 1.16
CEDAR LODGE NURSING HOME 6 FROWEIN ROAD
CENTER MORICHES 2.91 2.63 0.17 0.86 1.77 0 –
CEDAR MANOR NURSING & REHABILITATION CENTER CEDAR LANE, PO BOX 928
OSSINING
3.84 3.54 0.70 0.86 2.68 0 1.16
CENTER FOR NURSING AND REHABILITATION SNF 520 PROSPECT PLACE
BROOKLYN
3.37 3.22 0.32 0.83 2.38 0 1.32
CENTRAL ISLAND HEALTHCARE 825 OLD COUNTRY RD
PLAINVIEW 3.95 3.62 0.57 1.34 2.28 0 1.36
CENTRAL SUFFOLK HOSPITAL SKILLED NURSING FACILITY
1300 ROANOKE AVENUE RIVERHEAD
3.46 3.08 0.46 1.06 2.02 0 1.39
CHAMPLAIN VALLEY PHYSICIANS HOSPITAL SNF
75 BEEKMAN STREET PLATTSBURGH
4.55 4.24 0.89 1.38 2.86 0 1.02
CHAPIN HOME FOR THE AGING 165 01 CHAPIN PARKWAY
JAMAICA 3.25 3.15 0.27 0.88 2.27 0 1.16

26
Name and Address of Nursing Home
Total nursing staff hours
Total direct care
RN
direct care
LIC direct care
CN
A care
CM
S Phase II standard 0.75 R
N, 1.3 LIC
, 2.8 CN
A
Florida standard 1.0 LIC
, 2.6 CN
A
California standard
3.2 Total
Vermont standard
2.0 CN
A, 3.0 Total
Ohio R
N standard
0.2 RN
Illinois standard 0.5 LIC
, 2.5 Total
Special N
eeds (resident days as %
of total)
CM
I (last available quarter)
CHARLES T SITRIN HEALTH CARE SNF
2050 TILDEN AVE NEW HARTFORD
4.20 3.89 0.21 1.30 2.59 0.2 1.26
CHASE MEMORIAL NURSING HOME CO
ONE TERRACE HEIGHTS NEW BERLIN
3.74 3.60 0.38 1.08 2.51 0 1.11
CHAUTAUQUA COUNTY HOME 10836 TEMPLE ROAD
DUNKIRK 3.14 3.06 0.25 1.01 2.05 0 1.15
CHEMUNG COUNTY HEALTH CENTER
103 WASHINGTON STREET ELMIRA
4.09 3.88 0.38 1.36 2.53 0 1.22
CHENANGO MEMORIAL HOSPITAL
179 NORTH BROAD STREET NORWICH
3.91 3.79 0.32 1.18 2.61 0 0.96
CHILDS NURSING HOME COMPANY IN
25 HACKETT BLVD ALBANY
3.60 3.18 0.26 1.13 2.05 0 1.17
CLAXTON-HEPBURN MED CTR RHCF
214 KING STREET OGDENSBURG
5.90 5.27 0.21 1.69 3.58 0 1.01
CLIFFSIDE REHAB & H C C 119 - 19 GRAHAM COURT
FLUSHING 4.10 4.08 0.58 1.44 2.63 16.2 1.29
CLIFTON FINE HOSPITAL RHCF 1014 OSWEGATCHIE TRAIL, PO
BOX 10 STAR LAKE
6.64 6.22 0.83 2.23 4.00 0 0.98
CLIFTON SPRINGS HOSPITAL & CLINIC SNF
2 COULTER ROAD CLIFTON SPRINGS
4.35 3.89 0.23 1.46 2.43 3.4 1.04

27
Name and Address of Nursing Home
Total nursing staff hours
Total direct care
RN
direct care
LIC direct care
CN
A care
CM
S Phase II standard 0.75 R
N, 1.3 LIC
, 2.8 CN
A
Florida standard 1.0 LIC
, 2.6 CN
A
California standard
3.2 Total
Vermont standard
2.0 CN
A, 3.0 Total
Ohio R
N standard
0.2 RN
Illinois standard 0.5 LIC
, 2.5 Total
Special N
eeds (resident days as %
of total)
CM
I (last available quarter)
CLINTON COUNTY NURSING HOME
16 FLYNN AVENUE PLATTSBURGH
4.02 3.79 0.43 1.49 2.29 0 1.19
CLOVE LAKES HEALTH CARE AND REHABILITATION CENTER
25 FANNING STREET STATEN ISLAND
3.53 3.31 0.35 0.93 2.38 0 1.48
COBBLE HILL HEALTH CENTER INC
380 HENRY STREET BROOKLYN
3.64 3.42 0.37 0.94 2.48 0 1.22
COLD SPRING HILLS CENTER FOR NURSING AND REHABILIT
378 SYOSSET WOODBURY ROAD
WOODBURY
3.35 2.97 0.39 0.87 2.11 – –
COLER-GOLDWATER SPECIALTY HOSPITAL SNF
ROOSEVELT ISLAND NEW YORK
2.35 2.29 0.45 0.75 1.53 0 0.94
COMMUNITY GENERAL HOSPITAL OF GREATER SYR
RHCF 4900 BROAD ROAD
SYRACUSE
4.40 3.92 1.18 1.87 2.04 0 1.06
COMMUNITY MEMORIAL HOSPITAL SNF 150 BROAD ST
HAMILTON
4.12 3.82 0.57 1.25 2.56 0 1.16
CONCORD NURSING HOME 300 MADISON STREET
BROOKLYN 3.52 3.39 0.33 1.18 2.21 9.0 1.22
CONCOURSE REHABILITATION AND N
1072 GRAND CONCOURSE BRONX
3.59 3.36 0.57 1.02 2.34 4.9 –
28
Name and Address of Nursing Home
Total nursing staff hours
Total direct care
RN
direct care
LIC direct care
CN
A care
CM
S Phase II standard 0.75 R
N, 1.3 LIC
, 2.8 CN
A
Florida standard 1.0 LIC
, 2.6 CN
A
California standard
3.2 Total
Vermont standard
2.0 CN
A, 3.0 Total
Ohio R
N standard
0.2 RN
Illinois standard 0.5 LIC
, 2.5 Total
Special N
eeds (resident days as %
of total)
CM
I (last available quarter)
CONESUS LAKE NURSING HOME 6131 BIG TREE ROAD BOX F
LIVONIA 3.40 3.07 0.32 0.88 2.19 0 1.19
CORTLAND CARE CENTER 193 CLINTON AVENUE
CORTLAND 3.39 3.27 0.23 0.94 2.34 0 1.08
CORTLAND MEMORIAL NURSING FACILITY
134 HOMER AVENUE CORTLAND
3.97 3.90 0.59 1.59 2.31 1.3 1.26
CORTLANDT HEALTHCARE LLC 110 OREGON ROAD CORTLANDT MANOR
3.77 3.53 0.39 1.17 2.36 0 1.27
CREST HALL H R F 63 OAKCREST AVENUE
MIDDLE ISLAND 2.35 2.09 0.06 0.78 1.31 0 1.00
CREST MANOR LIVING AND REHABILITATION CENTER 6745 PITTSFORD PALMYRA
ROAD FAIRPORT
4.44 3.95 0.49 1.22 2.73 0 1.11
CROUSE COMMUNITY CENTER INC
101 SOUTH STREET MORRISVILLE
3.79 3.66 0.51 1.04 2.62 0 1.09
CROWN NURSING AND REHAB CENTER
3457 NOSTRAND AVENUE BROOKLYN
3.99 3.93 0.34 1.13 2.80 0 1.36
CUBA MEMORIAL HOSPITAL INC SNF
140 WEST MAIN STREET CUBA
4.58 4.29 0.00 0.94 3.36 0 –
DALEVIEW CARE CENTER 574 FULTON STREET EAST FARMINGDALE
3.57 3.48 0.35 1.17 2.30 0 1.30

29
Name and Address of Nursing Home
Total nursing staff hours
Total direct care
RN
direct care
LIC direct care
CN
A care
CM
S Phase II standard 0.75 R
N, 1.3 LIC
, 2.8 CN
A
Florida standard 1.0 LIC
, 2.6 CN
A
California standard
3.2 Total
Vermont standard
2.0 CN
A, 3.0 Total
Ohio R
N standard
0.2 RN
Illinois standard 0.5 LIC
, 2.5 Total
Special N
eeds (resident days as %
of total)
CM
I (last available quarter)
DAUGHTERS OF JACOB GERIATRIC CENTER
1160 TELLER AVE BRONX
3.33 3.12 0.49 1.06 2.06 2.8 1.19
DAUGHTERS OF SARAH NURSING CENTER
180 WASHINGTON AVE EXT ALBANY
3.50 3.27 0.27 1.12 2.16 0.2 –
DELAWARE COUNTY COUNTRYSIDE
41861 STATE HIGHWAY 10 DELHI
4.00 3.87 0.27 1.32 2.55 0 1.05
DELAWARE NURSING AND REHABILITATION CENTER
1014 DELAWARE AVE BUFFALO
3.41 3.04 0.15 0.96 2.08 0 1.08
DEWITT REHAB AND HEALTH CARE CENTER 211 EAST 79 ST
NEW YORK
3.24 3.18 0.69 0.99 2.18 0 1.26
DITMAS PARK CARE CENTER 2107 DITMAS AVENUE
BROOKLYN 3.75 3.52 0.31 0.97 2.55 0 1.22
DR SUSAN SMITH MCKINNEY NURSIN
594 ALBANY AVENUE BROOKLYN
4.12 3.91 0.38 1.07 2.84 – 1.29
DR WILLIAM O BENENSON REHABILITATION PAVILION
36 17 PARSONS BOULEVARD FLUSHING
4.82 4.64 0.89 1.69 2.95 3.1 1.45
DRY HARBOR S N F 61 35 DRY HARBOR ROAD
MIDDLE VILLAGE 3.01 2.76 0.17 0.63 2.13 0 1.47
DUMONT MASONIC HOME 676 PELHAM ROAD
NEW ROCHELLE 3.92 3.68 0.54 1.15 2.53 8.4 1.22
30
Name and Address of Nursing Home
Total nursing staff hours
Total direct care
RN
direct care
LIC direct care
CN
A care
CM
S Phase II standard 0.75 R
N, 1.3 LIC
, 2.8 CN
A
Florida standard 1.0 LIC
, 2.6 CN
A
California standard
3.2 Total
Vermont standard
2.0 CN
A, 3.0 Total
Ohio R
N standard
0.2 RN
Illinois standard 0.5 LIC
, 2.5 Total
Special N
eeds (resident days as %
of total)
CM
I (last available quarter)
DUTCHESS CENTER FOR REHAB AND HEALTHCARE
9 RESERVOIR ROAD PAWLING
3.04 2.83 0.04 0.95 1.88 – –
EAST HAVEN NURSING AND REHAB C
2323 27 EASTCHESTER ROAD BRONX
2.36 2.15 0.05 0.53 1.62 0 –
EAST NECK NURSING & REHAB CENTER
134 GREAT EAST NECK ROAD WEST BABYLON
3.21 3.16 0.43 0.99 2.17 0 1.27
EAST ROCKAWAY CARE FACILITY
243 ATLANTIC AVENUE LYNBROOK
3.14 2.84 0.16 0.75 2.08 0 1.16
EAST SIDE NURSING HOME 62 PROSPECT ST
WARSAW 3.60 3.44 0.39 1.38 2.06 0 1.12
EASTCHESTER REHAB AND HEALTH CARE CENTER
2700 EASTCHESTER ROAD BRONX
3.55 3.32 0.60 1.04 2.28 8.1 1.26
EASTERN STAR HOME AND INFIRMAR
8290 STATE RT 69 ORISKANY
4.34 3.81 0.21 1.35 2.46 0 1.08
EDDY COHOES REHABILITATION CTR
421 W COLUMBIA STREET COHOES
5.08 4.09 0.77 1.98 2.11 0 1.04
EDDY FORD NURSING HOME COLUMBIA STREET
COHOES 4.19 4.01 0.72 1.47 2.53 0.6 1.12
EDDY HERITAGE HOUSE NURSING CENTER
2920 TIBBITS AVENUE TROY
3.84 3.59 0.26 1.18 2.41 0.5 1.11

31
Name and Address of Nursing Home
Total nursing staff hours
Total direct care
RN
direct care
LIC direct care
CN
A care
CM
S Phase II standard 0.75 R
N, 1.3 LIC
, 2.8 CN
A
Florida standard 1.0 LIC
, 2.6 CN
A
California standard
3.2 Total
Vermont standard
2.0 CN
A, 3.0 Total
Ohio R
N standard
0.2 RN
Illinois standard 0.5 LIC
, 2.5 Total
Special N
eeds (resident days as %
of total)
CM
I (last available quarter)
EDEN PARK HEALTH CARE CENTRE INC CATSKILL
154 JEFFERSON HEIGHTS CATSKILL
3.78 3.46 0.15 0.97 2.49 0.6 1.13
EDEN PARK HEALTH CARE CENTRE INC COBLESKILL
136 PARKWAY DRIVE COBLESKILL
2.10 2.02 0.21 0.78 1.24 0 1.19
EDEN PARK HEALTH CARE CENTRE INC GLENS FALLS
170 WARREN STREET GLENS FALLS
4.05 3.66 0.10 0.95 2.71 0 1.10
EDEN PARK HEALTH CARE CENTRE INC POUGHKEEPSIE
100 FRANKLIN STREET POUGHKEEPSIE
3.54 3.29 0.40 1.22 2.07 0.1 1.16
EDEN PARK HEALTH CARE CENTRE INC UTICA
1800 BUTTERFIELD AVE UTICA
3.62 3.17 0.24 0.94 2.23 0.4 0.98
EDNA TINA WILSON LIVING CENTER
700 ISLAND COTTAGE ROAD ROCHESTER
3.96 3.69 0.44 1.43 2.26 0 1.10
EGER HEALTH CARE CENTER OF STA
140 MEISNER AVENUE STATEN ISLAND
3.67 3.57 0.50 0.86 2.71 0 1.39
ELANT AT BRANDYWINE INC 620 SLEEPY HOLLOW ROAD
BRIARCLIFF MANOR 4.01 3.87 0.93 1.16 2.70 0 1.23
ELANT AT GOSHEN INC 46 HARRIMAN DRIVE
GOSHEN 3.86 3.21 0.40 1.16 2.05 0 1.32
ELANT AT NEWBURGH INC 172 MEADOW HILL ROAD
NEWBURGH 2.61 2.52 0.10 0.65 1.87 0 1.11
32
Name and Address of Nursing Home
Total nursing staff hours
Total direct care
RN
direct care
LIC direct care
CN
A care
CM
S Phase II standard 0.75 R
N, 1.3 LIC
, 2.8 CN
A
Florida standard 1.0 LIC
, 2.6 CN
A
California standard
3.2 Total
Vermont standard
2.0 CN
A, 3.0 Total
Ohio R
N standard
0.2 RN
Illinois standard 0.5 LIC
, 2.5 Total
Special N
eeds (resident days as %
of total)
CM
I (last available quarter)
ELCOR HEALTH SERVICES 48 COLONIAL DRIVE
HORSEHEADS 3.84 3.47 0.11 0.79 2.69 0 –
ELDERWOOD HEALTH CARE AT CRESTWOOD
2600 NIAGARA FALLS BOULEVARD
NIAGARA FALLS
3.38 3.12 0.14 1.24 1.89 0 1.21
ELDERWOOD HEALTH CARE AT HEATHWOOD
815 HOPKINS ROAD WILLIAMSVILLE
3.81 3.58 0.40 1.30 2.28 15.1 1.30
ELDERWOOD HEALTH CARE AT LAKEWOOD
5775 MAELOU DRIVE HAMBURG
3.78 3.56 0.35 1.50 2.06 0 1.15
ELDERWOOD HEALTH CARE AT LINWOOD
1818 COMO PARK BLVD LANCASTER
3.36 3.08 0.22 0.93 2.15 0 1.17
ELDERWOOD HEALTH CARE AT MAPLEWOOD
225 BENNETT ROAD CHEEKTOWAGA
3.88 3.59 0.20 1.32 2.27 0 1.21
ELDERWOOD HEALTH CARE AT OAKWOOD
200 BASSETT ROAD WILLIAMSVILLE
3.51 3.41 0.54 1.25 2.16 0 1.18
ELDERWOOD HEALTH CARE AT RIVERWOOD
2850 GRAND ISLAND BLVD GRAND ISLAND
3.60 3.14 0.00 0.98 2.16 0 1.14
ELDERWOOD HEALTH CARE AT WEDGEWOOD
4459 BAILEY AVE AMHERST
4.09 3.88 0.45 1.51 2.37 0 –
33
Name and Address of Nursing Home
Total nursing staff hours
Total direct care
RN
direct care
LIC direct care
CN
A care
CM
S Phase II standard 0.75 R
N, 1.3 LIC
, 2.8 CN
A
Florida standard 1.0 LIC
, 2.6 CN
A
California standard
3.2 Total
Vermont standard
2.0 CN
A, 3.0 Total
Ohio R
N standard
0.2 RN
Illinois standard 0.5 LIC
, 2.5 Total
Special N
eeds (resident days as %
of total)
CM
I (last available quarter)
ELIZABETH CHURCH MANOR NURSING
863 FRONT STREET BINGHAMTON
3.40 3.02 0.22 0.90 2.12 0.1 1.13
ELIZABETH SETON PEDIATRIC CENTER
590 AVENUE OF THE AMERICAS NEW YORK
8.65 8.34 2.95 4.67 3.67 – –
ELLIS RESIDENTIAL & REHABILITATION CENTER
1101 NOTT STREET SCHENECTADY
4.35 3.94 0.93 1.25 2.68 0 1.17
ELM MANOR NURSING HOME 210 N MAIN STREET
CANANDAIGUA 3.09 2.83 0.22 0.87 1.95 0 1.21
ELMHURST CARE CENTER 100 17 TWENTYTHIRD AVE
EAST ELMHURST 3.76 3.44 0.48 0.94 2.50 0 1.41
EPISCOPAL CHURCH HOME 505 MT HOPE AVENUE
ROCHESTER 3.92 3.61 0.17 1.24 2.37 0 1.06
EPISCOPAL RESIDENTIAL HEALTH CARE FACILITY INC. 24 RHODE ISLAND STREET
BUFFALO
3.68 3.48 0.13 1.20 2.28 0 1.29
ERIE COUNTY MEDICAL CENTER / ERIE COUNTY HOME SNF
462 GRIDER STREET BUFFALO
3.21 3.09 0.47 1.10 1.99 6.0 1.21
EVERGREEN COMMONS 1070 LUTHER ROAD EAST GREENBUSH
3.38 3.17 0.31 1.11 2.06 – –
EVERGREEN VALLEY NURSING HOME
8 BUSHEY BOULEVARD PLATTSBURGH
3.32 3.07 0.18 1.12 1.95 0 1.06
34
Name and Address of Nursing Home
Total nursing staff hours
Total direct care
RN
direct care
LIC direct care
CN
A care
CM
S Phase II standard 0.75 R
N, 1.3 LIC
, 2.8 CN
A
Florida standard 1.0 LIC
, 2.6 CN
A
California standard
3.2 Total
Vermont standard
2.0 CN
A, 3.0 Total
Ohio R
N standard
0.2 RN
Illinois standard 0.5 LIC
, 2.5 Total
Special N
eeds (resident days as %
of total)
CM
I (last available quarter)
FAIRCHILD MANOR NURSING HOME
765 FAIRCHILD PLACE LEWISTON
3.26 3.08 0.11 0.91 2.17 0 1.30
FAIRPORT BAPTIST HOMES 4646 NINE MILE POINT ROAD
FAIRPORT 5.07 4.83 0.55 1.29 3.54 0 –
FAIRVIEW NURSING CARE CTR INC
69 70 GRAND CENTRAL PARKWAY
FOREST HILLS
3.34 3.18 0.66 0.97 2.20 0 1.36
FAR ROCKAWAY NURSING HOME
13 11 VIRGINA ST FAR ROCKAWAY
2.58 2.48 0.32 0.76 1.72 0 –
FATHER BAKER MANOR 6400 POWERS ROAD
ORCHARD PARK 4.35 4.17 0.83 1.91 2.26 0 1.21
FAXTON - ST LUKES HEALTHCARE ALLEN CALDER
1656 CHAMPLIN AVENUE UTICA
5.59 4.85 0.01 1.70 3.14 0 1.20
FERNCLIFF NURSING HOME CO INC
21 FERNCLIFF DRIVE RHINEBECK
2.65 2.48 0.20 0.82 1.67 0 1.13
FIDDLERS GREEN MANOR NURSING HOME
168 WEST MAIN STREET SPRINGVILLE
3.31 3.22 0.15 1.11 2.11 0 1.13
FIELD HOME HOLY COMFORTER 2300 CATHERINE STREET
CORTLANDT MANOR 3.65 3.49 0.42 1.13 2.36 0.3 1.27
FIELDSTON LODGE CARE CENTER
666 KAPPOCK STREET RIVERDALE
3.52 3.37 0.56 1.11 2.25 5.3 1.30

35
Name and Address of Nursing Home
Total nursing staff hours
Total direct care
RN
direct care
LIC direct care
CN
A care
CM
S Phase II standard 0.75 R
N, 1.3 LIC
, 2.8 CN
A
Florida standard 1.0 LIC
, 2.6 CN
A
California standard
3.2 Total
Vermont standard
2.0 CN
A, 3.0 Total
Ohio R
N standard
0.2 RN
Illinois standard 0.5 LIC
, 2.5 Total
Special N
eeds (resident days as %
of total)
CM
I (last available quarter)
FINGER LAKES CENTER FOR LIVING
20 PARK AVENUE AUBURN
4.67 4.07 0.00 1.64 2.43 0 1.06
FINGER LAKES HEALTH 196-198 NORTH STREET
GENEVA 3.54 3.38 0.17 1.12 2.27 0.9 1.16
FISHKILL HEALTH RELATED CENTER
22 ROBERT R. KASIN WAY BEACON
4.50 4.02 0.48 1.47 2.54 0 1.22
FLUSHING MANOR CARE CENTER
139 66 35TH AVENUE FLUSHING
3.90 3.62 0.26 0.59 3.03 0 1.15
FLUSHING MANOR NURSING AND REHABILITATION CENTER
35 15 PARSONS BLVD FLUSHING
3.56 3.45 0.78 0.96 2.49 0 1.28
FOLTS HOME 104 NORTH WASHINGTON
STREET HERKIMER
3.26 3.10 0.21 1.07 2.03 0 1.04
FOREST HILLS CARE CENTER 71 44 YELLOWSTONE BLVD
FOREST HILLS 3.18 2.95 0.22 0.84 2.11 0 1.32
FOREST VIEW CTR REHAB NURSING
71 20 110TH STREET FOREST HILLS
3.69 3.30 0.03 0.89 2.42 0 1.37
FORT HUDSON NURSING CENTER, INC
319 UPPER BROADWAY FORT EDWARD
3.66 3.52 0.35 1.37 2.14 0.2 1.11
FORT TRYON REHAB & HEALTH CARE FACILITY LLC
801 W 190TH ST NEW YORK
3.13 3.04 0.44 0.94 2.10 0 1.38
36
Name and Address of Nursing Home
Total nursing staff hours
Total direct care
RN
direct care
LIC direct care
CN
A care
CM
S Phase II standard 0.75 R
N, 1.3 LIC
, 2.8 CN
A
Florida standard 1.0 LIC
, 2.6 CN
A
California standard
3.2 Total
Vermont standard
2.0 CN
A, 3.0 Total
Ohio R
N standard
0.2 RN
Illinois standard 0.5 LIC
, 2.5 Total
Special N
eeds (resident days as %
of total)
CM
I (last available quarter)
FOUNDERS PAVILLION 205 EAST FIRST STREET
CORNING 3.63 3.14 0.14 0.95 2.19 – 1.18
FOUR SEASONS NURSING AND REHAB
1555 ROCKAWAY PARKWAY BROOKLYN
3.63 3.47 0.29 0.98 2.49 0 1.55
FRANKLIN CENTER FOR REHABILITATION AND NURSING
142 27 FRANKLIN AVENUE FLUSHING
3.56 3.46 0.41 1.06 2.41 3.5 1.51
FRANKLIN COUNTY NURSING HOME
184 FINNEY BOULEVARD MALONE
4.31 4.17 0.52 1.44 2.74 0 1.04
FRANKLIN HOSPITAL MEDICAL CENTER
900 FRANKLIN AVENUE VALLEY STREAM
4.50 4.07 0.53 1.52 2.54 0 1.37
FRIEDWALD CENTER FOR REHAB AND NURSING LLC
475 NEW HEMPSTEAD ROAD NEW CITY
3.58 3.32 0.53 1.08 2.23 6.3 1.32
FULTON COMMONS CARE INC 60 MERRICK AVENUE
EAST MEADOW 2.89 2.81 0.33 0.86 1.95 – 1.14
FULTON COUNTY RESIDENTIAL HCF
847 CO HWY 122 GLOVERSVILLE
2.94 2.74 0.25 0.88 1.86 0 1.05
GARDEN CARE CENTER 135 FRANKLIN AVENUE
FRANKLIN SQUARE 3.86 3.50 0.16 1.10 2.40 0 1.37
GARDEN GATE HEALTH CARE FACILITY
2365 UNION ROAD CHEEKTOWAGA
4.45 4.19 0.50 1.56 2.63 1.2 –

37
Name and Address of Nursing Home
Total nursing staff hours
Total direct care
RN
direct care
LIC direct care
CN
A care
CM
S Phase II standard 0.75 R
N, 1.3 LIC
, 2.8 CN
A
Florida standard 1.0 LIC
, 2.6 CN
A
California standard
3.2 Total
Vermont standard
2.0 CN
A, 3.0 Total
Ohio R
N standard
0.2 RN
Illinois standard 0.5 LIC
, 2.5 Total
Special N
eeds (resident days as %
of total)
CM
I (last available quarter)
GENESEE COUNTY NURSING HOME
278 BANK STREET BATAVIA
3.89 3.63 0.56 1.19 2.43 0 1.31
GERRY NURSING HOME CO., INC
4600 ROUTE 60 GERRY
3.39 3.07 0.09 0.94 2.13 0 1.13
GLEN ARDEN INC 46 HARRIMAN DRIVE
GOSHEN 3.05 2.96 0.67 1.06 1.90 0 1.22
GLEN COVE CENTER FOR NURSING
6 MEDICAL PLAZA GLEN COVE
3.08 2.89 0.17 0.91 1.98 0 1.38
GLEN ISLAND CARE CENTER 490 PELHAM ROAD
NEW ROCHELLE 4.12 2.66 0.27 0.65 2.01 0 1.35
GLENDALE HOME SCHDY CNTY DEPT
59 HETCHELTOWN ROAD SCOTIA
3.34 3.19 0.47 1.10 2.09 0 1.10
GLENGARIFF HEALTH CARE CENTER
141 DOSORIS LANE GLEN COVE
4.16 3.69 0.51 1.13 2.56 0 1.27
GOLD CREST CARE CENTER 2316 BRUNER AVENUE
BRONX 3.07 2.72 0.03 0.74 1.98 0 1.18
GOLDEN GATE REHAB AND HCC 191 BRADLEY AVE STATEN ISLAND
2.62 2.39 0.16 0.56 1.83 0 1.26
GOLDEN HILL HEALTH CARE CENTER
99 GOLDEN HILL DRIVE KINGSTON
3.69 3.47 0.33 1.14 2.32 0 1.07

38
Name and Address of Nursing Home
Total nursing staff hours
Total direct care
RN
direct care
LIC direct care
CN
A care
CM
S Phase II standard 0.75 R
N, 1.3 LIC
, 2.8 CN
A
Florida standard 1.0 LIC
, 2.6 CN
A
California standard
3.2 Total
Vermont standard
2.0 CN
A, 3.0 Total
Ohio R
N standard
0.2 RN
Illinois standard 0.5 LIC
, 2.5 Total
Special N
eeds (resident days as %
of total)
CM
I (last available quarter)
GOOD SAMARITAN LUTHERAN HCC
125 ROCKEFELLER ROAD DELMAR
4.13 4.00 0.32 1.45 2.55 – 1.22
GOOD SAMARITAN NURSING HOME
101 ELM ST SAYVILLE
4.44 3.78 0.08 0.95 2.83 0 1.18
GOOD SHEPHERD FAIRVIEW HOME
80 FAIRVIEW AVENUE BINGHAMTON
4.23 3.81 0.44 1.51 2.29 0.1 1.06
GOUVERNEUR HEALTH CARE SERVICES
227 MADISON STREET NEW YORK
3.59 3.43 0.58 1.31 2.12 0 1.10
GOWANDA NURSING HOME 100 MILLER STREET
GOWANDA 3.53 3.35 0.17 1.13 2.22 0 1.05
GRACE MANOR HEALTH CARE FACILITY
10 SYMPHONY CIRCLE BUFFALO
3.46 3.17 0.24 1.10 2.08 0 1.14
GRACE PLAZA NURSING AND REHABILITATION CENTER
15 ST PAULS PLACE GREAT NECK
3.60 3.29 0.49 1.13 2.16 0 1.37
GRAND MANOR NURSING AND REHAB
700 WHITE PLAINS ROAD BRONX
2.09 2.00 0.23 0.57 1.42 0 –
GRANDELL REHABILITATION AND NU
645 W BROADWAY LONG BEACH
3.18 2.92 0.16 0.74 2.19 0 1.20
39
Name and Address of Nursing Home
Total nursing staff hours
Total direct care
RN
direct care
LIC direct care
CN
A care
CM
S Phase II standard 0.75 R
N, 1.3 LIC
, 2.8 CN
A
Florida standard 1.0 LIC
, 2.6 CN
A
California standard
3.2 Total
Vermont standard
2.0 CN
A, 3.0 Total
Ohio R
N standard
0.2 RN
Illinois standard 0.5 LIC
, 2.5 Total
Special N
eeds (resident days as %
of total)
CM
I (last available quarter)
GREATER HARLEM NURSING HOME CO
30 WEST 138TH STREET NEW YORK
3.87 3.76 0.35 1.05 2.71 0 1.15
GREENFIELD HEALTH AND REHABILITATION CENTER
5949 BROADWAY LANCASTER
4.24 4.05 0.53 1.62 2.43 0 1.16
GREENPARK CARE CENTER INC SNF
140 ST EDWARDS STREET BROOKLYN
3.40 3.31 0.22 0.87 2.43 0 1.09
GROTON COMMUNITY HEALTH CARE C
120 SYKES STREET GROTON
4.00 3.47 0.23 1.04 2.43 0 1.13
GUILD HOME FOR AGED BLIND 75 STRATTON STREET
YONKERS 3.22 2.92 0.31 0.95 1.97 8.1 1.15
GUILDERLAND CENTER NURSING HOME
127 MAIN ST GUILDERLAND CENTER
3.22 2.92 0.06 0.92 2.00 0 1.05
GURWIN JEWISH GERIATRIC CENTER OF LI INC
68 HAUPPAUGE ROAD COMMACK
3.81 3.56 0.57 1.17 2.39 6.1 1.37
HAMILTON MANOR NURSING HOME
1172 LONG POND ROAD ROCHESTER
4.25 3.93 0.18 1.18 2.74 0 1.11
HARBOUR HEALTH MULTICARE CTR FOR LIVING
1205 DELAWARE AVENUE BUFFALO
3.93 3.77 0.32 1.38 2.39 0 1.26
HARDING NURSING HOME 220 TOWER STREET
WATERVILLE 3.47 3.39 0.41 0.99 2.40 0 1.10
40
Name and Address of Nursing Home
Total nursing staff hours
Total direct care
RN
direct care
LIC direct care
CN
A care
CM
S Phase II standard 0.75 R
N, 1.3 LIC
, 2.8 CN
A
Florida standard 1.0 LIC
, 2.6 CN
A
California standard
3.2 Total
Vermont standard
2.0 CN
A, 3.0 Total
Ohio R
N standard
0.2 RN
Illinois standard 0.5 LIC
, 2.5 Total
Special N
eeds (resident days as %
of total)
CM
I (last available quarter)
HARRIS HILL NURSING FACILITY LLC
2699 WHERLE DRIVE WILLIAMSVILLE
3.40 3.23 0.47 1.50 1.72 0.2 1.10
HAVEN MANOR HEALTH CARE CENTER
1441 GATEWAY BOULEVARD FAR ROCKAWAY
1.82 1.75 0.15 0.70 1.05 0 1.01
HAWTHORN HEALTH MULTICARE CTR FOR LIVING
1175 DELAWARE AVE BUFFALO
4.06 3.77 0.23 1.29 2.48 0 1.16
HAYM SALOMON HOME FOR THE AGED
2340 CROPSEY AVENUE BROOKLYN
4.68 4.45 0.47 1.15 3.30 0 1.39
HEBREW HOSP HOME OF WEST INC
61 GRASSLANDS ROAD VALHALLA
3.67 3.42 0.26 0.71 2.71 0 1.22
HEBREW HOME FOR THE AGED AT RIVERDALE
5901 PALISADE AVENUE RIVERDALE
2.81 2.74 0.47 0.88 1.86 0 1.15
HEBREW HOME FOR THE AGED AT RIVERDALE
3220 HENRY HUDSON PARKWAY BRONX
3.67 3.41 0.25 0.78 2.63 0 1.23
HEBREW HOSP HOME INC 801 CO OP CITY BLVD
BRONX 3.08 2.90 0.27 0.88 2.03 0.2 1.11
HELEN AND MICHAEL SCHAFFER ECC 16 GUION PLACE NEW ROCHELLE
4.47 4.08 0.95 1.29 2.79 0 1.36

41
Name and Address of Nursing Home
Total nursing staff hours
Total direct care
RN
direct care
LIC direct care
CN
A care
CM
S Phase II standard 0.75 R
N, 1.3 LIC
, 2.8 CN
A
Florida standard 1.0 LIC
, 2.6 CN
A
California standard
3.2 Total
Vermont standard
2.0 CN
A, 3.0 Total
Ohio R
N standard
0.2 RN
Illinois standard 0.5 LIC
, 2.5 Total
Special N
eeds (resident days as %
of total)
CM
I (last available quarter)
HEMPSTEAD PARK NURSING HOME
800 FRONT STREET HEMPSTEAD
3.46 3.24 0.13 0.74 2.50 0 1.17
HERITAGE COMMONS RESIDENTIAL HEALTH CARE
1019 WICKER STREET TICONDEROGA
4.08 3.77 0.22 1.17 2.60 0 1.17
HERITAGE GREEN NURSING HOME
PO BOX 400 ROUTE 430 GREENHURST
3.19 2.94 0.04 0.85 2.09 0 1.12
HERITAGE HEALTH CARE CENTER
1657 SUNSET AVE UTICA
3.18 3.08 0.43 1.26 1.82 0 1.20
HERITAGE PARK HEALTH CARE CENTER
150 PRATHER AVENUE JAMESTOWN
3.48 3.23 0.18 1.02 2.21 0 1.16
HIGHBRIDGE WOODYCREST CENTER
936 WOODYCREST AVENUE BRONX
3.39 3.22 0.50 1.37 1.85 100.0 0.85
HIGHFIELD GARDENS CARE CENTER OF GREAT NECK
199 COMMUNITY DRIVE GREAT NECK
3.22 3.11 0.33 0.89 2.22 0 –
HIGHLAND CARE CENTER INC 91 31 175TH STREET
JAMAICA 3.10 2.87 0.01 0.79 2.08 0 –
HIGHLAND HEALTHCARE CENTER
160 SENECA ST WELLSVILLE
3.77 3.55 0.23 1.13 2.42 0 1.18
HIGHLAND NURSING HOME INC 182 HIGHLAND ROAD
MASSENA 3.35 3.23 0.42 0.94 2.30 0 1.04
42
Name and Address of Nursing Home
Total nursing staff hours
Total direct care
RN
direct care
LIC direct care
CN
A care
CM
S Phase II standard 0.75 R
N, 1.3 LIC
, 2.8 CN
A
Florida standard 1.0 LIC
, 2.6 CN
A
California standard
3.2 Total
Vermont standard
2.0 CN
A, 3.0 Total
Ohio R
N standard
0.2 RN
Illinois standard 0.5 LIC
, 2.5 Total
Special N
eeds (resident days as %
of total)
CM
I (last available quarter)
HIGHLANDS LIVING CENTER 500 HAHNEMANN TRAIL
PITTSFORD 3.85 3.58 0.55 1.47 2.11 0 1.18
HILAIRE FARM NURSING HOME PO BOX 519
HUNTINGTON 3.69 3.46 0.82 1.02 2.44 0 1.10
HILL HAVEN NURSING HOME 1550 EMPIRE BLVD
WEBSTER 3.47 3.13 0.28 1.11 2.03 0 1.03
HILLSIDE MANOR REHAB AND EXTEN
182 15 HILLSIDE AVENUE JAMAICA EST
3.14 3.08 0.44 1.00 2.08 0 1.35
HOLLIS PARK MANOR NURSING HOME
191 06 HILLSIDE AVENUE HOLLIS
3.05 2.98 0.24 0.89 2.09 0 1.12
HOLY FAMILY HOME 1740 84TH STREET
BROOKLYN 3.64 3.42 0.60 0.80 2.62 0 1.23
HOOSICK FALLS HEALTH CENTER
21 DANFORTH STREET HOOSICK FALLS
4.11 3.81 0.40 1.29 2.52 0 1.20
HORACE NYE HOME 81 PARK STREET ELIZABETHTOWN
4.33 4.03 0.40 1.31 2.72 0 1.05
HORNELL GARDENS 434 MONROE AVENUE
HORNELL 3.67 3.39 0.27 1.20 2.19 0 1.11
HUDSON HAVEN CARE CENTER 37 MESIER AVENUE WAPPINGERS FALLS
4.61 4.39 0.56 1.83 2.57 0 1.19
HUDSON VALLEY REHAB AND EXT CA
260 VINEYARD AVE, RT 44/55 HIGHLAND
3.54 3.45 0.28 1.21 2.24 0 –
43
Name and Address of Nursing Home
Total nursing staff hours
Total direct care
RN
direct care
LIC direct care
CN
A care
CM
S Phase II standard 0.75 R
N, 1.3 LIC
, 2.8 CN
A
Florida standard 1.0 LIC
, 2.6 CN
A
California standard
3.2 Total
Vermont standard
2.0 CN
A, 3.0 Total
Ohio R
N standard
0.2 RN
Illinois standard 0.5 LIC
, 2.5 Total
Special N
eeds (resident days as %
of total)
CM
I (last available quarter)
HUNTINGTON HILLS CENTER 400 SOUTH SERVICE ROAD
MELVILLE 3.61 3.37 0.30 1.05 2.32 0 1.33
HYDE PARK NURSING HOME INC 4975 ABANY POST ROAD
STAATSBURG 2.93 2.67 0.34 0.98 1.69 0 1.20
IDEAL SENIOR LIVING CENTER 601 HIGH AVENUE
ENDICOTT 3.36 2.95 0.18 0.78 2.17 0 1.04
INDIAN RIVER REHABILITATION & HCC INC
17 MADISON STREET GRANVILLE
2.95 2.88 0.39 0.87 2.01 0 1.05
IRA DAVENPORT MEM HOSP SNF
7571 STATE ROUTE 54 BATH
3.26 2.98 0.19 0.92 2.06 0 1.05
IROQUOIS NURSING HOME INC 4600 SOUTHWOOD HEIGHTS
DRIVE JAMESVILLE
3.76 3.69 0.25 1.11 2.58 0 1.21
ISABELLA GERIATRIC CENTER INC
515 AUDUBON AVENUE NEW YORK
3.46 3.34 0.59 0.92 2.42 2.7 1.28
ISLAND NURSING AND REHABILITATION CENTER, INC
5537 EXPRESSWAY DRIVE NORTH
HOLTSVILLE
3.97 3.52 0.17 1.20 2.31 0 1.34
JAMAICA HOSPITAL NURSING HOME
90 28 VAN WYCK EXPRESSWAY JAMAICA
3.54 3.23 0.67 1.16 2.07 0 1.35
JAMES A EDDY MEMORIAL GERIATRIC CENTER
2256 BURDETT AVENUE TROY
3.78 3.49 0.40 1.15 2.34 0 1.03

44
Name and Address of Nursing Home
Total nursing staff hours
Total direct care
RN
direct care
LIC direct care
CN
A care
CM
S Phase II standard 0.75 R
N, 1.3 LIC
, 2.8 CN
A
Florida standard 1.0 LIC
, 2.6 CN
A
California standard
3.2 Total
Vermont standard
2.0 CN
A, 3.0 Total
Ohio R
N standard
0.2 RN
Illinois standard 0.5 LIC
, 2.5 Total
Special N
eeds (resident days as %
of total)
CM
I (last available quarter)
JAMES G JOHNSTON MEMORIAL NURSING HOME
285 DEYO HILL ROAD JOHNSON CITY
4.04 3.68 0.44 1.28 2.41 1.2 1.05
JAMES SQUARE HEALTH AND REHABI
918 JAMES STREET SYRACUSE
3.92 3.65 0.16 1.25 2.40 0.2 1.06
JEFFERSONS FERRY LIFE CARE CO
500 MATHER DRIVE SOUTH SETAUKET
4.19 3.90 0.51 1.58 2.32 0 1.02
JENNIE B RICHMOND CHAFFEE NURSING HOME CO., INC. 222 EAST MAIN STREET
SPRINGVILLE
3.87 3.44 0.17 1.02 2.42 0 1.04
JENNIFER MATTHEW NRS & REHAB
1335 PORTLAND AVE ROCHESTER
4.19 3.94 0.16 1.38 2.55 0 1.14
JEWISH HOME AND HOSPITAL BRONX
100 WEST KINGSBRIDGE ROAD BRONX
3.19 3.03 0.70 0.86 2.17 – –
JEWISH HOME AND HOSPITAL FOR AGED
120 WEST 106TH STREET NEW YORK
3.63 3.44 0.78 1.08 2.35 0 1.29
JEWISH HOME OF ROCHESTER 2021 WINTON ROAD SOUTH
ROCHESTER 4.28 3.91 0.18 1.32 2.59 0 0.97
JOHN J FOLEY SKILLED NURSING FACILITY 14 GLOVER DRIVE
YAPHANK
4.35 3.99 0.21 1.03 2.95 4.7 1.26
45
Name and Address of Nursing Home
Total nursing staff hours
Total direct care
RN
direct care
LIC direct care
CN
A care
CM
S Phase II standard 0.75 R
N, 1.3 LIC
, 2.8 CN
A
Florida standard 1.0 LIC
, 2.6 CN
A
California standard
3.2 Total
Vermont standard
2.0 CN
A, 3.0 Total
Ohio R
N standard
0.2 RN
Illinois standard 0.5 LIC
, 2.5 Total
Special N
eeds (resident days as %
of total)
CM
I (last available quarter)
JULIE BLAIR NURSING AND REHAB
325 NORTHERN BOULEVARD ALBANY
3.72 3.59 0.27 1.17 2.42 0 1.22
KAATERSKILL CARE SKILLED NURSING AND REHAB
161 JEFFERSON HEIGHTS CATSKILL
2.67 2.60 0.54 1.07 1.53 0 1.10
KALEIDA HEALTH DEACONESS SNF
1001 HUMBOLDT PARKWAY BUFFALO
4.60 4.16 0.66 1.79 2.36 8.6 1.07
KALEIDA HEALTH DEGRAFF MEMORIAL HOSPITAL SNF
445 TREMONT STREET NORTH TONAWANDA
3.69 3.49 0.33 1.21 2.28 0 –
KALEIDA HEALTH MILLARD FILLMORE GATES SNF
3 GATES CIRCLE BUFFALO
5.00 4.53 0.42 1.90 2.63 0 –
KATERI RESIDENCE 150 RIVERSIDE DRIVE
NEW YORK 3.41 3.21 0.16 0.79 2.41 0 1.23
KATHERINE LUTHER HOME 110 UTICA ROAD
CLINTON 4.07 3.92 0.49 1.38 2.54 0 1.09
KENDAL AT ITHACA 2230 NORTH TRIPHAMMER
ROAD ITHACA
5.83 5.18 1.01 2.83 2.35 0 1.04
KENDAL ON HUDSON ONE KENDAL WAY SLEEPY HOLLOW
11.25 9.53 3.58 4.78 4.76 – –
KESER NURSING AND REHABILITATION CENTER INC
40 HEYWARD STREET BROOKLYN
3.60 3.31 0.30 0.92 2.39 0 1.32
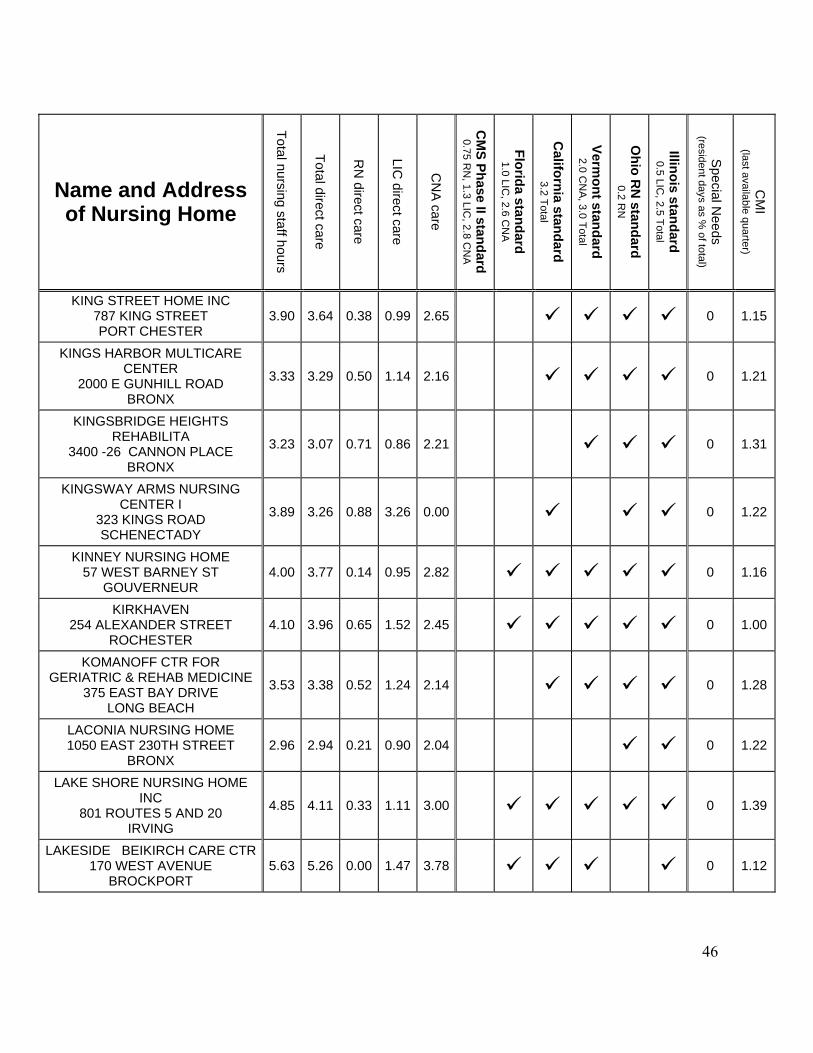
46
Name and Address of Nursing Home
Total nursing staff hours
Total direct care
RN
direct care
LIC direct care
CN
A care
CM
S Phase II standard 0.75 R
N, 1.3 LIC
, 2.8 CN
A
Florida standard 1.0 LIC
, 2.6 CN
A
California standard
3.2 Total
Vermont standard
2.0 CN
A, 3.0 Total
Ohio R
N standard
0.2 RN
Illinois standard 0.5 LIC
, 2.5 Total
Special N
eeds (resident days as %
of total)
CM
I (last available quarter)
KING STREET HOME INC 787 KING STREET PORT CHESTER
3.90 3.64 0.38 0.99 2.65 0 1.15
KINGS HARBOR MULTICARE CENTER
2000 E GUNHILL ROAD BRONX
3.33 3.29 0.50 1.14 2.16 0 1.21
KINGSBRIDGE HEIGHTS REHABILITA
3400 -26 CANNON PLACE BRONX
3.23 3.07 0.71 0.86 2.21 0 1.31
KINGSWAY ARMS NURSING CENTER I
323 KINGS ROAD SCHENECTADY
3.89 3.26 0.88 3.26 0.00 0 1.22
KINNEY NURSING HOME 57 WEST BARNEY ST
GOUVERNEUR 4.00 3.77 0.14 0.95 2.82 0 1.16
KIRKHAVEN 254 ALEXANDER STREET
ROCHESTER 4.10 3.96 0.65 1.52 2.45 0 1.00
KOMANOFF CTR FOR GERIATRIC & REHAB MEDICINE
375 EAST BAY DRIVE LONG BEACH
3.53 3.38 0.52 1.24 2.14 0 1.28
LACONIA NURSING HOME 1050 EAST 230TH STREET
BRONX 2.96 2.94 0.21 0.90 2.04 0 1.22
LAKE SHORE NURSING HOME INC
801 ROUTES 5 AND 20 IRVING
4.85 4.11 0.33 1.11 3.00 0 1.39
LAKESIDE BEIKIRCH CARE CTR 170 WEST AVENUE
BROCKPORT 5.63 5.26 0.00 1.47 3.78 0 1.12

47
Name and Address of Nursing Home
Total nursing staff hours
Total direct care
RN
direct care
LIC direct care
CN
A care
CM
S Phase II standard 0.75 R
N, 1.3 LIC
, 2.8 CN
A
Florida standard 1.0 LIC
, 2.6 CN
A
California standard
3.2 Total
Vermont standard
2.0 CN
A, 3.0 Total
Ohio R
N standard
0.2 RN
Illinois standard 0.5 LIC
, 2.5 Total
Special N
eeds (resident days as %
of total)
CM
I (last available quarter)
LAKESIDE NURSING HOME 1229 TRUMANSBURG ROAD
ITHACA 3.36 3.13 0.39 1.08 2.05 0 1.04
LATTA ROAD NURSING HOME 2100 LATTA ROAD
ROCHESTER 3.78 3.60 0.32 1.18 2.42 0 1.13
LATTA ROAD NURSING HOME A 2102 LATTA ROAD
ROCHESTER 3.81 3.67 0.31 1.20 2.47 0 1.04
LAWRENCE NURSING CARE CENTER
350 BEACH 54TH STREET ARVERNE
3.07 2.97 0.28 0.84 2.13 0 1.05
LEMBERG HOME AND GERIATRIC INS
8629 BAY PARKWAY BROOKLYN
3.48 3.36 0.47 0.93 2.43 0 1.42
LEROY VILLAGE GREEN RESDNTL HLTH CARE FACILITY
INC 10 MUNSON STREET
LEROY
3.91 3.48 0.22 0.87 2.61 0 1.08
LEWIS COUNTY R H C F 7785 NORTH STATE STREET
LOWVILLE 3.40 3.23 0.00 1.08 2.14 0 1.08
LILY POND NURSING HOME 150 LILY POND AVE
STATEN ISLAND 2.33 2.15 0.03 0.53 1.62 0 1.05
LITTLE FALLS HOSPITAL 140 BURWELL STREET
LITTLE FALLS 3.69 3.49 0.12 0.91 2.58 0 1.14
LITTLE FLOWER NURSING HOME
340 EAST MONTAUK HIGHWAY EAST ISLIP
2.98 2.78 0.16 0.92 1.86 0 1.15

48
Name and Address of Nursing Home
Total nursing staff hours
Total direct care
RN
direct care
LIC direct care
CN
A care
CM
S Phase II standard 0.75 R
N, 1.3 LIC
, 2.8 CN
A
Florida standard 1.0 LIC
, 2.6 CN
A
California standard
3.2 Total
Vermont standard
2.0 CN
A, 3.0 Total
Ohio R
N standard
0.2 RN
Illinois standard 0.5 LIC
, 2.5 Total
Special N
eeds (resident days as %
of total)
CM
I (last available quarter)
LIVINGSTON COUNTY CAMPUS SNF
ONE MURRAY HILL DRIVE MOUNT MORRIS
4.13 3.84 0.26 1.28 2.55 0 1.12
LIVINGSTON COUNTY S N F 4600 MILLENNIUM DRIVE
GENESEO 4.19 3.84 0.15 1.23 2.61 0 1.17
LIVINGSTON HILLS NURSING & REHABILITATION CTR ROUTE 9 PO BOX 95
LIVINGSTON
3.67 3.50 0.29 1.23 2.27 0 –
LONG ISLAND CARE CENTER INC
144-61 38TH AVE FLUSHING
3.36 3.25 0.27 1.11 2.14 4.6 1.33
LONG ISLAND STATE VETERANS HOME
100 PATRIOTS ROAD STONYBROOK
3.88 3.71 0.81 1.29 2.43 0 1.10
LORETTO HEALTH AND REHABILITATION CENTER
700 EAST BRIGHTON AVENUE SYRACUSE
3.49 3.31 0.14 1.10 2.21 0 –
LORETTO UTICA RES H C F INC 1445 KEMBLE STREET
UTICA 3.39 3.29 0.38 1.46 1.83 0 –
LORETTO-OSWEGO HEALTH AND REHAB CENTER 132 ELLEN STREET
OSWEGO
3.31 2.89 0.00 0.71 2.18 0 –
LUTHERAN AUGUSTANA CENTER FOR EXTENDED CARE
& REHA 5434 SECOND AVENUE
BROOKLYN
3.20 3.03 0.35 0.97 2.06 0 1.31

49
Name and Address of Nursing Home
Total nursing staff hours
Total direct care
RN
direct care
LIC direct care
CN
A care
CM
S Phase II standard 0.75 R
N, 1.3 LIC
, 2.8 CN
A
Florida standard 1.0 LIC
, 2.6 CN
A
California standard
3.2 Total
Vermont standard
2.0 CN
A, 3.0 Total
Ohio R
N standard
0.2 RN
Illinois standard 0.5 LIC
, 2.5 Total
Special N
eeds (resident days as %
of total)
CM
I (last available quarter)
LUTHERAN CENTER AT POUGHKEEPSIE
965 DUTCHESS TURNPIKE POUGHKEEPSIE
4.13 3.83 0.37 1.55 2.28 0 1.21
LUTHERAN RETIREMENT HOME 715 FALCONER STREET
JAMESTOWN 3.03 2.88 0.25 1.02 1.85 0 1.10
MANHATTANVILLE HEALTH CARE CENTER, LLC
311 W 231ST STREET BRONX
3.54 3.41 0.48 1.03 2.38 0 1.22
MAPLEWOOD NURSING HOME INC
100 DANIEL DRIVE WEBSTER
5.40 5.04 0.70 1.81 3.23 0 1.14
MARCUS GARVEY NURSING HOME
810 20 ST MARKS AVENUE BROOKLYN
3.14 3.10 0.22 0.57 2.52 0 1.06
MARGARET TIETZ CENTER FOR NURS
164 11 CHAPIN PARKWAY JAMAICA
3.70 3.63 0.64 1.12 2.50 0 1.27
MARIA REGINA RESIDENCE 1725 BRENTWOOD ROAD
BRENTWOOD 3.95 3.82 0.48 1.20 2.62 0 1.01
MARQUIS CARE CENTER 2 MEDICAL PLAZA
GLEN COVE 3.28 3.03 0.21 0.97 2.06 0 1.35
MARTIN LUTHER HOME 110 UTICA ROAD
CLINTON 3.53 3.45 0.51 1.05 2.41 0 1.16
MARY MANNING WALSH NURSING HOME
1339 YORK AVENUE NEW YORK
3.15 3.10 0.43 0.89 2.21 0 1.25

50
Name and Address of Nursing Home
Total nursing staff hours
Total direct care
RN
direct care
LIC direct care
CN
A care
CM
S Phase II standard 0.75 R
N, 1.3 LIC
, 2.8 CN
A
Florida standard 1.0 LIC
, 2.6 CN
A
California standard
3.2 Total
Vermont standard
2.0 CN
A, 3.0 Total
Ohio R
N standard
0.2 RN
Illinois standard 0.5 LIC
, 2.5 Total
Special N
eeds (resident days as %
of total)
CM
I (last available quarter)
MASONIC HOME AND HEALTH FACILITY
2150 BLEECKER STREET UTICA
4.51 4.36 0.59 1.65 2.72 0 1.08
MAYFAIR CARE CENTER INC 100 BALDWIN ROAD
HEMPSTEAD 2.82 2.62 0.29 0.73 1.88 0 –
MCAULEY MANOR AT MERCYCARE
ONE BETHESDA DRIVE HORNELL
3.89 3.64 0.46 1.28 2.36 6.8 1.08
MCAULEY RESIDENCE 1503 MILITARY ROAD
KENMORE 3.85 3.46 0.15 1.28 2.19 0 1.15
MEADOW PARK REHAB HLTH CTR LLC
78 10 164TH STREET FLUSHING
2.59 2.36 0.01 0.65 1.71 0 –
MEADOWBROOK CARE CENTER 320 WEST MERRICK ROAD
FREEPORT 3.52 3.43 0.46 1.11 2.32 2.6 1.15
MEADOWBROOK HEALTHCARE 154 NORTH PROSPECT AVENUE
PLATTSBURGH 3.49 3.22 0.47 1.14 2.08 0 1.24
MEDFORD MULTICARE CENTER FOR LIVING
3115 HORSEBLOCK ROAD MEDFORD
3.51 3.46 0.38 1.29 2.17 – 1.01
MEDINA MEMORIAL HOSPITAL SNF
200 OHIO STREET MEDINA
4.90 4.53 0.19 1.20 3.33 0 1.07
MENORAH HOME & HOSPITAL FOR AGED AND INFIRM 1516 ORIENTAL BLVD
BROOKLYN
3.29 3.02 0.22 0.88 2.13 0 1.15

51
Name and Address of Nursing Home
Total nursing staff hours
Total direct care
RN
direct care
LIC direct care
CN
A care
CM
S Phase II standard 0.75 R
N, 1.3 LIC
, 2.8 CN
A
Florida standard 1.0 LIC
, 2.6 CN
A
California standard
3.2 Total
Vermont standard
2.0 CN
A, 3.0 Total
Ohio R
N standard
0.2 RN
Illinois standard 0.5 LIC
, 2.5 Total
Special N
eeds (resident days as %
of total)
CM
I (last available quarter)
MERCY HEALTH AND REHAB CENTER
3 ST ANTHONY STREET AUBURN
4.24 3.88 0.22 1.27 2.61 0 1.13
MERCY HEALTHCARE CENTER INC
114 WAWBEEK AVE TUPPER LAKE
2.89 2.61 0.16 0.82 1.79 0 1.06
MERCY HOSPITAL SKILLED NURSING FACILITY 565 ABBOTT ROAD
BUFFALO
4.08 3.62 0.26 1.23 2.39 0 1.13
MERCY OF NORTHERN NEW YORK
218 STONE STREET WATERTOWN
2.72 2.68 0.01 0.84 1.84 0 1.00
METHODIST CHURCH HOME FOR THE
4499 MANHATTAN COLLEGE PARKWAY
BRONX
2.96 2.73 0.40 0.70 2.04 0 1.16
METROPOLITAN JEWISH GERIATRIC CENTER
4915 10TH AVE BROOKLYN
3.85 3.57 0.36 1.04 2.53 0 1.42
MICHAEL MALOTZ SKILLED NURSING PAVILLION 120 ODELL AVENUE
YONKERS
4.02 3.67 0.62 1.20 2.47 5.5 1.28
MICHAUD RESIDENTIAL HEALTH SERVICES INC
453 PARK STREET FULTON
3.71 3.23 0.00 0.91 2.33 0 1.11
MIDWAY NURSING HOME INC 69 95 QUEENS MIDTOWN
EXPRESSWAY MASPETH
2.85 2.73 0.26 0.84 1.89 0 –
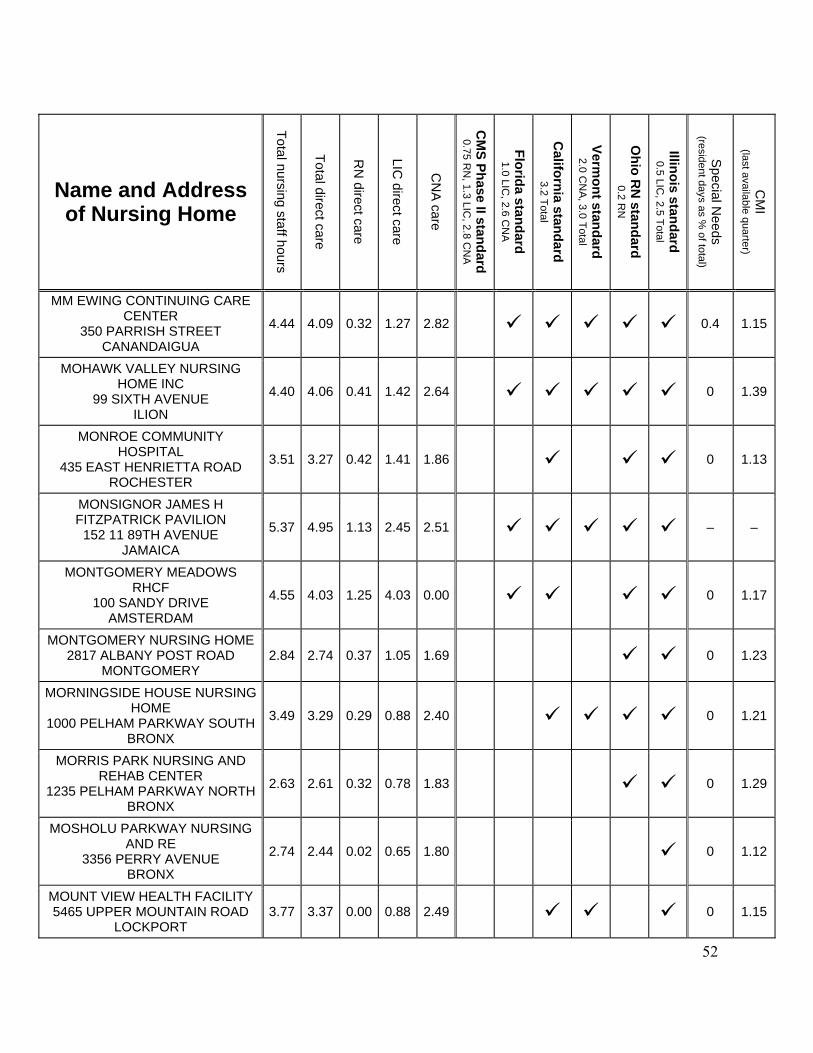
52
Name and Address of Nursing Home
Total nursing staff hours
Total direct care
RN
direct care
LIC direct care
CN
A care
CM
S Phase II standard 0.75 R
N, 1.3 LIC
, 2.8 CN
A
Florida standard 1.0 LIC
, 2.6 CN
A
California standard
3.2 Total
Vermont standard
2.0 CN
A, 3.0 Total
Ohio R
N standard
0.2 RN
Illinois standard 0.5 LIC
, 2.5 Total
Special N
eeds (resident days as %
of total)
CM
I (last available quarter)
MM EWING CONTINUING CARE CENTER
350 PARRISH STREET CANANDAIGUA
4.44 4.09 0.32 1.27 2.82 0.4 1.15
MOHAWK VALLEY NURSING HOME INC
99 SIXTH AVENUE ILION
4.40 4.06 0.41 1.42 2.64 0 1.39
MONROE COMMUNITY HOSPITAL
435 EAST HENRIETTA ROAD ROCHESTER
3.51 3.27 0.42 1.41 1.86 0 1.13
MONSIGNOR JAMES H FITZPATRICK PAVILION
152 11 89TH AVENUE JAMAICA
5.37 4.95 1.13 2.45 2.51 – –
MONTGOMERY MEADOWS RHCF
100 SANDY DRIVE AMSTERDAM
4.55 4.03 1.25 4.03 0.00 0 1.17
MONTGOMERY NURSING HOME 2817 ALBANY POST ROAD
MONTGOMERY 2.84 2.74 0.37 1.05 1.69 0 1.23
MORNINGSIDE HOUSE NURSING HOME
1000 PELHAM PARKWAY SOUTH BRONX
3.49 3.29 0.29 0.88 2.40 0 1.21
MORRIS PARK NURSING AND REHAB CENTER
1235 PELHAM PARKWAY NORTH BRONX
2.63 2.61 0.32 0.78 1.83 0 1.29
MOSHOLU PARKWAY NURSING AND RE
3356 PERRY AVENUE BRONX
2.74 2.44 0.02 0.65 1.80 0 1.12
MOUNT VIEW HEALTH FACILITY 5465 UPPER MOUNTAIN ROAD
LOCKPORT 3.77 3.37 0.00 0.88 2.49 0 1.15

53
Name and Address of Nursing Home
Total nursing staff hours
Total direct care
RN
direct care
LIC direct care
CN
A care
CM
S Phase II standard 0.75 R
N, 1.3 LIC
, 2.8 CN
A
Florida standard 1.0 LIC
, 2.6 CN
A
California standard
3.2 Total
Vermont standard
2.0 CN
A, 3.0 Total
Ohio R
N standard
0.2 RN
Illinois standard 0.5 LIC
, 2.5 Total
Special N
eeds (resident days as %
of total)
CM
I (last available quarter)
MOUNTAINSIDE RESIDENTIAL CARE
42158 STATE HIGHWAY 28 MARGARETVILLE
3.39 3.01 0.10 0.90 2.11 0 1.12
MT LORETTO NURSING HOME INC
302 SWART HILL ROAD AMSTERDAM
3.38 2.99 0.06 0.91 2.08 0 1.15
N Y CONGREGATIONAL NURSING CTR
135 LINDEN BOULEVARD BROOKLYN
3.06 2.84 0.26 0.82 2.02 0 1.23
N Y S VETS HOME AT MONTROSE
2090 ALBANY POST ROAD MONTROSE
4.32 3.98 0.11 0.65 3.33 – 1.10
N Y S VETS HOME AT OXFORD 4211 STATE HIGHWAY 220
OXFORD 4.38 4.20 0.64 1.49 2.72 0 1.10
N Y S VETS HOME ST ALBANS 178 50 LINDEN BLVD
JAMAICA 4.28 4.20 0.38 1.41 2.79 0 –
NASSAU EXTENDED CARE FACILITY
ONE GREENWICH STREET HEMPSTEAD
2.96 2.88 0.33 0.99 1.89 0 1.17
NATHAN LITTAUER HOSPITAL NURSI
99 EAST STATE STREET GLOVERSVILLE
4.04 3.49 0.32 1.06 2.42 0 1.15
NATHAN MILLER CENTER FOR NURSING CARE
37 DEKALB AVENUE WHITE PLAINS
3.71 3.48 0.19 1.06 2.42 – 1.08
NAZARETH NURSING HOME 291 WEST NORTH STREET
BUFFALO 3.65 3.49 0.27 1.21 2.28 0 1.09
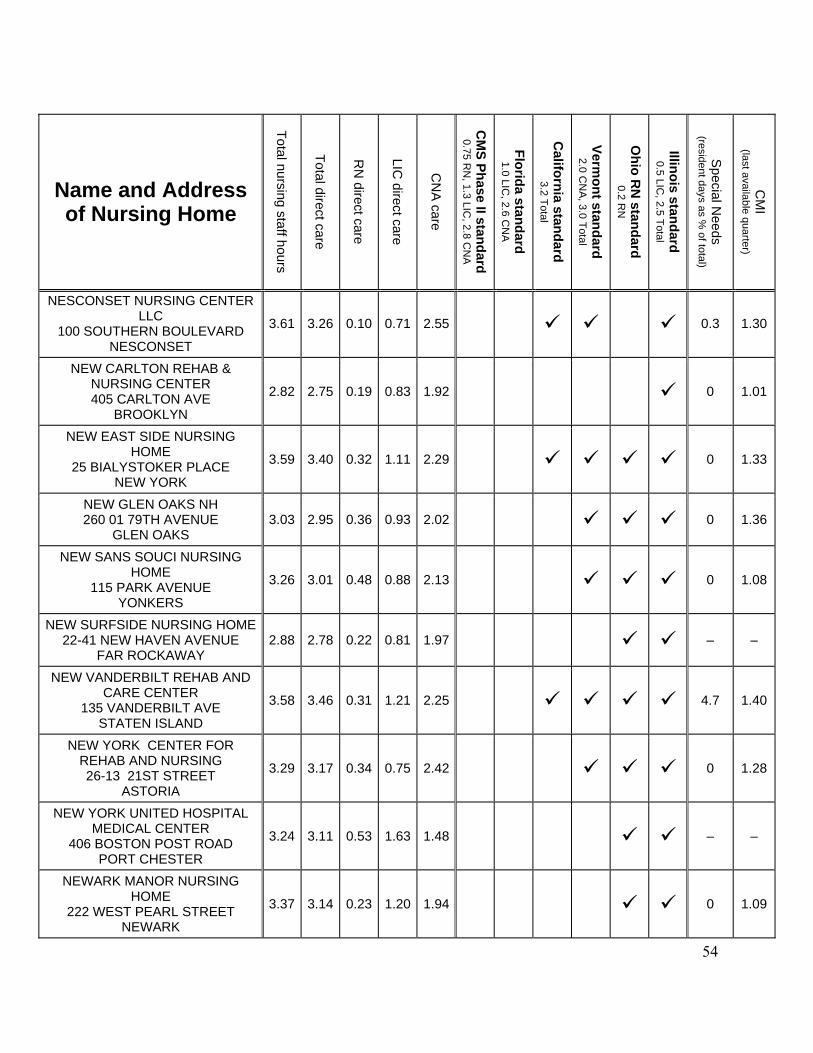
54
Name and Address of Nursing Home
Total nursing staff hours
Total direct care
RN
direct care
LIC direct care
CN
A care
CM
S Phase II standard 0.75 R
N, 1.3 LIC
, 2.8 CN
A
Florida standard 1.0 LIC
, 2.6 CN
A
California standard
3.2 Total
Vermont standard
2.0 CN
A, 3.0 Total
Ohio R
N standard
0.2 RN
Illinois standard 0.5 LIC
, 2.5 Total
Special N
eeds (resident days as %
of total)
CM
I (last available quarter)
NESCONSET NURSING CENTER LLC
100 SOUTHERN BOULEVARD NESCONSET
3.61 3.26 0.10 0.71 2.55 0.3 1.30
NEW CARLTON REHAB & NURSING CENTER 405 CARLTON AVE
BROOKLYN
2.82 2.75 0.19 0.83 1.92 0 1.01
NEW EAST SIDE NURSING HOME
25 BIALYSTOKER PLACE NEW YORK
3.59 3.40 0.32 1.11 2.29 0 1.33
NEW GLEN OAKS NH 260 01 79TH AVENUE
GLEN OAKS 3.03 2.95 0.36 0.93 2.02 0 1.36
NEW SANS SOUCI NURSING HOME
115 PARK AVENUE YONKERS
3.26 3.01 0.48 0.88 2.13 0 1.08
NEW SURFSIDE NURSING HOME 22-41 NEW HAVEN AVENUE
FAR ROCKAWAY 2.88 2.78 0.22 0.81 1.97 – –
NEW VANDERBILT REHAB AND CARE CENTER
135 VANDERBILT AVE STATEN ISLAND
3.58 3.46 0.31 1.21 2.25 4.7 1.40
NEW YORK CENTER FOR REHAB AND NURSING 26-13 21ST STREET
ASTORIA
3.29 3.17 0.34 0.75 2.42 0 1.28
NEW YORK UNITED HOSPITAL MEDICAL CENTER
406 BOSTON POST ROAD PORT CHESTER
3.24 3.11 0.53 1.63 1.48 – –
NEWARK MANOR NURSING HOME
222 WEST PEARL STREET NEWARK
3.37 3.14 0.23 1.20 1.94 0 1.09
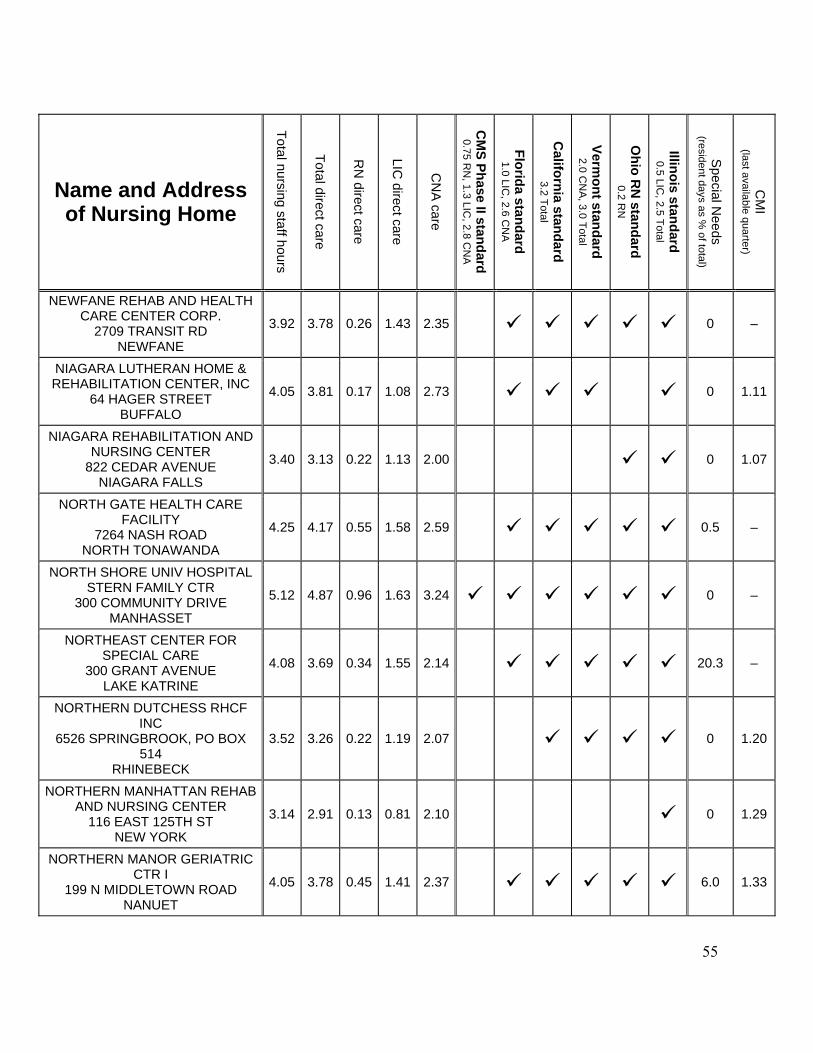
55
Name and Address of Nursing Home
Total nursing staff hours
Total direct care
RN
direct care
LIC direct care
CN
A care
CM
S Phase II standard 0.75 R
N, 1.3 LIC
, 2.8 CN
A
Florida standard 1.0 LIC
, 2.6 CN
A
California standard
3.2 Total
Vermont standard
2.0 CN
A, 3.0 Total
Ohio R
N standard
0.2 RN
Illinois standard 0.5 LIC
, 2.5 Total
Special N
eeds (resident days as %
of total)
CM
I (last available quarter)
NEWFANE REHAB AND HEALTH CARE CENTER CORP.
2709 TRANSIT RD NEWFANE
3.92 3.78 0.26 1.43 2.35 0 –
NIAGARA LUTHERAN HOME & REHABILITATION CENTER, INC
64 HAGER STREET BUFFALO
4.05 3.81 0.17 1.08 2.73 0 1.11
NIAGARA REHABILITATION AND NURSING CENTER
822 CEDAR AVENUE NIAGARA FALLS
3.40 3.13 0.22 1.13 2.00 0 1.07
NORTH GATE HEALTH CARE FACILITY
7264 NASH ROAD NORTH TONAWANDA
4.25 4.17 0.55 1.58 2.59 0.5 –
NORTH SHORE UNIV HOSPITAL STERN FAMILY CTR
300 COMMUNITY DRIVE MANHASSET
5.12 4.87 0.96 1.63 3.24 0 –
NORTHEAST CENTER FOR SPECIAL CARE
300 GRANT AVENUE LAKE KATRINE
4.08 3.69 0.34 1.55 2.14 20.3 –
NORTHERN DUTCHESS RHCF INC
6526 SPRINGBROOK, PO BOX 514
RHINEBECK
3.52 3.26 0.22 1.19 2.07 0 1.20
NORTHERN MANHATTAN REHAB AND NURSING CENTER
116 EAST 125TH ST NEW YORK
3.14 2.91 0.13 0.81 2.10 0 1.29
NORTHERN MANOR GERIATRIC CTR I
199 N MIDDLETOWN ROAD NANUET
4.05 3.78 0.45 1.41 2.37 6.0 1.33

56
Name and Address of Nursing Home
Total nursing staff hours
Total direct care
RN
direct care
LIC direct care
CN
A care
CM
S Phase II standard 0.75 R
N, 1.3 LIC
, 2.8 CN
A
Florida standard 1.0 LIC
, 2.6 CN
A
California standard
3.2 Total
Vermont standard
2.0 CN
A, 3.0 Total
Ohio R
N standard
0.2 RN
Illinois standard 0.5 LIC
, 2.5 Total
Special N
eeds (resident days as %
of total)
CM
I (last available quarter)
NORTHERN METROPOLITAN RHCF
225 MAPLE AVENUE MONSEY
4.50 4.20 0.68 1.24 2.96 0 1.25
NORTHERN RIVERVIEW HEALTH CARE
87 SOUTH ROUTE 9W HAVERSTRAW
3.68 3.47 0.51 1.23 2.23 0 1.34
NORTHWOODS REHAB EXTENDED CARE FACILITY
7 KEELER AVENUE MORAVIA
3.43 3.26 0.20 1.23 2.02 0 0.99
NORTHWOODS REHAB ROSEWOOD GAR 284 TROY ROAD
RENSSELAER
3.52 3.02 0.19 1.06 1.96 0 1.09
NORTHWOODS REHAB ECC CORTLAND
28 KELLOGG ROAD CORTLAND
3.21 3.09 0.05 1.15 1.95 0 1.06
NORTHWOODS REHAB ECC HILLTOP
1805 PROVIDENCE AVENUE NISKAYUNA
5.65 5.07 0.59 2.27 2.80 61.3 –
NORTHWOODS REHAB ECC TROY
100 NEW TURNPIKE ROAD TROY
3.38 2.84 0.08 0.97 1.87 0 –
NORWEGIAN CHRISTIAN HOME & HEALTH CENTER 1270 67TH STREET
BROOKLYN
3.08 2.90 0.42 0.63 2.27 0.2 –
NOTTINGHAM RHCF 1305 NOTTINGHAM ROAD
JAMESVILLE 3.93 3.47 0.54 1.00 2.46 0 1.06
NYACK MANOR NURSING HOME 476 CHRISTIAN HERALD ROAD
VALLEY COTTAGE 3.56 3.44 0.38 0.90 2.54 0 1.21
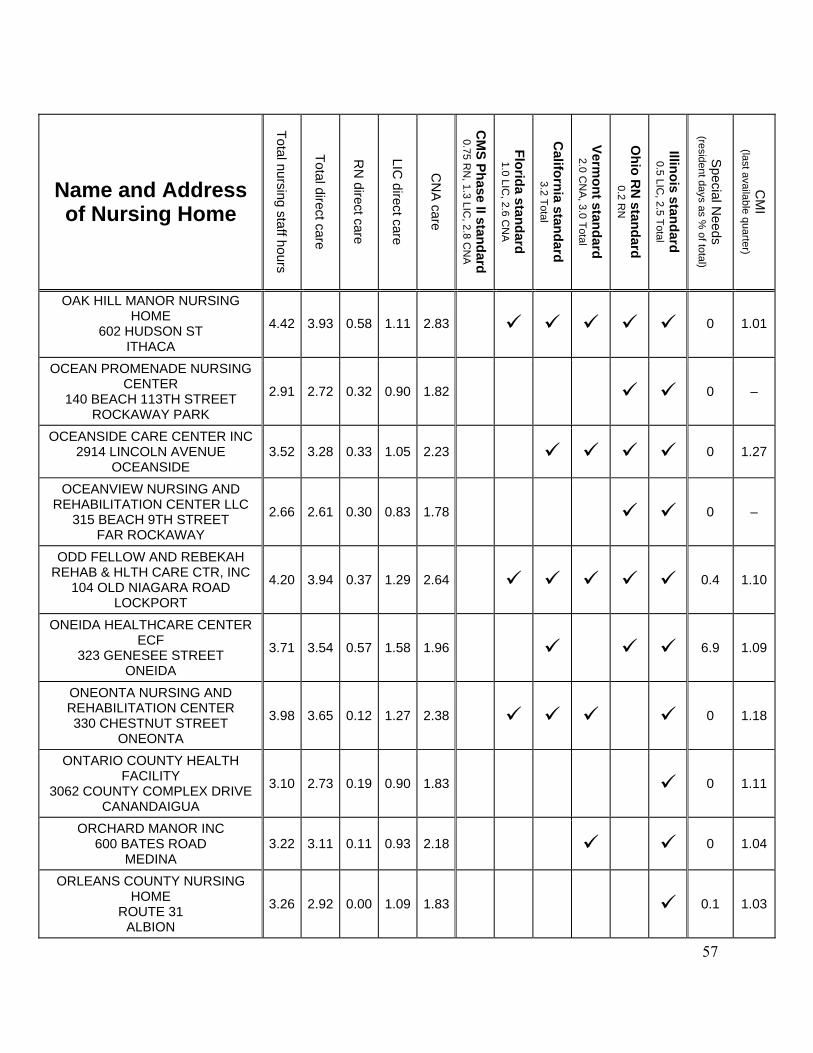
57
Name and Address of Nursing Home
Total nursing staff hours
Total direct care
RN
direct care
LIC direct care
CN
A care
CM
S Phase II standard 0.75 R
N, 1.3 LIC
, 2.8 CN
A
Florida standard 1.0 LIC
, 2.6 CN
A
California standard
3.2 Total
Vermont standard
2.0 CN
A, 3.0 Total
Ohio R
N standard
0.2 RN
Illinois standard 0.5 LIC
, 2.5 Total
Special N
eeds (resident days as %
of total)
CM
I (last available quarter)
OAK HILL MANOR NURSING HOME
602 HUDSON ST ITHACA
4.42 3.93 0.58 1.11 2.83 0 1.01
OCEAN PROMENADE NURSING CENTER
140 BEACH 113TH STREET ROCKAWAY PARK
2.91 2.72 0.32 0.90 1.82 0 –
OCEANSIDE CARE CENTER INC 2914 LINCOLN AVENUE
OCEANSIDE 3.52 3.28 0.33 1.05 2.23 0 1.27
OCEANVIEW NURSING AND REHABILITATION CENTER LLC
315 BEACH 9TH STREET FAR ROCKAWAY
2.66 2.61 0.30 0.83 1.78 0 –
ODD FELLOW AND REBEKAH REHAB & HLTH CARE CTR, INC
104 OLD NIAGARA ROAD LOCKPORT
4.20 3.94 0.37 1.29 2.64 0.4 1.10
ONEIDA HEALTHCARE CENTER ECF
323 GENESEE STREET ONEIDA
3.71 3.54 0.57 1.58 1.96 6.9 1.09
ONEONTA NURSING AND REHABILITATION CENTER 330 CHESTNUT STREET
ONEONTA
3.98 3.65 0.12 1.27 2.38 0 1.18
ONTARIO COUNTY HEALTH FACILITY
3062 COUNTY COMPLEX DRIVE CANANDAIGUA
3.10 2.73 0.19 0.90 1.83 0 1.11
ORCHARD MANOR INC 600 BATES ROAD
MEDINA 3.22 3.11 0.11 0.93 2.18 0 1.04
ORLEANS COUNTY NURSING HOME
ROUTE 31 ALBION
3.26 2.92 0.00 1.09 1.83 0.1 1.03
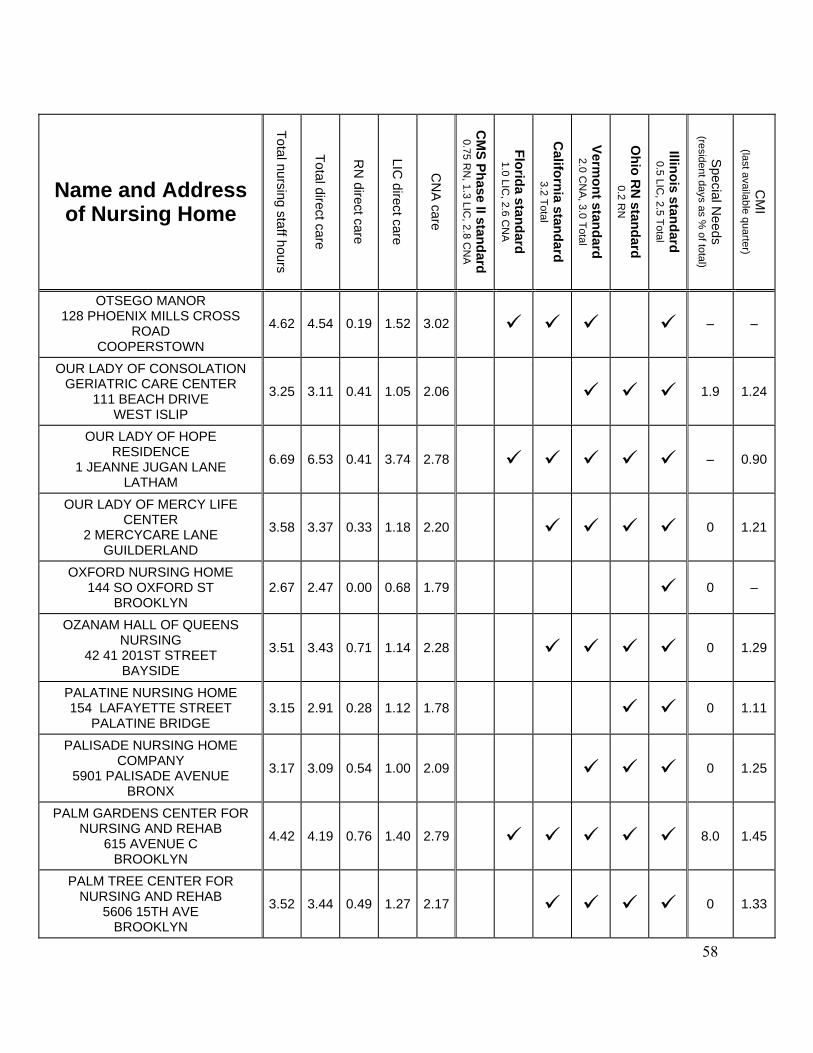
58
Name and Address of Nursing Home
Total nursing staff hours
Total direct care
RN
direct care
LIC direct care
CN
A care
CM
S Phase II standard 0.75 R
N, 1.3 LIC
, 2.8 CN
A
Florida standard 1.0 LIC
, 2.6 CN
A
California standard
3.2 Total
Vermont standard
2.0 CN
A, 3.0 Total
Ohio R
N standard
0.2 RN
Illinois standard 0.5 LIC
, 2.5 Total
Special N
eeds (resident days as %
of total)
CM
I (last available quarter)
OTSEGO MANOR 128 PHOENIX MILLS CROSS
ROAD COOPERSTOWN
4.62 4.54 0.19 1.52 3.02 – –
OUR LADY OF CONSOLATION GERIATRIC CARE CENTER
111 BEACH DRIVE WEST ISLIP
3.25 3.11 0.41 1.05 2.06 1.9 1.24
OUR LADY OF HOPE RESIDENCE
1 JEANNE JUGAN LANE LATHAM
6.69 6.53 0.41 3.74 2.78 – 0.90
OUR LADY OF MERCY LIFE CENTER
2 MERCYCARE LANE GUILDERLAND
3.58 3.37 0.33 1.18 2.20 0 1.21
OXFORD NURSING HOME 144 SO OXFORD ST
BROOKLYN 2.67 2.47 0.00 0.68 1.79 0 –
OZANAM HALL OF QUEENS NURSING
42 41 201ST STREET BAYSIDE
3.51 3.43 0.71 1.14 2.28 0 1.29
PALATINE NURSING HOME 154 LAFAYETTE STREET
PALATINE BRIDGE 3.15 2.91 0.28 1.12 1.78 0 1.11
PALISADE NURSING HOME COMPANY
5901 PALISADE AVENUE BRONX
3.17 3.09 0.54 1.00 2.09 0 1.25
PALM GARDENS CENTER FOR NURSING AND REHAB
615 AVENUE C BROOKLYN
4.42 4.19 0.76 1.40 2.79 8.0 1.45
PALM TREE CENTER FOR NURSING AND REHAB
5606 15TH AVE BROOKLYN
3.52 3.44 0.49 1.27 2.17 0 1.33
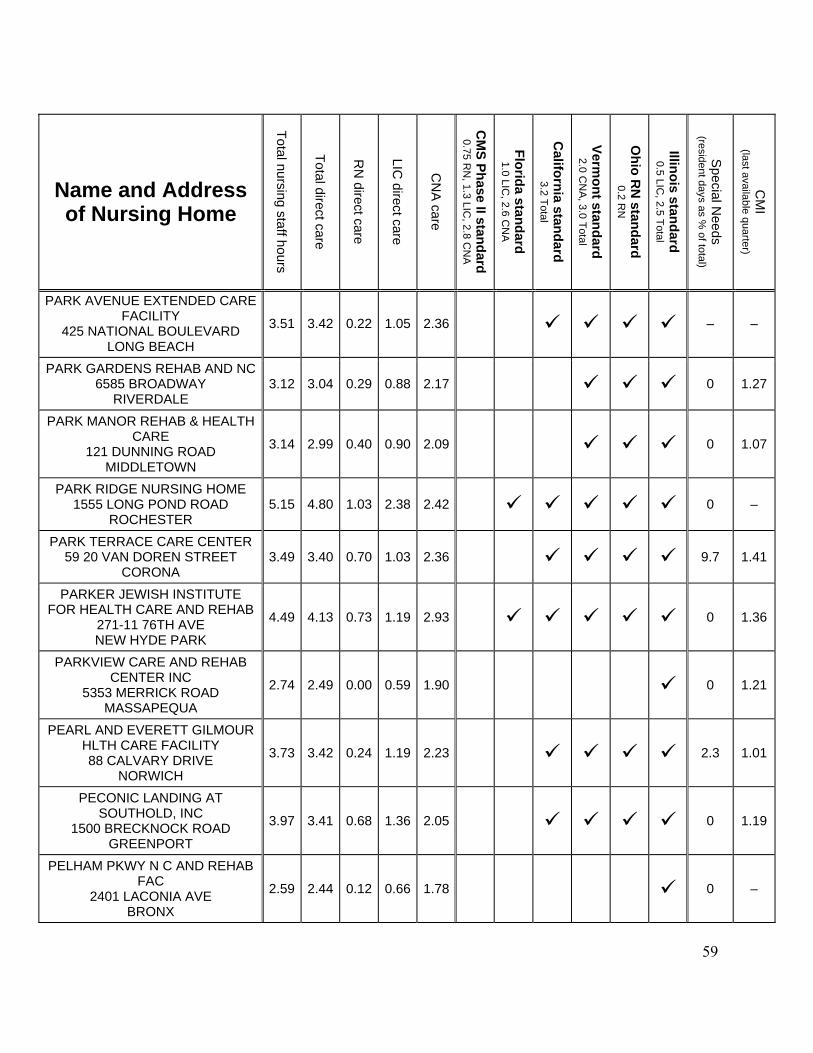
59
Name and Address of Nursing Home
Total nursing staff hours
Total direct care
RN
direct care
LIC direct care
CN
A care
CM
S Phase II standard 0.75 R
N, 1.3 LIC
, 2.8 CN
A
Florida standard 1.0 LIC
, 2.6 CN
A
California standard
3.2 Total
Vermont standard
2.0 CN
A, 3.0 Total
Ohio R
N standard
0.2 RN
Illinois standard 0.5 LIC
, 2.5 Total
Special N
eeds (resident days as %
of total)
CM
I (last available quarter)
PARK AVENUE EXTENDED CARE FACILITY
425 NATIONAL BOULEVARD LONG BEACH
3.51 3.42 0.22 1.05 2.36 – –
PARK GARDENS REHAB AND NC 6585 BROADWAY
RIVERDALE 3.12 3.04 0.29 0.88 2.17 0 1.27
PARK MANOR REHAB & HEALTH CARE
121 DUNNING ROAD MIDDLETOWN
3.14 2.99 0.40 0.90 2.09 0 1.07
PARK RIDGE NURSING HOME 1555 LONG POND ROAD
ROCHESTER 5.15 4.80 1.03 2.38 2.42 0 –
PARK TERRACE CARE CENTER 59 20 VAN DOREN STREET
CORONA 3.49 3.40 0.70 1.03 2.36 9.7 1.41
PARKER JEWISH INSTITUTE FOR HEALTH CARE AND REHAB
271-11 76TH AVE NEW HYDE PARK
4.49 4.13 0.73 1.19 2.93 0 1.36
PARKVIEW CARE AND REHAB CENTER INC
5353 MERRICK ROAD MASSAPEQUA
2.74 2.49 0.00 0.59 1.90 0 1.21
PEARL AND EVERETT GILMOUR HLTH CARE FACILITY 88 CALVARY DRIVE
NORWICH
3.73 3.42 0.24 1.19 2.23 2.3 1.01
PECONIC LANDING AT SOUTHOLD, INC
1500 BRECKNOCK ROAD GREENPORT
3.97 3.41 0.68 1.36 2.05 0 1.19
PELHAM PKWY N C AND REHAB FAC
2401 LACONIA AVE BRONX
2.59 2.44 0.12 0.66 1.78 0 –
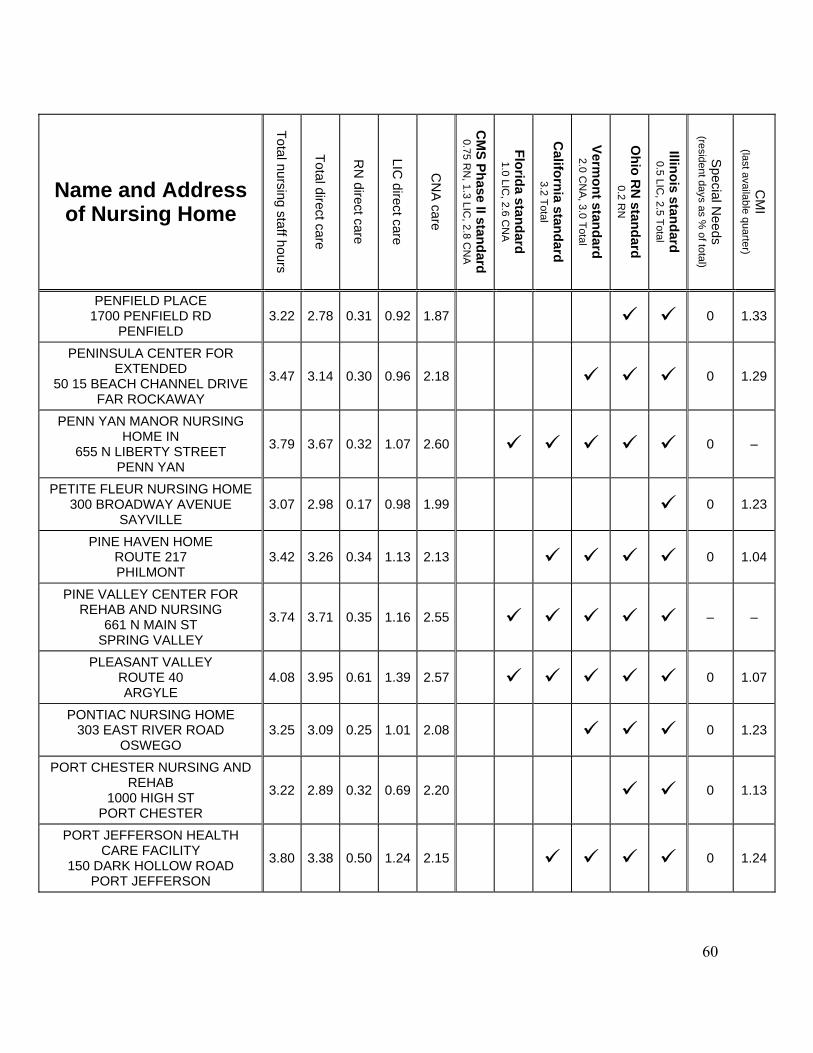
60
Name and Address of Nursing Home
Total nursing staff hours
Total direct care
RN
direct care
LIC direct care
CN
A care
CM
S Phase II standard 0.75 R
N, 1.3 LIC
, 2.8 CN
A
Florida standard 1.0 LIC
, 2.6 CN
A
California standard
3.2 Total
Vermont standard
2.0 CN
A, 3.0 Total
Ohio R
N standard
0.2 RN
Illinois standard 0.5 LIC
, 2.5 Total
Special N
eeds (resident days as %
of total)
CM
I (last available quarter)
PENFIELD PLACE 1700 PENFIELD RD
PENFIELD 3.22 2.78 0.31 0.92 1.87 0 1.33
PENINSULA CENTER FOR EXTENDED
50 15 BEACH CHANNEL DRIVE FAR ROCKAWAY
3.47 3.14 0.30 0.96 2.18 0 1.29
PENN YAN MANOR NURSING HOME IN
655 N LIBERTY STREET PENN YAN
3.79 3.67 0.32 1.07 2.60 0 –
PETITE FLEUR NURSING HOME 300 BROADWAY AVENUE
SAYVILLE 3.07 2.98 0.17 0.98 1.99 0 1.23
PINE HAVEN HOME ROUTE 217 PHILMONT
3.42 3.26 0.34 1.13 2.13 0 1.04
PINE VALLEY CENTER FOR REHAB AND NURSING
661 N MAIN ST SPRING VALLEY
3.74 3.71 0.35 1.16 2.55 – –
PLEASANT VALLEY ROUTE 40 ARGYLE
4.08 3.95 0.61 1.39 2.57 0 1.07
PONTIAC NURSING HOME 303 EAST RIVER ROAD
OSWEGO 3.25 3.09 0.25 1.01 2.08 0 1.23
PORT CHESTER NURSING AND REHAB
1000 HIGH ST PORT CHESTER
3.22 2.89 0.32 0.69 2.20 0 1.13
PORT JEFFERSON HEALTH CARE FACILITY
150 DARK HOLLOW ROAD PORT JEFFERSON
3.80 3.38 0.50 1.24 2.15 0 1.24

61
Name and Address of Nursing Home
Total nursing staff hours
Total direct care
RN
direct care
LIC direct care
CN
A care
CM
S Phase II standard 0.75 R
N, 1.3 LIC
, 2.8 CN
A
Florida standard 1.0 LIC
, 2.6 CN
A
California standard
3.2 Total
Vermont standard
2.0 CN
A, 3.0 Total
Ohio R
N standard
0.2 RN
Illinois standard 0.5 LIC
, 2.5 Total
Special N
eeds (resident days as %
of total)
CM
I (last available quarter)
PRESBYTERIAN HOME FOR CENTRAL
4290 MIDDLE SETTLEMENT ROAD
NEW HARTFORD
3.61 3.31 0.32 1.02 2.30 0 1.13
PROJECT SAMARITAN AIDS SVS INC
1401 UNIVERSITY AVENUE BRONX
1.65 1.40 0.63 1.00 0.41 – –
PROMENADE REHAB AND HEALTH CARE CENTER
140 BEACH 114TH STREET ROCKAWAY PARK
3.81 3.68 0.44 1.10 2.58 3.8 1.32
PROSPECT PARK CARE CENTER 1455 CONEY ISLAND AVENUE
BROOKLYN 3.19 3.12 0.19 0.78 2.35 0 1.06
PROVIDENCE REST 3304 WATERBURY AVENUE
BRONX 3.57 3.32 0.24 0.98 2.34 0.4 1.23
PUTNAM COMMONS RHCF 46 MT EBO ROAD NORTH
BREWSTER 3.82 3.72 0.36 1.34 2.38 0 –
PUTNAM NURSING AND REHABILITAT
404 LUDINGTONVILLE ROAD HOLMES
3.43 3.05 0.21 0.91 2.14 0 1.17
QUEEN OF PEACE RESIDENCE 110 30 221ST ST
QUEENS VILLAGE 3.72 3.38 0.64 0.84 2.54 0 0.98
QUEENS BLVD EXT CARE FACILITY
61 11 QUEENS BOULEVARD WOODSIDE
3.90 3.62 0.42 1.06 2.56 0 1.37
QUEENS CENTER FOR REHAB AND RHC
157 15 19TH AVENUE WHITESTONE
3.29 2.97 0.13 0.59 2.37 0 –

62
Name and Address of Nursing Home
Total nursing staff hours
Total direct care
RN
direct care
LIC direct care
CN
A care
CM
S Phase II standard 0.75 R
N, 1.3 LIC
, 2.8 CN
A
Florida standard 1.0 LIC
, 2.6 CN
A
California standard
3.2 Total
Vermont standard
2.0 CN
A, 3.0 Total
Ohio R
N standard
0.2 RN
Illinois standard 0.5 LIC
, 2.5 Total
Special N
eeds (resident days as %
of total)
CM
I (last available quarter)
QUEENS NASSAU REHABILITATION AND NURSING
CENTER 520 BEACH 19TH STREET
FAR ROCKAWAY
3.22 3.08 0.33 0.87 2.22 9.2 –
RAMAPO MANOR CTR FOR REHAB & N
30 CRAGMERE ROAD BOX 248 SUFFERN
1.74 1.57 0.18 0.55 1.03 0 1.33
RECONSTRUCTION HOME AND HEALTH CARE CTR INC
318 SOUTH ALBANY STREET ITHACA
2.94 2.78 0.52 1.20 1.58 0 –
REGAL HEIGHTS REHABILITATION HEALTH CARE
70-05 35 AVENUE JACKSON HEIGHTS
3.57 3.41 0.36 1.05 2.36 0 1.31
REGEIS CARE CENTER 3200 BAYCHESTER AVENUE
BRONX 3.43 3.33 0.35 0.98 2.34 0 1.41
REGENCY EXTENDED CARE CENTER
65 ASHBURTON AVENUE YONKERS
2.54 2.43 0.15 0.72 1.71 0 –
REGO PARK NURSING HOME 111 26 CORONA AVENUE
FLUSHING 2.84 2.77 0.29 0.71 2.06 0 1.29
RESORT NURSING HOME 430 BEACH 68TH STREET
ARVERNE 3.53 3.36 0.60 1.18 2.18 3.5 1.33
RESURRECTION NURSING HOME INC
90 NO MAIN STREET CASTLETON ON HUDSON
3.81 3.34 0.15 1.23 2.10 0 1.04
RIDGE VIEW MANOR NURSING HOME
300 DORRANCE AVENUE BUFFALO
2.79 2.61 0.37 1.05 1.56 – 1.18
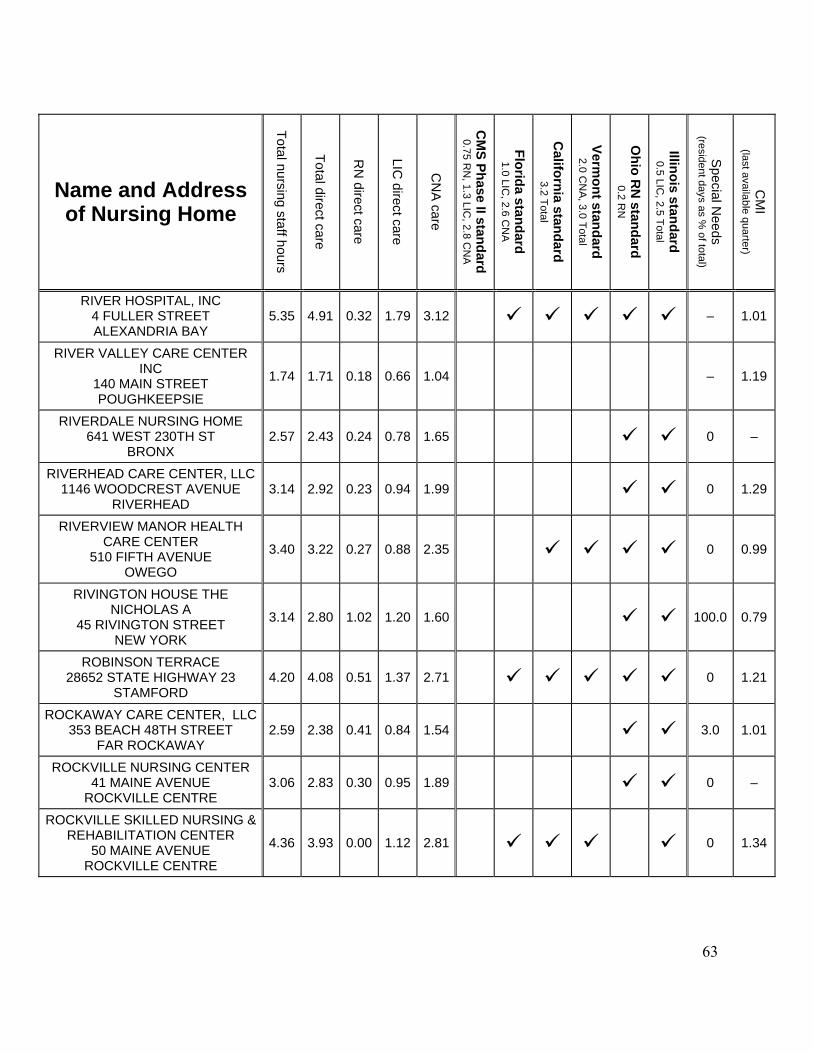
63
Name and Address of Nursing Home
Total nursing staff hours
Total direct care
RN
direct care
LIC direct care
CN
A care
CM
S Phase II standard 0.75 R
N, 1.3 LIC
, 2.8 CN
A
Florida standard 1.0 LIC
, 2.6 CN
A
California standard
3.2 Total
Vermont standard
2.0 CN
A, 3.0 Total
Ohio R
N standard
0.2 RN
Illinois standard 0.5 LIC
, 2.5 Total
Special N
eeds (resident days as %
of total)
CM
I (last available quarter)
RIVER HOSPITAL, INC 4 FULLER STREET ALEXANDRIA BAY
5.35 4.91 0.32 1.79 3.12 – 1.01
RIVER VALLEY CARE CENTER INC
140 MAIN STREET POUGHKEEPSIE
1.74 1.71 0.18 0.66 1.04 – 1.19
RIVERDALE NURSING HOME 641 WEST 230TH ST
BRONX 2.57 2.43 0.24 0.78 1.65 0 –
RIVERHEAD CARE CENTER, LLC 1146 WOODCREST AVENUE
RIVERHEAD 3.14 2.92 0.23 0.94 1.99 0 1.29
RIVERVIEW MANOR HEALTH CARE CENTER
510 FIFTH AVENUE OWEGO
3.40 3.22 0.27 0.88 2.35 0 0.99
RIVINGTON HOUSE THE NICHOLAS A
45 RIVINGTON STREET NEW YORK
3.14 2.80 1.02 1.20 1.60 100.0 0.79
ROBINSON TERRACE 28652 STATE HIGHWAY 23
STAMFORD 4.20 4.08 0.51 1.37 2.71 0 1.21
ROCKAWAY CARE CENTER, LLC 353 BEACH 48TH STREET
FAR ROCKAWAY 2.59 2.38 0.41 0.84 1.54 3.0 1.01
ROCKVILLE NURSING CENTER 41 MAINE AVENUE
ROCKVILLE CENTRE 3.06 2.83 0.30 0.95 1.89 0 –
ROCKVILLE SKILLED NURSING & REHABILITATION CENTER
50 MAINE AVENUE ROCKVILLE CENTRE
4.36 3.93 0.00 1.12 2.81 0 1.34
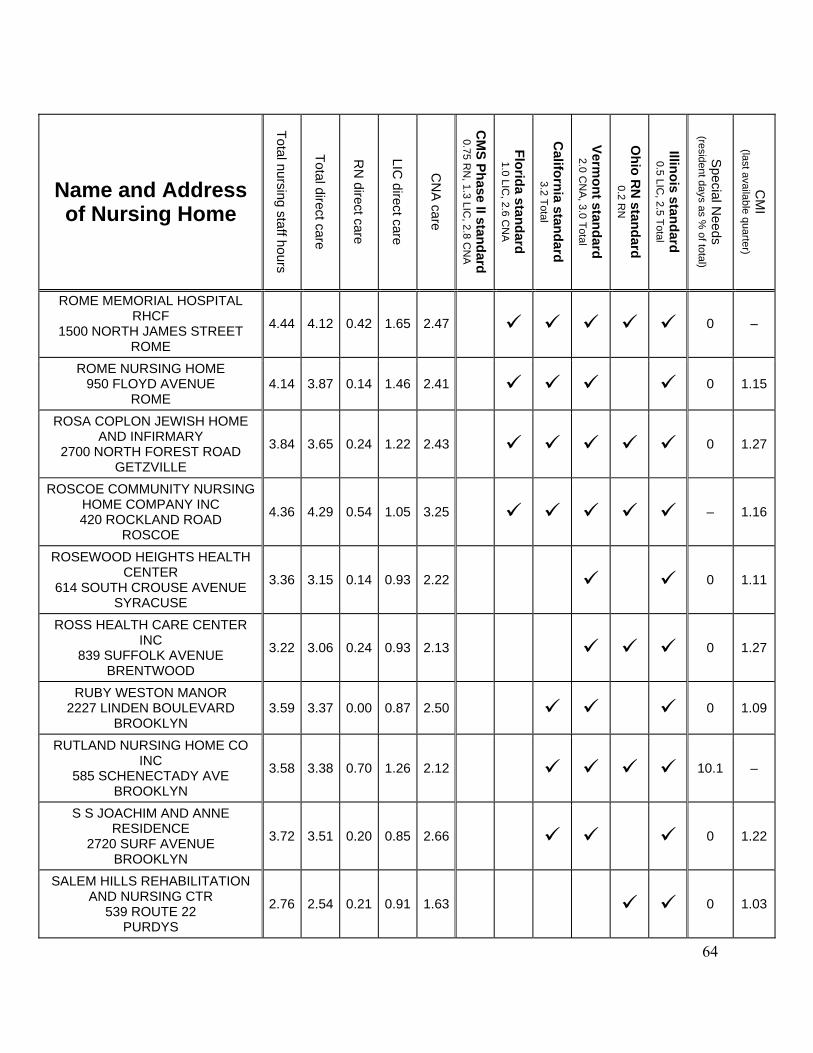
64
Name and Address of Nursing Home
Total nursing staff hours
Total direct care
RN
direct care
LIC direct care
CN
A care
CM
S Phase II standard 0.75 R
N, 1.3 LIC
, 2.8 CN
A
Florida standard 1.0 LIC
, 2.6 CN
A
California standard
3.2 Total
Vermont standard
2.0 CN
A, 3.0 Total
Ohio R
N standard
0.2 RN
Illinois standard 0.5 LIC
, 2.5 Total
Special N
eeds (resident days as %
of total)
CM
I (last available quarter)
ROME MEMORIAL HOSPITAL RHCF
1500 NORTH JAMES STREET ROME
4.44 4.12 0.42 1.65 2.47 0 –
ROME NURSING HOME 950 FLOYD AVENUE
ROME 4.14 3.87 0.14 1.46 2.41 0 1.15
ROSA COPLON JEWISH HOME AND INFIRMARY
2700 NORTH FOREST ROAD GETZVILLE
3.84 3.65 0.24 1.22 2.43 0 1.27
ROSCOE COMMUNITY NURSING HOME COMPANY INC 420 ROCKLAND ROAD
ROSCOE
4.36 4.29 0.54 1.05 3.25 – 1.16
ROSEWOOD HEIGHTS HEALTH CENTER
614 SOUTH CROUSE AVENUE SYRACUSE
3.36 3.15 0.14 0.93 2.22 0 1.11
ROSS HEALTH CARE CENTER INC
839 SUFFOLK AVENUE BRENTWOOD
3.22 3.06 0.24 0.93 2.13 0 1.27
RUBY WESTON MANOR 2227 LINDEN BOULEVARD
BROOKLYN 3.59 3.37 0.00 0.87 2.50 0 1.09
RUTLAND NURSING HOME CO INC
585 SCHENECTADY AVE BROOKLYN
3.58 3.38 0.70 1.26 2.12 10.1 –
S S JOACHIM AND ANNE RESIDENCE
2720 SURF AVENUE BROOKLYN
3.72 3.51 0.20 0.85 2.66 0 1.22
SALEM HILLS REHABILITATION AND NURSING CTR
539 ROUTE 22 PURDYS
2.76 2.54 0.21 0.91 1.63 0 1.03
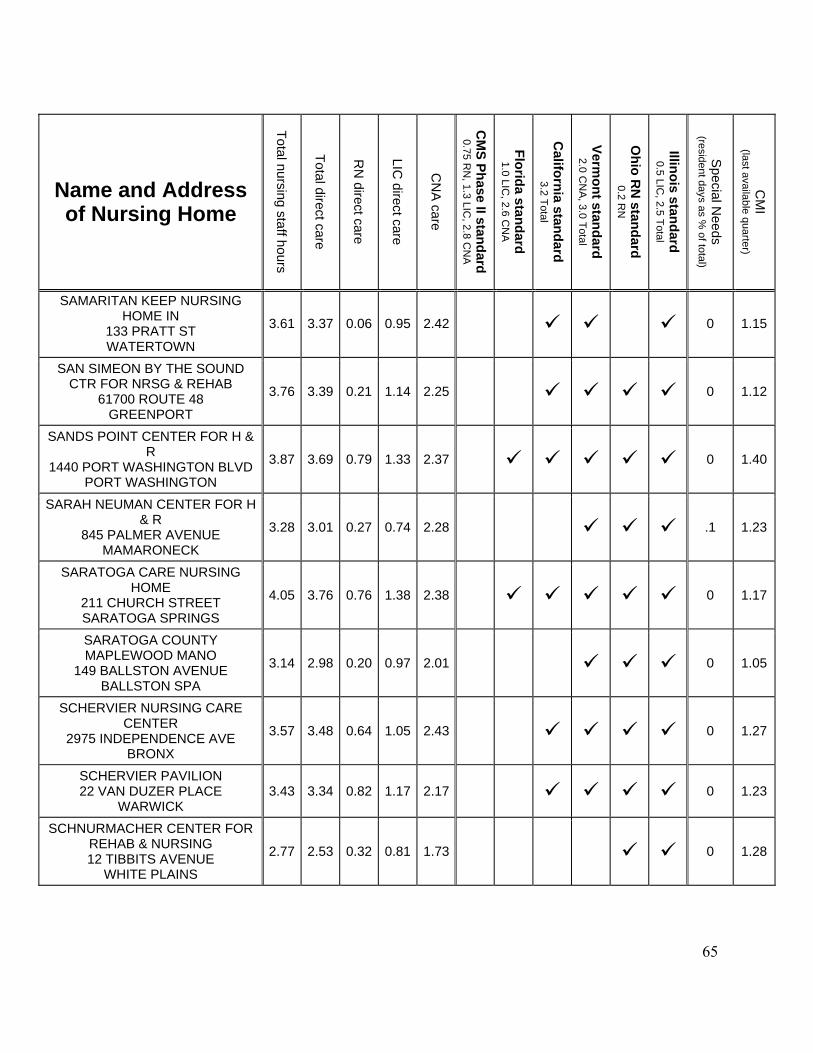
65
Name and Address of Nursing Home
Total nursing staff hours
Total direct care
RN
direct care
LIC direct care
CN
A care
CM
S Phase II standard 0.75 R
N, 1.3 LIC
, 2.8 CN
A
Florida standard 1.0 LIC
, 2.6 CN
A
California standard
3.2 Total
Vermont standard
2.0 CN
A, 3.0 Total
Ohio R
N standard
0.2 RN
Illinois standard 0.5 LIC
, 2.5 Total
Special N
eeds (resident days as %
of total)
CM
I (last available quarter)
SAMARITAN KEEP NURSING HOME IN
133 PRATT ST WATERTOWN
3.61 3.37 0.06 0.95 2.42 0 1.15
SAN SIMEON BY THE SOUND CTR FOR NRSG & REHAB
61700 ROUTE 48 GREENPORT
3.76 3.39 0.21 1.14 2.25 0 1.12
SANDS POINT CENTER FOR H & R
1440 PORT WASHINGTON BLVD PORT WASHINGTON
3.87 3.69 0.79 1.33 2.37 0 1.40
SARAH NEUMAN CENTER FOR H & R
845 PALMER AVENUE MAMARONECK
3.28 3.01 0.27 0.74 2.28 .1 1.23
SARATOGA CARE NURSING HOME
211 CHURCH STREET SARATOGA SPRINGS
4.05 3.76 0.76 1.38 2.38 0 1.17
SARATOGA COUNTY MAPLEWOOD MANO
149 BALLSTON AVENUE BALLSTON SPA
3.14 2.98 0.20 0.97 2.01 0 1.05
SCHERVIER NURSING CARE CENTER
2975 INDEPENDENCE AVE BRONX
3.57 3.48 0.64 1.05 2.43 0 1.27
SCHERVIER PAVILION 22 VAN DUZER PLACE
WARWICK 3.43 3.34 0.82 1.17 2.17 0 1.23
SCHNURMACHER CENTER FOR REHAB & NURSING 12 TIBBITS AVENUE
WHITE PLAINS
2.77 2.53 0.32 0.81 1.73 0 1.28

66
Name and Address of Nursing Home
Total nursing staff hours
Total direct care
RN
direct care
LIC direct care
CN
A care
CM
S Phase II standard 0.75 R
N, 1.3 LIC
, 2.8 CN
A
Florida standard 1.0 LIC
, 2.6 CN
A
California standard
3.2 Total
Vermont standard
2.0 CN
A, 3.0 Total
Ohio R
N standard
0.2 RN
Illinois standard 0.5 LIC
, 2.5 Total
Special N
eeds (resident days as %
of total)
CM
I (last available quarter)
SCHOELLKOPF HEALTH CENTER
621 TENTH STREET NIAGARA FALLS
3.49 3.31 0.27 1.22 2.10 0 1.17
SCHOFIELD RESIDENCE 3333 ELMWOOD AVENUE
KENMORE 3.83 3.51 0.46 1.22 2.29 0 1.15
SCHULMAN AND SCHACHNE INST FOR NRSG & REHAB
555 ROCKAWAY PARKWAY BROOKLYN
3.32 3.09 0.50 1.06 2.03 32.9 1.30
SCHUYLER HOSPITAL L T C U 220 STEUBEN STREET
MONTOUR FALLS 3.41 3.04 0.16 0.81 2.23 0 1.09
SCHUYLER RIDGE R H C 1 ABELE BOULEVARD
CLIFTON PARK 4.10 3.61 0.45 1.05 2.55 0 1.22
SEA CREST HEALTH CARE CENTER
3035 WEST 24TH ST BROOKLYN
2.99 2.73 0.21 0.54 2.19 0 1.35
SEA VIEW HOSPITAL REHABILITATI
460 BRIELLE AVE STATEN ISLAND
4.18 4.03 0.75 1.14 2.89 4.0 1.12
SENECA HEALTH CARE CENTER 2987 SENECA STREET
WEST SENECA 4.36 4.16 0.44 1.18 2.98 0 1.11
SENECA HILL MANOR INC 20 MANOR DRIVE
OSWEGO 3.49 3.15 0.00 0.95 2.20 0 1.19
SENECA NURSING AND REHABILITATION CENTER
200 DOUGLAS DRIVE WATERLOO
3.05 2.96 0.40 1.05 1.92 0 1.18

67
Name and Address of Nursing Home
Total nursing staff hours
Total direct care
RN
direct care
LIC direct care
CN
A care
CM
S Phase II standard 0.75 R
N, 1.3 LIC
, 2.8 CN
A
Florida standard 1.0 LIC
, 2.6 CN
A
California standard
3.2 Total
Vermont standard
2.0 CN
A, 3.0 Total
Ohio R
N standard
0.2 RN
Illinois standard 0.5 LIC
, 2.5 Total
Special N
eeds (resident days as %
of total)
CM
I (last available quarter)
SEPHARDIC SKILLED NURSING AND REHAB CENTER
2266 CROPSEY AVENUE BROOKLYN
4.01 3.83 0.44 1.06 2.77 0 1.32
SHEEPSHEAD NURSING AND REHABILITATION CTR
2840 KNAPP ST BROOKLYN
3.95 3.70 0.55 0.99 2.71 0 1.58
SHERIDAN MANOR NURSING HOME
2799 SHERIDAN DRIVE TONAWANDA
4.19 3.73 0.00 1.18 2.55 – 1.11
SHORE VIEW NURSING HOME 2865 BRIGHTON 3RD STREET
BROOKLYN 3.31 3.01 0.41 0.96 2.05 0 1.38
SHOREFRONT JEWISH GERIATRIC CENTER
3015 W 29 ST BROOKLYN
3.49 3.19 0.09 0.77 2.41 0 1.45
SILVER LAKE SPECIALIZED CARE C
275 CASTLETON AVENUE STATEN ISLAND
4.03 3.96 0.59 1.16 2.80 14.5 1.28
SILVERCREST ECF 144 45 87TH AVENUE
JAMAICA 3.98 3.92 0.51 1.33 2.58 14.0 1.42
SKY VIEW REHABILITATION AND HEALTH CARE CENTER LLC
1280 ALBANY POST RD CROTON ON HUDSON
3.05 3.01 0.34 0.99 2.02 – –
SMITHTOWN CENTER FOR REHAB & NURSING CARE
391 NORTH COUNTY ROAD SMITHTOWN
3.57 3.25 0.29 0.88 2.37 1.1 1.33
SOLDIERS AND SAILORS MEMORIAL
418 NORTH MAIN STREET PENN YAN
2.89 2.71 0.10 0.88 1.83 13.6 1.07

68
Name and Address of Nursing Home
Total nursing staff hours
Total direct care
RN
direct care
LIC direct care
CN
A care
CM
S Phase II standard 0.75 R
N, 1.3 LIC
, 2.8 CN
A
Florida standard 1.0 LIC
, 2.6 CN
A
California standard
3.2 Total
Vermont standard
2.0 CN
A, 3.0 Total
Ohio R
N standard
0.2 RN
Illinois standard 0.5 LIC
, 2.5 Total
Special N
eeds (resident days as %
of total)
CM
I (last available quarter)
SOMERS MANOR NURSING HOME
ROUTE 100 SOMERS
2.69 2.56 0.42 0.73 1.83 0 1.14
SOUTH SHORE NURSING HOME 275 W MERRICK ROAD
FREEPORT 3.99 3.77 1.21 1.77 1.99 8.9 1.43
SOUTHAMPTON CARE CENTER 330 MEETING HOUSE LANE
SOUTHAMPTON 3.74 3.57 0.65 1.12 2.45 0 1.26
SPLIT ROCK REHAB AND HEALTH CARE CENTER 3525 BAYCHESTER AVE
BRONX
3.69 3.39 0.24 0.84 2.55 10.4 1.25
ST ANNS HOME FOR THE AGED 1500 PORTLAND AVENUE
ROCHESTER 3.74 3.61 0.51 1.46 2.15 0 1.09
ST ANNS NURSING HOME CO INC (THE HERITAGE) 1500 PORTLAND AVE
ROCHESTER
1.53 1.42 0.39 0.86 0.56 0 0.73
ST BARNABAS NURSING HOME 2175 QUARRY RD
BRONX 3.72 3.44 0.57 1.28 2.16 25.1 1.22
ST CABRINI NURSING HOME INC 115 BROADWAY DOBBS FERRY
3.81 3.53 0.46 0.89 2.63 0.3 1.20
ST CAMILLUS RESIDENTIAL HEALTH
813 FAY ROAD SYRACUSE
5.56 5.30 0.60 1.96 3.34 6.4 1.29
ST CATHERINE LABOURE HEALTH CARE CENTER
2157 MAIN STREET BUFFALO
4.50 4.23 0.52 1.51 2.72 0 1.31
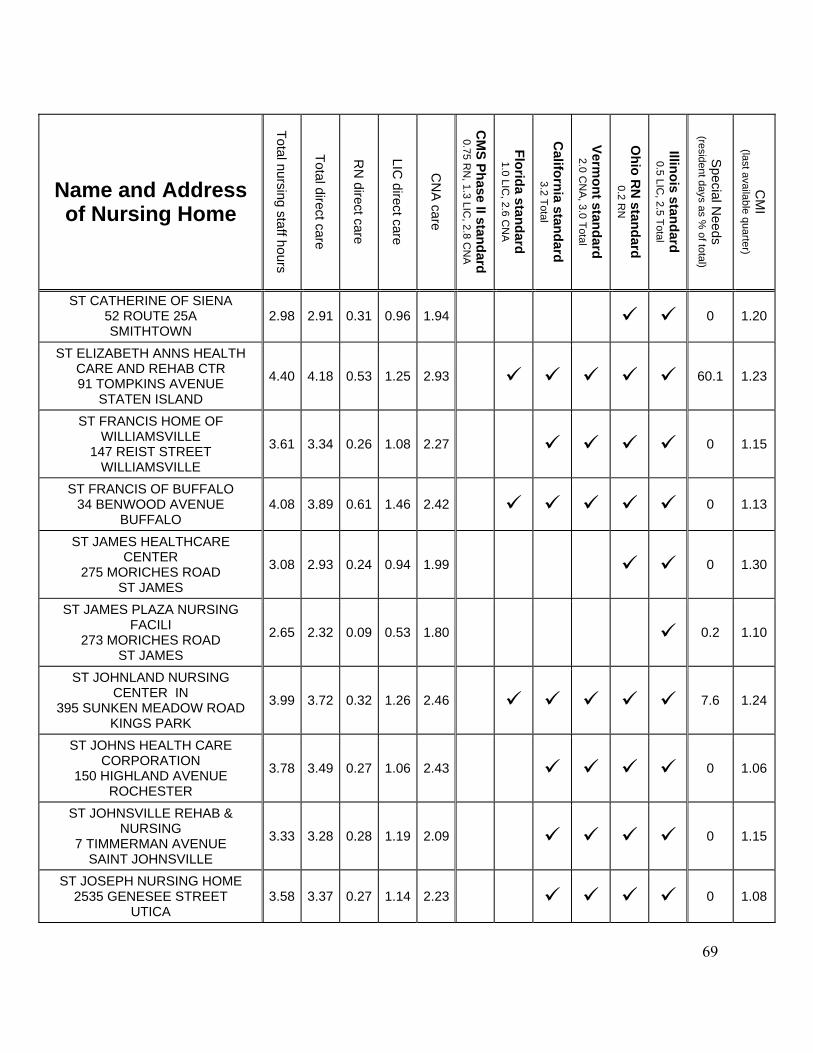
69
Name and Address of Nursing Home
Total nursing staff hours
Total direct care
RN
direct care
LIC direct care
CN
A care
CM
S Phase II standard 0.75 R
N, 1.3 LIC
, 2.8 CN
A
Florida standard 1.0 LIC
, 2.6 CN
A
California standard
3.2 Total
Vermont standard
2.0 CN
A, 3.0 Total
Ohio R
N standard
0.2 RN
Illinois standard 0.5 LIC
, 2.5 Total
Special N
eeds (resident days as %
of total)
CM
I (last available quarter)
ST CATHERINE OF SIENA 52 ROUTE 25A SMITHTOWN
2.98 2.91 0.31 0.96 1.94 0 1.20
ST ELIZABETH ANNS HEALTH CARE AND REHAB CTR 91 TOMPKINS AVENUE
STATEN ISLAND
4.40 4.18 0.53 1.25 2.93 60.1 1.23
ST FRANCIS HOME OF WILLIAMSVILLE
147 REIST STREET WILLIAMSVILLE
3.61 3.34 0.26 1.08 2.27 0 1.15
ST FRANCIS OF BUFFALO 34 BENWOOD AVENUE
BUFFALO 4.08 3.89 0.61 1.46 2.42 0 1.13
ST JAMES HEALTHCARE CENTER
275 MORICHES ROAD ST JAMES
3.08 2.93 0.24 0.94 1.99 0 1.30
ST JAMES PLAZA NURSING FACILI
273 MORICHES ROAD ST JAMES
2.65 2.32 0.09 0.53 1.80 0.2 1.10
ST JOHNLAND NURSING CENTER IN
395 SUNKEN MEADOW ROAD KINGS PARK
3.99 3.72 0.32 1.26 2.46 7.6 1.24
ST JOHNS HEALTH CARE CORPORATION
150 HIGHLAND AVENUE ROCHESTER
3.78 3.49 0.27 1.06 2.43 0 1.06
ST JOHNSVILLE REHAB & NURSING
7 TIMMERMAN AVENUE SAINT JOHNSVILLE
3.33 3.28 0.28 1.19 2.09 0 1.15
ST JOSEPH NURSING HOME 2535 GENESEE STREET
UTICA 3.58 3.37 0.27 1.14 2.23 0 1.08

70
Name and Address of Nursing Home
Total nursing staff hours
Total direct care
RN
direct care
LIC direct care
CN
A care
CM
S Phase II standard 0.75 R
N, 1.3 LIC
, 2.8 CN
A
Florida standard 1.0 LIC
, 2.6 CN
A
California standard
3.2 Total
Vermont standard
2.0 CN
A, 3.0 Total
Ohio R
N standard
0.2 RN
Illinois standard 0.5 LIC
, 2.5 Total
Special N
eeds (resident days as %
of total)
CM
I (last available quarter)
ST JOSEPHS HOME 420 LAFAYETTE STREET
OGDENSBURG 2.91 2.73 0.34 0.88 1.85 0 0.87
ST JOSEPHS HOSP S N F 555 EAST MARKET STREET
ELMIRA 4.06 3.95 0.82 1.47 2.48 0 1.05
ST JOSEPHS HOSPITAL NURSING HOME OF YONKERS
NY 127 SOUTH BROADWAY
YONKERS
3.66 3.38 0.30 1.01 2.38 0 1.36
ST JOSEPHS MANOR 2211 WEST STATE STREET
OLEAN 4.61 4.32 0.17 1.43 2.89 0 1.14
ST JOSEPHS PLACE 160 EAST MAIN STREET
PORT JERVIS 2.96 2.73 0.35 0.96 1.77 0 1.23
ST LUKES HEALTH SERVICES 299 EAST RIVER ROAD
OSWEGO 3.76 3.45 0.14 1.08 2.38 0 1.09
ST LUKES HOME 1650 CHAMPLIN AVENUE
UTICA 3.41 3.11 0.12 0.95 2.16 0 1.13
ST MARGARETS CENTER 27 HACKETT BLVD
ALBANY 6.22 5.34 0.96 1.51 3.83 65.5 1.49
ST MARYS CENTER INC 516 WEST 126TH STREET
NEW YORK 1.92 1.37 0.26 1.18 0.19 100.0 0.95
ST MARYS HOSPITAL FOR CHILDREN INC
29 01 216 STREET BAYSIDE
7.89 7.35 2.37 3.30 4.04 – –
ST MARYS REHABILITATION CENTER FOR CHILDREN 15 SPRING VALLEY ROAD
OSSINING
5.58 5.36 1.63 2.42 2.93 100.0 –
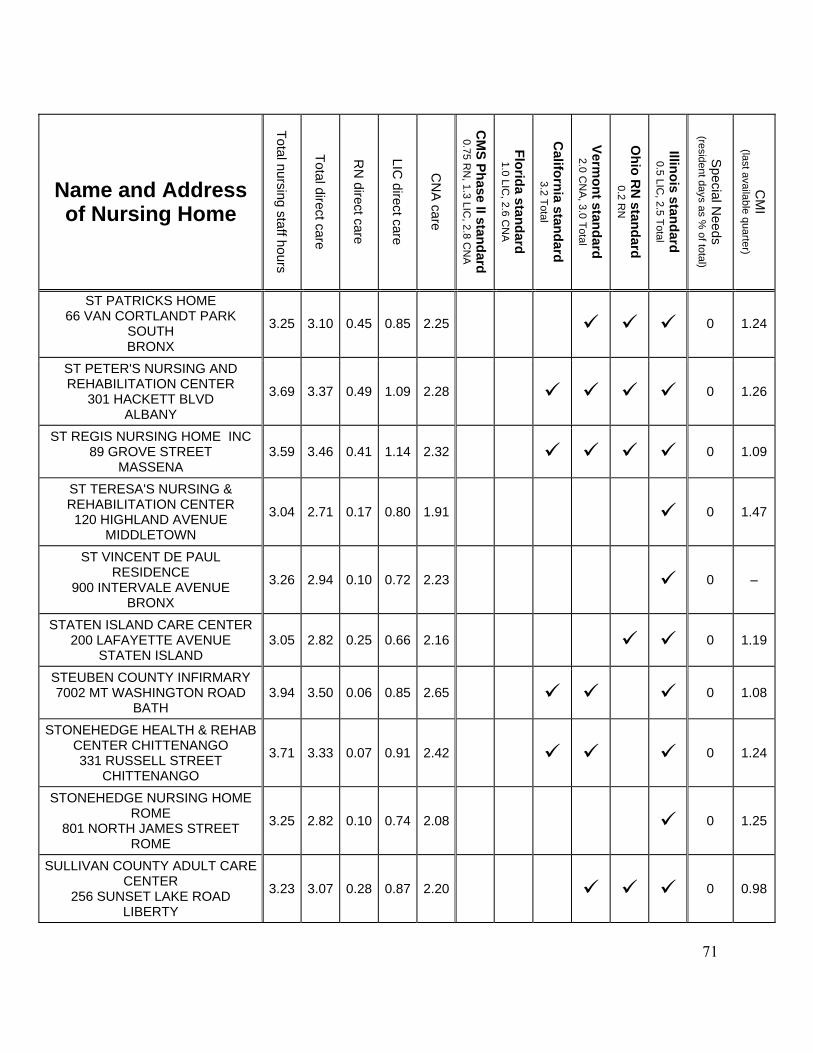
71
Name and Address of Nursing Home
Total nursing staff hours
Total direct care
RN
direct care
LIC direct care
CN
A care
CM
S Phase II standard 0.75 R
N, 1.3 LIC
, 2.8 CN
A
Florida standard 1.0 LIC
, 2.6 CN
A
California standard
3.2 Total
Vermont standard
2.0 CN
A, 3.0 Total
Ohio R
N standard
0.2 RN
Illinois standard 0.5 LIC
, 2.5 Total
Special N
eeds (resident days as %
of total)
CM
I (last available quarter)
ST PATRICKS HOME 66 VAN CORTLANDT PARK
SOUTH BRONX
3.25 3.10 0.45 0.85 2.25 0 1.24
ST PETER'S NURSING AND REHABILITATION CENTER
301 HACKETT BLVD ALBANY
3.69 3.37 0.49 1.09 2.28 0 1.26
ST REGIS NURSING HOME INC 89 GROVE STREET
MASSENA 3.59 3.46 0.41 1.14 2.32 0 1.09
ST TERESA'S NURSING & REHABILITATION CENTER
120 HIGHLAND AVENUE MIDDLETOWN
3.04 2.71 0.17 0.80 1.91 0 1.47
ST VINCENT DE PAUL RESIDENCE
900 INTERVALE AVENUE BRONX
3.26 2.94 0.10 0.72 2.23 0 –
STATEN ISLAND CARE CENTER 200 LAFAYETTE AVENUE
STATEN ISLAND 3.05 2.82 0.25 0.66 2.16 0 1.19
STEUBEN COUNTY INFIRMARY 7002 MT WASHINGTON ROAD
BATH 3.94 3.50 0.06 0.85 2.65 0 1.08
STONEHEDGE HEALTH & REHAB CENTER CHITTENANGO 331 RUSSELL STREET
CHITTENANGO
3.71 3.33 0.07 0.91 2.42 0 1.24
STONEHEDGE NURSING HOME ROME
801 NORTH JAMES STREET ROME
3.25 2.82 0.10 0.74 2.08 0 1.25
SULLIVAN COUNTY ADULT CARE CENTER
256 SUNSET LAKE ROAD LIBERTY
3.23 3.07 0.28 0.87 2.20 0 0.98

72
Name and Address of Nursing Home
Total nursing staff hours
Total direct care
RN
direct care
LIC direct care
CN
A care
CM
S Phase II standard 0.75 R
N, 1.3 LIC
, 2.8 CN
A
Florida standard 1.0 LIC
, 2.6 CN
A
California standard
3.2 Total
Vermont standard
2.0 CN
A, 3.0 Total
Ohio R
N standard
0.2 RN
Illinois standard 0.5 LIC
, 2.5 Total
Special N
eeds (resident days as %
of total)
CM
I (last available quarter)
SUMMIT PARK NURSING CARE CENTER
SANATORIUM ROAD POMONA
3.64 3.32 0.55 0.77 2.55 0 1.18
SUNHARBOR MANOR 255 WARNER AVENUE
ROSLYN HEIGHTS 3.81 3.66 0.51 1.27 2.39 0 1.34
SUNNYSIDE NURSING HOME 7000 COLLAMER RD
EAST SYRACUSE 3.60 3.32 0.14 1.14 2.18 0 1.27
SUNRISE MANOR CTR FOR NURSING
1325 BRENTWOOD ROAD BAY SHORE
3.26 3.11 0.28 1.09 2.02 0 1.37
SUNRISE NURSING HOME 17 SUNRISE DRIVE
OSWEGO 2.85 2.61 0.06 0.71 1.91 0 1.00
SUNSET NURSING HOME INC 232 ACADEMY STREET
BOONVILLE 3.90 3.80 0.21 1.33 2.47 0 1.13
SUSQUEHANNA NURSING & REHABILITATION CENTER, LLC
282 RIVERSIDE DR JOHNSON CITY
3.70 3.47 0.23 0.95 2.52 0 1.04
SUTTON PARK CTR NURSING REHAB
31 LOCKWOOD AVENUE NEW ROCHELLE
3.24 3.07 0.24 0.86 2.21 0 1.13
SYRACUSE HOME ASSOCIATION 7740 MEIGS ROAD BALDWINSVILLE
4.20 3.93 0.15 1.30 2.63 1.0 1.22
TARRYTOWN HALL CARE CENTER
WOOD COURT TARRYTOWN
3.25 2.95 0.00 0.58 2.36 0 1.26
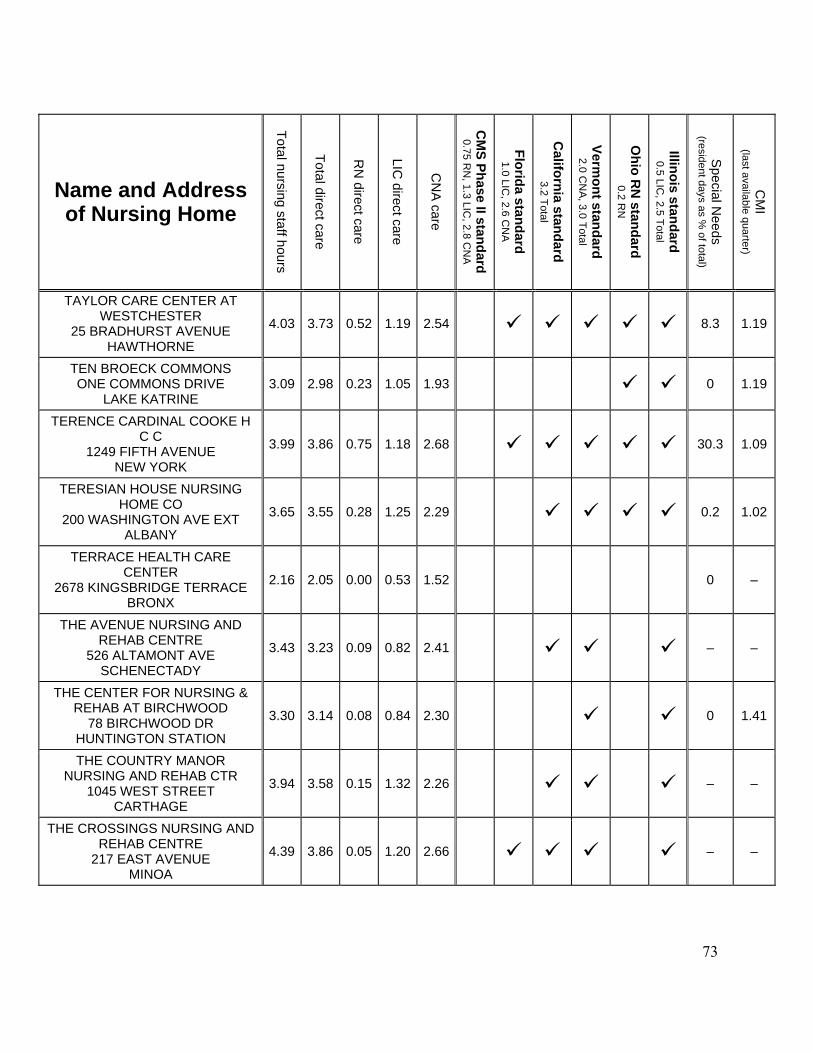
73
Name and Address of Nursing Home
Total nursing staff hours
Total direct care
RN
direct care
LIC direct care
CN
A care
CM
S Phase II standard 0.75 R
N, 1.3 LIC
, 2.8 CN
A
Florida standard 1.0 LIC
, 2.6 CN
A
California standard
3.2 Total
Vermont standard
2.0 CN
A, 3.0 Total
Ohio R
N standard
0.2 RN
Illinois standard 0.5 LIC
, 2.5 Total
Special N
eeds (resident days as %
of total)
CM
I (last available quarter)
TAYLOR CARE CENTER AT WESTCHESTER
25 BRADHURST AVENUE HAWTHORNE
4.03 3.73 0.52 1.19 2.54 8.3 1.19
TEN BROECK COMMONS ONE COMMONS DRIVE
LAKE KATRINE 3.09 2.98 0.23 1.05 1.93 0 1.19
TERENCE CARDINAL COOKE H C C
1249 FIFTH AVENUE NEW YORK
3.99 3.86 0.75 1.18 2.68 30.3 1.09
TERESIAN HOUSE NURSING HOME CO
200 WASHINGTON AVE EXT ALBANY
3.65 3.55 0.28 1.25 2.29 0.2 1.02
TERRACE HEALTH CARE CENTER
2678 KINGSBRIDGE TERRACE BRONX
2.16 2.05 0.00 0.53 1.52 0 –
THE AVENUE NURSING AND REHAB CENTRE
526 ALTAMONT AVE SCHENECTADY
3.43 3.23 0.09 0.82 2.41 – –
THE CENTER FOR NURSING & REHAB AT BIRCHWOOD
78 BIRCHWOOD DR HUNTINGTON STATION
3.30 3.14 0.08 0.84 2.30 0 1.41
THE COUNTRY MANOR NURSING AND REHAB CTR
1045 WEST STREET CARTHAGE
3.94 3.58 0.15 1.32 2.26 – –
THE CROSSINGS NURSING AND REHAB CENTRE
217 EAST AVENUE MINOA
4.39 3.86 0.05 1.20 2.66 – –
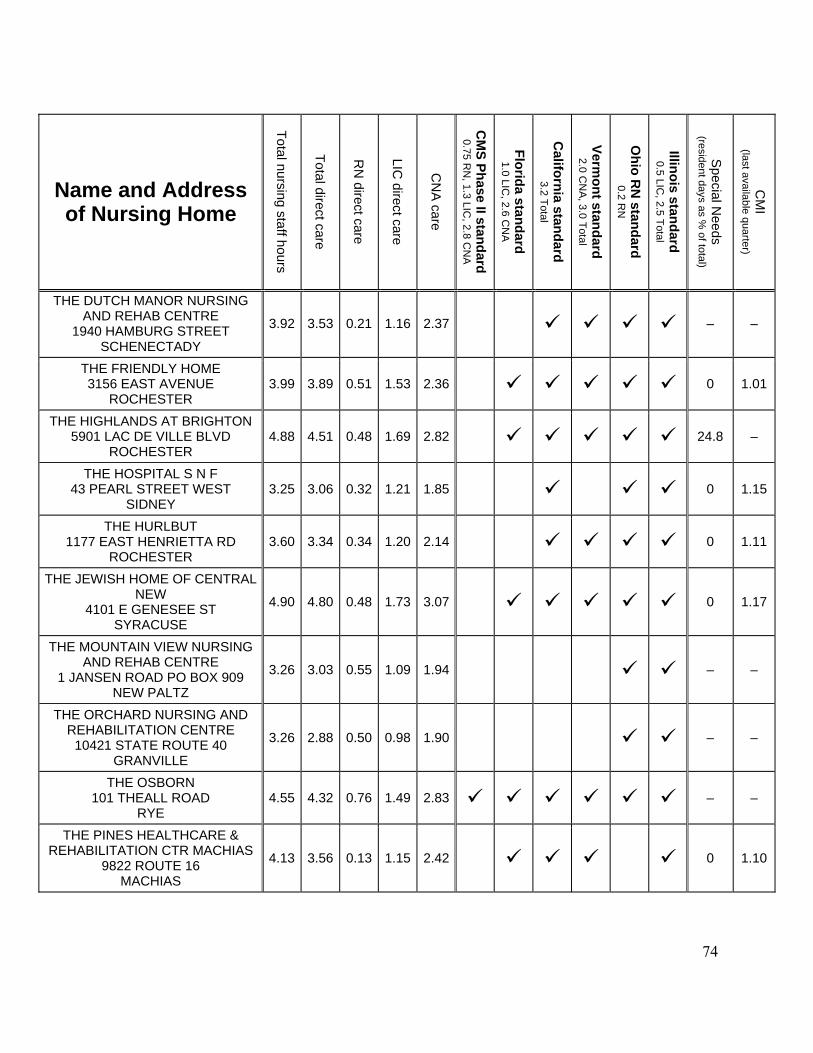
74
Name and Address of Nursing Home
Total nursing staff hours
Total direct care
RN
direct care
LIC direct care
CN
A care
CM
S Phase II standard 0.75 R
N, 1.3 LIC
, 2.8 CN
A
Florida standard 1.0 LIC
, 2.6 CN
A
California standard
3.2 Total
Vermont standard
2.0 CN
A, 3.0 Total
Ohio R
N standard
0.2 RN
Illinois standard 0.5 LIC
, 2.5 Total
Special N
eeds (resident days as %
of total)
CM
I (last available quarter)
THE DUTCH MANOR NURSING AND REHAB CENTRE
1940 HAMBURG STREET SCHENECTADY
3.92 3.53 0.21 1.16 2.37 – –
THE FRIENDLY HOME 3156 EAST AVENUE
ROCHESTER 3.99 3.89 0.51 1.53 2.36 0 1.01
THE HIGHLANDS AT BRIGHTON 5901 LAC DE VILLE BLVD
ROCHESTER 4.88 4.51 0.48 1.69 2.82 24.8 –
THE HOSPITAL S N F 43 PEARL STREET WEST
SIDNEY 3.25 3.06 0.32 1.21 1.85 0 1.15
THE HURLBUT 1177 EAST HENRIETTA RD
ROCHESTER 3.60 3.34 0.34 1.20 2.14 0 1.11
THE JEWISH HOME OF CENTRAL NEW
4101 E GENESEE ST SYRACUSE
4.90 4.80 0.48 1.73 3.07 0 1.17
THE MOUNTAIN VIEW NURSING AND REHAB CENTRE
1 JANSEN ROAD PO BOX 909 NEW PALTZ
3.26 3.03 0.55 1.09 1.94 – –
THE ORCHARD NURSING AND REHABILITATION CENTRE
10421 STATE ROUTE 40 GRANVILLE
3.26 2.88 0.50 0.98 1.90 – –
THE OSBORN 101 THEALL ROAD
RYE 4.55 4.32 0.76 1.49 2.83 – –
THE PINES HEALTHCARE & REHABILITATION CTR MACHIAS
9822 ROUTE 16 MACHIAS
4.13 3.56 0.13 1.15 2.42 0 1.10
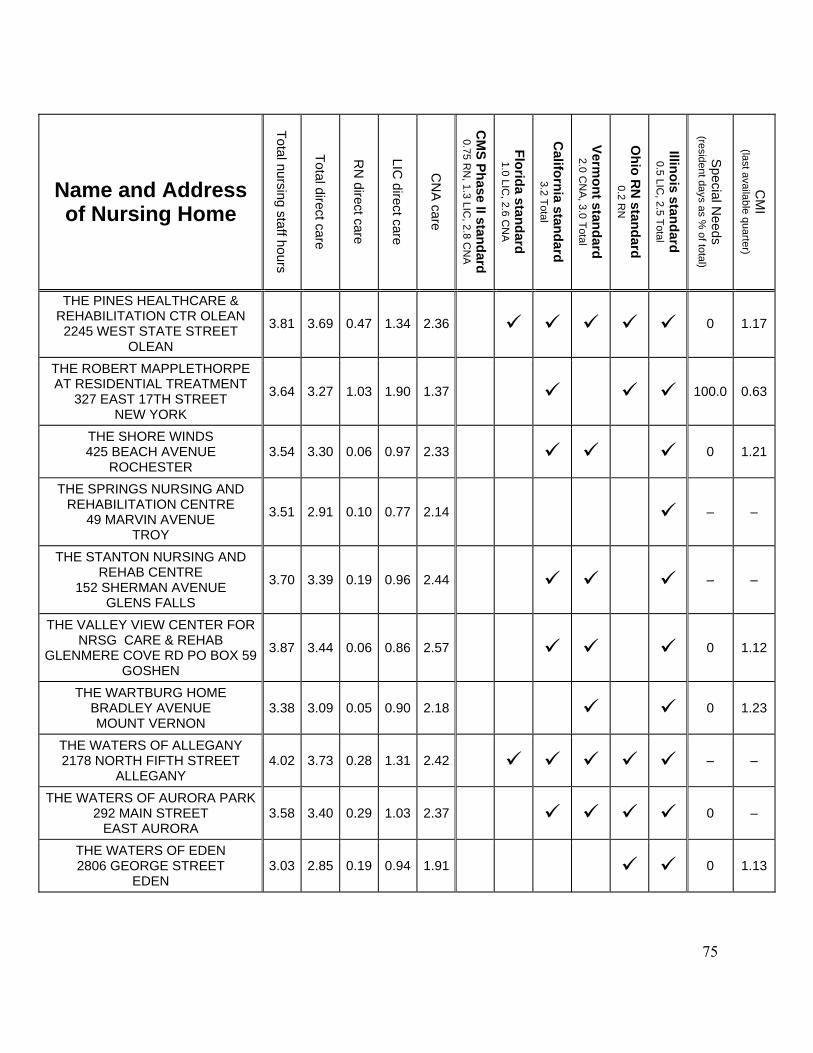
75
Name and Address of Nursing Home
Total nursing staff hours
Total direct care
RN
direct care
LIC direct care
CN
A care
CM
S Phase II standard 0.75 R
N, 1.3 LIC
, 2.8 CN
A
Florida standard 1.0 LIC
, 2.6 CN
A
California standard
3.2 Total
Vermont standard
2.0 CN
A, 3.0 Total
Ohio R
N standard
0.2 RN
Illinois standard 0.5 LIC
, 2.5 Total
Special N
eeds (resident days as %
of total)
CM
I (last available quarter)
THE PINES HEALTHCARE & REHABILITATION CTR OLEAN 2245 WEST STATE STREET
OLEAN
3.81 3.69 0.47 1.34 2.36 0 1.17
THE ROBERT MAPPLETHORPE AT RESIDENTIAL TREATMENT
327 EAST 17TH STREET NEW YORK
3.64 3.27 1.03 1.90 1.37 100.0 0.63
THE SHORE WINDS 425 BEACH AVENUE
ROCHESTER 3.54 3.30 0.06 0.97 2.33 0 1.21
THE SPRINGS NURSING AND REHABILITATION CENTRE
49 MARVIN AVENUE TROY
3.51 2.91 0.10 0.77 2.14 – –
THE STANTON NURSING AND REHAB CENTRE
152 SHERMAN AVENUE GLENS FALLS
3.70 3.39 0.19 0.96 2.44 – –
THE VALLEY VIEW CENTER FOR NRSG CARE & REHAB
GLENMERE COVE RD PO BOX 59 GOSHEN
3.87 3.44 0.06 0.86 2.57 0 1.12
THE WARTBURG HOME BRADLEY AVENUE MOUNT VERNON
3.38 3.09 0.05 0.90 2.18 0 1.23
THE WATERS OF ALLEGANY 2178 NORTH FIFTH STREET
ALLEGANY 4.02 3.73 0.28 1.31 2.42 – –
THE WATERS OF AURORA PARK 292 MAIN STREET
EAST AURORA 3.58 3.40 0.29 1.03 2.37 0 –
THE WATERS OF EDEN 2806 GEORGE STREET
EDEN 3.03 2.85 0.19 0.94 1.91 0 1.13
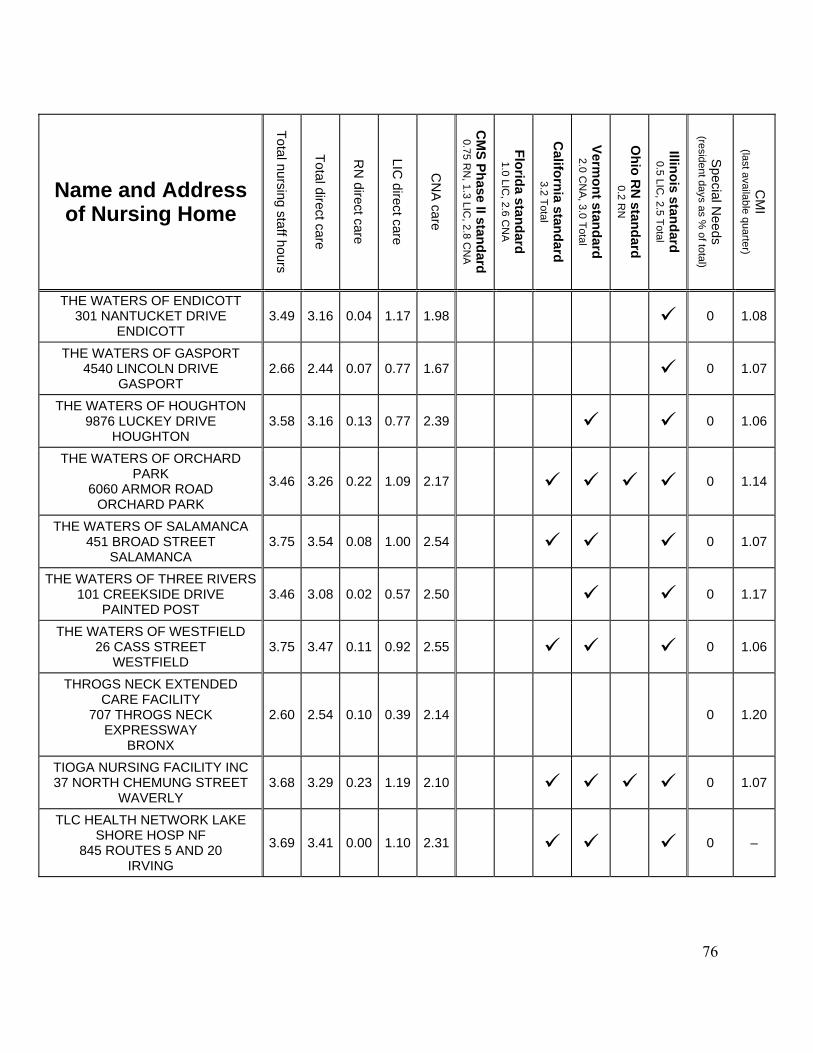
76
Name and Address of Nursing Home
Total nursing staff hours
Total direct care
RN
direct care
LIC direct care
CN
A care
CM
S Phase II standard 0.75 R
N, 1.3 LIC
, 2.8 CN
A
Florida standard 1.0 LIC
, 2.6 CN
A
California standard
3.2 Total
Vermont standard
2.0 CN
A, 3.0 Total
Ohio R
N standard
0.2 RN
Illinois standard 0.5 LIC
, 2.5 Total
Special N
eeds (resident days as %
of total)
CM
I (last available quarter)
THE WATERS OF ENDICOTT 301 NANTUCKET DRIVE
ENDICOTT 3.49 3.16 0.04 1.17 1.98 0 1.08
THE WATERS OF GASPORT 4540 LINCOLN DRIVE
GASPORT 2.66 2.44 0.07 0.77 1.67 0 1.07
THE WATERS OF HOUGHTON 9876 LUCKEY DRIVE
HOUGHTON 3.58 3.16 0.13 0.77 2.39 0 1.06
THE WATERS OF ORCHARD PARK
6060 ARMOR ROAD ORCHARD PARK
3.46 3.26 0.22 1.09 2.17 0 1.14
THE WATERS OF SALAMANCA 451 BROAD STREET
SALAMANCA 3.75 3.54 0.08 1.00 2.54 0 1.07
THE WATERS OF THREE RIVERS 101 CREEKSIDE DRIVE
PAINTED POST 3.46 3.08 0.02 0.57 2.50 0 1.17
THE WATERS OF WESTFIELD 26 CASS STREET
WESTFIELD 3.75 3.47 0.11 0.92 2.55 0 1.06
THROGS NECK EXTENDED CARE FACILITY
707 THROGS NECK EXPRESSWAY
BRONX
2.60 2.54 0.10 0.39 2.14 0 1.20
TIOGA NURSING FACILITY INC 37 NORTH CHEMUNG STREET
WAVERLY 3.68 3.29 0.23 1.19 2.10 0 1.07
TLC HEALTH NETWORK LAKE SHORE HOSP NF
845 ROUTES 5 AND 20 IRVING
3.69 3.41 0.00 1.10 2.31 0 –

77
Name and Address of Nursing Home
Total nursing staff hours
Total direct care
RN
direct care
LIC direct care
CN
A care
CM
S Phase II standard 0.75 R
N, 1.3 LIC
, 2.8 CN
A
Florida standard 1.0 LIC
, 2.6 CN
A
California standard
3.2 Total
Vermont standard
2.0 CN
A, 3.0 Total
Ohio R
N standard
0.2 RN
Illinois standard 0.5 LIC
, 2.5 Total
Special N
eeds (resident days as %
of total)
CM
I (last available quarter)
TOLSTOY FOUNDATION NURSING HOM
100 LAKE ROAD, PO BOX 319 VALLEY COTTAGE
3.49 3.25 0.20 0.95 2.31 0 –
TOWNHOUSE EXTENDED CARE FACILITY
755 HEMPSTEAD TURNPIKE UNIONDALE
4.00 3.81 0.29 1.25 2.56 6.7 1.30
TREETOPS REHABILITATION AND CARE CENTER
3550 LEXINGTON AVENUE MOHEGAN LAKE
3.20 2.95 0.22 0.69 2.26 – 1.04
UIHLEIN MERCY CENTER 420 OLD MILITARY ROAD
LAKE PLACID 2.93 2.90 0.56 0.95 1.95 0 1.10
UNION PLAZA CARE CENTER 33 23 UNION STREET
FLUSHING 2.83 2.75 0.24 0.80 1.95 0 1.16
UNITED HEBREW GERIATRIC CENTER
60 WILLOW DRIVE NEW ROCHELLE
2.50 2.28 0.38 0.61 1.66 0 0.95
UNITED HELPERS CANTON NURSING
40 WEST MAIN STREET CANTON
3.86 3.75 0.21 0.95 2.80 0 1.05
UNITED HELPERS CEDARS NURSING
6695 STATE HIGHWAY 37 OGDENSBURG
3.61 3.33 0.30 1.06 2.27 0 1.20
UNITED HELPERS NURSING HOME
8101 STATE HIGHWAY 68 OGDENSBURG
3.79 3.60 0.37 0.92 2.68 0 1.19
UNITED NURSING HOME FOR THE AG
391 PELHAM ROAD NEW ROCHELLE
3.76 3.44 0.57 0.92 2.51 0 1.20

78
Name and Address of Nursing Home
Total nursing staff hours
Total direct care
RN
direct care
LIC direct care
CN
A care
CM
S Phase II standard 0.75 R
N, 1.3 LIC
, 2.8 CN
A
Florida standard 1.0 LIC
, 2.6 CN
A
California standard
3.2 Total
Vermont standard
2.0 CN
A, 3.0 Total
Ohio R
N standard
0.2 RN
Illinois standard 0.5 LIC
, 2.5 Total
Special N
eeds (resident days as %
of total)
CM
I (last available quarter)
UNITY LIVING CENTER 89 GENESSEE STREET
ROCHESTER 3.74 3.39 0.50 1.40 1.99 0 –
UNIVERSITY NURSING HOME 2505 GRAND AVE
BRONX 3.13 3.02 0.26 0.95 2.07 0 1.23
VALLEY HEALTH SERVICES INC 690 WEST GERMAN STREET
HERKIMER 5.10 4.90 0.32 1.75 3.15 0 1.22
VALLEY VIEW MANOR NURSING HOME
40 PARK STREET NORWICH
3.56 3.28 0.08 1.14 2.14 0 1.18
VAN ALLEN NURSING HOME 755 E MONROE STREET
LITTLE FALLS 2.95 2.68 0.17 1.08 1.60 0 1.06
VAN DUYN HOME AND HOSPITAL
5075 WEST SENECA TURNPIKE SYRACUSE
3.22 3.11 0.38 1.02 2.09 0 1.02
VAN RENSSELAER MANOR 85 BLOOMINGROVE DRIVE
TROY 4.34 4.08 0.51 1.41 2.67 0 1.09
VERRAZANO NURSING HOME 100 CASTLETON AVENUE
STATEN ISLAND 2.73 2.59 0.27 0.71 1.88 0 1.26
VESTAL NURSING CENTER 860 OLD VESTAL ROAD
VESTAL 3.45 3.09 0.28 0.96 2.13 0 1.16
VICTORIA HOME 25 N MALCOLM STREET
OSSINING 4.37 3.98 0.32 1.08 2.91 0 1.03
VICTORY LAKE NURSING CENTER
419 NORTH QUAKER LANE, PO BOX 2008
HYDE PARK
3.51 3.28 0.08 1.17 2.11 0 1.08

79
Name and Address of Nursing Home
Total nursing staff hours
Total direct care
RN
direct care
LIC direct care
CN
A care
CM
S Phase II standard 0.75 R
N, 1.3 LIC
, 2.8 CN
A
Florida standard 1.0 LIC
, 2.6 CN
A
California standard
3.2 Total
Vermont standard
2.0 CN
A, 3.0 Total
Ohio R
N standard
0.2 RN
Illinois standard 0.5 LIC
, 2.5 Total
Special N
eeds (resident days as %
of total)
CM
I (last available quarter)
VICTORY MEMORIAL HOSPITAL SNF
699 92 STREET BROOKLYN
3.58 3.21 0.55 0.83 2.38 0 1.35
VILLAGE CENTER FOR CARE 607 HUDSON STREET
NEW YORK 3.41 3.34 0.34 1.08 2.26 0 1.13
VIVIAN TEAL HOWARD RHCF 116 EAST CASTLE STREET
SYRACUSE 3.63 3.30 0.11 0.97 2.33 0 –
WARTBURG LUTHERAN HOME FOR THE AGING
50 SHEFFIELD AVENUE BROOKLYN
4.66 4.08 0.26 1.26 2.82 0 1.17
WARTBURG NURSING HOME INC
50 SHEFFIELD AVENUE BROOKLYN
3.47 3.32 0.22 0.88 2.44 0 1.18
WATERFRONT HEALTH CARE CENTER, INC.
200 SEVENTH STREET BUFFALO
3.98 3.52 0.10 1.01 2.51 0 1.12
WATERVIEW HILLS REHABILITATION AND NRSG
CTR 537 ROUTE 22
PURDY STATION
3.40 2.88 0.27 0.77 2.11 0 1.22
WATERVIEW NURSING HOME 119 15 27TH AVENUE
FLUSHING 2.77 2.64 0.23 0.74 1.90 0 1.24
WAYNE CENTER FOR NURSING & REHABILITATION
3530 WAYNE AVENUE BRONX
2.90 2.66 0.16 0.73 1.93 7.7 1.22
WAYNE COUNTY NURSING HOME
1529 NYE ROAD LYONS
4.39 4.12 0.29 1.52 2.60 0 0.98
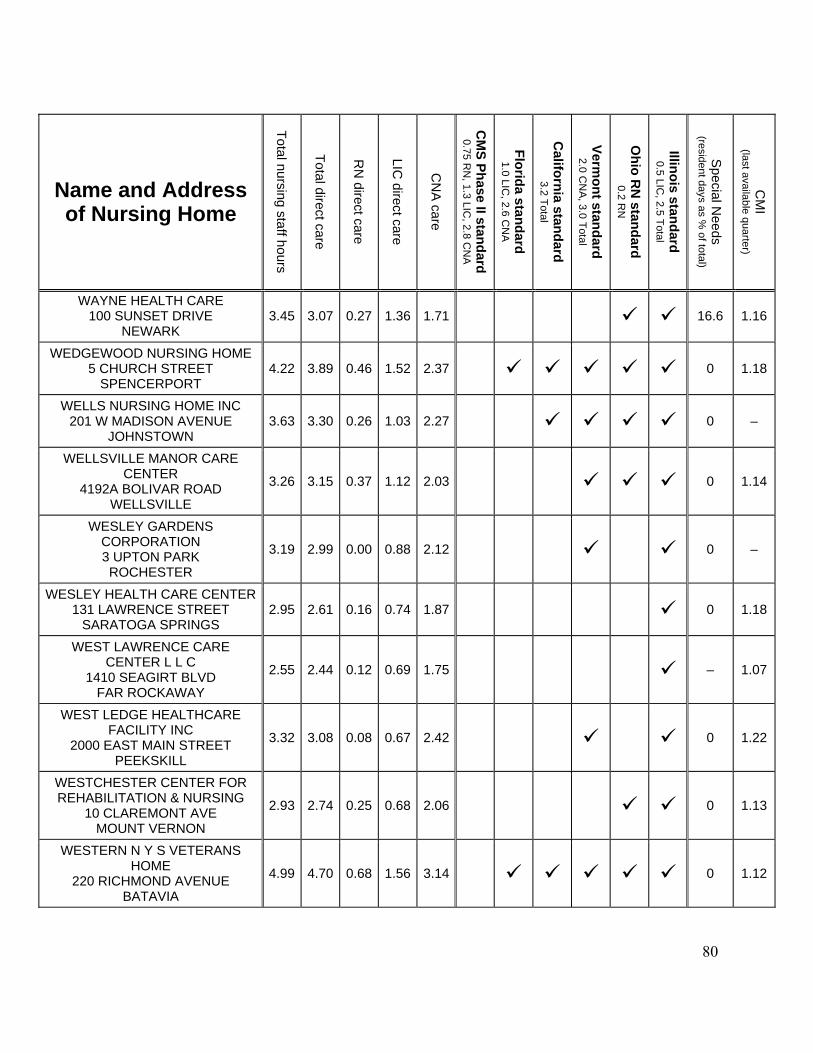
80
Name and Address of Nursing Home
Total nursing staff hours
Total direct care
RN
direct care
LIC direct care
CN
A care
CM
S Phase II standard 0.75 R
N, 1.3 LIC
, 2.8 CN
A
Florida standard 1.0 LIC
, 2.6 CN
A
California standard
3.2 Total
Vermont standard
2.0 CN
A, 3.0 Total
Ohio R
N standard
0.2 RN
Illinois standard 0.5 LIC
, 2.5 Total
Special N
eeds (resident days as %
of total)
CM
I (last available quarter)
WAYNE HEALTH CARE 100 SUNSET DRIVE
NEWARK 3.45 3.07 0.27 1.36 1.71 16.6 1.16
WEDGEWOOD NURSING HOME 5 CHURCH STREET
SPENCERPORT 4.22 3.89 0.46 1.52 2.37 0 1.18
WELLS NURSING HOME INC 201 W MADISON AVENUE
JOHNSTOWN 3.63 3.30 0.26 1.03 2.27 0 –
WELLSVILLE MANOR CARE CENTER
4192A BOLIVAR ROAD WELLSVILLE
3.26 3.15 0.37 1.12 2.03 0 1.14
WESLEY GARDENS CORPORATION 3 UPTON PARK ROCHESTER
3.19 2.99 0.00 0.88 2.12 0 –
WESLEY HEALTH CARE CENTER 131 LAWRENCE STREET
SARATOGA SPRINGS 2.95 2.61 0.16 0.74 1.87 0 1.18
WEST LAWRENCE CARE CENTER L L C
1410 SEAGIRT BLVD FAR ROCKAWAY
2.55 2.44 0.12 0.69 1.75 – 1.07
WEST LEDGE HEALTHCARE FACILITY INC
2000 EAST MAIN STREET PEEKSKILL
3.32 3.08 0.08 0.67 2.42 0 1.22
WESTCHESTER CENTER FOR REHABILITATION & NURSING
10 CLAREMONT AVE MOUNT VERNON
2.93 2.74 0.25 0.68 2.06 0 1.13
WESTERN N Y S VETERANS HOME
220 RICHMOND AVENUE BATAVIA
4.99 4.70 0.68 1.56 3.14 0 1.12

81
Name and Address of Nursing Home
Total nursing staff hours
Total direct care
RN
direct care
LIC direct care
CN
A care
CM
S Phase II standard 0.75 R
N, 1.3 LIC
, 2.8 CN
A
Florida standard 1.0 LIC
, 2.6 CN
A
California standard
3.2 Total
Vermont standard
2.0 CN
A, 3.0 Total
Ohio R
N standard
0.2 RN
Illinois standard 0.5 LIC
, 2.5 Total
Special N
eeds (resident days as %
of total)
CM
I (last available quarter)
WESTGATE NURSING HOME 525 BEAHAN ROAD
ROCHESTER 2.09 2.00 0.12 0.71 1.28 0 –
WESTHAMPTON CARE CENTER 78 OLD COUNTRY ROAD
WESTHAMPTON 3.12 2.99 0.23 1.02 1.97 0 1.24
WESTMOUNT HEALTH FACILITY 42 GURNEY LANE
QUEENSBURY 3.43 3.23 0.46 1.01 2.22 0 1.12
WHITE OAKS NURSING HOME 8565 JERICHO TURNPIKE
WOODBURY 3.12 2.93 0.22 0.81 2.12 0 1.22
WHITE PLAINS CENTER FOR NURSING CARE, LLC
220 WEST POST ROAD WHITE PLAINS
3.31 2.94 0.00 0.82 2.12 – –
WHITTIER REHAB & SKILLED NURSING CENTER
1 GREEN MANOR AVENUE GHENT
4.13 4.01 0.72 1.45 2.56 – –
WILLIAMSBRIDGE MANOR NH 1540 TOMLINSON AVENUE
BRONX 2.68 2.61 0.29 0.84 1.77 0 1.11
WILLOUGHBY REHAB AND HEALTH CARE CENTER 949 WILLOUGHBY AVE
BROOKLYN
2.48 2.39 0.22 0.71 1.67 0 –
WILLOW POINT NURSING HOME 3700 OLD VESTAL ROAD
VESTAL 3.57 3.38 0.39 1.14 2.24 0 1.12
WINGATE AT DUTCHESS 3 SUMMIT COURT
FISHKILL 4.40 3.90 0.49 1.45 2.45 10.3 1.26
WINGATE AT ST FRANCIS, LLC 10 HASTINGS DRIVE
BEACON 4.23 3.55 0.37 1.38 2.17 10.7 –
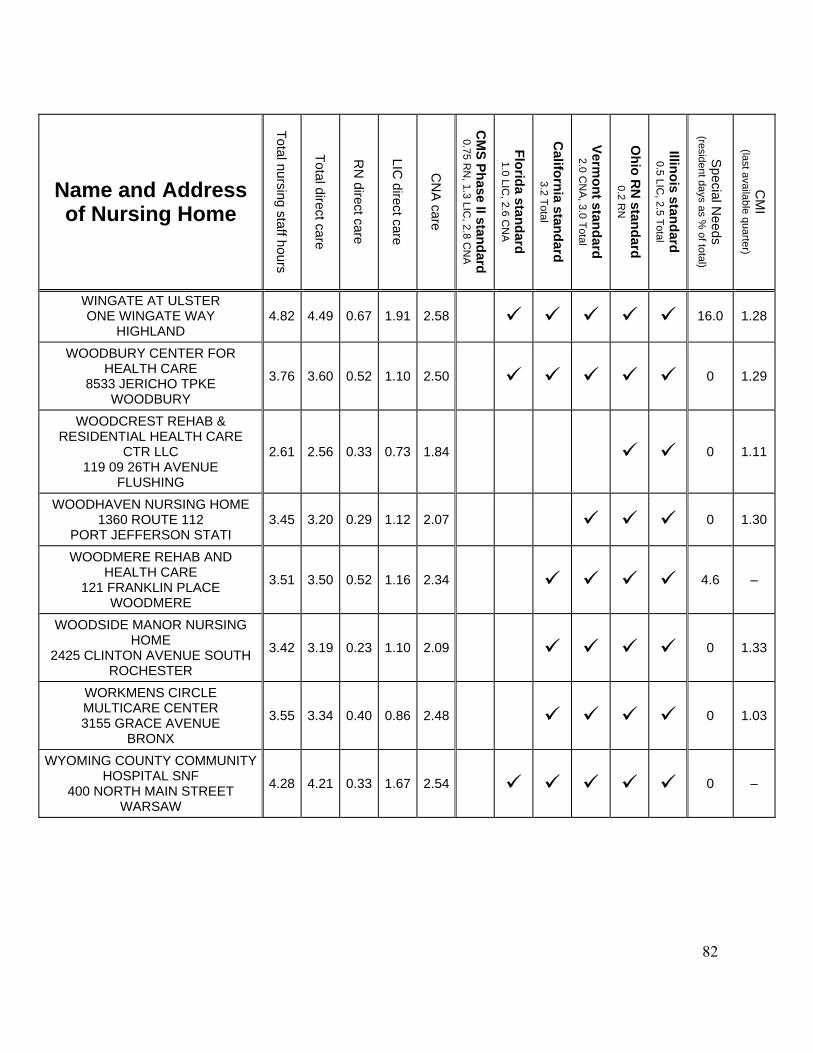
82
Name and Address of Nursing Home
Total nursing staff hours
Total direct care
RN
direct care
LIC direct care
CN
A care
CM
S Phase II standard 0.75 R
N, 1.3 LIC
, 2.8 CN
A
Florida standard 1.0 LIC
, 2.6 CN
A
California standard
3.2 Total
Vermont standard
2.0 CN
A, 3.0 Total
Ohio R
N standard
0.2 RN
Illinois standard 0.5 LIC
, 2.5 Total
Special N
eeds (resident days as %
of total)
CM
I (last available quarter)
WINGATE AT ULSTER ONE WINGATE WAY
HIGHLAND 4.82 4.49 0.67 1.91 2.58 16.0 1.28
WOODBURY CENTER FOR HEALTH CARE
8533 JERICHO TPKE WOODBURY
3.76 3.60 0.52 1.10 2.50 0 1.29
WOODCREST REHAB & RESIDENTIAL HEALTH CARE
CTR LLC 119 09 26TH AVENUE
FLUSHING
2.61 2.56 0.33 0.73 1.84 0 1.11
WOODHAVEN NURSING HOME 1360 ROUTE 112
PORT JEFFERSON STATI 3.45 3.20 0.29 1.12 2.07 0 1.30
WOODMERE REHAB AND HEALTH CARE
121 FRANKLIN PLACE WOODMERE
3.51 3.50 0.52 1.16 2.34 4.6 –
WOODSIDE MANOR NURSING HOME
2425 CLINTON AVENUE SOUTH ROCHESTER
3.42 3.19 0.23 1.10 2.09 0 1.33
WORKMENS CIRCLE MULTICARE CENTER 3155 GRACE AVENUE
BRONX
3.55 3.34 0.40 0.86 2.48 0 1.03
WYOMING COUNTY COMMUNITY HOSPITAL SNF
400 NORTH MAIN STREET WARSAW
4.28 4.21 0.33 1.67 2.54 0 –

83
Appendix A
Nursing Homes Excluded from the Staffing List
Name and address of nursing home
Certified Beds
Exclusion Code
Exclusion Definition
Survey Date
PARK NURSING HOME 128 BEACH 115TH STREET
ROCKAWAY PARK 196 2 <1.5 hours 02/25/05
WINDSOR PARK NURSING HOME 212 40 HILLSIDE AVENUE
QUEENS VILLAGE 70 2 <1.5 hours 08/05/05
BETH ABRAHAM HEALTH SERVICES 612 ALLERTON AVENUE
BRONX 520 6 Change in
staffing 03/08/05
SPRAIN BROOK MANOR N H 77 JACKSON AVE
SCARSDALE 121 6 Change in
staffing 12/30/04
OAK HOLLOW NURSING CENTER 49 OAKCREST AVE
MIDDLE ISLAND 164 7 6-12 hours,
excluded 04/25/05
ALBANY COUNTY NURSING HOME 780 ALBANY SHAKER ROAD
ALBANY 420 4 CNA>5.25
hours 08/26/05
LITTLE NECK NURSING HOME 260 19 NASSAU BLVD
LITTLE NECK 120 2 <1.5 hours 09/09/05
HOLLISWOOD CARE CENTER INC 195 44 WOODHULL AVENUE
HOLLIS 314 2 <1.5 hours 02/16/05
THE BRIGHTONIAN 1919 ELMWOOD AVENUE
ROCHESTER 54 2 <1.5 hours 06/09/05
UNITED ODD FELLOW AND REBEKAH HOME
1072 HAVEMEYER AVENUE BRONX
213 2 <1.5 hours 09/15/05
THE WATERS OF DUNKIRK 447 449 LAKE SHORE DRIVE WEST
DUNKIRK 40 4 CNA>5.25
hours 01/05/05
PATCHOGUE NURSING CENTER 25 SCHOENFELD BLVD
PATCHOGUE 120 2 <1.5 hours 05/31/05

Appendix A Excluded Nursing Homes
84
Name and address of nursing home
Certified Beds
Exclusion Code
Exclusion Definition
Survey Date
WILLIAMSVILLE SUBURBAN NURSING HOME
163 SOUTH UNION ROAD WILLIAMSVILLE
220 6 Change in staffing 06/16/05
RIVER MANOR CARE CENTER 630 E 104TH STREET
BROOKLYN 380 2 <1.5 hours 07/29/05
HORIZON CARE CENTER 64 11 BEACH CHANNEL DRIVE
ARVERNE 280 2 <1.5 hours 11/16/05
INCARNATION CHILDRENS CENTER 142 AUDOBON AVENUE
NEW YORK 21 4 CNA>5.25
hours 10/18/05
HELEN HAYES HOSPITAL RESIDENTIAL HEALTH CARE FAC
51 N RT 9W WEST HAVERSTRAW
25 7 6-12 hours, excluded 03/30/05
OUR LADY OF PEACE NURSING CARE RESIDENCE
5285 LEWISTON ROAD LEWISTON
250 2 <1.5 hours 11/09/05
WESTCHESTER MEADOWS 55 GRASSLAND ROAD
VALHALLA 20 3 >12 hours 10/07/05
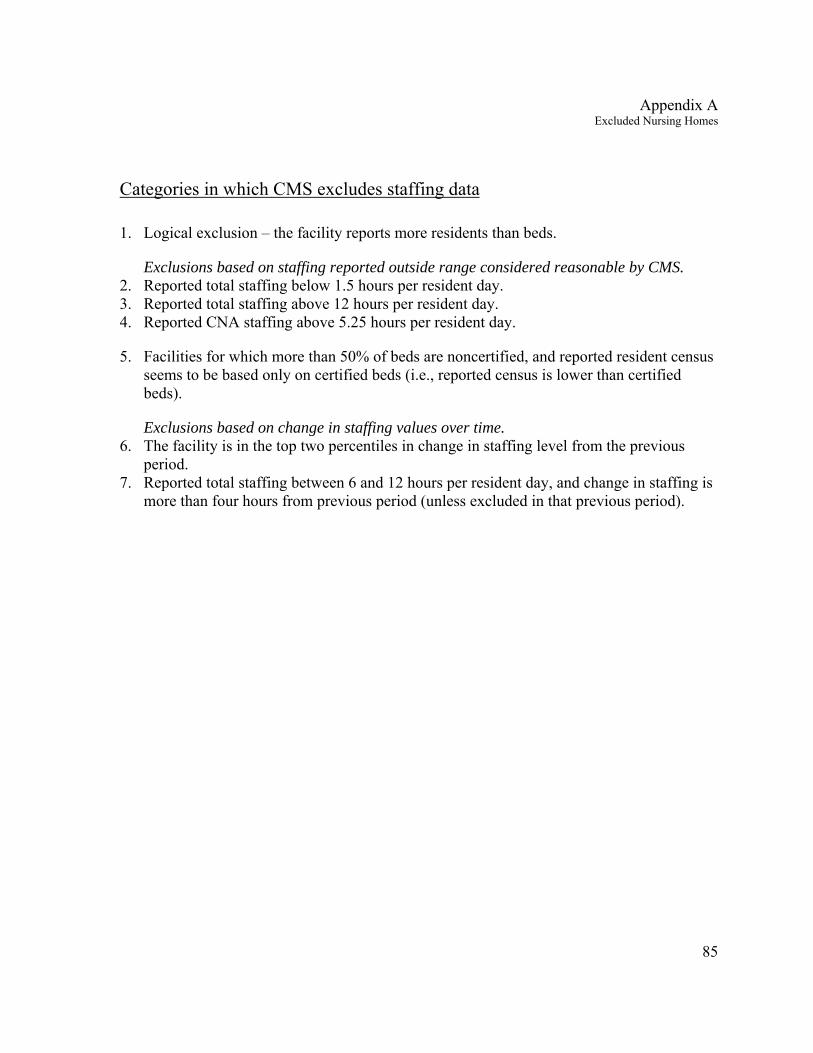
Appendix A Excluded Nursing Homes
85
Categories in which CMS excludes staffing data
1. Logical exclusion – the facility reports more residents than beds.
Exclusions based on staffing reported outside range considered reasonable by CMS. 2. Reported total staffing below 1.5 hours per resident day. 3. Reported total staffing above 12 hours per resident day. 4. Reported CNA staffing above 5.25 hours per resident day.
5. Facilities for which more than 50% of beds are noncertified, and reported resident census seems to be based only on certified beds (i.e., reported census is lower than certified beds).
Exclusions based on change in staffing values over time. 6. The facility is in the top two percentiles in change in staffing level from the previous
period. 7. Reported total staffing between 6 and 12 hours per resident day, and change in staffing is
more than four hours from previous period (unless excluded in that previous period).

86
Appendix B
Staffing Levels and the Quality of Care: The Research
Many kinds of information are important to people choosing nursing homes. Certainly
they may want to know about the quality of care in such facilities. Also relevant is the evidence
that links care to staffing. A consumer who learns about this relationship can make more
informed decisions about the weight to give staffing levels in choosing a home.
The relationships between staffing levels and quality of care have been studied
empirically, with findings from numerous research studies over many years. More recent
research has actually identified certain numerical staffing levels below which care is impaired.
In 2001, the Institute of Medicine (“IOM”)1 issued a report reviewing what it called the
abundant research evidence that both nursing-to-resident staffing levels and the ratio of
professional nurses to other nursing personnel are important predictors of high quality of care in
nursing homes.2 The 2001 report was not the first assessment by the IOM; it built on prior
studies including a 1986 report on ways to improve the quality of care.3 The report noted
research associating greater numbers of nurses with improved resident outcomes, and concluded
that on the whole there were inadequate numbers of nurses to provide the care needed.4
Extensive and thorough academic research has reached similar conclusions. Studies by
many researchers over many years have repeatedly described a distinct relationship between
nursing staff levels and the quality of care.5
1 The Institute of Medicine is a component of the National Academy of Sciences, which is an independent advisory organization created by the federal government. The IOM’s mission is to serve as adviser to the nation to improve health by providing unbiased, evidence-based, and authoritative information and advice concerning health and science policy. 2 Institute of Medicine, “Improving the Quality of Long-Term Care” (Wunderlich & Kohler eds. 2001) at 12, 190. 3 Institute of Medicine Committee on Nursing Home Regulations, “Improving the Quality of Care in Nursing Homes” (Takeuchi, Burke & McGeary eds. 1986). 4 Id. at 101. 5 Many of the studies are briefly described in the 2001 report cited above. IOM, “Improving the Quality of Long-Term Care” (Wunderlich & Kohler eds. 2001) at 187-89. As the IOM report describes, one Massachusetts study found that better outcomes for nursing home residents were not related to higher RN staffing levels, but some seventeen other studies were cited in support of the “positive association between nurse staffing levels and the

Appendix B The Statistical Research
87
Federal agencies have also studied staffing levels. In 1999, the HHS Office of Inspector
General (OIG) issued a report based primarily on six studies that it had recently conducted on
nursing home care in ten states including New York.6 Reviewing extensive evidence of serious
care deficiencies – including inadequate prevention and treatment of conditions such as pressure
sores, lack of nutrition, and incontinence – the report concluded that nursing home staffing levels
should be higher, “since this directly impacts on the care residents receive.”7
An exhaustive federal study recently provided further support for the relationship
between staffing and problems with the quality of care. In 1990, Congress directed HHS to
perform a study on nurse staffing levels.8 The department’s Centers for Medicare & Medicaid
Services (CMS), with the aid of contractors, consultants, and a panel of technical experts,
undertook a massive study, and reported the results in two phases.
The Phase I report, issued in 2000, considered the relationship between staffing ratios and
quality of care, based on (i) a review of the literature and expert opinion; (ii) an outcomes
analysis using data gathered from approximately 1,800 nursing homes in New York, Ohio, and
Texas; and (iii) a time-motion analysis of requirements for implementing five daily nurse aide
care processes that have been linked to good outcomes.
The Phase II report was transmitted to Congress in 2002, and included data from a
representative sample of over 5,000 facilities in ten states including New York, distinguishing
between short-stay and long-stay residents. The report refined the Phase I time-motion analysis,
processes and outcomes of nursing home care.” Id. There are also numerous studies in addition to the ones given as examples in the IOM report. For example, when one expert surveyed the academic literature at a briefing for congressional staff members, she cited six additional studies that found a positive relationship between nurse staffing levels and the quality of care. Harrington, “Nursing Home Staffing and Quality”, http://nccnhr.newc.com/uploads/CHcongressionalbriefing0502.ppt, slide 12 (2002) (citing 17 studies from 1977 through 2002, in addition to CMS studies, including Fottler et al. 1981, Gustafson et al. 1990, Johnson-Pawlson 1993, Castle 2000, Ryden et al. 2000, and Horn 2002). 6 OIG, “Quality of Care in Nursing Homes: An Overview” (1999), http://oig.hhs.gov/oei/reports/oei-02-99-00060.pdf. 7 Id. at 30. 8 In 1990, Congress directed that HHS complete the study by 1992, but the results were actually not submitted until the following decade.
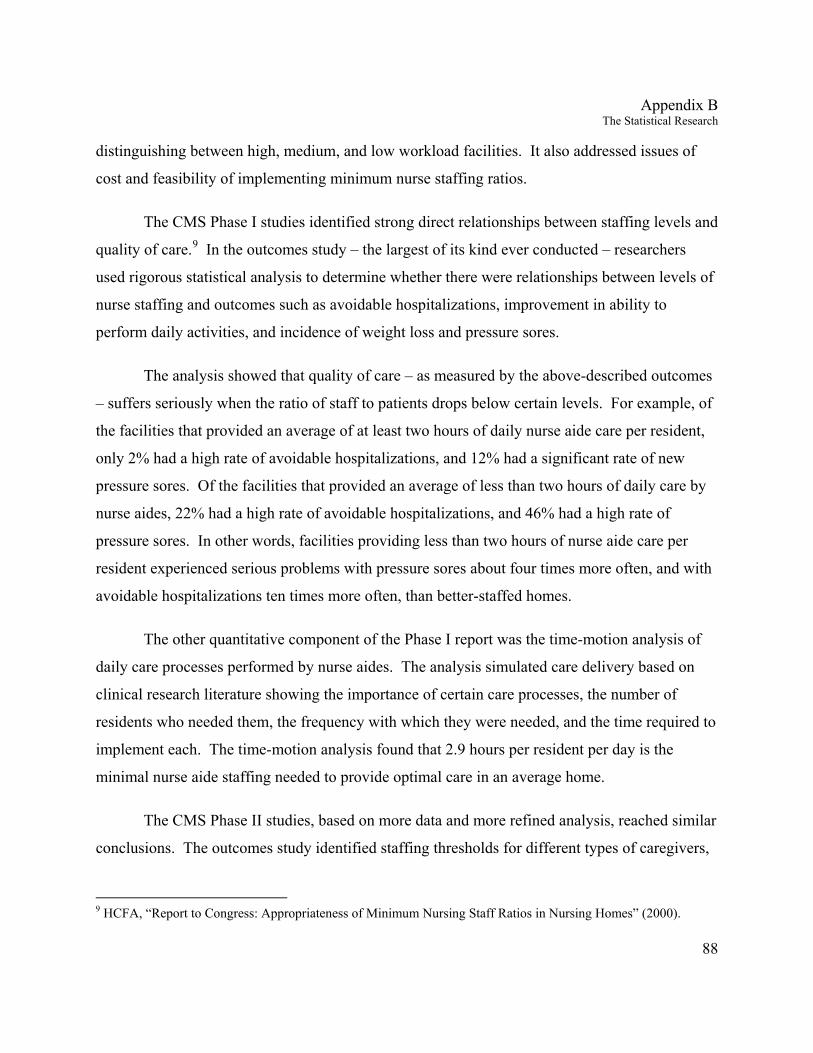
Appendix B The Statistical Research
88
distinguishing between high, medium, and low workload facilities. It also addressed issues of
cost and feasibility of implementing minimum nurse staffing ratios.
The CMS Phase I studies identified strong direct relationships between staffing levels and
quality of care.9 In the outcomes study – the largest of its kind ever conducted – researchers
used rigorous statistical analysis to determine whether there were relationships between levels of
nurse staffing and outcomes such as avoidable hospitalizations, improvement in ability to
perform daily activities, and incidence of weight loss and pressure sores.
The analysis showed that quality of care – as measured by the above-described outcomes
– suffers seriously when the ratio of staff to patients drops below certain levels. For example, of
the facilities that provided an average of at least two hours of daily nurse aide care per resident,
only 2% had a high rate of avoidable hospitalizations, and 12% had a significant rate of new
pressure sores. Of the facilities that provided an average of less than two hours of daily care by
nurse aides, 22% had a high rate of avoidable hospitalizations, and 46% had a high rate of
pressure sores. In other words, facilities providing less than two hours of nurse aide care per
resident experienced serious problems with pressure sores about four times more often, and with
avoidable hospitalizations ten times more often, than better-staffed homes.
The other quantitative component of the Phase I report was the time-motion analysis of
daily care processes performed by nurse aides. The analysis simulated care delivery based on
clinical research literature showing the importance of certain care processes, the number of
residents who needed them, the frequency with which they were needed, and the time required to
implement each. The time-motion analysis found that 2.9 hours per resident per day is the
minimal nurse aide staffing needed to provide optimal care in an average home.
The CMS Phase II studies, based on more data and more refined analysis, reached similar
conclusions. The outcomes study identified staffing thresholds for different types of caregivers,
9 HCFA, “Report to Congress: Appropriateness of Minimum Nursing Staff Ratios in Nursing Homes” (2000).

Appendix B The Statistical Research
89
and found that care for long-stay residents was impaired when staffing fell below those
numbers.10 Here are the thresholds identified in the Phase II study:
Phase II staffing thresholds below which care is impaired
Staff category Hours per resident day
RNs .75
Total licensed nurses (RNs + LPNs) 1.3
Nurse aides (CNAs) 2.8
The refined Phase II time-motion analysis reached a result for nurse aides similar to the above
result from the outcomes study.11 The study found that implementation of all the thresholds as
minimum requirements “would find 52 percent of all nursing homes failing to meet all of these
standards and 97 percent failing to meet one or more.” HHS has not sought to base regulations
on the findings of these studies, and indeed has questioned whether they fully account for all the
10 The quality measures for long-stay residents were functional improvement, incidence of pressure sores, incidence of skin trauma, improvement in residents’ resistance to the provision of needed care, and weight loss. The study concluded that for each quality measure, “there was a pattern of incremental benefits of increased staffing until a threshold was reached at which point there were no further significant benefits with respect to quality when additional staff were utilized.” CMS, “Appropriateness of Minimum Nurse Staffing Ratios in Nursing Homes: Phase II Final Report” at 1-6 (2001). The study also found thresholds for short-stay residents, based on quality measures relating to hospital transfers for potentially avoidable causes. Those thresholds were .55 hours for RNs, 1.15 hours for licensed staff, and 2.4 hours for aides. This report compares staffing levels to the thresholds for long-stay patients, but consumers seeking homes for short stays should bear in mind the thresholds found applicable to those circumstances. 11 CMS analyzed the amount of nurse aide staffing minimally necessary to provide all five key care processes on a timely basis in facilities with different case mixes and therefore different workloads. The minimally necessary levels of nurse aide staffing were 2.8 hours per resident day for low workload facilities and 3.2 hours in high workload facilities. CMS, “Appropriateness of Minimum Nurse Staffing Ratios in Nursing Homes: Phase II Final Report” at 1-7 (2001). That analysis has since been validated by further research. A 2004 study, examining sixteen resident care processes typically implemented by nurse aides in areas such as feeding assistance, incontinence care, and exercise, supported the conclusion that nurse aide staffing above 2.8 hours per resident per day is associated with better quality. Schnelle, Simmons, Harrington, Cadogan, Garcia & Bates-Jensen, “Relationship of Nursing Home Staffing to Quality of Care,” Health Services Research 39:2 (April 2004).

Appendix B The Statistical Research
90
relevant factors. See footnote 4 on page 5 above. But the Phase II study has been widely cited
as the most comprehensive and thorough research on this topic.
The Government Accountability Office provided another recent analysis of the
relationship between staffing levels and quality of care. It studied deficiency statistics and
staffing data for nursing homes in three states. The overall analysis showed that “nursing hours
per resident day – especially nurses’ aide hours – were related to quality of care deficiencies,
with homes providing more nursing hours being less likely to have identified quality problems
than homes providing fewer nursing hours.”12
12 GAO, “Nursing Homes: Quality of Care More Related to Staffing than Spending,” GAO-02-431R on Nursing Home Expenditures and Quality (June 2002). The relationship held in Ohio and Washington but there was an inverse relationship in Mississippi. The former states had staffing data available in cost reports, and the study excluded about 5% of their free-standing nursing homes because of missing data; in Mississippi, staffing data was not available in cost reports, and the study excluded 31% of its free-standing nursing homes.
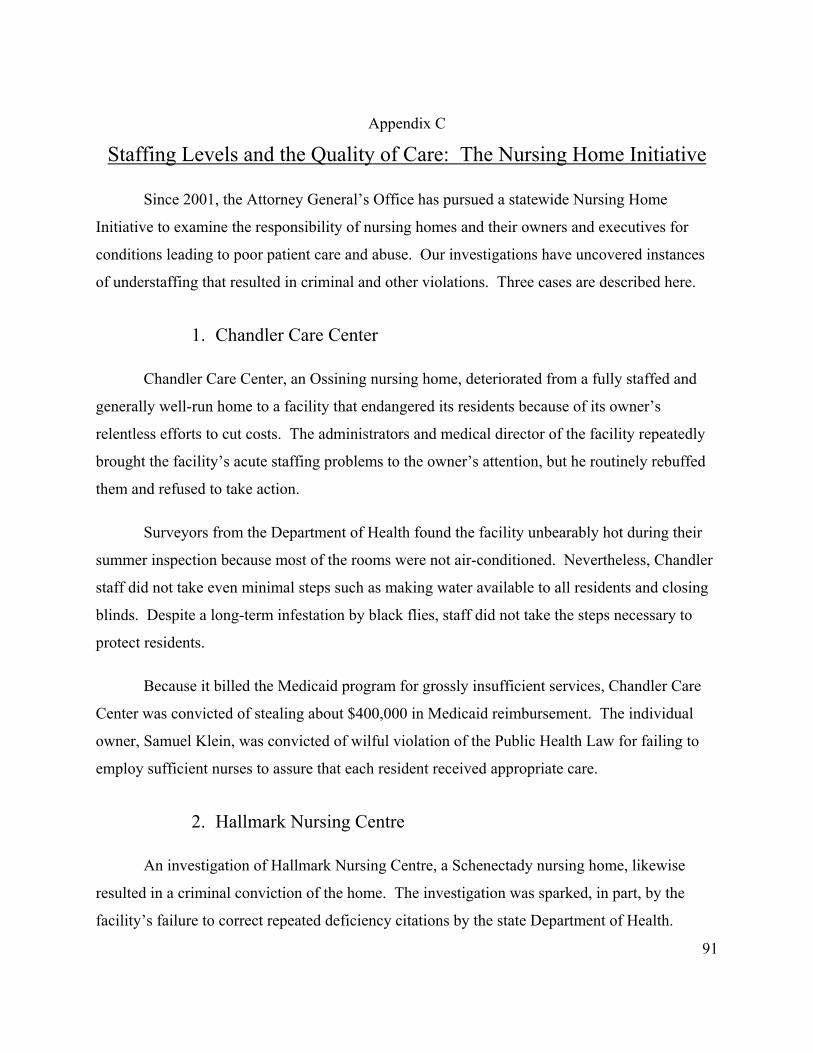
91
Appendix C
Staffing Levels and the Quality of Care: The Nursing Home Initiative
Since 2001, the Attorney General’s Office has pursued a statewide Nursing Home
Initiative to examine the responsibility of nursing homes and their owners and executives for
conditions leading to poor patient care and abuse. Our investigations have uncovered instances
of understaffing that resulted in criminal and other violations. Three cases are described here.
1. Chandler Care Center
Chandler Care Center, an Ossining nursing home, deteriorated from a fully staffed and
generally well-run home to a facility that endangered its residents because of its owner’s
relentless efforts to cut costs. The administrators and medical director of the facility repeatedly
brought the facility’s acute staffing problems to the owner’s attention, but he routinely rebuffed
them and refused to take action.
Surveyors from the Department of Health found the facility unbearably hot during their
summer inspection because most of the rooms were not air-conditioned. Nevertheless, Chandler
staff did not take even minimal steps such as making water available to all residents and closing
blinds. Despite a long-term infestation by black flies, staff did not take the steps necessary to
protect residents.
Because it billed the Medicaid program for grossly insufficient services, Chandler Care
Center was convicted of stealing about $400,000 in Medicaid reimbursement. The individual
owner, Samuel Klein, was convicted of wilful violation of the Public Health Law for failing to
employ sufficient nurses to assure that each resident received appropriate care.
2. Hallmark Nursing Centre
An investigation of Hallmark Nursing Centre, a Schenectady nursing home, likewise
resulted in a criminal conviction of the home. The investigation was sparked, in part, by the
facility’s failure to correct repeated deficiency citations by the state Department of Health.

Appendix C The Attorney General’s nursing home cases
92
Inspectors had cited the facility for insufficient staffing once in 2000 and twice in 2001. In the
first of those surveys, the inspectors found that twelve residents who had not received adequate
care had suffered harm, including reduced ambulation and range of motion, and increased rates
of pressure sores. In the second survey, inspectors found that insufficient staff levels had
compromised proper care as to pressure sores, resulted in medication errors, and undermined
patient dignity. In the third, there were again findings of deficiencies in the areas of pressure
sores and administration of medications.
The administrator of the nursing home knew as early as April 2000 that staffing was at a
critically low level and that resident care was at risk. Although Hallmark assured the Health
Department that it would address staffing issues at the facility, the facility continued to cut
staffing until it reached its lowest levels in January and February 2001. Yet at the same time that
staff levels dropped, the facility continued aggressively to pursue new patient admissions to
increase revenues. The failure to employ additional staff was not due to a lack of financial
resources; in 2000, the owners withdrew more than a million dollars from the facility.
The owners’ enhanced profits came at the cost of care necessary to the well-being of the
residents. As the Department of Health found, during the period that staffing was slashed,
multiple residents developed unnecessary pressure sores and went without needed treatments,
therapies and medications.
At Hallmark, the worst shortages were of RNs. Because RNs were not available to
perform the assessments that only they are authorized to do, many residents did not get proper
medical interventions. Hallmark sustained a drastic decline of RN staffing around the year 2000,
falling from a high of almost 35 minutes of RN care per resident day to a low of about 4 minutes
per day in 2001. In addition, to cover up the fact that assessments had been performed by
unauthorized staff rather than by registered nurses, nursing home staff falsified the facility’s
records.
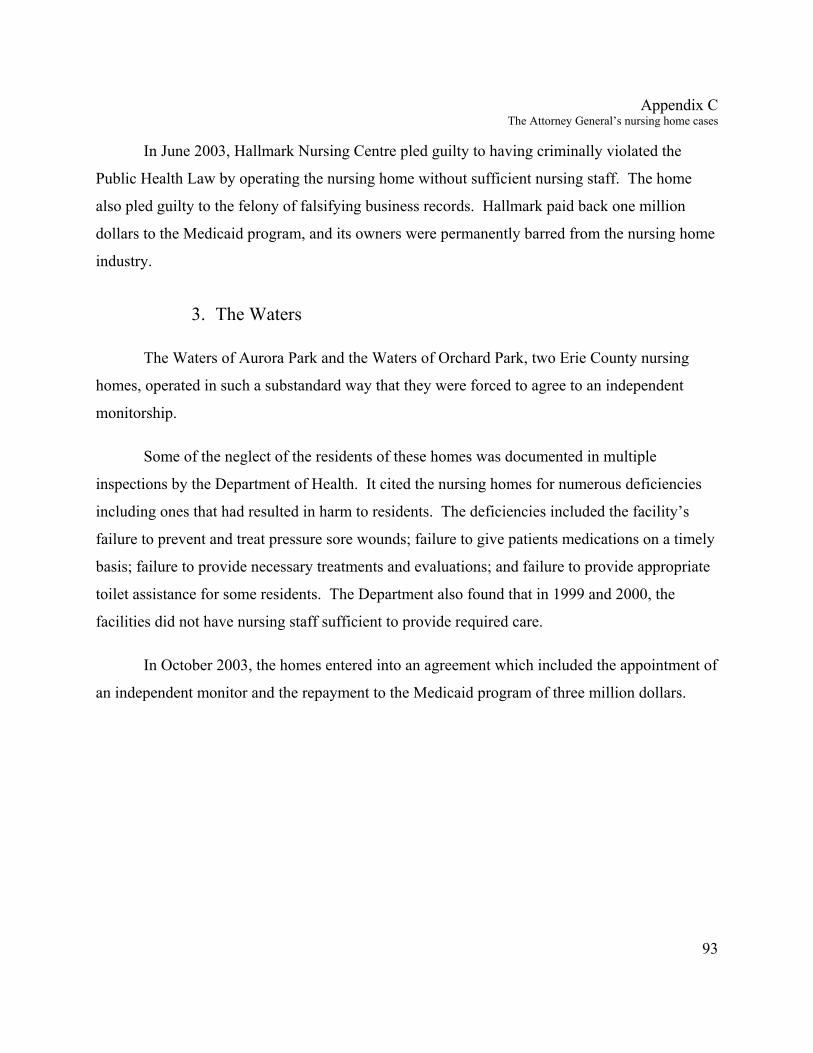
Appendix C The Attorney General’s nursing home cases
93
In June 2003, Hallmark Nursing Centre pled guilty to having criminally violated the
Public Health Law by operating the nursing home without sufficient nursing staff. The home
also pled guilty to the felony of falsifying business records. Hallmark paid back one million
dollars to the Medicaid program, and its owners were permanently barred from the nursing home
industry.
3. The Waters
The Waters of Aurora Park and the Waters of Orchard Park, two Erie County nursing
homes, operated in such a substandard way that they were forced to agree to an independent
monitorship.
Some of the neglect of the residents of these homes was documented in multiple
inspections by the Department of Health. It cited the nursing homes for numerous deficiencies
including ones that had resulted in harm to residents. The deficiencies included the facility’s
failure to prevent and treat pressure sore wounds; failure to give patients medications on a timely
basis; failure to provide necessary treatments and evaluations; and failure to provide appropriate
toilet assistance for some residents. The Department also found that in 1999 and 2000, the
facilities did not have nursing staff sufficient to provide required care.
In October 2003, the homes entered into an agreement which included the appointment of
an independent monitor and the repayment to the Medicaid program of three million dollars.
94
Appendix D
Staffing Data and Its Sources
There are various sources of staffing data for facilities in New York State. As noted
above, the staffing information in the foregoing list is drawn from a CMS database called Online
Survey, Certification, and Reporting (OSCAR). State surveyors – in New York, employees of
the Department of Health – inspect each nursing home at least once during a 15-month period.
Each time there is an inspection, the facility is required to report certain information, including
staffing levels, to CMS.
Consumers should be aware of other sources of staffing information as well. For
example, it can be useful to speak with people familiar with the staffing patterns at a particular
nursing home. Moreover, starting in 2003, nursing homes have been required to post the number
of licensed and unlicensed nursing staff directly responsible for resident care on each daily shift.1
This requirement has been elaborated in a regulation, effective December 27, 2005, requiring
daily posting of the total number and the actual hours worked by RNs, LPNs, and CNAs, as well
as the resident census. The posting must be in a clear and readable format in a prominent place
readily accessible to residents and visitors. Also, the facility must, upon oral or written request,
make nurse staffing data available to the public for review at a cost not to exceed the community
standard. 2
Staffing information is also found in yearly cost reports that nursing homes are required
to file with the Department of Health. These reports provide staffing data for an entire year and
they are reviewed by outside auditors. One drawback to this source is that the most recent
available cost report figures are for calendar year 2004, so the OSCAR figures are more current
overall.
1 Medicare, Medicaid, and SCHIP Benefits Improvement and Protection Act of 2000, sec. 941. 2 70 Fed. Reg. 62065 (Oct. 28, 2005).
Appendix D Staffing Data and its Sources
95
There is, moreover, a gap in the cost report data. For nursing staff actually employed by
the facility, the cost reports provide specific information about hours of direct care, as well as
numbers of residents, allowing ready computation of care hours per resident day. For many
homes, however, the hours listed in the cost reports are an incomplete measure of the care given,
because those homes supplement their staff by contracting with outside employment agencies
who supply “agency” staff as needed. As to such “agency” nursing staff, the cost reports list the
dollar amounts that the facilities spent on these labor costs, but they do not specify staffing levels
by hours. The omission of agency hours led us to choose the OSCAR data over the cost report
data for inclusion in this report.
Nevertheless, the cost report data has certain advantages. The OSCAR figures reflect
only a two-week period at the time of the survey, and they are gathered and reported, without
audit, by the facilities themselves. In our nursing home investigations we have seen instances of
institutions increasing staffing during the two-week reporting period. The use of OSCAR data –
as in this report, and in the federal government’s Nursing Home Compare website – may in some
cases be a generous approach to measuring the staffing of a nursing home.
Attempts to quantify the reliability of OSCAR data have yielded conflicting results. One
study found average staffing hours reported on OSCAR for California facilities to be only .1
hour higher than corresponding cost report data.3 On the other hand, some recent OIG reports
“have found that actual staffing levels are often significantly lower than the self-reported
[OSCAR] staffing data contained on the Nursing Home Compare website, in one instance by
36%.”4
We compared the OSCAR data to cost report data for facilities in New York. Average
staffing levels were close between the two sources for each kind of caregiver. This observation
provided further support for the utility of the OSCAR data. However, there are particular
3 Harrington, Zimmerman, Karon, Robinson & Beutel, “Nursing Home Staffing and Its Relationship to Deficiencies,” 55B Journal of Gerontology at S285 (2000). 4 Letter from Rep. Waxman and Sen. Grassley to Hon. Tommy Thompson, at 2 & n.6 (June 25, 2004).

Appendix D Staffing Data and its Sources
96
instances in which a nursing home’s staffing, as reflected in the presumptively more reliable cost
report, is significantly less than the levels reflected in OSCAR. When the OSCAR staffing
levels for a nursing home seem out of line with other information, consumers may want to
inquire into the extent and significance of any apparent discrepancies.