Staff Retirement Plan Annual Report 2013 - World...
54
Financial Management of the Plan Staff Retirement Plan Annual Report 2013
Transcript of Staff Retirement Plan Annual Report 2013 - World...

Fina
ncia
l Man
agem
ent
of th
e Pl
an
Staff Retirement Plan Annual Report 2013
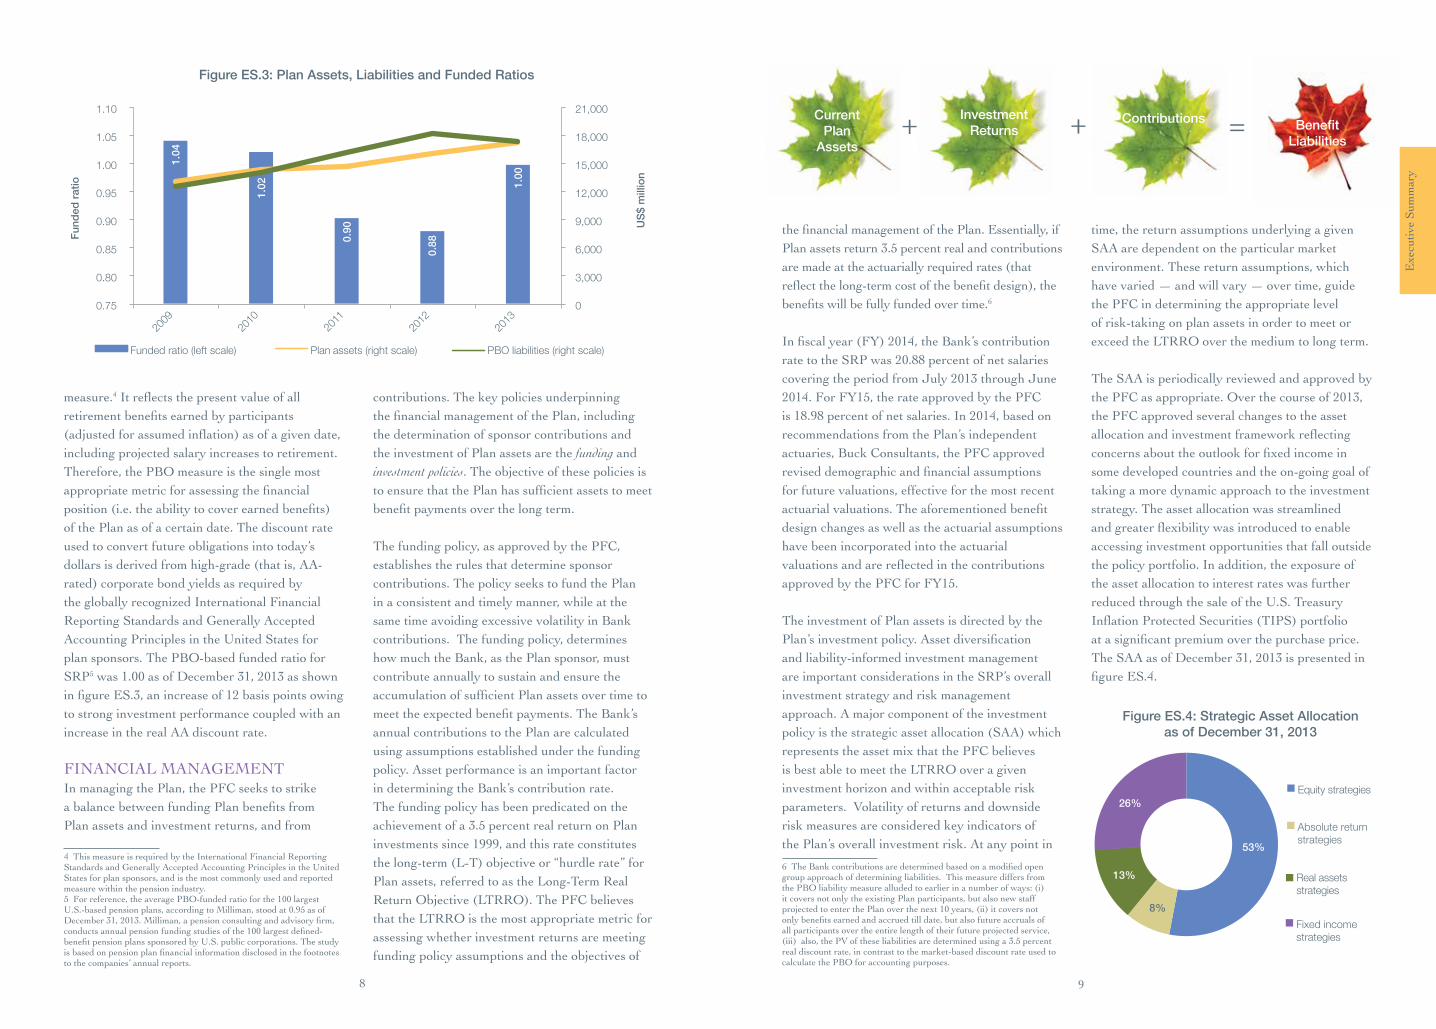
4.4
5.5 6.3 6.9
1.0 1.5 2.0 2.5 3.0 3.5 4.0 4.5 5.0 5.5 6.0 6.5 7.0
1992 1995 1998 2001 2004 2007 2010 2013
Long-term return objective (nominal)
Traditional portfolio return (60/40 stocks/bonds)
Net nominal return
Gross nominal return
US$
Cumulative Dollar Value Growth (1990-2013)
Equity strategies
Fixed income strategies
Real assets strategies
Absolute return strategies
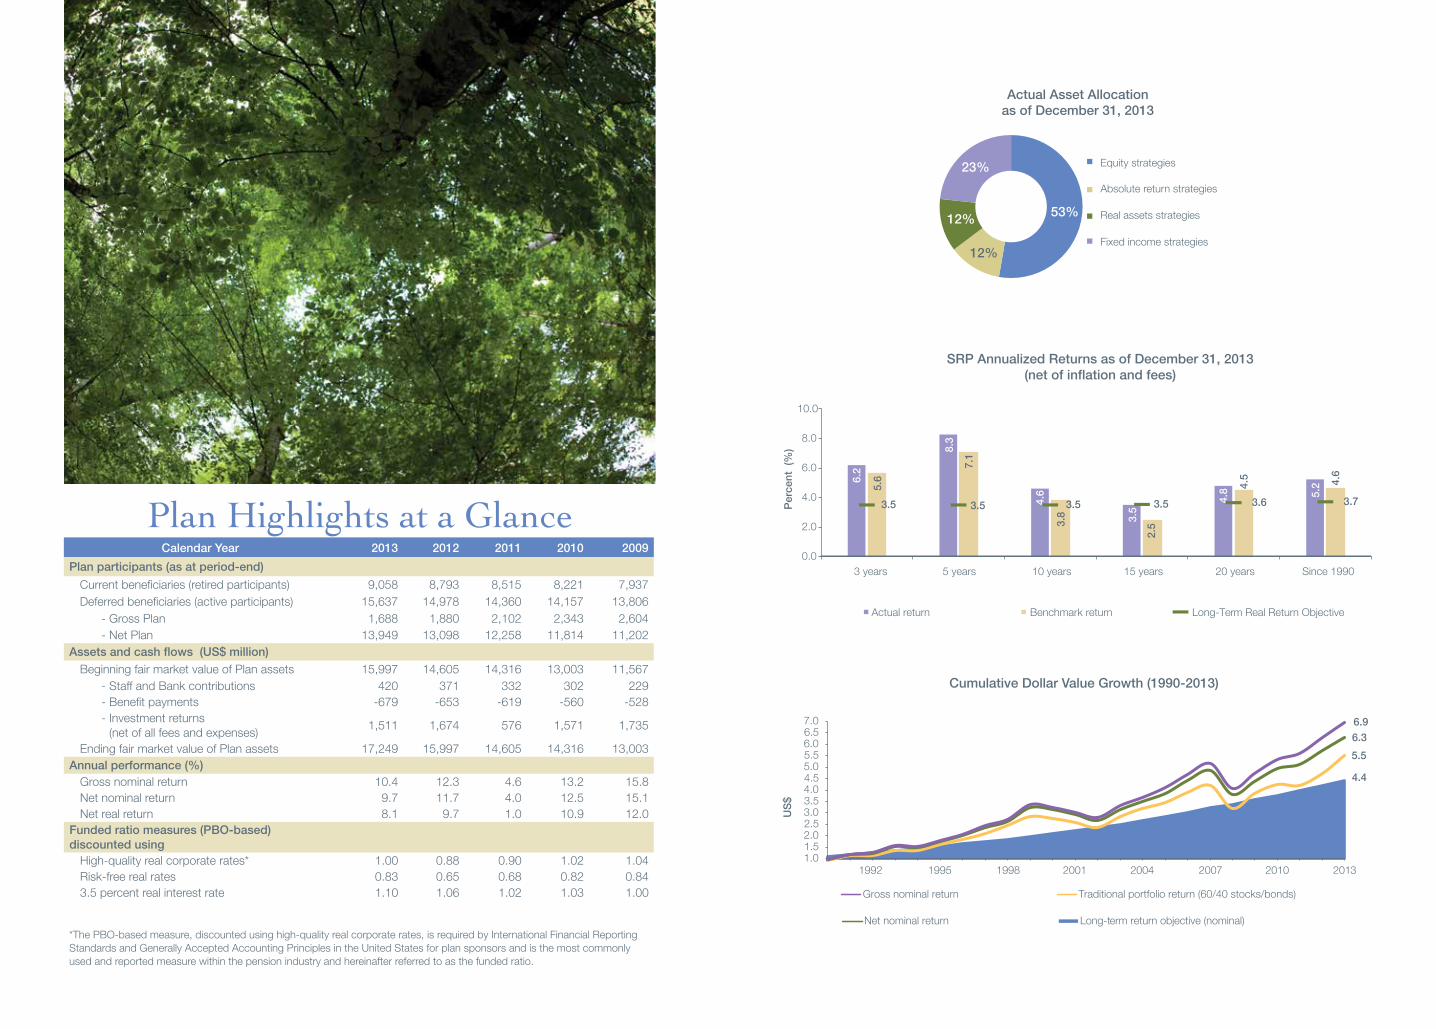
Actual Asset Allocation as of December 31, 2013
53%
23%
12%
12%
Plan Highlights at a GlanceCalendar Year 2013 2012 2011 2010 2009
Plan participants (as at period-end)
Current beneficiaries (retired participants) 9,058 8,793 8,515 8,221 7,937 Deferred beneficiaries (active participants) 15,637 14,978 14,360 14,157 13,806
- Gross Plan 1,688 1,880 2,102 2,343 2,604 - Net Plan 13,949 13,098 12,258 11,814 11,202 Assets and cash flows (US$ million)
Beginning fair market value of Plan assets 15,997 14,605 14,316 13,003 11,567 - Staff and Bank contributions 420 371 332 302 229 - Benefit payments -679 -653 -619 -560 -528
- Investment returns
(net of all fees and expenses)1,511 1,674 576 1,571 1,735
Ending fair market value of Plan assets 17,249 15,997 14,605 14,316 13,003 Annual performance (%)
Gross nominal return 10.4 12.3 4.6 13.2 15.8 Net nominal return 9.7 11.7 4.0 12.5 15.1 Net real return 8.1 9.7 1.0 10.9 12.0
Funded ratio measures (PBO-based) discounted using
High-quality real corporate rates* 1.00 0.88 0.90 1.02 1.04 Risk-free real rates 0.83 0.65 0.68 0.82 0.84 3.5 percent real interest rate 1.10 1.06 1.02 1.03 1.00
*The PBO-based measure, discounted using high-quality real corporate rates, is required by International Financial Reporting Standards and Generally Accepted Accounting Principles in the United States for plan sponsors and is the most commonly used and reported measure within the pension industry and hereinafter referred to as the funded ratio.
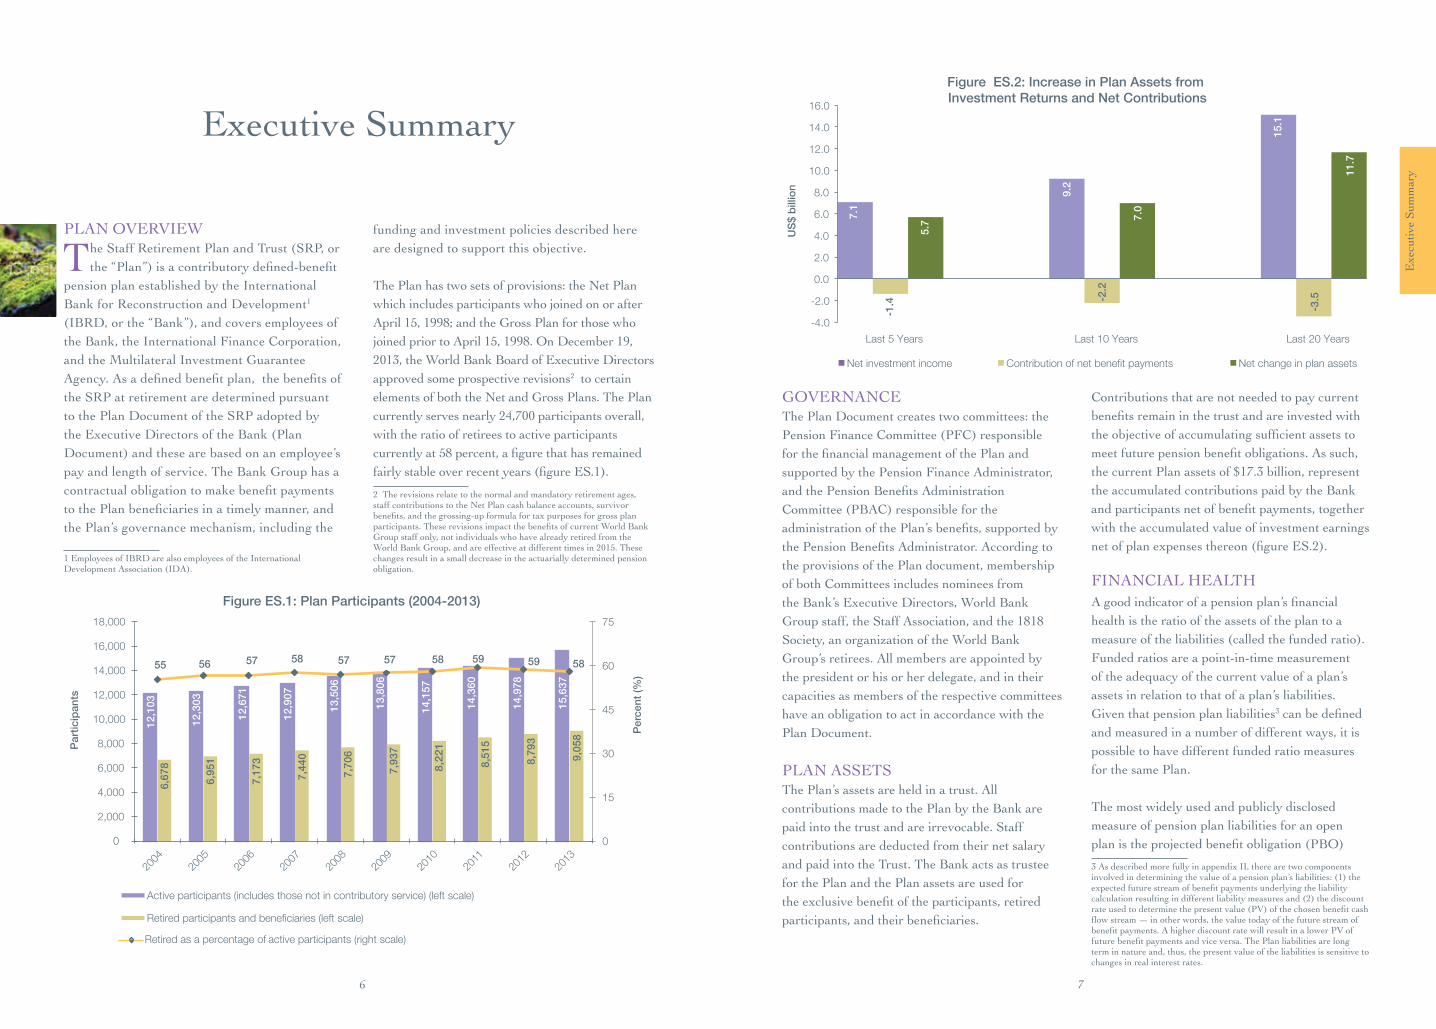
6.2
8.3
4.6
3.5
4.8 5.2 5.
6
7.1
3.8
2.5
4.5 4.6
3.5 3.5 3.5 3.5 3.6 3.7
0.0
2.0
4.0
6.0
8.0
10.0
3 years 5 years 10 years 15 years 20 years Since 1990
Perc
ent
(%)
Actual return Benchmark return Long-Term Real Return Objective
SRP Annualized Returns as of December 31, 2013(net of inflation and fees)

AcronymsALM asset liability managementABO accumulatedbenefitobligationASC AccountingStandardsCodificationASU Accounting Standards Updatesbps basis pointsBofA ML Bank of America Merrill Lynch BNY Mellon Bank of New York MellonCY calendar yearCPI consumer price indexEM emerging markets EURIBOR Euro Interbank Offered RateFoF fund of fundsFASB Financial Accounting Standards
BoardFY fiscalyearG7 Group of 7 industrialized countriesHAGS highest three years’ average
pensionable gross salary HANS highest three years’ average net salaryHFRI Hedge Fund Research Performance
IndexHR human resourcesIASB International Accounting Standards
BoardIBRD International Bank for
Reconstruction and DevelopmentIFC International Finance CorporationIFRS International Financial Reporting
StandardsIRS Internal Revenue ServiceISDA International Swaps and Derivatives
AssociationLEG Legal Vice PresidencyLIBOR London Interbank Offered RateL-T long-termLTRRO Long-Term Real Return ObjectiveM&A mergers and acquisitionsMIGA Multilateral Investment Guarantee
AgencyML Merrill LynchMRA mandatory retirement ageMSCI Morgan Stanley Capital International
NAV net asset valueNCREIF National Council of Real Estate
Investment Fiduciaries NRA net retirement agePBAC PensionBenefitsAdministration
CommitteePBO projectedbenefitobligationPEBP Post-EmploymentBenefitsPlanPEN Pension and Endowments
Department PENAD Pension Administration DivisionPFC Pension Finance CommitteePV present valuePVAB present value of accumulated plan
benefitsREITs Real Estate Investment TrustsSAA strategic asset allocationSRP Staff Retirement Plan and TrustSSRP Supplemental Staff Retirement PlanS&P Standard and Poor’sTBA to be announcedTIPS TreasuryInflationProtected
SecuritiesTRO Treasury Operations DepartmentTSA Tax Supplement AccountTUCS Trust Universe Comparison ServiceU.S. GAAP United States Generally Accepted
Accounting PrinciplesUST United States TreasuryVaR value at riskVSC voluntary savings componentWBG The World Bank Group

List of Boxes, Figures and Tables
BOXES Box1.1: WhoisResponsibleforBenefitPayments? 14Box 1.2: Facts about Plan Participants 16Box 3.1: A Snapshot of Plan Governance and Funding 23Box3.2: RelationshipbetweenInvestmentPerformance,FundedRatioandContributions 24Box 3.3: External Manager Selection Process 28Box4.1: NetPlanOptions 35BoxA2.1: DiscussiononLongevityAssumptions 44BoxA2.2: TheFeaturesofDifferentLiabilityMeasures 45BoxA2.3: UsageofDiscountRates 45BoxA2.4: AssessingtheFinancialPositionversusFundingaPlan 46
FIGURES FigureES.1:PlanParticipants(2004–2013) 6Figure ES.2: Increase in Plan Assets from Investment Returns and Net Contributions 7Figure ES.3: Plan Assets, Liabilities and Funded Ratios 8FigureES.4:StrategicAssetAllocationasofDecember31,2013 9Figure1.1: PlanParticipants(2004–2013) 15Figure2.1: PlanAssets,LiabilitiesandFundedRatios 19Figure2.2: RealAADiscountRates(singleequivalent) 19Figure2.3: AnnualContributions,NetInvestmentIncomeandBenefitPayments(2004–2013) 20Figure2.4: DollarImpactonPlanAssetsfromInvestmentReturnsandNetContributions 21Figure3.1: BankSRPContributionRatessinceFiscalYear1994 25Figure4.1: SRPAnnualizedReturnsasofDecember31,2013(netofinflationandfees) 34Figure4.2: FixedIncomeStrategiesbyGeography 36Figure4.3: NetInvestmentPerformance-FixedIncomeStrategies 36Figure4.4: PublicEquitiesPortfoliobyGeography 38Figure4.5: PrivateEquityPortfoliobyGeography 38Figure4.6: 1-year,5-year,10-yearNetInvestmentPerformance-EquityStrategies 39Figure4.7: PrivateRealEstatePortfoliobyGeography 39Figure4.8: NetInvestmentPerformance-RealAssetsStrategies 39Figure4.9: HedgeFundsPortfoliobyGeography 41Figure4.10:NetInvestmentPerformance-HedgeFundsPortfolio 41
TABLES Table ES.1: SRP Performance as of December 31, 2013 10Table 3.1: Asset Allocation as of December 31, 2012 27Table3.2: AssetAllocationeffectiveasofDecember31,2013 29Table4.1: SRPPerformanceasofDecember31,2013 34Table4.2: MarketEnvironmentasofDecember31,2013 35
TheSRPAnnualReportcontainsforward-lookingstatementsthatmaybeidentifiedbysuchtermsas“anticipates”,“believes”,“expects”,“intends”,orwordsofsimilarmeaning.Suchstatementsinvolveassumptionsandestimatesbasedoncurrentexpectations,which are subject to risks and uncertainties beyond control. Consequently, actual results could differ from those anticipated. This report may also contain information originating with third parties, information which is in public domain and other information providedtoorobtainedfromthirdparties(“ThirdPartyInformation”).StaffofIBRDdidnotindependentlyverifyaccuracyorcompleteness of Third Party Information and does not guarantee the same, to the extent Third Party Information has been used in, or relied upon, in preparation of this report.
Letter from the Pension Finance Administrator
Appendix I: CommitteeMembership 42Appendix II: APrimeronValuingPensionPlanLiabilities 43Appendix III: CharacteristicsofDifferentAssetClasses 47Appendix IV: Historical Performance of Cash Balance and Voluntary
Savings Component—Investment Options as of December31,201349Appendix V: GlossaryofTerms 50Appendix VI: ActuarialValuationResultsLetter 53Appendix VII: Independent Auditors’ Report 63Appendix VIII:FinancialStatements 65
Executive Summary
I. Overview of the Plan
II. Financial Health of the Plan
III. Financial Management of the Plan
IV. Plan Performance
Table of Contents
2
6
14
18
22
32

3
Let
ter
from
the
Pens
ion
Fina
nce
Adm
inis
trat
or
LETTER FROM THE
Pension Finance Administrator
2
On behalf of the Pension Finance Committee (PFC),Iampleasedtopresentthe64th
Annual Report of the World Bank Group Staff RetirementPlan(SRP,orthe“Plan”).
Calendar year 2013 was another strong year fortheSRP.Servingnearly24,700currentanddeferredbeneficiaries,theassetsofthePlanwere$17.3 billion at the end of the year, with investment returnscontributingmorethan$1.5billiontothe growth of the assets over the year. The SRP continues to be well funded and have a strong governance structure in which the assets of the Plan are held in trust, separate from the assets of the sponsor.
In 2013, the SRP assets again earned a return in excess of the Long-Term Real Return Objective (LTRRO)of3.5percentandthePBOfundedpositionoftheSRPincreased–endingtheyearat1.00–onthebackofstronginvestmentreturnsand a rise in U.S. interest rates. The year also saw somechangestotheWorldBank’spensionbenefitsthat apply only to current World Bank Group staff prospectively and not to retirees and others alreadyreceivingbenefits.Thesebenefitdesignchanges have been fully incorporated into the actuarial valuations of the Plan liabilities and are reflectedinthecontributionratesforfiscalyear(FY)2015.
RESULTSIn 2013 the world economy advanced further on its recovery path led primarily by developed economies although the journey continued to be a bumpy one. Towards the middle of 2013, with the outlook for economic growth improving in developed markets, the U.S. Federal Reserve signaled to the markets that it would begin to pare down its purchases of government and mortgage
backed securities. Concerns about stimulus withdrawal caused bond markets to sell-off, pushing up the yield on the U.S. Treasury 10-year note by more than 100 basis points and prompting investors to scale down emerging market positions. Consequently, the emerging market assets significantlyunderperformeddevelopedmarkets.
Inthisenvironment,financialmarketsdeliveredvaried results in 2013, in stark contrast to 2012. Highqualityfixedincomeassetsexperiencednegative returns and so did emerging market equities and most commodities. On the other hand, favored by the renewed growth momentum and improved expectations, developed market equities and private equity had a very strong performance with the MSCI World Index returning more than 27 percent and the private equity index returning about 20 percent. Developed markets real estate fundamentals also continued to improve over the course of 2013 resulting in a return of 11 percent for the NCREIF index. In2013,theSRP’sdiversifiedassetallocationreturned10.4percentgrossoffees(9.7percentnetoffees)andanetrealreturnoverinflationof 8.1 percent for the year. The SRP’s net real return was in excess of the LTRRO, currently at3.5percent.ActivemanagementofthePlancontributedtoanexcessreturnof48basispointsover the asset class weighted benchmark during the year, with most asset classes and strategies contributing to this excess return. In April of 2013,staffalsotookactionstosignificantlyreduce the interest rate risk of the SRP which contributed meaningfully to the total return of the Plan over the remainder of the year.
PensionbenefitsarefundedbyacombinationofPlan assets, investment income and contributions.
When real returns exceed the LTRRO, future contributionswillbelower(allelsebeingequal),andviceversa.Overthe5-year,10-yearandlonger time periods, the Plan’s net real returns of 8.3percent,4.6percentand5.2percent(since1990)respectivelyhavebeenwellinexcessoftheLTRRO. As a result, the investments have played a strongroleinthefundingofPlanbenefits,resultingin contribution rates being lower than they would have been had the assets returned the LTRRO.
The Plan’s PBO funded ratio increased to 1.00 at the end of December 2013 as a result of the combination of strong investment returns and theriseininterestrates.InMay2014,thePFCapprovedaBankcontributionrateof18.98percentofnetsalariesforFY15.Thisrateislowerthan what was expected last year primarily due to investment returns being higher than the LTRRO.
The external actuaries undertook a periodic experience study for the SRP designed to ensure that the demographic assumptions used in the actuarial valuation models provide the best estimate of future experience. They furtherreviewedtheLTRROandtheinflationassumption.TheLTRROwasreconfirmedandtheassumedinflationratewasrecalibratedto2.5percenttoreflectmoreaccuratelylongerterminflationexpectations.Inaddition,thePFC
approvedcertainmodificationstotheactuarialassumptionsandthesetooarereflectedinthecontributionrateforFY15.
STRATEGY AND OUTLOOKGoing into 2013, we expected continued strengthening of the growth trajectory, particularly in developed countries. We were concerned about the level of interest rates and, consequently, took actions during the year to reduce the interest rate sensitivity of the Plan and increase the overall exposure to growth assets while maintaining a cautious stance on emerging markets. We also continued to experience strong distributions from private equity and, to some extent, private real estate investments which we strove to reinvest in order to maintain the allocations close to the policy.Thistrendisexpectedtopersistin2014andrepresentsanareaofsignificantfocusfortheinvestment team.
Looking forward, current market expectations point towards further gradual improvement in economic conditions with developed countries stillexpectedtoleadtheway,althoughsignificantchallenges remain. Improved growth expectations in the United States reinforce the concerns for the outlook for interest rates with negative implicationsforfixedincomereturns.Atthesame time, equity and credit markets have had

54
Let
ter
from
the
Pens
ion
Fina
nce
Adm
inis
trat
or
an extraordinary run since 2008 fueled by the excessliquidityinthefinancialsystem,leavinglessroom for outsized returns going forward. Against thisbackgroundwemaintainourdiversifiedapproach seeking to strike the appropriate balance of generating strong investment returns without taking excessive risks. One of the ways we seek to achieve this is by identifying and exploiting selective investment opportunities where we can effectively use our long investment horizon and access to top external managers as a competitive advantage. For example, we have been analyzing the ongoing changes in different parts of the financialmarketssincethefinancialcrisisin2008that have altered the structure and participants primarily through the re-regulation of the banking system. We have been focusing on this as a theme and investing opportunistically to take advantage of this, whenever possible.
In December 2013, the PFC reviewed the asset allocation of the Plan and decided to make some changes to the investment framework that are designed to further streamline the asset allocation, increaseimplementationflexibilityandfocusthe asset allocation on achieving the LTRRO going forward. Supported by engagements with other major institutional investors, the PFC has been focused on the key investment objective as encapsulated by the LTRRO. Furthermore, the assetallocationofthePlanwasmodifiedslightlyto reduce the granularity of the allocation in some areas. In addition, the changes increase the flexibilityfortheimplementationofinvestmentopportunities that are outside of the streamlined policy allocation.
OUTREACH AND COMMUNICATIONRecently, we launched the Pension website. The website is an important part of the continuation of our work to enhance communication with Plan beneficiariesandstakeholders.Aspreviouslyannounced, the functionality of the website isbeingrolledoutinphases.Thefirstreleaseprovides key information about the pension plan, including plan governance and funding, pension benefits,investmentmanagementandperformance
reporting. With the recent launch by the Bank of thenewhumanresources(HR)system,ourfocusis now on the development of the second phase of the website that will provide retirees and current staff with a self-service interface to the new HR system in a secure environment. Information provided on the website is for information purposes only.
In addition to the website, we continue to engage extensively with active participants through seminars, video conferences, and one-on-one counseling services. The pension kiosk on the groundfloorofthemaincomplex,openedin2011,has assisted over 2,000 participants so far.
PENSION FINANCE COMMITTEEThis year, I would like to welcome Frank Heemskerk and Javed Hamid to the PFC. Mr. Heemskerk is a World Bank executive director. Mr. Hamid, is the retiree alternate to Jeff Katz who serves as a nominee of the 1818 Society. We are looking forward to working with Mr. Heemskerk and Mr. Hamid. Also, at this time, I would like to thank Piero Cipollone for his service and contributions to the Committee.
COMMITMENT TO RESULTSThe pension team is committed to working with thePFCandthePensionBenefitsAdministrationCommittee to ensure that the investment, financialandadministrationfunctionsareperformed with integrity and with the ultimate goal of serving well the World Bank Staff RetirementPlanandallofthePlanbeneficiaries.The team will continue to work to employ strategies and practices that we believe are in the best interest of the Plan and that best enable us to accomplish the mission entrusted to us.
John F. GandolfoPension Finance Administrator and Chief Investment Officer
7
Exe
cutiv
e Su
mm
ary
6
Executive Summary
12,1
03
12,3
03
12,6
71
12,9
07
13,5
06
13,8
06
14,1
57
14,3
60
14,9
78
15,6
37
6,67
8
6,95
1
7,17
3
7,44
0
7,70
6
7,93
7
8,22
1
8,51
5
8,79
3
9,05
8
55 56 57 58 57 57 58 59 59 58
0
15
30
45
60
75
0
2,000
4,000
6,000
8,000
10,000
12,000
14,000
16,000
18,000
2004
2005
2006
20
07
2008
20
09
2010
2011
20
12
2013
Active participants (includes those not in contributory service) (left scale)
Retired participants and beneficiaries (left scale)
Retired as a percentage of active participants (right scale)
Parti
cipa
nts
Perc
ent (
%)
Figure ES.1: Plan Participants (2004-2013)
PLAN OVERVIEW
The Staff Retirement Plan and Trust (SRP, or the“Plan”)isacontributorydefined-benefit
pension plan established by the International Bank for Reconstruction and Development1 (IBRD,orthe“Bank”),andcoversemployeesofthe Bank, the International Finance Corporation, and the Multilateral Investment Guarantee Agency.Asadefinedbenefitplan,thebenefitsofthe SRP at retirement are determined pursuant to the Plan Document of the SRP adopted by the Executive Directors of the Bank (Plan Document)andthesearebasedonanemployee’spay and length of service. The Bank Group has a contractualobligationtomakebenefitpaymentstothePlanbeneficiariesinatimelymanner,andthe Plan’s governance mechanism, including the
1 Employees of IBRD are also employees of the International DevelopmentAssociation(IDA).
funding and investment policies described here are designed to support this objective.
The Plan has two sets of provisions: the Net Plan which includes participants who joined on or after April15,1998;andtheGrossPlanforthosewhojoinedpriortoApril15,1998.OnDecember19,2013, the World Bank Board of Executive Directors approved some prospective revisions2 to certain elements of both the Net and Gross Plans. The Plan currentlyservesnearly24,700participantsoverall,with the ratio of retirees to active participants currentlyat58percent,afigurethathasremainedfairlystableoverrecentyears(figureES.1).
2 The revisions relate to the normal and mandatory retirement ages, staff contributions to the Net Plan cash balance accounts, survivor benefits,andthegrossing-upformulafortaxpurposesforgrossplanparticipants.TheserevisionsimpactthebenefitsofcurrentWorldBankGroup staff only, not individuals who have already retired from the WorldBankGroup,andareeffectiveatdifferenttimesin2015.Thesechanges result in a small decrease in the actuarially determined pension obligation.
GOVERNANCEThe Plan Document creates two committees: the PensionFinanceCommittee(PFC)responsibleforthefinancialmanagementofthePlanandsupported by the Pension Finance Administrator, andthePensionBenefitsAdministrationCommittee(PBAC)responsiblefortheadministrationofthePlan’sbenefits,supportedbythePensionBenefitsAdministrator.Accordingtothe provisions of the Plan document, membership of both Committees includes nominees from the Bank’s Executive Directors, World Bank Group staff, the Staff Association, and the 1818 Society, an organization of the World Bank Group’s retirees. All members are appointed by the president or his or her delegate, and in their capacities as members of the respective committees have an obligation to act in accordance with the Plan Document.
PLAN ASSETSThe Plan’s assets are held in a trust. All contributions made to the Plan by the Bank are paid into the trust and are irrevocable. Staff contributions are deducted from their net salary and paid into the Trust. The Bank acts as trustee for the Plan and the Plan assets are used for theexclusivebenefitoftheparticipants,retiredparticipants,andtheirbeneficiaries.
Contributions that are not needed to pay current benefitsremaininthetrustandareinvestedwiththeobjectiveofaccumulatingsufficientassetstomeetfuturepensionbenefitobligations.Assuch,the current Plan assets of $17.3 billion, represent the accumulated contributions paid by the Bank andparticipantsnetofbenefitpayments,togetherwith the accumulated value of investment earnings netofplanexpensesthereon(figureES.2).
FINANCIAL HEALTHAgoodindicatorofapensionplan’sfinancialhealth is the ratio of the assets of the plan to a measureoftheliabilities(calledthefundedratio).Funded ratios are a point-in-time measurement of the adequacy of the current value of a plan’s assets in relation to that of a plan’s liabilities. Given that pension plan liabilities3canbedefinedand measured in a number of different ways, it is possible to have different funded ratio measures for the same Plan.
The most widely used and publicly disclosed measure of pension plan liabilities for an open planistheprojectedbenefitobligation(PBO)
3 As described more fully in appendix II, there are two components involvedindeterminingthevalueofapensionplan’sliabilities:(1)theexpectedfuturestreamofbenefitpaymentsunderlyingtheliabilitycalculationresultingindifferentliabilitymeasuresand(2)thediscountrateusedtodeterminethepresentvalue(PV)ofthechosenbenefitcashflowstream—inotherwords,thevaluetodayofthefuturestreamofbenefitpayments.AhigherdiscountratewillresultinalowerPVoffuturebenefitpaymentsandviceversa.ThePlanliabilitiesarelongterm in nature and, thus, the present value of the liabilities is sensitive to changes in real interest rates.
7.1
9.2
15.1
-1.4 -2
.2
-3.5
5.7 7.
0
11.7
-4.0
-2.0
0.0
2.0
4.0
6.0
8.0
10.0
12.0
14.0
16.0
Last 5 Years Last 10 Years Last 20 Years
US$
bill
ion
Net investment income Contribution of net benefit payments Net change in plan assets
Figure ES.2: Increase in Plan Assets from Investment Returns and Net Contributions
9
Exe
cutiv
e Su
mm
ary
8
1.04
1.02
0.90
0.88
1.00
0
3,000
6,000
9,000
12,000
15,000
18,000
21,000
0.75
0.80
0.85
0.90
0.95
1.00
1.05
1.10
2009
2010
2011
2012
2013
US$
mill
ion
Fund
ed ra
tio
Funded ratio (left scale) Plan assets (right scale) PBO liabilities (right scale)
Figure ES.3: Plan Assets, Liabilities and Funded Ratios
measure.4Itreflectsthepresentvalueofallretirementbenefitsearnedbyparticipants(adjustedforassumedinflation)asofagivendate,including projected salary increases to retirement. Therefore, the PBO measure is the single most appropriatemetricforassessingthefinancialposition(i.e.theabilitytocoverearnedbenefits)of the Plan as of a certain date. The discount rate used to convert future obligations into today’s dollars is derived from high-grade (that is, AA-rated)corporatebondyieldsasrequiredbythe globally recognized International Financial Reporting Standards and Generally Accepted Accounting Principles in the United States for plan sponsors. The PBO-based funded ratio for SRP5 was 1.00 as of December 31, 2013 as shown infigureES.3,anincreaseof12basispointsowingto strong investment performance coupled with an increase in the real AA discount rate.
FINANCIAL MANAGEMENTIn managing the Plan, the PFC seeks to strike abalancebetweenfundingPlanbenefitsfromPlan assets and investment returns, and from
4ThismeasureisrequiredbytheInternationalFinancialReportingStandards and Generally Accepted Accounting Principles in the United States for plan sponsors, and is the most commonly used and reported measure within the pension industry.5Forreference,theaveragePBO-fundedratioforthe100largestU.S.-basedpensionplans,accordingtoMilliman,stoodat0.95asofDecember31,2013.Milliman,apensionconsultingandadvisoryfirm,conductsannualpensionfundingstudiesofthe100largestdefined-benefitpensionplanssponsoredbyU.S.publiccorporations.Thestudyisbasedonpensionplanfinancialinformationdisclosedinthefootnotesto the companies’ annual reports.
contributions. The key policies underpinning thefinancialmanagementofthePlan,includingthe determination of sponsor contributions and the investment of Plan assets are the funding and investment policies. The objective of these policies is toensurethatthePlanhassufficientassetstomeetbenefitpaymentsoverthelongterm.
The funding policy, as approved by the PFC, establishes the rules that determine sponsor contributions. The policy seeks to fund the Plan in a consistent and timely manner, while at the same time avoiding excessive volatility in Bank contributions. The funding policy, determines how much the Bank, as the Plan sponsor, must contribute annually to sustain and ensure the accumulationofsufficientPlanassetsovertimetomeettheexpectedbenefitpayments.TheBank’sannual contributions to the Plan are calculated using assumptions established under the funding policy. Asset performance is an important factor in determining the Bank’s contribution rate. The funding policy has been predicated on the achievementofa3.5percentrealreturnonPlaninvestmentssince1999,andthisrateconstitutesthelong-term(L-T)objectiveor“hurdlerate”forPlan assets, referred to as the Long-Term Real ReturnObjective(LTRRO).ThePFCbelievesthat the LTRRO is the most appropriate metric for assessing whether investment returns are meeting funding policy assumptions and the objectives of
thefinancialmanagementofthePlan.Essentially,ifPlanassetsreturn3.5percentrealandcontributionsare made at the actuarially required rates (that reflectthelong-termcostofthebenefitdesign),thebenefitswillbefullyfundedovertime.6
Infiscalyear(FY)2014,theBank’scontributionrate to the SRP was 20.88 percent of net salaries covering the period from July 2013 through June 2014.ForFY15,therateapprovedbythePFCis18.98percentofnetsalaries.In2014,basedonrecommendations from the Plan’s independent actuaries, Buck Consultants, the PFC approved reviseddemographicandfinancialassumptionsfor future valuations, effective for the most recent actuarialvaluations.Theaforementionedbenefitdesign changes as well as the actuarial assumptions have been incorporated into the actuarial valuationsandarereflectedinthecontributionsapprovedbythePFCforFY15.
The investment of Plan assets is directed by the Plan’sinvestmentpolicy.Assetdiversificationand liability-informed investment management are important considerations in the SRP’s overall investment strategy and risk management approach. A major component of the investment policyisthestrategicassetallocation(SAA)whichrepresents the asset mix that the PFC believes is best able to meet the LTRRO over a given investment horizon and within acceptable risk parameters. Volatility of returns and downside risk measures are considered key indicators of the Plan’s overall investment risk. At any point in
6TheBankcontributionsaredeterminedbasedonamodifiedopengroup approach of determining liabilities. This measure differs from thePBOliabilitymeasurealludedtoearlierinanumberofways:(i)it covers not only the existing Plan participants, but also new staff projectedtoenterthePlanoverthenext10years,(ii)itcoversnotonlybenefitsearnedandaccruedtilldate,butalsofutureaccrualsofall participants over the entire length of their future projected service, (iii)also,thePVoftheseliabilitiesaredeterminedusinga3.5percentreal discount rate, in contrast to the market-based discount rate used to calculate the PBO for accounting purposes.
time, the return assumptions underlying a given SAA are dependent on the particular market environment. These return assumptions, which have varied — and will vary — over time, guide the PFC in determining the appropriate level of risk-taking on plan assets in order to meet or exceed the LTRRO over the medium to long term.
The SAA is periodically reviewed and approved by the PFC as appropriate. Over the course of 2013, the PFC approved several changes to the asset allocationandinvestmentframeworkreflectingconcernsabouttheoutlookforfixedincomeinsome developed countries and the on-going goal of taking a more dynamic approach to the investment strategy. The asset allocation was streamlined andgreaterflexibilitywasintroducedtoenableaccessing investment opportunities that fall outside the policy portfolio. In addition, the exposure of the asset allocation to interest rates was further reduced through the sale of the U.S. Treasury InflationProtectedSecurities(TIPS)portfolioatasignificantpremiumoverthepurchaseprice.The SAA as of December 31, 2013 is presented in figureES.4.
=+ BenefitLiabilities
CurrentPlan
Assets
InvestmentReturns
Contributions+
Equity strategies
Absolute return strategies
Real assets strategies
Fixed income strategies
53%
26%
8%
13%
Figure ES.4: Strategic Asset Allocation as of December 31, 2013

11
Exe
cutiv
e Su
mm
ary
10
Table ES.1: SRP Performance as of December 31, 2013
Statistics Annualized
CY13 5-year 10-year 20-yearSince 1990
SRP performance (%)Gross nominal return 10.4 11.2 7.7 7.8 8.4
Net nominal return 9.7 10.5 7.1 7.3 8.0
Excess net return over asset class weighted benchmark
0.5 1.2 0.8 0.3 0.6
Net real return 8.1 8.3 4.6 4.8 5.2
Long-Term Real Return Objective (LTRRO)
3.5 3.5 3.5 3.6 3.7
Excess net real return over LTRRO 4.6 4.8 1.1 1.2 1.5
Consumer price index (%) 1.5 2.1 2.4 2.4 2.6
PLAN PERFORMANCEThe SAA and risk tolerance of the Plan are the primary drivers of the total return of the Plan and itsabilitytomeettheLTRRO.Since19907, the Plan’sassetshaveincreasedbymorethan$13.9billion,netoffees,expenses,andbenefitpayments.Over the same period, cumulative investment income generated $17.1 billion, net of fees and expenses including $1.8 billion of value add from active management.
In2013,theSRPreturned9.7percentnetoffees,outperforming the asset class weighted benchmark by48 basis points. The net real return in 2013, 8.1 percent, was substantially in excess of the LTRRO. As shown in table ES.1, over medium and long time periods, the Plan has earned net real returns in excess of the LTRRO. This means that Plan asset returns have exceeded what wasexpectedofthemintheoverallfinancialmanagement of the Plan. Although the Plan is managed with a long-term horizon, it should be expected that results over shorter time periods may be impacted positively or negatively by short term market movements.
Expenses necessary to properly perform the trustee functions and duties are borne by the Plan. These expenses include investment management fees for external managers, in-house administrative
7Theperiodsince1990isusedasananchorforPlanperformancesinceitreflectsasufficientlonghistoryofPlan’sdiversifiedassetallocationthrough different market cycles.
expenses (including staff and other administrative costs),andcontractualservicesprovidedbythirdparties, such as consulting, custody, audit and actuarial services. These expenses are discussed annually with and approved by the PFC, during the annual budget review process. In 2013, the total administrative costs for investment management, including in-house administrative expenses and expenses associated with third party contractual services, amounted to 6.7 basis points (bps)onthetotalassetsundermanagement.Investment management fees for external managers amounted to 76 bps for 2013. Plan management strives to keep Plan costs reasonable relative to the business model and benchmarks costs against the industry periodically.

1312
Section IOverview of the PlancontainsabriefoverviewofthePlandesign,benefitstructure,participants’profiles,andgovernance.
Section IIFinancial Health of the PlandiscussesthePlan’sfinancialhealth.
Section IIIFinancial Management of the PlanfocusesonthefinancialmanagementofthePlan,providinggreaterdetailson the key policies, including funding, asset liability management and risk tolerance, investment management, as well as risk management.
Section IVPlan Performancecovers the 2013 market environment along with the long-term and short-term performance of the various strategies and asset classes in detail.
The following sections of the report provide a more detailed review of the SRP for the yearendedDecember31,2013,includinginformationonPlanbeneficiaries,thekeypoliciesunderpinningthefinancialmanagement,financialresults,andthefinancialhealthof the Plan. The report is organized as follows:

Ove
rvie
w o
f the
Pla
n
1514
SECTION I
Overview of the Plan
12,1
03
12,3
03
12,6
71
12,9
07
13,5
06
13,8
06
14,1
57
14,3
60
14,9
78
15,6
37
6,67
8
6,95
1
7,17
3
7,44
0
7,70
6
7,93
7
8,22
1
8,51
5
8,79
3
9,05
8
55 56 57 58 57 57 58 59 59 58
0
15
30
45
60
75
0
2,000
4,000
6,000
8,000
10,000
12,000
14,000
16,000
18,000
2004
2005
2006
20
07
2008
20
09
2010
2011
20
12
2013
Active participants (includes those not in contributory service) (left scale)
Retired participants and beneficiaries (left scale)
Retired as a percentage of active participants (right scale)
Parti
cipa
nts
Perc
ent (
%)
Figure 1.1: Plan Participants (2004-2013)
Box 1.1:
Who is Responsible for Benefit Payments?The World Bank Group—specifically, the Bank, International Finance Corporation (IFC), and the Multilateral Investment Guarantee Agency (MIGA)—in its capacity as an employer has a contractual obligation to make the benefit payments defined in the Plan Document to participants when they retire or otherwise become entitled to them. The Plan’s assets are held in a trust established by the Bank and formalized in the Plan Document approved by the Executive Directors of the Bank, for the exclusive benefit of Plan participants and retirees or their beneficiaries. The Bank acts as a trustee for the Plan. The Bank also contributes to the cost of funding the liabilities of the Plan and all such Bank contributions are paid into the trust and are irrevocable. The Plan assets, held in trust, represent the accumulated contributions paid by the Bank and participants (of both the Gross and Net Plans), net of benefit payments and Plan management expenses, together with the accumulated value of investment earnings thereon.
(appendixVIII). Additionally, the Treasury Pension website (pension.worldbank.org) contains useful information about the SRP, including the Plan’s annual reports, as well as Gross Plan and Net Plan information, including investment option fact sheets with regard to the latter.
Participantscontributeatafixedratedependingon the plan in which they are participating. For theNetPlan,therateisfivepercentofnetsalariesuntil new changes described in the next paragraph take effect. For the Gross Plan, the rate is seven percent of pensionable gross salaries. The Bank is obligated to fund the cost of Plan liabilities not contributed by participants.10
OnDecember19,2013,theWorldBankBoardofExecutive Directors approved some prospective revisions to certain elements of both the Net Plan and the Gross Plan. The main revisions relate to the normal and mandatory retirement ages, staff contributions to the Net Plan cash balanceaccounts,survivorbenefits,andthegrossing-up formula for tax purposes for gross 10 Employer contributions are made by the Bank and reimbursed to the Bank by other World Bank Group entities for their proportionate share of the contributions made.
plan participants.11 These revisions impact the benefitsofcurrentWorldBankGroupstaffonly,not individuals who have already retired from the World Bank Group, and become effective at differentpointsintimein2015.Thesechangesresult in a small decrease in the actuarially determined pension obligation.
AsofDecember31,2013,therewere15,637activeparticipantsinthePlan—13,949intheNetPlanand1,688intheGrossPlan—and9,058retireesandotherbeneficiaries(seefigure1.1).Withthe numbers of active participants and retirees growing at approximately the same rate, the ratio ofretireestoactiveparticipants,currentlyat58percent, has remained fairly stable over recent years.
MANAGEMENT OF THE PLANThePensionFinanceCommittee(PFC)andPensionBenefitsAdministrationCommittee(PBAC)areresponsibleforthefinancialmanagementandadministrationofthebenefitsunder the Plan and are, respectively, supported bythePensionFinanceAdministrator(“Finance
11 As part of the revision, the voluntary savings component will be discontinued for headquarter staff in the Net Plan and the balance will be transferred to the cash balance component.
The Staff Retirement Plan and Trust (SRP, or the“Plan”)isafundedcontributorypension
planestablishedtoprovideretirementbenefitstoemployees of the World Bank Group (WBG, or the “BankGroup”),whichincludestheInternationalBank for Reconstruction and Development8 (IBRD,orthe“Bank”),theInternationalFinanceCorporation(IFC),andtheMultilateralInvestmentGuaranteeAgency(MIGA).
PLAN DESIGN, BENEFITS AND PARTICIPATIONTwo plans make up the overall SRP and Trust: the Net Plan and the Gross Plan.9
§ ParticipantswhojoinedonorafterApril15,1998arecoveredbytheNetPlan,whichhasthreebenefitcomponents:(1)a defined-benefit, inflation-indexed annuity based on the participant’s number of years of service and
8 Employees of IBRD are also employees of the International DevelopmentAssociation(IDA).9AnnuitybenefitsintheGrossPlanandtheNetPlanaresubjecttocertain minimum service requirements and are substituted with lump sum payouts in cases where the minimum service requirements are not met.
highestthreeyears’averagenetsalary;(2)a cash balance benefitreflectingtheaccumulatedvalueofspecifiedWorldBankGroupcredits,participant contributions, and investment earnings based on investment options chosen bytheparticipants;and(3)a voluntary savings benefitreflectingtheaccumulatedvalue of optional contributions made by the participants and investment earnings based on investment options chosen by the participants.
§ ParticipantswhojoinedpriortoApril15,1998arecoveredbytheGrossPlan,adefined-benefitplanprovidinganinflation-indexed annuity upon retirement based on the participant’s number of years of service and highest three years’ average pensionable gross salary.
Retirees may elect to receive pensions in currencies other than the U.S. dollar, subject to applicable conditions stated in the Plan. A brief descriptionofthePlanbenefitscanbefoundin note A to the Plan’s Financial Statements

17
Ove
rvie
w o
f the
Pla
n
16
Box 1.2:
Facts about Plan Participants § The Plan serves 24,695 participants
overall. § 89 percent of active participants are in
the Net Plan. § The average active participant is 44
years old and has nine years of service. § 61 percent of active participants have
been with the WBG for less than 10 years and 76 percent for less than 15 years.
§ As of December 31, 2013, there are four beneficiaries over the age of 100 receiving pensions.
§ 70 percent of the retirees are domiciled in the United States, 15 percent in Europe, and 15 percent in the rest of the world.
6%
30%
35%
29% Age under 30 Age 30-39 Age 40-49 Age 50 and over
Active Participants by Age
11%
45% 31%
11%
2%
Age under 60 Age 60-69 Age 70-79 Age 80-89 Age 90 and over
Retirees by Age
Administrator”)andthePensionBenefitsAdministrator(BenefitsAdministrator).
ThePFCisresponsiblefortheoverallfinancialmanagement of the Plan and determines and directs the investment of the Plan assets. The PBAC is responsible for the administration of Plan benefits.
The PFC’s responsibilities include the following: (1)approvinginvestmentpoliciesandrulesforthePlan’smanagement;(2)approvingfundingmethods and assumptions for the actuarial valuationofthePlan’sassetsandliabilities;(3)ensuringthatactuarialvaluationsofthePlan’s assets and liabilities are undertaken, and determining the Bank Group’s annual contributions on the basis of such valuations in accordancewiththePlanDocument;and(4)approving the Plan’s annual budget and the annualfinancialstatementsforthePlan.ThePFCalso reviews the Plan’s investment performance. The Plan Document requires that the PFC be composed of a vice president, Senior Vice President or Managing Director of the Bank (as Chairman),twoExecutiveDirectors,andthreetoeight other members, two of which are nominated by the Staff Association and one (plus an alternate)bythe1818Society(anorganizationofBankGroupretirees)aslistedinappendixI.ThePBAC membership also requires two Executive Directors, a Vice President or Managing Director (Chairman),butonlythreetosixothermembers,three of which are nominated in the same manner as the PFC’s other members. All members are appointed by the president or his or her delegate, according to the Plan Document.
In discharging their responsibilities, the PFC members shall act in accordance with the Plan Documentwhichrequires(1)thatPlanassetsbe“held,administeredandmaintainedbytheTrustee,in Trust, separately from the Trustee’s other property andassetssolelytoprovidethebenefitsandpaytheexpensesofthePlan”,and(2)that“nopartofthe principal or income of the Plan shall be used or diverted to purposes other than for the exclusive benefitoftheparticipantsandretiredparticipantsor
theirbeneficiariesorestatesunderthePlans,untilallliabilitiesthereofhavebeensatisfied”.
The director of the Pension and Endowments Department(PEN)actsastheFinanceAdministrator. Subject to the general directions of the PFC, the Finance Administrator prepares documents, makes recommendations to the PFC, and performs all such other functions as assigned by the PFC or as directed by the Plan Documents. Plan functions are performed within various departments intheBank’sTreasury(TRE)andLegal(LEG)VicePresidency.
§ PEN is responsible for all investment-related functions, including asset allocation, portfolio construction, investment strategy research, implementation of investment decisions (i.e. risk allocation, passive versus active portfolio management, tactical positioning, manager hiring, termination, and monitoring as well asduediligenceprocesses),andportfoliorebalancing.
§ An in-house actuary within PEN is responsible for overseeing the annual valuation of the Plan’s liabilities and the annual contribution recommendations by external actuarial consultants as well as for undertaking periodic projects, such as Plan experiencestudies.ThePlanusesthefirmBuck Consultants as the external actuarial consultant to assist the in-house actuary.
§ The Quantitative Strategies, Risk, and Analytics Department is responsible for measuring and monitoring Plan risks and developing risk management tools for the Plan.
§ TheTreasuryOperationsDepartment(TRO)is responsible for accounting, asset valuation, performance measurement and attribution, and management reporting as well as cash management for the Plan. In addition, TRO manages and oversees all activities performed by the Plan’s custodian, monitors and approves investment management expenses for certain asset classes, tracks asset class exposures
and measures and monitors liquidity and counterparty risks. It is also responsible for the production of the Plan’s annual reports and year-endfinancialstatementsincompliancewith all applicable accounting standards and policies.
§ The Pension Administration Division (PENAD)ofPENadministerstheprovisionsofthePlantonearly24,700participants,includingretireesandbeneficiaries,subjectto the oversight of the PBAC. PENAD administerspensionbenefitsforretireesandbeneficiaries,includingmaintenancecashbalance and voluntary savings accounts, administration of disability, restorations, transfers, superannuation, and spousal support. It also undertakes education for Plan participants through individual counseling, pre-retirement planning seminars, and other avenues.
§ LEG supports pension investment management through the review and negotiation of legal documentation for the Plan’s investment activities, including investment management agreements and fund investment documents, and provides support on custody and certain tax-related matters. In addition, LEG provides legal support on benefitsandadministrationissues.
§ The Plan’s assets are managed for the most part by external asset managers and, except for fund investments, are held in custody, primarily with the Bank of New York Mellon.
Plan expenses necessary to properly perform the above-mentioned functions and duties are borne by the Plan. These expenses are discussed annually with and approved by the PFC and include investment management fees for external managers, in-house administrative expenses (including staff costs, related travel and training, and certain information technologyandcommunicationscharges)aswellascontractual services provided by third parties (such asactuarial,custody,andriskmanagementservices).

19
Fina
ncia
l Hea
lth
of th
e Pl
an
18
SECTION II
Financial Health of the Plan
1.04
1.02
0.90
0.88
1.00
0
3,000
6,000
9,000
12,000
15,000
18,000
21,000
0.75
0.80
0.85
0.90
0.95
1.00
1.05
1.10
2009
2010
2011
2012
2013
US$
mill
ion
Fund
ed ra
tio
Funded ratio (left scale) Plan assets (right scale) PBO liabilities (right scale)
Figure 2.1: Plan Assets, Liabilities and Funded Ratios
0.0
1.0
2.0
3.0
4.0
5.0
6.0
7.0
1995 1996 1997 1998 1999 2000 2001 2002 2003 2004 2005 2006 2007 2008 2009 2010 2011 2012 2013
Per
cent
(%)
Weighted average real AA discount rate Average discount rate
Figure 2.2: Real AA Discount Rates(single equivalent)
Thefinancialhealthofadefined-benefitpension plan such as the SRP can be assessed
using funded ratios that measure the adequacy of the current value of a plan’s assets in relation to that of a plan’s liabilities.12 A funded ratio in excess of 1.00 indicates that plan assets are in excess of plan liabilities, and a funded ratio of less than 1.00 indicates that plan assets are less than plan liabilities.Pensionplanliabilitiescanbedefined
12 As described more fully in appendix II, there are two components involvedindeterminingthevalueofapensionplan’sliabilities:(1)theexpectedfuturestreamofbenefitpaymentsunderlyingtheliabilitycalculationresultingindifferentliabilitymeasuresand(2)thediscountrateusedtodeterminethepresentvalue(PV)ofthechosenbenefitcashflowstream—inotherwords,thevaluetodayofthefuturestreamofbenefitpayments.AhigherdiscountratewillresultinalowerPVoffuturebenefitpaymentsandviceversa.ThePlanliabilitiesarelongterm in nature and, thus, the present value of the liabilities is sensitive to changes in real interest rates.
and measured in a number of different ways, as outlined in appendix II. For the SRP, the liabilities are long term in nature and, thus, sensitive to changes in real interest rates.
The most widely used and publicly disclosed measure of pension plan liabilities for an open plan istheprojectedbenefitobligation(PBO)measure.This measure is required by the International FinancialReportingStandards(IFRS)andtheGenerally Accepted Accounting Principles in the UnitedStates(U.S.GAAP)forplansponsors,and is the most commonly used and reported measurewithinthepensionindustry.Itreflectsthepresentvalueofallretirementbenefitsearned
byparticipants(adjustedforassumedinflation)as of a given date, including projected salary increases to retirement. Therefore, the funded ratio based on the PBO measure13 is the single mostappropriatemetricforassessingthefinancialposition(i.e.theabilitytocoverearnedbenefits)ofthe Plan as of a certain date.
13Otherliabilitymeasures,liketheClosed,Open,andModifiedOpenGroup, that anticipate and account for expected future service accruals (forcurrentorevenfuturepopulation)andthatuseaconstant3.5percent real discount rate every year create stable contribution patterns and are more suitable for funding purposes.
The discount rate used to convert the PBO obligations into today’s dollars is derived from high-grade corporate bond yields as required by the globally recognized IFRS and U.S. GAAP for plan sponsors. The present value of the PBO measure based on prevailing high-quality (AA-rated)corporatebondyields—discountedusing the entire yield curve from Citigroup14 and basedontheinflationexpectationspublishedby
14TheCitigroupcurveiswidelyusedforPBOdetermination,asitisobjective, transparent, and readily available. It is disseminated by the Society of Actuaries at www.soa.org/professional-interests/pension/resources/pen-resources-pension.aspx.
10-year 20-year Since 1990
Nominal 7.1% 7.3% 8.0%Real 4.6% 4.8% 5.2%
Annualized Nominal and Real Net Investment
Returns as of December 31, 2013
PBO–Funded Ratio at December 31, 2013
1.00
$3.2 billion $17.1 billion Benefit payments Investment exceeding contributions income
Cumulative Flows since 1990
Impact on Funded Ratio of One Percent Increase
in Interest Rate
+14 %
21
Fina
ncia
l Hea
lth
of th
e Pl
an
20
the Cleveland Federal Reserve15 — was $17.3 billion16 as of December 31, 2013. The effective realdiscountrateunderlyingthisfigurewasapproximately 2.7 percent. The fair value of the Plan’s net assets were $17.3 billion, resulting in a PBO-based funded ratio of 1.0017(figure2.1)as of December 31, 2013. By way of reference, the average PBO-funded ratio for the 100 largest U.S.-based pension plans, according to Milliman18, stoodat0.95atthatdate.
The investment performance in 2013 coupled with the increase in real AA discount rate contributed to the increase of the funded ratio for the Plan, from 0.88 to 1.00. Implied real AA interest rates, which areusedtodiscountthebenefitcashflows,rosein2013bymorethan65basispoints(figure2.2).
15TheClevelandFederalReservepublishesinflationforecaststhatareconsistent with market yields, available at www.clevelandfed.org/research/data/inflation_expectations/index.cfm.16Approximately15percentoftheseobligationsarecurrentlyestimatedtobedenominatedincurrenciesotherthantheU.S.dollar,reflectingtheaggregate impact of the currency choices made thus far by individual eligible retirees.17 A PBO-based funded ratio of 1.00 indicates that all accrued rights todateareexactlycoveredbytheassets;futurecontributionswillcoverfuture rights only.18Milliman,apensionconsultingandadvisoryfirm,conductsannualpension funding studies of the 100 largest U.S. public corporations that sponsordefined-benefitpensionplans.Thestudyisbasedonpensionplan accounting information disclosed in the footnotes to the companies’ annual reports.
In order to assess the risk and return trade-offs underlying the management of the Plan, two additional approaches are used to calculate the presentvalueofthePBOmeasure.Thefirstapproach is based on the Long-Term Real Return Objective(LTRRO)of3.5percentusedinthefunding methodology. On this basis, the resulting funded ratio was 1.10 at year end 2013.
This indicates that, using the real return assumption in the funding methodology, the assets are more than keeping pace with the liabilities over time. The second approach is based on risk-free real interest rates—real interest rates derived from U.S. Government TIPS with maturitiescorrespondingtothetimeprofileofthebenefitcashflows.AsofDecember31,2013,this approach produced a funded ratio of 0.83, an increase of 18 basis points, aided by strong investment returns and a rise in real interest rate ofmorethan140basispoints.Thisapproachillustrates the extent to which the current assets, if invested to eliminate inflation and investment risk, wouldmeetbenefitspaymentsaccruedpriortoDecember 31, 2013. It is important to note that this funded ratio is not widely used, represents a much more conservative measure than just
described, and is not comparable to the funded ratios often quoted in the press for other plans. The differences between the funded ratios are discussed in detail in appendix II.
A combination of staff and Bank contributions and investmentreturns(figure2.3)augmentthePlanassetsandtogetherfundthebenefitspaidtotheretirees. The amount that the Plan pays each year inpensionbenefitsisnowgreaterthantheamountit collects in contributions.
In 2013, Bank and staff contributions were $302 million and $118 million, respectively. Net investment earnings, after all fees and administrativeexpenses,amountedto$1,511million;andpensionbenefitpaymentstotaled$679million.
Figure2.4 shows the dollar impact of investment returns and net contributions (i.e., contributions lessbenefitpayments)onthegrowthoftheassetsof the Plan over various time periods. Over the past 10-year and 20-year periods, the Plan’s assets have increased by $7.0 billion and $11.7 billion, respectively, with investment performance not only driving the growth in assets, but also contributing totheregularpensionbenefitpayments.
7.1
9.2
15.1
-1.4 -2
.2
-3.5
5.7 7.
0
11.7
-4.0
-2.0
0.0
2.0
4.0
6.0
8.0
10.0
12.0
14.0
16.0
Last 5 Years Last 10 Years Last 20 Years
US$
bill
ion
Net investment income Contribution of net benefit payments Net change in plan assets
Figure 2.4: Dollar Impact on Plan Assets from Investment Returns and Net Contributions
77
77
80
87
97
98
103
108
111
118
184 24
8
224
161
101
131 19
9 224 260 30
2
-366
-397
-447
-480
-510
-528
-560
-619
-653
-679
-3,600
-2,700
-1,800
-900
0
900
1,800
2,700
-800
-600
-400
-200
0
200
400
600
2004
2005
2006
2007
2008
2009
2010
2011
2012
2013
US$
mill
ion
Staff contributions (left scale) Bank contributions (left scale)
Benefit payments (left scale) Net investment income (right scale)
US$
mill
ion
Figure 2.3: Annual Contributions, Net Investment Income and Benefit Payments (2004-2013)

2322
Fina
ncia
l Man
agem
ent
of th
e Pl
an
SECTION III
Financial Management of the Plan
=+ BenefitLiabilities
CurrentPlan
Assets
InvestmentReturns
Contributions
Actuarial Value
of Assets
PV of Staff
Contributions
PV of Required Bank
Contributions
PV of Benefits for Current
and Former Staff
PV of Benefits for Future
Staff+ + +
Box 3.1:
A Snapshot of Plan Governance and Funding
Pension Finance Committee Responsibility The PFC oversees the Plan’s financial management. The PFC is responsible for the following:
§§ Arranging regular actuarial valuations of assets and liabilities
§§ Reviewing and adopting assumptions underlying such valuations after obtaining recommendations from the Plan’s actuaries
§§ Determining the Bank’s contributions on the basis of those actuarial valuations after consulting with the Bank.
Bank Responsibility§§ The Bank’s obligations are based on the
Plan Document approved by the Board.
§§ The Plan Document provides that the Bank shall contribute to the Plan the amount determined by the PFC on the basis of actuarial valuations after consulting with the Bank.
Plan Document and Principles of Staff Employment§§ The Plan may not be amended to reduce
benefits to which Plan participants have already become entitled.
§§ The Principles of Staff Employment, approved by the Board, prohibit the retroactive reduction of compensation for services already rendered.
FUNDING POLICY
The funding policy for a pension plan such as the SRP seeks to determine how much a plan
sponsor must contribute annually to sustain and ensuretheaccumulationofsufficientplanassetsovertimetomeettheexpectedbenefitpayments.A funding policy often has to balance competing objectives avoiding excessive volatility in sponsor contributions and maintaining the participants’ securitybyfundingplanbenefitpaymentswithoutaccumulatingexcesssurplusesordeficits.
The SRP’s funding policy is approved by the PFC. The policy determines the Bank’s annual contributions to the Plan and incorporates the actuarial principles and assumptions used to calculate the Plan assets and liabilities. The following steps determine the Bank’s annual contributions:
1. Estimating the value of Plan assets and liabilities and the PV of projected future staff contributions, all in accordance with actuarial principles as of the end of the previouscalendaryear(CY):Theliabilitiesand the PV of projected staff contributions are calculated using the relevant population of staff and new entrants assumed in the funding methodology (refer to appendix II formoredetails).
2. Computing the difference between the actuarial value of Plan liabilities and the actuarial value of Plan assets, after accounting for the PV of projected staff contributions: The difference, if any, is the PV of contributions needed from the Bank.
+
Assets Liabilities
The SRP benefit payments are funded by plan assets, staff and Bank contributions, and investment returns. Staff contributions are fixed as a percentage of salaries, while the Bank’s contributions and the Plan’s investment returns vary. The key policies underpinning the determination of sponsor contributions and guiding the investment of Plan assets are the funding and investment policies. The objective of these policies is to ensure that the Plan has sufficient assets to meet benefit payments over the long term.
The funding policy, approved by the PFC, establishes the actuarial principles and assumptions used to determine the Bank’s annual contributions to the Plan. The funding policy effectively assumes a real return on plan investments (3.5 percent since 1999) and this rate constitutes the long-term objective or “hurdle rate” for Plan assets (referred to as the LTRRO). This is the real rate of return that the plan assets are expected to earn on average over the long term. Consequently, the PFC believes that the LTRRO is the most appropriate metric for assessing whether investment returns are meeting funding policy assumptions.
The investment of Plan assets is directed by the Plan’s investment policy. A major component of the investment policy is the strategic asset allocation (SAA) which represents the asset mix that the PFC believes is best able to meet the LTRRO over a given investment horizon and within acceptable risk parameters. At any point in time, the return assumptions underlying a given SAA are dependent on the particular market environment. These return assumptions, which have varied – and will vary - over time, guide the PFC in determining the appropriate level of risk taking on plan assets in order to meet or exceed the LTRRO. The SAA is periodically reviewed and approved by the PFC as appropriate.
=
25
Fina
ncia
l Man
agem
ent
of th
e Pl
an
24
24.8
4
23.9
4
22.3
5
20.1
1
5.00
15.0
9
25.6
2
26.7
2
18.3
5
12.2
3
5.74
15.5
5
15.3
0 17.6
4
18.9
1
20.8
8
18.9
8
0
5
10
15
20
30
1994 1997 2000 2003 2006 2009 2012 2015
Perc
ent (
%)
Fiscal year (FY) ending June 30
Note: Bank contributions were suspended from FY98 to FY02. Actual Projected FY15
25
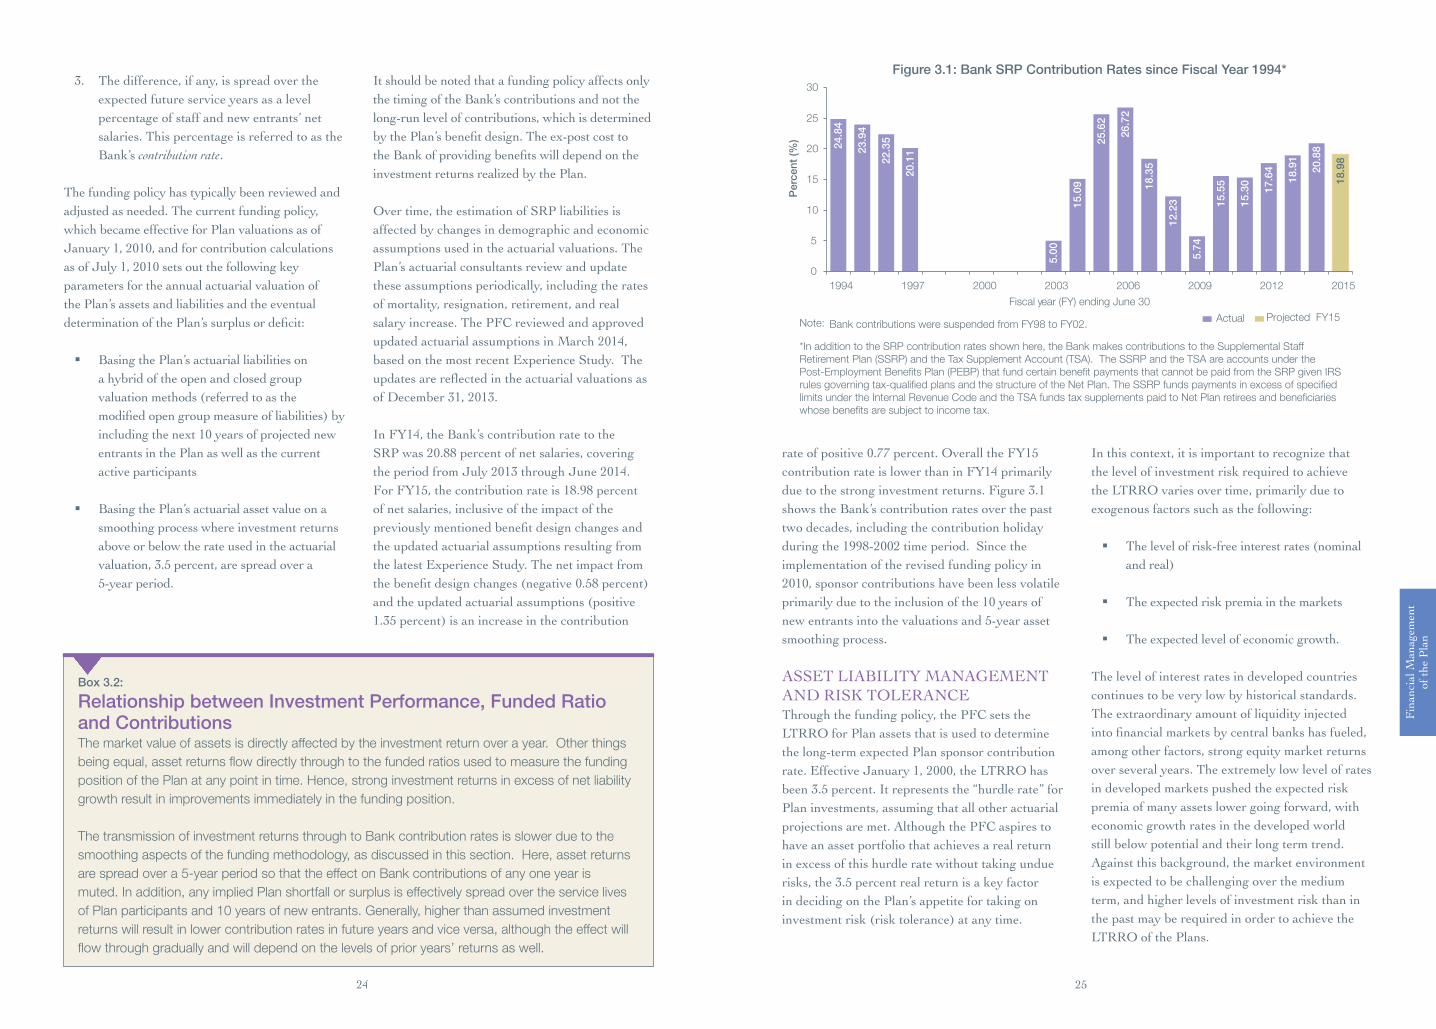
Figure 3.1: Bank SRP Contribution Rates since Fiscal Year 1994*
*In addition to the SRP contribution rates shown here, the Bank makes contributions to the Supplemental Staff Retirement Plan (SSRP) and the Tax Supplement Account (TSA). The SSRP and the TSA are accounts under the Post-Employment Benefits Plan (PEBP) that fund certain benefit payments that cannot be paid from the SRP given IRS rules governing tax-qualified plans and the structure of the Net Plan. The SSRP funds payments in excess of specified limits under the Internal Revenue Code and the TSA funds tax supplements paid to Net Plan retirees and beneficiaries whose benefits are subject to income tax.
Box 3.2:
Relationship between Investment Performance, Funded Ratio and ContributionsThe market value of assets is directly affected by the investment return over a year. Other things being equal, asset returns flow directly through to the funded ratios used to measure the funding position of the Plan at any point in time. Hence, strong investment returns in excess of net liability growth result in improvements immediately in the funding position.
The transmission of investment returns through to Bank contribution rates is slower due to the smoothing aspects of the funding methodology, as discussed in this section. Here, asset returns are spread over a 5-year period so that the effect on Bank contributions of any one year is muted. In addition, any implied Plan shortfall or surplus is effectively spread over the service lives of Plan participants and 10 years of new entrants. Generally, higher than assumed investment returns will result in lower contribution rates in future years and vice versa, although the effect will flow through gradually and will depend on the levels of prior years’ returns as well.
3. The difference, if any, is spread over the expected future service years as a level percentage of staff and new entrants’ net salaries. This percentage is referred to as the Bank’s contribution rate.
The funding policy has typically been reviewed and adjusted as needed. The current funding policy, which became effective for Plan valuations as of January 1, 2010, and for contribution calculations as of July 1, 2010 sets out the following key parameters for the annual actuarial valuation of the Plan’s assets and liabilities and the eventual determinationofthePlan’ssurplusordeficit:
§ Basing the Plan’s actuarial liabilities on a hybrid of the open and closed group valuation methods (referred to as the modifiedopengroupmeasureofliabilities)byincluding the next 10 years of projected new entrants in the Plan as well as the current active participants
§ Basing the Plan’s actuarial asset value on a smoothing process where investment returns above or below the rate used in the actuarial valuation,3.5percent,arespreadovera5-yearperiod.
It should be noted that a funding policy affects only the timing of the Bank’s contributions and not the long-run level of contributions, which is determined bythePlan’sbenefitdesign.Theex-postcosttotheBankofprovidingbenefitswilldependontheinvestment returns realized by the Plan.
Over time, the estimation of SRP liabilities is affected by changes in demographic and economic assumptions used in the actuarial valuations. The Plan’s actuarial consultants review and update these assumptions periodically, including the rates of mortality, resignation, retirement, and real salary increase. The PFC reviewed and approved updatedactuarialassumptionsinMarch2014,based on the most recent Experience Study. The updatesarereflectedintheactuarialvaluationsasof December 31, 2013.
InFY14,theBank’scontributionratetotheSRP was 20.88 percent of net salaries, covering theperiodfromJuly2013throughJune2014.ForFY15,thecontributionrateis18.98percentof net salaries, inclusive of the impact of the previouslymentionedbenefitdesignchangesandthe updated actuarial assumptions resulting from the latest Experience Study. The net impact from thebenefitdesignchanges(negative0.58percent)and the updated actuarial assumptions (positive 1.35percent)isanincreaseinthecontribution
rateofpositive0.77percent.OveralltheFY15contributionrateislowerthaninFY14primarilydue to the strong investment returns. Figure 3.1 shows the Bank’s contribution rates over the past two decades, including the contribution holiday duringthe1998-2002timeperiod.Sincetheimplementation of the revised funding policy in 2010, sponsor contributions have been less volatile primarily due to the inclusion of the 10 years of newentrantsintothevaluationsand5-yearassetsmoothing process.
ASSET LIABILITY MANAGEMENT AND RISK TOLERANCEThrough the funding policy, the PFC sets the LTRRO for Plan assets that is used to determine the long-term expected Plan sponsor contribution rate. Effective January 1, 2000, the LTRRO has been3.5percent.Itrepresentsthe“hurdlerate”forPlan investments, assuming that all other actuarial projections are met. Although the PFC aspires to have an asset portfolio that achieves a real return in excess of this hurdle rate without taking undue risks,the3.5percentrealreturnisakeyfactorin deciding on the Plan’s appetite for taking on investmentrisk(risktolerance)atanytime.
In this context, it is important to recognize that the level of investment risk required to achieve the LTRRO varies over time, primarily due to exogenous factors such as the following:
§ The level of risk-free interest rates (nominal andreal)
§ The expected risk premia in the markets
§ The expected level of economic growth.
The level of interest rates in developed countries continues to be very low by historical standards. The extraordinary amount of liquidity injected intofinancialmarketsbycentralbankshasfueled,among other factors, strong equity market returns over several years. The extremely low level of rates in developed markets pushed the expected risk premia of many assets lower going forward, with economic growth rates in the developed world still below potential and their long term trend. Against this background, the market environment is expected to be challenging over the medium term, and higher levels of investment risk than in the past may be required in order to achieve the LTRRO of the Plans.
Fina
ncia
l Man
agem
ent
of th
e Pl
an
26 27
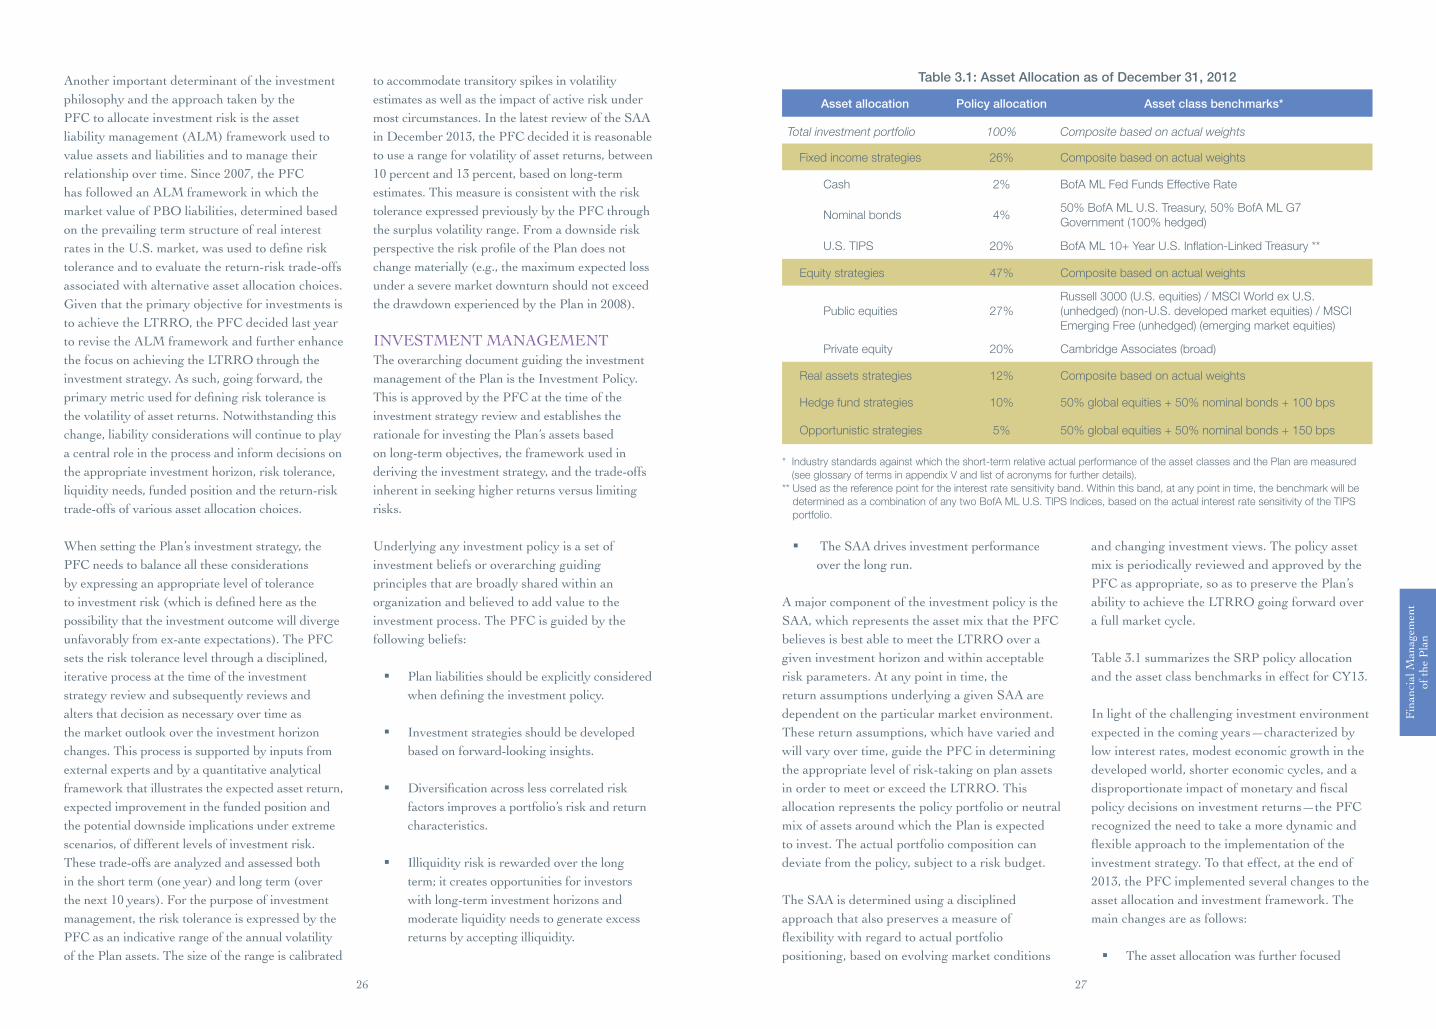
Table 3.1: Asset Allocation as of December 31, 2012
Asset allocation Policy allocation Asset class benchmarks*
Total investment portfolio 100% Composite based on actual weights
Fixed income strategies 26% Composite based on actual weights
Cash 2% BofA ML Fed Funds Effective Rate
Nominal bonds 4%50% BofA ML U.S. Treasury, 50% BofA ML G7 Government (100% hedged)
U.S. TIPS 20% BofA ML 10+ Year U.S. Inflation-Linked Treasury **
Equity strategies 47% Composite based on actual weights
Public equities 27%Russell 3000 (U.S. equities) / MSCI World ex U.S. (unhedged) (non-U.S. developed market equities) / MSCI Emerging Free (unhedged) (emerging market equities)
Private equity 20% Cambridge Associates (broad)
Real assets strategies 12% Composite based on actual weights
Hedge fund strategies 10% 50% global equities + 50% nominal bonds + 100 bps
Opportunistic strategies 5% 50% global equities + 50% nominal bonds + 150 bps
* Industry standards against which the short-term relative actual performance of the asset classes and the Plan are measured (see glossary of terms in appendix V and list of acronyms for further details).
** Used as the reference point for the interest rate sensitivity band. Within this band, at any point in time, the benchmark will be determined as a combination of any two BofA ML U.S. TIPS Indices, based on the actual interest rate sensitivity of the TIPS portfolio.
Another important determinant of the investment philosophy and the approach taken by the PFC to allocate investment risk is the asset liabilitymanagement(ALM)frameworkusedtovalue assets and liabilities and to manage their relationship over time. Since 2007, the PFC has followed an ALM framework in which the market value of PBO liabilities, determined based on the prevailing term structure of real interest ratesintheU.S.market,wasusedtodefinerisktolerance and to evaluate the return-risk trade-offs associated with alternative asset allocation choices. Given that the primary objective for investments is to achieve the LTRRO, the PFC decided last year to revise the ALM framework and further enhance the focus on achieving the LTRRO through the investment strategy. As such, going forward, the primarymetricusedfordefiningrisktoleranceisthe volatility of asset returns. Notwithstanding this change, liability considerations will continue to play a central role in the process and inform decisions on the appropriate investment horizon, risk tolerance, liquidity needs, funded position and the return-risk trade-offs of various asset allocation choices. When setting the Plan’s investment strategy, the PFC needs to balance all these considerations by expressing an appropriate level of tolerance toinvestmentrisk(whichisdefinedhereasthepossibility that the investment outcome will diverge unfavorablyfromex-anteexpectations).ThePFCsets the risk tolerance level through a disciplined, iterative process at the time of the investment strategy review and subsequently reviews and alters that decision as necessary over time as the market outlook over the investment horizon changes. This process is supported by inputs from external experts and by a quantitative analytical framework that illustrates the expected asset return, expected improvement in the funded position and the potential downside implications under extreme scenarios, of different levels of investment risk. These trade-offs are analyzed and assessed both intheshortterm(oneyear)andlongterm(overthenext10years).Forthepurposeofinvestmentmanagement, the risk tolerance is expressed by the PFC as an indicative range of the annual volatility of the Plan assets. The size of the range is calibrated
to accommodate transitory spikes in volatility estimates as well as the impact of active risk under most circumstances. In the latest review of the SAA in December 2013, the PFC decided it is reasonable to use a range for volatility of asset returns, between 10 percent and 13 percent, based on long-term estimates. This measure is consistent with the risk tolerance expressed previously by the PFC through the surplus volatility range. From a downside risk perspectivetheriskprofileofthePlandoesnotchange materially (e.g., the maximum expected loss under a severe market downturn should not exceed thedrawdownexperiencedbythePlanin2008).
INVESTMENT MANAGEMENTThe overarching document guiding the investment management of the Plan is the Investment Policy. This is approved by the PFC at the time of the investment strategy review and establishes the rationale for investing the Plan’s assets based on long-term objectives, the framework used in deriving the investment strategy, and the trade-offs inherent in seeking higher returns versus limiting risks.
Underlying any investment policy is a set of investment beliefs or overarching guiding principles that are broadly shared within an organization and believed to add value to the investment process. The PFC is guided by the following beliefs:
§ Plan liabilities should be explicitly considered whendefiningtheinvestmentpolicy.
§ Investment strategies should be developed based on forward-looking insights.
§ Diversificationacrosslesscorrelatedriskfactors improves a portfolio’s risk and return characteristics.
§ Illiquidity risk is rewarded over the long term;itcreatesopportunitiesforinvestorswith long-term investment horizons and moderate liquidity needs to generate excess returns by accepting illiquidity.
§ The SAA drives investment performance over the long run.
A major component of the investment policy is the SAA, which represents the asset mix that the PFC believes is best able to meet the LTRRO over a given investment horizon and within acceptable risk parameters. At any point in time, the return assumptions underlying a given SAA are dependent on the particular market environment. These return assumptions, which have varied and will vary over time, guide the PFC in determining the appropriate level of risk-taking on plan assets in order to meet or exceed the LTRRO. This allocation represents the policy portfolio or neutral mix of assets around which the Plan is expected to invest. The actual portfolio composition can deviate from the policy, subject to a risk budget.
The SAA is determined using a disciplined approach that also preserves a measure of flexibilitywithregardtoactualportfoliopositioning, based on evolving market conditions
and changing investment views. The policy asset mix is periodically reviewed and approved by the PFC as appropriate, so as to preserve the Plan’s ability to achieve the LTRRO going forward over a full market cycle.
Table 3.1 summarizes the SRP policy allocation and the asset class benchmarks in effect for CY13.
In light of the challenging investment environment expected in the coming years—characterized by low interest rates, modest economic growth in the developed world, shorter economic cycles, and a disproportionateimpactofmonetaryandfiscalpolicy decisions on investment returns—the PFC recognized the need to take a more dynamic and flexibleapproachtotheimplementationoftheinvestment strategy. To that effect, at the end of 2013, the PFC implemented several changes to the asset allocation and investment framework. The main changes are as follows:
§ The asset allocation was further focused

28 29
Fina
ncia
l Man
agem
ent
of th
e Pl
an
Table 3.2: Asset Allocation effective as of December 31, 2013
Asset allocation Policy allocation Asset class benchmarks*
Total investment portfolio 100% Composite based on policy weights
Fixed income strategies 26% Composite based on policy weights
Cash 2% BofA ML Fed Funds Effective Rate
Nominal bonds 24% BofA ML U.S. Treasury
Equity strategies 53% Composite based on policy weights
Public equities 33%
Russell 3000 (U.S. equities) / MSCI World ex U.S. (unhedged) (non-U.S. developed market equities) / MSCI Emerging Free (unhedged) (emerging market equities)
Private equity 20% Cambridge Associates (broad)
Real assets strategies 13% Composite based on actual weights
Absolute return strategies 8% BofA ML Fed Funds Effective Rate + 300 bps
*Industry standards against which the short-term relative actual performance of the asset classes and the Plan are measured (see glossary of terms in appendix V and list of acronyms for further details).
Box 3.3:
External Manager Selection Process Investments under the Plan are carried out primarily through external managers. The external manager selection process is therefore one of the cornerstones of portfolio construction, and is informed by the PFC-approved SAA and risk budgets. This selection process is performed by a diverse team of highly dedicated and experienced professionals, consisting of investment staff and staff from the legal and operations departments. One of the team’s most important roles across the various asset classes is to identify excellent external managers who staff expects will deliver strong investment returns within acceptable risk parameters and who are likely to be effective partners over the long term.
Through the market monitoring and portfolio construction processes, staff identifies and meets with a large number of prospective managers. The list is gradually reduced as the team selects those managers who are best suited to the specific asset class strategies and who share the team’s values. An intensive due diligence process follows which includes several components, such as the following:
§ Broad analysis of the investment philosophy, investment process, portfolio construction, risk management, and performance track record, with a focus on sustainability
§ Review of the external manager’s business and organization, including the infrastructure and the quality of staff
§ Legal review and operational due diligence covering investment management, risk and analytics, transaction processing, accounting and control functions.
Ongoing monitoring of external managers is also an integral aspect of the Plan’s overall investment activities. Periodic visits, conference calls, and portfolio compliance and performance reviews are carried out to better evaluate and monitor, on a continuous basis, the robustness of external managers’ investments and operations. Managers’ performance is evaluated at regular intervals and discussed in a wider group setting to ensure that the Plan’s objectives continue to be met.
around core risk factors by reducing the number of investment categories and simplifying the asset class benchmarks where appropriate.
§ Allocation to absolute return strategies has been reduced and the role of the strategy was furtherrefinedtoreflectmainlyexposureto market neutral hedge fund strategies (strategies with no consistent exposure to systematic risk factors and with a strong focus on downside protection and capital preservation).Theassetclassbenchmarkwasadjustedaccordinglytoreflecttheexpectedriskandreturnprofileofthisinvestmentstrategy.
§ Rebalancing bands around public asset class were removed to enhance transparency and performance measurement of active risk taking.
§ The active risk budget was expanded to include investment strategies that do not fitinoneparticularcategoryintheSAAbut rather cut across different categories from a risk exposure perspective (e.g., high yield, emerging market debt, opportunistic strategies, hedge fund strategies with significantdirectionality,andsoforth).As such, going forward, for example, the Opportunistic Strategies investment category will be incorporated as part of the
overall active risk budget. This enhanced approach to active risk is expected to enableincreasedflexibilityinidentifyingand exploiting sources of return outside of the asset allocation and combining these return streams optimally in the portfolio construction process.
Furthermore, over the course of 2013, in light of continued concerns with respect to the outlook for interest rates in the United States, the Plan sold itsentireU.S.TIPSportfoliotorealizesignificantgains, thereby reducing the interest rate sensitivity of the portfolio.
The appropriateness of the investment strategy is continuously assessed and discussed with the PFC in light of changes in the macroeconomic environment. Periodically, the assumptions underlying the investment strategy are updated to incorporate changes in market levels and outlook. Also, extensive scenario analysis is performed tocaptureandreflectonthemacroeconomicdevelopmentsthatcouldhaveasignificantimpacton the SRP portfolio over the medium term (the nextthreetofiveyears).
The eligible universe of assets continues to be grouped primarily under the following four categories, as discussed in appendix III, based on fundamental return and risk characteristics, along with expected behavioral responses to market conditions:
§ Fixed income strategies (including primarilynominalbondsandinflationprotectedsecurities)
§ Equity strategies (including public and privateequity)
§ Real assets strategies (including assets such as real estate, timber, infrastructure, and othersimilarstrategies)
§ Absolute return strategies, consisting primarily of market neutral hedge fund strategies.
Table 3.2 summarizes the SRP policy asset allocation and the asset class benchmarks as of December 31, 2013.

30 31
Fina
ncia
l Man
agem
ent
of th
e Pl
an
RISK MANAGEMENTThe Plan’s investment activities expose it to a range of investment risks. Investment risk refers to the potential loss inherent in an investment or portfolio of investments due to the unpredictability offinancialmarkets.Itcommonlyincludesmarket,credit, counterparty, and liquidity risks. Managing investment risk is an integral part of managing Plan assets and involves collaborative efforts across various departments.
Assetdiversificationandaliability-informedinvestment management are central to the SRP’s overall investment strategy and risk management approach. The asset volatility risk together with the downside risk measures, as discussed in the ALM and risk tolerance section, are considered the key indicators of the Plan’s overall investment risk.Thesemeasuresareusedtodefinetheoverall level of investment risk that the PFC is willing to assume in order to pursue investment returns.ThePlan’sassetsarediversifiedacrossa variety of asset classes. Investments within eachassetclassarefurtherdiversifiedacrossfunds, managers, strategies, geographies, and sectors to limit the adverse impact that could result from any individual investment. The risk management for each asset class is tailored to its specificcharacteristicsandrepresentsanintegralpart of the external managers’ due diligence and monitoring processes.
Investment risk is regularly monitored at the absolute level as well as at the relative levels with respect to the investment policy, manager benchmarks, and liabilities of the Plan. Stress tests are performed periodically using relevant market scenarios to assess the impact of extreme market events. To ensure consistent implementation of the Plan’s desired risk level, the investment policy documentspecifiesassetallocationbandsaroundthe policy allocation. A monthly rebalancing process is used to ensure that these bands are adhered to, taking into account the market conditions and constraints related to investing in private asset classes and absolute return strategies, as appropriate. In addition, monitoring of performance (at both manager and asset class
levels)againstbenchmarksandofcompliancewithinvestment guidelines is carried out on a regular basis as part of the risk monitoring process.
Credit risk is monitored on a regular basis and assessed for possible market event impacts. The Plan’s liquidity position is analyzed at regular intervals and periodically tested using various stress scenarios to ensure that the Plan hassufficientliquiditytomeetallcashflowrequirements. In addition, the long-term cash flowneedsofthePlanareconsideredduringtheinvestment strategy review and are one of the main drivers in determining the maximum allocation to the illiquid investment vehicles.
More information on the risk management activitiesisprovidedinnoteK,“FinancialRiskManagement,”ofthePlan’sFinancialStatements(appendixVIII).

Plan
Per
form
ance
32 33
SECTION IV
Plan Performance
2013 Net Investment Income
Cumulative Net Investment Income over 10 years
Cumulative Net Investment Income since 1990
2013 Net Investment Return above Inflation
Annualized 10-year Net Investment Return above
Inflation
Annualized Net Investment Return above Inflation
since 1990
US$ 1.5 billion
US$ 9.2 billion
US$ 17.1 billion
8.1%
4.6%
5.2%
4.4
5.5 6.3 6.9
1.0 1.5 2.0 2.5 3.0 3.5 4.0 4.5 5.0 5.5 6.0 6.5 7.0
1992 1995 1998 2001 2004 2007 2010 2013
Long-term return objective (nominal)
Traditional portfolio return (60/40 stocks/bonds)
Net nominal return
Gross nominal return
US$
Cumulative Dollar Value Growth (1990-2013)
The Plan’s performance is largely driven by the SAA which, as discussed previously,
issubstantiallyinformedbytheLTRROof3.5percent that is used in the funding policy as the critical determinant of the level of contributions and the long-term adequacy of the assets to service pension liabilities.
LONG-TERM PLAN PERFORMANCEConsistent with the Plan’s long-term investment objective, the most relevant time frame for measuring performance is a multi-year period. Since1990,thePlan’sassetshaveincreasednearly$13.9billion,netoffees,expensesandbenefitpayments,withcumulativeinvestmentincome contributing $17.1 billion, net of fees and expenses. The Plan generated annualized net real returnsince1990of5.2percent,exceedingtheLTRRO.Asshowninfigure4.1,thePlanreturnsconsistently met or exceeded the LTRRO over longer time periods, with annualized net real investmentreturnsof4.6percentand4.8percentover 10-year and 20-year periods, respectively.
The LTRRO during the same time periods were3.5percentand3.6percent,respectively.Inaddition,asshownintable4.1,theportfolioconsistently outperformed its asset class weighted benchmark over various time periods, generating $1.3 billion in excess returns over the last 10 years and$1.8billionsince1990.
CY13 MARKET ENVIRONMENTThe recovery trend in the world economy continued in CY13 led by developed countries. Over the course of the year there was growing evidence that the U.S. economy was getting on a
Equity strategies
Fixed income strategies
Real assets strategies
Absolute return strategies
Actual Asset Allocation as of December 31, 2013
53%
23%
12%
12%more sustainable footing with positive implications on the performance of risky assets and consumer confidence.Therecoveryinthehousingmarketcontinued at a steady pace while unemployment dropped consistently throughout the year. At the same time economic conditions stabilized in the Eurozone and the region returned to economic growth after being mired in a recessionary environment for several years. In Japan a renewed commitment to aggressive monetary stimulation by the Bank of Japan led to a boost in economic growthandareturntoinflation.Inthiscontextequity markets and risky assets in general in the developed world recorded strong returns while G7 government bond market returns were negative as long-term yields rose, particularly in the United States. In light of improved economic conditionstheU.S.FederalReserve(Fed)started
to modulate the degree of monetary stimulation by gradually reducing the size of its bond purchasing program late in CY13. Initial discussions of the Fed tapering bond purchases in the spring of CY13 resulted in an upsurge in volatility in global financialmarkets,withadisproportionateimpacton emerging market assets and global government bond markets. Emerging economies, particularly those with vulnerable current account balances, sawtheircurrenciesdepreciatesignificantlywithgovernment bonds and equity markets selling off as investors reallocated capital away from these economies and into developed markets. Table 4.2showsthemarketreturnsofdifferentmarketindices and/or passive portfolios in 2013 and over thelast5and10-yearperiods.
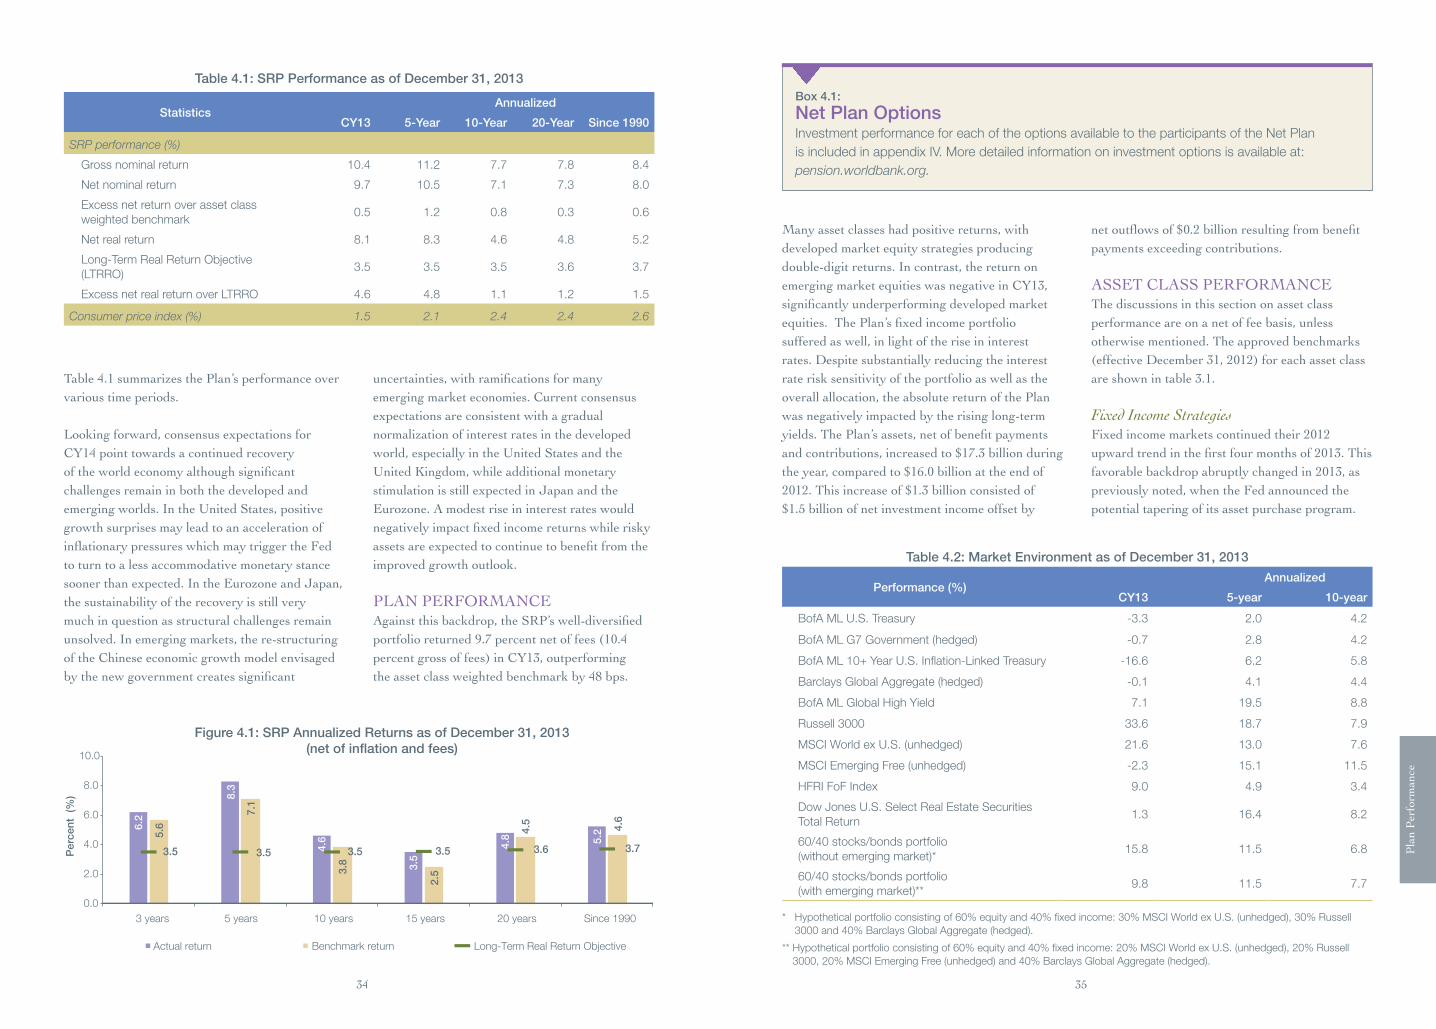
34
Plan
Per
form
ance
35
Table 4.2: Market Environment as of December 31, 2013
Performance (%) Annualized
CY13 5-year 10-year
BofA ML U.S. Treasury -3.3 2.0 4.2
BofA ML G7 Government (hedged) -0.7 2.8 4.2
BofA ML 10+ Year U.S. Inflation-Linked Treasury -16.6 6.2 5.8
Barclays Global Aggregate (hedged) -0.1 4.1 4.4
BofA ML Global High Yield 7.1 19.5 8.8
Russell 3000 33.6 18.7 7.9
MSCI World ex U.S. (unhedged) 21.6 13.0 7.6
MSCI Emerging Free (unhedged) -2.3 15.1 11.5
HFRI FoF Index 9.0 4.9 3.4
Dow Jones U.S. Select Real Estate Securities Total Return
1.3 16.4 8.2
60/40 stocks/bonds portfolio(without emerging market)*
15.8 11.5 6.8
60/40 stocks/bonds portfolio(with emerging market)**
9.8 11.5 7.7
* Hypothetical portfolio consisting of 60% equity and 40% fixed income: 30% MSCI World ex U.S. (unhedged), 30% Russell 3000 and 40% Barclays Global Aggregate (hedged).
** Hypothetical portfolio consisting of 60% equity and 40% fixed income: 20% MSCI World ex U.S. (unhedged), 20% Russell 3000, 20% MSCI Emerging Free (unhedged) and 40% Barclays Global Aggregate (hedged).
Table4.1summarizesthePlan’sperformanceovervarious time periods.
Looking forward, consensus expectations for CY14pointtowardsacontinuedrecoveryoftheworldeconomyalthoughsignificantchallenges remain in both the developed and emerging worlds. In the United States, positive growth surprises may lead to an acceleration of inflationarypressureswhichmaytriggertheFedto turn to a less accommodative monetary stance sooner than expected. In the Eurozone and Japan, the sustainability of the recovery is still very much in question as structural challenges remain unsolved. In emerging markets, the re-structuring of the Chinese economic growth model envisaged bythenewgovernmentcreatessignificant
uncertainties,withramificationsformanyemerging market economies. Current consensus expectations are consistent with a gradual normalization of interest rates in the developed world, especially in the United States and the United Kingdom, while additional monetary stimulation is still expected in Japan and the Eurozone. A modest rise in interest rates would negativelyimpactfixedincomereturnswhileriskyassetsareexpectedtocontinuetobenefitfromtheimproved growth outlook.
PLAN PERFORMANCEAgainstthisbackdrop,theSRP’swell-diversifiedportfolioreturned9.7percentnetoffees(10.4percentgrossoffees)inCY13,outperformingtheassetclassweightedbenchmarkby48bps.
Many asset classes had positive returns, with developed market equity strategies producing double-digit returns. In contrast, the return on emerging market equities was negative in CY13, significantlyunderperformingdevelopedmarketequities.ThePlan’sfixedincomeportfoliosuffered as well, in light of the rise in interest rates. Despite substantially reducing the interest rate risk sensitivity of the portfolio as well as the overall allocation, the absolute return of the Plan was negatively impacted by the rising long-term yields.ThePlan’sassets,netofbenefitpaymentsand contributions, increased to $17.3 billion during the year, compared to $16.0 billion at the end of 2012. This increase of $1.3 billion consisted of $1.5billionofnetinvestmentincomeoffsetby
netoutflowsof$0.2billionresultingfrombenefitpayments exceeding contributions.
ASSET CLASS PERFORMANCEThe discussions in this section on asset class performance are on a net of fee basis, unless otherwise mentioned. The approved benchmarks (effectiveDecember31,2012)foreachassetclassare shown in table 3.1.
Fixed Income StrategiesFixed income markets continued their 2012 upwardtrendinthefirstfourmonthsof2013.Thisfavorable backdrop abruptly changed in 2013, as previously noted, when the Fed announced the potential tapering of its asset purchase program.
Box 4.1:
Net Plan OptionsInvestment performance for each of the options available to the participants of the Net Plan is included in appendix IV. More detailed information on investment options is available at: pension.worldbank.org.
Table 4.1: SRP Performance as of December 31, 2013
Statistics Annualized
CY13 5-Year 10-Year 20-Year Since 1990
SRP performance (%)Gross nominal return 10.4 11.2 7.7 7.8 8.4
Net nominal return 9.7 10.5 7.1 7.3 8.0
Excess net return over asset class weighted benchmark
0.5 1.2 0.8 0.3 0.6
Net real return 8.1 8.3 4.6 4.8 5.2
Long-Term Real Return Objective(LTRRO)
3.5 3.5 3.5 3.6 3.7
Excess net real return over LTRRO 4.6 4.8 1.1 1.2 1.5
Consumer price index (%) 1.5 2.1 2.4 2.4 2.6
6.2
8.3
4.6
3.5
4.8 5.2 5.
6
7.1
3.8
2.5
4.5 4.6
3.5 3.5 3.5 3.5 3.6 3.7
0.0
2.0
4.0
6.0
8.0
10.0
3 years 5 years 10 years 15 years 20 years Since 1990
Perc
ent
(%)
Actual return Benchmark return Long-Term Real Return Objective
Figure 4.1: SRP Annualized Returns as of December 31, 2013(net of inflation and fees)
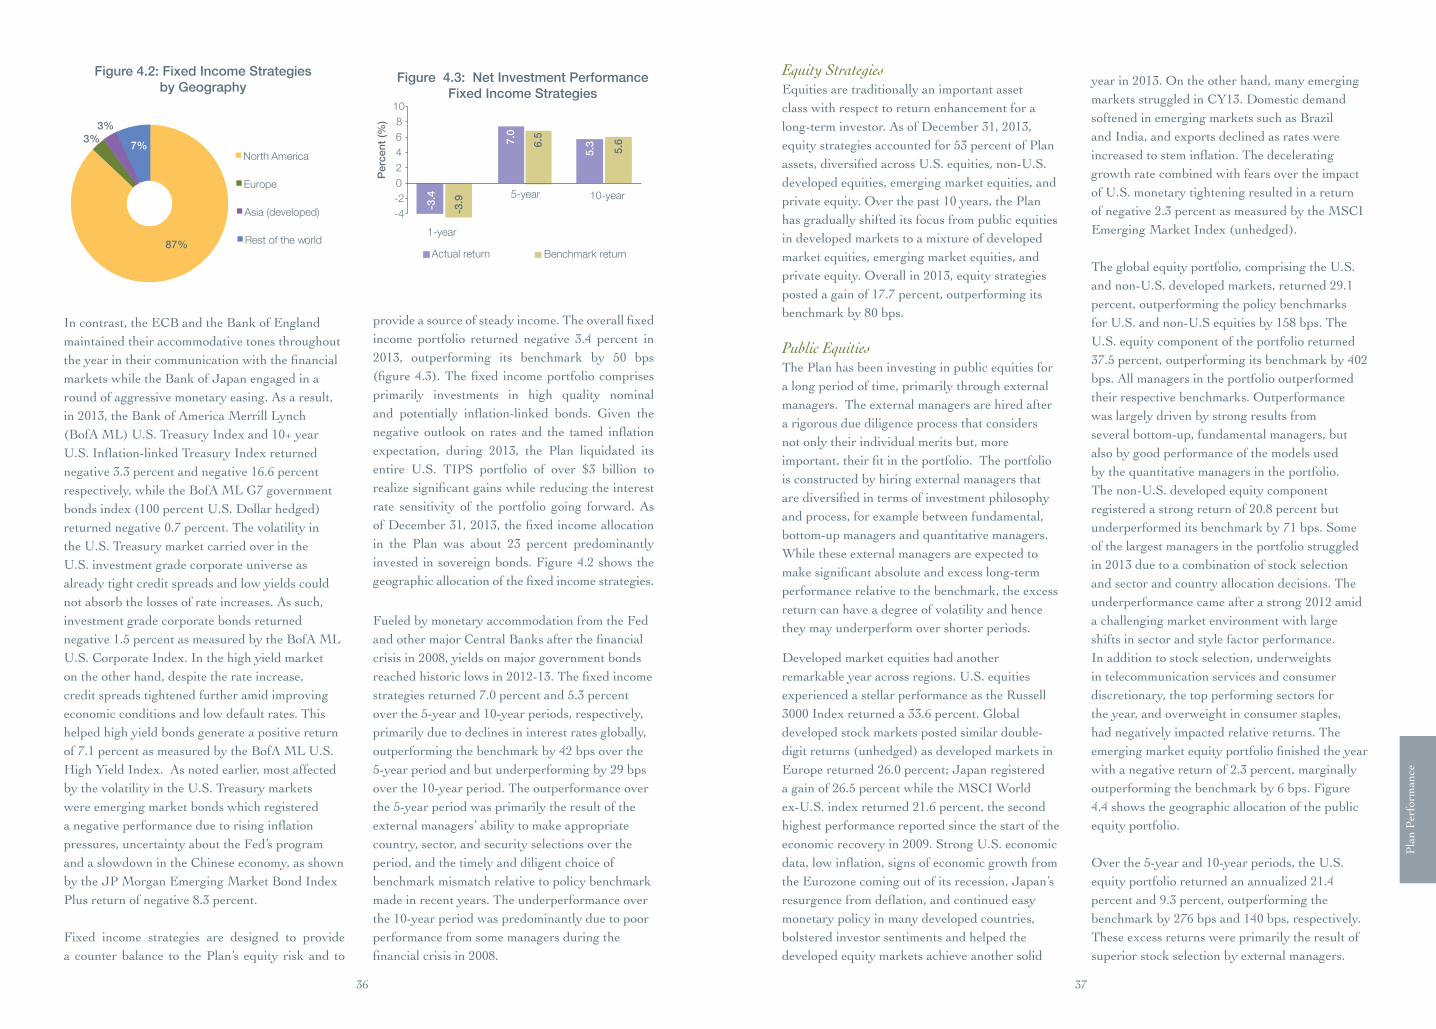
Plan
Per
form
ance
36 37
In contrast, the ECB and the Bank of England maintained their accommodative tones throughout theyearintheircommunicationwiththefinancialmarkets while the Bank of Japan engaged in a round of aggressive monetary easing. As a result, in 2013, the Bank of America Merrill Lynch (BofAML)U.S.TreasuryIndexand10+yearU.S.Inflation-linkedTreasuryIndexreturnednegative 3.3 percent and negative 16.6 percent respectively, while the BofA ML G7 government bondsindex(100percentU.S.Dollarhedged)returned negative 0.7 percent. The volatility in the U.S. Treasury market carried over in the U.S. investment grade corporate universe as already tight credit spreads and low yields could not absorb the losses of rate increases. As such, investment grade corporate bonds returned negative1.5percentasmeasuredbytheBofAMLU.S. Corporate Index. In the high yield market on the other hand, despite the rate increase, credit spreads tightened further amid improving economic conditions and low default rates. This helped high yield bonds generate a positive return of 7.1 percent as measured by the BofA ML U.S. High Yield Index. As noted earlier, most affected by the volatility in the U.S. Treasury markets were emerging market bonds which registered anegativeperformanceduetorisinginflationpressures, uncertainty about the Fed’s program and a slowdown in the Chinese economy, as shown by the JP Morgan Emerging Market Bond Index Plus return of negative 8.3 percent.
Fixed income strategies are designed to provide a counter balance to the Plan’s equity risk and to
provideasourceofsteadyincome.Theoverallfixedincome portfolio returned negative 3.4 percent in2013, outperforming its benchmark by 50 bps(figure4.3).Thefixed incomeportfoliocomprisesprimarily investments in high quality nominal and potentially inflation-linked bonds. Given thenegative outlook on rates and the tamed inflationexpectation, during 2013, the Plan liquidated its entire U.S. TIPS portfolio of over $3 billion to realizesignificantgainswhilereducingtheinterestrate sensitivity of the portfolio going forward. As ofDecember31,2013,thefixedincomeallocationin the Plan was about 23 percent predominantly investedinsovereignbonds.Figure4.2showsthegeographicallocationofthefixedincomestrategies.
Fueled by monetary accommodation from the Fed andothermajorCentralBanksafterthefinancialcrisis in 2008, yields on major government bonds reachedhistoriclowsin2012-13.Thefixedincomestrategiesreturned7.0percentand5.3percentoverthe5-yearand10-yearperiods,respectively,primarily due to declines in interest rates globally, outperformingthebenchmarkby42bpsoverthe5-yearperiodandbutunderperformingby29bpsover the 10-year period. The outperformance over the5-yearperiodwasprimarilytheresultoftheexternal managers’ ability to make appropriate country, sector, and security selections over the period, and the timely and diligent choice of benchmark mismatch relative to policy benchmark made in recent years. The underperformance over the 10-year period was predominantly due to poor performance from some managers during the financialcrisisin2008.
Equity StrategiesEquities are traditionally an important asset class with respect to return enhancement for a long-term investor. As of December 31, 2013, equitystrategiesaccountedfor53percentofPlanassets,diversifiedacrossU.S.equities,non-U.S.developed equities, emerging market equities, and private equity. Over the past 10 years, the Plan has gradually shifted its focus from public equities in developed markets to a mixture of developed market equities, emerging market equities, and private equity. Overall in 2013, equity strategies posted a gain of 17.7 percent, outperforming its benchmark by 80 bps.
Public EquitiesThe Plan has been investing in public equities for a long period of time, primarily through external managers. The external managers are hired after a rigorous due diligence process that considers not only their individual merits but, more important,theirfitintheportfolio.Theportfoliois constructed by hiring external managers that arediversifiedintermsofinvestmentphilosophyand process, for example between fundamental, bottom-up managers and quantitative managers. While these external managers are expected to makesignificantabsoluteandexcesslong-termperformance relative to the benchmark, the excess return can have a degree of volatility and hence they may underperform over shorter periods.
Developed market equities had another remarkable year across regions. U.S. equities experienced a stellar performance as the Russell 3000 Index returned a 33.6 percent. Global developed stock markets posted similar double-digitreturns(unhedged)asdevelopedmarketsinEuropereturned26.0percent;Japanregisteredagainof26.5percentwhiletheMSCIWorldex-U.S. index returned 21.6 percent, the second highest performance reported since the start of the economicrecoveryin2009.StrongU.S.economicdata,lowinflation,signsofeconomicgrowthfromthe Eurozone coming out of its recession, Japan’s resurgencefromdeflation,andcontinuedeasymonetary policy in many developed countries, bolstered investor sentiments and helped the developed equity markets achieve another solid
year in 2013. On the other hand, many emerging markets struggled in CY13. Domestic demand softened in emerging markets such as Brazil and India, and exports declined as rates were increasedtosteminflation.Thedeceleratinggrowth rate combined with fears over the impact of U.S. monetary tightening resulted in a return of negative 2.3 percent as measured by the MSCI EmergingMarketIndex(unhedged). The global equity portfolio, comprising the U.S. andnon-U.S.developedmarkets,returned29.1percent, outperforming the policy benchmarks forU.S.andnon-U.Sequitiesby158bps.TheU.S. equity component of the portfolio returned 37.5percent,outperformingitsbenchmarkby402bps. All managers in the portfolio outperformed their respective benchmarks. Outperformance was largely driven by strong results from several bottom-up, fundamental managers, but also by good performance of the models used by the quantitative managers in the portfolio. The non-U.S. developed equity component registered a strong return of 20.8 percent but underperformed its benchmark by 71 bps. Some of the largest managers in the portfolio struggled in 2013 due to a combination of stock selection and sector and country allocation decisions. The underperformance came after a strong 2012 amid a challenging market environment with large shifts in sector and style factor performance. In addition to stock selection, underweights in telecommunication services and consumer discretionary, the top performing sectors for the year, and overweight in consumer staples, had negatively impacted relative returns. The emergingmarketequityportfoliofinishedtheyearwith a negative return of 2.3 percent, marginally outperforming the benchmark by 6 bps. Figure 4.4showsthegeographicallocationofthepublicequity portfolio.
Overthe5-yearand10-yearperiods,theU.S.equityportfolioreturnedanannualized21.4percentand9.3percent,outperformingthebenchmarkby276bpsand140bps,respectively.These excess returns were primarily the result of superior stock selection by external managers.
-3.4
-3.9
7.0
6.5
5.3
5.6
-4 -2 0 2 4 6 8
10
Perc
ent (
%)
Actual return Benchmark return
Figure 4.3: Net Investment Performance Fixed Income Strategies
1-year
5-year 10-year
87%
3% 3%
7% North America
Europe
Asia (developed)
Rest of the world
Figure 4.2: Fixed Income Strategies by Geography
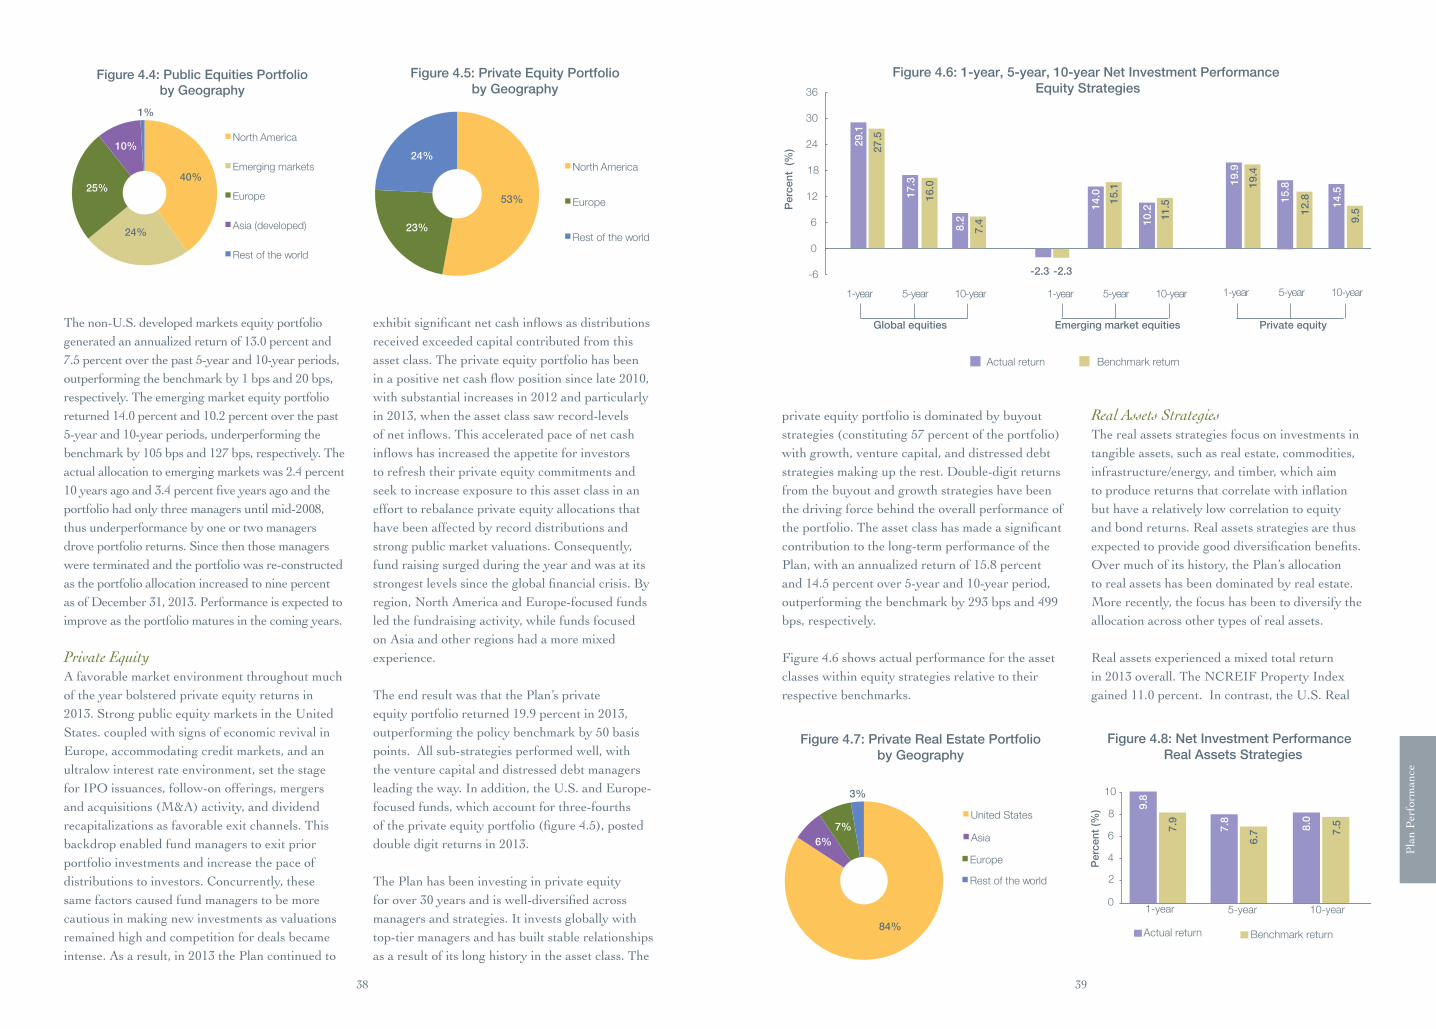
Plan
Per
form
ance
38 39
40%
24%
25%
10%
1%
North America
Emerging markets
Europe
Asia (developed)
Rest of the world
Figure 4.4: Public Equities Portfolio by Geography
53%
23%
24% North America
Europe
Rest of the world
Figure 4.5: Private Equity Portfolio by Geography
84%
6% 7%
3%
United States
Asia
Europe
Rest of the world
Figure 4.7: Private Real Estate Portfolio by Geography
9.8
7.9
7.8
6.7
8.0
7.5
0
4
6
8
10
Perc
ent (
%)
Actual return Benchmark return
Figure 4.8: Net Investment Performance Real Assets Strategies
1-year 10-year 5-year
2
The non-U.S. developed markets equity portfolio generated an annualized return of 13.0 percent and 7.5percentoverthepast5-yearand10-yearperiods,outperforming the benchmark by 1 bps and 20 bps, respectively. The emerging market equity portfolio returned14.0percentand10.2percentoverthepast5-yearand10-yearperiods,underperformingthebenchmarkby105bpsand127bps,respectively.Theactualallocationtoemergingmarketswas2.4percent10yearsagoand3.4percentfiveyearsagoandtheportfolio had only three managers until mid-2008, thus underperformance by one or two managers drove portfolio returns. Since then those managers were terminated and the portfolio was re-constructed as the portfolio allocation increased to nine percent as of December 31, 2013. Performance is expected to improve as the portfolio matures in the coming years.
Private EquityA favorable market environment throughout much of the year bolstered private equity returns in 2013. Strong public equity markets in the United States. coupled with signs of economic revival in Europe, accommodating credit markets, and an ultralow interest rate environment, set the stage for IPO issuances, follow-on offerings, mergers andacquisitions(M&A)activity,anddividendrecapitalizations as favorable exit channels. This backdrop enabled fund managers to exit prior portfolio investments and increase the pace of distributions to investors. Concurrently, these same factors caused fund managers to be more cautious in making new investments as valuations remained high and competition for deals became intense. As a result, in 2013 the Plan continued to
exhibitsignificantnetcashinflowsasdistributionsreceived exceeded capital contributed from this asset class. The private equity portfolio has been inapositivenetcashflowpositionsincelate2010,with substantial increases in 2012 and particularly in 2013, when the asset class saw record-levels ofnetinflows.Thisacceleratedpaceofnetcashinflowshasincreasedtheappetiteforinvestorsto refresh their private equity commitments and seek to increase exposure to this asset class in an effort to rebalance private equity allocations that have been affected by record distributions and strong public market valuations. Consequently, fund raising surged during the year and was at its strongestlevelssincetheglobalfinancialcrisis.Byregion, North America and Europe-focused funds led the fundraising activity, while funds focused on Asia and other regions had a more mixed experience.
The end result was that the Plan’s private equityportfolioreturned19.9percentin2013,outperformingthepolicybenchmarkby50basispoints. All sub-strategies performed well, with the venture capital and distressed debt managers leading the way. In addition, the U.S. and Europe-focused funds, which account for three-fourths oftheprivateequityportfolio(figure4.5),posteddouble digit returns in 2013.
The Plan has been investing in private equity forover30yearsandiswell-diversifiedacrossmanagers and strategies. It invests globally with top-tier managers and has built stable relationships as a result of its long history in the asset class. The
private equity portfolio is dominated by buyout strategies(constituting57percentoftheportfolio)with growth, venture capital, and distressed debt strategies making up the rest. Double-digit returns from the buyout and growth strategies have been the driving force behind the overall performance of theportfolio.Theassetclasshasmadeasignificantcontribution to the long-term performance of the Plan,withanannualizedreturnof15.8percentand14.5percentover5-yearand10-yearperiod,outperformingthebenchmarkby293bpsand499bps, respectively.
Figure4.6showsactualperformancefortheassetclasses within equity strategies relative to their respective benchmarks.
Real Assets StrategiesThe real assets strategies focus on investments in tangible assets, such as real estate, commodities, infrastructure/energy, and timber, which aim toproducereturnsthatcorrelatewithinflationbut have a relatively low correlation to equity and bond returns. Real assets strategies are thus expectedtoprovidegooddiversificationbenefits.Over much of its history, the Plan’s allocation to real assets has been dominated by real estate. More recently, the focus has been to diversify the allocation across other types of real assets.
Real assets experienced a mixed total return in 2013 overall. The NCREIF Property Index gained 11.0 percent. In contrast, the U.S. Real
-2.3 -2.3 -6
0
6
12
18
24
30
36
Perc
ent
(%)
Actual return Benchmark return
Figure 4.6: 1-year, 5-year, 10-year Net Investment Performance Equity Strategies Components
29.1
27
.5
17.3
16
.0
8.2
7.
4
14.0
15
.1
10.2
11
.5
19.9
19
.4
15.8
12.8
14.5
9.
5
1-year 5-year 10-year 1-year 5-year 10-year 1-year 5-year 10-year
Global equities Emerging market equities Private equity
-2.3 -2.3 -6
0
6
12
18
24
30
36
Perc
ent
(%)
Actual return Benchmark return
Figure 4.6: 1-year, 5-year, 10-year Net Investment Performance Equity Strategies
29.1
27
.5
17.3
16
.0
8.2
7.
4
14.0
15
.1
10.2
11
.5
19.9
19
.4
15.8
12.8
14.5
9.
5
1-year 5-year 10-year 1-year 5-year 10-year 1-year 5-year 10-year
Global equities Emerging market equities Private equity

Plan
Per
form
ance
40 41
34%
17% 8%
11%
30%
North America
Emerging markets
Europe
Asia (developed)
Global
Figure 4.9: Hedge Funds Portfolio by Geography
9.7 12
.5
6.9
5.5
4.7
1.5
0 2 4 6 8
10 12 14
Perc
ent
(%)
Actual return Benchmark return
1-year 10-year 5-year
Figure 4.10: Net Investment Performance Hedge Funds Portfolio
EstateInvestmentTrusts(REITs)hadalacklusterperformance due to the threat of rising interest rates, with the Dow Jones U.S. Select Real Estate Securities Total Return Index up only by 1.3 percent. Despite this lackluster performance in the U.S. REITs market, the overall real estate fundamentals in the United States remained strong for the year as vacancy rates declined and rents continued to grow modestly with employment and consumer spending picking up. The improving real estate fundamentals have been driven by the primary markets but the fundamentals are also improving across the secondary markets. Commodity markets, represented by the Dow Jones-UBS Commodity Index declined for the thirdyearinarowtocloseatnegative9.5percentin 2013. Other real assets, such as infrastructure/energy,benefitedfromtheever-growingdemandfor infrastructure development and resources around the world, while timber returns as shown bytheNCREIFTimberlandIndexposteda9.7percent return with much of the appreciation coming in the fourth quarter. Strong returns in the last quarter were mainly driven by the recovery inthehousingsectorbackedbylowinflationandimprovingemploymentandconsumerconfidence.
The Plan’s real assets portfolio—comprised primarily of real estate, timber and infrastructure—returned9.8percentin2013(figure4.8),outperformingthepolicybenchmarkby191basispoints.Amongitssub-strategies,privaterealestate(with84percentallocationintheUnitedStatesasinfigure4.7)exhibiteda positive return for the fourth consecutive year. Buoyed largely by an institutional appetite for high-quality, well-leased properties in core markets, private real estate generated a return of 10.8 percent, outperforming its benchmark by 133 bps. The real estate investment strategy in 2013 focused on making investments in value-add and opportunistic investments across the United States and Europe and balancing this exposure with U.S. debt that provides steady core-like returns with strongcashflowsandgooddownsideprotection.REITs gained 1.1 percent for the year, marginally underperforming their benchmark by 6 bps, primarily because of the portfolio’s overweight
in fundamentally strong companies that were outperformed by lesser-quality companies in 2013, but are expected to outperform on a risk-adjusted basis in the long term. The infrastructure/energyportfolioreturned15.0percentintheyear,outperformingitsbenchmarkby941bps,mostlybenefitingfromthegrowingdemandforinfrastructure development and natural resources around the world, operational improvements, and growth that led to rising valuations. Timber posted a6.5percentreturnin2013,outperformingitsbenchmarkby99bps,supportedbythesignsofeconomic recovery.
The real assets portfolio returned an annualized 7.8percentand8.0percentoverthe5-yearand10-year periods, outperforming its benchmark by 114bpsforthe5-yearperiodand44bpsforthe10-year period.
Absolute Return Strategies In CY13, the Plan’s hedge fund investments comprised two distinct sets of strategies: market neutral and directional. The market neutral strategies have limited exposure and correlation to equity, credit, and interest rates and are expected to generate cash plus a spread of 300 bps which isexpectedtobesufficienttomeettherequiredreal return target of the Plan over the medium to long term without taking directional market exposure and which aims to preserve capital in down markets. At the end of 2013, these strategies represented9.0percentofthetotalSRPassets.The directional hedge fund strategies take directional market exposure and are expected to outperform a combination of public equities and fixedincome.Attheendof2013,theallocationtothese directional managers was about 3.0 percent of SRP assets.
The market neutral portion of the portfolio returned6.5percentin2013,outperformingthe cash plus 300 basis points expectations for this set of strategies. Among the top performers intheportfoliowereequityfocusedandfixedincome relative value funds. Equity focused fundsbenefitedfromtheincreaseddispersioninglobalequitieswhilefixedincomearbitrage
funds took advantage of the increased volatility in rate markets after the surprise announcement of the Fed on its tapering of asset purchases. Multi-strategy managers also recorded strong performancebenefitingfromastrongoverallrelative value environment.
The directional hedge fund strategies in the portfoliobenefitedfromstrongreturnsofriskassets in developed markets, returning 18.7 percentfortheyear,outperformingits50/50stocks/bonds benchmark by more than 620 bps.
In CY13, the hedge fund portfolio allocation was tilted towards the market neutral strategies. Thus,whiletherespectivestrategies–marketneutralanddirectional–eachachievedreturnsthatexceeded expectations, the combined allocation underperformed the Plan’s policy benchmark by 284bps.
The inherent differences between market neutral and directional hedge fund strategies were a fundamental driver of the decision by the PFC in December 2013 to separate these activities. As a result, the policy portfolio now includes an allocation to absolute return strategies that is intended to be comprised of market neutral hedge funds. The proper evaluation of the performance of this portfolio is cash plus a spread (300 basis pointsinthiscase)andtheportfolioisexpectedto exhibit low or very little correlation with other major risk factors in the overall portfolio. It also was determined by the PFC that directional hedge fund strategies could be employed but that these
would be treated as out-of-policy investments that are most properly benchmarked and assessed against a combination of stocks and bonds.
Figure4.9showsthegeographicallocationofthehedgefundportfolioandfigure4.10showstheactual performance relative to the benchmark of the asset class.
Over the past 10 years, the hedge fund industry hasseensignificantchanges.Whilefundsthatemployed macro strategies to generate returns dominated the landscape in the early 2000s, today managers employ a broad range of strategies (equitylong/short,event,fixedincomearbitrage,creditlong/short,distressed,andsoforth)andgeographicfocus(dominatedbytheAmericas).For the SRP, the portfolio generated an annualized returnof6.9percentand4.7percentovera5-yearand 10-year period, outperforming its benchmark by 132 bps and 330 bps, respectively.

4342
App
endi
x I
& I
I
APPENDIX I
Committee Membership
APPENDIX II
A Primer on Valuing Pension Plan Liabilities
Pension Finance Committee Members
BertrandBadré(fromMarch2013)Managing Director and WBG Chief Financial Officer – Chair
CharlesA.McDonough(untilFebruary2013)Acting WBG Chief Financial Officer – Chair
Executive DirectorsPieroCipollone(untilNovember2013)
Roberto Tan
FrankHeemskerk(fromNovember2013)
Staff Association NomineesDavid WiltonManager, IFC
Giuliano Caloia Chief Credit Officer, IFC
1818 Society NomineesJeffrey Katz Retiree
JavedHamid(fromNovember2013)Retiree - Alternate
Members at LargeLakshmiShyam-Sunder(fromJuly2013)Vice President and WBG Chief Risk Officer
Jingdong Hua Vice President, Treasury & Syndications, IFC
Madelyn Antoncic Vice President and Treasurer, IBRD
Sudhir Krishnamurthi Retiree
Pension Finance AdministratorJohn F. Gandolfo Director and Chief Investment Officer, Pension and Endowments, IBRD
Pension Benefits Administration Committee Members
Sean Thomas McGrathVice President, Human Resources, IBRD – Chair
James T. Clagett Program Manager, IBRD – Deputy Chair
Executive DirectorsMarie-Lucie Morin (from February until December2013)
MansurMuhtar(fromFebruary2013)
MichaelThomasWillcock(fromFebruary2014)
Staff Association NomineesArdhanari RamaswamyManager, IFC
Lana BaderSenior Financial Officer, IBRD
1818 Society NomineesKhalidSiraj(fromJuly2013untilMarch2014)Retiree
NaderehChamlou(fromOctober2013)Retiree Members at LargeYvonneTsikata(untilSeptember2013)Sector Director, IBRD
HuaWan(fromFebruary2014)Senior Portfolio Manager, IBRD
Angela C. BishopSenior Financial Assistant, IBRD
Pension Benefits AdministratorSharada Sundar Manager, Pension Administration, IBRD
There are two components involved in determining the value of a pension plan’s
liabilities:(1)theexpectedfuturestreamofbenefitpayments underlying the liability calculation and (2)thediscountrateusedtodeterminethepresentvalueofthechosenbenefitcashflowstream—thatis,thevaluetodayofthefuturestreamofbenefitpayments.
BENEFIT CASH FLOW STREAMThebenefitcashflowstreamrepresentstheexpectedbenefitpaymentstobemadeineachfuture year after the valuation date. These are calculated by projecting the participant and retiree groups at the valuation date forward in time and allowingfortheprobabilityofthevariousbenefitcontingencies that can occur. For example, each year a certain proportion of retirees will pass away and a certain proportion of those will have spouses who will commence receiving a pension. Similarly, participants have various probabilities that they will leave the Bank in each future year withbenefitpaymentsdefinedinaccordancewiththebenefitrules,andtheseareprojectedforwardas well. These calculations are performed for each individualandaggregatedtoproducethebenefitcashflowsforthePlanasawholeandforvarioussubgroups, such as retirees, Gross Plan members, Net Plan members, and so forth. It is important to note that the projections at the individual level aredoneonan“expected”basis,sothateachparticipant/retireehasexpectedcashflowsineachfuture year that will be reasonable in aggregate, eventhoughinrealityeachindividual’sspecificcircumstances may vary from the aggregate assumptions.
Theprobabilitiesofthevariousbenefitcontingencies are derived from a set of assumptionscalledthe“actuarialbasis”.Examples of the assumptions are as follows:
§ The probability that a Net Plan male participantwillleavetheBankatage52with more than three years of service (three percent)
§ The rates of salary growth for staff aged 40(3.5percentreal,includingpromotionalgrowth)
§ The proportion of Net Plan retirees aged 54whowillchooselumpsumpaymentsatexit(15percent)
§ The probability that a female retiree aged 80willsurviveforoneyear(97.5percent),adjusted for longevity improvement.
These assumptions are derived from experience studies, most recently reviewed by the PFC in March2014coveringtheperiod2008-12,andthebenefitdesign,alsorecentlyrevisedandbrieflyalluded to in the Plan overview section of this report. Through the experience studies, the Plan’s actual experience during the covered period is compared to the various prevailing assumptions and any variations are observed. The assumptions are thenadjustedwhereappropriatetoreflectthelatestexperience, recognizing the accumulated history built into the existing basis. While the actuarial basis needs to be reasonably accurate, variations in individual assumptions will often offset each
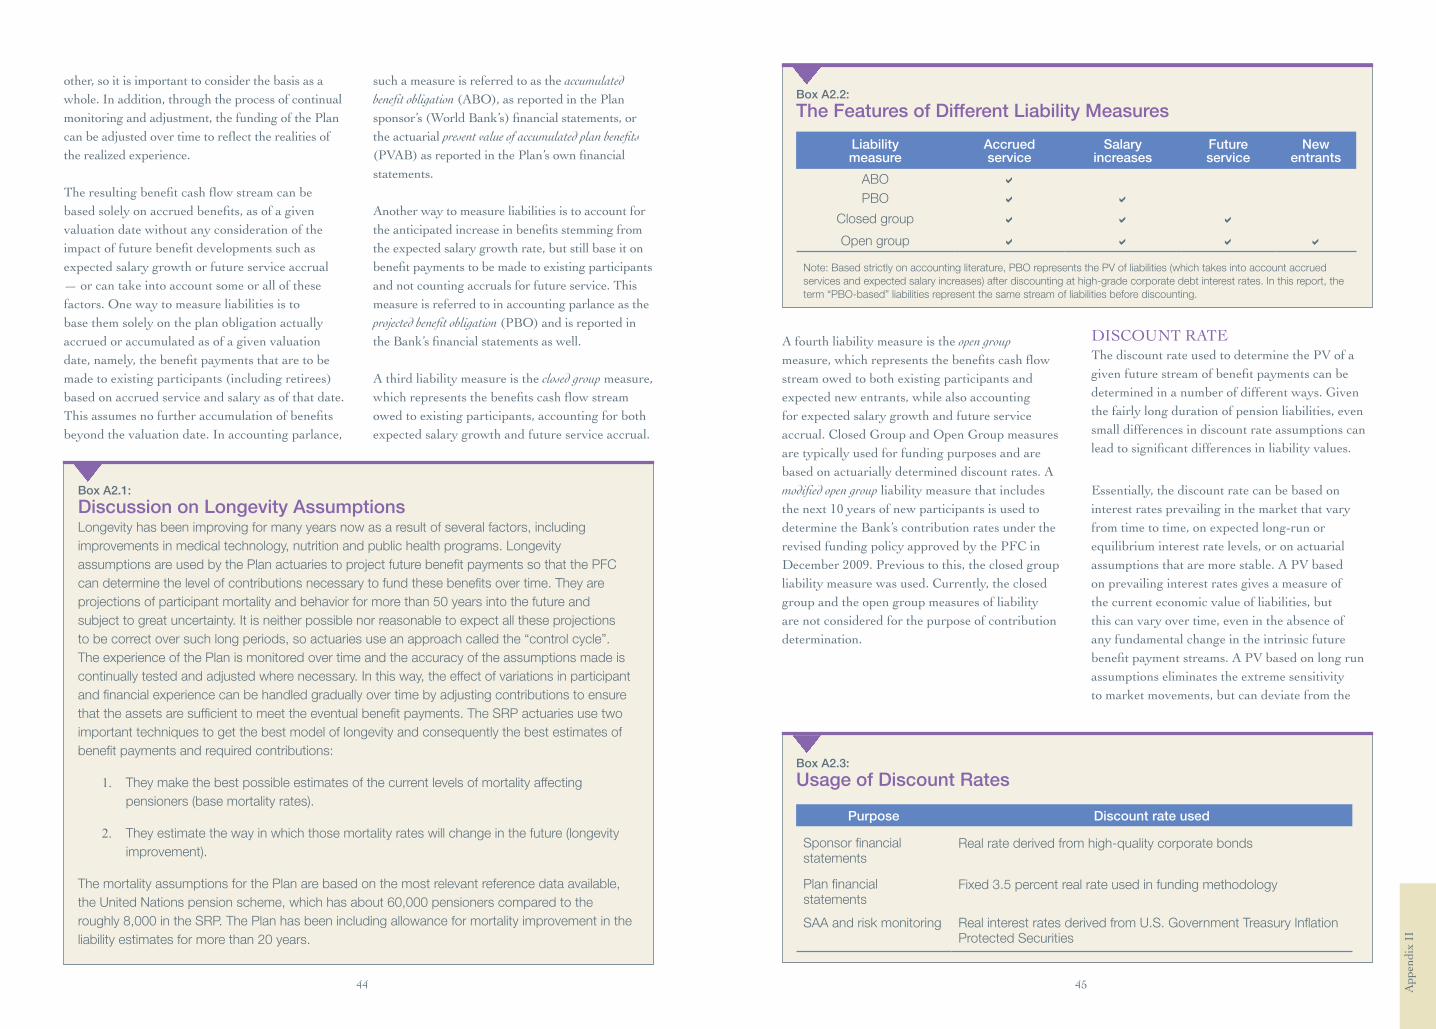
44 45 App
endi
x II
Box A2.1:
Discussion on Longevity AssumptionsLongevity has been improving for many years now as a result of several factors, including improvements in medical technology, nutrition and public health programs. Longevity assumptions are used by the Plan actuaries to project future benefit payments so that the PFC can determine the level of contributions necessary to fund these benefits over time. They are projections of participant mortality and behavior for more than 50 years into the future and subject to great uncertainty. It is neither possible nor reasonable to expect all these projections to be correct over such long periods, so actuaries use an approach called the “control cycle”. The experience of the Plan is monitored over time and the accuracy of the assumptions made is continually tested and adjusted where necessary. In this way, the effect of variations in participant and financial experience can be handled gradually over time by adjusting contributions to ensure that the assets are sufficient to meet the eventual benefit payments. The SRP actuaries use two important techniques to get the best model of longevity and consequently the best estimates of benefit payments and required contributions:
1. They make the best possible estimates of the current levels of mortality affecting pensioners (base mortality rates).
2. They estimate the way in which those mortality rates will change in the future (longevity improvement).
The mortality assumptions for the Plan are based on the most relevant reference data available, the United Nations pension scheme, which has about 60,000 pensioners compared to the roughly 8,000 in the SRP. The Plan has been including allowance for mortality improvement in the liability estimates for more than 20 years.
Box A2.2:
The Features of Different Liability Measures
Liability measure
Accrued service
Salary increases
Future service
New entrants
ABO
PBO
Closed group
Open group
Note: Based strictly on accounting literature, PBO represents the PV of liabilities (which takes into account accrued services and expected salary increases) after discounting at high-grade corporate debt interest rates. In this report, the term “PBO-based” liabilities represent the same stream of liabilities before discounting.
Box A2.3:
Usage of Discount Rates
Purpose Discount rate used
Sponsor financial statements
Real rate derived from high-quality corporate bonds
Plan financial statements
Fixed 3.5 percent real rate used in funding methodology
SAA and risk monitoring Real interest rates derived from U.S. Government Treasury Inflation Protected Securities
other, so it is important to consider the basis as a whole. In addition, through the process of continual monitoring and adjustment, the funding of the Plan canbeadjustedovertimetoreflecttherealitiesofthe realized experience.
Theresultingbenefitcashflowstreamcanbebasedsolelyonaccruedbenefits,asofagivenvaluation date without any consideration of the impactoffuturebenefitdevelopmentssuchasexpected salary growth or future service accrual — or can take into account some or all of these factors. One way to measure liabilities is to base them solely on the plan obligation actually accrued or accumulated as of a given valuation date,namely,thebenefitpaymentsthataretobemadetoexistingparticipants(includingretirees)based on accrued service and salary as of that date. Thisassumesnofurtheraccumulationofbenefitsbeyond the valuation date. In accounting parlance,
such a measure is referred to as the accumulated benefit obligation(ABO),asreportedinthePlansponsor’s(WorldBank’s)financialstatements,orthe actuarial present value of accumulated plan benefits (PVAB)asreportedinthePlan’sownfinancialstatements.
Another way to measure liabilities is to account for theanticipatedincreaseinbenefitsstemmingfromthe expected salary growth rate, but still base it on benefitpaymentstobemadetoexistingparticipantsand not counting accruals for future service. This measure is referred to in accounting parlance as the projected benefit obligation(PBO)andisreportedintheBank’sfinancialstatementsaswell.
A third liability measure is the closed group measure, whichrepresentsthebenefitscashflowstreamowed to existing participants, accounting for both expected salary growth and future service accrual.
A fourth liability measure is the open group measure,whichrepresentsthebenefitscashflowstream owed to both existing participants and expected new entrants, while also accounting for expected salary growth and future service accrual. Closed Group and Open Group measures are typically used for funding purposes and are based on actuarially determined discount rates. A modified open group liability measure that includes the next 10 years of new participants is used to determine the Bank’s contribution rates under the revised funding policy approved by the PFC in December2009.Previoustothis,theclosedgroupliability measure was used. Currently, the closed group and the open group measures of liability are not considered for the purpose of contribution determination.
DISCOUNT RATE The discount rate used to determine the PV of a givenfuturestreamofbenefitpaymentscanbedetermined in a number of different ways. Given the fairly long duration of pension liabilities, even small differences in discount rate assumptions can leadtosignificantdifferencesinliabilityvalues.
Essentially, the discount rate can be based on interest rates prevailing in the market that vary from time to time, on expected long-run or equilibrium interest rate levels, or on actuarial assumptions that are more stable. A PV based on prevailing interest rates gives a measure of the current economic value of liabilities, but this can vary over time, even in the absence of any fundamental change in the intrinsic future benefitpaymentstreams.APVbasedonlongrunassumptions eliminates the extreme sensitivity to market movements, but can deviate from the

46 47 App
endi
x II
I
APPENDIX III
Characteristics of Different Asset Classes
current economic value if the assumed long-term interest rates differ materially from the current prevailing rates.
In addition, the chosen discount rate can be based on relatively risk-free government securities, high-quality(butriskier)corporatebonds,orthe expected return assumptions underlying the plan’sassetallocation.BecausetheSRPbenefitsareindexedtoinflation,discountingoffuturebenefitpaymentsisdoneproperlyusingreal(thatis,inflation-adjusted)ratherthannominalinterestrates.
International Financial Reporting Standards and the Generally Accepted Accounting Principles in the United States specify discount rates that are to be used for calculating pension plan liabilities for different reporting purposes. At present, the SRP financialstatementsreportthePVABmeasureofliabilitiescalculatedusingthe3.5percentreallong-term expected return on plan assets. On the otherhand,fiscalyear-endfinancialstatementsof the Bank report the PBO liability using a discount rate based on prevailing high-quality (thatis,AA-rated)corporatebondyields,whichis the measure commonly used within the pension industry. Another liability measure that provides
FIXED INCOME STRATEGIESThese are investments in bonds (corporate or government),securitizedinstruments,TIPS,andother income-producing debt securities. Lower gradefixedincomesecuritiessuchascorporatebonds have a higher expected return in the long run than government bonds because of possible credit downgrades and default. The expected returnsandrisksonfixedincomesecuritiesaretypically low to moderate. In the SRP SAA, the allocation is primarily composed of high grade government bonds.
EQUITY STRATEGIESEquities or stocks signify an ownership position (equity)inacorporationandrepresentaclaimon a proportional share of the corporation’s assets andprofits.Equityholdersareresidualclaimantsand their claims thus carry higher risks, which arereflectedinthehighervolatilityofequityreturns. The higher risk causes equity investors to demandareturnpremiumoverlessriskybonds–the so-called equity risk premium. For long-term investors, stocks are traditionally an important asset class with respect to return enhancement.
The Plan distinguishes between two main broad categories within the equity strategies bucket:
Public equities include (1)globalequities- equities of companies in developed economies that are publiclytradedonastockexchangeand(2)emerging market equities - equities of companies in emerging market economies that are publicly traded on a stock exchange. These investments are riskier than developed public market equities, owing to their smaller size and the novelty of some national markets. This translates into lower liquidityandlesspriceefficiency.Emergingmarkets may also be more exposed to political
Box A2.4:
Assessing the Financial Position versus Funding a PlanBoth the ABO and the PBO account for accrued services only at the date of valuation. They are therefore indicated to assess the financial position – a comparison of the accumulated assets with the accumulated liabilities of a pension plan at a given date.
Moreover, the PBO takes account of the expected salary growth rate, giving the best liability measure on an ongoing basis, whereas the ABO, by ignoring expected future salary growth, provides a liability measure that reflects termination circumstances (termination of the sponsor entity). The PBO is by construction more conservative (larger) and therefore preferred to the ABO when assessing the financial position of an open plan. It is for instance the measure retained by the major accounting standards (U.S. GAAP, IFRS) to disclose a plan financial position in the sponsor’s financial statements, and the measure retained by the Bank to calculate its funded ratio.
The closed, open, and modified open group liability measures, that anticipate and account for expected future service accruals (for current or even future population) and that are based on a constant discount rate, are more appropriate for funding purposes.
useful information is based on risk-free real discountrates(thatis,TIPS-based).Thisliabilitymeasure is more conservative than those described above and illustrates the level of risk premia that is incorporated in the other liability measures. It is important to note that the discount rates underlying the risk-free and AA-based liabilities are market-based and consequently can vary substantially over time.
risks. For all of these reasons, investors usually require a higher risk premium than in developed equity markets.
Private equity includes equity investments in a company whose stocks are usually not publicly traded on an exchange. Investments are typically done through limited partnerships. These investments are illiquid and are expected to earn a premium over traditional securities such as publicly traded stocks and bonds. Once invested, it isdifficulttoaccessthemoney,whichislockedupin long-term investments that can last for 10 years or more. Cash is received as investments are sold. Limited partners typically have no right to demand that sales be made. Private equity investments includefinancingprivatecompanies(ventureandgrowth capital, leveraged buyouts of private or publiccompanies,anddistresseddebtinvesting).Investing in this asset class requires considerable due diligence and monitoring.
ABSOLUTE RETURN STRATEGIESThese instruments comprise many market strategies,includingmacro,fixedincomearbitrage,and equity fundamental and equity quantitative strategies. These strategies aim to have limited exposure and correlation with traditional market performance indicators such as equity, credit, and interest rates. Depending on the strategy, the diversificationbenefitsandrisk-returnefficiencycan vary. These strategies are most commonly utilized by hedge funds that are typically open to onlyalimitedrangeofqualifiedinvestors.Mosthedge funds invest in relatively liquid assets and permit investors to enter or leave the fund, usually requiring several months’ notice. As in the case of private equity, substantial due diligence is required, as the investment results are highly dependent on manager skill.
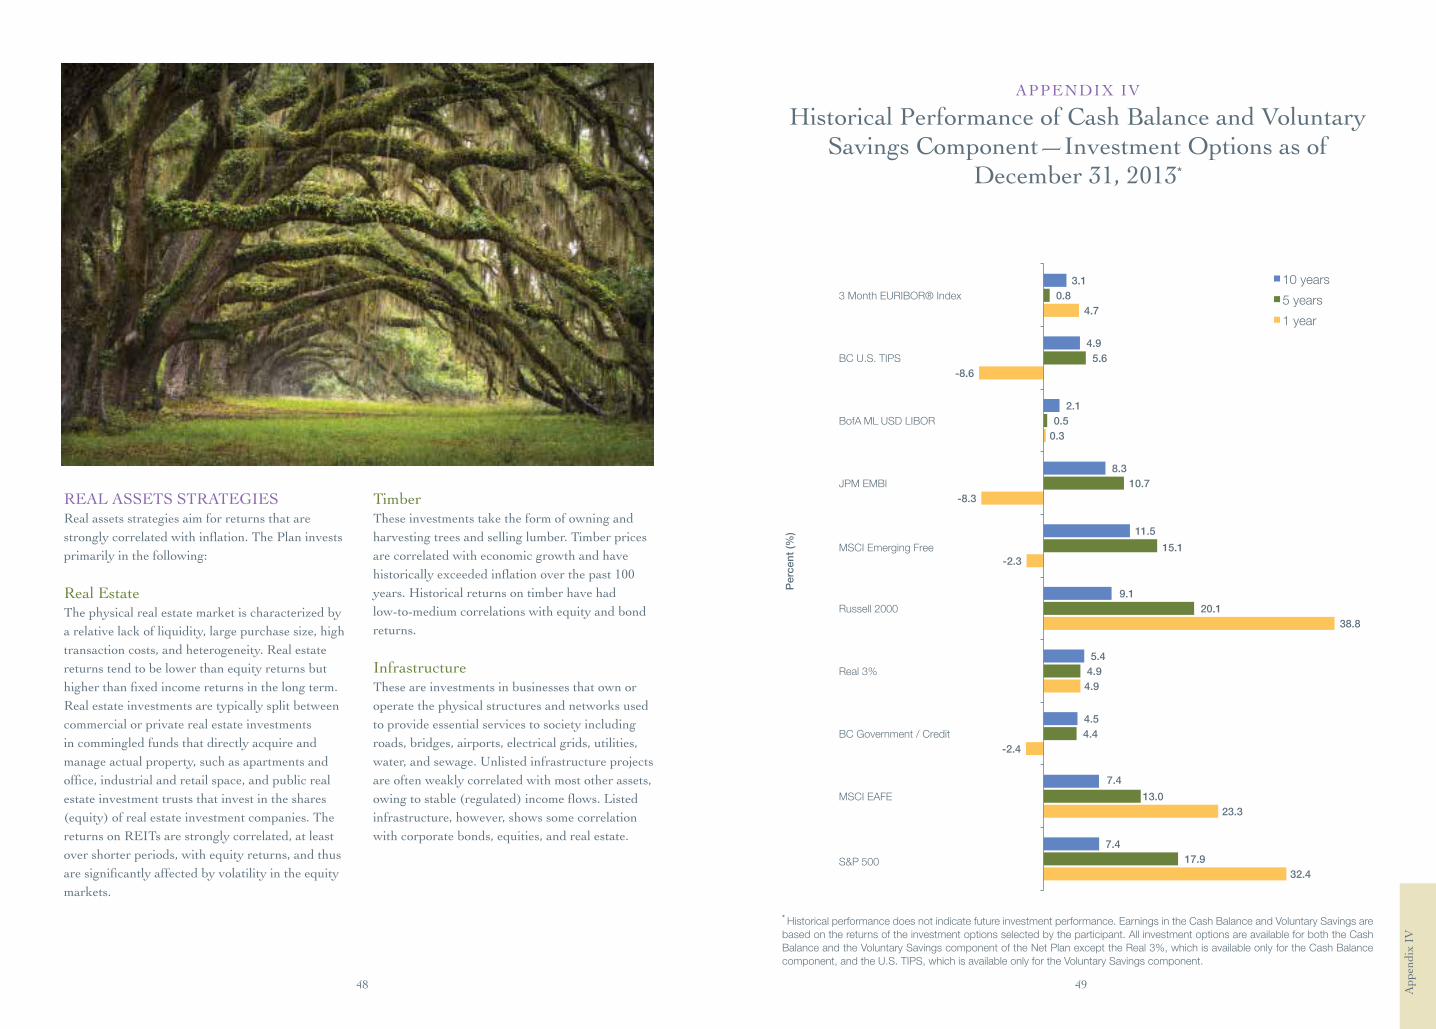
48 49 App
endi
x IV
APPENDIX IV
Historical Performance of Cash Balance and Voluntary Savings Component—Investment Options as of
December 31, 2013*
* Historical performance does not indicate future investment performance. Earnings in the Cash Balance and Voluntary Savings are based on the returns of the investment options selected by the participant. All investment options are available for both the Cash Balance and the Voluntary Savings component of the Net Plan except the Real 3%, which is available only for the Cash Balance component, and the U.S. TIPS, which is available only for the Voluntary Savings component.
32.4
23.3
-2.4
4.9
38.8
-2.3
-8.3
0.3
-8.6
4.7
17.9
13.0
4.4
4.9
20.1
15.1
10.7
0.5
5.6
0.8
7.4
7.4
4.5
5.4
9.1
11.5
8.3
2.1
4.9
3.1
S&P 500
MSCI EAFE
BC Government / Credit
Real 3%
Russell 2000
MSCI Emerging Free
JPM EMBI
BofA ML USD LIBOR
BC U.S. TIPS
3 Month EURIBOR® Index 10 years 5 years 1 year
Perc
ent (
%)
Historical Performance of Cash Balance and Voluntary Savings Component - Investment Options as of December 31, 2013*
REAL ASSETS STRATEGIESReal assets strategies aim for returns that are stronglycorrelatedwithinflation.ThePlaninvestsprimarily in the following:
Real Estate The physical real estate market is characterized by a relative lack of liquidity, large purchase size, high transaction costs, and heterogeneity. Real estate returns tend to be lower than equity returns but higherthanfixedincomereturnsinthelongterm.Real estate investments are typically split between commercial or private real estate investments in commingled funds that directly acquire and manage actual property, such as apartments and office,industrialandretailspace,andpublicrealestate investment trusts that invest in the shares (equity)ofrealestateinvestmentcompanies.Thereturns on REITs are strongly correlated, at least over shorter periods, with equity returns, and thus aresignificantlyaffectedbyvolatilityintheequitymarkets.
32.4
23.3
-2.4
4.9
38.8
-2.3
-8.3
0.3
-8.6
4.7
17.9
13.0
4.4
4.9
20.1
15.1
10.7
0.5
5.6
0.8
7.4
7.4
4.5
5.4
9.1
11.5
8.3
2.1
4.9
3.1
S&P 500
MSCI EAFE
BC Government / Credit
Real 3%
Russell 2000
MSCI Emerging Free
JPM EMBI
BofA ML USD LIBOR
BC U.S. TIPS
3 Month EURIBOR® Index 10 years 5 years 1 year
Perc
ent (
%)
Historical Performance of Cash Balance and Voluntary Savings Component - Investment Options as of December 31, 2013*
TimberThese investments take the form of owning and harvesting trees and selling lumber. Timber prices are correlated with economic growth and have historicallyexceededinflationoverthepast100years. Historical returns on timber have had low-to-medium correlations with equity and bond returns.
Infrastructure These are investments in businesses that own or operate the physical structures and networks used to provide essential services to society including roads, bridges, airports, electrical grids, utilities, water, and sewage. Unlisted infrastructure projects are often weakly correlated with most other assets, owingtostable(regulated)incomeflows.Listedinfrastructure, however, shows some correlation with corporate bonds, equities, and real estate.

50 51 App
endi
x V
APPENDIX V
Glossary of Terms
active management — A money-management approach based on informed, independent investment judgment, as opposed to passive management(indexing)whichseekstomatchtheperformance of the overall market (or some part ofit)bymirroringitscompositionorbybeingbroadlydiversified.
actuarial assumptions — Estimate of an uncertain variableinputintoafinancialmodel,normallyforthepurposesofcalculatingpremiumsorbenefits.For example, a common actuarial assumption relates to predicting a person’s lifespan, given their age, gender, health conditions and other factors.
annuity — Seriesofpaymentsatfixedintervals,guaranteedforafixednumberofyearsorthelifetime of one or more individuals.
asset liability management (ALM) — An asset management technique that explicitly incorporates liabilities when determining risk and return positioning.
basis points (bps) — A unit that is equal to 1/100th of one percent.
benchmark — Infinance,itrepresentsastandardagainst which the performance of a security, index or investor can be measured. In the case of the Plan, the short-term actual performance of each asset class is measured against the respective asset class benchmark and aggregated at the Plan level.
composite — A grouping of equities, indexes or other factors combined in a standardized way, providing a useful statistical measure of overall market or sector performance over time.
correlation — A statistical measure of how much the movement of two securities or asset classes are related. The range of possible correlations is between-1and+1.Aresultof-1meansaperfectnegativecorrelation,+1meansaperfectpositivecorrelation and 0 means no correlation at all. A positive correlation between two securities means that they tend to move up and down together.
counterparty risk — The risk to each party of a contract that the counterparty will not live up to its contractual obligations.
credit risk — The risk that an issuer or other counterparty to an investment or transaction will notfulfillitscontractualobligations.
custodian—Afinancialinstitutionthatholdscustomers’ securities for safekeeping so as to minimize the risk of their theft or loss.
deleveraging — A process undertaken by a company inanattempttoreduceitsfinancialleverage.
discount rate — The rate used to discount future cashflowstopresentvalue.
diversification — Infinance,spreadinginvestmentsamong many different types of assets less than perfectly correlated in order to reduce the overall volatility of the portfolio.
downside risk — An estimation of an investment’s potential to suffer a decline in value if the market conditions change. Downside risk explains a “worstcase”scenarioforaninvestment.
duration(abbreviatedfrommodifiedduration)— Thechangeinthevalueofafixedincomesecurityor liability that will result from a 1 percent change intherelevantinterestrate.Forexamplea5-yeardurationmeansthatvalueofthefixedincomesecuritywilldecreaseby5percentifinterestratesriseby1percentandincreaseinvalueby5percentif interest rates fall by 1 percent. Duration is stated in years because it is similar to the weighted averagetimeofthecashflowsunderlyingthesecurity or liability.
dynamic approach — A portfolio management strategy that involves rebalancing a portfolio so as to bring the asset mix back to its long-term policy. Such rebalancing would generally involve reducing positions in the best-performing asset class, while adding to positions in underperforming assets. The general premise of dynamic asset allocationistoreducethefluctuationrisksandachieve returns that exceed the policy benchmark.
ex-ante —Refers to anticipated future events, such as future returns or prospects of a company.
exogenous factors — Factors outside the control of the organization.
funded ratio — Measures the ratio of the current market value of assets against a measure of liabilitiesandisoneindicatorofthefinancialstrength of a pension fund’s ability to meet obligations to its members.
gross return — The total rate of return on an investment before the deduction of any fees or expenses.
hedge — Making an investment to reduce the risk of adverse price movements in an asset. Normally, a hedge consists of taking an offsetting position in a related security, such as a futures contract.
hurdle rate — The minimum rate of return on an investment required by a manager or investor.
investment horizon — The length of time a sum of money is expected to be invested. The length of the investment horizon depends on when and how much money will be needed and the horizon influencestheoptimalassetallocation.
investment policy — A document drafted between a portfolio manager and a client that outlines general rules for the manager. This statement provides the general investment goals and objectives of a client and describes the strategies that the manager shouldemploytomeettheseobjectives.Specificinformation on matters such as asset allocation, risk tolerance, and liquidity requirements would also be included in an Investment Policy.
liability-informed investment — In a liability-informed investment framework there is a closer link between the investment of the assets and theliabilities.Morespecifically,theliabilitiesaretaken into account when designing the investment strategy as the underlying characteristics of the liabilities and their expected behavior over time are used as the basis for allocating investment risk and for assessing the risk/return trade-offs of various investment alternatives.
liquidity risk — The risk stemming from the lack of marketability of an investment that cannot be bought or sold quickly enough to prevent or minimize a loss.
Long-Term Real Return Objective—Benefitsarefunded by assets, contributions, and investment returns. The linkage between funding and investmentpoliciesisthe3.5percentrealdiscountrate that is used to assess whether investment returns are meeting funding policy assumptions. In turn, this rate constitutes the long-term objective or hurdle rate for Plan assets and is referred to as the Plan’s Long-Term Real Return Objective.
net return — The investment returns after deducting investment management fees from the gross return.
52 53 App
endi
x V
I
APPENDIX VI
Actuarial Valuation Results Letter
485 Lexington Avenue • New York, NY 10017 212.330.1000 • 212.330.1166 (fax)
July 3, 2014
Mr. Charles Harrison The World Bank Group 1225 Connecticut Avenue NW MSN C5-502 Washington, DC 20433
Re: Final Results of the Actuarial Valuation of the Staff Retirement Plan as of January 1, 2014
Dear Mr. Harrison:
We have prepared the valuation of the Staff Retirement Plan (SRP) as of January 1, 2014, and are writing to present the results. These results are based on final asset information provided by the Bank on June 23 and June 27, and census data provided by the Bank on February 6.
DATA
The following table summarizes the data included in both the current and previous valuations:
Data as of 1/1/2013*
Data as of 1/1/2014*
Percentage Increase
Number of active participants 14,817 15,482 4.5% Annual net remuneration $ 1,466,369,960 $ 1,554,736,897 6.0% Number of participants not
in contributory service 161 155 -3.7% Number of retired participants,
terminated participants entitled to deferred pension, and beneficiaries 8,793 9,058 3.0%
Annual pensions $ 583,415,807 $ 613,928,496 5.2% Present assets of the Plan: At market value $15,996,696,000 $ 17,249,402,000 7.8% At adjusted value $15,399,591,153 $ 16,712,310,593 8.5%
* Based on final values
nominal return — The investment’s rate of return adjustedforinflation.
Plan document — The governing document of the Staff Retirement Plan and Trust of the International Bank for Reconstruction and Development as adopted by the Executive Directors of IBRD, and as from time to time amended and restated.
plan sponsor — The organization that sets up a retirementplanforthebenefitoftheorganization’semployees. The responsibilities of the plan sponsor include determining membership parameters, investment choices and providing contribution payments.
portfolio rebalancing — A process of realigning the weightings of portfolio’s assets. It involves periodically buying or selling assets in the portfolio to maintain the original desired level of asset allocation.
present value — The current value of one or more future cash payments, discounted at some appropriate interest rate.
real return — The investment’s rate of return minus theinflationaryfactor.
real yields — An interest rate that has been adjusted toremovetheeffectsofinflationtoreflecttherealyield.
risk budgeting — A framework that helps maximize the expected return for a given level of overall portfolio risk by budgeting proportions of the total portfolio risk to its various components.
risk premium — The reward for holding a risky investment rather than a risk-free one.
risk tolerance — The degree of uncertainty that an investor can handle in regard to changes in the value of his or her portfolio compared to expectation.
standard deviation — A measure of the dispersion of the actual values of a variable around the expected values.Itisdefinedasthesquarerootofthevariance.Infinance,thestandarddeviationisarepresentation of the risk associated with a given security, or the risk of a portfolio of securities.
strategic asset allocation — The process of dividing the investments among different kinds of assets in order to optimize the risk/reward trade-off based onaninstitution’sspecificsituationandgoalsin order to maintain a long-term goal for asset allocation.
surplus volatility — It is a measure of the volatility in the funded ratio calculated as the square root of the variance of the plan surplus (the difference betweentheassetsandtheliabilitiesoftheplan).
trustee — A company, individual or institution thatholdsoradministersassetsforthebenefitofa third party. It is trusted to make decisions in the beneficiary’sbestinterests.

54 55 App
endi
x V
I
Mr. Charles Harrison July 3, 2014 Page 2
METHODOLOGY
The valuation was based on the Plan provisions in effect on January 1, 2014. The following changes were adopted by the Bank in December 2013 and are reflected in this year’s valuation results.
Plan Provisions
The following plan design changes will be implemented as follows:
Effective January 1, 2015:
• Staff contributions for the Net Plan will be restructured from a fixed, mandatory contribution of 5 percent to include an additional voluntary contribution of up to 6 percent, for a maximum total staff contribution of 11 percent of net salaries. For valuation purposes, we have assumed that 100 percent of Net Plan participants will choose to contribute the maximum 11 percent.
• A survivor’s benefit providing lifetime annuities for spouses or domestic partners of active Net Plan participants (in lieu of a lump sum death benefit) along with a child survivor benefit will be introduced for Net Plan participants.
• For service rendered after the change date only, the SRP’s grossing-up formula for the Gross Plan will be revised to reflect current tax rates.
Effective December 31, 2015:
• The Mandatory Retirement Age (MRA) for all current and future staff will increase to age 67 and the Normal Retirement Age (NRA) for future staff will increase to age 65. The NRA for current staff will remain at age 62.
• Gross Plan accruals will cease at age 62 and will increase by CPI until retirement.
Demographic Assumptions
In March 2014, the Pension Finance Committee approved several changes to the actuarial assumptions for the valuation as of January 1, 2014, reflecting Plan experience observed from 2008 - 2012. The following key changes were made:
• Reduction in the salary scale at most ages • Revision of withdrawal rates for the Gross and Net Plans, as appropriate • Reductions in Net Plan early retirement rates • Adjustment of the fixed retirement age from 62 to 65 for the Net Plan • Changes in the assumed form of payment (annuity vs. lump sum cashout or commutation) for
Gross and Net Plan benefits (retirement and termination) • Reductions in the rates of death in active service • Updates to the salary, age, and sex distributions for future new entrants
Mr. Charles Harrison July 3, 2014 Page 3
Economic Assumptions
In March 2014, the Pension Finance Committee approved changes to the economic assumptions for the valuation as of January 1, 2014. The assumption changes are:
• A reduction of the long-term inflation assumption from 4.00% to 2.50% • A change from using expected inflation to actual inflation to compute the expected asset return
for the actuarial value of assets, for years after January 1, 2014.
The revised summary of actuarial assumptions is shown in Appendix A of this letter.
All other actuarial methods and assumptions remained the same as those used in the prior valuation as of January 1, 2013, including the 3.50% real rate of return assumption. Thus, the resulting nominal asset return was reduced from 7.50% to 6.00%.
The funding method, referred to as the 10-Year hybrid aggregate funding method, was first effective with the valuation as of January 1, 2010. Under this method, it is intended that contributions on account of current participants and those hired in the next 10 years will be made as a level percentage of payroll.
RESULTS
The results in the form of a valuation balance sheet are presented in the attached Table I.
The principal results of this valuation, together with the results produced last year, are shown below. The closed-group funding results are shown only for comparison purposes.
BANK CONTRIBUTION RATES*
Date of Valuation Closed-Group Funding Method Basis
Valuation Funding Method Basis**
January 1, 2013 (FY 2014) 20.66% 20.73%***
January 1, 2014 (FY 2015) 17.04% 18.90%***
* Contribution rates are expressed as a percentage of net salaries.
** The Valuation basis includes future new participants entering service over the next 10 years.
*** The theoretical contribution rates of 20.73% and 18.90% are based on final asset values as of January 1, 2013, and January 1, 2014, respectively. For Fiscal Year 2014, the Bank actually contributed at 20.88%, which was the rate determined based on preliminary asset values and approved by the Pension Finance Committee in its May 2013 meeting. For Fiscal Year 2015, at its May 2014 meeting, the PFC approved a contribution rate of 18.98% of net salaries, which was the rate determined based on preliminary asset values.
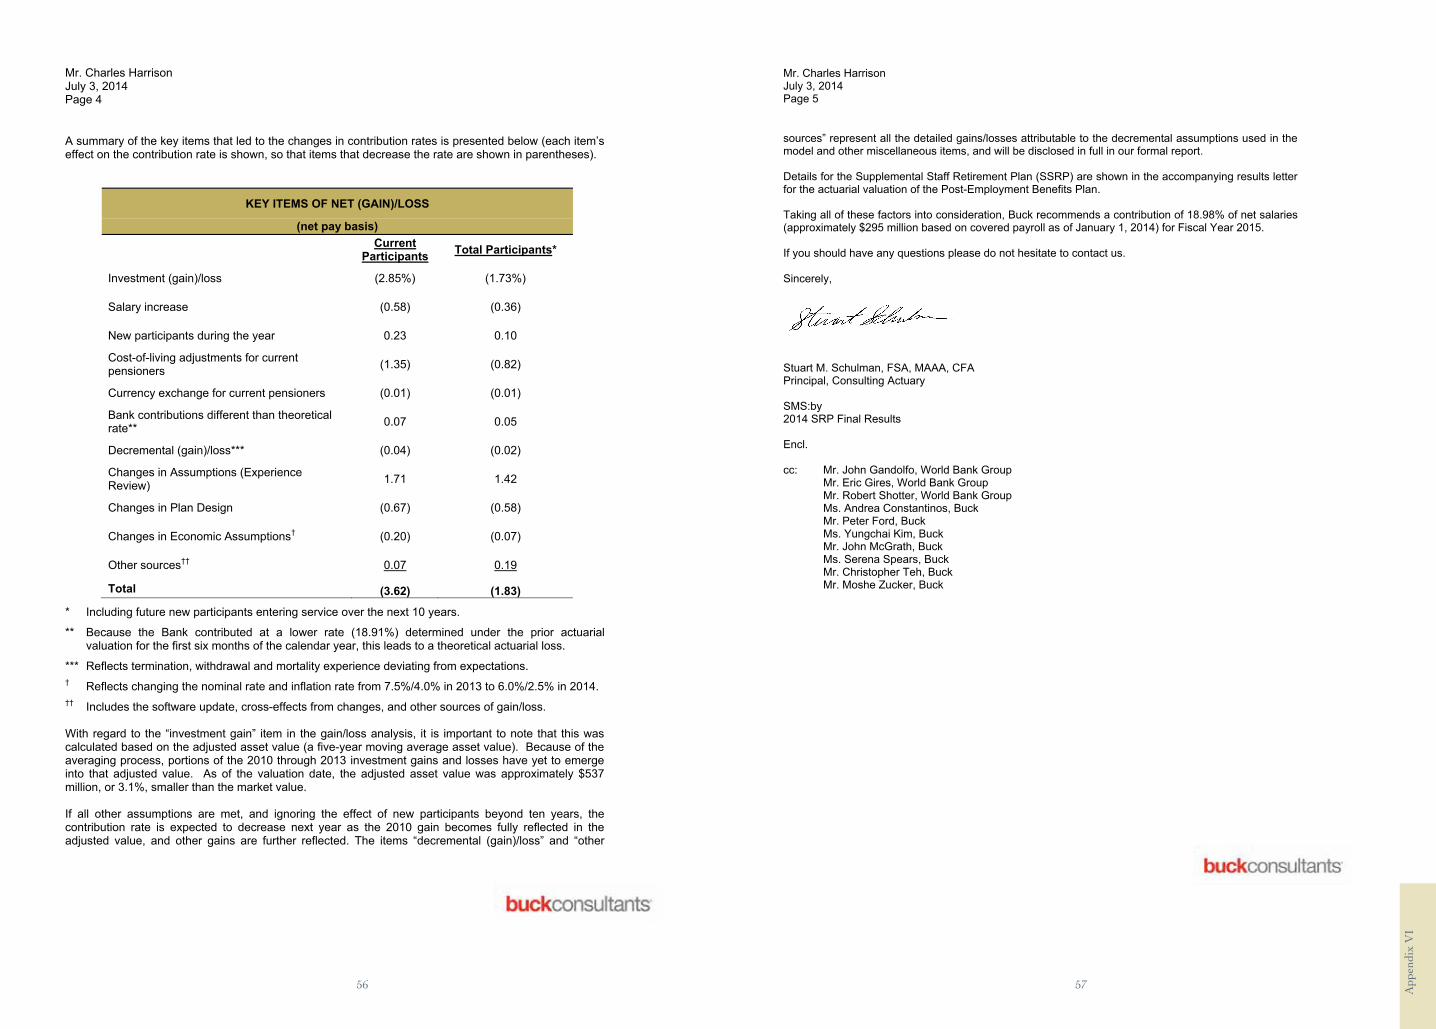
56 57 App
endi
x V
I
Mr. Charles Harrison July 3, 2014 Page 4
A summary of the key items that led to the changes in contribution rates is presented below (each item’s effect on the contribution rate is shown, so that items that decrease the rate are shown in parentheses).
KEY ITEMS OF NET (GAIN)/LOSS
(net pay basis) Current
Participants Total Participants*
Investment (gain)/loss (2.85%) (1.73%)
Salary increase (0.58) (0.36)
New participants during the year 0.23 0.10
Cost-of-living adjustments for current pensioners (1.35) (0.82)
Currency exchange for current pensioners (0.01) (0.01)
Bank contributions different than theoretical rate** 0.07 0.05
Decremental (gain)/loss*** (0.04) (0.02)
Changes in Assumptions (Experience Review) 1.71 1.42
Changes in Plan Design (0.67) (0.58)
Changes in Economic Assumptions† (0.20) (0.07)
Other sources†† 0.07 0.19
Total (3.62) (1.83)
* Including future new participants entering service over the next 10 years.
** Because the Bank contributed at a lower rate (18.91%) determined under the prior actuarial valuation for the first six months of the calendar year, this leads to a theoretical actuarial loss.
*** Reflects termination, withdrawal and mortality experience deviating from expectations. † Reflects changing the nominal rate and inflation rate from 7.5%/4.0% in 2013 to 6.0%/2.5% in 2014. †† Includes the software update, cross-effects from changes, and other sources of gain/loss.
With regard to the “investment gain” item in the gain/loss analysis, it is important to note that this was calculated based on the adjusted asset value (a five-year moving average asset value). Because of the averaging process, portions of the 2010 through 2013 investment gains and losses have yet to emerge into that adjusted value. As of the valuation date, the adjusted asset value was approximately $537 million, or 3.1%, smaller than the market value.
If all other assumptions are met, and ignoring the effect of new participants beyond ten years, the contribution rate is expected to decrease next year as the 2010 gain becomes fully reflected in the adjusted value, and other gains are further reflected. The items “decremental (gain)/loss” and “other
Mr. Charles Harrison July 3, 2014 Page 5
sources” represent all the detailed gains/losses attributable to the decremental assumptions used in the model and other miscellaneous items, and will be disclosed in full in our formal report.
Details for the Supplemental Staff Retirement Plan (SSRP) are shown in the accompanying results letter for the actuarial valuation of the Post-Employment Benefits Plan.
Taking all of these factors into consideration, Buck recommends a contribution of 18.98% of net salaries (approximately $295 million based on covered payroll as of January 1, 2014) for Fiscal Year 2015.
If you should have any questions please do not hesitate to contact us.
Sincerely,
Stuart M. Schulman, FSA, MAAA, CFA Principal, Consulting Actuary
SMS:by2014 SRP Final Results
Encl.
cc: Mr. John Gandolfo, World Bank Group Mr. Eric Gires, World Bank Group Mr. Robert Shotter, World Bank Group Ms. Andrea Constantinos, Buck Mr. Peter Ford, Buck
Ms. Yungchai Kim, Buck Mr. John McGrath, Buck
Ms. Serena Spears, Buck Mr. Christopher Teh, Buck
Mr. Moshe Zucker, Buck
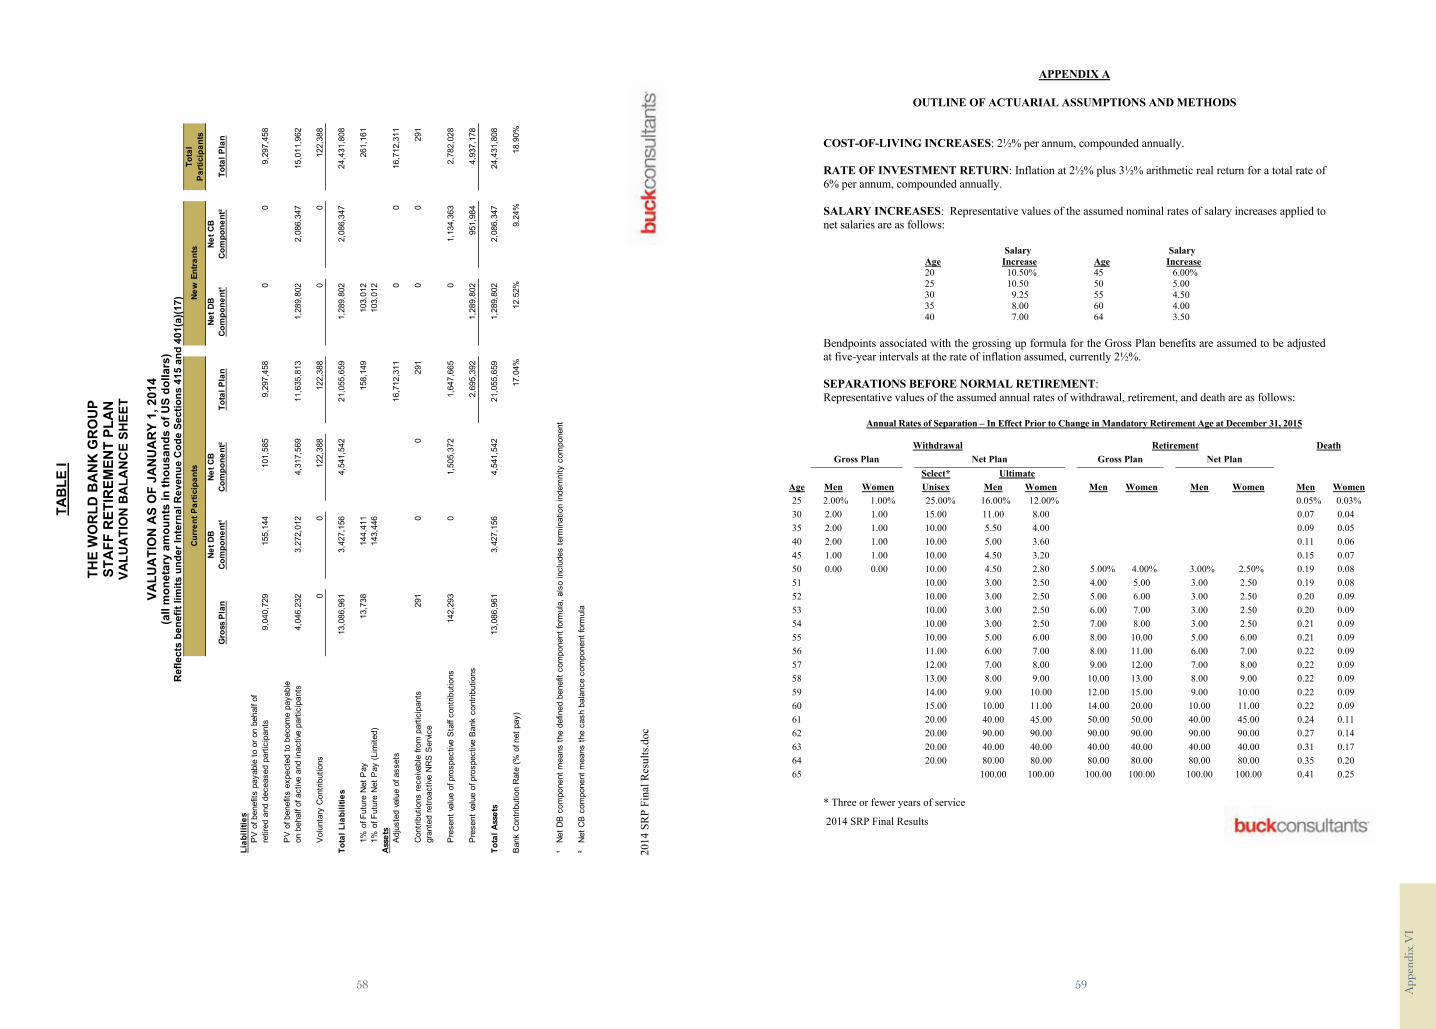
58 59 App
endi
x V
I
2014
SR
P Fi
nal R
esul
ts.d
oc
TAB
LE I
THE
WO
RLD
BA
NK
GR
OU
P ST
AFF
RET
IREM
ENT
PLA
N
VALU
ATI
ON
BA
LAN
CE
SHEE
T
VALU
ATI
ON
AS
OF
JAN
UA
RY
1, 2
014
(all
mon
etar
y am
ount
s in
thou
sand
s of
US
dolla
rs)
Ref
lect
s be
nefit
lim
its u
nder
Inte
rnal
Rev
enue
Cod
e Se
ctio
ns 4
15 a
nd 4
01(a
)(17)
Cur
rent
Par
ticip
ants
New
Ent
rant
sTo
tal
Part
icip
ants
Net D
BNe
t CB
Net D
BN
et C
BG
ross
Pla
nCo
mpo
nent
¹Co
mpo
nent
²To
tal P
lan
Com
pone
nt¹
Com
pone
nt²
Tota
l Pla
n
Liab
ilitie
sP
V o
f ben
efits
pay
able
to o
r on
beha
lf of
re
tired
and
dec
ease
d pa
rtici
pant
s9,
040,
729
15
5,14
4
10
1,58
5
9,
297,
458
0
0
9,
297,
458
PV
of b
enef
its e
xpec
ted
to b
ecom
e pa
yabl
eon
beh
alf o
f act
ive a
nd in
activ
e pa
rtici
pant
s4,
046,
232
3,
272,
012
4,
317,
569
11
,635
,813
1,
289,
802
2,
086,
347
15
,011
,962
Vol
unta
ry C
ontri
butio
ns0
0
12
2,38
8
12
2,38
8
0
0
12
2,38
8
Tota
l Lia
bilit
ies
13,0
86,9
61
3,42
7,15
6
4,54
1,54
2
21,0
55,6
59
1,28
9,80
2
2,08
6,34
7
24,4
31,8
08
1% o
f Fut
ure
Net
Pay
13,7
38
144,
411
158,
149
103,
012
261,
161
1% o
f Fut
ure
Net
Pay
(Lim
ited)
143,
446
103,
012
Ass
ets
Adj
uste
d va
lue
of a
sset
s16
,712
,311
0
0
16
,712
,311
Con
tribu
tions
rece
ivabl
e fro
m p
artic
ipan
ts29
1
0
0
29
1
0
0
29
1
gr
ante
d re
troac
tive
NR
S S
ervic
e
Pre
sent
val
ue o
f pro
spec
tive
Sta
ff co
ntrib
utio
ns14
2,29
3
0
1,
505,
372
1,
647,
665
0
1,
134,
363
2,
782,
028
Pre
sent
val
ue o
f pro
spec
tive
Ban
k co
ntrib
utio
ns2,
695,
392
1,
289,
802
95
1,98
4
4,
937,
178
Tota
l Ass
ets
13,0
86,9
61
3,42
7,15
6
4,54
1,54
2
21,0
55,6
59
1,28
9,80
2
2,08
6,34
7
24,4
31,8
08
Ban
k C
ontri
butio
n R
ate
(% o
f net
pay
)17
.04%
12.5
2%9.
24%
18.9
0%
¹N
et D
B c
ompo
nent
mea
ns th
e de
fined
ben
efit
com
pone
nt fo
rmul
a, a
lso
incl
udes
term
inat
ion
inde
mni
ty c
ompo
nent
²N
et C
B c
ompo
nent
mea
ns th
e ca
sh b
alan
ce c
ompo
nent
form
ula
2014 SRP Final Results
APPENDIX A
OUTLINE OF ACTUARIAL ASSUMPTIONS AND METHODS
COST-OF-LIVING INCREASES: 2½% per annum, compounded annually.
RATE OF INVESTMENT RETURN: Inflation at 2½% plus 3½% arithmetic real return for a total rate of 6% per annum, compounded annually.
SALARY INCREASES: Representative values of the assumed nominal rates of salary increases applied to net salaries are as follows:
Salary Salary Age Increase Age Increase 20 10.50% 45 6.00% 25 10.50 50 5.00 30 9.25 55 4.50 35 8.00 60 4.00 40 7.00 64 3.50
Bendpoints associated with the grossing up formula for the Gross Plan benefits are assumed to be adjusted at five-year intervals at the rate of inflation assumed, currently 2½%.
SEPARATIONS BEFORE NORMAL RETIREMENT:Representative values of the assumed annual rates of withdrawal, retirement, and death are as follows:
Annual Rates of Separation – In Effect Prior to Change in Mandatory Retirement Age at December 31, 2015
Withdrawal Retirement Death Gross Plan Net Plan Gross Plan Net Plan Select* Ultimate
Age Men Women Unisex Men Women Men Women Men Women Men Women25 2.00% 1.00% 25.00% 16.00% 12.00% 0.05% 0.03%30 2.00 1.00 15.00 11.00 8.00 0.07 0.04 35 2.00 1.00 10.00 5.50 4.00 0.09 0.05 40 2.00 1.00 10.00 5.00 3.60 0.11 0.06 45 1.00 1.00 10.00 4.50 3.20 0.15 0.07 50 0.00 0.00 10.00 4.50 2.80 5.00% 4.00% 3.00% 2.50% 0.19 0.08 51 10.00 3.00 2.50 4.00 5.00 3.00 2.50 0.19 0.08 52 10.00 3.00 2.50 5.00 6.00 3.00 2.50 0.20 0.09 53 10.00 3.00 2.50 6.00 7.00 3.00 2.50 0.20 0.09 54 10.00 3.00 2.50 7.00 8.00 3.00 2.50 0.21 0.09 55 10.00 5.00 6.00 8.00 10.00 5.00 6.00 0.21 0.09 56 11.00 6.00 7.00 8.00 11.00 6.00 7.00 0.22 0.09 57 12.00 7.00 8.00 9.00 12.00 7.00 8.00 0.22 0.09 58 13.00 8.00 9.00 10.00 13.00 8.00 9.00 0.22 0.09 59 14.00 9.00 10.00 12.00 15.00 9.00 10.00 0.22 0.09 60 15.00 10.00 11.00 14.00 20.00 10.00 11.00 0.22 0.09 61 20.00 40.00 45.00 50.00 50.00 40.00 45.00 0.24 0.11 62 20.00 90.00 90.00 90.00 90.00 90.00 90.00 0.27 0.14 63 20.00 40.00 40.00 40.00 40.00 40.00 40.00 0.31 0.17 64 20.00 80.00 80.00 80.00 80.00 80.00 80.00 0.35 0.20 65 100.00 100.00 100.00 100.00 100.00 100.00 0.41 0.25
* Three or fewer years of service
60 61 App
endi
x V
I
2014 SRP Final Results 2
Annual Rates of Separation - In Effect With Change in Mandatory Retirement Age at December 31, 2015
Withdrawal Retirement Death Gross Plan Net Plan Gross Plan Net Plan Select* Ultimate
Age Men Women Unisex Men Women Men Women Men Women Men Women25 2.00% 1.00% 25.00% 16.00% 12.00% 0.05% 0.03% 30 2.00 1.00 15.00 11.00 8.00 0.07 0.04 35 2.00 1.00 10.00 5.50 4.00 0.09 0.05 40 2.00 1.00 10.00 5.00 3.60 0.11 0.06 45 1.00 1.00 10.00 4.50 3.20 0.15 0.07 50 0.00 0.00 10.00 4.50 2.80 5.00% 4.00% 3.00% 2.50% 0.19 0.08 51 10.00 3.00 2.50 4.00 5.00 3.00 2.50 0.19 0.08 52 10.00 3.00 2.50 5.00 6.00 3.00 2.50 0.20 0.09 53 10.00 3.00 2.50 6.00 7.00 3.00 2.50 0.20 0.09 54 10.00 3.00 2.50 7.00 8.00 3.00 2.50 0.21 0.09 55 10.00 5.00 6.00 8.00 10.00 5.00 6.00 0.21 0.09 56 11.00 6.00 7.00 8.00 11.00 6.00 7.00 0.22 0.09 57 12.00 7.00 8.00 9.00 12.00 7.00 8.00 0.22 0.09 58 13.00 8.00 9.00 10.00 13.00 8.00 9.00 0.22 0.09 59 14.00 9.00 10.00 12.00 15.00 9.00 10.00 0.22 0.09 60 15.00 10.00 11.00 14.00 20.00 10.00 11.00 0.22 0.09 61 20.00 40.00 45.00 50.00 50.00 40.00 45.00 0.24 0.11 62 20.00 40.00 40.00 90.00 90.00 40.00 40.00 0.27 0.14 63 20.00 40.00 40.00 40.00 40.00 40.00 40.00 0.31 0.17 64 20.00 80.00 80.00 80.00 80.00 80.00 80.00 0.35 0.20 65 20.00 80.00 80.00 80.00 80.00 80.00 80.00 0.41 0.25 66 20.00 80.00 80.00 80.00 80.00 80.00 80.00 0.48 0.31 67 100.00 100.00 100.00 100.00 0.55 0.37
Disability separation rates are assumed to be 0% at all ages.
PERCENTAGE OF GROSS PLAN PARTICIPANTS RETIRING WHO ELECT TO COMMUTE BENEFITS: 10% (50% of Gross Plan participants commute 20% of their benefit)
PERCENTAGE OF GROSS PLAN PARTICIPANTS WITHDRAWING AFTER 3 YEARS OF SERVICE WHO ELECT LUMP SUM BENEFITS: 0%
PERCENTAGE OF NET PLAN PARTICIPANTS RETIRING WHO ELECT TO TAKE THEIR CASH BALANCE BENEFIT AS A LUMP SUM: 40%
PERCENTAGE OF NET PLAN PARTICIPANTS RETIRING WHO ELECT TO TAKE THEIR DEFINED BENEFIT AS A LUMP SUM: 15%
PERCENTAGE OF NET PLAN PARTICIPANTS WITHDRAWING AFTER 10 YEARS OF SERVICE WHO ELECT TO TAKE THEIR DEFINED BENEFIT AS A LUMP SUM: 40%
2014 SRP Final Results 3
DEATHS AFTER RETIREMENT:
Annual Rates at Illustrative Ages*
Age Male Female 50 0.28% 0.10% 55 0.36 0.10 60 0.38 0.23 65 0.61 0.46 70 1.18 0.86 75 2.22 1.50 80 4.10 2.59 85 7.48 4.55 90 13.41 8.23
* These rates are the baseline rates as of January 1, 2007. The forecasting methodology assumes that future mortality improvements are a function of (a) an individual’s attained age and (b) the calendar year.
The mortality improvements are assumed as follows:
Annual Rates of Mortality Reduction at Illustrative Ages
Age Annual Reduction Male Female
50 2.00% 2.00% 55 2.00 2.00 60 2.00 2.00 65 2.00 1.67 70 2.00 1.33 75 1.60 1.00 80 1.20 0.67 85 0.80 0.33 90 0.40 0.00
95 and over 0.00 0.00
CHILDREN’S BENEFITS (applied to only Gross Plan prior to January 1, 2015 and to both Gross and Net Plan from January 1, 2015 and on): Married participants are assumed to have two children, born at the participants’ age 30 and 35. Unmarried participants are assumed to have ¼ child at age 30 and ¼ child at age 35. Children are assumed to receive benefits on the following basis:
Age Period Under 22 Ceasing on 22nd birthday
22 and Over Continuing for life.
ASSET VALUATION METHOD: Five-year moving market average, with investment returns greater or less than the assumed real valuation interest rate plus actual inflation for the preceding year being recognized 20% per year for five years. Resulting value is subject to a corridor of 80% to 120% around Market Value. For years prior to 2014, investment returns greater or less than the assumed nominal valuation interest rate are recognized 20% per year for five years.
62 63
App
endi
x V
II
2014 SRP Final Results 4
ACTUARIAL COST METHOD: Open-Group Aggregate Cost Method, reflecting future participants expected to enter the Plan within ten years of the valuation date.
NEW ENTRANTS: Future new participants are included as replacements for terminating participants on the basis of a constant active workforce. The new entrant distribution was based on the results of a detailed study over the period 2008 - 2012 of actual new entrant data. The new entrant distribution was determined based on the age and sex distributions of employees with less than one year of service. The resulting new entrant frequency distribution for males and females is as follows:
Male Female
Age Frequency Starting Salary* Frequency Starting Salary*
25 12.50% $42,025
30 22.75 63,550
35 21.00 80,975
40 16.50 98,400
45 12.00 116,850
50 8.00 129,150
55 7.25 153,750
20.75% $41,000
29.50 58,425
23.00 67,650
12.00 82,000
7.75 95,325
4.00 114,800
3.00 129,150
*Shown in 2014 Dollars.
The starting salaries are brought forward each year by the emerging rate of inflation (based on CPI-U) plus 1% for assumed productivity increases.
Based on the experience of the Plan, 50% of new entrants are assumed to be male.
CURRENCY OPTION: For active participants in the Gross Plan, the value of the currency option is estimated by a load of 1.86% of Gross pay.
OTHER: For active participants and future new entrants, husbands are assumed to be three years older than wives. 80% of Gross Plan retirees are assumed to be married.
CASH BALANCE ACCOUNTS: For funding valuations, interest is assumed to be credited at a nominal rate of return of 5½%, representing a real return of 3% plus assumed inflation of 2½%. The present value of participant contributions was included on both the asset and liability portions of the balance sheet.
NET PLAN EMPLOYEE CONTRIBUTIONS: Starting January 1, 2015, all Net Plan participants are assumed to contribute the optional additional 6% contribution to the cash balance component of the SRP. No Net Plan participants are assumed to make the one-time transition payment or the additional percentage of pay transition contributions.
APPENDIX VII
Independent Auditors’ Report
KPMG LLP is a Delaware limited liability partnership,the U.S. member firm of KPMG International Cooperative (“KPMG International”), a Swiss entity.
KPMG LLP Suite 120001801 K Street, NW Washington, DC 20006
Independent Auditors’ Report
Pension Finance Committee and Participants of the Staff Retirement Plan and Trust of the International Bank for Reconstruction and Development:
Report on the Financial Statements
We have audited the accompanying financial statements of the Staff Retirement Plan and Trust (the “Plan”) of the International Bank for Reconstruction and Development, which comprise the statements of net assets available for benefits and of accumulated plan benefits as of December 31, 2013 and 2012, and the related statements of changes in net assets available for benefits and of changes in accumulated plan benefits for the years then ended, and the related notes to the financial statements.
Management's Responsibility for the Financial Statements
Management is responsible for the preparation and fair presentation of these financial statements in accordance with accounting principles generally accepted in the United States of America and International Financial Reporting Standards as issued by the International Accounting Standards Board; this includes the design, implementation, and maintenance of internal controlrelevant to the preparation and fair presentation of financial statements that are free from material misstatement, whether due to fraud or error.
Auditors’ Responsibility
Our responsibility is to express an opinion on these financial statements based on our audits. We conducted our audits in accordance with auditing standards generally accepted in the United States of America and International Standards on Auditing.Those standards require that we plan and perform the audit to obtain reasonable assurance about whether the financial statements are free from material misstatement.
An audit involves performing procedures to obtain audit evidence about the amounts and disclosures in the financial statements. The procedures selected depend on the auditor's judgment, including the assessment of the risks of material misstatement of the financial statements, whether due to fraud or error. In making those risk assessments, the auditor considers internal controlrelevant to the entity's preparation and fair presentation of the financial statements in order to design audit procedures that are appropriate in the circumstances, but not for the purpose of expressing an opinion on the effectiveness of the entity's internal control. Accordingly, we express no such opinion. An audit also includes evaluating the appropriateness of accounting policies used and the reasonableness of significant accounting estimates made by management, as well as evaluating the overall presentation of the financial statements.
We believe that the audit evidence we have obtained is sufficient and appropriate to provide a basis for our audit opinion.
Opinion
In our opinion, the financial statements referred to above present fairly, in all material respects, the financial status of the Plan as of December 31, 2013 and 2012, and the changes in its financial status for the years then ended, in accordance with accounting principles generally accepted in the United States of America and International Financial Reporting Standards as issued by the International Accounting Standard Board.
Very truly yours,
McLean, VirginiaJuly 21, 2014

65
App
endi
x V
III
International Bank for Reconstruction and DevelopmentStaff Retirement Plan and Trust
Statement of Net Assets Available for Benefits
(in thousands)
As of December 31, 2013 2012 Assets Cash $ 72,197 $ 34,931 Investments (including securities transferred under security lending Note L agreements of $94 million and $74.7 million as of December 31, 2013 and 2012) Debt Securities Note J Short-term investments 23,860 7,137 Securities purchased under resale agreements 289,138 145,865 Government and agency securities 3,861,229 4,303,837 Corporate and convertible bonds 155,187 153,239 Asset and mortgage backed securities 245,275 303,760 Total Debt Securities 4,574,689 4,913,838 Equities Note J Common and preferred stocks 3,194,593 2,998,523 Mutual funds and exchange traded funds 443,593 212,039 Real estate investment trusts 354,850 357,397 Total Equities 3,993,036 3,567,959 Other Fund Investments Note I & J Other commingled funds 1,651,697 1,193,473 Hedge funds 1,997,960 1,694,943 Private equity funds 3,197,471 3,129,330 Real estate funds 1,674,783 1,549,208 Total Other Fund Investments 8,521,911 7,566,954 Total Investments 17,089,636 16,048,751 Other Assets Derivative assets Note M 41,860 14,764 Fund subscriptions in advance 120,000 - Receivable from investment securities traded 17,259 24,810 Accrued interest and dividends receivable 23,835 32,969 Other receivables 30,437 34,232 Total Other Assets
233,391
106,775
Total Assets 17,395,224
16,190,457
Liabilities Payable for investment securities purchased (18,194) (90,194) Derivative liabilities Note M (4,571) (5,247) Liability to return collateral held under securities lending agreement (99,519) (78,176) Accrued interest and dividends payable (159) (160) Benefits payable (15,545) (14,322) Other payables (7,834) (5,662) Total Liabilities (145,822) (193,761) Net Assets Available for Benefits $ 17,249,402 $ 15,996,696
APPENDIX VIII
Financial Statements
The accompanying notes are an integral part of these financial statements.64

66 67
App
endi
x V
III
International Bank for Reconstruction and DevelopmentStaff Retirement Plan and Trust
Statement of Changes in Net Assets Available for Benefits
(in thousands)
Years ended December 31, 2013 2012
Investment Income: Net appreciation in fair value of investments Note G $ 1,446,706 $ 1,559,379 Interest and dividends 204,627 246,582 Less: Investment expenses (126,434) (118,690) Total Investment Income 1,524,899 1,687,271 Contributions: Contributions by participants 93,687 90,226 Contributions by participants - voluntary savings 24,880 20,575 Contributions by the Bank Note C 301,501 259,816 Total Contributions 420,068 370,617 Benefit Payments: Pensions (587,549) (553,323) Commutation payments (24,924) (37,005) Contributions, withdrawal benefits and interest paid to former participants on withdrawal (58,673) (57,947) Lump sum death benefits (5,775) (2,970) Termination grants (2,113) (1,887) Total Benefit Payments (679,034) (653,132) Administrative Expenses: Custody and consulting fees (2,477) (2,299) Other (10,750) (10,857) Total Administrative Expenses (13,227) (13,156) Net increase 1,252,706 1,391,600 Net Assets Available for Benefits: Beginning-of-year 15,996,696 14,605,096
End-of-year $ 17,249,402 $ 15,996,696
As of December 31, 2013 2012 Actuarial present value of accumulated plan benefits Note B9 Vested benefits Participants currently receiving payments $ 9,122,452 $ 8,829,872 Other participants: Deferred vested 175,005 159,132 Active 4,315,322 3,806,507 Subtotal 4,490,327 3,965,639 Total Vested Benefits 13,612,779 12,795,511 Nonvested benefits 400,361 532,670 Total Actuarial Present Value of
Accumulated Plan Benefits $ 14,013,140 $ 13,328,181
International Bank for Reconstruction and DevelopmentStaff Retirement Plan and Trust
Statement of Accumulated Plan Benefits
(in thousands)
International Bank for Reconstruction and DevelopmentStaff Retirement Plan and Trust
Statement of Changes in Accumulated Plan Benefits
(in thousands) Years ended December 31,
2013 2012 Changes in Accumulated Plan Benefits Actuarial present value of accumulated plan benefits at beginning-of-year $ 13,328,181 $ 12,518,807 Increase/(decrease) during the year attributed to: Changes in plan provisions 35,144 - Changes in actuarial assumptions 170,143 - Increase for interest 974,150 914,418 Changes in benefits accumulated (including accumulations due to additional accrual plus experience gains and losses) 184,556 548,088 Benefits paid (679,034) (653,132) Net increase 684,959 809,374 Actuarial present value of accumulated plan benefits at end-of-year $ 14,013,140 $ 13,328,181
The accompanying notes are an integral part of these financial statements. The accompanying notes are an integral part of these financial statements.

6968
App
endi
x V
III
International Bank for Reconstruction and Development
Staff Retirement Plan and Trust
Notes to Financial Statements
December 31, 2013 and 2012
A. DESCRIPTION OF THE PLAN
The following is only a brief description of the Staff Retirement Plan and Trust of the International Bank forReconstructionandDevelopment(the“Plan”).ParticipantsshouldrefertothePlandocument,whichprovides more complete information.
PursuanttoaresolutionoftheExecutiveDirectorsonMay5,1948,thePlanbecameeffectiveMay31,1948.ThePlanisacontributorydefinedbenefitpensionplanestablishedbytheInternationalBankforReconstructionandDevelopment(IBRDorthe“Bank”),andcoversmostemployeesoftheBank,theInternationalFinanceCorporation(IFC),andtheMultilateralInvestmentGuaranteeAgency(MIGA)(collectivelyreferredtoasthe“WorldBankGroup”).ThePlanisanemployeebenefitplanofIBRDandisduly established pursuant to IBRD’s Articles of Agreement as an integral part of IBRD’s operations. The Plan is a Trust under international law so, consistent with IBRD, it does not have a domicile or residency in any particular country or state.
TheBankistrusteeofthePlanandholdsthePlan’sassetsinTrustfortheexclusivebenefitofparticipants,retireesandbeneficiaries.OtherthanPlaninvestmentsinfundstructures,mostPlanassetsaremanagedbyexternalassetmanagersandheldincustodywithTheBankofNewYorkMellon(BNYMellon).
ThePensionFinanceCommittee(PFC)isresponsiblefortheoversightofinvestmentandactuarialactivitiesofthePlan,includingtheBank’scontributiontothePlan.ThePensionBenefitsAdministrationCommittee(PBAC)isresponsibleforadministeringthePlan’sbenefits(seenoteKfordetails).
Ingeneral,employeeswhoenteredthePlanpriortoApril15,1998referredtoastheGrossPlan,arecoveredbyonesetofprovisionsgoverningparticipation,retirementanddeathbenefits,paymentofbenefits,andcontributions;whileemployeesenteringthePlanonorafterApril15,1998referredtoastheNet plan, are covered by a different set of provisions. See description of Plan provisions in note A1.
Themandatoryemployeecontributionsaresevenpercentofpensionablegrosssalary,asdefinedbythePlan,forstaffinthegrossplanandfivepercentofnetsalary,asdefinedbythePlan,forstaffintheNet plan. The Bank contributions19 are determined on an annual basis and expressed as a percentage of employees’ net salaries, based on actuarial assumptions and a funding methodology approved by the PFC.
OnDecember19,2013,theBoardofExecutiveDirectorsapprovedmanagement’sproposalstochangeseveral elements of both the Net and Gross Plans, which include an increase in the mandatory retirement age(MRA)forcurrentstaffandanincreaseinthenormalretirementage(NRA)forfuturestaff.
The highlights of the changes are: (1)EnablingNetPlanPensionParticipantstosavemoreforretirementbyallowingadditional
contributions.NetPlanstaffcontributionswillberestructuredfromafixed,mandatorycontributionoffivepercenttoincludeanadditionalvoluntarycontributionofuptosixpercent,foramaximumtotal
staff contribution of 11 percent of net salaries to the Cash Balance component. Furthermore, staff on the Net Plan will be able to make contributions for previous years of service.
(2)ImprovementstotheSurvivors’BenefitsoftheNetPlanbyprovidinglifetimeannuitiesforspousesanddomesticpartners,togetherwithanewsurvivors’benefitforchildren.
(3)Increasingthemandatoryretirementage(theageatwhichtheBankGrouprequiresseparationfromservice)toage67forallstaffwhoareemployedonorafterDecember31,2015.
(4)Closingthevoluntarysavingscomponent(VSC)forHeadquarters(HQ)staffintheNetPlan,makingthe401(k)theprimaryoptionalsavingsplanforHQappointedstaffinboththeNetandGrossPlans.TheexistingVSCbalancesasofJanuary1,2015forbothHQandCountryOfficestaffwillbetransferredtotheCashBalanceComponent.AnewVSCplanwillbeopenedforCountryOfficestaff,asanon-qualifiedplan,withnospecialU.S.taxconsiderations.
(5)Updatingthegrossing-upformulafortheGrossPlanbyadjustingtheexistinggrossing-upformulatoensurethat future tax computations are in line with current tax brackets. The current Plan formula was established in1990,basedonthecombinedtaxratesoftheUnitedStates,France,andGermany.GrossPlanrulesrequirethatformalreviewsofthegrossing-upformulabeconductedeveryfiveyears.Thepurposeofthereviewsistoensurethat(i)theformulacontinuestoproducereasonablelevelsofpensionableremunerationbasedonchangesinthetaxratesofthethreecountries,and(ii)theWBG’sretirementbenefitsremaincompetitive. Provisions were made at the time the formula was established for regular reviews and for Managementtorecommendadjustmentsinpensionablegrosssalaries“ifchangesintheunderlyingtaxandexchangeratesarematerialandlikelytopersist”.Thereisnoimpactonaccruedbenefits.
(6)CeasingpensionaccrualforGrossPlanparticipantsafterage62,whileallowingstaffinthisgrouptocontinuetoaccumulatesavingsinthe401(k).
(7)Increasingthenormalretirementage(theageatwhichstaffcanretirewithoutanearlyretirementpenaltyinpensionbenefits)to65forparticipantsenteringthePlanonorafterDecember31,2015while it remains at age 62 for all other staff participating in the Plan before then.
These changes will be introduced in two separate phases. Changes to employee contributions, survivor benefits,thegrossing-upformula,andtheclosureoftheVSCwilltakeeffectonJanuary1,2015,whileincreasestotheNRAandMRAwillfollowonDecember31,2015.
BenefitsineffectatDecember31,2013aredescribedbelow,withoutconsideringthechangesabove.
1.RetirementBenefits
(a)ProvisionsapplyingtotheGrossPlan
Employees who received a severance payment and who have three or more years of pensionable service or havereachedage55areentitledtoapensionbeginningatnormalretirementage62equalto2.2percentoftheirhighestthreeyearaveragepensionablegrosssalary(HAGS)foreachyearofthefirst25yearsofservice and 1.8 percent of their HAGS for each of the next 10 years of service thereafter. The Plan permits retiredemployeeswhohavereachedage55(oratleastage50withaminimumtotalageplusyearsofserviceequalto75years)toreceiveareducedearlyretirementpensioncommencingbeforeage62.
19TheemployercontributionsaremadebytheBankandthenreimbursedtotheBankbyotherWorldBankGroupentitiesfortheirproportionateshareof the contributions made.

70 71
App
endi
x V
III
Thoseparticipantswhochoosetoenrollcanelecttosaveonepercentto15percentoftheirnetsalaryonan after-tax basis. Upon termination, employees are entitled to receive a lump sum withdrawal of their contributions plus any deemed earnings/losses credited to the separate notional accounts established for thiscomponent.EmployeesterminatedafterJune1,2009whoareeligibletoreceiveapension,havetheoption to leave their funds invested in voluntary savings until they begin the pension.
Deemed earnings in the Cash Balance and voluntary savings are based on the returns of funds selected by the participant. The Cash Balance component offers the following nine investment options at December 31, 2013: theReal3%option,providingareturnofthreepercentaboveU.S.inflation;theU.S.Dollarmoneymarketoption,providingareturnontheBankofAmerica(BofA)MerrillLynch(ML)USD3-MonthLIBORindex;theEuromoneymarketoption,providingareturnequaltotheproductoftheThomsonReuters3-Month Euribor Constant Maturity Total Return End-of-Month Index and BofA ML Spot Euro/U.S. DollarExchangeRate;theGovernment/CorporateBondoption,providingareturncorrespondingtothatoftheBarclaysCapitalU.S.Government/Creditindex;theemergingmarketbondoption,providingareturnontheJPMorganEmergingMarketBondIndex;theStandard&Poor’s(S&P500)option,providingareturnonthisstockindex;theRussell2000option,providingareturnonthisstockindex;theEuropeAsiaandFarEast(EAFE)option,providingareturncorrespondingtothatoftheMorganStanleyCapitalInternationalIndex(MSCIEAFEIndex);andtheemergingmarketequityoption,providingareturnontheMorganStanley Capital International Emerging Market Index. The investment options for the voluntary savings component are the same as those for the Cash Balance component except for the Real 3% option, which is notavailableinthiscomponent.InsteadparticipantscanselectaU.S.TreasuryInflationProtectedSecurities(TIPS)option,whichprovidesareturnoftheBarclaysCapitalU.S.TIPSIndex.
2.DisabilityBenefits
EmployeeswhoenteredthePlanpriortoApril15,1998andwhobecametotallyandpermanentlydisabledpriortoJuly1,1998wereretiredonadisabilitypensionnormallyequaltothepensiontheywouldhavereceived based on actual service and HAGS, but with no reduction for start of payments before normal retirementage62;providedsuchpensionisatleastequaltothelesserof50percentofHAGSorthenormalpension that the employees would have received had they continued to be employed to normal retirement age withnochangeinHAGS.ClaimsfordisabilitybenefitsarisingafterJuly1,1998are, if approved, covered by the World Bank Group outside the Plan and are administered by a third party provider.
3.DeathBenefits
(a)ProvisionsapplyingtotheGrossPlan
If a married participant dies in active service before normal retirement age, the spouse normally receives a pension based on the pension the employee would have received in the event of disability retirement. If the disability pension would have been more than 60 percent of HAGS, the spouse’s pension would be equal to50percentofthatpension;ifthedisabilitypensionwouldhavebeenbetween30percentand60percentofHAGS,thespouse’spensionwouldbeequalto30percentofHAGS;andifthedisabilitypensionwouldhave been less than 30 percent of HAGS, the spouse’s pension would be equal to the disability pension. If death occurs after the normal retirement date or after the employee has retired and becomes entitled to receiveapension,thespousewouldnormallyreceive50percentofsuchpension.
ThePlanallowsretiredemployeestocommuteaportionoftheiraccruedpensionbenefitintoalumpsumpayment. This is a one time option available at pension effective date. The commuted amount cannot exceedone-thirdofthetotalaccruedbenefitandiscalculatedbasedonfactorsspecifiedinthePlan.Thelump sum is payable as of the pension effective date and each monthly pension payment is permanently reduced. Employees who do not receive severance payments from the World Bank Group and who have waived any right that may exist thereto are entitled to receive unreduced early retirement pensions as early asage50iftheyhaveatleastthreeyearsofpensionableserviceorreachedage50atservicetermination.A severance payment refers to any payment that is characterized as such in Staff Rule 7.01 of the Bank.
Employeeswhoterminatebeforebecomingentitledtoapension(thatis,beforeage50andwithlessthanthreeyearsofpensionableservice)receivealumpsumdistributionbasedontheirHAGSandservice. Employees, who are terminated after becoming entitled to a pension, may elect, subject to certain conditions, to receive the lump sum distribution instead of a pension.
ParticipantsinthePlanwithservicepriortoMay1,1990haveabenefitbasedratablyontheirservicepriortoandafterMay1,1990usingthePlanprovisions(e.g.accrualrateandpensionableearnings)ineffectatthattime.AnadditionalmodificationismadeifthereisservicebeforeMay1,1974.
(b)ProvisionsapplyingtotheNetPlan
Benefitsareprovidedfromthreecomponents:DefinedBenefit,CashBalance,andvoluntarysavings(establishedMay1,2007).PriortoApril15,1998,therewasaTerminationGrantprogram20 for country officestaffonregularorfixed-termappointments.ForemployeeswhoearnedservicecreditsundertheTerminationGrantprogram,theterminationgrantbenefitsarealsoincludedinthePlan.
UndertheDefinedBenefitcomponent,employeesaccruebenefitsbasedonanaccruedpercentageoftheiryearsofservicetimestheirhighestthreeyearaveragenetsalary(HANS).BenefitsfromthiscomponentarepayableeitherasalumpsumwithdrawalbenefitcalculatedaseightpercentoftheirHANSforeach year of service, or as a pension calculated as one percent of their HANS for each year of service. Participantsbecomeeligibleforapensiononcetheyhaveatleast10yearsofserviceorafteratleastfiveyears of service if their age plus years of service is at least 60. Those eligible to receive a pension can begin receivingpaymentsasearlyasage50,butwithareductionofthreepercent(fivepercentforterminationspriortoJanuary1,2009)foreachyearundertheageof62thepensioncommences.Terminatingparticipantswhoarenoteligibleforapension,orwhoelectawithdrawalbenefitinlieuofapension,arepaidthelumpsumwithdrawalbenefit.
Under the Cash Balance component, the Plan maintains notional accounts for participants, representing the lump sum payment payable to a participant on or after termination of employment with the World Bank Group. The notional accounts receive monthly credits of 10 percent of net salary from the Bank, employeecontributionsoffivepercentofnetsalary,andanydeemedearnings/lossescreditedtotheiraccounts.ThosewhoelecttoreceivetheirDefinedBenefitcomponentasapensioncanalsoelecttoconvertsomeoralloftheirCashBalancebenefittoanannuity.
The voluntary savings component was established within the plan effective May 1, 2007. Only participants joiningtheplanonorafterApril15,1998areprovidedtheoptiontocontributetothiscomponent.
20StaffinthecountryofficeswithappointmenttypesofLocal-RegularorLocal-FixedTermbeforeApril15,1998andwhoareeligibleforparticipationinthePlanaccrue21percentoffinalnetsalaryperyearofterminationgrantservice.Thiscanbetakenaslumpsum,partlumpsum,orannuitizedusingannuityconversionfactors.ServicecreditsfortheprogramwerefrozenasofApril15,1998.

72 73
App
endi
x V
III
Uponthedeathofasingleparticipant,activeorretired,alumpsumbenefitispaidtotheemployee’sdesignatedbeneficiary.Thebenefitisdeterminedasfollows:
§ Death in active service: 100 percent of the employee’s annual gross salary, plus accumulated contributions;however,ifserviceisatleasttwoyears,thebenefitisthegreaterof200percentofemployee’sfinalannualgrosssalaryor100percentoftheemployee’sannualgrosssalary,plusaccumulated contributions.
§ Death after retirement and becoming entitled to receive a pension: in general, the excess of accumulated contributionsoveranybenefitpayments,plusapercentageoftheannualpension(maximum200percentondeathatorbeforeage65,minimum50percentondeathatorafterage73).
§ Death after retirement but before becoming entitled to receive a pension: in general, a lump sum withdrawalbenefitdeterminedasofthedateofdeath.
EffectiveMarch1,2002,thePlanwasamendedtoextendmostofthespousalsurvivorbenefitstoeligibledomestic partners of Plan participants.
(b)ProvisionsapplyingtotheNetPlan
Ifaparticipantdiesinactiveserviceorbeforethepensionbecomeseffective,alumpsumbenefitispaidtothedesignatedbeneficiaryintheamountofeightpercentofHANSforeachyearofserviceplustheaccount balance in the Cash Balance and voluntary savings components, as applicable. The lump sum deathbenefitwouldalsoincludetheTerminationGrant,ifapplicable,thatwouldhavebeenpayableonthedate of death to the participant.
Ingeneral,thedeathbenefitforamarriedparticipantreceivingapensionwhodiesafterretirementisapension payable to the surviving spouse in an amount based on the age of the participant at retirement and the age difference between the participant and the spouse. Such a participant may, prior to retirement, electtoreducehis/herpensioninordertoprovideagreaterbenefitor,withconsentofthespouse,nameanotherbeneficiaryorchangetheformofbenefittoalumpsum.Ingeneral,thedeathbenefitforasingleparticipantwhodiesafterretirementisalumpsumpayabletothedesignatedbeneficiaryinanamountrangingfrom430percentofhis/herpensionatthetimeofdeathforretirementatage50reducedby15percenteachyeartoaminimumof205percentatage65.Suchaparticipantmay,priortoretirement,electtoprovide,inlieuofalumpsum,asurvivorannuitytoadesignatedbeneficiaryonthesamebasisasamarried participant, with the amount of survivor annuity and reduction in pension, if any, based on the age oftheparticipantatretirementandtheagedifferencebetweentheparticipantandbeneficiary.
4.Children’sBenefits
These provisions apply only to the Gross plan. Eligible children of a deceased employee or a deceased retired employee who was receiving or entitled to receive a pension at the time of death, receive annual benefitpayments.TheamountofthebenefitpaymentisadjustedannuallyeffectiveMay1ofeachyear.SuchbenefitfortheperiodMay1,2013throughApril30,2014is$5,760perchild(maximum$17,280foralleligiblechildren);and$5,676.36perchild(maximum$17,029.08foralleligiblechildren)fortheperiodMay1,2012throughApril30,2013.Similarbenefitsarepayabletotheeligiblechildrenofaretiredemployeewhoisreceivingadisabilitypension.Eligiblechildrenareunmarriedchildrenunderage19(age22forfull-timestudents)orunmarrieddisabledchildrenwhosedisabilitystartedbeforeage22.
5.Cost-of-LivingIncreasesinPensions
ThePlancontainsprovisionsforcost-of-livingincreasesinpensionsandchildren’sbenefitsasofMay1ofeach year.
6. Payment Options
ThePlanpermitstheelectionofthefollowingpaymentoptionsrelatedtobenefitpayments:
(a) Provisions applying to the Gross Plan:
i. Converting up to one-third of the pension into a lump sum payment ii. Reducing the pension in order to provide a survivor annuity to a designated person iii. Receiving the pension in the currency of the country of principal residence instead of
in U.S. dollars, or partly in the currency of the country of principal residence and the remainder in U.S. dollars
iv. Reducing the pension after payments commence to provide a survivor annuity to a new spouse or a former spouse, in the case of marriage or divorce after retirement or to provide a survivor annuity to children born after retirement.
(b) ProvisionsapplyingtotheNetPlan:
i. The Plan permits the election of alternative currencies for payments of both lump sums and pensions
ii. Reducing the pension in order to provide a larger survivor annuity iii. Forparticipantseligibletoreceiveapension,electingawithdrawalbenefitinlieuofthe
pension.
7. Administrative Expenses
The Plan’s assets are held by the Bank, separate from the Bank’s other assets, and are used solely to provide thebenefitsandpaytheexpensesofthePlan.ThePlanallowspaymentofcertaininvestmentandactuarial-related fees and expenses out of Plan assets. The Plan incurred administrative expenses of $13.2 million and $13.1 million during the years ended December 31, 2013 and 2012 respectively. These expenses are included underOtherAdministrativeExpensesintheStatementofChangesinNetAssetsAvailableforBenefits.Other Administrative Expenses include staff cost, information technology, consulting, audit and actuarial related fees.
B. SUMMARY OF ACCOUNTING POLICIES
ThefollowingarethesignificantaccountingpoliciesadoptedbythePlan:
1. Basis of Accounting
TheaccompanyingfinancialstatementshavebeenpreparedinaccordancewithGenerallyAcceptedAccountingPrinciplesintheUnitedStates(U.S.GAAP)andInternationalFinancialReportingStandards(IFRS)asissuedbytheInternationalAccountingStandardsBoard(IASB).

74 75
App
endi
x V
III
2. Subsequent Events
OnJuly21,2014,thePFCapprovedthesefinancialstatementsforissuance,whichwasalsothedatethrough which the Plan’s management evaluated subsequent events. There were no subsequent events identifiedthroughthisdate.
3. Cash
Cashisdefinedascashonhand,cashheldwithexternalmanagersandcashheldatbrokersascollateralonfutures contracts.
4.Investments
Investment securities are carried and reported at fair value on the Statement of Net Assets Available for BenefitswithchangesinfairvaluerecognizedinNetappreciation/depreciationinfairvalueofinvestmentsontheStatementofChangesinNetAssetsAvailableforBenefits.Purchasesandsalesofsecuritiesarerecorded on a trade date basis. Gains and losses on sale of securities are based on the average cost of the respective securities. Dividends are recognized on the ex-dividend date.
5.ValuationofFinancialInstruments
Thecarryingvalueoffinancialassetsandliabilitiesapproximatesfairvalue.ThePlanhasanestablishedand documented process for determining fair values. Fair value is based on quoted market prices where available.Ifquotedmarketpricesarenotavailable,fairvaluesarebasedondiscountedcashflowmodelsusing market-based parameters such as yield curves, interest rates, volatilities, foreign exchange rates and credit curves.
Somefinancialassetsarevaluedusingvaluationtechniques,whichrequiresignificantunobservableinputs.The selection of these inputs may involve some judgment. Imprecision in estimating these factors, and changesinassumptions,canimpacttheNetAssetsDesignatedforBenefitsasreportedinthefinancialstatements. Plan management believes its estimates of fair value are reasonable given its processes for obtaining security prices from multiple independent third-party vendors. In addition, management performs periodic reviews of the third-party’s pricing process and controls and ensures that the policies are applied consistently from period to period.
Investments in equities listed on national and foreign securities exchanges are valued based on quoted closing price. Debt securities are not listed on an exchange and are valued by independent pricing vendors either using direct quoted prices in active markets or valuation techniques incorporating observable market inputs such as comparable trades, dealer quotes, interest rates, prepayment speeds, spreads and other market data. Hedge funds, commingled funds, private equity and real estate investment funds do not have a readily determinable fair market value. Fair value is recorded by the Plan mainly using the net asset value (NAV)reportedbytheinvestmentmanagerinthelatestavailablefinancialstatementsofthefunds,whicharereviewedbymanagement.TheAccountingStandardsCodification(ASC)820permitstheuseofNAVas a practical expedient for fair value, with additional disclosures required, when measuring the fair value ofafundinvestmentthatmeetscertainspecificcriteria(seenoteIandJformoredetails).
Securities purchased under resale agreements and securities lent under securities lending agreements are recorded at face value, which approximates fair value. The Plan receives securities purchased under resale agreements, monitors the fair value of the securities and, if necessary, closes out transactions and
enters into new repriced transactions. The securities transferred to the counterparties under security lending arrangements and the securities transferred to the Plan under the resale agreements have not met the accounting criteria for treatment as a sale. Therefore, securities transferred under security lendingarrangementsareretainedasassetsonthePlan’sStatementofNetAssetsAvailableforBenefits,and securities received under resale agreements are not recorded on the Plan’s Statement of Net Assets AvailableforBenefits(seenoteLformoredetails).
6. Accounting for Derivatives
The Plan complies with the derivative accounting requirements of the Financial Accounting Standards Board(FASB)ASC815DerivativesandHedging,aswellasInternationalAccountingStandard(IAS)39,FinancialInstruments:RecognitionandMeasurement.Thesestandardsrequirethatderivativeinstruments,asdefinedbythesestandards,berecordedonthebalancesheetatfairvalue.ThePlan’sderivative instruments, which include foreign currency forward contracts, futures, swaps and contracts to purchaseorselltobeannounced(TBA)securities,aremeasuredatfairvaluewiththechangesinfairvaluerecordedintheStatementofChangesinNetAssetsAvailableforBenefits.Noderivativesaredesignatedashedgesforaccountingpurposes(seenoteMformoredetails).
7. Risks and Uncertainties
The Plan invests in various investment securities. Investment securities in general are exposed to various risks such as interest rate, credit and overall market volatility. Due to the level of risk associated with certain investment securities, it is possible that changes in the value of investment securities will occur in the near term.
ThePlaninvestsincollectiveinvestmentfundswhichincludesecuritieswithcontractualcashflowssuchas asset backed securities, collateralized mortgage obligations and commercial mortgage backed securities. The value, liquidity and related income of these securities are sensitive to changes in economic conditions, including real estate value, delinquencies or defaults, or both, and may be adversely affected by shifts in the market’s perception of the issuers and changes in interest rates.
Plancontributionsaremadeandtheactuarialpresentvalueofaccumulatedplanbenefitsarereportedbasedoncertainassumptionspertainingtointerestrates,inflationratesandemployeedemographics,allofwhich are subject to change. Due to uncertainties inherent in the assumptions process and use of estimates, it is at least reasonably possible that actual results could differ from these estimates.
8. Use of Estimates
ThepreparationoffinancialstatementsinconformitywithU.S.GAAPandIFRSrequiresmanagementto make estimates and assumptions that affect the reported amounts of assets and liabilities and changes therein, disclosure of contingent assets and liabilities, and the actuarial present value of accumulated plan benefitsatthedateofthefinancialstatements.Suchestimatesincludebutarenotlimitedtoassumptionsaboutplanbenefitobligationsandchangestherein,andthefairvalueofinvestments.Actualresultscoulddiffer from those estimates.

76 77
App
endi
x V
III
9.ActuarialPresentValueofAccumulatedPlanBenefits
Accumulated plan benefits represent the total actuarial present value of those estimated future benefits,including lump sum distributions that are attributable under the Plan’s provisions to the service employees haverendered,asofthevaluationdate.Accumulatedplanbenefitsincludebenefitstobepaidto:(a)retiredorterminatedemployeesortheirbeneficiaries,(b)beneficiariesofemployeeswhohavedied,and(c)presentemployeesortheirbeneficiaries.
Benefitspayableunderallcircumstances-retirement,death,disability,andterminationofemployment-areincluded to the extent they are deemed attributable to employee service rendered as of the valuation date.
Theactuarialpresentvalueofaccumulatedplanbenefits(whichdoesnottakeintoaccountfuturesalaryincreases)isdeterminedbytheactuarialfirmofBuckConsultants(thePlan’sactuaries)andtheamountisderivedfromapplyingactuarialassumptionstoadjusttheaccumulatedplanbenefitstoreflectthetimevalueofmoney(throughdiscountsforinterest)andtheprobabilityofpayment(bymeansofdecrementssuchasfordeath,disability,withdrawal,orretirement)betweenthevaluationdateandtheexpecteddateofpayment.In2014,thePFCapprovedchangesinthedemographicassumptionsasaresultofanexperiencereview.Thereviewofthefinancialassumptionswascompleted,atthesametime.BoththechangesindemographicandfinancialassumptionswereusedforvaluationofliabilitiesasofDecember31,2013.
ThesignificantactuarialassumptionsusedinthevaluationsasofDecember31,2013and2012were:
§ Life expectancy of participants (2007 United Nations Joint Staff Pension Fund mortality table adjusted forforecastimprovementsinmortality)
§ Ageandgenderspecificresignationandretirementratesresultinginanaverageretirementageof59asofDecember31,2013andage58formalesand57forfemalesasofDecember31,2012
§ Annualrateof2.5percentin2013andfourpercentin2012forcost-of-livingincreasesinpensions
§ Annualinvestmentreturnofsixpercentin2013and7.5percentin2012whichservesasthediscountratefor liabilities.
The foregoing actuarial assumptions are based on the presumption that the Plan will continue. Were the Plan to be terminated, different actuarial assumptions and other factors might be applicable in determining theactuarialpresentvalueofaccumulatedplanbenefits.
10. Recent Accounting Pronouncements
U.S. GAAP Pronouncements
InJuly2010,theDodd-FrankWallStreetReformandConsumerProtectionAct(the“Act”)becamelawintheUnitedStates.TheActseekstoreformtheU.S.financialregulatorysystembyintroducingnewregulators and extending regulation over new markets, entities, and activities. The implementation of the Act is dependent on the development of various rules to clarify and interpret its requirements. Pending the development of these rules, no impact on the Plan has been determined as of December 31, 2013. The Plan continues to evaluate the potential future implications of the Act.
InDecember2011,theFASBissuedASU2011-11,BalanceSheet(ASCTopic210):Disclosures about Offsetting Assets and Liabilities. The ASU requires entities to disclose both gross information and net informationaboutinstrumentsandtransactionseligibleforoffsetinthestatementoffinancialposition,and instruments and transactions subject to an agreement similar to a master netting agreement. Subsequently,inJanuary2013,theFASBissuedASU2013-01,BalanceSheet(ASCTopic210):Clarifying the Scope of Disclosures about Offsetting Assets and Liabilities. The main objective of ASU 2011-11 is to clarify that the scope of ASU 2011-11 applies to derivatives, as well as repurchase agreements, reverse repurchase agreements, and securities borrowing and securities lending transactions that are either offset in accordance with U.S. GAAP or subject to an enforceable master netting arrangements or similar agreement. The Plan adopted this standard during the year ended December 31, 2013 and the adoption resultedinadditionaldisclosure(SeenoteKformoredetails).
IFRS Pronouncements
InNovember2009,theIASBissuedIFRS9Financial InstrumentsasthefirststepinitsprojecttoreplaceIAS39Financial Instruments: Recognition and Measurement.IFRS9introducesnewrequirementsforclassifyingandmeasuringfinancialassets.InOctober2010,theIASBissuedadditionstoIFRS9inrelationtofinancialliabilitiesthatanentityhaselectedtomeasureatfairvalue.Inthefourthquarterof2013,theIASBtentativelydecidedtodeferthemandatoryeffectivedateofIFRS9untiltheissuedateofthecompletedversionofIFRS9isknown,Theamendmentsalsoproviderelieffromrestatingcomparativeinformationandrequiredisclosures(inIFRS7)toenableusersoffinancialstatementstounderstandtheeffectofbeginningtoapplyIFRS9.TheapplicationofthisstandardisnotexpectedtohaveamaterialimpactonthePlan’sfinancialstatements.
In May 2011, the IASB issued IFRS 13 Fair Value Measurement. This standard sets out a framework for measuring fair value in a single IFRS and requires disclosures about fair value measurements. IFRS 13 applies when other IFRS’ require or permit fair value measurements. It does not introduce any new requirements to measure an asset or a liability at fair value, change what is measured at fair value in IFRS’ or address how to present changes in fair value. IFRS 13 establishes a single source of guidance for all fair value measurements required or permitted by IFRS’. The new requirements are effective for annual periods beginning on or after January 1, 2013, with earlier application permitted. The standard was adoptedin2012andtherehasbeennomaterialimpactofthisstandardonthePlanfinancialstatements.
In December 2011, the IASB published amendments to IAS 32 Financial Instruments: Presentation to clarify the application of the offsetting requirements. The amendments are effective for annual periods beginning onorafterJanuary1,2014,withearlierapplicationpermitted.ThePlaniscurrentlyevaluatingtheimpactoftheamendmentonitsfinancialstatements.
In December 2011, the IASB published new disclosures regarding the Offsetting Financial Assets and Financial Liabilities(AmendmentstoIFRS7).ThejointIASBandFASBdisclosurerequirementswillenableusersofthefinancialstatementstobettercomparefinancialstatementspreparedinaccordancewith IFRS and U.S. GAAP. The new requirements are effective for annual periods beginning on or after January 1, 2013. The Plan adopted this standard during the year ended December 31, 2013, and the adoptionresultedinadditionaldisclosure(SeenoteKformoredetails).

7978
App
endi
x V
III
11. Tax Status
OnDecember2,2011,theU.S.InternalRevenueService(IRS)informedtheBankofitsdeterminationthattheStaffRetirementPlanandtrustmeettherequirementsofSection401(a)oftheInternalRevenueCode(the“Code”)asapplicabletogovernmentalplans,otherthantherequirementthattheTrustbecreatedororganizedintheUnitedStates.Accordingly,concessionaltaxtreatmentisavailableforbenefitsto the extent applicable.
With regard to taxation of the Plan, the Trust established under the Plan to hold the Plan’s assets is intendedtoqualifyforexemptionunderSection501(a)oftheCodeexceptforthefactthatitwascreated or organized outside the United States. Based on the favorable determination letter from the IRS, dated December 2, 2011, the Plan Sponsor believes that the Trust continues to qualify and to operate in accordance with the applicable requirements of the Code. Additionally, since the income and assets of the Trust are held by the Bank, as trustee, they are subject to the Bank’s tax immunity granted under Article VII,Section9,oftheBank’sArticlesofAgreement.AccordinglytheTrust’sinvestmentincomeisexemptfrom income tax, and no provision for income taxes, whether current or deferred, has been included in the Plan’sfinancialstatements.
12.Reclassifications
Certainreclassificationshavebeenmadetoprioryearamountstoconformtothecurrentyearpresentation.CertainFederalGovernmentagencybondswerereclassifiedfromshortterminvestmentstoGovernmentandAgencysecurities.Interestanddividendsfromalternativefundinvestmentsarenowclassifiedasnet appreciation and depreciation of investments. Management believes this would further improve the presentationoftheFinancialStatementsandenhancecomparisonwithcurrentyear’sfigures.
C. FUNDING POLICY
As a condition of participation, employees in the Gross plan are required to contribute seven percent oftheirpensionablegrosssalariestothePlan.Employeesinthenetplanarerequiredtocontributefivepercent of their net salaries to the Plan. Present employees’ accumulated contributions at December 31, 2013 and 2012 were $1,237.0 million and $1,137.7 million, respectively, including interest credited (at an interestratecomputedinaccordancewithSection411oftheCode).
In2014,basedonrecommendationsfromthePlan’sindependentactuaries,BuckConsultants,thePFCapprovedreviseddemographicandfinancialassumptions(seenoteB9)forfuturevaluationseffectiveasof2013.Thechangesinassumptionshaveasignificanteffectontheamountsreported.Thecombinedeffectof these changes in assumptions resulted in a 1.3% increase in contribution rate for the Plan.
The Bank’s funding policy is to make contributions to the Plan at an annual rate, expressed as a percentage ofemployees’netsalaries.TheBank’scontributionrateforitsfiscalyearendedJune30,2014was20.88percentand18.91percentforitsfiscalyearendedJune30,2013.BankcontributionstothePlantotaled$301.5millionand$259.8millionduringcalendaryears2013and2012,respectively.Whencombinedwithemployeecontributionsandexpectedinvestmentreturns,totalfundingisestimatedtobesufficienttofullyprovideforallemployeebenefitsbythetimetheyretire. InDecember2009,thePFCapprovedarevisedactuarialcostmethodforpurposesofcomputingtheBank’s contribution rate, replacing the previous closed group aggregate cost method (which uses total projectedliabilitiesforallcurrentparticipantsandretirees)withamodifiedopengroupaggregatecost
method (which uses total projected liabilities for all current participants and retirees as well as future participantsexpectedtojointhePlaninthetenyearsfollowingthedateofthevaluation).Inaddition,theassetvalueusedtodeterminecontributionswasmodifiedsoastorecognizeannualdeviationsofactualfromexpectedinvestmentreturnsovertheimmediatelyprecedingfiveyearperiod.Asanadditionalconstraint, a corridor of 80 percent to 120 percent of market value of assets was established such that the resulting asset value may not deviate from the market value of assets by more than 20 percent. The previous method was based on a three year averaging of realized and unrealized capital gains and losses, but immediate recognition of interest and dividends and was not subject to a corridor constraint.
Based on the recommendations of the Plan’s actuaries and in accordance with the revised funding policy adoptedin2009,thePFCapprovedaBankcontributionrateof18.98percentofnetsalariesfortheperiodbeginningJuly1,2014throughJune30,2015.
While the Bank intends to continue the Plan into the future, it has the right under the Plan to completely orpartiallysuspenditscontributionsforbenefitsbasedonfutureservice,inwhicheventallsuchbenefitson account of future service will be reduced to such amounts as can be actuarially provided by future contributions, if any.
D. PLAN TERMINATION
Although there is no intention to do so, the Plan may be completely or partially terminated by the Bank at any time. In the event the Plan is terminated, the net assets of the Plan will be used for the purpose of payingorprovidingforallaccumulatedplanbenefitsasofthedateofPlanterminationandtheBankwillbe liable for any additional funds that may be required for this purpose. Any Plan assets remaining after payingorprovidingforallsuchbenefitswillbereturnedtotheBank.
E. RELATED-PARTY TRANSACTIONS
CertainofficersandemployeesoftheBank(whomayalsobeparticipantsinthePlan)performcertainadministrativeandlegalservicesrelatedtotheoperation,recordkeepingandfinancialreportingofthePlan.As trustee to the Plan, the Bank pays these salaries and other administrative expenses on behalf of the Plan and the Plan reimburses the Bank for such expenses according to agreed upon guidelines. The amount related to expenses incurred from July 1, 2012 to June 30, 2013 reimbursed to the Bank in 2013 was $11.3 million. The amount related to expenses incurred from July 1, 2011 to June 30, 2012 reimbursed to the Bank in 2012 was$11.3million.AtDecember31,2013and2012,anamountof$5.4millionand$5.3million,respectively,payabletotheBankisincludedunderOtherpayablesintheStatementofNetAssetsAvailableforBenefits.
F. FOREIGN CURRENCY
Transactions denominated in foreign currencies are recorded in U.S. dollars at exchange rates prevailing on the transaction date. Investments and other monetary assets and liabilities denominated in foreign currencies are translated into U.S. dollars at exchange rates prevailing on the year end date with any resulting gain or loss included in net appreciation in fair value of investments.
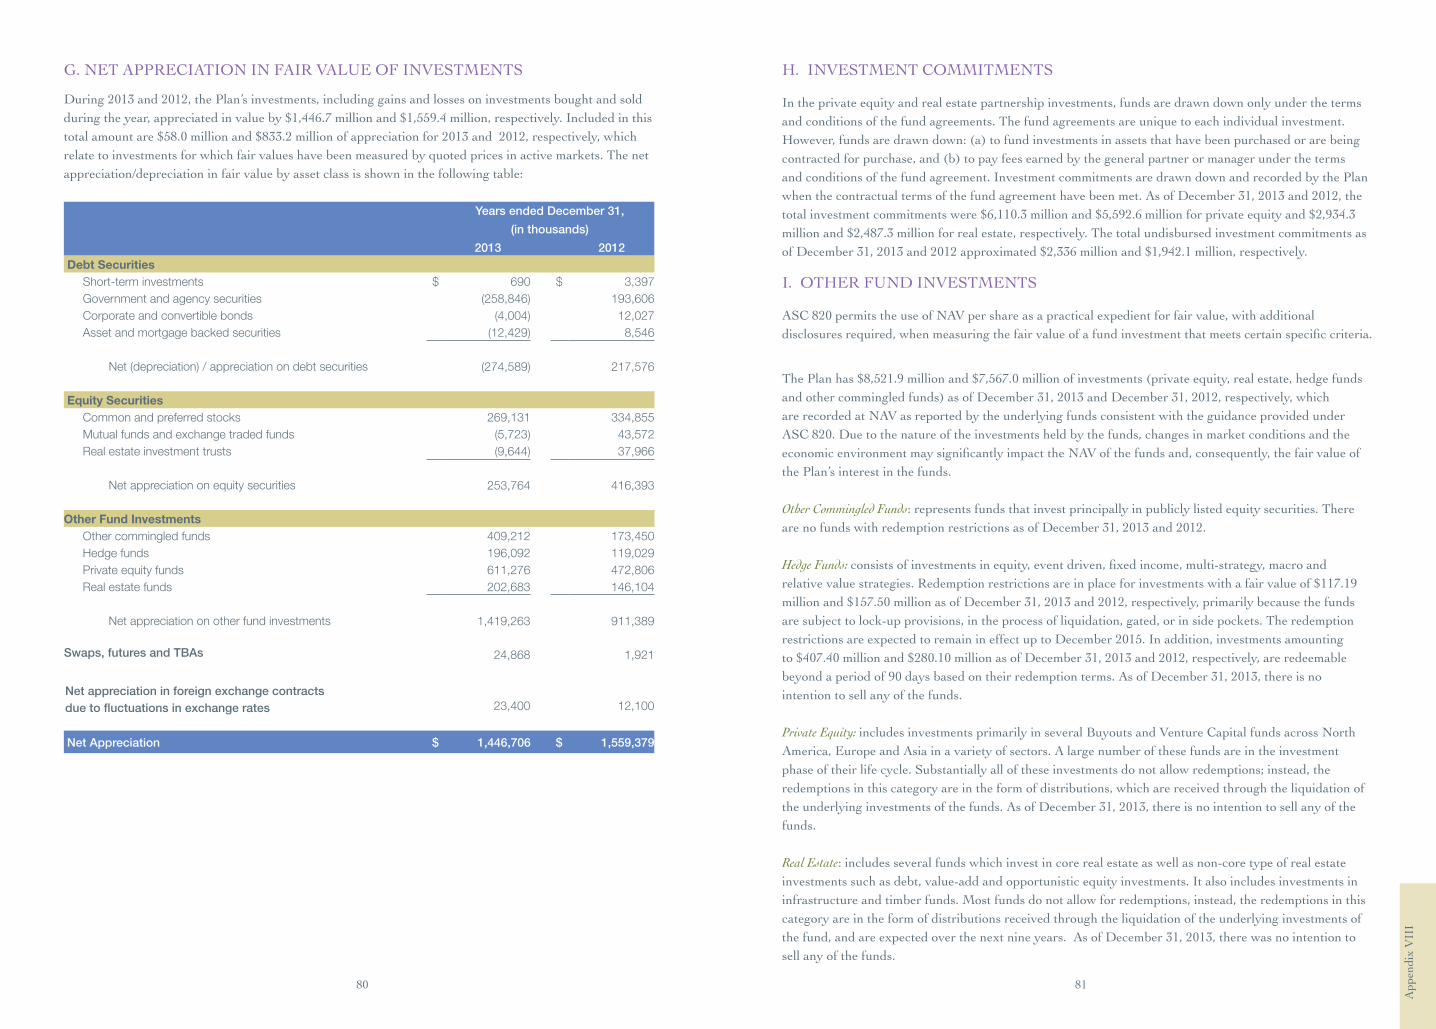
80 81
App
endi
x V
III
G. NET APPRECIATION IN FAIR VALUE OF INVESTMENTS
During 2013 and 2012, the Plan’s investments, including gains and losses on investments bought and sold duringtheyear,appreciatedinvalueby$1,446.7millionand$1,559.4million,respectively.Includedinthistotalamountare$58.0millionand$833.2millionofappreciationfor2013and2012,respectively,whichrelate to investments for which fair values have been measured by quoted prices in active markets. The net appreciation/depreciation in fair value by asset class is shown in the following table:
Years ended December 31, (in thousands) 2013 2012 Debt Securities Short-term investments $ 690 $ 3,397 Government and agency securities (258,846) 193,606 Corporate and convertible bonds (4,004) 12,027 Asset and mortgage backed securities (12,429) 8,546 Net (depreciation) / appreciation on debt securities (274,589) 217,576 Equity Securities Common and preferred stocks 269,131 334,855 Mutual funds and exchange traded funds (5,723) 43,572 Real estate investment trusts (9,644) 37,966 Net appreciation on equity securities 253,764 416,393 Other Fund Investments Other commingled funds 409,212 173,450 Hedge funds 196,092 119,029 Private equity funds 611,276 472,806 Real estate funds 202,683 146,104 Net appreciation on other fund investments 1,419,263 911,389
24,868 1,921 23,400 12,100
Net Appreciation $ 1,446,706 $ 1,559,379
H. INVESTMENT COMMITMENTS
In the private equity and real estate partnership investments, funds are drawn down only under the terms and conditions of the fund agreements. The fund agreements are unique to each individual investment. However,fundsaredrawndown:(a)tofundinvestmentsinassetsthathavebeenpurchasedorarebeingcontractedforpurchase,and(b)topayfeesearnedbythegeneralpartnerormanagerunderthetermsand conditions of the fund agreement. Investment commitments are drawn down and recorded by the Plan when the contractual terms of the fund agreement have been met. As of December 31, 2013 and 2012, the totalinvestmentcommitmentswere$6,110.3millionand$5,592.6 millionforprivateequityand$2,934.3millionand$2,487.3millionforrealestate,respectively.ThetotalundisbursedinvestmentcommitmentsasofDecember31,2013and2012approximated$2,336millionand$1,942.1million,respectively.
I. OTHER FUND INVESTMENTS
ASC 820 permits the use of NAV per share as a practical expedient for fair value, with additional disclosuresrequired,whenmeasuringthefairvalueofafundinvestmentthatmeetscertainspecificcriteria.
ThePlanhas$8,521.9millionand$7,567.0millionofinvestments(privateequity,realestate,hedgefundsandothercommingledfunds)asofDecember31,2013andDecember31,2012,respectively,whichare recorded at NAV as reported by the underlying funds consistent with the guidance provided under ASC 820. Due to the nature of the investments held by the funds, changes in market conditions and the economicenvironmentmaysignificantlyimpacttheNAVofthefundsand,consequently,thefairvalueofthe Plan’s interest in the funds.
Other Commingled Funds: represents funds that invest principally in publicly listed equity securities. There are no funds with redemption restrictions as of December 31, 2013 and 2012.
Hedge Funds: consistsofinvestmentsinequity,eventdriven,fixedincome,multi-strategy,macroandrelativevaluestrategies.Redemptionrestrictionsareinplaceforinvestmentswithafairvalueof$117.19millionand$157.50millionasofDecember31,2013and2012,respectively,primarilybecausethefundsare subject to lock-up provisions, in the process of liquidation, gated, or in side pockets. The redemption restrictionsareexpectedtoremainineffectuptoDecember2015.Inaddition,investmentsamountingto$407.40millionand$280.10millionasofDecember31,2013and2012,respectively,areredeemablebeyondaperiodof90daysbasedontheirredemptionterms.AsofDecember31,2013,thereisnointention to sell any of the funds.
Private Equity: includes investments primarily in several Buyouts and Venture Capital funds across North America, Europe and Asia in a variety of sectors. A large number of these funds are in the investment phaseoftheirlifecycle.Substantiallyalloftheseinvestmentsdonotallowredemptions;instead,theredemptions in this category are in the form of distributions, which are received through the liquidation of the underlying investments of the funds. As of December 31, 2013, there is no intention to sell any of the funds.
Real Estate: includes several funds which invest in core real estate as well as non-core type of real estate investments such as debt, value-add and opportunistic equity investments. It also includes investments in infrastructure and timber funds. Most funds do not allow for redemptions, instead, the redemptions in this category are in the form of distributions received through the liquidation of the underlying investments of the fund, and are expected over the next nine years. As of December 31, 2013, there was no intention to sell any of the funds.
Swaps, futures and TBAs
Net appreciation in foreign exchange contractsdue to fluctuations in exchange rates
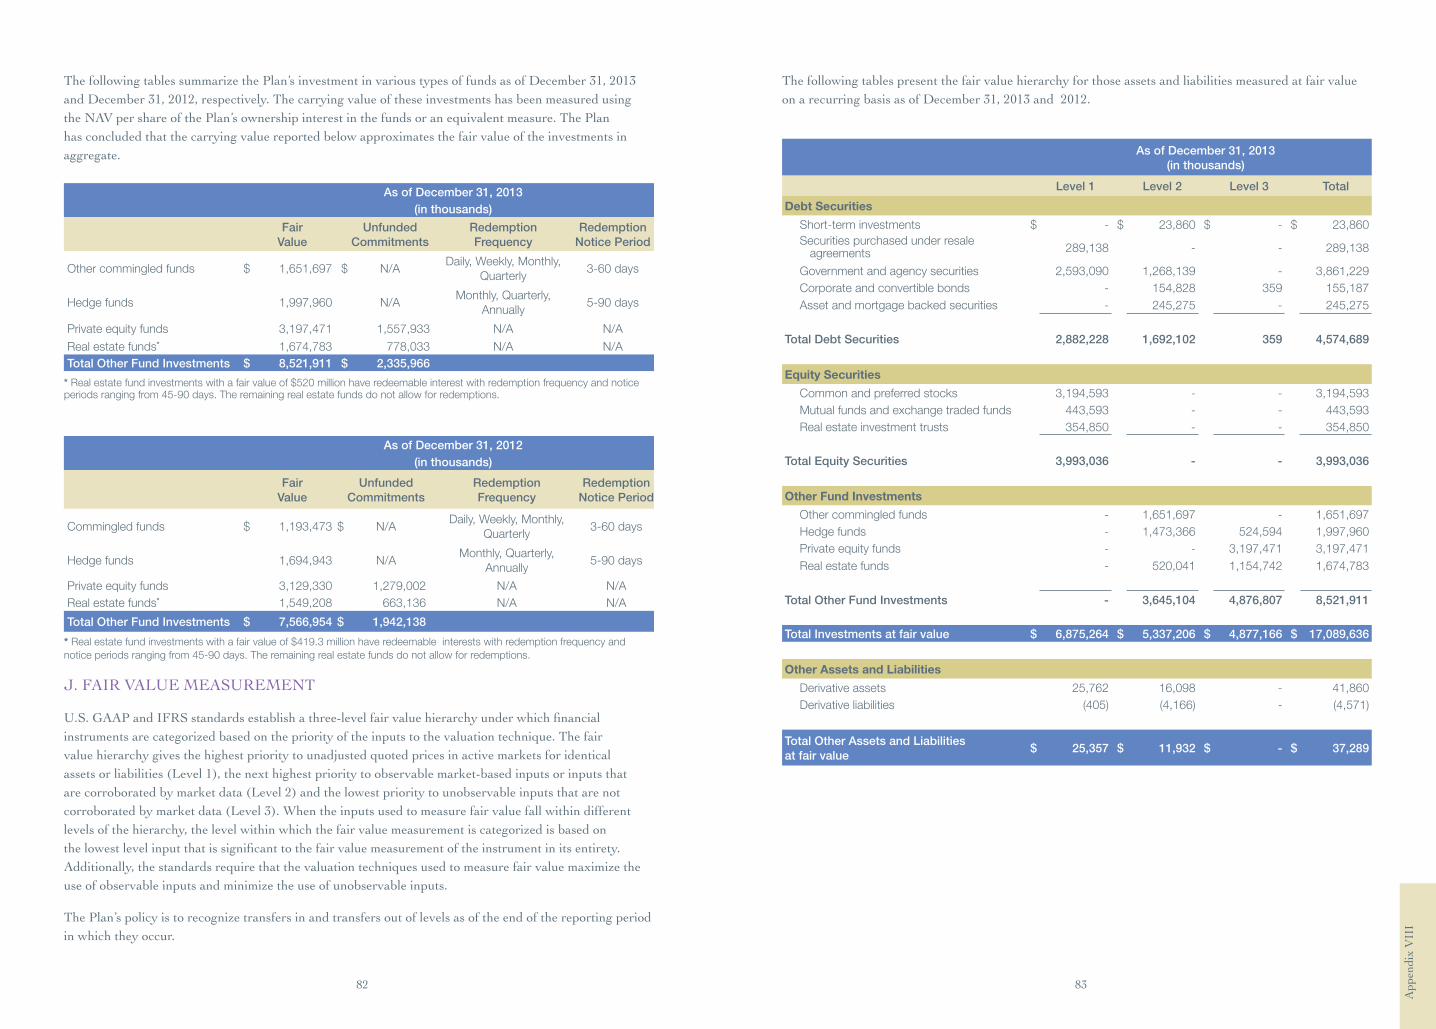
82 83
App
endi
x V
III
The following tables summarize the Plan’s investment in various types of funds as of December 31, 2013 and December 31, 2012, respectively. The carrying value of these investments has been measured using the NAV per share of the Plan’s ownership interest in the funds or an equivalent measure. The Plan has concluded that the carrying value reported below approximates the fair value of the investments in aggregate.
As of December 31, 2013 (in thousands)
Fair
Value
Unfunded Commitments
RedemptionFrequency
Redemption Notice Period
Other commingled funds $ 1,651,697 $ N/A Daily, Weekly, Monthly,
Quarterly3-60 days
Hedge funds 1,997,960 N/A Monthly, Quarterly,
Annually5-90 days
Private equity funds 3,197,471 1,557,933 N/A N/A
Real estate funds* 1,674,783 778,033 N/A N/A Total Other Fund Investments $ 8,521,911 $ 2,335,966
* Real estate fund investments with a fair value of $520 million have redeemable interest with redemption frequency and notice periods ranging from 45-90 days. The remaining real estate funds do not allow for redemptions.
As of December 31, 2012 (in thousands)
Fair
Value
Unfunded Commitments
Redemption Frequency
Redemption Notice Period
Commingled funds $ 1,193,473 $ N/A Daily, Weekly, Monthly,
Quarterly3-60 days
Hedge funds 1,694,943 N/A Monthly, Quarterly,
Annually5-90 days
Private equity funds 3,129,330 1,279,002 N/A N/A Real estate funds* 1,549,208 663,136 N/A N/A
Total Other Fund Investments $ 7,566,954 $ 1,942,138
* Real estate fund investments with a fair value of $419.3 million have redeemable interests with redemption frequency and notice periods ranging from 45-90 days. The remaining real estate funds do not allow for redemptions.
J. FAIR VALUE MEASUREMENT
U.S.GAAPandIFRSstandardsestablishathree-levelfairvaluehierarchyunderwhichfinancialinstruments are categorized based on the priority of the inputs to the valuation technique. The fair value hierarchy gives the highest priority to unadjusted quoted prices in active markets for identical assetsorliabilities(Level1),thenexthighestprioritytoobservablemarket-basedinputsorinputsthatarecorroboratedbymarketdata(Level2)andthelowestprioritytounobservableinputsthatarenotcorroboratedbymarketdata(Level3).Whentheinputsusedtomeasurefairvaluefallwithindifferentlevels of the hierarchy, the level within which the fair value measurement is categorized is based on thelowestlevelinputthatissignificanttothefairvaluemeasurementoftheinstrumentinitsentirety.Additionally, the standards require that the valuation techniques used to measure fair value maximize the use of observable inputs and minimize the use of unobservable inputs.
The Plan’s policy is to recognize transfers in and transfers out of levels as of the end of the reporting period in which they occur.
The following tables present the fair value hierarchy for those assets and liabilities measured at fair value on a recurring basis as of December 31, 2013 and 2012.
As of December 31, 2013
(in thousands)
Level 1 Level 2 Level 3 Total
Debt Securities
Short-term investments $ - $ 23,860 $ - $ 23,860
Securities purchased under resale agreements
289,138 - - 289,138
Government and agency securities 2,593,090 1,268,139 - 3,861,229 Corporate and convertible bonds - 154,828 359 155,187 Asset and mortgage backed securities - 245,275 - 245,275 Total Debt Securities 2,882,228 1,692,102 359 4,574,689
Equity Securities
Common and preferred stocks 3,194,593 - - 3,194,593 Mutual funds and exchange traded funds 443,593 - - 443,593 Real estate investment trusts 354,850 - - 354,850 Total Equity Securities 3,993,036 - - 3,993,036
Other Fund Investments
Other commingled funds - 1,651,697 - 1,651,697 Hedge funds - 1,473,366 524,594 1,997,960 Private equity funds - - 3,197,471 3,197,471 Real estate funds - 520,041 1,154,742 1,674,783 Total Other Fund Investments - 3,645,104 4,876,807 8,521,911 Total Investments at fair value $ 6,875,264 $ 5,337,206 $ 4,877,166 $ 17,089,636
Other Assets and Liabilities
Derivative assets 25,762 16,098 - 41,860 Derivative liabilities (405) (4,166) - (4,571)
Total Other Assets and Liabilities at fair value
$ 25,357 $ 11,932 $ - $ 37,289
agreements
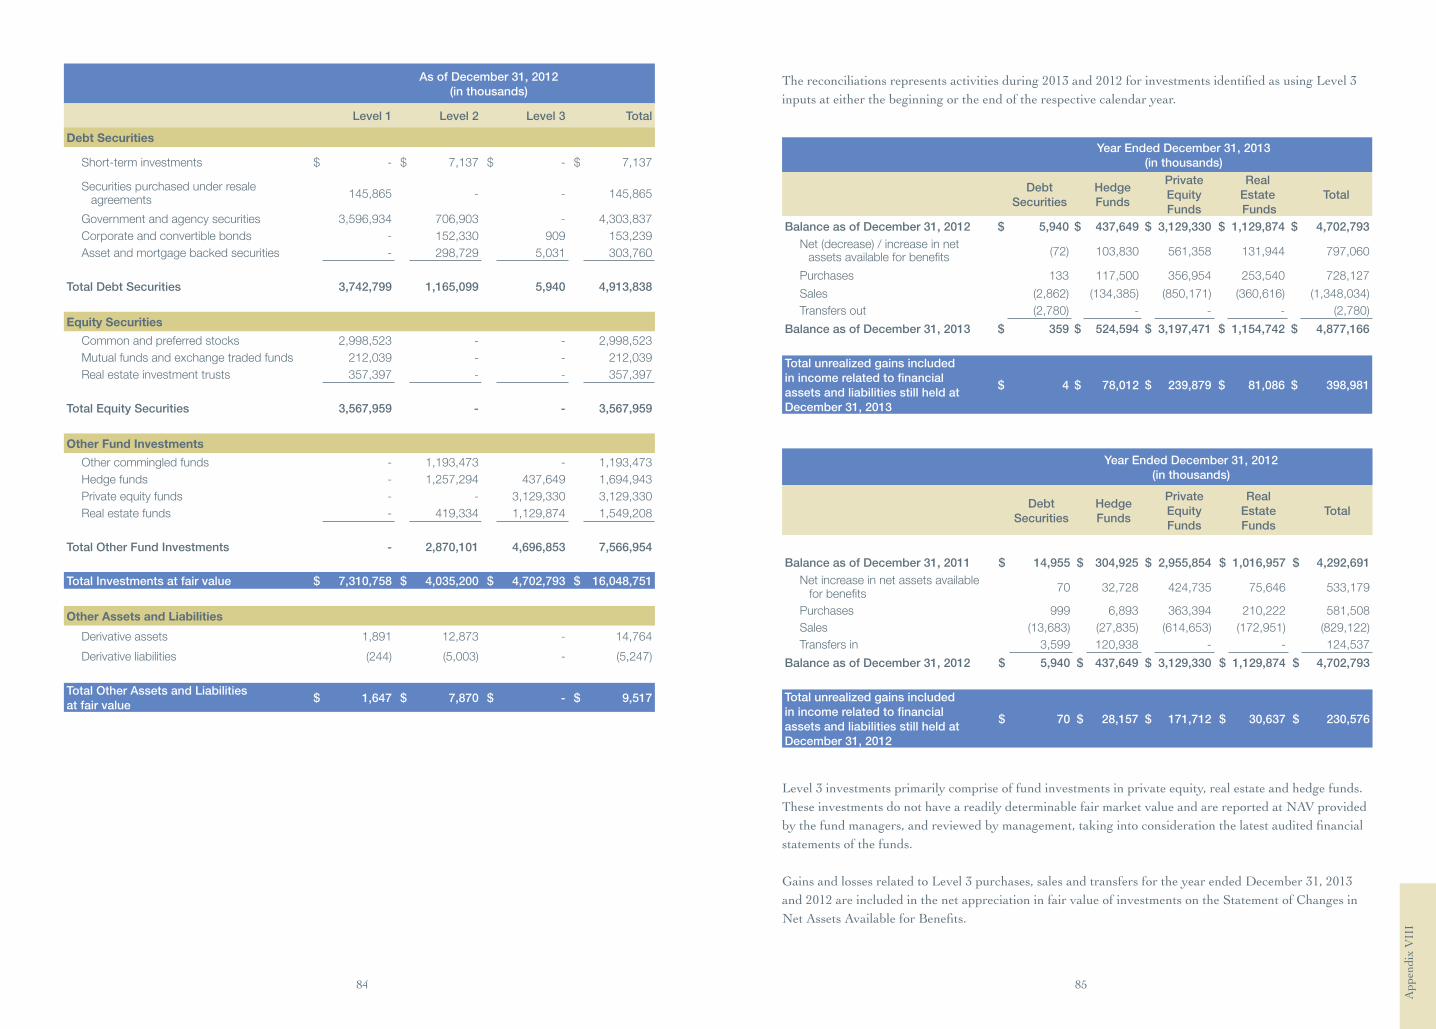
84 85
App
endi
x V
III
As of December 31, 2012
(in thousands)
Level 1 Level 2 Level 3 Total
Debt Securities
Short-term investments $ - $ 7,137 $ - $ 7,137
Securities purchased under resale agreements
145,865 - - 145,865
Government and agency securities 3,596,934 706,903 - 4,303,837 Corporate and convertible bonds - 152,330 909 153,239 Asset and mortgage backed securities - 298,729 5,031 303,760 Total Debt Securities 3,742,799 1,165,099 5,940 4,913,838
Equity Securities
Common and preferred stocks 2,998,523 - - 2,998,523 Mutual funds and exchange traded funds 212,039 - - 212,039 Real estate investment trusts 357,397 - - 357,397 Total Equity Securities 3,567,959 - - 3,567,959
Other Fund Investments
Other commingled funds - 1,193,473 - 1,193,473 Hedge funds - 1,257,294 437,649 1,694,943 Private equity funds - - 3,129,330 3,129,330 Real estate funds - 419,334 1,129,874 1,549,208 Total Other Fund Investments - 2,870,101 4,696,853 7,566,954 Total Investments at fair value $ 7,310,758 $ 4,035,200 $ 4,702,793 $ 16,048,751
Other Assets and Liabilities
Derivative assets 1,891 12,873 - 14,764
Derivative liabilities (244) (5,003) - (5,247)
Total Other Assets and Liabilities at fair value
$ 1,647 $ 7,870 $ - $ 9,517
Thereconciliationsrepresentsactivitiesduring2013and2012forinvestmentsidentifiedasusingLevel3inputs at either the beginning or the end of the respective calendar year.
Year Ended December 31, 2013
(in thousands)
Debt
Securities
Hedge Funds
Private Equity Funds
Real
Estate Funds
Total
Balance as of December 31, 2012 $ 5,940 $ 437,649 $ 3,129,330 $ 1,129,874 $ 4,702,793
Net (decrease) / increase in net assets available for benefits
(72) 103,830 561,358 131,944 797,060
Purchases 133 117,500 356,954 253,540 728,127
Sales (2,862) (134,385) (850,171) (360,616) (1,348,034) Transfers out (2,780) - - - (2,780)
Balance as of December 31, 2013 $ 359 $ 524,594 $ 3,197,471 $ 1,154,742 $ 4,877,166
Total unrealized gains included in income related to financial assets and liabilities still held at December 31, 2013
$ 4 $ 78,012 $ 239,879 $ 81,086 $ 398,981
Year Ended December 31, 2012
(in thousands)
Debt
Securities
Hedge Funds
Private Equity Funds
Real
Estate Funds
Total
Balance as of December 31, 2011 $ 14,955 $ 304,925 $ 2,955,854 $ 1,016,957 $ 4,292,691
Net increase in net assets available for benefits
70 32,728 424,735 75,646 533,179
Purchases 999 6,893 363,394 210,222 581,508 Sales (13,683) (27,835) (614,653) (172,951) (829,122) Transfers in 3,599 120,938 - - 124,537
Balance as of December 31, 2012 $ 5,940 $ 437,649 $ 3,129,330 $ 1,129,874 $ 4,702,793
Total unrealized gains included in income related to financial assets and liabilities still held at December 31, 2012
$ 70 $ 28,157 $ 171,712 $ 30,637 $ 230,576
Level 3 investments primarily comprise of fund investments in private equity, real estate and hedge funds. These investments do not have a readily determinable fair market value and are reported at NAV provided bythefundmanagers,andreviewedbymanagement,takingintoconsiderationthelatestauditedfinancialstatements of the funds.
Gains and losses related to Level 3 purchases, sales and transfers for the year ended December 31, 2013 and 2012 are included in the net appreciation in fair value of investments on the Statement of Changes in NetAssetsAvailableforBenefits.
agreements
assets available for benefits
for benefits
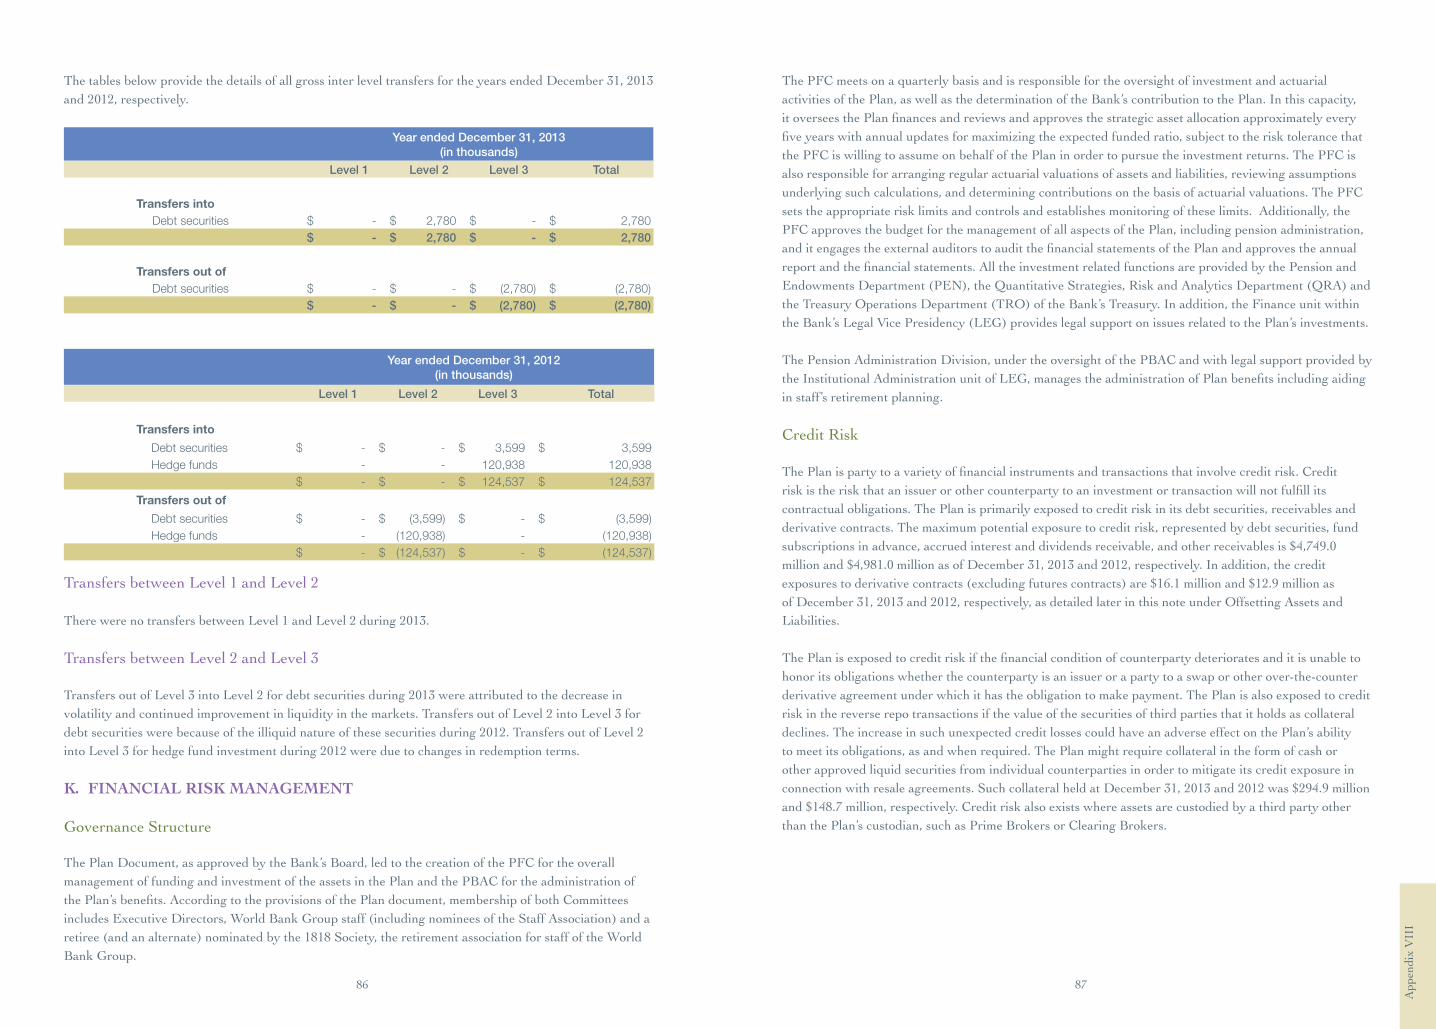
86 87
App
endi
x V
III
The tables below provide the details of all gross inter level transfers for the years ended December 31, 2013 and 2012, respectively.
Year ended December 31, 2013
(in thousands)
Level 1 Level 2 Level 3 Total Transfers into Debt securities $ - $ 2,780 $ - $ 2,780 $ - $ 2,780 $ - $ 2,780 Transfers out of Debt securities $ - $ - $ (2,780) $ (2,780) $ - $ - $ (2,780) $ (2,780)
Year ended December 31, 2012
(in thousands) Level 1 Level 2 Level 3 Total Transfers into Debt securities $ - $ - $ 3,599 $ 3,599 Hedge funds - - 120,938 120,938 $ - $ - $ 124,537 $ 124,537 Transfers out of Debt securities $ - $ (3,599) $ - $ (3,599) Hedge funds - (120,938) - (120,938) $ - $ (124,537) $ - $ (124,537)
Transfers between Level 1 and Level 2
There were no transfers between Level 1 and Level 2 during 2013.
Transfers between Level 2 and Level 3
Transfers out of Level 3 into Level 2 for debt securities during 2013 were attributed to the decrease in volatility and continued improvement in liquidity in the markets. Transfers out of Level 2 into Level 3 for debt securities were because of the illiquid nature of these securities during 2012. Transfers out of Level 2 into Level 3 for hedge fund investment during 2012 were due to changes in redemption terms.
K. FINANCIAL RISK MANAGEMENT
Governance Structure
The Plan Document, as approved by the Bank’s Board, led to the creation of the PFC for the overall management of funding and investment of the assets in the Plan and the PBAC for the administration of thePlan’sbenefits.AccordingtotheprovisionsofthePlandocument,membershipofbothCommitteesincludesExecutiveDirectors,WorldBankGroupstaff(includingnomineesoftheStaffAssociation)andaretiree(andanalternate)nominatedbythe1818Society,theretirementassociationforstaffoftheWorldBank Group.
The PFC meets on a quarterly basis and is responsible for the oversight of investment and actuarial activities of the Plan, as well as the determination of the Bank’s contribution to the Plan. In this capacity, itoverseesthePlanfinancesandreviewsandapprovesthestrategicassetallocationapproximatelyeveryfiveyearswithannualupdatesformaximizingtheexpectedfundedratio,subjecttotherisktolerancethatthe PFC is willing to assume on behalf of the Plan in order to pursue the investment returns. The PFC is also responsible for arranging regular actuarial valuations of assets and liabilities, reviewing assumptions underlying such calculations, and determining contributions on the basis of actuarial valuations. The PFC sets the appropriate risk limits and controls and establishes monitoring of these limits. Additionally, the PFC approves the budget for the management of all aspects of the Plan, including pension administration, anditengagestheexternalauditorstoauditthefinancialstatementsofthePlanandapprovestheannualreportandthefinancialstatements.AlltheinvestmentrelatedfunctionsareprovidedbythePensionandEndowmentsDepartment(PEN),theQuantitativeStrategies,RiskandAnalyticsDepartment(QRA)andtheTreasuryOperationsDepartment(TRO)oftheBank’sTreasury.Inaddition,theFinanceunitwithintheBank’sLegalVicePresidency(LEG)provideslegalsupportonissuesrelatedtothePlan’sinvestments.
The Pension Administration Division, under the oversight of the PBAC and with legal support provided by theInstitutionalAdministrationunitofLEG,managestheadministrationofPlanbenefitsincludingaidingin staff’s retirement planning.
Credit Risk
ThePlanispartytoavarietyoffinancialinstrumentsandtransactionsthatinvolvecreditrisk.Creditriskistheriskthatanissuerorothercounterpartytoaninvestmentortransactionwillnotfulfillitscontractual obligations. The Plan is primarily exposed to credit risk in its debt securities, receivables and derivative contracts. The maximum potential exposure to credit risk, represented by debt securities, fund subscriptionsinadvance,accruedinterestanddividendsreceivable,andotherreceivablesis$4,749.0millionand$4,981.0millionasofDecember31,2013and2012,respectively.Inaddition,thecreditexposurestoderivativecontracts(excludingfuturescontracts)are$16.1millionand$12.9millionasof December 31, 2013 and 2012, respectively, as detailed later in this note under Offsetting Assets and Liabilities.
ThePlanisexposedtocreditriskifthefinancialconditionofcounterpartydeterioratesanditisunabletohonor its obligations whether the counterparty is an issuer or a party to a swap or other over-the-counter derivative agreement under which it has the obligation to make payment. The Plan is also exposed to credit risk in the reverse repo transactions if the value of the securities of third parties that it holds as collateral declines. The increase in such unexpected credit losses could have an adverse effect on the Plan’s ability to meet its obligations, as and when required. The Plan might require collateral in the form of cash or other approved liquid securities from individual counterparties in order to mitigate its credit exposure in connectionwithresaleagreements.SuchcollateralheldatDecember31,2013and2012was$294.9millionand$148.7million,respectively.Creditriskalsoexistswhereassetsarecustodiedbyathirdpartyotherthan the Plan’s custodian, such as Prime Brokers or Clearing Brokers.
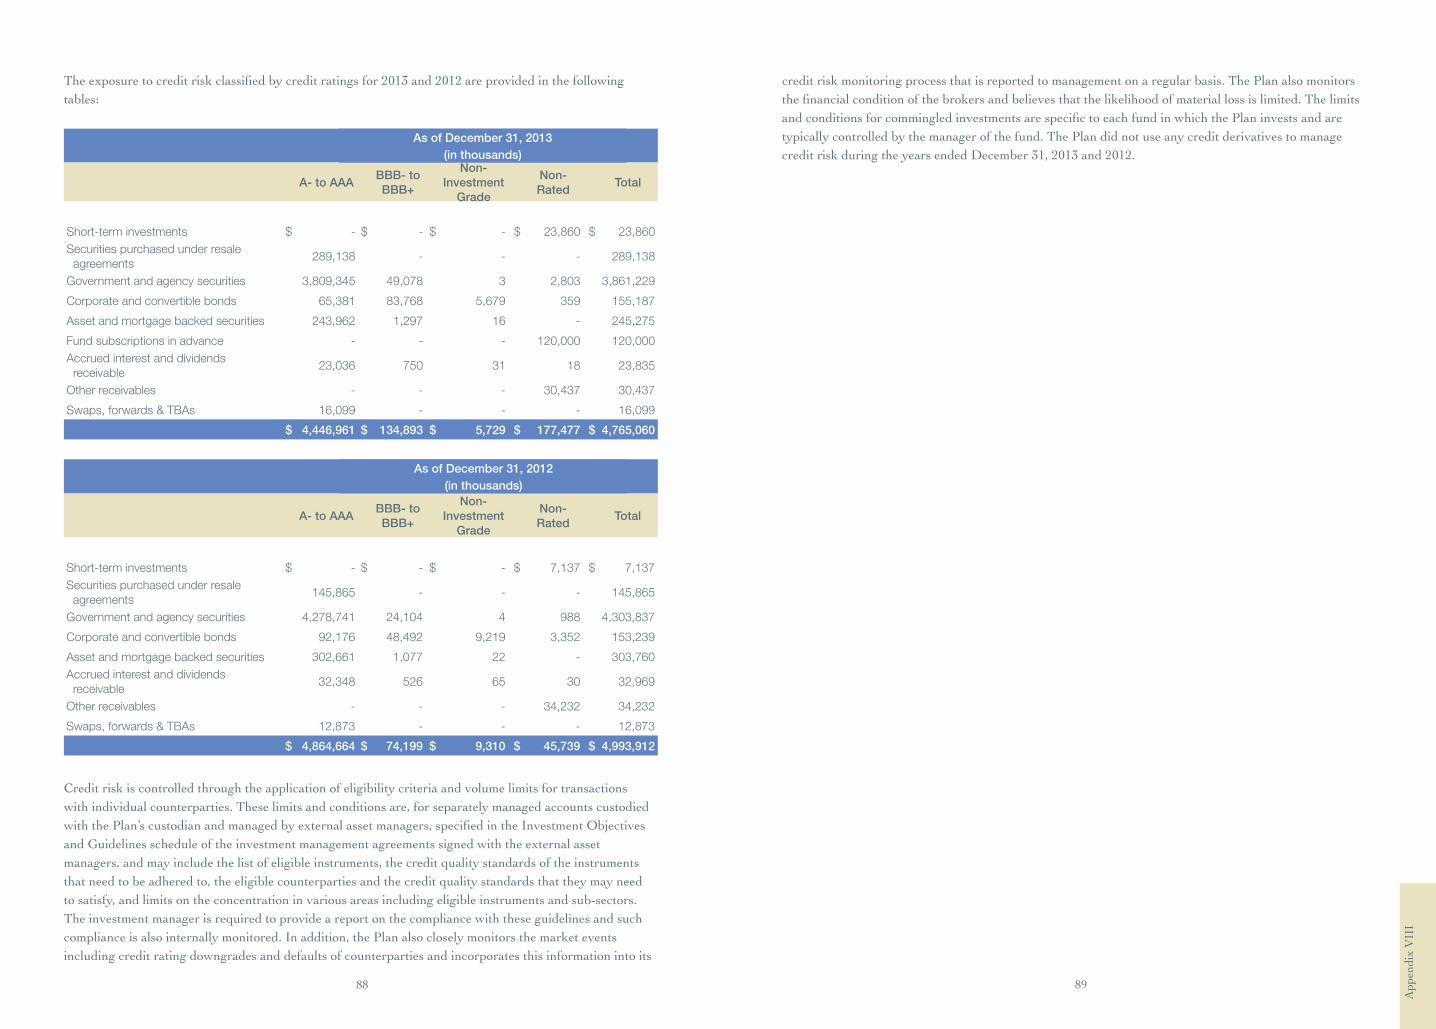
88 89
App
endi
x V
III
Theexposuretocreditriskclassifiedbycreditratingsfor2013and2012areprovidedinthefollowingtables:
As of December 31, 2013 (in thousands)
A- to AAA BBB- to BBB+
Non-
Investment Grade
Non- Rated
Total
Short-term investments $ - $ - $ - $ 23,860 $ 23,860 Securities purchased under resale agreements
289,138 - - - 289,138
Government and agency securities 3,809,345 49,078 3 2,803 3,861,229
Corporate and convertible bonds 65,381 83,768 5,679 359 155,187
Asset and mortgage backed securities 243,962 1,297 16 - 245,275
Fund subscriptions in advance - - - 120,000 120,000 Accrued interest and dividends receivable
23,036 750 31 18 23,835
Other receivables - - - 30,437 30,437
Swaps, forwards & TBAs 16,099 - - - 16,099
$ 4,446,961 $ 134,893 $ 5,729 $ 177,477 $ 4,765,060
As of December 31, 2012 (in thousands)
A- to AAA BBB- to BBB+
Non-
Investment Grade
Non- Rated
Total
Short-term investments $ - $ - $ - $ 7,137 $ 7,137 Securities purchased under resale agreements
145,865 - - - 145,865
Government and agency securities 4,278,741 24,104 4 988 4,303,837
Corporate and convertible bonds 92,176 48,492 9,219 3,352 153,239
Asset and mortgage backed securities 302,661 1,077 22 - 303,760 Accrued interest and dividends receivable
32,348 526 65 30 32,969
Other receivables - - - 34,232 34,232
Swaps, forwards & TBAs 12,873 - - - 12,873
$ 4,864,664 $ 74,199 $ 9,310 $ 45,739 $ 4,993,912
Credit risk is controlled through the application of eligibility criteria and volume limits for transactions with individual counterparties. These limits and conditions are, for separately managed accounts custodied withthePlan’scustodianandmanagedbyexternalassetmanagers,specifiedintheInvestmentObjectivesand Guidelines schedule of the investment management agreements signed with the external asset managers, and may include the list of eligible instruments, the credit quality standards of the instruments that need to be adhered to, the eligible counterparties and the credit quality standards that they may need to satisfy, and limits on the concentration in various areas including eligible instruments and sub-sectors. The investment manager is required to provide a report on the compliance with these guidelines and such compliance is also internally monitored. In addition, the Plan also closely monitors the market events including credit rating downgrades and defaults of counterparties and incorporates this information into its
credit risk monitoring process that is reported to management on a regular basis. The Plan also monitors thefinancialconditionofthebrokersandbelievesthatthelikelihoodofmateriallossislimited.ThelimitsandconditionsforcommingledinvestmentsarespecifictoeachfundinwhichthePlaninvestsandaretypically controlled by the manager of the fund. The Plan did not use any credit derivatives to manage credit risk during the years ended December 31, 2013 and 2012.
As of December 31, 2012 (in thousands)
As of December 31, 2013 (in thousands)
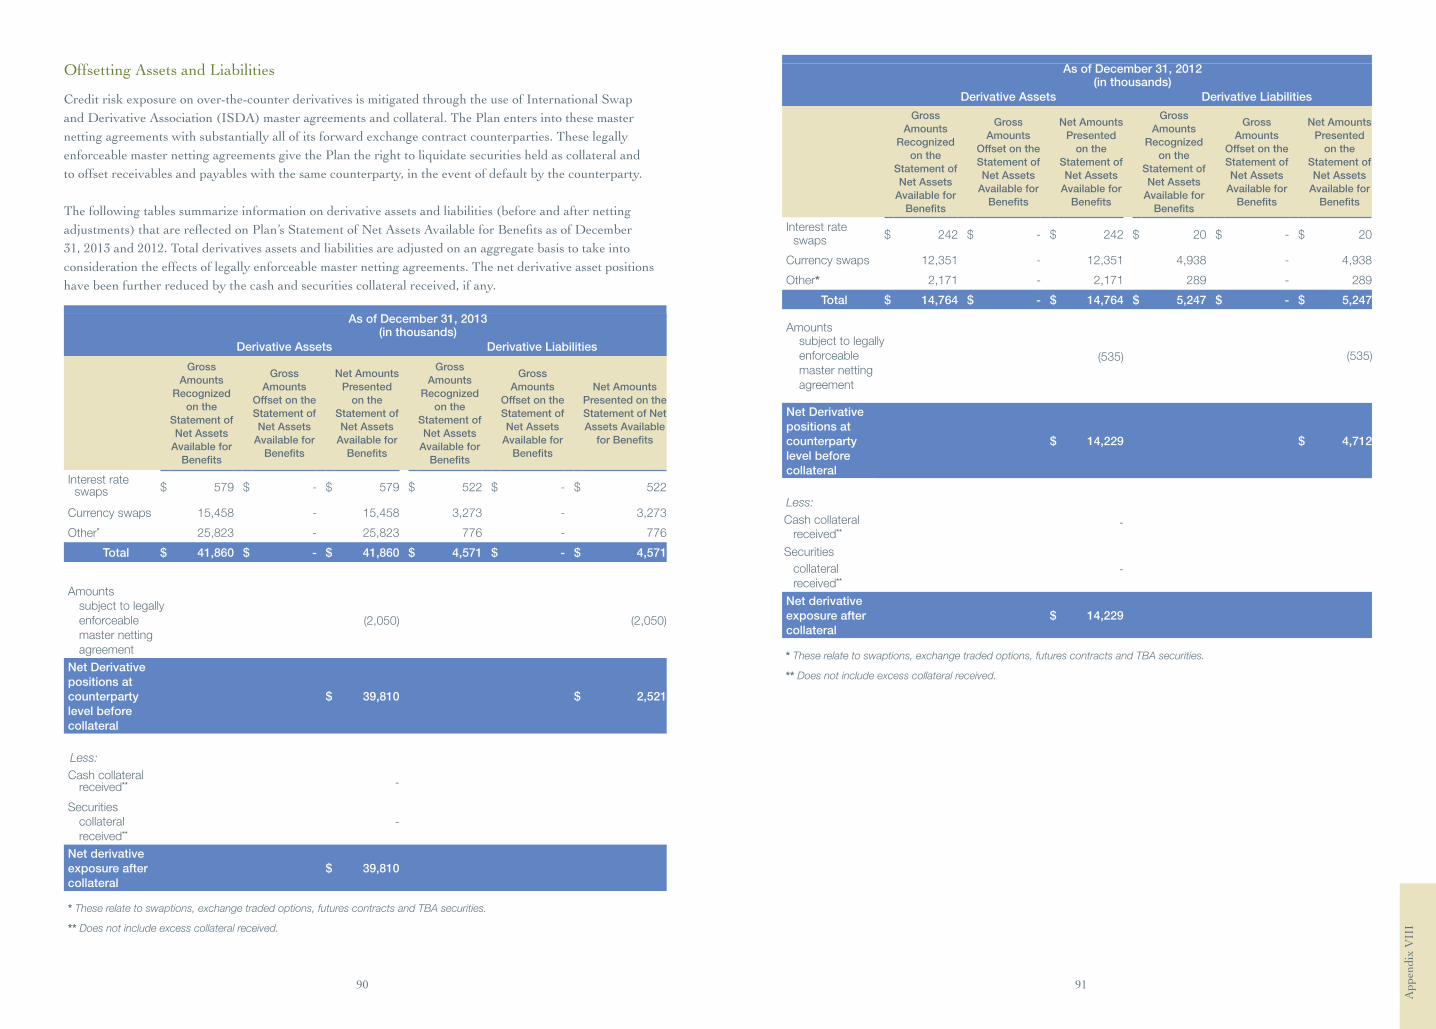
90 91
App
endi
x V
III
Offsetting Assets and Liabilities
Credit risk exposure on over-the-counter derivatives is mitigated through the use of International Swap andDerivativeAssociation(ISDA)masteragreementsandcollateral.ThePlanentersintothesemasternetting agreements with substantially all of its forward exchange contract counterparties. These legally enforceable master netting agreements give the Plan the right to liquidate securities held as collateral and to offset receivables and payables with the same counterparty, in the event of default by the counterparty.
The following tables summarize information on derivative assets and liabilities (before and after netting adjustments)thatarereflectedonPlan’sStatementofNetAssetsAvailableforBenefitsasofDecember31, 2013 and 2012. Total derivatives assets and liabilities are adjusted on an aggregate basis to take into consideration the effects of legally enforceable master netting agreements. The net derivative asset positions have been further reduced by the cash and securities collateral received, if any.
As of December 31, 2013 (in thousands)
Derivative Assets Derivative Liabilities
Gross Amounts
Recognized on the
Statement of Net Assets
Available for Benefits
Gross Amounts
Offset on the Statement of Net Assets
Available for Benefits
Net Amounts Presented
on the Statement of Net Assets
Available for Benefits
Gross Amounts
Recognized on the
Statement of Net Assets
Available for Benefits
Gross Amounts
Offset on the Statement of Net Assets
Available for Benefits
Net Amounts Presented on the Statement of Net Assets Available
for Benefits
Interest rate swaps $ 579 $ - $ 579 $ 522 $ - $ 522
Currency swaps 15,458 - 15,458 3,273 - 3,273
Other* 25,823 - 25,823 776 - 776
Total $ 41,860 $ - $ 41,860 $ 4,571 $ - $ 4,571
Amounts subject to legally enforceable master netting agreement
(2,050) (2,050)
Net Derivative positions at counterparty level before collateral
$ 39,810 $ 2,521
Less:
Cash collateral received**
-
Securities collateral received**
-
Net derivative exposure after collateral
$ 39,810
* These relate to swaptions, exchange traded options, futures contracts and TBA securities.
** Does not include excess collateral received.
As of December 31, 2012 (in thousands)
Derivative Assets Derivative Liabilities
Gross Amounts
Recognized on the
Statement of Net Assets
Available for Benefits
Gross Amounts
Offset on the Statement of Net Assets
Available for Benefits
Net Amounts Presented
on the Statement of Net Assets
Available for Benefits
Gross Amounts
Recognized on the
Statement of Net Assets
Available for Benefits
Gross Amounts
Offset on the Statement of Net Assets
Available for Benefits
Net Amounts Presented
on the Statement of Net Assets
Available for Benefits
Interest rate swaps $ 242 $ - $ 242 $ 20 $ - $ 20
Currency swaps 12,351 - 12,351 4,938 - 4,938
Other* 2,171 - 2,171 289 - 289
Total $ 14,764 $ - $ 14,764 $ 5,247 $ - $ 5,247
Amounts subject to legally enforceable master netting agreement
(535)
(535)
Net Derivative positions at counterparty level before collateral
$ 14,229 $ 4,712
Less:
Cash collateral received**
-
Securities collateral received**
-
Net derivative exposure after collateral
$ 14,229
* These relate to swaptions, exchange traded options, futures contracts and TBA securities.
** Does not include excess collateral received.
swaps
subject to legally enforceable master netting agreement
received**
collateral received**
* These relate to swaptions, exchange traded options, futures contracts and TBA securities.
** Does not include excess collateral received.
swaps
subject to legally enforceable master netting agreement
(535)
* These relate to swaptions, exchange traded options, futures contracts and TBA securities.
** Does not include excess collateral received.
Less: Cash collateral received**
Securities collateral received**
received**
collateral received**
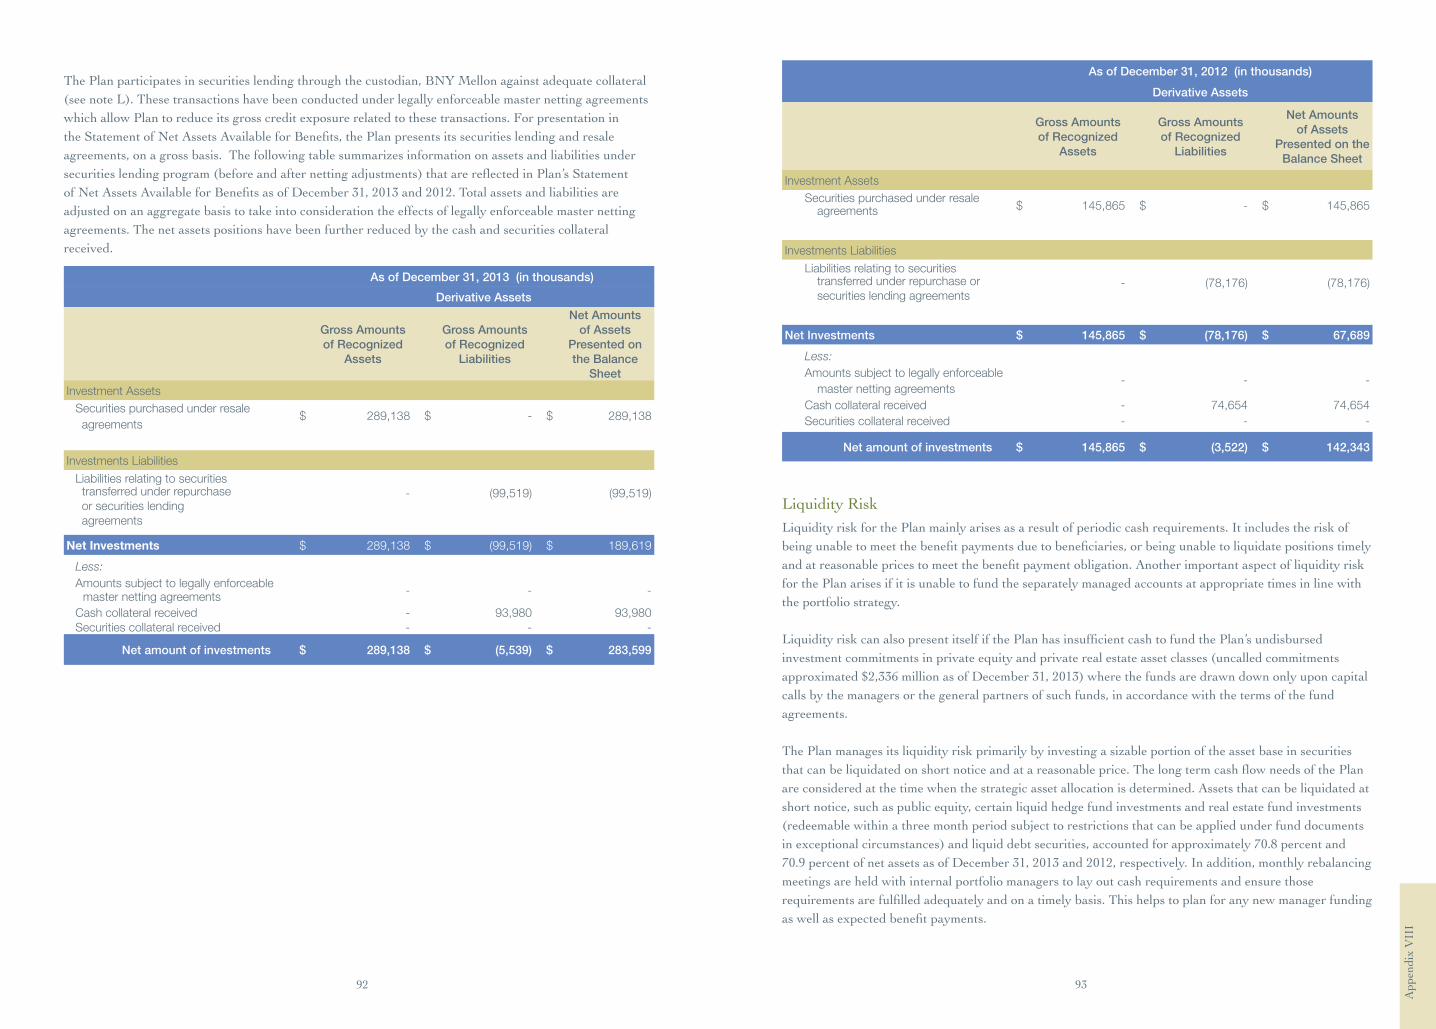
92 93
App
endi
x V
III
The Plan participates in securities lending through the custodian, BNY Mellon against adequate collateral (seenoteL).Thesetransactionshavebeenconductedunderlegallyenforceablemasternettingagreementswhich allow Plan to reduce its gross credit exposure related to these transactions. For presentation in theStatementofNetAssetsAvailableforBenefits,thePlanpresentsitssecuritieslendingandresaleagreements, on a gross basis. The following table summarizes information on assets and liabilities under securitieslendingprogram(beforeandafternettingadjustments)thatarereflectedinPlan’sStatementofNetAssetsAvailableforBenefitsasofDecember31,2013and2012.Totalassetsandliabilitiesareadjusted on an aggregate basis to take into consideration the effects of legally enforceable master netting agreements. The net assets positions have been further reduced by the cash and securities collateral received.
Derivative Assets
Gross Amounts of Recognized
Assets
Gross Amounts of Recognized
Liabilities
Net Amounts of Assets
Presented on the Balance
SheetInvestment Assets
Securities purchased under resale agreements
$ 289,138 $ - $ 289,138
Investments Liabilities
Liabilities relating to securities transferred under repurchase or securities lending agreements
- (99,519) (99,519)
Net Investments $ 289,138 $ (99,519) $ 189,619
Less:
Amounts subject to legally enforceable master netting agreements
- - -
Cash collateral receivedSecurities collateral received
- -
93,980
-
93,980 -
Net amount of investments $ 289,138 $ (5,539) $ 283,599
As of December 31, 2012 (in thousands)
Derivative Assets
Gross Amounts of Recognized
Assets
Gross Amounts of Recognized
Liabilities
Net Amounts of Assets
Presented on the Balance Sheet
Investment Assets
Securities purchased under resale agreements $ 145,865 $ - $ 145,865
Investments Liabilities
Liabilities relating to securities transferred under repurchase or securities lending agreements
- (78,176) (78,176)
Net Investments $ 145,865 $ (78,176) $ 67,689
Less:
Amounts subject to legally enforceable master netting agreements
- - -
Cash collateral receivedSecurities collateral received
- -
74,654-
74,654 -
Net amount of investments $ 145,865 $ (3,522) $ 142,343
Liquidity RiskLiquidity risk for the Plan mainly arises as a result of periodic cash requirements. It includes the risk of beingunabletomeetthebenefitpaymentsduetobeneficiaries,orbeingunabletoliquidatepositionstimelyandatreasonablepricestomeetthebenefitpaymentobligation.Anotherimportantaspectofliquidityriskfor the Plan arises if it is unable to fund the separately managed accounts at appropriate times in line with the portfolio strategy.
LiquidityriskcanalsopresentitselfifthePlanhasinsufficientcashtofundthePlan’sundisbursedinvestment commitments in private equity and private real estate asset classes (uncalled commitments approximated$2,336millionasofDecember31,2013)wherethefundsaredrawndownonlyuponcapitalcalls by the managers or the general partners of such funds, in accordance with the terms of the fund agreements.
The Plan manages its liquidity risk primarily by investing a sizable portion of the asset base in securities thatcanbeliquidatedonshortnoticeandatareasonableprice.ThelongtermcashflowneedsofthePlanare considered at the time when the strategic asset allocation is determined. Assets that can be liquidated at short notice, such as public equity, certain liquid hedge fund investments and real estate fund investments (redeemable within a three month period subject to restrictions that can be applied under fund documents inexceptionalcircumstances)andliquiddebtsecurities,accountedforapproximately70.8percentand70.9percentofnetassetsasofDecember31,2013and2012,respectively.Inaddition,monthlyrebalancingmeetings are held with internal portfolio managers to lay out cash requirements and ensure those requirementsarefulfilledadequatelyandonatimelybasis.Thishelpstoplanforanynewmanagerfundingaswellasexpectedbenefitpayments.
agreements
transferred under repurchase or securities lending agreements
master netting agreements
agreements
transferred under repurchase or securities lending agreements
master netting agreements
As of December 31, 2013 (in thousands)

94 95
App
endi
x V
III
Market Risk
Marketriskistheriskthatthefairvalueorfuturecashflowsofaninvestmentwillfluctuatebecauseofmarket movements, such as changes in interest rates, foreign exchange rates, equity prices etc. Market risk that the Plan is subject to is primarily comprised of the following:
a. Interest Rate Risk: the risk that changes in interest rates will adversely affect the Plan’s investments and liabilities. The Plan’s investments in debt securities and interest rate derivatives, as well as the Plan’s liabilities, are exposed to interest rate risk.
b. Currency Risk: the risk that movements in exchange rates will adversely affect the Plan. The Plan is exposed to currency risk through its holdings of non-U.S. dollar investment and liabilities.
c. Equity Risk: the risk that changes in stock prices will adversely affect the Plan. The Plan is exposed to equity risk through its investments in stocks and equity derivatives.
The PFC sets the overall level of market risk that it is willing to assume in order to achieve target investment returns. The objective of market risk management is to manage and control market risk exposures within acceptable parameters, while optimizing the return. The market risk is regularly monitored at the absolute level, as well as of the relative levels with respect to policy benchmarks, manager benchmarks and the liabilities.
The Plan uses a range of measures to assess the market risk of the portfolio. Under the asset-liability management framework adopted for the strategic asset allocation since 2007, the Surplus Volatility measure(theannualizedstandarddeviationofassetvaluesrelativetothatofliabilities)isconsideredtheprimary measure for assessing the Plan market risk.21 In addition, the Plan monitors the asset absolute risk intheformoftheAssetVolatility(theannualizedstandarddeviationofassetvalues)andabsolutevalueatrisk(VaR)measures.VaRisamethodtoestimatethepotentialnegativechangeinthemarketvalueofaportfoliothatisnotexpectedtobeexceededoveraspecifiedtimehorizonatthegivenconfidencelevel. The VaR models are designed to measure market risk in a normal market environment and may underestimatetheextremelosses,suchasthoseexperiencedin2008andearly2009.Toassesstheimpactof extreme market movements, stress tests are performed periodically using relevant market data.
ThePlanmonitorsthemarketriskfromtwoperspectives:1)along-termperspective,toassesstheriskcharacteristicsoftheportfoliooveralong-termhorizon,and2)ashort-termperspective,tocapturetheimpact of the recent market environment. The long-term risk estimates are based on an asset liability simulation model on a forward-looking basis over a 10-year horizon. The model uses a vector auto regression approach and a Monte Carlo simulation framework. It relies on asset class market indices and a longhistoryofquarterlymarketdata(goingbackto1980’s).Theshort-termriskestimatesarecomputedfrom current portfolio positions by applying a Monte Carlo simulation approach. The Monte Carlo method is commonly used in a stochastic model to simulate the various sources of uncertainty in the risk factors. It generates 1000 scenarios based on inputs estimated from exponentially weighted weekly return time series for the past three years with no decay factor. Prior to September 2012, inputs were estimated fromexponentiallyweighteddailyreturntimeseriesforthepastthreeyears(withadecayfactorof0.999).The portfolio is fully repriced for each scenario. Risk measures are then derived from the full distribution of 1000 possible outcomes.
End of Year Surplus Volatility Asset Volatility 95% Absolute VaR (% Annualized) 2013 2012 2013 2012 2013 2012 Short-Term Estimates 15.4 16.7 10.8 11.5 17.6 18.2
Long-Term Estimates 16.6 14.9 10.9 11.1 17.9 18.2
Volatility measures the dispersion of the distribution. VaR measures the potential down side risk, and hastwoequivalentinterpretations:(1)itestimatestheworstlossoveraone-yearhorizonata95percentconfidenceleveland(2)itestimatesthepotentiallossthatcanbeexceededoveraone-yearhorizonwithafivepercentprobability.
Foreign exchange contracts and futures limited to various equity indices, interest rates and foreign exchange are used to manage part of the market risk related to a variety of risk factors.
Operational Risk
Operational risk is the potential for loss resulting from inadequate or failed internal processes or systems, human factors, or external events, and includes business disruption and system failure, transaction processingfailuresandfailuresinexecutionoflegal,fiduciaryandagencyresponsibilities.ThePlan,likemost pension plans, is exposed to many types of operational risks. The Plan mitigates operational risk by maintaining a system of internal controls that is designed to keep that risk at appropriate levels. This, along with other checks and balances at various levels, ensures that mitigating controls exist to offset the impact of operational risks.
L. SECURITIES LENDING
The Plan participates in a securities lending program through the custodian, BNY Mellon. Under this program, the Plan’s investment securities are loaned to investment brokers for a fee. Such securities are fully collateralized by cash or securities issued or guaranteed by the U.S. Government. As of December 31,2013and2012,respectively,$94.0millionand$74.7millionofthePlan’ssecuritieswereonloanunderthesecuritieslendingprogramandwerecollateralizedbycashandliquidsecuritiesof$99.5millionand$78.2 million at December 31, 2013 and 2012, respectively. The fair value of the cash collateral received (approximately102percentfordomesticloansand105percentforinternationalloans),issubsequentlyinvestedinaseparatelymanagedaccountholdingmoneymarketandotherliquidfinancialinstruments,which are reported and included in the respective investment line items on the Statement of Net Assets AvailableforBenefits.TheobligationtoreturnthiscashcollateralreceivedisalsoincludedunderLiabilitytoreturncollateralheldundersecuritieslendingagreements.ThePlan’sinvestmentbalanceincludes$95.2million and $72.2 million at December 31, 2013 and 2012, respectively, of securities purchased using cash collateral received under securities lending agreements. Net gain from the program was $616,316 and $403,012fortheyearsendedDecember31,2013and2012,respectively.This,alongwithanyunrealizedgains and losses on collateral investments, is included in the net appreciation in fair value of investments on theStatementofChangesinNetAssetsAvailableforBenefits.
M. DERIVATIVE FINANCIAL INSTRUMENTS
AspartofthePlan’sriskmanagementprocess,thePlanispartytoavarietyofderivativefinancialinstruments:
21EffectiveJanuary1,2014,withtheapprovalofthenewinvestmentframework,theprimarymetricusedfordefiningrisktolerancegoingforwardwould be the asset volatility.
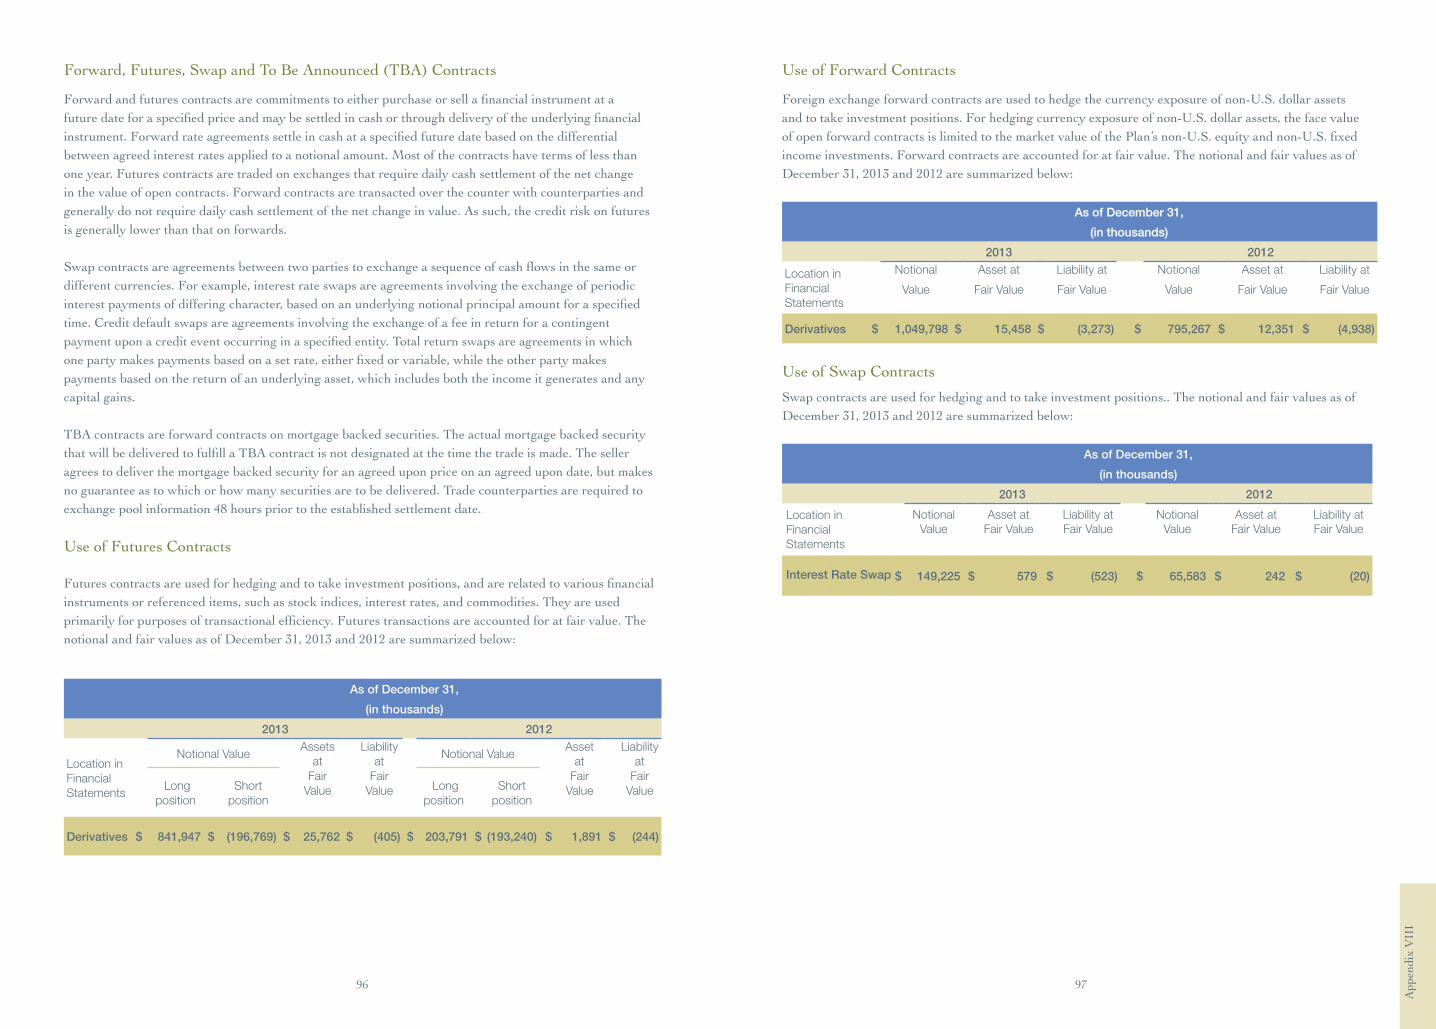
96 97
App
endi
x V
III
Forward,Futures,SwapandToBeAnnounced(TBA)Contracts
Forwardandfuturescontractsarecommitmentstoeitherpurchaseorsellafinancialinstrumentatafuturedateforaspecifiedpriceandmaybesettledincashorthroughdeliveryoftheunderlyingfinancialinstrument.Forwardrateagreementssettleincashataspecifiedfuturedatebasedonthedifferentialbetween agreed interest rates applied to a notional amount. Most of the contracts have terms of less than one year. Futures contracts are traded on exchanges that require daily cash settlement of the net change in the value of open contracts. Forward contracts are transacted over the counter with counterparties and generally do not require daily cash settlement of the net change in value. As such, the credit risk on futures is generally lower than that on forwards.
Swapcontractsareagreementsbetweentwopartiestoexchangeasequenceofcashflowsinthesameordifferent currencies. For example, interest rate swaps are agreements involving the exchange of periodic interestpaymentsofdifferingcharacter,basedonanunderlyingnotionalprincipalamountforaspecifiedtime. Credit default swaps are agreements involving the exchange of a fee in return for a contingent paymentuponacrediteventoccurringinaspecifiedentity.Totalreturnswapsareagreementsinwhichonepartymakespaymentsbasedonasetrate,eitherfixedorvariable,whiletheotherpartymakespayments based on the return of an underlying asset, which includes both the income it generates and any capital gains.
TBA contracts are forward contracts on mortgage backed securities. The actual mortgage backed security thatwillbedeliveredtofulfillaTBAcontractisnotdesignatedatthetimethetradeismade.Theselleragrees to deliver the mortgage backed security for an agreed upon price on an agreed upon date, but makes no guarantee as to which or how many securities are to be delivered. Trade counterparties are required to exchangepoolinformation48hourspriortotheestablishedsettlementdate.
Use of Futures Contracts
Futurescontractsareusedforhedgingandtotakeinvestmentpositions,andarerelatedtovariousfinancialinstruments or referenced items, such as stock indices, interest rates, and commodities. They are used primarilyforpurposesoftransactionalefficiency.Futurestransactionsareaccountedforatfairvalue.Thenotional and fair values as of December 31, 2013 and 2012 are summarized below:
As of December 31,
(in thousands)
2013 2012
Location in Financial Statements
Notional Value Assets
at
Liability at
Notional Value Asset
at
Liability at
Long
position
Short position
Fair
Value Fair
Value Long
position
Short position
Fair
Value Fair
Value
Derivatives $ 841,947 $ (196,769) $ 25,762 $ (405) $ 203,791 $ (193,240) $ 1,891 $ (244)
Use of Forward Contracts
Foreign exchange forward contracts are used to hedge the currency exposure of non-U.S. dollar assets and to take investment positions. For hedging currency exposure of non-U.S. dollar assets, the face value ofopenforwardcontractsislimitedtothemarketvalueofthePlan’snon-U.S.equityandnon-U.S.fixedincome investments. Forward contracts are accounted for at fair value. The notional and fair values as of December 31, 2013 and 2012 are summarized below:
As of December 31,
(in thousands)
2013 2012
Location in Financial Statements
Notional Asset at Liability at Notional Asset at Liability at
Value Fair Value Fair Value Value Fair Value Fair Value
Derivatives $ 1,049,798 $ 15,458 $ (3,273) $ 795,267 $ 12,351 $ (4,938)
Use of Swap Contracts Swap contracts are used for hedging and to take investment positions.. The notional and fair values as of December 31, 2013 and 2012 are summarized below:
As of December 31,
(in thousands)
2013 2012
Location in Financial Statements
Notional Asset at Liability at Notional Asset at Liability at
Value Fair Value Fair Value Value Fair Value Fair Value
Interest Rate Swap
$ 149,225 $ 579 $ (523) $ 65,583 $ 242 $ (20)
Location in Financial Statements
Interest Rate Swap

98
Use of To Be Announced Contracts
TBA securities are used for hedging against interest rate risk and to take investment positions. The notional and fair values as of December 2013 and 2012 are summarized below:
As of December 31,
(in thousands)
2013 2012
Location in Financial Statements
Notional Value Asset at
Liability
at Notional Value
Asset at
Liability at
Long
position
Short position
Fair
Value Fair
Value Long
position
Short position
Fair
Value Fair
Value
Derivatives $ 54,976 $ - $ 62 $ (371) $ 54,203 $ (4,000) $ 280 $ (45)
Thefollowingtableprovidesinformationonthelocationandamountsofgainsand(losses)onthederivative instruments as of December 31, 2013 and 2012:
As of December 31, (in thousands) Location in Financial Statements 2013 2012Swaps Net Appreciation
in Fair Value of Investments (Note G)
$ 1,942 $ (10,488)Futures $ 23,914 $ 12,412 TBAs $ (988) $ (3)
Total $ 24,868 $ 1,921
N. INVESTMENTS EXCEEDING FIVE PERCENT OF NET ASSETS
TherewerenoinvestmentsrepresentingfivepercentormoreofNetAssetsAvailableforBenefitsasofDecember 31, 2013 and 2012.
ThePlaninvestedatotalof$1,969.8millioninfiveU.S.TreasurySecuritiesand$1,280.5millioninfourU.S.TIPSasofDecember31,2013and2012respectively,eachinvestmentrepresentingfivepercentormoreofdebtsecurities.Therewere$232.9millioninonepublicequityfundrepresentingfivepercentormoreofEquitiesasofDecember31,2013.TherewerenoinvestmentsrepresentingfivepercentormoreofEquitiesasofDecember31,2012.ThePlanalsoinvested$812.7millionand$553.6millionincommingledfundsasofDecember31,2013and2012,respectively.Theseinvestmentsrepresentfivepercentormoreofother fund investments.

The World Bank 1818 H Street, NW
Washington,DC20433USA