STAFF REPORT REVENUE REQUIREMENT COST OF SERVICE
216
MISSOURI PUBLIC SERVICE COMMISSION STAFF REPORT REVENUE REQUIREMENT COST OF SERVICE UNION ELECTRIC COMPANY d/b/a Ameren Missouri CASE NO. ER-2014-0258 Jefferson City, Missouri December 5, 2014 ** Denotes Highly Confidential Information ** NP
Transcript of STAFF REPORT REVENUE REQUIREMENT COST OF SERVICE

MISSOURI PUBLIC SERVICE COMMISSION
STAFF REPORT
REVENUE REQUIREMENT
COST OF SERVICE
UNION ELECTRIC COMPANY d/b/a Ameren Missouri
CASE NO. ER-2014-0258
Jefferson City, Missouri December 5, 2014
** Denotes Highly Confidential Information ** NP

i
REVENUE REQUIREMENT 1
COST OF SERVICE REPORT 2
CASE NO. ER-2014-0258 3
I. Executive Summary ............................................................................................................ 1 4
Staff Expert/Witness: John P. Cassidy ......................................................................... 1 5
II. Background of Ameren Missouri........................................................................................ 1 6
Staff Expert/Witness: John P. Cassidy ......................................................................... 1 7
III. Test Year/True-Up Period................................................................................................... 2 8
Staff Expert/Witness: John P. Cassidy ......................................................................... 2 9
IV. Economic Considerations ................................................................................................... 3 10
Staff Expert/Witness: Michael L. Stahlman ................................................................. 8 11
V. Major Issues ........................................................................................................................ 8 12
Staff Expert/Witness: John P. Cassidy ......................................................................... 9 13
VI. Rate of Return ................................................................................................................... 10 14
A. Introduction ........................................................................................................... 10 15 B. Analytical Parameters ........................................................................................... 11 16 C. Current Economic and Capital Market Conditions ............................................... 14 17
1. Economic Conditions ............................................................................................ 14 18 2. Capital Market Conditions .................................................................................... 15 19
a. Utility Debt Markets ......................................................................................................... 15 20
b. Utility Equity Markets ...................................................................................................... 16 21
D. Ameren’s and Ameren Missouri’s Operations ..................................................... 23 22 1. Ameren .................................................................................................................. 23 23
E. Ameren Missouri’s and Ameren’s Credit Ratings ................................................ 24 24 F. Cost of Capital ...................................................................................................... 26 25
1. Capital Structure ................................................................................................... 26 26 2. Embedded Cost of Debt and Preferred Stock ....................................................... 26 27 3. Cost of Common Equity ....................................................................................... 26 28
a. The Proxy Groups ............................................................................................................. 27 29
b. The Constant-growth DCF ................................................................................................ 30 30
i. The Inputs .............................................................................................................. 31 31

ii
ii. Stage one .............................................................................................................. 33 1
iii. Stage two ............................................................................................................. 33 2
iv. Stage three ........................................................................................................... 34 3
v. Constraints on Long-term Growth Rates used in Stage Three ............................. 37 4
vi. Update of Multi-Stage DCF Analysis on the Proxy Group from 5 the 2012 Rate Cases ............................................................................................. 39 6
vii. Backdating of Multi-Stage DCF Analysis on the Current Proxy Group Cases .. 40 7
viii. Preference for GDP Growth .............................................................................. 40 8
G. Tests of Reasonableness ....................................................................................... 42 9 1. The CAPM ............................................................................................................ 42 10 2. Other Tests ............................................................................................................ 44 11
a. The “Rule of Thumb” ....................................................................................................... 44 12
b. Average Authorized Returns............................................................................................. 45 13
H. Conclusion ............................................................................................................ 46 14 Staff Expert/Witness: David Murray ......................................................................... 46 15
VII. Rate Base .......................................................................................................................... 47 16
A. Plant in Service and Depreciation Reserve ........................................................... 47 17 1. Plant in Service - Accounting Schedule 3 ............................................................. 47 18
Staff Expert/Witness: Jason Kunst ............................................................................. 47 19
2. Depreciation Reserve – Accounting Schedule 5 ................................................... 47 20 Staff Expert/Witness: Jason Kunst ............................................................................. 47 21
3. O’Fallon Solar Facility ......................................................................................... 47 22 a. In-Service Criteria ............................................................................................................. 47 23
Staff Expert/Witness: Claire M. Eubanks .................................................................. 48 24
b. Cost Assessment of O'Fallon Solar Generating Facility ................................................... 48 25
Staff Expert/Witness: Kofi Agyenim Boateng ........................................................... 48 26
4. Labadie ESP Audit Report .................................................................................... 49 27 a. Rate Impact of the Project ................................................................................................ 49 28
Staff Expert/Witness: Erin M. Carle .......................................................................... 50 29
b. Physical Description of the Project ................................................................................... 50 30
Staff Expert/Witness: Jerry Scheible ......................................................................... 51 31
5. Callaway Reactor Vessel Closure Head Audit Report ......................................... 51 32 a. Rate Impact of the Project ................................................................................................ 51 33
Staff Expert/Witness: Erin M. Carle .......................................................................... 51 34
b. Physical Description of the Project ................................................................................... 52 35
Staff Expert/Witness: Jerry Scheible ......................................................................... 52 36
iii
B. Cash Working Capital (CWC) .............................................................................. 52 1 1. Calculation of Revenue and Expense Lags ........................................................... 52 2
Staff Expert/Witness: Kofi Agyenim Boateng ............................................................ 54 3
C. Prepayments and Materials and Supplies ............................................................. 54 4 Staff Expert/Witness: Jason Kunst .............................................................................. 54 5
D. Customer Deposits ................................................................................................ 54 6 Staff Expert/Witness: Jason Kunst .............................................................................. 55 7
E. Customer Advances .............................................................................................. 55 8 Staff Expert/Witness: Jason Kunst .............................................................................. 55 9
F. Fuel Inventories .................................................................................................... 55 10 1. Fuel Inventory for Rate Base (other than coal) ..................................................... 55 11
Staff Expert/Witness: Lisa M. Ferguson ..................................................................... 56 12
2. Coal Inventory On-Site and Coal-In Transit ......................................................... 56 13 Staff Expert/Witness: Lisa K. Hanneken .................................................................... 56 14
G. Demand-Side Management Cost Recovery Regulatory Asset ............................. 56 15 1. Pre-MEEIA Demand-Side Programs and Revenue Requirement Impact ............ 56 16
Staff Expert/Witness: Hojong Kang, Ph.D. ................................................................ 57 17
2. DSM Costs Included In Rate Base ........................................................................ 58 18 Staff Expert/Witness: John P. Cassidy ....................................................................... 58 19
H. FAS 87 – Pensions and FAS 106 OPEBs Regulatory Liabilities ......................... 58 20 Staff Expert/Witness: Kofi Agyenim Boateng ........................................................... 58 21
I. Accumulated Deferred Income Taxes .................................................................. 59 22 Staff Expert/Witness: Lisa K. Hanneken ................................................................... 59 23
VIII. Corporate Allocations ....................................................................................................... 59 24
Staff Expert/Witness: Lisa K. Hanneken .................................................................... 61 25
IX. Income Statement.............................................................................................................. 61 26
A. Rate Revenues ....................................................................................................... 61 27 1. Introduction ........................................................................................................... 61 28
Staff Expert/Witness: Kofi Agyenim Boateng ........................................................... 61 29
2. Definitions............................................................................................................. 62 30 Staff Expert/Witness: Kofi Agyenim Boateng ........................................................... 62 31
3. The Development of Rate Revenue in this Case .................................................. 62 32 Staff Expert/Witness: Robin Kliethermes ................................................................... 63 33
4. Regulatory Adjustments to Test Year Sales and Rate Revenue ........................... 63 34 a. Adjustment to Remove Unbilled Revenues ...................................................................... 63 35
b. Adjustment to Remove Gross Receipts Tax ..................................................................... 63 36
Staff Expert/Witness: Kofi Agyenim Boateng ........................................................... 64 37
iv
c. Preliminary Adjustments to Test Year .............................................................................. 64 1
Staff Expert/Witness: Robin Kliethermes ................................................................... 64 2
d. Update Period Adjustment ................................................................................................ 64 3
Staff Experts/Witnesses: Robin Kliethermes and Brad J. Fortson .............................. 64 4
e. Large Customers Annualization ....................................................................................... 64 5
Staff Expert/Witness: Seoung Joun Won, PhD ........................................................... 66 6
Staff Expert/Witness: Sarah L. Kliethermes ............................................................... 66 7
f. Weather Normal Variables ............................................................................................... 66 8
g. Weather Normalization of Usage ...................................................................................... 69 9
Staff Expert/Witness: Seoung Joun Won, PhD ........................................................... 70 10
h. Weather Normalization of Revenue (Weather Sensitive Classes) .................................... 70 11
Staff Expert/Witness: Robin Kliethermes ................................................................... 70 12
i. 365-Days Adjustment to Usage - Weather Sensitive Classes ........................................... 70 13
Staff Expert/Witness: Seoung Joun Won, PhD ........................................................... 71 14
j. 365-Days Adjustment to Revenue - Weather Sensitive Classes ....................................... 71 15
k. Solar Revenue Adjustment ............................................................................................... 72 16
Staff Experts/Witnesses: Robin Kliethermes and Brad J. Fortson .............................. 72 17
l. Adjustment to Remove MEEIA Revenue ......................................................................... 72 18
m. Customer Growth Annualization ...................................................................................... 72 19
n. Removal of Rate Refunds and FAC Recovery ................................................................. 73 20
Staff Expert/Witness: Kofi Agyenim Boateng ........................................................... 73 21
o. Annualization and Normalization Results ........................................................................ 73 22
Staff Expert/Witnesses: Kofi Agyenim Boateng, Robin Kliethermes and 23 Brad J. Fortson .................................................................. 73 24
B. Adjustments to Non-Rate Revenues ..................................................................... 73 25 1. Lake of the Ozarks Shoreline Management Other Revenues ............................... 73 26 2. Miscellaneous Other Revenues ............................................................................. 74 27 3. Removal of Gain on Disposition of Emission Allowances .................................. 74 28
Staff Expert/Witness: Kofi Agyenim Boateng ........................................................... 74 29
4. Coal Refinement Projects ..................................................................................... 74 30 a. Rush Island Energy Center ............................................................................................... 75 31
b. Sioux Energy Center ......................................................................................................... 75 32
c. Labadie Energy Center ..................................................................................................... 75 33
Staff Expert/Witness: Lisa K. Hanneken .................................................................... 76 34

v
5. Off-System Sales (OSS) ....................................................................................... 76 1 a. Energy ............................................................................................................................... 76 2
Staff Expert/Witness: Lisa M. Ferguson ..................................................................... 76 3
b. Capacity Sales ................................................................................................................... 77 4
Staff Expert/Witness: Lisa K. Hanneken ................................................................... 77 5
c. Bilateral Transactions and Financial Swaps ..................................................................... 77 6
Staff Expert/Witness: Erin L. Maloney ....................................................................... 77 7
6. Midwest Independent Transmission System Operator (MISO)............................ 77 8 a. Day 2 Revenues and Expenses ......................................................................................... 77 9
b. Amortization of RSG Resettlement Expenses .................................................................. 78 10
c. Transmission Revenue and Expense ................................................................................. 79 11
d. Ancillary Services Market Revenue and Expense ............................................................ 79 12
e. Miscellaneous MISO Related Revenues ........................................................................... 79 13
Staff Expert/Witness: Lisa K. Hanneken ................................................................... 79 14
C. Fuel and Purchased Power Expense ..................................................................... 79 15 1. Fuel and Purchased-Power Prices ......................................................................... 79 16
a. Coal Prices ........................................................................................................................ 80 17
i. Accounting Coal Prices ......................................................................................... 80 18
ii. Fly Ash ................................................................................................................. 81 19
b. Nuclear Fuel Prices ........................................................................................................... 81 20
i. Nuclear Fuel Rod Assembly Prices ....................................................................... 81 21
ii. Spent-Fuel Costs ................................................................................................... 81 22
iii. Spent Fuel and DOE Breach of Contract Settlements with Ameren Missouri .... 82 23
Staff Expert/Witness: Lisa M. Ferguson .................................................................... 87 24
c. Natural Gas Cost ............................................................................................................... 87 25
i. Variable Natural Gas Cost ..................................................................................... 87 26
Staff Expert/Witness: Erin L. Maloney ....................................................................... 87 27
ii. Fixed Natural Gas Cost ........................................................................................ 87 28
Staff Expert/Witness: Lisa M. Ferguson ..................................................................... 87 29
d. Fuel Oil Prices .................................................................................................................. 87 30
Staff Expert/Witness: Erin L. Maloney ....................................................................... 88 31
e. Maryland Heights Renewable Center Fuel Cost ............................................................... 88 32
Staff Expert/Witness: Lisa M. Ferguson ..................................................................... 88 33
vi
f. Whole Sale Market Prices ................................................................................................. 88 1
Staff Expert/Witness: Erin L. Maloney ....................................................................... 89 2
2. Fuel and Purchased Power Cost Modeling ........................................................... 89 3 a. Variable Costs ................................................................................................................... 89 4
b. Planned and Forced Outages ............................................................................................. 90 5
c. Capacity Contract Prices and Energy ............................................................................... 90 6
d. Normalization of Hourly Load Requirements at Transmission ........................................ 91 7
Staff Expert/Witness: Shawn E. Lange ...................................................................... 92 8
i. System Energy Losses ........................................................................................... 92 9
Staff Expert/Witness: Alan J. Bax ............................................................................. 93 10
ii. Solar Load Adjustment ......................................................................................... 93 11
Staff Expert/Witness: Michael L. Stahlman ............................................................... 94 12
3. Other Fuel Related Items ...................................................................................... 94 13 a. Fuel Additive - Limestone for Sioux Scrubbers ............................................................... 94 14
b. Fuel Additive – Activated Carbon .................................................................................... 95 15
Staff Expert/Witness: Lisa M. Ferguson ..................................................................... 96 16
D. Payroll and Benefits .............................................................................................. 96 17 1. Payroll ................................................................................................................... 96 18 2. Payroll Taxes ........................................................................................................ 97 19
Staff Expert/Witness: Brian Wells .............................................................................. 98 20
3. Accounting Standards Codification (ASC) 715-30 (formerly FAS 87) Pension 21 Costs ...................................................................................................................... 98 22
a. Accounting Standards Codification 715-30 Pension Tracker ........................................... 98 23
b. Annualization .................................................................................................................... 99 24
Staff Expert/Witness: Kofi Agyenim Boateng ........................................................... 99 25
4. Accounting Standards Codification (ASC) 715-60 (formerly FAS 106) Other Post 26 Retirement Benefit Costs (OPEBs) ....................................................................... 99 27
a. Accounting Standards Codification 715-60 OPEBs Tracker ............................................ 99 28
b. Annualization .................................................................................................................. 100 29
Staff Expert/Witness: Kofi Agyenim Boateng ......................................................... 100 30
5. Non-Qualified Pensions Expense ....................................................................... 100 31 Staff Expert/Witness: Kofi Agyenim Boateng ......................................................... 101 32
6. Other Employee Benefits .................................................................................... 101 33 Staff Expert/Witness: Brian Wells ............................................................................ 101 34

vii
7. Incentive Compensation ...................................................................................... 101 1 a. Short-Term Incentive Compensation .............................................................................. 102 2
b. Long Term Incentive Compensation .............................................................................. 104 3
c. Exceptional Performance Bonus (EPB) .......................................................................... 104 4
Staff Expert/Witness: Sarah Sharpe ......................................................................... 104 5
E. Other Expenses ................................................................................................... 105 6 1. Rate Case Expenses ............................................................................................ 105 7
Staff Expert/Witness: Sarah Sharpe ......................................................................... 106 8
2. Dues and Donations ............................................................................................ 106 9 3. Lobbying ............................................................................................................. 107 10
Staff Expert/Witness: Jason Kunst ............................................................................ 107 11
4. Edison Electric Institute (EEI) Dues ................................................................... 107 12 Staff Expert/Witness: Jason Kunst ............................................................................ 108 13
5. Insurance Expense .............................................................................................. 108 14 Staff Expert/Witness: Brian Wells ............................................................................ 109 15
6. Vegetation Management and Infrastructure Inspection Programs ...................... 109 16 a. Annual Expense .............................................................................................................. 109 17
b. Trackers .......................................................................................................................... 109 18
c. Amortizations .................................................................................................................. 110 19
Staff Expert/Witness: Lisa K. Hanneken ................................................................. 111 20
7. Maintenance Expense ......................................................................................... 111 21 a. Power Plant Maintenance ............................................................................................... 111 22
b. Distribution Maintenance ............................................................................................... 111 23
Staff Expert/Witness: Lisa K. Hanneken .................................................................. 111 24
8. Customer Deposit Interest Expense .................................................................... 111 25 Staff Expert/Witness: Jason Kunst ............................................................................ 111 26
9. Property Tax Expense ......................................................................................... 111 27 a. Property Tax Refund Tracker ......................................................................................... 112 28
Staff Expert/Witness: Jason Kunst ............................................................................ 113 29
10. Uncollectible Expense ........................................................................................ 113 30 Staff Expert/Witness: Kofi Agyenim Boateng ......................................................... 113 31
11. Advertising Expense ........................................................................................... 113 32 Staff Expert/Witness: Jason Kunst ........................................................................... 115 33
12. Gross Receipt Tax Expense ................................................................................ 115 34 Staff Expert/Witness: Kofi Agyenim Boateng ......................................................... 115 35
13. Lockbox Function ............................................................................................... 115 36 Staff Expert/Witness: Brian Wells ............................................................................ 116 37

viii
14. New Bill Format Expense ................................................................................... 116 1 Staff Expert/Witness: Jason Kunst ............................................................................ 116 2
15. Sioux Construction Accounting .......................................................................... 116 3 Staff Expert/Witness: Lisa K. Hanneken ................................................................. 117 4
16. Test Year Storm Cost Annualization and Storm Tracker ................................... 117 5 Staff Expert/Witness: Kofi Agyenim Boateng ......................................................... 118 6
17. Prior Storm CostAmortization Expense.............................................................. 118 7 Staff Expert/Witness: Kofi Agyenim Boateng ......................................................... 119 8
18. Amortizations of Regulatory Assets and Liabilities ........................................... 119 9 a. Netting of Regulatory Asset and Liability Amortizations .............................................. 119 10
b. New and Continuing Regulatory Asset and Liability Amortizations ............................. 120 11
Staff Expert/Witness: John P. Cassidy ..................................................................... 122 12
19. Noranda Accounting Authority Order (“AAO”) Lost Revenue Deferral ........... 122 13 Staff Expert/Witness: John P. Cassidy ..................................................................... 122 14
20. Energy Efficiency Regulatory Asset Amortizations ........................................... 122 15 Staff Expert/Witness: John P. Cassidy ..................................................................... 123 16
21. Renewable Energy Standard ............................................................................... 123 17 a. Summary ......................................................................................................................... 123 18
Staff Expert/Witness: Claire M. Eubanks ................................................................ 124 19
b. Renewable Energy Standard Costs ................................................................................. 125 20
c. RES AAO Regulatory Asset/(Liability) Amortizations .................................................. 126 21
d. Maryland Heights Energy Center Methane Fuel Costs Included In RES AAO ............. 126 22
e. Pioneer Prairie Wind Contract ........................................................................................ 127 23
Staff Expert/Witness: John P. Cassidy ..................................................................... 127 24
22. Solar Rebates ...................................................................................................... 127 25 Staff Expert/Witness: John P. Cassidy ..................................................................... 128 26
23. FASB Interpretation No. 48 (“FIN 48”) Amortization ....................................... 128 27 Staff Expert/Witness: Lisa K. Hanneken .................................................................. 129 28
24. Missouri Energy Efficiency Investment Act (“MEEIA”) Costs in Test Year .... 129 29 Staff Expert/Witness: John P. Cassidy ..................................................................... 130 30
25. Callaway Refueling Adjustment ......................................................................... 130 31 Staff Expert/Witness: Lisa M. Ferguson ................................................................... 131 32
26. Low-level Radioactive Waste Expense .............................................................. 131 33 Staff Expert/Witness: Lisa M. Ferguson ................................................................... 134 34
27. Lease Expense ..................................................................................................... 134 35 Staff Expert/Witness: Brian Wells ............................................................................ 134 36

ix
28. PSC Assessment.................................................................................................. 134 1 Staff Expert/Witness: Brian Wells ............................................................................ 134 2
29. Corporate Franchise Tax ..................................................................................... 134 3 Staff Expert/Witness: Sarah Sharpe .......................................................................... 135 4
30. Outside Services - External Auditors .................................................................. 135 5 Staff Expert/Witness: Lisa K. Hanneken ................................................................. 135 6
31. SO2 Allowance Tracker ...................................................................................... 135 7 Staff Expert/Witness: Lisa K. Hanneken ................................................................. 136 8
32. Board of Directors Fees & Expenses .................................................................. 136 9 Staff Expert/Witness: Jason Kunst ........................................................................... 137 10
33. Miscellaneous Expenses ..................................................................................... 137 11 Staff Expert/Witness: Jason Kunst ............................................................................ 137 12
34. Snow Removal Costs .......................................................................................... 137 13 Staff Expert/Witness: Brian Wells ............................................................................ 137 14
35. Taum Sauk Failure Expense Removal ................................................................ 137 15 Staff Expert/Witness: Sarah Sharpe .......................................................................... 138 16
36. Low-Income Weatherization Program ................................................................ 138 17 Staff Expert/Witness: Henry E. Warren, PhD ........................................................... 141 18
37. Keeping Current Pilot Program .......................................................................... 141 19 a. Evaluation ....................................................................................................................... 142 20
b. Keeping Current Statistics .............................................................................................. 142 21
c. Agency Feedback ............................................................................................................ 143 22
d. Customer Feedback ......................................................................................................... 143 23
e. Keeping Current Impacts ................................................................................................ 147 24
f. Recommendation ............................................................................................................ 147 25
Staff Expert/Witness: Kory Boustead ...................................................................... 148 26
g. Keeping Current program - Removal of Revenue and Expense ..................................... 148 27
Staff Expert/Witness: Sarah Sharpe .......................................................................... 148 28
x
F. Depreciation Expense ......................................................................................... 148 1 1. Staff Recommendation ........................................................................................ 148 2 2. Depreciation and Depreciation Rate Overview .................................................. 148 3
a. Plant In Service Review .................................................................................................. 148 4
b. General Plan Amortization ............................................................................................. 150 5
c. Retirement of the Meramec Plant ................................................................................... 153 6
d. Retirement of the Rush Island Plant ............................................................................... 154 7
e. Staff’s Review of Ameren Missouri’s Submitted Depreciation Study ........................... 154 8
f. Depreciation Expense – Truncation of Terminal Net Salvage........................................ 156 9
3. Staff’s Depreciation Summary ............................................................................ 158 10 Staff Expert/Witness: Arthur W. Rice, PE ............................................................... 158 11
4. Project First (Enterprise System) ........................................................................ 159 12 Staff Expert/Witness: Jason Kunst ........................................................................... 159 13
5. Capitalized Depreciation ..................................................................................... 159 14 Staff Expert/Witness: Brian Wells ........................................................................... 159 15
6. Eliminate Depreciation on Coal Cars ................................................................. 159 16 Staff Expert/Witness: Lisa M. Ferguson ................................................................... 159 17
G. Income Tax ......................................................................................................... 160 18 Staff Expert/Witness: Lisa K. Hanneken ................................................................. 161 19
X. Fuel Adjustment Clause (FAC) ...................................................................................... 161 20
A. Policy .................................................................................................................. 161 21 1. History................................................................................................................. 162 22 2. Summary of Ameren Missouri’s Fuel and Purchased Power Costs Net Off-System 23
Sales Revenues.................................................................................................... 164 24 Staff Expert/Witness: Matthew J. Barnes ................................................................. 169 25
3. Maryland Heights Energy Center ....................................................................... 169 26 Staff Expert/Witness: Matthew J. Barnes ................................................................. 170 27
4. Loss Study - Compliance With FAC Rules ........................................................ 170 28 Staff Expert/Witness: Alan J. Bax and Matthew J. Barnes ....................................... 170 29
5. Additional Filing Requirements .......................................................................... 170 30 Staff Expert/Witness: Matthew J. Barnes ................................................................. 172 31
B. Fuel Adjustment Clause Heat Rate and Efficiency Testing ................................ 172 32 Staff Expert/Witness: Randy S. Gross ...................................................................... 175 33
XI. Other Issues ..................................................................................................................... 175 34
A. Smart Grid Status ................................................................................................ 175 35 Staff Expert/Witness: Randy S. Gross ...................................................................... 178 36

xi
B. Light Emitting Diode (LED) Street and Area Lighting ...................................... 178 1 Staff Expert/Witness: Hojong Kang, Ph.D. .............................................................. 178 2
Appendices .................................................................................................................................. 179 3
Appendix 1: Staff Credentials ............................................................................................ 179 4 Appendix 2: Support for Staff Cost of Capital Recommendation ..................................... 179 5 Appendix 3: Alphabetical Listing of Testimony Schedules .............................................. 179 6 Appendix 4: Advertising .................................................................................................... 179 7
8

Page 1
REVENUE REQUIREMENT COST OF SERVICE REPORT 1
I. Executive Summary 2
Staff has conducted a review in Case No. ER-2014-0258 of all revenue requirement cost 3
of service components (capital structure and return on rate base, rate base, depreciation expense 4
and other operating expenses) which comprise Union Electric Company’s d/b/a Ameren 5
Missouri ("Ameren Missouri" or "Company") revenue requirement. This audit was in response 6
to Ameren Missouri’s filing made on July 3, 2014, seeking to increase its retail rates to recover 7
an additional approximately $264 million on an annual basis. 8
Staff’s recommended increase in revenue requirement is based upon an adjusted test year 9
for the twelve months ending March 31, 2014, including true-up estimates through January 1, 10
2015. Staff’s recommended revenue requirement for Ameren Missouri is $113,139,943 based 11
upon Staff’s midpoint return on equity (ROE) recommendation of 9.25%. 12
The impact of Staff’s recommended revenue requirement for each retail rate customer 13
class will be addressed in Staff’s rate design direct testimony and report that is scheduled to be 14
filed on December 19, 2014. 15
Staff Expert/Witness: John P. Cassidy 16
II. Background of Ameren Missouri 17
Ameren Missouri provides electric utility service to approximately 1.2 million retail 18
customers primarily in the eastern half of Missouri, but also to a limited extent in northwestern 19
Missouri. Ameren Missouri is wholly owned by Ameren Corporation (Ameren), which also 20
provides utility service in Illinois through its Ameren Illinois operating subsidiary. Ameren 21
Missouri also operates a natural gas distribution business in Missouri, which serves 22
approximately 127,000 customers. 23
Ameren Missouri last sought a general change of its electric retail rates when it filed a 24
request for a $375.6 million annual increase on February 3, 2012, in Case No. ER-2012-0166. 25
As a result of the Missouri Public Service Commission’s (“PSC” or “Commission”) Report and 26
Order in that proceeding, Ameren Missouri was granted an annual rate increase of approximately 27
$259.6 million, effective January 2, 2013. 28
Staff Expert/Witness: John P. Cassidy 29

Page 2
III. Test Year/True-Up Period 1
Ameren Missouri filed its case based upon a twelve- month period ending March 31, 2014 2
test year and made adjustments to its case to reflect the impacts of anticipated changes through 3
the true-up period ending December 31, 2014 except for certain items where a true-up cut-off 4
date of January 1, 2015 was appropriate. These dates were ordered by the Commission on 5
August 20, 2014, in its Order Adopting Procedural Schedule, Establishing Test Year, And 6
Delegating Authority. 7
Based on current information, Staff's revenue requirement as presented in its Accounting 8
Schedules includes expected changes for certain major items within a true-up period ending 9
December 31, 2014 except for those items that it would be appropriate to true-up for significant 10
changes through January 1, 2015. For example, the plant and depreciation reserve balances have 11
been adjusted to reflect the anticipated additions through the December 31, 2014, true-up cutoff 12
point. Fuel expense has also been adjusted to reflect increase in coal commodity contract prices 13
and coal transportation contract prices, effective on January 1, 2015. Staff expects to consider 14
actual changes to the value of these items, as well as additional components of the cost of 15
service, during the upcoming true-up audit. Staff is not now adopting for the purpose of setting 16
Ameren Missouri’s rates, the value of the items quantified in Staff’s true-up estimate inclusions. 17
Staff has only included these items as placeholders, pending Staff’s completion of its true-up 18
audit. The true-up information to be filed is described in a footnote to the parties’ Jointly 19
Proposed Procedural Schedule that was filed on August 15, 2014 and adopted by the 20
Commission in its Order Adopting Procedural Schedule, Establishing Test Year, And Delegating 21
Authority that was issued on August 20, 2014. 22
Staff Expert/Witness: John P. Cassidy 23
24
25
26
27
28
29
continued on next page 30


Page 5
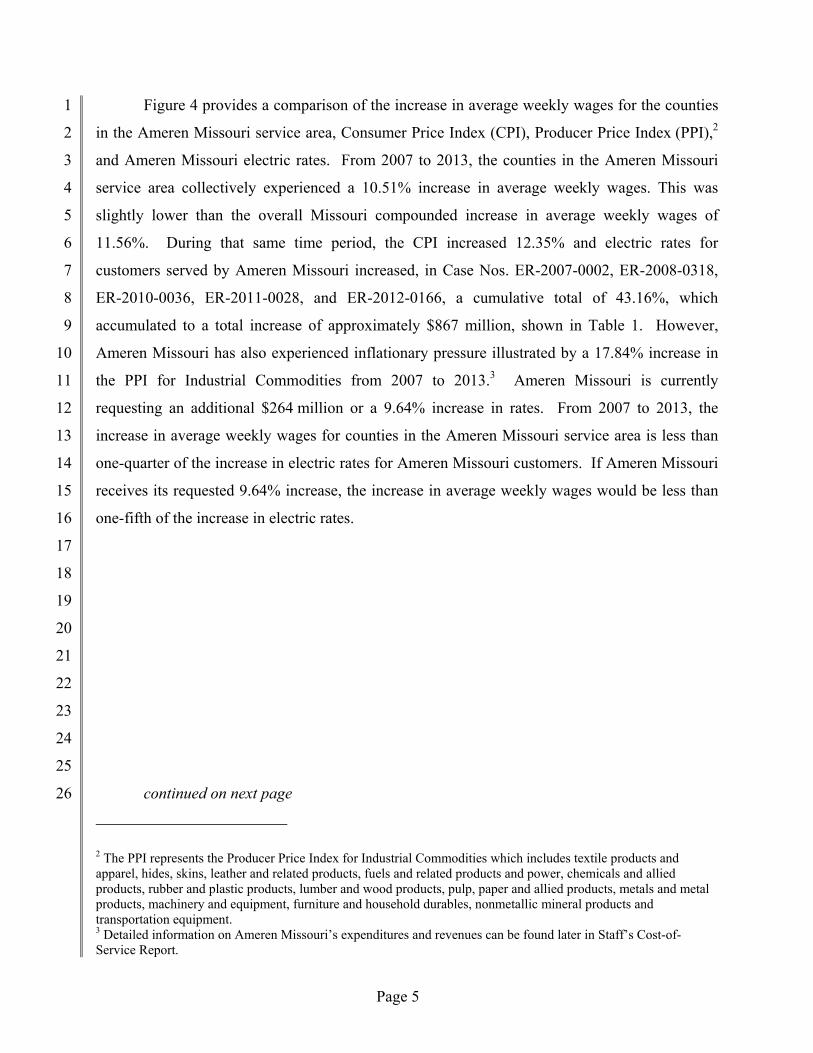
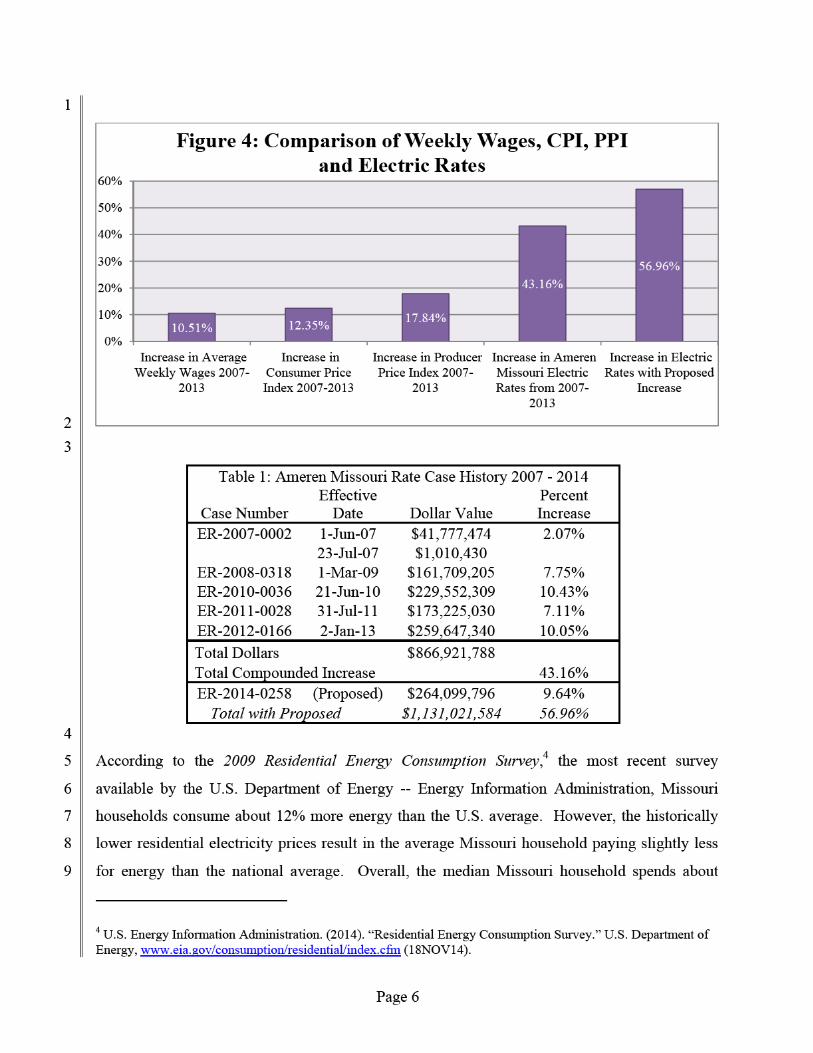
Figure 4 provides a comparison of the increase in average weekly wages for the counties 1
in the Ameren Missouri service area, Consumer Price Index (CPI), Producer Price Index (PPI),2 2
and Ameren Missouri electric rates. From 2007 to 2013, the counties in the Ameren Missouri 3
service area collectively experienced a 10.51% increase in average weekly wages. This was 4
slightly lower than the overall Missouri compounded increase in average weekly wages of 5
11.56%. During that same time period, the CPI increased 12.35% and electric rates for 6
customers served by Ameren Missouri increased, in Case Nos. ER-2007-0002, ER-2008-0318, 7
ER-2010-0036, ER-2011-0028, and ER-2012-0166, a cumulative total of 43.16%, which 8
accumulated to a total increase of approximately $867 million, shown in Table 1. However, 9
Ameren Missouri has also experienced inflationary pressure illustrated by a 17.84% increase in 10
the PPI for Industrial Commodities from 2007 to 2013.3 Ameren Missouri is currently 11
requesting an additional $264 million or a 9.64% increase in rates. From 2007 to 2013, the 12
increase in average weekly wages for counties in the Ameren Missouri service area is less than 13
one-quarter of the increase in electric rates for Ameren Missouri customers. If Ameren Missouri 14
receives its requested 9.64% increase, the increase in average weekly wages would be less than 15
one-fifth of the increase in electric rates. 16
17
18
19
20
21
22
23
24
25
continued on next page 26
2 The PPI represents the Producer Price Index for Industrial Commodities which includes textile products and apparel, hides, skins, leather and related products, fuels and related products and power, chemicals and allied products, rubber and plastic products, lumber and wood products, pulp, paper and allied products, metals and metal products, machinery and equipment, furniture and household durables, nonmetallic mineral products and transportation equipment. 3 Detailed information on Ameren Missouri’s expenditures and revenues can be found later in Staff’s Cost-of-Service Report.

Page 7
2.37% of its income on electricity. For households that were identified as being at or below the 1
150% poverty line, the median increased to 7.68%. 2
The U.S. Census Bureau provides limited economic data on a zip code basis.5 The city 3
and county of St. Louis, which include zip codes from 63001 through 63199, were analyzed by 4
Staff. Information was not available for all zip codes in that range since many zip codes were 5
specific to an entity (e.g. Monsanto) or related to a P.O. Box rather than a locale. For the zip 6
codes that had information available, Staff was able to develop an estimate of the average annual 7
wage for a person working within that zip code. Staff used this information and identified eight 8
zip codes of generally lower wages, two of which were removed since they were P.O. Boxes. 9
Table 2 below displays the data of the remaining six zip codes. The names listed in the 10
General Name column are somewhat subjective and based on an attempt to better refine where 11
the zip code is located. The largest class of establishment, in both employment size (two of the 12
three establishments in the 250-499 range) and numbers (411 of 1605 establishments) in these 13
regions is Health Care and Social Assistance, as defined by the Industry Code Description. 14
The region also contains 244 establishments classified as retail, 190 as “other services” 15
excluding public administration, and 160 as accommodation and food services. Sixty-one 16
percent of all establishments had one to four employees, and 88% of all establishments had less 17
than twenty employees. 18
19
Table 2. Economic Data of Zip Codes with Generally Lower Estimated Average Payrolls
Zip Code General Name Employees
Estimated Average Annual Payroll
Number of Establishments by Employment Size
1 - 4 5 - 9 10 -19 20-49 50-99 100-249
250-499 500+
63033 Black Jack 7644 $22,285 410 117 88 49 24 12 1 0
63034 Old Jamestown 1541 $21,964 128 40 16 9 2 3 0 0
63113 St. Louis (Kingsway East) 2563 $24,954 125 36 21 26 2 3 2 0
63135 Ferguson 2412 $22,709 168 40 26 18 7 3 0 0 63138 Spanish Lake 2186 $25,461 142 30 22 14 4 5 0 0
63140 Kinloch 239 $24,598 3 3 2 3 1 0 0 0
20
5 U.S. Census Bureau. (2014). “County Business Patterns.” https://www.census.gov/econ/cbp/ (19NOV14).

Page 8
The current economic outlook suggests that steady growth will continue for the 1
foreseeable future. The most recent version of Business Cycle Conditions from the American 2
Institute for Economic Research (“AIER”) rated the majority of leading indicators and nearly all 3
coincident and lagging indicators as expanding or probably expanding. However, Charles 4
Plosser, the president of the Federal Reserve Bank of Philadelphia, has recently expressed 5
concerns that the interest rates set by the Federal Reserve have remained too low for far too 6
long.6 However, even those who are concerned about the interest rates being too low do not 7
predict, assuming current monetary policy holds, any recession until late 2016. 8
Staff Expert/Witness: Michael L. Stahlman 9
V. Major Issues 10
The following are the major issues between Staff and Ameren Missouri based on their 11
respective pre-filed direct revenue requirement cases. These issues are discussed here because of 12
their estimated revenue requirement dollar value. A brief explanation for each issue follows, 13
together with an estimate of the dollar value of the difference between the positions of Staff and 14
Ameren Missouri on the issue. 15
Return on Equity (ROE) – Issue Value – ($61.1 million difference). Staff supports the 16
9.25% ROE midpoint of its ROE recommended range of 9.00% to 9.50%. Ameren Missouri is 17
requesting a 10.40% ROE. This issue is addressed in detail in Section VI of this report by Staff 18
witness David Murray. 19
Depreciation Expense – Issue Value – ($17.2 million difference). The primary 20
difference between Ameren Missouri and Staff centers on differing treatment for negative net 21
salvage accruals. Staff recommends limiting negative net salvage accruals for cost of removal 22
on two Distribution Plant accounts to a maximum of 100% of original cost. The Company’s 23
proposal for these two accounts would allow accrual of more than twice the original cost in 24
depreciation expense over the life of the asset. One of these accounts, (account 369.1 Overhead 25
Services), already has accumulated depreciation that exceeds the original cost by approximately 26
35% with an expected remaining life exceeding 25 more years. Overall, Ameren Missouri has 27
already accrued approximately $800 million in accumulated depreciation reserves for future cost 28
of removal. 29 6 Jones, Marc and Jamie McGeever. “Too low U.S. rates should make Fed nervous: Plosser.” Reuters 11 Nov. 2014. Web. 19 Nov. 2014.
Page 9
Off-Systems Sales Revenue - Bilateral Sales and Financial Swaps – Issue Value 1
($16.0 million difference). Staff proposes to include revenues associated with Bilateral Sales and 2
Financial Swaps. Ameren Missouri has excluded all such revenues from its cost of service 3
calculation. 4
Pension Expense – Issue Value – ($10.0 million difference) Staff recommends a level of 5
pension expense that is significantly lower than what was incurred during the test year in order to 6
reflect a declining trend in pension costs. Ameren Missouri is recommending that a higher level 7
of pension expense be used in this case. 8
Accounting Authority Order (AAO) to Recover Lost Revenue – Issue Value – 9
($7.1 million). In Case No. EU-2012-0027, the Commission granted Ameren Missouri 10
permission to defer certain lost revenues (or “fixed costs” as characterized by Ameren Missouri) 11
that it was unable to recover when the Noranda Aluminum Smelter lost power in late January 12
2009 due to a severe ice storm that struck southeast Missouri. Due to the power outage, Noranda 13
ceased operations for several months. Ameren Missouri is proposing to include approximately 14
$7.1 million in the cost-of-service calculation in this rate case, which represents a five-year 15
amortization of the $35.6 million of total lost revenues associated with the Noranda Aluminum 16
Smelter outage. Staff opposes Ameren Missouri’s proposal to include an amortization of the lost 17
revenues for recovery in rates. 18
Ameren Services Company (“AMS”) Allocations – Issue Value ($6.3 million 19
difference). Ameren Missouri has included an adjustment to reflect a projected estimate of 20
increases in expenses that are allocated to Ameren Missouri from an affiliate service company, 21
AMS. Staff has excluded this estimate from its cost of service calculation. 22
Property Taxes – Issue Value – ($5.7 million difference). Ameren Missouri reflected a 23
projected property tax expense at the time of the filing of their rate case. Staff has included 24
actual property tax payments made for calendar year 2013 until such time that actual property tax 25
expense for calendar year 2014 becomes known and measurable. 26
There are other significant differences between Staff and the Company, based upon their 27
respective direct filings. However, these other differences are less significant than the items 28
discussed above. 29
Staff Expert/Witness: John P. Cassidy 30
Page 10
VI. Rate of Return 1
A. Introduction 2
An essential ingredient of the cost-of-service ratemaking formula is the rate of 3
return ("ROR"), which is usually premised on the goal of allowing a utility the opportunity to 4
recover the costs required to secure debt and equity financing. If the allowed ROR is based on 5
the costs to acquire capital, then it is synonymous with the utility’s weighted average cost of 6
capital ("WACC"), which is calculated by multiplying each component ratio of the appropriate 7
capital structure by its cost and then summing the results. While the proportion and cost of most 8
components of the capital structure are a matter of record, the cost of common equity must be 9
determined through expert analysis. Staff’s expert financial analyst, David Murray, has 10
estimated Ameren Missouri’s cost of common equity by applying well-respected and 11
widely-used methodologies to data derived from a carefully-assembled group of comparable 12
companies. Staff then used that cost of common equity and compared it to Staff’s cost of 13
common equity estimate in Ameren Missouri’s last rate case to determine what, if any changes 14
should be made to Ameren Missouri’s allowed return on common equity (ROE).7 Staff 15
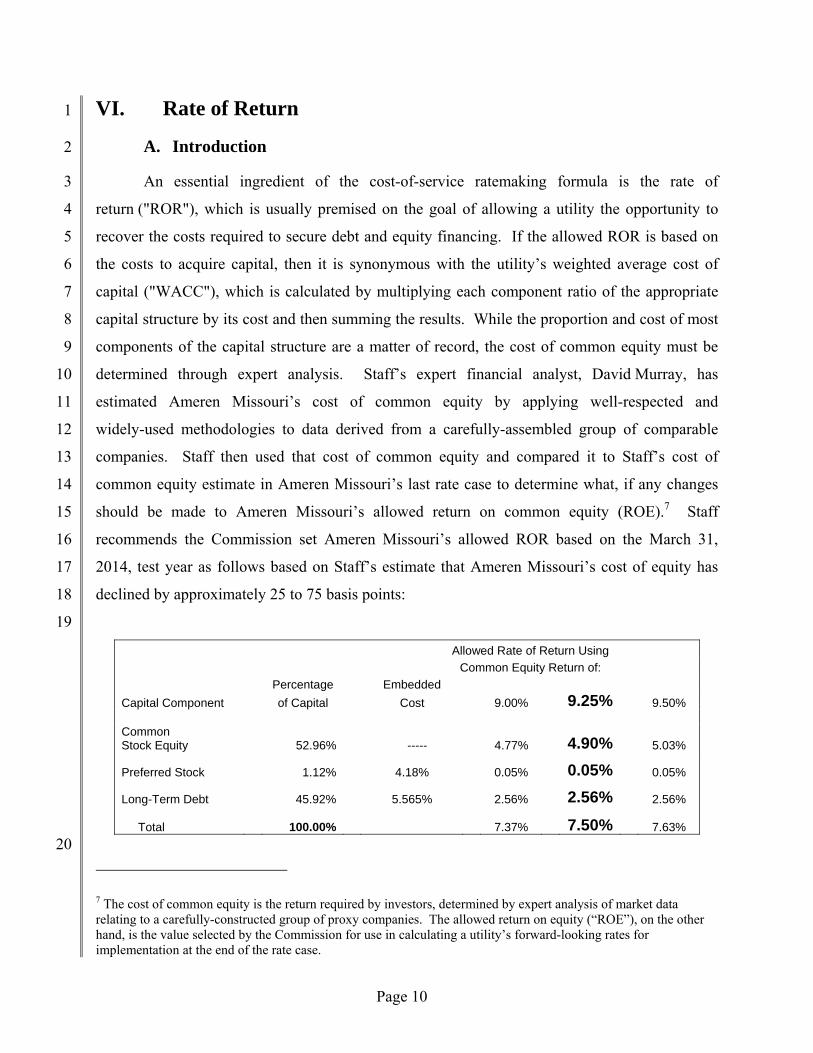
recommends the Commission set Ameren Missouri’s allowed ROR based on the March 31, 16
2014, test year as follows based on Staff’s estimate that Ameren Missouri’s cost of equity has 17
declined by approximately 25 to 75 basis points: 18
19
Allowed Rate of Return Using
Common Equity Return of:
Percentage Embedded
Capital Component of Capital Cost 9.00% 9.25% 9.50%
Common Stock Equity 52.96% ----- 4.77% 4.90% 5.03%
Preferred Stock 1.12% 4.18% 0.05% 0.05% 0.05%
Long-Term Debt 45.92% 5.565% 2.56% 2.56% 2.56%
Total 100.00% 7.37% 7.50% 7.63%
20
7 The cost of common equity is the return required by investors, determined by expert analysis of market data relating to a carefully-constructed group of proxy companies. The allowed return on equity (“ROE”), on the other hand, is the value selected by the Commission for use in calculating a utility’s forward-looking rates for implementation at the end of the rate case.
Page 11
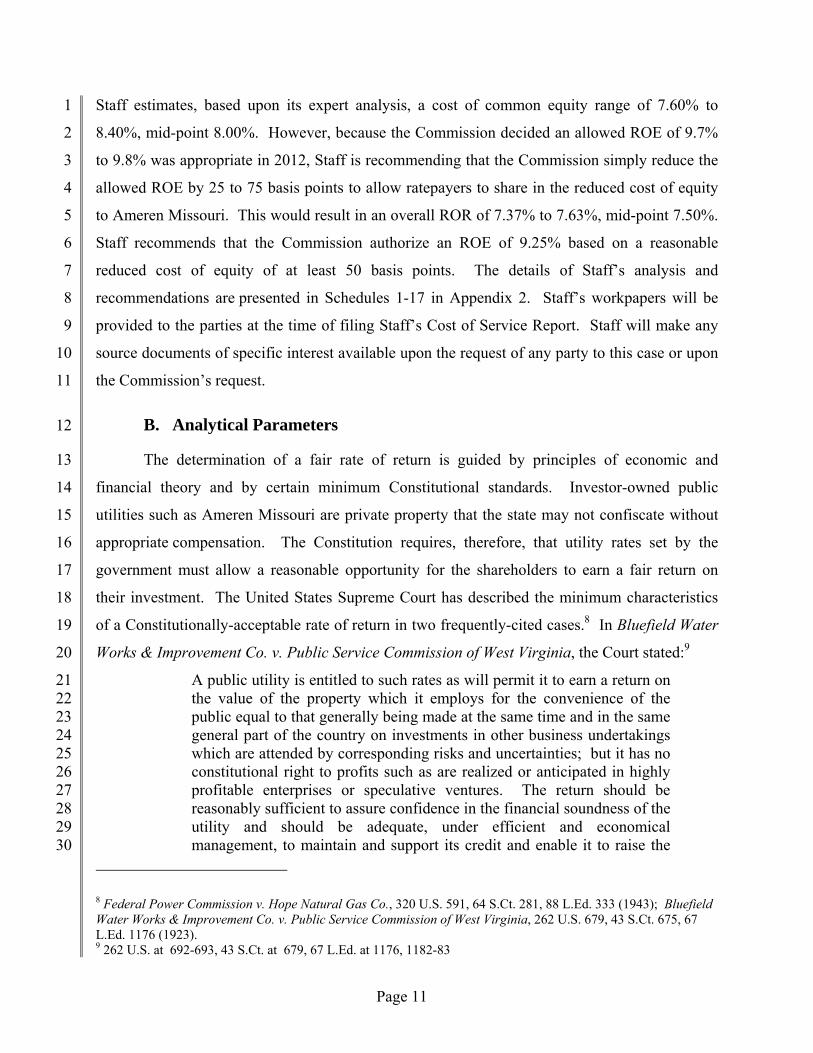
Staff estimates, based upon its expert analysis, a cost of common equity range of 7.60% to 1
8.40%, mid-point 8.00%. However, because the Commission decided an allowed ROE of 9.7% 2
to 9.8% was appropriate in 2012, Staff is recommending that the Commission simply reduce the 3
allowed ROE by 25 to 75 basis points to allow ratepayers to share in the reduced cost of equity 4
to Ameren Missouri. This would result in an overall ROR of 7.37% to 7.63%, mid-point 7.50%. 5
Staff recommends that the Commission authorize an ROE of 9.25% based on a reasonable 6
reduced cost of equity of at least 50 basis points. The details of Staff’s analysis and 7
recommendations are presented in Schedules 1-17 in Appendix 2. Staff’s workpapers will be 8
provided to the parties at the time of filing Staff’s Cost of Service Report. Staff will make any 9
source documents of specific interest available upon the request of any party to this case or upon 10
the Commission’s request. 11
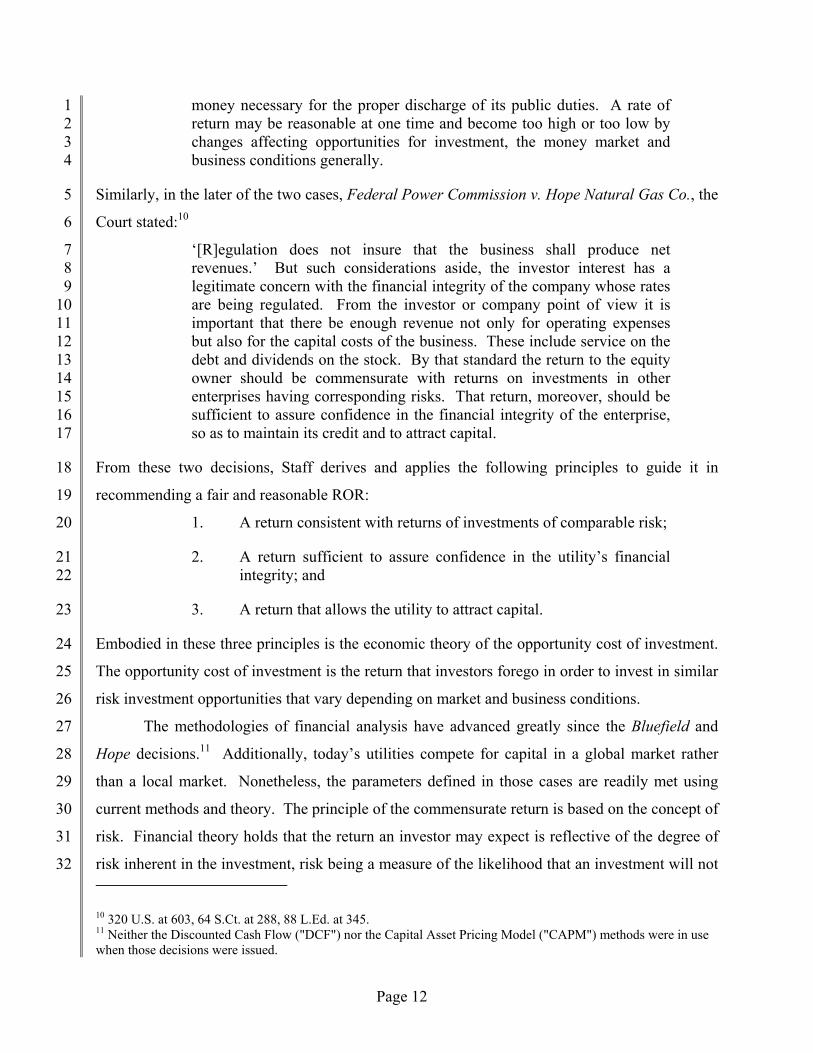
B. Analytical Parameters 12
The determination of a fair rate of return is guided by principles of economic and 13
financial theory and by certain minimum Constitutional standards. Investor-owned public 14
utilities such as Ameren Missouri are private property that the state may not confiscate without 15
appropriate compensation. The Constitution requires, therefore, that utility rates set by the 16
government must allow a reasonable opportunity for the shareholders to earn a fair return on 17
their investment. The United States Supreme Court has described the minimum characteristics 18
of a Constitutionally-acceptable rate of return in two frequently-cited cases.8 In Bluefield Water 19
Works & Improvement Co. v. Public Service Commission of West Virginia, the Court stated:9 20
A public utility is entitled to such rates as will permit it to earn a return on 21 the value of the property which it employs for the convenience of the 22 public equal to that generally being made at the same time and in the same 23 general part of the country on investments in other business undertakings 24 which are attended by corresponding risks and uncertainties; but it has no 25 constitutional right to profits such as are realized or anticipated in highly 26 profitable enterprises or speculative ventures. The return should be 27 reasonably sufficient to assure confidence in the financial soundness of the 28 utility and should be adequate, under efficient and economical 29 management, to maintain and support its credit and enable it to raise the 30
8 Federal Power Commission v. Hope Natural Gas Co., 320 U.S. 591, 64 S.Ct. 281, 88 L.Ed. 333 (1943); Bluefield Water Works & Improvement Co. v. Public Service Commission of West Virginia, 262 U.S. 679, 43 S.Ct. 675, 67 L.Ed. 1176 (1923). 9 262 U.S. at 692-693, 43 S.Ct. at 679, 67 L.Ed. at 1176, 1182-83
Page 12
money necessary for the proper discharge of its public duties. A rate of 1 return may be reasonable at one time and become too high or too low by 2 changes affecting opportunities for investment, the money market and 3 business conditions generally. 4
Similarly, in the later of the two cases, Federal Power Commission v. Hope Natural Gas Co., the 5
Court stated:10 6
‘[R]egulation does not insure that the business shall produce net 7 revenues.’ But such considerations aside, the investor interest has a 8 legitimate concern with the financial integrity of the company whose rates 9 are being regulated. From the investor or company point of view it is 10 important that there be enough revenue not only for operating expenses 11 but also for the capital costs of the business. These include service on the 12 debt and dividends on the stock. By that standard the return to the equity 13 owner should be commensurate with returns on investments in other 14 enterprises having corresponding risks. That return, moreover, should be 15 sufficient to assure confidence in the financial integrity of the enterprise, 16 so as to maintain its credit and to attract capital. 17
From these two decisions, Staff derives and applies the following principles to guide it in 18
recommending a fair and reasonable ROR: 19
1. A return consistent with returns of investments of comparable risk; 20
2. A return sufficient to assure confidence in the utility’s financial 21 integrity; and 22
3. A return that allows the utility to attract capital. 23
Embodied in these three principles is the economic theory of the opportunity cost of investment. 24
The opportunity cost of investment is the return that investors forego in order to invest in similar 25
risk investment opportunities that vary depending on market and business conditions. 26
The methodologies of financial analysis have advanced greatly since the Bluefield and 27
Hope decisions.11 Additionally, today’s utilities compete for capital in a global market rather 28
than a local market. Nonetheless, the parameters defined in those cases are readily met using 29
current methods and theory. The principle of the commensurate return is based on the concept of 30
risk. Financial theory holds that the return an investor may expect is reflective of the degree of 31
risk inherent in the investment, risk being a measure of the likelihood that an investment will not 32 10 320 U.S. at 603, 64 S.Ct. at 288, 88 L.Ed. at 345. 11 Neither the Discounted Cash Flow ("DCF") nor the Capital Asset Pricing Model ("CAPM") methods were in use when those decisions were issued.

Page 13
perform as expected by that investor. Any line of business carries with it its own peculiar risks 1
and it follows, therefore, that the return Ameren Missouri’s shareholders may expect is equal to 2
that required for comparable-risk utility companies. 3
Financial theory holds that the company-specific Discounted Cash Flow ("DCF") method 4
satisfies the constitutional principles inherent in estimating a return consistent with those of 5
companies of comparable risk;12 however, Staff recognizes that there is also merit in analyzing a 6
comparable group of companies as this approach allows for consideration of industry-wide data. 7
Because Staff believes the cost of equity can be reliably estimated using a comparable group of 8
companies and the Commission has expressed a preference for this approach, Staff relies 9
primarily on its analysis of a comparable group of companies to estimate the cost of equity for 10
Ameren Missouri. 11
In this case, Staff has applied this comparable company approach through the use of both 12
the DCF method and the Capital Asset Pricing Model ("CAPM"). Properly used and applied in 13
appropriate circumstances, both the DCF and the CAPM methodologies can provide accurate 14
estimates of a utility’s cost of equity. Because it is well-accepted economic theory that a 15
company that earns its cost of capital will be able to attract capital and maintain its financial 16
integrity, Staff believes that authorizing an allowed return on common equity based on the 17
cost of common equity is consistent with the principles set forth in Hope and Bluefield. 18
However, as Staff will discuss extensively throughout this section of the report, Staff believes it 19
is common practice for commissions to allow returns on equity that are higher than the costs of 20
equity for utilities. Consequently, Staff’s recommended allowed ROE is higher than Staff’s 21
estimate of Ameren Missouri’s cost of equity. 22
Because the Commission authorized an ROE in Ameren Missouri’s last rate case that it 23
deemed to be fair and reasonable, Staff believes it can best serve the Commission by providing it 24
an estimate of the relative change in electric utilities’ cost of equity in general, and Ameren 25
Missouri’s in particular, since Ameren Missouri’s last rate case, Case No. ER-2012-0166. Staff 26
believes the cost of equity has declined by approximately 50 basis points since Ameren 27
12 Because the DCF method uses stock prices to estimate the cost of equity, this theory not only compares the utility investment to other utilities, but it compares the utility investment to all available assets. Consequently, setting the allowed ROE based on a market-determined cost of equity is necessarily consistent with the principles of Hope and Bluefield.
Page 14
Missouri’s last rate case. Consequently, Staff recommends the Commission allow Ameren 1
Missouri an ROE in a range of 9.00 to 9.50 percent with a point estimate of 9.25 percent. 2
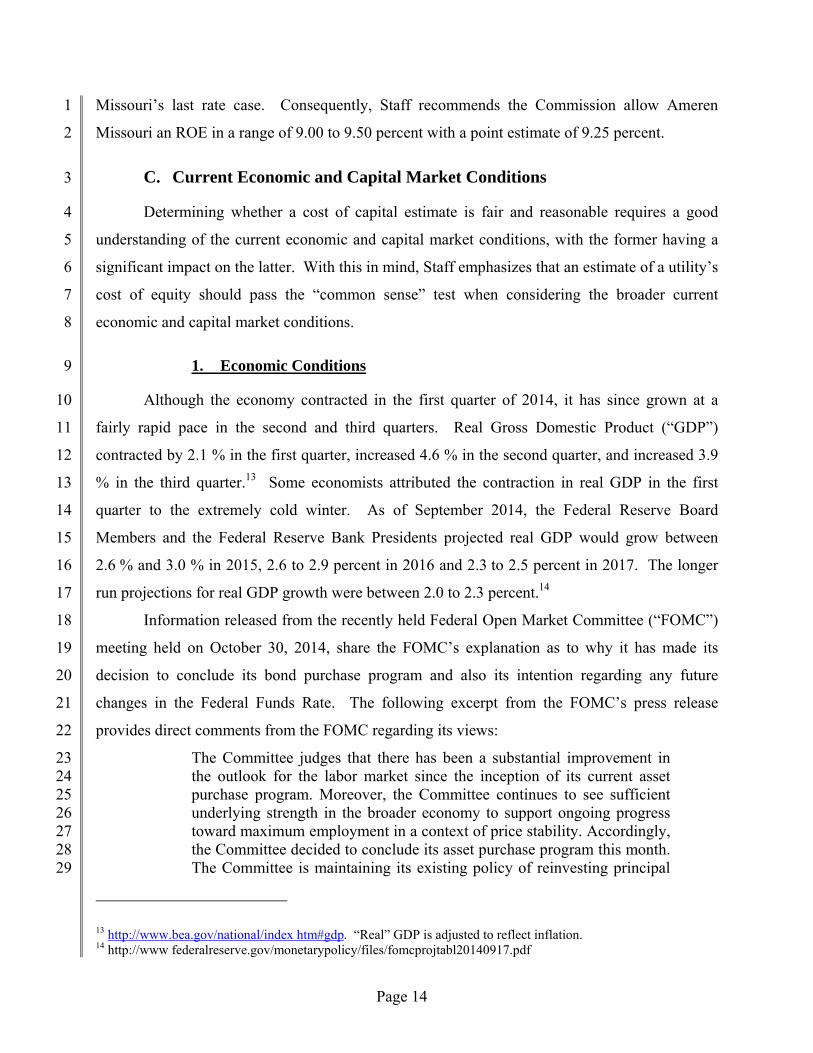
C. Current Economic and Capital Market Conditions 3
Determining whether a cost of capital estimate is fair and reasonable requires a good 4
understanding of the current economic and capital market conditions, with the former having a 5
significant impact on the latter. With this in mind, Staff emphasizes that an estimate of a utility’s 6
cost of equity should pass the “common sense” test when considering the broader current 7
economic and capital market conditions. 8
1. Economic Conditions 9
Although the economy contracted in the first quarter of 2014, it has since grown at a 10
fairly rapid pace in the second and third quarters. Real Gross Domestic Product (“GDP”) 11
contracted by 2.1 % in the first quarter, increased 4.6 % in the second quarter, and increased 3.9 12
% in the third quarter.13 Some economists attributed the contraction in real GDP in the first 13
quarter to the extremely cold winter. As of September 2014, the Federal Reserve Board 14
Members and the Federal Reserve Bank Presidents projected real GDP would grow between 15
2.6 % and 3.0 % in 2015, 2.6 to 2.9 percent in 2016 and 2.3 to 2.5 percent in 2017. The longer 16
run projections for real GDP growth were between 2.0 to 2.3 percent.14 17
Information released from the recently held Federal Open Market Committee (“FOMC”) 18
meeting held on October 30, 2014, share the FOMC’s explanation as to why it has made its 19
decision to conclude its bond purchase program and also its intention regarding any future 20
changes in the Federal Funds Rate. The following excerpt from the FOMC’s press release 21
provides direct comments from the FOMC regarding its views: 22
The Committee judges that there has been a substantial improvement in 23 the outlook for the labor market since the inception of its current asset 24 purchase program. Moreover, the Committee continues to see sufficient 25 underlying strength in the broader economy to support ongoing progress 26 toward maximum employment in a context of price stability. Accordingly, 27 the Committee decided to conclude its asset purchase program this month. 28 The Committee is maintaining its existing policy of reinvesting principal 29
13 http://www.bea.gov/national/index htm#gdp. “Real” GDP is adjusted to reflect inflation. 14 http://www federalreserve.gov/monetarypolicy/files/fomcprojtabl20140917.pdf

Page 15
payments from its holdings of agency debt and agency mortgage-backed 1 securities in agency mortgage-backed securities and of rolling over 2 maturing Treasury securities at auction. This policy, by keeping the 3 Committee's holdings of longer-term securities at sizable levels, should 4 help maintain accommodative financial conditions. 5
To support continued progress toward maximum employment and price 6 stability, the Committee today reaffirmed its view that the current 0 to 1/4 7 percent target range for the federal funds rate remains appropriate. In 8 determining how long to maintain this target range, the Committee will 9 assess progress--both realized and expected--toward its objectives of 10 maximum employment and 2 percent inflation. This assessment will take 11 into account a wide range of information, including measures of labor 12 market conditions, indicators of inflation pressures and inflation 13 expectations, and readings on financial developments. The Committee 14 anticipates, based on its current assessment, that it likely will be 15 appropriate to maintain the 0 to 1/4 percent target range for the federal 16 funds rate for a considerable time following the end of its asset purchase 17 program this month, especially if projected inflation continues to run 18 below the Committee's 2 percent longer-run goal, and provided that 19 longer-term inflation expectations remain well anchored. However, if 20 incoming information indicates faster progress toward the Committee's 21 employment and inflation objectives than the Committee now expects, 22 then increases in the target range for the federal funds rate are likely to 23 occur sooner than currently anticipated. Conversely, if progress proves 24 slower than expected, then increases in the target range are likely to occur 25 later than currently anticipated. 26
When the Committee decides to begin to remove policy accommodation, 27 it will take a balanced approach consistent with its longer-run goals of 28 maximum employment and inflation of 2 percent. The Committee 29 currently anticipates that, even after employment and inflation are near 30 mandate-consistent levels, economic conditions may, for some time, 31 warrant keeping the target federal funds rate below levels the Committee 32 views as normal in the longer run.15 33
2. Capital Market Conditions 34
a. Utility Debt Markets 35
Utility debt markets indicate a lower cost-of-capital environment than that which existed 36
in 2012. If one were to assume that the risk premium16 required for investing in utility stocks 37
15 Federal Reserve Press Release October 30, 2014. 16 Risk Premium in this context is the excess required return to invest in a company’s equity rather than its debt.

Page 16
rather than utility bonds was constant, then the current lower utility debt yields translate into a 1
lower required return on equity than in 2012. 2
Although utility bond yields increased during the 2013 calendar year, they have generally 3
declined through October 31, 2014, and on average are below the yields in 2012. The average 4
utility bond yield for the first 6 months of 2012 (the general time frame in which capital market 5
data was analyzed in the 2012 rate cases) was 4.94%. The average utility bond yield for the most 6
recent 6 months in 2014 was 4.36%, a decline of approximately 60 basis points. (see Schedules 7
4-1 and 4-3). For the most recent 6 months through October 2014, the average spread between 8
30-year T-bonds (3.27 %) and average utility bond yields (4.36 %) was 109 basis points. For the 9
first 6 months in 2012, the average spread between 30-year T-bonds (3.04 %) and average utility 10
bond yields (4.94 %)17 was 190 basis points. The decline in the spread is explained mainly by 11
the decline in utility bond yields because the 30-year T-bond yields have increased slightly since 12
2012. (see Schedules 4-3 and 4-4). Consequently, it appears that utility bond yields may have 13
already factored in an expected increase in yields on treasury bonds at some point in time. 14
b. Utility Equity Markets 15
For the twelve months ending September 30, 2014, the total return on the Dow Jones 16
Industrial Average was 12.65%, the total return on the Standard & Poor’s 500 (“S&P 500”) 17
was 18.78%, and the total return on the Edison Electric Institute ("EEI") Index of electric utilities 18
was 15.58%. Typically, over long holding periods utility indices tend to lag behind broader 19
market indices that are increasing or decreasing. Regulated utilities are not expected to be as 20
cyclical as the broader markets because of low demand elasticity; however, utilities with 21
significant non-regulated operations are likely to be more affected by general economic trends. 22
The equally weighted returns for the EEI’s indices of electric utility companies since 2009 are as 23
follows: 24
2009 2010 2011 2012 2013 201418 25
EEI Broad Index 14.1% 11.9% 21.4% 4.8% 17.3% 17.3% 26
Regulated 14.2% 15.8% 22.3% 4.7% 17.0% 16.8% 27
17 For utility bond yields prior to September 2010, Staff used Mergent Bond Record. For utility bond yields subsequent to this period, Staff used data it receives from BondsOnline pursuant to a subscription agreement. 18 For the first 6 months of 2014 because as of December 4, 2014, EEI had not updated the returns through September 30, 2014.

Page 17
Mostly Regulated 15.6% 8.5% 19.5% 5.8% 16.0% 18.2% 1
Diversified 8.1% -5.2% 21.4% 0.8% 47.5% 16.1% 2
Chain linking19 these returns provides the following total return performance for all of the 3
categories provided by EEI: EEI Broad Index: 123.51%; EEI Regulated Index: 131.41%; EEI 4
Mostly Regulated Index: 117.43%; and EEI Diversified Index: 114.75%. 5
Although the above returns are equally weighted returns and the S&P 500 is a 6
market-weighted return, reviewing the performance of the S&P 500 over the same period is 7
helpful in evaluating relative performance of utilities as they relate to the broader markets: 8
2009 2010 2011 2012 2013 2014 9
S&P 500 26.5% 15.1% 2.1% 16.0% 32.4% 7.1% 10
Chain linking the S&P returns indicates total return performance of 144.53%, which is greater 11
than the total return performance of all of EEI’s indices. Traditionally, over long-term market 12
periods, total returns on the S&P 500 should outperform regulated utilities by at least 25% to 13
30% because betas on regulated utilities typically are around 0.7, implying that utilities will lag 14
the S&P 500 in gains by about 30%, but also lag the S&P 500 in losses by about 30%. 15
Comparing the total return of EEI’s regulated utilities index shows that the regulated utilities 16
sector has only lagged by about 10%. This relationship actually is quite logical considering the 17
low-growth, low long-term interest rate the U.S. economy and capital markets have experienced 18
during the period since the recession of 2008 and 2009. Many investors have been seeking 19
investments that may provide a return higher than those being offered by bonds. Because utility 20
stocks are viewed by investors as being a close alternative to bonds, the price of utility stocks has 21
been bid up due mainly to lower interest rates. Quite simply, the lower interest rate environment 22
has continued to support a low cost of capital environment for utilities for both their equity 23
capital and their debt capital. 24
In fact, many utility equity analysts during the past few years have consistently discussed 25
the premium at which regulated utility stocks have traded as compared to the S&P 500, which is 26
not typical over the long-term in capital markets. Typically, due to the low-growth and 27
high-dividend yield characteristics of utility stocks, the price-to-earnings ratios are lower for 28 19 A process for combining periodic returns to produce an overall time-weighted rate of return. 2009 CFA Program Curriculum, Level III, Volume 6, p. 120.

Page 18
utility stocks as compared to the higher-growth, lower-yield profile of the S&P 500. Equity 1
analysts consistently explain that the higher multiples are driven by the low interest rate 2
environment, not higher growth expectations for the regulated utility industry as compared to the 3
broader markets. 4
Goldman Sachs’ analysis consistently shows that utilities typically trade at a premium to 5
the market when U.S. 10-year treasury yields trade below the 3% level and trade at a discount to 6
the market when U.S. 10-year treasury yields trade above 3%. The average yield on the U.S. 10-7
year treasury was 2.30% for the month of October 2014. Goldman Sachs also points out that the 8
projected compound annual growth rate (“CAGR”) in Earnings Per Share (“EPS”) for utilities 9
for the 2013 through 2016 averages approximately 5%, which is below most all other sectors in 10
the S&P 500. Coupling the fact that utilities are trading at a premium to the S&P 500 even 11
though utilities have lower growth expectations than the S&P 500, clearly indicates that utilities’ 12
cost of equity is quite low in the current economic and capital market environment. Assuming 13
the Commission accepts these capital market experts’ views on the reason for the current higher 14
valuation levels of utilities, then the key question the Commission needs to answer in 15
determining a fair allowed return on equity in this case is whether changes since the Commission 16
heard evidence in the electric cases in 2012 when it authorized an ROE of 9.8% for Ameren 17
Missouri and 9.7% for KCPL and KCPL Greater Missouri Operations Company (“GMO”) 18
justify a decrease, increase or no change to the allowed ROEs now. 19
Although Staff will provide more specific information about its specific cost of equity 20
analysis of its proxy groups later in its testimony, Staff will provide a brief overview of the 21
changes in the capital markets since the Commission authorized ROEs in the Ameren Missouri 22
and KCPL rate cases at the end of 2012 and in early 2013, based on capital market evidence 23
through approximately mid-2012. 24
At the time Staff filed its direct testimony in both the Ameren Missouri and KCPL and 25
GMO rate cases, the 6-month average utility bond yield through June 2012 was 4.94%. At the 26
time Staff was preparing its testimony for this case, the 6-month average utility bond yield 27
through October 2014 was 4.36%, a decline of approximately 60 basis points. Although not as 28
indicative of utility capital costs, the 6-month average U.S. 30-year Treasury yield was 3.04% 29
for the first 6-months of 2012. At the time Staff was preparing its testimony for this case, the 30

Page 19
6-month average U.S. 30-year U.S. Treasury yield was 3.27%, an increase of approximately 1
25 basis points. 2
Although Staff believes the decline in utility bond yields provides support for lowering 3
the allowed ROE from the Commission’s previous authorizations, it is important to evaluate the 4
impact the lower bond yields have had on both the absolute and relative performance of 5
electric utility indices and broader market indices over the period since the Commission last 6
authorized ROEs for electric utilities in Missouri. As provided in the table above (but partially 7
reproduced below for convenience), the total returns for each of the indices were as follows since 8
January 1, 2012: 9
2012 2013 2014 10
EEI Broad Index 4.8% 17.3% 17.3% 11
Regulated 4.7% 17.0% 16.8% 12
Mostly Regulated 5.8% 16.0% 18.2% 13
Diversified 0.8% 47.5% 16.1% 14
S&P 500 16.0% 32.4% 7.1% 15
Chain linking these returns provides the following total return performance for all of the indices: 16
EEI Broad Index: 44.20%; EEI Regulated Index: 43.08%; EEI Mostly Regulated Index: 17
45.06%; EEI Diversified Index: 72.62%; S&P 500: 64.49%. This information clearly shows 18
that the regulated utilities’ total returns as compared to the S&P 500 were much more consistent 19
with a typical capital market situation in which utilities’ returns lag that of the broader markets 20
by approximately 30%. Although this information provides insight on the performance of the 21
market, without analyzing the reasons for the performance differences, it will not provide much 22
insight on any potential changes in the cost of equity since 2012. 23
The fact that the compound average annualized return for the regulated utilities’ index 24
was 13.91% since 2012, while the expected average near-term growth of EPS for regulated 25
utilities is only approximately 5%, implies that the price gains have been driven by a continued 26
contraction in the required ROE. A contraction in the required ROE, i.e. the cost of equity, 27
allows for an expansion in the price-to-earnings multiples of the sector. Because the average 28
dividend yield for regulated electric utilities is no higher than 4%, this means that the other 29
approximate 5% of capital gains came directly from an expansion of the price-to-earnings 30

Page 20
multiple for electric utilities, not due to changes in the growth fundamentals of the underlying 1
companies. 2
Below is a graph of the change in the price-to-last-twelve-months’-earnings ratios 3
(“p/e ratios”) for EEI’s current regulated utility index from the beginning of January 1, 2012, 4
through September 30, 2014. As can be seen, the p/e ratios have increased since the 5
Commission determined that an allowed ROE for Ameren Missouri and KCPL should be in the 6
range of 9.70% to 9.80%. The increase in the p/e ratios for the electric utility industry indicates 7
that the cost of equity has declined further since the Commission last decided an allowed ROE of 8
9.70% to 9.80% was fair and reasonable. 9
10
As explained by EEI itself, the continued increase in electric utility stock prices is not explained 11
by the fundamentals of the industry, but by the macroeconomic environment, which has caused 12
investors to continue to lower their required ROE’s, i.e. the cost of common equity. EEI 13

Page 21
specifically stated the following in its report on electric utility stocks through the second quarter 1
of 2014: 2
The EEI Index surged 18.0% in the first half of 2014, outperforming the 3 major averages after markedly trailing in 2012 and 2013. As has typically 4 been the case in recent years, performance was influenced more by 5 macroeconomic trends (declining interest rates and firming natural gas 6 spot prices in early 2014) than any significant change in industry 7 fundamentals.20 8
Although this commentary does not estimate how much the cost of equity has declined, it 9
definitely provides evidence that it has declined since 2012. 10
Staff also decided to analyze the changes in the price-to-forward EPS multiples, as 11
reported by FactSet21, because these multiples are often discussed by equity analysts and 12
investors when evaluating whether a stock is attractively valued (lower p/e ratio than implied in 13
their valuations). In 2012 the average p/e ratio for EEI’s regulated electric utilities was 16.3x; in 14
2013 it increased to 16.9x and in 2014 it increased to 18.1x. One way to evaluate whether the 15
p/e ratio expansion can be explained by changes in growth fundamentals of the industry rather 16
than a declining ROE, i.e. cost of common equity, is to evaluate the PEG ratio, which measures 17
the change in the ratio of p/e to the 5-year EPS growth projections. In 2012 the average PEG 18
ratio for EEI’s regulated electric utilities was 3.7x, it increased to 4.4x in 2013 and has since 19
come back down to 4.0x. Although not as high as it was in 2013, it is above the ratio in 2012, 20
which indicates that the cost of equity for regulated electric utilities has declined since then. 21
Although Staff is introducing different criteria to select its proxy group in this rate case as 22
compared to the criteria it used in the 2012 rate cases, Staff performed an updated analysis of the 23
proxy group it used in 2012 for purposes of evaluating and quantifying any potential changes to 24
the cost of equity for the proxy group. Being that the main issue the Commission had with 25
Staff’s cost of equity estimate in the last rate case was that it was just too low, which was 26
primarily driven by Staff’s use of a lower perpetual growth rate, the Commission should focus on 27
the relative change in Staff’s cost of equity estimate compared to 2012 rather than the absolute 28
estimate. Because perpetual growth rates should not change much over time, Staff believes that 29
20 Edison Electric Institute Second Quarter 2014 Financial Update. 21 Staff receives FactSet compilation of equity analyst estimates through its subscription to SNL Financial.
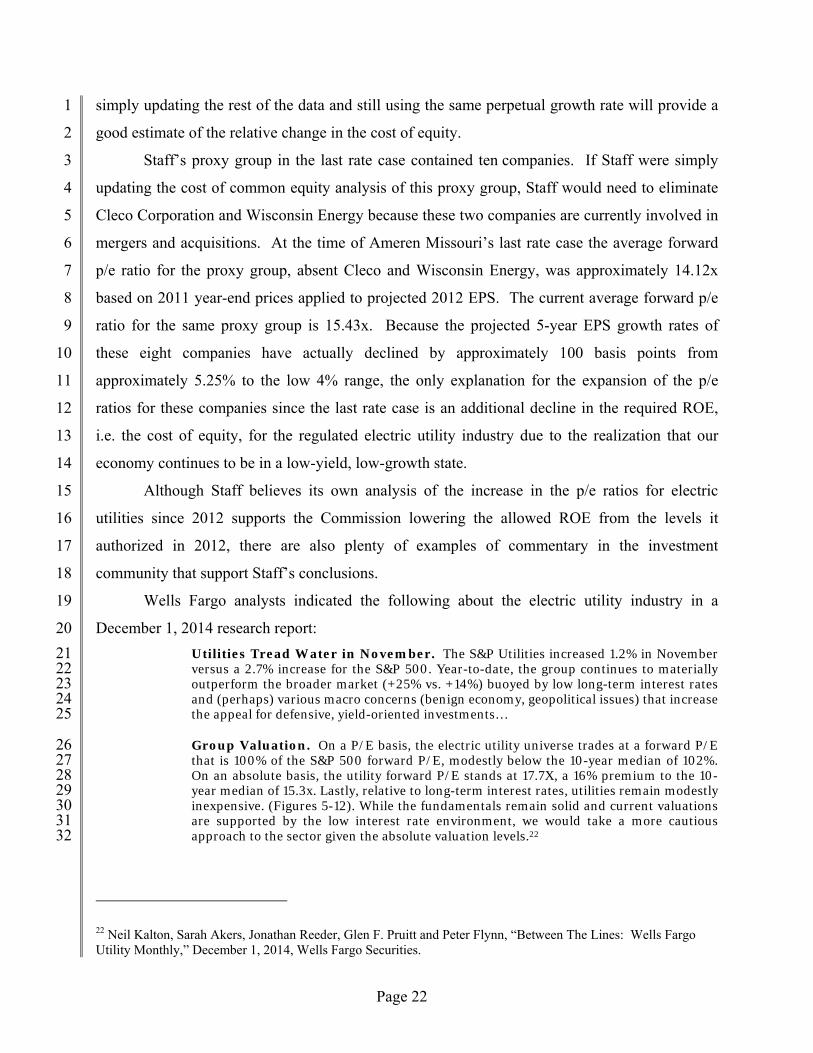
Page 22
simply updating the rest of the data and still using the same perpetual growth rate will provide a 1
good estimate of the relative change in the cost of equity. 2
Staff’s proxy group in the last rate case contained ten companies. If Staff were simply 3
updating the cost of common equity analysis of this proxy group, Staff would need to eliminate 4
Cleco Corporation and Wisconsin Energy because these two companies are currently involved in 5
mergers and acquisitions. At the time of Ameren Missouri’s last rate case the average forward 6
p/e ratio for the proxy group, absent Cleco and Wisconsin Energy, was approximately 14.12x 7
based on 2011 year-end prices applied to projected 2012 EPS. The current average forward p/e 8
ratio for the same proxy group is 15.43x. Because the projected 5-year EPS growth rates of 9
these eight companies have actually declined by approximately 100 basis points from 10
approximately 5.25% to the low 4% range, the only explanation for the expansion of the p/e 11
ratios for these companies since the last rate case is an additional decline in the required ROE, 12
i.e. the cost of equity, for the regulated electric utility industry due to the realization that our 13
economy continues to be in a low-yield, low-growth state. 14
Although Staff believes its own analysis of the increase in the p/e ratios for electric 15
utilities since 2012 supports the Commission lowering the allowed ROE from the levels it 16
authorized in 2012, there are also plenty of examples of commentary in the investment 17
community that support Staff’s conclusions. 18
Wells Fargo analysts indicated the following about the electric utility industry in a 19
December 1, 2014 research report: 20
Utilities Tread Water in November. The S&P Utilities increased 1.2% in November 21 versus a 2.7% increase for the S&P 500. Year-to-date, the group continues to materially 22 outperform the broader market (+25% vs. +14%) buoyed by low long-term interest rates 23 and (perhaps) various macro concerns (benign economy, geopolitical issues) that increase 24 the appeal for defensive, yield-oriented investments… 25
Group Valuation. On a P/E basis, the electric utility universe trades at a forward P/E 26 that is 100% of the S&P 500 forward P/E, modestly below the 10-year median of 102%. 27 On an absolute basis, the utility forward P/E stands at 17.7X, a 16% premium to the 10-28 year median of 15.3x. Lastly, relative to long-term interest rates, utilities remain modestly 29 inexpensive. (Figures 5-12). While the fundamentals remain solid and current valuations 30 are supported by the low interest rate environment, we would take a more cautious 31 approach to the sector given the absolute valuation levels.22 32
22 Neil Kalton, Sarah Akers, Jonathan Reeder, Glen F. Pruitt and Peter Flynn, “Between The Lines: Wells Fargo Utility Monthly,” December 1, 2014, Wells Fargo Securities.

Page 23
Goldman Sachs indicated the following about the electric utility industry in a July 27, 2014 1
research report: 2
We reiterate our Cautious view on utilities…Heading into 2Q2014 reporting 3 and as investors position portfolios through year-end, we remain cautious on 4 utilities in general, given (1) valuation levels that remain above historical trends, 5 with many at PE multiples of 15.5x/15.0x on 2015/2016 – just below peak levels, 6 and (2) the potential for rising US treasury yields to weigh on valuation… 7
Utilities still trade above historical levels – at almost 15.5x on 2015 (FY2) 8 earnings, near peak levels – and we see little room for multiple expansion or 9 abnormal earnings growth going forward. EPS growth for the sector remains 10 below many other S&P industries.23 11
D. Ameren’s and Ameren Missouri’s Operations 12
1. Ameren 13
The following excerpt from Ameren’s Form 10-Q filing with the United States Securities 14
and Exchange Commission ("SEC") for the quarter ended September 30, 2014, provides a good 15
description of Ameren’s current business operations and current organizational structure: 16
Ameren, headquartered in St. Louis, Missouri, is a public utility holding 17 company under PUHCA 2005, administered by FERC. Ameren’s primary 18 assets are its equity interests in its subsidiaries. Ameren’s subsidiaries are 19 separate, independent legal entities with separate businesses, assets, and 20 liabilities. Dividends on Ameren’s common stock and the payment of 21 parent company expenses by Ameren depend on distributions made to it 22 by its subsidiaries. Ameren’s principal subsidiaries are listed below. Also 23 see the Glossary of Terms and Abbreviations at the front of this report and 24 in the Form 10-K. 25
Union Electric Company, doing business as Ameren 26 Missouri, operates a rate-regulated electric generation, 27 transmission, and distribution business, and a rate-regulated 28 natural gas transmission and distribution business in 29 Missouri. Ameren Missouri supplies electric service to 1.2 30 million customers and natural gas service to 127,000 31 customers. 32
Ameren Illinois Company, doing business as Ameren 33 Illinois, operates a rate-regulated electric and natural gas 34 transmission and distribution business in Illinois. Ameren 35
23 Michael Lapides, Adam Muro, Vikas Sharma, Rishabh Gupta, “Power Positioning 2H2014: CPN to the CL [Conviction List] Buy list, upgrade DYN, downgrade PCG,” July 27, 2014.

Page 24
Illinois supplies electric service to 1.2 million customers 1 and natural gas service to 807,000 customers. 2
Ameren’s business risk profile has changed significantly since its last rate case in 2012. 3
Ameren’s operations in 2012 included its merchant generation operations in Illinois. These 4
non-regulated merchant operations increased Ameren’s business risk profile to the extent that 5
Staff excluded Ameren from its proxy group for estimating Union Electric’s cost of common 6
equity. Ameren’s merchant generation operations were held under its non-regulated subsidiary 7
Ameren Energy Generating Company (“Genco”). As can be seen in Staff’s schedules providing 8
Ameren’s historical financial information, write-downs and other losses from the Genco 9
operations caused Ameren to experience contraction in the growth of various financial 10
indicators, such as earnings and dividends, for the period 2009 through 2013. Ameren sold its 11
Genco operations to Dynegy on December 2, 2013. Because the assets held by Genco had no 12
value to Ameren’s shareholders, Dynegy’s consideration for the acquisition of the Genco assets 13
was simply the assumption of $824 million of debt held by Genco. After the divestiture of these 14
non-regulated assets, Ameren’s business risk profile became consistent with that of a pure-play 15
electric utility if one considers its federal transmission assets to be regulated electric operations. 16
E. Ameren Missouri’s and Ameren’s Credit Ratings 17
Ameren and Ameren Missouri are currently rated by Moody’s, Standard & Poor’s 18
("S&P") and Fitch. It is important to understand the current credit standing of Ameren as well as 19
Ameren Missouri, as Ameren’s ratings influence investors’ views of the risk associated with 20
investing in Ameren Missouri. Although Staff is not estimating the cost of capital for Ameren in 21
this case, the influence of the risks of Ameren’s other operations, which now no longer include 22
the non-regulated merchant generation operations, on Ameren Missouri’s risk must be 23
understood in order to estimate a fair rate of return for Ameren Missouri. Ameren Missouri’s 24
past affiliation with Ameren’s non-regulated operations had consistently impaired Ameren 25
Missouri’s credit quality from what it could have been absent this affiliation. Since Ameren 26
divested the non-regulated operations, Ameren Missouri’s credit quality and ratings have 27
improved. 28
Ameren Missouri’s and Ameren’s credit ratings are generally consistent with the 29
exception of Moody’s, which rates Ameren one notch lower than Ameren Missouri. S&P, 30

Page 25
Moody’s and Fitch issuer/corporate credit rating are ‘BBB+’, ‘Baa1’ and ‘BBB+’, 1
respectively.24 S&P’s rating of Ameren Missouri is two notches higher than it was in 2012; 2
Moody’s rating of Ameren Missouri is one notch higher; and Fitch’s rating is the same. 3
However, it is important to understand that S&P’s ratings methodology is still based on 4
its assessment of Ameren’s overall credit quality. Based on S&P’s May 8, 2014, research report 5
on Ameren Missouri, it would assign an ‘A-’ credit rating to Ameren Missouri if it were rated as 6
a stand-alone entity. 7
The following is an excerpt from S&P’s May 8, 2014, credit-rating report on 8
Ameren Missouri, discussing Ameren Missouri’s business risk: 9
We consider AM [Ameren Missouri] business risk profile as "excellent", 10 reflecting its lower-risk, monopolistic rate-regulated utility businesses that 11 provide an essential service. AM is a rate-regulated utility that serves 12 about 1.2 million electric and more than 120,000 gas customers in portions 13 of central and eastern Missouri. The company also has about 10,300 14 megawatts (MW) of generating capacity, generating about 75% of its 15 electricity from coal and 20% from nuclear. 16
We view the Missouri regulatory jurisdiction as "strong/adequate" (see 17 "Utility Regulatory Assessments For U.S. Investor-Owned Utilities," Jan. 18 7, 2014) and we view AM's management of regulatory risk as average 19 compared with peers. This reflects the company's use of various riders and 20 trackers that include a fuel adjustment clause and pension and storm 21 trackers. However, under our base case scenario of slower-than-average 22 economic growth, continued regulatory lag, and higher capital spending, 23 we view the company's ability to consistently earn its allowed return on 24 equity as challenging. 25
S&P’s methodology of assessing corporations in general, and utilities in specific, has 26
changed since 2012. Ameren Missouri is now assigned a “regulatory/advantage” score based on 27
S&P’s assessment of the regulatory environment and the utility company’s ability to manage the 28
regulatory environment. S&P considers the Missouri regulatory environment for electric utilities 29
to be one notch below the best category, which is “Strong,” and S&P assigns Ameren Missouri’s 30
ability to “manage” that regulatory environment as “neutral,” which means they do not consider 31
the utility to have a positive or negative advantage over other utilities’ ability to manage the 32
regulatory process. 33
24 SNL Financial.

Page 26
F. Cost of Capital 1
In order to arrive at Staff’s recommended ROR, Staff specifically examined (1) an 2
appropriate ratemaking capital structure, (2) the Company’s embedded cost of debt and preferred 3
stock, and (3) the change in the Company’s cost of common equity. 4
1. Capital Structure 5
Schedules 5-1 and 5-2 present Ameren Missouri’s and Ameren’s historical year-end 6
capital structures in dollar terms and percentage terms for the years 2009 through 2013 along 7
with the quarter-end as of September 30, 2014. As can be observed from these historical capital 8
structures, the current capital structure of Ameren Missouri is fairly consistent with the way in 9
which Ameren has been capitalized over this period, easing Staff’s concern regarding 10
manipulation of Ameren Missouri’s capital structure for ratemaking purposes. 11
For the purposes of its direct case, Staff accepted Ameren Missouri’s March 31, 2014, 12
capital structure provided in the Direct Testimony of Company witness Ryan J. Martin.25 13
Schedule 6 presents Ameren Missouri’s capital structure and associated capital ratios. 14
The resulting capital structure consists of 52.96% common stock equity, 1.12% preferred stock 15
and 45.92% long-term debt. 16
2. Embedded Cost of Debt and Preferred Stock 17
Staff currently accepts the embedded cost of long-term debt and preferred stock as 18
provided in Company witness Ryan Martin’s direct testimony. 19
3. Cost of Common Equity 20
Staff estimated Ameren Missouri’s cost of common equity through a comparable 21
company cost-of-equity analysis of a broader proxy group and a more refined proxy group using 22
the DCF method. Staff also compared the new proxy groups and the proxy group in Ameren 23
Missouri’s last rate case to estimate the relative change in the cost of equity since 2012. 24
Additionally, Staff used a CAPM analysis and a survey of other indicators as a check of the 25
reasonableness of its recommendations. 26
25 Martin Direct Testimony, February 3, 2012, p. 5, lines 19-20.

Page 27
a. The Proxy Groups 1
Staff decided to perform a cost of common equity analysis on two sets of proxy groups in 2
this case. Although Staff has revised its selection criteria to select a current proxy group, 3
considering the insight that can be gained about the relative change in the cost of common equity 4
by evaluating the proxy group Staff used in the rate cases in 2012, Staff decided to update the 5
cost of common equity analysis on this proxy group as well. Staff limited its DCF analysis of 6
the old proxy group to the multi-stage DCF since Staff gave this the most weight in the last case 7
and because it is dynamic enough to consider near-term growth rate impacts. The only changes 8
Staff made to the proxy group from 2012 was to eliminate Cleco Corporation and Wisconsin 9
Energy Resources because their stock prices are currently influenced by announced mergers and 10
acquisitions. Staff will first explain how it selected the new proxy group and provide cost of 11
common equity indications from this proxy group. Staff will then update the cost of common 12
equity analysis from the proxy group in 2012 and compare the new results to the old results to 13
draw inferences about the change in the cost of equity since 2012. 14
Although Staff has changed its proxy group selection process as compared to the 2012 15
rate cases, the ultimate goal is the same, which is to select companies whose operations are 16
confined as much as possible to regulated utility operations (“pure-play regulated utilities”/ 17
“pure-play”) with a majority of the regulated utility operations being that of the electric utility 18
sector. Staff believes its ability to access a vast amount of financial and capital market 19
information through its upgraded subscriptions to SNL Financial now allows for a much more 20
efficient and detailed analysis of companies that are generally classified as electric utilities, but 21
may have significant amounts of other operations that contribute to their risk profile. In the past, 22
Staff relied on various third-parties, such as credit rating agencies and certain publishers, to assist 23
with attempting to select appropriate companies. Although this usually resulted in a reasonable 24
proxy group, Staff’s easy and efficient access to very detailed financial information has allowed 25
it to refine its proxy group selection process and become more aware of companies which have 26
material non-regulated business segments that cause their risk profiles to be inconsistent with a 27
pure-play regulated utility. Staff’s explanation of its new process follows: 28
Starting with 64 market-traded companies classified as power companies by SNL 29
Financial, Staff applied a number of criteria to develop a proxy group comparable in risk to 30
Ameren Missouri’s regulated electric utility operations (see Schedule 7). Staff’s criteria are 31

Page 28
designed to capture companies with primarily regulated electric operations (which means the 1
companies’ operations may have other regulated operations, such as gas distribution), and whose 2
electric utility operations contain a significant amount of generation assets. Staff believes the 3
criteria it selected accomplished this objective. However, Staff notes that even with its screening 4
criteria, some of the companies it chose for its proxy group have business segments other than 5
rate-regulated utility operations that cause material volatility in the contribution of the regulated 6
utility operations to the percentage of income on a year-to-year basis. That being said, Staff will 7
refine its broader proxy group to eliminate two additional companies that have material volatility 8
in the percentage of income from regulated operations due to the volatility of income from its 9
non-regulated segments. However, Staff will show the results of the broader proxy group and 10
the refined proxy group in each of its schedules. Staff’s criteria are as follows: 11
1. Classified as a power company by SNL (64 companies); 12
2. Publicly-traded stock (one company eliminated, 63 remaining); 13
3. Followed by EEI and classified by EEI as a regulated utility 14 (29 companies eliminated, 34 remaining); 15
4. At least 50% of plant from electric utility operations (4 companies 16 eliminated, 30 remaining); 17
5. At least 25% of electric plant from generation (8 companies 18 eliminated, 22 remaining); 19
6. At least 80% of income from regulated utility operations 20 (2 companies eliminated, 20 remaining); 21
7. No reduced dividend since 2011 (0 companies eliminated, 22 20 remaining); 23
8. At least investment grade credit rating (0 companies eliminated, 24 20 remaining); 25
9. At least 2 equity analysts providing long-term growth projections 26 in the last 90 days (6 companies eliminated, 14 remaining); 27
10. No significant merger or acquisition announced recently 28 (0 companies eliminated, 14 remaining). 29

Page 29
The resulting final group of 14 publicly-traded electric utility companies (“the comparables”) 1
was used as the broader proxy group to estimate a cost of common equity for the electric utility 2
industry. These companies are shown on Schedule 8. 3
The final criterion used to eliminate any remaining companies that may have segments 4
that have risks inconsistent with a regulated utility is criterion No. 6. In order to select 5
companies that consistently received at least 80% of their income from rate-regulated utility 6
operations, one has to review past performance (Staff chose the last 3 years). However, limiting 7
the selection criteria to just looking at the average amount of income from regulated utility 8
operations can cause the selection of companies that have material volatility in the percentage of 9
income contributed by the regulated utility operations simply because a non-regulated segment 10
may contribute 25% to margin in one year and then reduce margin by 10% in the following year. 11
In the latter situation, one would erroneously conclude that the risk profile of the company is 12
consistent with a regulated utility since the regulated income was over 100% of the company’s 13
income. If one were to take a simple average of these two years, then the company would be 14
selected as a comparable company based simply on the fact that 92.5% of the average income 15
came from regulated utility operations. Being that the non-regulated operations significantly 16
increased the variability of income, it is important to add an additional criterion to eliminate 17
companies that have such volatile segments. 18
Consequently, Staff decided to further refine its broader proxy group to eliminate 19
companies in which the contributions of income from rate-regulated utility operations had a 20
standard deviation of greater than 10% for the most recent three years. If the contribution from 21
regulated utility operations is varying significantly from year to year, then this will make the cost 22
of capital inconsistent with the risks of the regulated utility operations. Staff used standard 23
deviation because it measures the degree of dispersion from the mean. Staff chose 10% because 24
this is the threshold for determining if a segment is material and must be reported according to 25
Generally Accepted Accounting Principles (“GAAP”) that govern the requirements 26
regarding segment reporting. Segment reporting requirements had been governed by 27
Statement of Financial Accounting Standard 131, which has now been reclassified as Accounting 28
Standard Codification No. 280. Materiality of a business segment, as defined by GAAP, is 29
defined as follows: 30

Page 30
a. Its [operating segment] reported revenue, including both sales to external 1
customers and intersegment sales or transfers, is 10 percent or more of the 2
combined revenue, internal and external, of all operating segments. 3
b. The absolute amount of its reported profit or loss is 10 percent or more of the 4
greater, in absolute amount, of either: 5
1. The combined reported profit of all operating segments that did not 6 report a loss 7
2. The combined reported loss of all operating segments that did report a 8 loss. 9
c. Its assets are 10 percent or more of the combined assets of all operating 10
segments. 11
For purposes of evaluating whether a company’s non-regulated segments were causing a 12
material variability in income as to make its business risk inconsistent with the regulated 13
business risk profile of a regulated electric utility, Staff decided to use the 10% threshold to 14
define material volatility. Consequently, keeping with GAAP’s definition of material being at 15
least 10% of profit or loss, Staff excluded companies whose regulated utilities contribution to 16
income had a standard deviation greater than 10%. However, if a company had swings in its 17
regulated income contribution of 10% or more, but it has since divested the segment that caused 18
these swings, such as Ameren, then Staff included these companies. The two companies that had 19
a greater than 10% standard deviation in the percentage of income from regulated utility 20
operations were OGE Energy and TECO Energy. Staff will provide cost of common equity 21
information for the broader proxy group and for the refined group, which excludes OGE 22
and TECO. 23
b. The Constant-growth DCF 24
Next, Staff estimated Ameren Missouri’s cost of common equity applying values derived 25
from the proxy group to the constant-growth DCF model. The constant-growth DCF model is 26
widely used by investors to evaluate stable-growth investment opportunities, such as regulated 27
utility companies. The constant-growth version of the model is usually considered appropriate 28

Page 31
for mature industries such as the regulated utility industry.26 It may be expressed algebraically as 1
follows: 2
k = D1/P0 + g 3
Where: k is the cost of equity; 4
D1 is the expected next 12 months dividend; 5
P0 is the current price of the stock; and 6
g is the dividend growth rate. 7
The term D1/P0, the expected next 12-months' dividend divided by current share price, is the 8
dividend yield. Staff calculated the dividend yield for each of the comparable companies by 9
dividing the weighted average of the 2014 fiscal year and 2015 fiscal year FactSet projected 10
dividends per share (see Schedule 11) by the monthly high/low average stock price for the three 11
months ending October 31, 2014 (see Schedule 11).27 Staff weighted the FactSet projections in 12
this manner in order to reflect the approximate amount of time remaining in the 2014 fiscal year 13
for each comparable company. Staff used the above-described stock price because it reflects 14
current market expectations. The projected average dividend yield for the broader proxy group of 15
fourteen comparable companies is approximately 3.90 %, unadjusted for quarterly compounding. 16
The projected average dividend yield for the refined proxy group of twelve comparable 17
companies is also approximately 3.90 %, unadjusted for quarterly compounding. 18
i. The Inputs 19
In the DCF method, the cost of equity is the sum of the dividend yield and a 20
growth rate ("g") that represents the projected capital appreciation of the stock. In estimating a 21
growth rate, Staff considered the actual dividends per share ("DPS"), EPS and book value per 22
share ("BVPS") for each of the comparable companies and also the projected DPS, EPS and 23
26 Aswath Damodaran, Investment Valuation: Tools and techniques for determining the value of any asset, University Edition, John Wiley & Sons, Inc., 1996, p. 195-196; John D. Stowe, Thomas R. Robinson, Jerald E. Pinto and Dennis W. McLeavey, Analysis of Equity Investments: Valuation, Association for Investment Management and Research, 2002, p.64. 27 The monthly high/low averaging technique minimizes the effects of short-term stock market volatility on the calculation of dividend yield. P0 is calculated by averaging the highest and the lowest price for each month during the selected period.

Page 32
BVPS. In reviewing actual growth rates, Staff found the historical growth rates to be quite 1
volatile, at least for a few of the companies in the proxy group.28 Staff also reviewed equity 2
analysts’ consensus estimates for long-term compound annual growth rates as reported by 3
FactSet and provided by SNL Financial. The average consensus long-term growth rates for the 4
broader proxy group is currently 5.74 % as compared to 5.60 % for the refined proxy group. 5
(see Schedule 9-6). 6
Based on the shorter-term projected EPS growth rate data, one may argue that electric 7
utilities can grow at a rate of 5.6 to 5.75 percent, but it would be unreasonable to conclude that 8
this growth rate is sustainable in perpetuity because it does not give consideration to empirical 9
and logical information that suggests that utility companies should grow at a rate less than that of 10
the overall economy due to the mere fact that investors invest in utility companies for yield and 11
not growth. In fact, considering that companies in the S&P 500 (a proxy for the U.S. capital 12
markets) in recent years have retained approximately 65% to 70% of their earnings for 13
reinvestment,29 while electric utilities’ retention ratio has been less than half that of the 14
S&P 500,30 it makes logical sense that utilities will grow at a rate less than that of nominal GDP 15
growth. Consequently, a projected long-term, steady-state nominal GDP growth rate31 should be 16
considered as an upper constraint when testing the reasonableness of growth rates used to 17
estimate the cost of equity for a regulated electric utility. Staff will provide more detail on 18
economic growth projections when discussing the multi-stage DCF, but a high-end estimate for 19
nominal GDP is not much higher than 4.5%, causing an estimated constant growth rate over this 20
rate to be highly suspect. 21
Because Staff is not relying on the constant-growth DCF to quantify the change in the 22
cost of equity since the 2012 rate cases, Staff’s growth rate estimate for the constant growth DCF 23
is based on some common sense restraints on sustainable growth rates and the actual growth 24
experience of the electric utility companies that have experienced more stable growth patterns. 25
Several companies in Staff’s proxy group have projected 5-year CAGR in EPS that simply are 26
28 Schedule 9-1 depicts the annual compound growth rates for DPS, EPS and BVPS for each comparable company for the past ten years. Schedule 9-2 lists the annual compound growth rates for DPS, EPS and BVPS for each of the comparable companies for the past five years. 29 Table B-95 and B-96 attached to the 2013 Economic Report of the President. 30 http://www.wyattresearch.com/article/dividend-payout-ratio 31 The nominal GDP growth rate, contrasted to the real GDP growth rate introduced earlier, is not adjusted for inflation.
Page 33
not sustainable in the long-term. Simply removing growth rates that exceed 6% reduces the 1
project 5-year CAGR in EPS to 4.6%. Considering that actual long-term growth experience in 2
the electric utility industry barely supports a constant growth rate much more than 3%, Staff will 3
use 3.5% as the low end and 4.5% for the high end investors’ expectations of a constant growth 4
rate. Consequently, for purposes of Staff’s constant growth DCF for both the broader and more 5
refined proxy group, Staff uses a growth rate range of 3.5 to 4.5%. 6
Using the growth rate range Staff established for the constant-growth DCF results in a 7
cost of equity estimate of 7.4% to 8.4%. However, Staff will again rely on its multi-stage DCF 8
analysis to provide what it believes to be a more reliable cost of common equity due to the 9
non-sustainable growth rates of a few companies in its proxy group. 10
ii. Stage one 11
The first stage of a multi-stage DCF is usually quite specific due to the ability to forecast 12
cash flows in the near-term with more accuracy. In fact, it is often the case that the first stage of 13
a multi-stage DCF will be based on discrete cash flows projected on an annual basis for the next 14
several years. However, in the context of discounting expected future DPS, it is often the case 15
that a compound growth rate is applied to the current DPS to estimate the expected DPS over the 16
next several years. Although it is rare for a company to tie its targeted DPS growth rate directly 17
to a 5-year EPS projected compound growth rate, because equity analysts’ 5-year EPS forecasts 18
are widely available and may provide some insight on expected DPS, Staff decided to use these 19
growth rates for the first 5-years of its multi-stage DCF. However, Staff emphasizes that it has 20
never seen an investment analysis of a utility company that used 5-year EPS forecasts for 21
purposes of estimating the growth in DPS in a single-stage, constant-growth DCF or for the final 22
stage in a multi-stage DCF. Considering the fact that the very equity analysts that provide 5-year 23
EPS compound growth rates do not use them as a proxy for expected long-term DPS growth in 24
their own analyses should be proof in and of itself that stock prices do not reflect this 25
assumption. Consequently, Staff limited its use of these growth rates to the first five years of its 26
analysis, the very period these growth rates are intended to cover. 27
iii. Stage two 28
Stage two, i.e. the transition stage, is simply a gradual movement from above normal 29
growth to more normal/sustainable growth for the final stage. Although stage two can also 30
consist of forecasted discrete cash flows, because it is a transitional period, it is logical to linearly 31

Page 34
reduce the high growth first-stage growth over a specific period in order to gradually reduce the 1
growth rate to the expected sustainable growth rate. Staff chose to do this over a 5-year period, 2
which is fairly conventional in multi-stage DCF analysis. 3
iv. Stage three 4
Stage three is the final/constant-growth stage. In fact, the final stage can be reduced to 5
the single-stage, constant-growth form of the DCF. Although this is the “generic” stage, it is 6
extremely important to select a reasonable growth rate for this stage to arrive at a reliable cost of 7
equity estimate. 8
Cost of equity estimates using multi-stage DCF methodologies are extremely sensitive to 9
the assumed perpetual growth rate. Staff performed an extensive amount of research on the 10
actual realized growth rates of electric utilities over a 30-year period to estimate a 3.00% to 11
4.00% growth rate as a reasonable proxy for perpetual growth for the electric utility industry. 12
The Financial Analysis Unit has access to Value Line data on Central region electric 13
utility companies dating back to 1968.32 Staff believes it is important to analyze electric utility 14
industry financial data to at least the early 1970s since this was approximately the beginning of 15
the last large construction cycle for the electric utility industry.33 Because 1968 is consistent 16
with the starting point of the last construction cycle, Staff decided to capture data starting in that 17
year. Ideally, Staff would have analyzed data through the beginning of the current construction 18
cycle, which started approximately during the middle of the past decade, but because many 19
electric utility companies diversified into non-regulated merchant and trading operations towards 20
the end of the 1990s and there was much consolidation during this same period, this noise causes 21
any study relying on this more recent data to be less reliable in evaluating regulated electric 22
utility growth rates. It appears that much of the disruption in the electric industry occurred 23
subsequent to the Enron, Inc., bankruptcy in December 2001. Considering that much of this 24
disruption was caused by deregulation, Staff does not consider the information during this period 25
32 Value Line has consistently published information the electric utility industry based on three regions: East, West and Central. The Central Region electric utility industry data is published in Edition 5 of The Value Line Investment Survey data. Staff maintained consistent and comprehensive files for the Central Region for reports published back to 1985, which provides electric utility per share data dating back to 1968. 33 Daniel Ford, Gregg Orrill, Theodore W. Brooks, Ross A. Fowler, M. Beth Straka and Noah Howser, “Utilities Capital Management,” July 16, 2009, Barclays Capital, p. 13 (Attachment D).

Page 35
to be informative for understanding investors’ growth expectations for regulated electric utility 1
operations. 2
Staff did not apply rigid selection criteria for purposes of selecting central region electric 3
utility companies contained in Edition 5 of the Value Line Investment Survey. However, Staff 4
did eliminate companies that generally did not have at least 70% of revenues from electric utility 5
operations in the late 1990s. Staff also eliminated companies that appeared to be impacted 6
significantly by events related to the restructuring of the electric utility markets in the mid to late 7
1990s. Staff also eliminated companies that had data comparability problems due to major 8
mergers, acquisitions and/or restructurings. Staff only included companies in which comparable 9
data was available for each year of the period 1968 through 1999. The companies Staff selected 10
are shown in Schedules 13-1 through 13-4. 11
Staff’s analysis of these electric utility companies’ data over the last electric utility 12
construction cycle indicates that average long-term growth slowly increased through the 13
late 1980s and early 1990s and declined for the rest of the 1990s. The growth rates are based on 14
Staff’s calculation of a simple average of all of the companies’ growth rates over this period. 15
Because a simple average gives each company equal weight, Staff believes this approach is 16
appropriate because it does not introduce size bias. As can be seen in the attached Schedules, 17
the rolling average 10-year compound EPS growth rate for this period was 3.62%; the rolling 18
10-year compound DPS growth rate was 3.99%; the rolling 10-year compound BVPS growth 19
rate was 3.18%; and the overall average for DPS, EPS and BVPS was 3.59%. 20
However, it is important to understand that these growth rates were achieved during a 21
much more robust economic environment than the U.S. is expected to achieve in the foreseeable 22
future. Also, considering that some rate of return witnesses’ DCF analyses assume utilities can 23
grow at the same rate as GDP in perpetuity, it is interesting to note that the average growth rate 24
for these electric utilities was less than 50% of GDP growth over the same period. 25
Although Staff relied on the aforementioned proxy group for purposes of estimating a 26
going forward sustainable industry growth rate, another relevant proxy group to evaluate growth 27
trends for electric utility companies is the growth of the utility companies that actually have a 28
large amount of their electric utility operations in Missouri. In addition to evaluating the growth 29
of Missouri electric utility companies for the period 1968-1999, Staff also evaluated the growth 30
of Missouri electric utility companies through 2013. As can be seen in the chart below, if the 31


Page 37
ownership of merchant generation operations in Illinois. This exposure caused Ameren to incur 1
significant losses in recent years, which would skew any financial growth rates that include this 2
information. Although Empire and Great Plains Energy did not incur financial difficulties due to 3
non-regulated operations, both companies did reduce their dividends in recent years. Because of 4
these issues that occurred around or after the recession and financial crisis in 2008 and 2009, 5
Staff also determined the average growth of Missouri’s utilities through 2007. The average 6
10-year compound growth rates in DPS, EPS and BVPS for the period 1968 through 2007 were 7
2.85%, 2.03% and 2.27%, respectively, with an overall average growth rate of 2.39%. 8
Obviously, the actual experienced growth rates of Missouri’s electric utilities support the 9
reasonable, if not lofty, perpetual growth rates Staff chose to use for its perpetual growth rate 10
analysis. The actual realized growth rates of Missouri’s utilities support a perpetual growth rate 11
range of 2% to 3% rather than the 3% to 4% Staff decided to use. Although these growth rates 12
are generally characterized as “low” when discussed in the utility ratemaking arena, these growth 13
rates are more typical of those that are used by investors when determining a reasonable price to 14
pay for a utility stock.34 Additionally, considering that the dividend yield from utility stocks has 15
historically produced 2/3 of the total return on utility stocks, 35 and the fact that dividend yields 16
for electric utilities are currently approximately 4%, a 2% capital appreciation rate in utility 17
stocks is about what investors would expect. This translates into an approximate expected return 18
of 6% for utility stocks, which is quite logical and rational in the current low-yield environment. 19
v. Constraints on Long-term Growth Rates used in Stage Three 20
In order to evaluate the credibility of an estimated perpetual growth rate for the electric 21
utility industry, it is important to be aware of the changing fundamentals that have occurred and 22
continue to occur within the electric utility industry due to changes in demand for electricity. In 23
the past, growth in electric utility earnings and dividends was primarily driven by the increase in 24
demand for electricity and the growth of customers using electricity. However, this dynamic has 25
34 Staff has analyzed many utility stock research reports over the last several years and has consistently observed much lower perpetual growth rates than those typically assumed in models for estimating the cost of equity for utility ratemaking. 35 Hugh Wynne, Francois D. Broquin, Saurabh Singh, “U.S. Utilities: Our Dividend Growth Model Identifies Utilities Poised to Pay More,” May 20, 2011, Bernstein Research.

Page 38
changed and the demand for electricity is no longer a primary growth driver for electric utilities. 1
The decline in electricity demand growth is illustrated in the graph below:36 2
3
The fact that the growth in electricity demand has been in a steady state of decline seems to 4
explain the steady decline in electric utilities’ financial performance over the period Staff 5
analyzed in its previous discussion in this testimony. To the extent that potential financial 6
growth for electric utilities is now limited to the ability to make additional investments and pass 7
the cost of these investments (which includes the allowed ROR) onto a near-constant customer 8
base, any growth higher than needed capital investment to replace existing infrastructure would 9
seem to be highly speculative and not sustainable. However, Staff notes that much of the rate 10
base growth for electric utilities in recent years has been due to electric utilities making 11
investments in their coal-based generating facilities in order to comply with various emission 12
standards. These types of investments are policy-driven, and therefore are not controllable by 13
management (although the amount of reasonable project costs are). Absent policy-driven 14
investment requirements, it would seem that growth in investment would be limited to a rate 15
36 Energy Information Administration’s 2014 Annual Energy Outlook, p. MT-16.

Page 39
similar to inflation because the only way to recover these costs is to raise rates on the existing 1
customer base that is not using as much electricity. 2
** 3
4
5
6 7 8 9 10 11 12 13 14 15 16 17
18
19
20
** 21
vi. Update of Multi-Stage DCF Analysis on the Proxy Group from 22 the 2012 Rate Cases 23
Staff updated the multi-stage DCF analysis it performed on the proxy group from the last 24
rate case to gain insight on first, the direction of the change of the cost of common equity since 25
the last rate case, and second, to provide an idea as to how much the cost of common equity has 26
changed. In performing the updated analysis, Staff determined it was necessary to eliminate 27
Cleco and Wisconsin Energy because both companies’ stock prices are currently influenced by 28
mergers and acquisitions. In order to allow for comparability between the two cases, Staff 29
eliminated these companies from the 2012 study as well. After updating the multi-stage DCF 30
analysis, Staff’s multi-stage cost of equity estimate was 7.38% to 8.15% (see Schedules 14-1 to 31
14-3). This compares to the multi-stage DCF analysis in the last rate case that indicated the cost 32
of equity was 8% to 8.75% after eliminating Cleco and Wisconsin Energy from the proxy group 33
NP
______________________________________________________________________________________________________________________________________________________________________
________________________________________________________________________________________________________________________________________________________________________________________________________________________________________________________________________________________________________________________________________________________________________________________________________________________________________________________________________________________________________________________________________________________________________________________________________
____________________________________________________________________________________________________________________________________________________________

Page 40
results. Consequently, the updated multi-stage DCF analysis of the same proxy group using a 1
consistent perpetual growth rate shows a cost of equity decrease of approximately 60 basis points 2
since 2012. 3
vii. Backdating of Multi-Stage DCF Analysis on the Current Proxy 4 Group Cases 5
In order to test whether the implied decrease in the cost of common equity from the proxy 6
group in the 2012 rate cases is reliable, Staff also decided to backdate a cost of common equity 7
estimate of the current proxy group. Again, because the perpetual growth rate should not change 8
much, simply using stock prices for the current proxy group from the 2012 period and using the 9
projected long-term growth rates at the time for the first stage, provides a reasonable estimate of 10
what the implied cost of equity used was at the time for the current proxy group. 11
Finding historical stock prices is not difficult as this is available from many sources 12
online. However, looking back to 2012 and finding projected growth rates at the time is usually 13
a challenge. However, because Staff currently has an upgraded subscription to SNL Financial 14
and because SNL Financial maintains a database of this information, Staff was able to perform 15
this analysis. Staff’s backdated multi-stage DCF analysis of the current proxy group, with the 16
exception of Ameren and PNM Resources because of financial difficulties they had at the time 17
unrelated to their regulated utility operations, shows that the cost of equity estimate would have 18
been approximately in 8.16% to 8.84% range (see Schedules 15-1 to 15-3). This compares to a 19
current cost of equity estimate of 7.60% to 8.36% if Ameren and PNM Resources are removed. 20
Consequently, this supports an implied cost of equity reduction of approximately 50 to 55 basis 21
point range from Ameren Missouri’s last rate case. 22
viii. Preference for GDP Growth 23
Although Staff is confident that investors do not expect that utilities’ per share growth 24
rates can grow at the same rate of nominal GDP in the long-run, Staff recognizes that even 25
customer ROR witnesses have been willing to accept this assumption for purposes of estimating 26
the cost of equity. Consequently, Staff will provide a cost of equity indication using this 27
simplified approach. 28
Projected GDP growth is available from a variety of sources and the Energy Information 29
Administration (“EIA”) publishes many of these in its Annual Energy Outlook. Not only does 30
EIA publish near-term projected GDP growth rates, but they also publish projected GDP growth 31

Page 41
rates over very long time periods. Because economists are projecting these growth rates over 1
very long time periods, such growth rates represent economists current estimates of what they 2
believe the U.S. economy’s long-run sustainable growth rate may be, since it is impossible to 3
take into consideration many specific economic issues when projecting these long-term growth 4
rates. These projected long-term growth rates in U.S. GDP are consistent with the current low 5
interest rate environment, which provide signals that the U.S. economy will not return to the 6
growth it achieved during the last century. This is quite logical considering the maturity of the 7
U.S. economy. The projected economic growth rates are shown below:37 8
9
In each case in which the sources do not project a nominal GDP growth rate, Staff recommends 10
adding a GDP price deflator of 2.0%, which is the CBO’s prediction of long-term inflation and 11
also the inflation rate which is targeted by the Federal Reserve. Considering the fact that a 12
perpetual growth rate is intended to measure the long-run trend growth rate supported by the 13
long-term fundamentals of the U.S.’s mature economy, Staff believes the most relevant 14
projections from the table above are for the period 2025 through 2040. Staff recommends using 15
the mid-point of the real GDP range of 2.2 to 2.5%, which is 2.35%. Compounding the expected 16
GDP price deflator of 2.0% with the long-term real GDP growth of 2.35%, results in long-term 17
nominal GDP growth of approximately 4.40%. When using a 4.4% GDP growth rate in Staff’s 18
37 Energy Information Administration’s 2014 Annual Energy Outlook, p. CP-2.

Page 42
multi-stage DCF results in a cost of equity estimate of approximately 8.72% for the broad proxy 1
group and 8.67% for the refined proxy group. 2
G. Tests of Reasonableness 3
Staff has tested the reasonableness of its DCF results, both by use of a CAPM analysis 4
and consideration of other evidence. 5
1. The CAPM 6
The CAPM is built on the premise that the variance in returns is the appropriate measure 7
of risk, but only the non-diversifiable variance (systematic risk) is rewarded. Systematic risks, 8
also called market risks, are unanticipated events that affect almost all assets to some degree 9
because the effects are economy wide. Systematic risk in an asset, relative to the average, is 10
measured by the Beta of that asset. Unsystematic risks, also called asset-specific risks, are 11
unanticipated events that affect single assets or small groups of assets. Because unsystematic 12
risks can be freely eliminated by diversification, the reward for bearing risk depends on the level 13
of systematic risk. The CAPM shows that the expected return for a particular asset depends on 14
the pure time value of money (measured by the risk free rate), the reward for bearing systematic 15
risk (measured by the market risk premium), and the amount of systematic risk (measured 16
by Beta). The general form of the CAPM is as follows: 17
k = Rf + β ( Rm - Rf ) 18
Where: k is the expected return on equity for a security; 19
Rf is the risk-free rate; 20
β is Beta; and 21
Rm - Rf is the market risk premium. 22
For inputs, Staff relied on historical capital market return information through the end 23
of 2013. For the risk-free rate (Rf), Staff used the average yield on 30-year U.S. Treasury bonds 24
for the three-month period ending October 31, 2014; that figure was 3.17%. For beta (β), Staff 25
relied on estimates directly calculated through an Excel spreadsheet designed specifically to be 26
used with the SNL database of market and financial information. Although Staff is no longer 27
using Value Line’s published betas for purposes of its CAPM analysis in its direct testimony, 28

Page 43
because Value Line is used by many retail investors, Staff still believes Value Line’s beta 1
calculation methodology should be considered when performing a CAPM analysis. Because 2
estimating beta is a matter of having access to financial data and performing statistical 3
calculations, unless a financial services provider has a proprietary adjustment they make to their 4
beta calculation, understanding the methodology used by a financial provider allows an analyst 5
to approximately replicate betas of that provider. Fortunately, this is the case for Value Line’s 6
beta calculation methodology. Consistent with Value Line’s approach to calculating beta, Staff 7
used 5-years of historical weekly returns of the subject company and the New York Stock 8
Exchange (“NYSE”) index. The covariance of the weekly returns on the NYSE index and the 9
weekly returns on the subject company is divided by the variance of the weekly returns on the 10
NYSE index to determine raw beta (unadjusted beta). Staff then adjusted the raw beta using the 11
Blume adjustment formula as used by Value Line: Adjusted Beta = (.35 + .67(Unadjusted Beta)) 12
(see Schedule 16). 13
The average beta for the broader proxy group was 0.74 and 0.73 for the refined proxy 14
group. For the market risk premium (Rm – Rf) estimates, Staff relied on the historical difference 15
between earned returns on stocks and earned returns on bonds.38 The first risk premium was 16
based on the long-term arithmetic average of historical return differences from 1926-2013 – 17
6.20 %. The second risk premium was based on the long-term geometric average of historical 18
return differences from 1926 to 2013 – 4.64 percent. The results using the long-term arithmetic 19
average risk premium and the long-term geometric risk premium are 7.76 and 6.60 percent, 20
respectively for the broad proxy group and 7.66 and 6.53 percent for the refined proxy group. 21
These cost of common equity results support the reasonableness of Staff’s cost of equity 22
estimates derived from its DCF analysis. Staff again notes that both U.S. Treasury yields and 23
utility bond yields are quite low (at levels last experienced in the early 1960s) and that the spread 24
between them is presently below their long-term average. It is not improbable that investors are 25
only requiring returns on common equity in the 6 to 7 percent range for utility stocks. In fact, as 26
Staff will explain in its other tests of reasonableness, these cost of equity estimates are consistent 27
with common sense tests. 28
38 From Duff & Phelps 2014 Valuation Handbook: A Guide to the Cost of Capital.

Page 44
2. Other Tests 1
a. The “Rule of Thumb” 2
A “rule of thumb” method allows an objective test of individual analysts’ cost of equity 3
estimates. Because this method is suggested in a textbook39 used for the curriculum for 4
Chartered Financial Analyst (“CFA”) Program, Staff believes this method is free of any bias 5
from those involved in utility ratemaking. It is also a useful test because it is very 6
straightforward and limits the risk premium to a 100 basis point range. The cost of equity is 7
estimated by simply adding a risk premium to the yield-to-maturity ("YTM") of the subject 8
company’s long-term debt. Based on experience in the U.S. markets, the typical risk premium is 9
in the 3% to 4% range. Considering that this is based on general U.S. capital-market experience 10
and that regulated utilities are on the low end of the risk spectrum of the general U.S. market, a 11
risk premium closer to 3% seems logical. This is especially true considering that regulated 12
utility stocks behave like bonds. For the months of August, September and October 2014, “A” 13
rated 30-year utility bonds and “Baa” rated 30-year utility bonds had average yields of 4.13% 14
and 4.76% respectively.40 Adding a 3% risk premium, the “rule of thumb” indicates a cost of 15
common equity between 7.13% and 7.76%. Adding a 4% risk premium, the “rule of thumb” 16
indicates a cost of common equity between 8.13% and 8.76%. 17
These simple, straight-forward tests of reasonableness of cost of common equity 18
estimates provide a common sense check on whether a cost of common equity estimate is logical 19
considering the bid up of utility bonds and stocks in the last several years. As a point of 20
reference, and also evidence that the Commission should lower its authorized return from the 21
9.7% to 9.8% range it allowed in 2012, the cost of equity indications from this straight-forward 22
test in the last Ameren Missouri rate case were as follows: 7.92% to 8.52% using a 3% risk 23
premium and 8.92% to 9.52% using a 4% risk premium. The implied decline in the cost of 24
common equity from rate cases in 2012 using this simple, straight-forward test is as much as 25
75 basis points. 26
39 John D. Stowe, Thomas R. Robinson, Jerald E. Pinto and Dennis W. McLeavey, Analysis of Equity Investments: Valuation, Association for Investment Management and Research, 2002, p. 54. 40 BondsOnline.com, pursuant to a subscription agreement Staff has with BondsOnline.

Page 45
b. Average Authorized Returns 1
In the past, the Commission has applied a test of reasonableness using average 2
authorized returns published by Regulatory Research Associates (“RRA”) to test the 3
reasonableness of its allowed ROE. To the extent the Commission chooses to use RRA data 4
again in this case, Staff believes the Commission should have information on allowed ROE’s 5
since 2012. 6
According to RRA, the average authorized return on equity in the first three quarters of 7
2014 for electric utility companies was 10.00 % (based on 24 decisions) compared to a 2013 8
calendar year average of 10.02 %.41 Excluding the effect of the surcharge/rider generation cases 9
in Virginia, the average allowed electric ROEs were 9.75 % for the first three quarters of 2014 10
and 9.80 % for the 2013 calendar year. This compares to an average allowed ROE of 10.17 % in 11
2012. 12
In order to provide more specific information on the allowed ROE’s by type of electric 13
utility operations, Staff determined the allowed ROEs that were given to integrated electric 14
utility companies. Staff excluded allowed ROEs that were determined for dockets not involving 15
a full general rate case (i.e. rider only cases). Staff also continued to exclude the aforementioned 16
Virginia rate cases. The average allowed ROE for integrated electric utilities were 9.94 % 17
through November 14, 2014 and 9.96 % for the 2013 calendar year. This compares to an 18
average allowed ROE of 10.10 % in 2012. 19
As a further refinement, Staff also evaluated allowed ROE information for only cases that 20
were fully-litigated as in these cases, one would expect that each issue is determined based on its 21
own merits. Allowed returns determined in context of a settled case are not as reliable because 22
parties make adjustments to other elements of the ratemaking formula in order to arrive at an 23
overall reasonable number. It has been Staff’s experience, that some companies do not want a 24
lower ROE published in a settlement because this is a headline number. Consequently, 25
companies may compromise on a more obscure area of the rate case in order to have a higher 26
ROE published in the settlement. Allowed ROEs for fully-litigated cases were 10.06 % through 27
41 RRA, Regulatory Focus – Major rate case decisions (January-September 2014) - October 10, 1014: 2014 data includes four surcharge/rider generation cases in Virginia that incorporate plant-specific ROE premiums. Virginia statutes authorize the State Corporation Commission to approve ROE premiums of up to 200 basis points for certain generation projects.

Page 46
November 14, 2014, and 9.96 % for the 2013 calendar year. This compares to an average 1
allowed ROE for fully-litigated cases of 10.10 % in 2012. 2
The allowed ROE information does not seem to provide any clear trends, but Staff 3
believes the economic and capital market conditions clearly support a lower allowed ROE than 4
the 9.7% and 9.8% the Commission authorized in 2012. 5
H. Conclusion 6
A just and reasonable rate is one that is fair to the investors and fair to the ratepayers. 7
Fairness to the ratepayers means rates that are not one penny more than is necessary to be fair to 8
the shareholders. Fairness to the shareholders means rates that will produce revenues, on an 9
annual basis, sufficient to cover Ameren Missouri’s prudent cost of service, which includes an 10
allowed ROR. Using widely-accepted methods of financial analysis, Staff believes the cost of 11
common equity has declined by up to 75 basis points since 2012. Consequently, Staff 12
recommends the Commission reduce its authorized ROE for Ameren Missouri to anywhere 13
between 9.0% to 9.5% to at least partially share the reduced cost of equity with ratepayers. 14
Given that the cost of capital is as real a cost as any other cost of service, reducing this cost in the 15
ratemaking formula is consistent with the principles of cost of service ratemaking. Using this 16
recommended allowed ROE results in weighted average cost of capital for Ameren Missouri in 17
the range of 7.37% to 7.63% (see Schedule 17). This rate was calculated by applying an 18
embedded cost of long-term debt of 5.565% and an allowed return on common equity range of 19
9.0% to 9.50% to a capital structure consisting of 52.96% common equity, 45.92% long-term 20
debt, and 1.12% preferred stock. Because there appears to be some concern in setting an allowed 21
return on equity based on a reasonable estimate of the cost of equity, Staff recommends the 22
Commission set the allowed ROE at 9.25% in this case. Although this is above what Staff 23
estimates to be the cost of equity to be in the current capital market environment, this allowed 24
ROE would balance the concern about the impact of a lower allowed ROE on investors’ view of 25
Missouri’s regulatory environment, while still passing along the benefit of lower capital costs to 26
ratepayers. 27
Staff Expert/Witness: David Murray 28
Page 47
VII. Rate Base 1
A. Plant in Service and Depreciation Reserve 2
1. Plant in Service - Accounting Schedule 3 3
This schedule has been adjusted, by account, to reflect the rate base value of Ameren 4
Missouri’s plant-in-service estimates through December 31, 2014. These estimates will be 5
replaced with actual amounts as part of Staff’s true-up audit. Staff adjusted Ameren Missouri’s 6
plant balances to allocate a portion of the Company’s general plant to Ameren Missouri’s retail 7
natural gas business. All adjustments to the test year balances are reflected in Adjustments to 8
Plant – Accounting Schedule 4. 9
Staff Expert/Witness: Jason Kunst 10
2. Depreciation Reserve – Accounting Schedule 5 11
Accounting Schedule 5, Depreciation Reserve, has been adjusted, by account, to reflect 12
the estimated rate base value of Ameren Missouri’s depreciation reserves through December 31, 13
2014. These estimates will be replaced with actual amounts as part of Staff’s true-up audit. As it 14
did with Plant in Service, Staff adjusted Ameren Missouri’s depreciation reserve balances to 15
allocate a portion of the Company’s general plant depreciation reserve to Ameren Missouri’s 16
retail natural gas business. All adjustments to test year balances are reflected in Adjustments to 17
Depreciation Reserve – Accounting Schedule 6. 18
Staff Expert/Witness: Jason Kunst 19
3. O’Fallon Solar Facility 20
a. In-Service Criteria 21
In Spring 2014, Ameren Missouri began construction of a 5.7 megawatt (“MW”) 22
direct current (DC), utility-scale solar facility located in O’Fallon, Missouri; adjacent to the 23
existing Belleau substation. Based on discussions with Ameren Missouri, Staff understands that 24
construction of the facility is complete; however, Staff’s evaluation of whether the facility meets 25
in-service criteria is on-going and expected to be complete by December 31, 2014. 26

Page 48
In order to include the solar facility in rate base, the plant must be “fully operational and 1
used for service.” 42 In-service criteria are a set of operational tests or operational requirements 2
used to determine whether a new unit is "fully operational and used for service." 3
A new facility may not have any historical operating information from which Staff can 4
make a recommendation to the Commission as to whether the new unit is "fully operational and 5
used for service"; therefore, operational tests must be established and performed in order for 6
Staff to file its recommendation. In-service criteria are developed, based on review of the new 7
unit's operational specifications and discussions with the Company. 8
Staff and Ameren Missouri have agreed to the in-service criteria attached in Appendix 3, 9
Schedule CME-1. Staff proposes Ameren Missouri demonstrate that the solar facility meets 10
the agreed-to in-service criteria by December 31, 2014, in order to include the solar facility in 11
rate base. 12
Staff Expert/Witness: Claire M. Eubanks 13
b. Cost Assessment of O'Fallon Solar Generating Facility 14
On April 8, 2014, the Missouri Public Service Commission approved Ameren Missouri’s 15
application for a certificate of public convenience and necessity to build a 5.7 MW DC 16
photovoltaic solar generation facility in O’Fallon, Missouri. Ameren Missouri expects 17
construction of the solar project to be completed and the facility to become operational by the 18
end of December 31, 2014, and thus be included as part of this rate case proceeding. As the 19
project is still ongoing, Staff has not included any costs relating to the O’Fallon solar generating 20
facility in its cost of service calculation. Staff will continue to monitor and review all the project 21
costs and assess whether those costs were prudently and reasonably incurred for inclusion in the 22
revenue requirement calculation for this rate case. Staff will work with Ameren Missouri upon 23
completion of the project and a determination will be made for cost inclusion in the cost of 24
service when Staff performs its true-up audit of Ameren Missouri in this rate case. 25
Staff Expert/Witness: Kofi Agyenim Boateng 26
42 Section 393.135, RSMo. 2000: “Any charge made or demanded by an electrical corporation for service, or in connection therewith, which is based on the costs of construction in progress upon any existing or new facility of the electrical corporation, or any other cost associated with owning, operating, maintaining, or financing any property before it is fully operational and used for service, is unjust and unreasonable, and is prohibited”. (Emphasis added)

Page 49
4. Labadie ESP Audit Report 1
a. Rate Impact of the Project 2
On September 11, 2013, the Commission opened a case, EO-2014-0070, to facilitate and 3
retain discovery regarding Staff’s audit of Ameren Missouri’s construction of pollution control 4
equipment at its Labadie Energy Center. On page 9, section (m), of the Commission’s Order 5
Adopting Procedural Schedule, Establishing Test Year and Delegating Authority, issued on 6
August 20, 2014, in Case No. ER-2014-0258, the Commission indicated, in part, that data 7
requests and responses thereto made by any party in Case No. EO-2014-0070 shall be treated as 8
having been made in Case No. ER-2014-0258. Based upon numerous meetings with Company 9
officials, tours of the Labadie facility and Ameren Missouri’s responses to Staff data requests 10
issued in Case Nos. EO-2014-0070 and ER-2014-0258, Staff is in the process of completing a 11
construction audit and prudence review of all costs associated with pollution control equipment, 12
specifically Electro-Static Precipitators (“ESPs”), on Labadie Energy Centers Units 1 and 2. 13
ESPs are essentially highly efficient filtration devices consisting of several chambers that contain 14
numerous electro-statically-charged steel plates that collect and remove fine particulate matter 15
from flowing emission gases. 16
As of the time of Staff’s direct testimony filing in this case, Ameren Missouri has 17
installed ESPs on Unit 2 at its Labadie Energy Center. The construction and testing 18
requirements for the ESPs on Unit 2 were completed during August 2014 and they were deemed 19
to be fully operational and in-service on August 13, 2014. The Unit 2 ESPs were installed at an 20
actual total construction cost of approximately ** ** At this time, Staff is 21
proposing an adjustment to remove approximately ** ** of the approximately 22
** ** of total capitalized costs pertaining to Unit 2 due to an incident that 23
occurred on May 29, 2013. Staff will discuss this incident and the basis for its adjustment later 24
in this section of the report addressing Labadie ESP construction costs. 25
Ameren Missouri is currently in the process of completing the installation of ESPs on 26
Unit 1 and has indicated to Staff that it expects this unit to be fully operational and in-service by 27
a target date of December 7, 2014. Ameren Missouri estimates that the cost to complete Unit 1 28
will be approximately ** **. Staff has included these estimated construction 29
costs in the cost-of-service calculation that is being submitted as part of its direct testimony filing 30
in this case but will revise this amount to reflect actual, prudently-incurred costs on the Labadie 31
NP
________________
________
__________

Page 50
Unit 1 ESP project through December 31, 2014, as part of its true-up audit, if such updated 1
information is provided by Ameren Missouri and it meets all in service criteria. 2
In addition, as noted above, on November 7, 2014, Staff received information 3
from Ameren Missouri in response to Staff Data Request No. 0013, issued as part of Case No. 4
EO-2014-0070, regarding a ** 5
6
7
8
** As of Staff’s December 5, 9
2014, direct testimony filing, Staff is continuing to review the information supplied by Ameren 10
Missouri regarding this ** ** and may make additional adjustments to the total 11
capitalized costs associated with the ESPs installed on both Unit 1 and 2 as part of its true-up 12
audit in this rate case. Appendix 3, Schedule EMC-JS-1, provides more detailed descriptions 13
regarding the Labadie ESP Construction Audit. 14
Staff Expert/Witness: Erin M. Carle 15
b. Physical Description of the Project 16
Ameren Missouri is making upgrades to the Labadie Unit 1 and Unit 2 ESPs in response 17
to the U.S. Environmental Protection Agency’s (“EPA”) Mercury and Air Toxics Standards 18
(MATS) to reduce Particulate Matter (PM) emissions. Recent regulations require a combined 19
(condensable and filterable) PM emission regulation of 0.030 lb/mmBtu and a Mercury (“Hg”) 20
emission of 1.0 lb/TBtu. The deadline for Labadie to be in compliance with the MATS is 21
April 16, 2015. Ameren Missouri plans to utilize the site averaging option under the MATS rule 22
for particulate matter compliance for Labadie. Use of site averaging will allow less extensive 23
modifications to Units 3 & 4 to be necessary in the future. The major components associated 24
with the current Unit 1 & 2 ESP upgrades will consist of: 25
The existing “A” and “B” ESPs for each boiler unit are to be taken out of 26 service and retired in place. 27
The “C” ESPs for each boiler unit will be upgraded with new inlet 28 nozzles, gas flow improvements, rapper systems, and switch mode power 29 supplies. 30
New “D” ESP chambers will be constructed, along with associated 31 relocations, foundations, ductwork, ash systems, and electrical upgrades. 32
NP
__________________________________________________________________________________________________________________________________________________________________________________________________________________________________________________________________________________
________

Page 51
Additionally, the existing SO3 flue gas conditioning components will be eliminated as SO3 will 1
no longer be required in the process. 2
Staff Expert/Witness: Jerry Scheible 3
5. Callaway Reactor Vessel Closure Head Audit Report 4
a. Rate Impact of the Project 5
As part of Ameren Missouri’s recently completed refueling at its Callaway Nuclear 6
Energy Center, a new reactor vessel closure head (RVCH) was installed to avoid potential 7
problems that other nuclear reactors operating within the United States have experienced43. In 8
addition, the replacement of the new reactor closure head is expected to potentially reduce the 9
average outage time for all future Callaway refuelings by as much as two days, resulting in 10
savings to Ameren Missouri and, ultimately, its customers. 11
At the time of Staff’s direct testimony filing in this case, Staff has determined that 12
Ameren Missouri’s replacement of the Callaway RVCH is fully operational and in-service as of 13
November 21, 2014. However, Staff has not received all actual construction cost information 14
regarding this project and will need to review such documentation as part of its true-up audit in 15
this rate proceeding. In the interim, Staff has included the approximate ** ** 16
budgeted total cost for this project in its case until the actual costs can be reviewed. Staff has 17
included these estimated construction costs in the cost of service calculation that is being 18
submitted as part of its direct testimony filing in this case but will revise this amount to reflect 19
actual, prudently incurred costs on the RVCH project through December 31, 2014, as part of its 20
true-up audit, when such updated cost information is provided by Ameren Missouri. 21
Appendix 3 – Schedule EMC-JS-2 provides more detailed descriptions regarding the 22
RVCH Construction Audit. 23
Staff Expert/Witness: Erin M. Carle 24
43 **
**
NP
__________
____________________________________________________________________________________________________________________________________________________________________________________________________________________________

Page 52
b. Physical Description of the Project 1
This project is for the replacement of the Callaway RVCH, which has been in operation 2
since 1984. Concern regarding the degradation of RVCH components has become a leading 3
nuclear power generation industry issue. Callaway was becoming an industry outlier with 4
increasing susceptibility to degradation. Although no issues regarding degradation of the current 5
RVCH, such as weld cracks or material corrosion have been specifically identified, the 6
replacement mitigates regulatory concerns, improves plant reliability, reduces refueling outage 7
duration, improves safety and eliminated a 2014 inspection. 8
Staff Expert/Witness: Jerry Scheible 9
B. Cash Working Capital (CWC) 10
1. Calculation of Revenue and Expense Lags 11
Cash working capital (CWC) represents the amount of cash required for day-to-day 12
expenses incurred in providing service to ratepayers. In some instances, payments for goods and 13
services are paid shortly after, or even before, the goods are received/utilized or the services are 14
performed. In other instances, the payment for a good or service occurs long after the good or 15
service is received. If, on average, the payment for goods or services utilized in the provision of 16
utility service is made before receipt of related customer revenues, the utility will have a 17
relatively constant investment in cash working capital (i.e., an investment in the prepayment of 18
cash expenses made in advance of the receipt of related service revenue). In this instance, the 19
utility’s shareholders are compensated for the funds they provided by inclusion of these funds in 20
rate base. In that way, the shareholders earn a return on the funds they have invested. 21
Conversely, if, on average, the payment for goods or services utilized in the provision of utility 22
service is made after receipt of related customer revenues, the utility will enjoy a relatively 23
constant source of cost-free funds supplied by ratepayers (i.e., ratepayers provide cost-free 24
capital to the utility in the form of payment for utility service prior to the time that the utility is 25
required to pay “cash” for goods and services consumed in providing the utility service). 26
Ratepayers under this circumstance are compensated for the funds they provided by reducing 27
rate base by the amount of the customer-provided cash working capital. 28

Page 53
To determine the amount of cash working capital provided by both the ratepayers and 1
shareholders, Staff performs a lead/lag study. The lead/lag study involves the analysis of the 2
timing of when expenses are paid to suppliers, employees, etc. and when the utility receives 3
revenues from customers for the services it provides. A positive cash working capital 4
requirement indicates that, in the aggregate, the shareholders provided the working capital for the 5
test year. This means, on average, the utility paid the expenses incurred to provide the electric 6
service to the ratepayers before the ratepayers paid for the service. A negative cash working 7
capital requirement indicates that, in the aggregate, the ratepayers provided the working capital 8
during the test year. This means, on average, the ratepayers paid for their electric service before 9
the utility paid the expenses incurred to provide that service. 10
In Case No. ER-2012-0166, the main issue of disagreement between the parties was 11
Ameren Missouri’s proposed new methodology of the calculation of its collection lag, which was 12
based on weighted average data from a monthly Accounts Receivables Breakdown Report with 13
accounts receivables balances grouped by customer class by days aged. Staff and other parties to 14
the rate case opposed this methodology and preferred utilizing Ameren Missouri’s CURST 246 15
report (Sales Analysis Report) to determine the collection lag. The parties believed that the 16
CURST 246 report produced the most reliable and accurate collections lag for determining the 17
customer bill collection patterns. Ameren Missouri contended that it no longer maintains the 18
system that produced the CURST 246 report and also did not believe that the result produced by 19
the CURST 246 report was accurate. The Commission in its Report and Order in Case No. 20
ER-2012-0166 agreed with Ameren Missouri and approved the Company’s use of the Accounts 21
Receivable Breakdown Report as a tool of calculating the collections lag. 22
In this proceeding, Staff did not conduct a full lead/lag study for the purpose of 23
determining the Cash Working Capital requirement. However, Staff conducted a limited 24
analysis of the various leads/lags as approved by the Commission in Ameren Missouri’s most 25
recent last rate case, No. ER-2012-0166, in an effort to determine their appropriateness and 26
reasonableness for use in this current rate proceeding. Additionally, Staff reviewed Ameren 27
Missouri’s proposed collection lag of 25.79 days as found in Ameren Missouri witness Joseph S. 28
Weiss’ direct testimony. Staff finds the lead/lags analyses utilized in Ameren Missouri’s last 29
rate case and the collection lag calculated by Ameren Missouri in this rate case to be appropriate 30
and reasonable lead and lag factors for use in this rate case. Staff utilized those lead/lag 31

Page 54
calculations and applied them to the adjusted test year amounts determined by Staff in this rate 1
case to calculate the current cash working capital requirement for Ameren Missouri. Staff’s 2
overall study resulted in a positive cash working capital requirement. This means that the 3
shareholders have provided the working capital, in the aggregate, during the test year. Therefore, 4
the shareholders will be compensated for the working capital through an increase to rate base. 5
Staff Expert/Witness: Kofi Agyenim Boateng 6
C. Prepayments and Materials and Supplies 7
Ameren Missouri utilizes shareholder funds for prepaid items such as insurance 8
premiums and materials and supplies. These items are included in rate base, so that the up-front 9
investment made by Ameren Missouri is recognized in customer’s rates. Staff has included 10
prepayments in rate base at the 13-month average level ending September 30, 2014. In addition, 11
Staff has issued Data Request No. 0476 seeking additional information about the categories of 12
prepayments that Ameren Missouri is seeking to include in rate base. Staff will review this 13
response once it is received and may make further adjustments to the amount of prepayments 14
reflected in rate base as part of its true-up audit. 15
Ameren Missouri also maintains a variety of materials and supplies in its inventory in 16
order to meet the day-to-day needs of its utility operations. Staff has included Ameren 17
Missouri’s average balance of materials and supplies inventory that was maintained during the 18
13-months ending September 30, 2014. Staff will reexamine the level of both materials and 19
supplies and prepayments as part of its true-up audit. 20
Staff Expert/Witness: Jason Kunst 21
D. Customer Deposits 22
Customer deposits represent funds received from Ameren Missouri’s customers as a 23
security against potential loss arising from failure to pay for utility service received. Until 24
refunded, customer deposits represent a source of funds available to the Company and are 25
included as an offset to the rate base investment. Generally, interest is calculated on customer 26
deposits and paid to the customers for the use of their money. Customers earn the prime rate, as 27
published in the Wall Street Journal, plus one percent interest on their deposits. The amount of 28
customer deposits in Accounting Schedule 2, Rate Base, represents a 13-month average 29

Page 55
(September 2013-September 2014) of Ameren Missouri’s customer deposits. In Accounting 1
Schedule 10, Staff adjusted expense to include interested calculated on Staff’s level of customer 2
deposits reflected in rate base. Staff will reexamine the amount of customer deposits to include 3
in rate base as part of its true-up audit. 4
It should be noted that Ameren Missouri recently changed the criteria for requiring a 5
customer to make a deposit with the filing of new tariffs in Case No. ET-2014-0076. The 6
Unanimous Stipulation and Agreement adopting this proposed change was approved by the 7
Commission and requires that the experimental program be re-examined in future rate cases. 8
Staff Expert/Witness: Jason Kunst 9
E. Customer Advances 10
Customer advances are funds provided by individual customers of Ameren Missouri 11
to assist in the costs of the provision of electric service to them. As no interest is paid to 12
the customers for the use of their money, unlike the case with customer deposits, 13
these funds represent an interest-free source of capital to the Company. Therefore, it is 14
appropriate to include these funds as an offset to rate base. The amount of customer advances 15
reflected on Accounting Schedule 2, Rate Base, represents a 13-month average (September 2013 16
– September 2014). The level of Customer Advances will be reexamined as part of Staff’s 17
true-up audit. 18
Staff Expert/Witness: Jason Kunst 19
F. Fuel Inventories 20
1. Fuel Inventory for Rate Base (other than coal) 21
Staff included a 13-month average through September 30, 2014, to determine the 22
inventory value for oil. For nuclear fuel inventory, Staff used an 18-month average of the value 23
of the nuclear fuel that was contained in the fuel core of the Callaway Nuclear Generating Unit 24
through September 30, 2014, as well as an average of the most current value of nuclear fuel on-25
site. For stored natural gas, Staff utilized a 13-month average through September 30, 2014, to 26
determine the inventory value. Staff will continue to examine the actual inventory quantities for 27
Page 56
oil, natural gas, and nuclear fuel through the end of the true-up cut-off period, December 31, 1
2014. Staff will also re-examine natural gas prices at that time. 2
Staff Expert/Witness: Lisa M. Ferguson 3
2. Coal Inventory On-Site and Coal-In Transit 4
a. Staff included a 13-month average of coal inventory that is physically on 5
the ground at each generation plant through March 31, 2014. Staff agrees with the amounts of 6
on-site coal inventory that Ameren Missouri is seeking to recover as sponsored by Ameren 7
Missouri witness Laura M. Moore in her direct testimony on Schedule LMM-344. However, 8
Staff has excluded all amounts of coal-in-transit through March 31, 2014 which is included in the 9
coal inventory balances on Schedule LMM-3. 10
b. Coal-in-transit is coal that has been loaded into railcars at the mine and 11
is in-route to the coal plant, but has not yet arrived at the plant. Ameren Missouri only 12
includes the on-site coal inventory in its analysis of operational needs of each plant given that the 13
coal-in-transit is not available for use. Staff’s position is that coal that is loaded on a train, but 14
not actually on-site at a coal generation center does not represent usable coal inventory to 15
Ameren Missouri and, therefore, should not be included in coal inventory balances that are 16
included in rate base. 17
Staff Expert/Witness: Lisa K. Hanneken 18
G. Demand-Side Management Cost Recovery Regulatory Asset 19
1. Pre-MEEIA Demand-Side Programs and Revenue Requirement 20 Impact 21
Ameren Missouri began implementing demand-side management (DSM) programs in 22
February 2009 for energy efficiency programs contained in the Company’s then-adopted 23
preferred resource plan which was filed on February 5, 2008, in Case No. EO-2007-0409. 24
Ameren Missouri’s “Cycle 1” DSM programs (four business energy efficiency programs and 25
five residential energy efficiency programs) were each first offered to customers in 2009 and 26
were each terminated on September 30, 2011, because of the throughput disincentive with the 27
44 As revised and presented to Staff by Laura Moore on 11/14/14, subsequent to Ameren Missouri’s direct filing.

Page 57
DSM programs, that is, the financial disincentive for Ameren Missouri to promote energy 1
efficiency programs because a large portion of its fixed costs are recovered based on the level of 2
sales (i.e. throughput). 3
The energy and demand impacts and the overall delivery processes of Ameren Missouri’s 4
DSM programs are evaluated, measured and verified by third-party contractors chosen and paid 5
for by Ameren Missouri. Ameren Missouri’s “Cycle 1” evaluation, measurement and 6
verification ("EM&V") reports for all of its DSM programs were provided to Ameren Missouri 7
DSM Stakeholder Group45 members in May 2012. 8
Ameren Missouri offered five “bridge” DSM programs (two business energy efficiency 9
programs and three residential energy efficiency programs) which were designed to bridge the 10
gap at a very low funding level between the expiration of Ameren Missouri’s former energy 11
efficiency programs (which expired on September 30, 2011) and when the Commission issued an 12
order on the Company’s anticipated MEEIA filing. The business “bridge” programs became 13
effective on November 24, 2011, and the residential “bridge” programs became effective on 14
December 18, 2011. 46 All “bridge” DSM programs terminated on September 30, 2012, and 15
were limited by the Company’s goal of reducing a total of 30,000 MWh of energy usage through 16
the “bridge” programs. 17
Staff recommends that the Commission order the continuation of the current Ameren 18
Missouri DSM regulatory asset cost recovery mechanism47 for the “Cycle 1” DSM programs and 19
for the “bridge” DSM programs. 20
Staff Expert/Witness: Hojong Kang, Ph.D. 21
45 The Ameren Missouri DSM Quarterly Stakeholder Group includes Staff, Office of the Public Counsel, Missouri Department of Economic Development – Division of Energy, and other interested parties and serves as an advisory group to Ameren Missouri in the development, implementation, monitoring and evaluation of Ameren Missouri’s demand response, energy efficiency and affordability programs. 46 Case No. ET-2012-0011 for Residential Energy Efficiency Programs and Case No. ET-2012-0156 for Business Energy Efficiency Programs. 47 In Case No. ER-2010-0036, as a result of the First Nonunanimous Stipulation and Agreement, the balance of the regulatory asset for prudently incurred programs’ costs was included in rate base and an annual amortization based on six years was included in expense. In Case No. ER-2011-0028, the Commission approved the continued use of the regulatory asset cost recovery mechanism it had approved in Case No. ER-2010-0036.

Page 58
2. DSM Costs Included In Rate Base 1
In prior rate proceedings, Ameren Missouri was allowed to treat DSM program 2
expenditures as a depreciable asset through booking the amounts to a regulatory asset account 3
and accruing a carrying charge equal to Ameren Missouri’s Allowance for Funds Used During 4
Construction (AFUDC) rate on the balance. A new DSM regulatory asset was created in each 5
rate case. In Case No. ER-2008-0318, one-tenth of the program cost amount Ameren Missouri 6
spent though September 30, 2008, was included in the cost of service through a ten-year 7
amortization. In Case No. ER-2010-0036, $11,430,501, the balance in the regulatory asset as of 8
December 31, 2009, less the Residential Lighting and Appliance program cost, was included in 9
rate base and an annual amortization based on six years was included in expense. In Case No. 10
ER-2011-0028, DSM program costs incurred through February 28, 2011, in the amount of 11
$28,547,631, was included in Ameren Missouri’s rate base and an annual amortization of that 12
amount, less Residential Lighting and Appliance program costs based on six years was included 13
in expense. In Case No. ER-2012-0166, $36,878,639 of DSM program costs incurred through 14
July 31, 2012 was included in rate base. Staff also included a six year amortization of 15
that balance. 16
In this rate proceeding, the Company has incurred approximately $3,269,719 of DSM 17
program costs since the July 31, 2012 true-up cutoff date in Ameren Missouri’s last 18
rate proceeding, Case No. ER-2012-0166, which Staff has included in rate base. One-sixth of 19
this amount has been included in expense through a six-year amortization. 20
As it was presented in the last rate case, Staff has combined the unamortized portion of 21
all previous Ameren Missouri DSM regulatory assets included in rate base into one rate base line 22
item in this case labeled “Energy Efficiency Regulatory Asset.” 23
Staff Expert/Witness: John P. Cassidy 24
H. FAS 87 – Pensions and FAS 106 OPEBs Regulatory Liabilities 25
See the discussion in Section IX. D – Payroll and Benefits, Subsections 3.a. and 4.a. 26
Staff Expert/Witness: Kofi Agyenim Boateng 27

Page 59
I. Accumulated Deferred Income Taxes 1
Ameren Missouri’s Accumulated Deferred Income Tax Reserve (“ADIT”) represents, in 2
effect, a prepayment of income taxes by Ameren Missouri’s customers to the Company prior to 3
payment being made by the Company to taxing authorities. As an example, because Ameren 4
Missouri is allowed to deduct depreciation expense on an accelerated basis for income tax 5
purposes, the depreciation expense deduction used for income taxes paid by the Company is 6
considerably higher than depreciation expense used for ratemaking purposes. This results in 7
what is referred to as a “book-tax timing difference” and creates a deferral of income taxes to the 8
future. The net credit balance in the deferred tax reserve represents a source of cost-free funds to 9
the Company. Therefore, Ameren Missouri’s rate base is reduced by the deferred tax reserve 10
balance to avoid having customers pay a return on funds that are provided cost-free to the 11
Company. As part of its true-up audit, Staff will re-examine the ADIT balances to make sure all 12
items included in those balances are consistent with the other components of the cost of service 13
and that they reflect the current balances at the true-up cut-off date, December 31, 2014. 14
Based on this true-up examination, Staff may make additional adjustments to the cost of service 15
as necessary. 16
Staff Expert/Witness: Lisa K. Hanneken 17
VIII. Corporate Allocations 18
A subsidiary of Ameren Corporation, Ameren Services Company (“AMS”), provides 19
various management and administrative services for Ameren Missouri and affiliate companies. 20
In its audit, Staff reviewed the methods used by AMS to assign and allocate its costs to Ameren 21
Missouri’s electric operations. Under AMS’s corporate cost allocation system, costs are 22
categorized into four types: Direct, Direct Allocated, Indirect Corporate, and Indirect Function. 23
The allocations of costs and the methods used to allocate costs from AMS are outlined in 24
Ameren Missouri’s cost allocation manual (CAM). AMS evaluates and updates the allocation 25
factors at the beginning of each calendar year, unless a significant change in circumstances 26
occurs which would require an intermediate factor update. In addition, the Company’s Internal 27
Auditing Department performs an audit each year of AMS’ Service Request System and Service 28
Request policies, operating procedures, and controls as ordered by the Illinois Commerce 29

Page 60
Commission (ICC) in Order #06-0070 on May 16, 2007. The Company provided Staff with data 1
regarding its allocations through September 2014 for review, as well as copies of the internal 2
audit reports required by the ICC. 3
In December 2013, during the test year, Ameren Corporation divested itself of Ameren 4
Energy Resources (AER) and its subsidiaries Ameren Energy Generating Company (“Genco”), 5
Ameren Energy Resources Generating Company (“AERG”) and Ameren Energy Marketing 6
Company (“AEM”). Each of these entities was also being assigned allocated costs from AMS 7
and, as a result of the divestiture, a higher percentage of costs are being allocated to the 8
remaining entities, including Ameren Missouri. Another result of the divestiture was that several 9
employees were displaced and ultimately offered positions at various Ameren entities, including 10
AMS and Ameren Missouri, which in turn increased both Ameren Missouri’s direct and 11
allocated labor costs. 12
As part of its filing Ameren Missouri made an adjustment to address the impact of the 13
divestiture on the allocated costs it receives. Staff is not making an adjustment as this time, given 14
that a large portion of this change has been captured as part of the adjustments proposed in its 15
direct filing which updated most expenses through September 2014. In addition, as part of its 16
true-up audit, Staff will be reviewing and likely be making adjustments to many expense areas, 17
most of which include allocated AMS costs. Therefore, given that the data through December 31, 18
2014 available for Staff’s true-up audit, will contain an entire year of the post-divestiture 19
allocated costs, it will eliminate the need for a standalone adjustment. 20
There are several ways in which the allocated costs to Ameren Missouri could potentially 21
change as a result of the divesture. First, the most obvious way is in the effect on allocation 22
percentages. Prior to the divesture each entity being provided services by AMS got not only 23
directly allocated costs assigned to them, but also a share of the common costs as well. These 24
costs were spread among the various entities on a percentage basis. With the divestiture of 25
several of the entities, there are fewer remaining entities which to spread these costs amongst. 26
The next way in which changes can be seen is in the amount of costs being allocated by those 27
percentages. Staff has determined that a higher amount of total AMS costs is being allocated to 28
the entities since the divestiture. Staff is also reviewing the hiring of the employees that 29
previously held positions at the divested entities who were offered positions at the remaining 30
entities. 31

Page 61
In order to determine the impact of all of these changes, Staff has requested, but not yet 1
received, several additional items of data, including a complete, detailed breakdown of all 2
monthly allocated AMS costs to Ameren Missouri and to each Ameren affiliate prior to the AER 3
divestiture and also subsequent to the AER divestiture in order to aid in the determination of the 4
appropriateness of allocated AMS costs to Ameren Missouri on a post divestiture basis. 5
Therefore, Staff has reservations as to whether Ameren Missouri ratepayers are being held 6
harmless for the divestiture. 7
The information requested, once received, will be reviewed as part of Staff’s continuing 8
examination of AMS allocations. However, Staff has concerns as to whether the data that will be 9
made available to Staff will be able to answer all the questions it has. The difficulty is that Staff 10
believes AMS’s current allocation procedures are not clear enough to fully quantify or identify 11
the impact of the divesture or any other allocation related issues. Therefore, Staff recommends 12
further review of this issue through a CAM review. 13
Staff Expert/Witness: Lisa K. Hanneken 14
IX. Income Statement 15
A. Rate Revenues 16
1. Introduction 17
Since the largest component of operating revenues results from rates charged to Ameren 18
Missouri’s retail customers, a comparison of operating revenues with cost of service is 19
fundamentally a test of the adequacy of the currently effective Missouri jurisdictional retail 20
electricity rates. If the overall cost of providing service to Missouri retail customers exceeds 21
operating revenues, an increase in the current rates Ameren Missouri charges its Missouri retail 22
customers for electricity is required. 23
One of the major tasks in a rate case is not only to determine whether a deficiency 24
(or excess) between cost of service and operating revenues exists, but also to determine the 25
magnitude of any such deficiency (or excess). Any deficiency (or excess) identified can only be 26
made up (or otherwise addressed) by adjusting Missouri retail rates (i.e., rate revenues) 27
prospectively, on a going-forward basis. 28
Staff Expert/Witness: Kofi Agyenim Boateng 29

Page 62
2. Definitions 1
Operating Revenues are composed of Rate Revenue, Revenue from Off-System Sales and 2
Other Operating Revenues. Each is defined respectively as follows: 3
Rate Revenues: Test year rate revenues consist solely of the revenues derived from the 4
current rates Ameren Missouri charges for providing electric service to its Missouri retail 5
customers (i.e., native load and customer charges). Ameren Missouri’s charges are determined 6
by multiplying each customer’s usage by the per unit rates established in its tariff. Missouri 7
retail customers are charged summer rates (June – September) and winter rates (October – May) 8
during the year. These charges are broken down for Missouri retail customers into two 9
categories: (1) a demand charge; and (2) an energy charge. Missouri retail customers' rates are 10
also broken down by rate class based upon type and amount of usage. These rate classes include: 11
(1) Residential; (2) Commercial; (3) Small General Services; (4) Large General Services; 12
(5) Large Primary Services (11M); and (6) Public and Private Lighting. In addition to these rate 13
classes, there are separate categories for large industrial customers: (1) Noranda (12M); and 14
(2) Metropolitan Sewer District (MSD). Revenues from the fuel adjustment clause (FAC) 15
represent collections or refunds of prior period fuel costs and are excluded in determining the 16
annualized level of ongoing rate revenues. 17
Revenue from Off-System Sales: Revenue from off-system sales is realized as a result 18
of Ameren Missouri’s sales of electricity to other utilities through MISO at non-regulated prices. 19
The gross revenue from these sales, less the generation or purchased power expense incurred by 20
Ameren Missouri to make these sales, is known as the profit margin on off-system sales. The 21
rationale for assigning this profit to ratepayers and including it in operating revenues is that the 22
electricity sold by Ameren Missouri is generated by power plants being paid for by the 23
ratepayers through electric rates charged by Ameren Missouri. 24
Other Operating Revenues: This category includes the revenue from such items as the 25
rental of pole space, leased land and other miscellaneous charges. 26
Staff Expert/Witness: Kofi Agyenim Boateng 27
3. The Development of Rate Revenue in this Case 28
The objective of this section is to determine normalized and annualized test year usage 29
and revenues by rate class. The intent of Staff’s adjustments to test year Missouri usage and rate 30

Page 63
revenues is to determine the level of revenue that the Company would have collected on an 1
annual, normal-weather basis, based on information “known and measurable” at the end of the 2
test year (in this case, updated through July 2014, as explained below). The two major 3
categories of revenue adjustments are known as “normalizations” and “annualizations.” 4
Normalizations deal with test year events that are unusual and unlikely to be repeated in the 5
years when the new rates from this case are in effect. Test year weather is an example. 6
Annualizations are adjustments that re-state test year results as if conditions known at the end of 7
the test year had existed throughout the entire test year. Adjustments for customer growth are an 8
example of an annualization. 9
Staff Expert/Witness: Robin Kliethermes 10
4. Regulatory Adjustments to Test Year Sales and Rate Revenue 11
a. Adjustment to Remove Unbilled Revenues 12
Staff has eliminated unbilled revenue from its determination of revenue requirement to 13
ensure only 365 days of revenue are included and to reflect revenues stated on an “as billed” 14
basis. The recording of unbilled revenue on the books of the Company recognizes sales of 15
electricity that have occurred, but have not yet been billed to the customer. Therefore, it is 16
necessary for Staff to remove unbilled revenue in order to reach an accurate revenue requirement 17
based upon electricity sales billed to and revenues collected from Missouri ratepayers. 18
Staff Expert/Witness: Kofi Agyenim Boateng 19
b. Adjustment to Remove Gross Receipts Tax 20
The Company acts as a collector for taxes imposed on utility service revenues by 21
municipalities and other taxing authorities. The Gross Receipts Tax (GRT) included on a 22
customer’s bill is collected by the Company and remitted to the appropriate taxing authority. 23
The GRT included on a customers’ bill is recorded as revenue on the books of the Company, 24
with a corresponding charge booked to GRT expense. Theoretically, the revenue and expense 25
offset one another and, therefore, have no effect on net income. However, the expense accrual 26
for GRT does not always match perfectly with the GRT included in revenue due to timing 27
differences in the collection and payment of GRT. Eliminating the GRT recorded in revenue and 28

Page 64
expense through companion adjustments assures that GRT will have no impact on the calculation 1
of net income for revenue requirement purposes. 2
Staff Expert/Witness: Kofi Agyenim Boateng 3
c. Preliminary Adjustments to Test Year 4
Starting with revenue based on Revenue Month (the month in which usage and revenue 5
were reported in the Company billing system), Staff adjusted Ameren Missouri’s revenue in all 6
rate classes to reflect Ameren Missouri’s revenues as Primary/Rate Month (the month reflecting 7
the rates and revenue in the month when the majority of service actually occurred). This 8
adjustment was necessary to move re-billed amounts (negative and positive) to the month where 9
the energy was actually used. 10
Staff Expert/Witness: Robin Kliethermes 11
d. Update Period Adjustment 12
To provide a more current basis for normalization, annualization, and growth 13
calculations, Staff determined that usage data used to determine revenue in this case should be 14
updated to reflect the 12-month period ending July 2014, and should include minor billing 15
adjustments. 16
Staff Experts/Witnesses: Robin Kliethermes and Brad J. Fortson 17
e. Large Customers Annualization 18
LPS Rate Class – The adjustments to billing units and revenues were 19
based upon an “update period” of August 1, 2013, through July 31, 2014, to be adjusted 20
for known and measurable changes through the true-up period ending December 31, 2014. 21
There were 73 customers in the LPS rate class during the update period. A data check was 22
performed for billing corrections prior to doing other adjustments. LPS customers were 23
annualized on an individual customer (account) basis. Their individual monthly demand and 24
energy use, measured over multiple years prior to the update period and the twelve (12) months 25
of the update period, were examined graphically to determine if an adjustment was needed to 26
reflect an annualized/normalized level of demand and energy use for the 12-month update 27
period, as well as to identify the type of adjustment required to reflect the appropriate 28
annualized/normalized level. 29

Page 65
There were no adjustments to revenues for the Economic Development Rider (EDR). 1
This rider provides for discounts to be “paid” to customers (in the form of credits on their 2
electricity bill) who locate or expand operations in certain areas of Ameren Missouri’s service 3
territory. EDR credits are provided to the customer over a five-year period. The value of the 4
credits is a declining percentage of the customer’s electric bill calculated on the appropriate 5
general application rate schedule. Usually, these discounts are included in the determination of 6
Ameren Missouri’s revenues because fostering economic development is assumed to be a benefit 7
to all ratepayers. As of the end of the updated period, there are no EDR customers, therefore, no 8
EDR discount to revenues was included in this rate case. 9
The other LPS adjustments are as follows: 10
(a) Interclass Rate Switching Adjustment 11
No customers moved into the Large Primary Service (LPS) rate class from other classes, 12
and three LPS customers moved to Small Primary Service during the update period. Therefore, 13
adjustments were made to billing units and revenues for interclass rate switching. 14
(b) Annualization 15
The general intent of an annualization is to restate update period billing units results as if 16
conditions known at the end of the update period had existed throughout the entire time period 17
considered. Staff reviews each of the very largest customers to determine if adjustments need to 18
be made to reflect any major growth or decline in kWh usage and rate revenues due to the 19
entrance of new customers, the exit of existing customers, and load growth or decline of specific 20
existing customers. These customers’ billing units and revenues were annualized for all twelve 21
(12) months. 22
(c) Weather Normalization 23
Staff normalized update period usage data provided by Ameren Missouri for some LPS 24
weather sensitive customers for weather by applying weather normalization factors provided by 25
Staff witness Seoung Joun Won for each month. Staff adjusted the billing units by these factors, 26
and applied current rates to determine weather-normalized revenue. The difference between 27
these weather-normalized revenues and the update period revenues determined the amount of the 28
Weather Normalization Adjustment. 29

Page 66
(d) 365-Days Adjustment 1
Rate revenues and billing units were measured by billing month (the period of time over 2
which the staggered bill cycles result in each customer being billed precisely once) rather than by 3
calendar month. The number of days in the twelve (12) billing months comprising the update 4
period for each customer was compared to a 365-day calendar year. For those LPS customers 5
with greater or less than 365 days, a per-day kWh adjustment was made, with the appropriate 6
rates applied to determine the revenue adjustment. 365-Days adjustments are also known as 7
“unbilled” sales and “unbilled” revenues on financial statements. 8
(e) Solar Adjustment 9
Based on the analysis of Staff witnesses Michael L. Stahlman and Sarah L. Kliethermes, 10
there is no significant kWh reduction due to solar installations of LPS customers during the 11
update period. Therefore, there is no solar adjustment of LPS class in this rate case. 12
Staff Expert/Witness: Seoung Joun Won, PhD 13
LTS Rate Class - There was only one customer on the LTS rate class. Staff observed a 14
change in usage during the update period associated with an equipment malfunction at the 15
Noranda facility. Pending receipt of additional information, Staff normalized update period 16
usage to the test year usage level. 17
Staff Expert/Witness: Sarah L. Kliethermes 18
f. Weather Normal Variables 19
This information was provided to Staff witness Seoung Joun Won for weather 20
normalization of the test year kWh usage and update period hourly loads. 21
Historical Data Used to Calculate Weather Variables - Each year’s weather is unique; 22
consequently, test year usage, hourly loads, revenue, and fuel and purchased power expense 23
need to be adjusted to “normal” weather so that rates will be designed on the basis of normal 24
weather rather than any anomalous weather in the test year. In the quantification of the 25
relationship between test year weather and energy sales, Staff used weather observations of 26
Lambert - St. Louis International Airport (“STL”), Missouri for the update period, August 1, 27
2013, through July 31, 2014. 28
As a measure of “normal” weather, Staff used a 30-year period of “climate normals” 29
(“normals”) published in July 2011 by the National Climatic Data Center (NCDC) of the 30
Page 67
U.S. National Oceanic and Atmospheric Administration (“NOAA”). According to NOAA, a 1
climate normal is defined as the arithmetic mean of a climatological element computed over 2
three consecutive decades.48 To conform to the NOAA’s three consecutive decades for 3
determining normal temperatures, Staff used observed maximum and minimum daily 4
temperatures for the 30-year period of January 1, 1981, through December 31, 2010. 5
Therefore, Staff bases its calculations on the time period of the most recent climate normals 6
produced by NCDC. 49 7
Although the definition of normal weather is relatively simple, the actual calculations 8
may be more complicated. Inconsistencies and biases in the 30-year time series of daily 9
temperature observations occur if weather instruments are relocated, replaced or recalibrated. 10
Changes in observation procedures or the instrument’s environment may also occur during the 11
30-year period. NOAA specifically identified three major instrument and location changes for 12
STL in 1988, 1996 and 2002 during the 30-year period of 1981 - 2010.50 It is necessary for Staff 13
to quantify these anomalies and subsequently adjust the time series in calculating the normal 14
temperatures for STL. For changes in 1988 and 1996, Staff utilizes the adjustments used in the 15
Company’s most recent rate case (Case No. ER-2012-0166). For change in 2002, the details of 16
adjustment procedures are presented in Staff’s accompanying workpaper. 17
As explained above, there are three major anomalies that require adjustments to the STL 18
1981 - 2010 daily temperature time series. First, on January 18, 2002, a change of the instrument 19
elevation occurred that resulted in monthly average temperature values around 0.21ºF warmer 20
than before, so Staff adjusted upward the observations from 1981 to 2002. Second, on May 15, 21
1996, a change occurred that resulted in temperature values around 1.69ºF cooler than before, so 22
Staff adjusted downward the observations from 1981 to 1996. Finally, on February 1, 1988, a 23
change occurred that resulted in temperature values that were around 0.45ºF warmer than before, 24
so Staff adjusted upward the observations from 1981 to 1988. Cumulatively, Staff identified the 25
average of the correction value of approximately -1.03ºF for the time period 1981 - 1988, 26
approximately -1.48ºF for the time period 1988 - 1996, and approximately 0.21ºF for the time 27
48 Retrieved on June 27, 2014, http://www.ncdc noaa.gov/data-access/land-based-station-data/land-based-datasets/climate-normals. 49 Retrieved on June 27, 2014, http://www.ncdc noaa.gov/data-access/land-based-station-data/land-based-datasets/climate-normals/1981-2010-normals-data. 50 Retrieved on July 10, 2014, from NOAA website, http://www.ncdc noaa.gov/homr.

Page 68
period 1996 - 2002 to the historical daily temperature time series. Staff derived the daily mean 1
temperature time series, daily two-day weighted mean temperatures, and normal daily 2
temperatures from these adjusted daily temperatures. 3
Weather Variables - Because weather fluctuates greatly from day-to-day, the STL 4
temperature variables required to weather-normalize sales are the test year actual and the 30-year 5
normal two-day weighted daily mean temperature. The day’s daily mean temperature is 6
defined as the simple average of the day’s maximum daily temperature and minimum daily 7
temperature. The daily two-day weighted mean temperature is calculated using the previous 8
day’s mean daily temperature with a one-third weight and the current day’s mean daily 9
temperature with a two-thirds weight.51 10
This was done because in the Ameren Missouri service area, yesterday’s weather effects 11
how electricity is used today. This is likely due to heat retention by the structures in the service 12
area. For example, if today’s temperature is mild, but yesterday’s temperature was hot and the 13
air conditioner was on, it is likely that the air conditioner will also be used today. Similarly, if 14
yesterday’s temperature was mild and air conditioning was not used, then if today’s temperature 15
is slightly warmer, air conditioning may not be used until later in the day. 16
Calculation of “Normal Weather” - Staff used the STL daily two-day weighted mean 17
temperature data series to normalize both class usage and hourly net system loads. Staff used a 18
ranking method to calculate normal weather estimates of daily normal temperature values, 19
ranging from the temperature that is “normally” the hottest to the temperature that is “normally” 20
the coldest, thus estimating “normal extremes.” Staff ranked the two-day weighted temperatures 21
for each year of the 30-year history from hottest to coldest and then calculated the normal daily 22
temperature values by averaging the ranked two-day weighted mean temperatures for each rank, 23
irrespective of the calendar date. 24
This results in the normal extreme being the average of the most extreme temperatures in 25
each year of the 30-year normals period. The second most extreme temperature is based on the 26
average of the second most extreme day of each year, and so forth. Staff’s calculation of daily 27
normal temperatures is not the same as NOAA’s calculation of smoothed daily normal 28
51 To calculate the Dth day’s two-day weighted mean temperature (TWMTD), the current day’s (D) daily mean temperature (DMTD) is averaged with the prior day’s (D-1) daily mean temperature (DMTD-1), applying a 2/3 weight on the current day and 1/3 weight on the prior day: TWMTD = (2/3) DMTD + (1/3) DMTD-1

Page 69
temperatures. Because the test year temperatures do not follow smooth patterns from day to day, 1
Staff calculated normal daily temperatures based on the rankings of the actual temperatures of 2
the test year. 3
Staff Expert/Witness: Seoung Joun Won, PhD 4
g. Weather Normalization of Usage 5
In many of the classes of service, electricity consumption is highly responsive to the 6
weather, specifically temperature. As the temperature reaches higher levels, the demand for 7
cooling, air conditioning and fans increases the customers' consumption of electricity. As the 8
weather becomes cold and temperature falls, the demand for additional heating, electric space 9
heating for example, also forces an increase in electricity consumption. Electric air conditioning 10
and space heating is prevalent in Ameren Missouri's service territory, therefore, it follows that 11
Ameren Missouri's electric load is linked with and responsive to temperature. 12
Ameren Missouri's test year ran from April 1, 2013, through March 31, 2014. In an 13
attempt to capture a more likely forward-looking indictor of non-weather electricity usage per 14
customer, Staff determined to use the most recent temperature and load data available and, 15
therefore, based its analysis on an updated period of August 1, 2013, through July 31, 2014. 16
From November 2013 through February 2014, these months experienced temperatures 17
cooler than normal resulting in electric energy usage above that which would have been expected 18
under normal weather conditions. From May through June 2014, these months experienced 19
temperatures hotter than normal resulting in usage above that which would have been anticipated 20
under normal conditions. The month of August 2013 and the month of July 2014 saw 21
temperatures cooler than normal, which resulted in lower usage of electric energy than would 22
have been anticipated under normal weather conditions. Since the temperatures in the twelve 23
month updated period ending July 31, 2014, used by Staff deviated from normal, and since Staff 24
chose a more recent time period to review than the one used by Ameren Missouri, Staff 25
performed its own weather impact analysis. 26
However, the method and model used by Staff is similar to those used by 27
Ameren Missouri. Staff’s model and methodology contained elements important in the 28
class-level weather normalization process: use of daily load research data to determine 29
non-linear, class-specific responses to changes in temperature with the incorporation of different 30
base usage parameters to account for different days of the week, months of the year and holidays. 31

Page 70
The results of Staff’s analysis were provided to Staff witness Robin Kliethermes and Brad J. 1
Fortson to be used in the normalization of revenues for weather sensitive classes, Res, SGS, LGS 2
and SPS. 3
According to Staff’s weather sensitivity test for each customer in LPS class, 37 customers 4
show cooling demand response and 4 customers show both heating and cooling load response. 5
The members of the LPS class are not homogeneous and, consequently, a weather response 6
function created for weather sensitive members should not be applied to non-weather sensitive 7
members. Applying the weather-normalization process to annualized usage of non-weather 8
sensitive customers would have introduced a statistical error into the product of the analysis. 9
Staff determined it is both appropriate and necessary to weather-normalize only weather 10
sensitive customers in the LPS class. Please see LPS Annualization by Staff witness Seoung 11
Joun Won for a more detailed explanation of the annualization adjustments for the LPS class. 12
Staff Expert/Witness: Seoung Joun Won, PhD 13
h. Weather Normalization of Revenue (Weather Sensitive Classes) 14
Staff normalized update period usage data provided by Ameren Missouri for the Res, 15
SGS, LGS, and SPS rate classes. Staff applied a regression to model the relationship between 16
average use per customer and the percentage of update period usage that are priced in the first 17
rate block. The relationship was then applied to monthly usage per customer before and after the 18
weather adjustment, using the normalization factors provided by Staff witness Seoung 19
Joun Won.52 This computation resulted in normalized usage by rate block, which was then 20
converted to total normalized revenues by multiplying rate block usage by the appropriate rates. 21
The difference between these weather-normalized revenues and the update period revenues 22
determined the amount of the Weather Normalization Adjustment. 23
Staff Expert/Witness: Robin Kliethermes 24
i. 365-Days Adjustment to Usage - Weather Sensitive Classes 25
Staff calculated a normalization adjustment to Ameren Missouri's kWh usage to reflect a 26
calendar year's (i.e., 365 days') worth of usage. Ameren Missouri's customers' usage is measured 27
and rate revenues are collected over a period known as a revenue month, which is the interval 28 52 The results of the regression analysis were also consistent with cumulative frequency distribution data provided by Ameren Missouri for the Res, SGS, LGS and SPS rate classes.

Page 71
over which Ameren Missouri reads customers' meters and issues bills. A bill rendered for a 1
given revenue month may charge for usage in parts of two calendar months. Revenue months 2
take their names from the calendar month in which the customer's bill is rendered. For example, 3
assume a customer's meter was read and usage determined on June 8 and then again on July 8 4
and that the bill was sent to the customer on July 15. The revenue month for this bill is July even 5
though 22 days of the usage measured for this bill occurred from June 9 through June 30 and it 6
contained only eight days of usage in July. 7
The length of a revenue month is dependent upon the interval between meter readings 8
and does not necessarily have the same number of days that occur in a given calendar month of 9
the same name; that is, a revenue month may have more than or less than the number of days for 10
the same-named calendar month. For the example given above, the usage is for 30 days (June 9 11
through July 8), even though the revenue month is July, which has 31 days. When revenue 12
month usage is totaled over the year, the resulting revenue year will include usage from the 13
immediately prior calendar year and assign usage to the next calendar year, meaning a revenue 14
year may contain more than or less than 365 days' usage. Therefore, since the costs and 15
expenses are accounted over a calendar year, Staff calculates an annualization adjustment to 16
bring the revenue year kWh into a 365-days interval. This adjustment is stated in kWh and is 17
referred to as the 365-Days Adjustment. Staff calculates the 365-Days Adjustment by subtracting 18
the weather-normalized revenue month kWh from the weather-normalized calendar month kWh 19
for the test year; the difference, or the 365-Days Adjustment, may be either positive or negative. 20
The 365-Days Adjustment for the weather-sensitive classes were provided to 21
Staff witness Robin Kliethermes and Brad J. Fortson, who used the 365-Days Adjustment to 22
adjust the revenues of the weather-normalized class revenues months to the twelve months ended 23
July 31, 2014. 24
Staff Expert/Witness: Seoung Joun Won, PhD 25
j. 365-Days Adjustment to Revenue - Weather Sensitive Classes 26
As described above, since billing months are an aggregation of bill cycles, they will differ 27
from calendar months in the time period they cover. To adjust revenue for this difference, Staff 28
allocated the kWh days adjustment calculated by Staff witness Seoung Joun Won proportionately 29
to the appropriate monthly kWh usage for each class and applied current rates to arrive at the 30
365-Days Adjustment to revenue. 31

Page 72
Staff Experts/Witnesses: Robin Kliethermes and Brad J. Fortson 1
k. Solar Revenue Adjustment 2
Staff allocated the monthly kWh solar adjustment calculated by Staff witness Michael L. 3
Stahlman proportionately to the rate blocks of the Res, SGS and LGS rate classes. There was no 4
solar adjustment for the SPS class as explained by Staff witness Stahlman in Section IX, 5
Subsection C. 2. d. below. Staff applied current rates to the solar adjusted kWh to calculate the 6
revenue adjustment. 7
Staff Experts/Witnesses: Robin Kliethermes and Brad J. Fortson 8
l. Adjustment to Remove MEEIA Revenue 9
The Missouri Energy Efficiency Investment Act (MEEIA), § 393.1075, RSMo Supp. 10
2010, was passed by the Missouri legislature and signed by the governor in 2009. The MEEIA 11
program is designed to encourage Missouri’s investor-owned electric utilities to offer energy 12
efficiency programs and projects designed to reduce the amount of electricity used by the 13
utility’s customers. The Commission rules (4 CSR 240-20.093 and 4 CSR 240-3.163) 14
promulgated a mechanism that allows for periodic rate recovery of the MEEIA program costs as 15
well as the recovery of lost revenues related to the programs and a utility performance incentive 16
for investment in demand-side programs. During part of the test year, Ameren Missouri 17
collected MEEIA program costs as part of revenue through the base rates from ratepayers. 18
However, since January 27, 2014, the recovery of MEEIA program costs from customers is now 19
accomplished through a MEEIA Rate Rider mechanism, rather than through the base rates. 20
Accordingly, Staff has made adjustment to eliminate the test year MEEIA revenues from the 21
electric retail revenues. 22
Staff Expert/Witness: Kofi Agyenim Boateng 23
m. Customer Growth Annualization 24
Staff made customer growth adjustments to test year kWh sales and rate revenue 25
to reflect the additions to and, in certain instances, reductions to kWh sales and rate revenue 26
that would have occurred if the number of customers taking service at the end of July 31, 2014, 27
had existed throughout the entire year. Customer growth/loss was calculated for the 28
Res Time-of-Use and Non-Time-of-Use, SGS Time-of-Use and Non-Time-of-Use, LGS Time-29
of-Use and Non-Time-of-Use, as well as SPS Non-Time-of-Use and SPS Time-of-Use customer 30

Page 73
classes. The customer growth annualization takes into account weather and usage 1
normalizations, as well as the adjustments for 365 days and rate changes that occurred during the 2
test year. Other customer classes that did not exhibit growth were left at test year customer 3
levels instead of being annualized at the July 31, 2014, levels. These are the LPS, Outdoor 4
Lighting, and LTS classes. Staff will re-examine the level of customer growth through 5
December 31, 2014, during its true-up cut-off period and make adjustments to the cost of service 6
as necessary to reflect these updated levels. 7
Staff Expert/Witness: Kofi Agyenim Boateng 8
n. Removal of Rate Refunds and FAC Recovery 9
Staff made an adjustment to remove the Provision for Rate Refunds recorded by Ameren 10
Missouri from the test year. This item represents the collections or refunds of prior period 11
revenues related to the Company’s FAC. Staff’s calculated revenue requirement in this case 12
reflects a prospective level of net fuel and purchased power expense for Ameren Missouri. 13
Therefore, this provision must be eliminated in the context of a general rate proceeding in order 14
to reflect an accurate ongoing revenue requirement for ratemaking purposes. The Company will 15
appropriately consider these collections or refunds of prior period revenues when it rebases the 16
net base fuel costs in the FAC. 17
Staff Expert/Witness: Kofi Agyenim Boateng 18
o. Annualization and Normalization Results 19
Results of the annualization and normalization adjustments above are located at the 20
Rate Revenue Summary tab of Staff’s Accounting Schedules. 21
Staff Expert/Witnesses: Kofi Agyenim Boateng, Robin Kliethermes and Brad J. Fortson 22
B. Adjustments to Non-Rate Revenues 23
1. Lake of the Ozarks Shoreline Management Other Revenues 24
During the test year, the Company recorded other electric revenues associated with 25
annual fees, certified-dock-builder fees, enforcement fees, and processing fees associated with its 26
Lake of the Ozarks shoreline management activities. Staff examined the level that the Company 27
collected for these management activities through July 31, 2014, and has reflected an adjustment 28
to reflect the twelve-months-ending July 2014 level of revenues reported by Ameren Missouri 29

Page 74
for these activities. Staff will update this adjustment when it performs a true-up audit for 1
Ameren Missouri through December 31, 2014. 2
Staff Expert/Witness: Kofi Agyenim Boateng 3
2. Miscellaneous Other Revenues 4
Ameren Missouri’s miscellaneous other revenues consist of forfeited discounts, rents 5
from property, change and disconnection fees, customer installation fees, late fees, etc. Staff’s 6
analysis included a review of these revenue levels over a four-and-one-half-year period including 7
the test year and update period for this case through July 31, 2014. Based upon Staff’s review, 8
the miscellaneous other revenue levels at the twelve-month period ending July 31, 2014, appear 9
reasonable for inclusion in customer cost of service. Staff will review this area during its true-up 10
audit for Ameren Missouri in this proceeding. 11
Staff Expert/Witness: Kofi Agyenim Boateng 12
3. Removal of Gain on Disposition of Emission Allowances 13
During the test year, Ameren Missouri recorded a gain on sales of emission (nitrogen 14
oxide) allowances under the EPA’s Clean Air Interstate Rule (CAIR) program. Staff 15
understands the CAIR program is scheduled to be replaced by EPA’s Cross-State Air Pollution 16
Rule (CSAPR) program beginning on January 1, 2015, with its own set of allowances which will 17
make the remaining CAIR allowances no longer saleable. Staff proposes to eliminate this 18
revenue as it relates to a non-recurring revenue stream, to properly reflect actual billed retail 19
revenue and non-retail revenue that are recognized for revenue normalization purposes. 20
Staff Expert/Witness: Kofi Agyenim Boateng 21
4. Coal Refinement Projects 22
Due to the CSAPR, which requires future reductions in emissions of pollutants, such as 23
SO2 and NOx, Ameren Missouri will need to take steps to either reduce the amount of emissions 24
it produces or will need to obtain emission allowances for its existing level of emissions. To this 25
end, Ameren Missouri has begun implementation of measures at its Rush Island, Labadie and 26
Sioux Energy Centers to treat its coal to reduce emissions. 27
Ameren Missouri has contracted with outside parties to begin the utilization of refined 28
coal at these plants. The coal-refinement process is designed to reduce emissions of NOX and 29
Page 75
SO2, which are generated from burning coal. The coal refiners lease a portion of the property at 1
each location to obtain the space needed to place their equipment for the refinement process. 2
This process involves Ameren Missouri selling its coal to a third party who applies the 3
refinement process and then in turn sells the refined coal back to Ameren Missouri. The 4
contracts which Ameren Missouri has entered into produce revenues in the form of lease 5
payments to Ameren Missouri, coal handling costs and license fees. There are no incremental 6
costs to Ameren Missouri associated with this process. 7
However, a consequence of utilizing refined coal is additional costs related to 8
maintenance and capital costs as a result of corrosion and increase slagging rates due to the use 9
of chemicals as part of the refinement process. 10
a. Rush Island Energy Center 11
On December 14, 2011, Ameren Missouri was granted approval by the Commission in 12
Case No. EO-2012-0146 to undertake the coal-refinement process, through a third party, 13
Buffington Partners, LLC (“BP”), at its Rush Island Energy Center. In January 2013, Ameren 14
Missouri began the coal-refinement process at the Rush Island facility. 15
b. Sioux Energy Center 16
In Case No. EA-2013-0502 Ameren Missouri was granted approval on July 27, 2013 for 17
a similar project at its Sioux Energy Center. Due to the variances in the type of boilers at the 18
Sioux facility, Ameren Missouri has contracted with GS RC Sioux, LLC (“LLC”), to provide 19
refinement of the coal for its Sioux Energy Center based on different technology than that of the 20
Rush Island Energy Center refinement process. 21
c. Labadie Energy Center 22
Ameren Missouri was granted approval on December 28, 2013 in Case No. 23
EO-2014-0149 for refinement of coal, through the third party Larkwood Energy, LLC, at its 24
Labadie Energy Center similar to the process at the Rush Island Energy Center. 25
Staff has included an annualized ongoing amount in its cost of service calculation related 26
to the amounts received by Ameren Missouri for lease payments, coal handling charges and 27
license fees. In addition, Staff included an annualized amount of actual expense incurred for the 28
12-months ending September 30, 2014 related to the additional maintenance costs experienced 29
by Ameren Missouri. 30

Page 76
Staff will re-examine this issue as part of its true-up audit to determine if any changes 1
regarding Ameren Missouri’s expenses or revenues have taken place in conjunction with the 2
refinement process. 3
Staff Expert/Witness: Lisa K. Hanneken 4
5. Off-System Sales (OSS) 5
a. Energy 6
Off-system sales are those sales of electricity made after Ameren Missouri has met all 7
obligations to serve its native load customers (retail and full-requirements wholesale customers). 8
This excess energy is then available to sell to other utilities. By engaging in off-system sales, 9
Ameren Missouri generates profits, or net margin, which represent total proceeds from the sales 10
less associated generation or purchased power cost. It is appropriate to include off-system sales 11
in the cost of service because Ameren Missouri’s customers are already paying for all the costs 12
associated with the generating facilities that produce electricity, as well as the purchased power 13
that is necessary to meet native load. To the extent that off-system sales are made using these 14
facilities, as well as through the purchase of power, the customers should benefit from these 15
sales. Off-system sales represent an efficient utilization of the electric facilities and systems that 16
have been put in place to meet the electricity needs of Ameren Missouri’s customers. 17
Off-system sales revenues were calculated in the production cost model by using the 18
hourly-market energy prices that were determined by Staff witness Erin L. Maloney. Staff’s 19
adjustment for off-system sales revenue represents the inclusion of additional revenue in order to 20
annualize the off-system sales revenues that were calculated by Staff witness Shawn E. Lange 21
using Staff’s production cost model. This was recorded in Staff’s revenue requirement 22
cost-of-service calculation by subtracting Ameren Missouri’s test year ending March 31, 2014, 23
per book off-system sales revenues from Staff’s annualized level of off-system sales revenues as 24
determined by the production cost model using Staff’s hourly market energy prices. It should be 25
noted that Staff has reflected contracts for sale of power to Missouri municipalities as off-system 26
sales consistent with its treatment for these contracts in the previous rate proceeding. Staff will 27
continue to examine off-system sales revenues through December 31, 2014, which represents the 28
true-up cut-off date as approved by the Commission as part of this rate proceeding. 29
Staff Expert/Witness: Lisa M. Ferguson 30

Page 77
b. Capacity Sales 1
When unnecessary to serve its own load, Ameren Missouri is able to sell capacity to 2
other utility companies. Capacity sales to other utilities reduce Ameren Missouri's cost-of-3
service. Staff included an adjusted level of capacity sales as part of the cost-of-service 4
calculation in order to reflect the ongoing level of capacity sales. Staff will re-examine the level 5
of capacity sales as part of its true-up audit using information through year-end 2014. 6
Staff Expert/Witness: Lisa K. Hanneken 7
c. Bilateral Transactions and Financial Swaps 8
Staff made two adjustments outside the production cost model to account for bilateral 9
sales and financial swaps. The bilateral adjustment is for net sales (sales minus purchases) made 10
by the Company to counterparties to increase the revenue of underlying generation assets and the 11
financial swap adjustment is for transactions made by the Company to lock-in the sales price of 12
underlying generation assets. Staff will continue to review the bilateral transactions and 13
financial swaps and adjustments through the true-up period ending December 31, 2014, and will 14
update the inputs as necessary. 15
Staff Expert/Witness: Erin L. Maloney 16
6. Midwest Independent Transmission System Operator (MISO) 17
a. Day 2 Revenues and Expenses 18
Ameren Missouri participates in the MISO activities, including the MISO day-ahead and 19
real-time energy markets (often called MISO “Day 2” or “Midwest Markets”). As part of its 20
participation in the MISO Day 2 markets, during the test year the Company received payments 21
from the MISO related to the Revenue Sufficiency Guarantee (RSG) provision of MISO’s tariff. 22
These payments are designed to ensure that companies participating in the MISO Day 2 markets 23
are made whole when the Company’s total offer prices in market are not covered by the actual 24
market prices. 25
Since these offers include a margin for profits, it is important not to exclude this in the 26
calculation. Currently, Staff is utilizing a 51% profit margin rate based on the calculations of 27
margins embedded in the RSG make-whole payments performed during the true-up phase in the 28
last case, No. ER-2012-0166. In addition, Staff has annualized both test year revenue and 29

Page 78
expense levels for Day 2 items based on data provided for the 12-months ending September 30, 1
2014. Staff will re-examine this issue, through December 31, 2014, during its true-up audit. 2
For Ameren Missouri, the RSG payments received from MISO during the test year 3
totaled $5,914,918. Staff has included the more recent 12-months ending September 30, 2014 4
amount of $5,812,226 then applied the 51% profit margin rate for a resulting amount of 5
$2,964,235. 6
In addition, an amount of $4,888,827 related to Price Volatility and Net Regulation 7
revenues was received during the test year. Price Volatility payments are received when there is 8
a deviation from real-time prices and Net Regulation Adjustment revenues are received to make 9
generators price neutral for following regulation. Staff has removed this amount from its cost of 10
service calculations and Net Base Energy Cost (NBEC) calculations given that fact that Staff’s 11
fuel model does not model non-economic dispatch, therefore these revenues would not exist in 12
the model’s output. However, these items are taken into account in subsequent FAC filings to 13
ensure that the actual revenues and costs experienced by Ameren Missouri are being flowed 14
through to ratepayers. 15
Staff Expert/Witness: Lisa K. Hanneken 16
b. Amortization of RSG Resettlement Expenses 17
Consistent with the Commission’s Report and Orders in Case Nos. ER-2008-0318, 18
ER-2010-0036, ER-2011-0028 and ER-2012-0166, relating to MISO resettlement charges, Staff 19
had previously included an amortization of previously-incurred RSG resettlement expense. 20
However, as of December 2014, the end of the true-up period in this case, the amortization will 21
be fully recognized; therefore, Staff has removed the amount of amortization booked during the 22
test year for this item. 23
In addition, while Staff’s adjustment will remove the amortization going forward, it will 24
continue through the May 30, 2015 date of implementation of rates in this case, as established by 25
the Commission; therefore, from January 2015 through May 2015, the Company will continue to 26
receive in rates a monthly amount of $22,724 which is over and above the original balance to be 27
recovered which will result in a total amount of over-collection of $113,619. Staff witness 28
John P. Cassidy addresses this issue further in this Report (see Section IX, Subsection E. 17. b. 29
below) as part of his amortization expense analysis. 30
Staff Expert/Witness: Lisa K. Hanneken 31

Page 79
c. Transmission Revenue and Expense 1
Staff is recommending adjustments to the test year level of MISO transmission revenues 2
and expenses. Staff has annualized the test year’s revenue by annualizing data provided for the 3
12-months ending September 2014, which annualizes each item to a current ongoing level. 4
Staff will continue to review all of Ameren Missouri’s transmission transactions as 5
additional information becomes available through the true-up period. 6
Staff Expert/Witness: Lisa K. Hanneken 7
d. Ancillary Services Market Revenue and Expense 8
Ameren Missouri also participates in MISO’s Ancillary Services Market (ASM). 9
Ameren Missouri entered the ASM to acquire ancillary services for its retail load and to be able 10
to sell the services from its generation. Staff has annualized test year ASM revenue and expense 11
levels by using data for the 12-months ending September 2014. Staff will continue to review 12
Ameren Missouri’s ASM transactions as additional information becomes available through the 13
true-up period. 14
Staff Expert/Witness: Lisa K. Hanneken 15
e. Miscellaneous MISO Related Revenues 16
Ameren Missouri also received revenues as a result of inadvertent energy from MISO. 17
Staff has annualized these revenues based on the actual amounts for the 12-months ending 18
September 30, 2014. Staff will continue to review Ameren Missouri’s revenues resulting 19
from inadvertent energy from MISO as additional information becomes available through the 20
true-up period. 21
Staff Expert/Witness: Lisa K. Hanneken 22
C. Fuel and Purchased Power Expense 23
1. Fuel and Purchased-Power Prices 24
Staff reviewed all of Ameren Missouri’s coal commodity and coal transportation 25
contracts. Staff reviewed nuclear, natural gas, and fuel oil prices as reflected in Company fuel 26
reports, workpapers, and responses to Staff data requests. Staff also reviewed multiple years of 27
market energy prices. Staff’s annualization and normalization of the Company’s fuel and 28

Page 80
purchased-power expense allows for sufficient funds to serve the Company’s native load and 1
enable the Company to make off-system sales through the MISO day-ahead market. Staff’s fuel 2
expense adjustment includes all increases in commodity coal and coal transportation costs based 3
upon contracts in effect beginning January 1, 2015. Staff’s fuel expense adjustment for nuclear 4
fuel is based upon a forecast for this cost as of December 2014. Ameren Missouri completed a 5
nuclear refueling at its Callaway facility on November 21, 2014, and actual nuclear fuel cost 6
information related to this refueling is not yet available. As part of Staff’s true-up analysis in 7
this proceeding, Staff will include actual known and measurable nuclear fuel costs at year-end 8
2014. Staff’s fuel expense annualization also incorporates a three-year average of natural gas 9
and fuel oil commodity prices through July 31, 2014, as sponsored by Staff witness Erin L. 10
Maloney. Staff also included in the fuel cost calculation the fixed demand cost of natural gas 11
and an increase in costs resulting from fly ash activities. Staff’s annualized purchased-power 12
expense is determined through a three-year average of day-ahead market energy prices through 13
July 31, 2014, as sponsored by Staff witness Maloney. Staff will continue to examine all of 14
these fuel cost components through the true up period ending December 31, 2014, in order to 15
address any significant changes that may occur through that date. Staff’s purchased-power 16
expense adjustments reflect a three-year average of market energy prices through July 31, 2014. 17
For the period covering January through March 2014, Staff adjusted each of these months in 18
order to remove the impact of the “polar vortex” event that occurred during the 2013-14 winter. 19
Staff witness Maloney will discuss market energy prices in Section IX, Subsection C. 1. f. later 20
in this Report. 21
Staff Expert/Witness: Lisa M. Ferguson 22
a. Coal Prices 23
i. Accounting Coal Prices 24
Staff’s accounting coal prices are used to compute the fuel costs based on the coal unit 25
generation that is determined by the production cost model. Staff performed a review of all of 26
Ameren Missouri’s current accounting coal commodity and coal transportation contracts. Staff’s 27
accounting coal prices reflect Ameren Missouri’s mine-specific coal commodity and coal rail 28
and barge transportation contracts that will be in effect as of January 1, 2015. Staff also included 29
an ongoing level of cost associated with the hedging activities of Ameren Missouri for the cost of 30

Page 81
rail transportation fuel surcharges. These hedges are tied to the prices of on-highway diesel as 1
reported by the Energy Information Administration, an independent statistical agency of the 2
U.S. Department of Energy (DOE). Finally, Staff included all railcar-related costs as a 3
component of the accounting coal price used in the production cost model. 4
Staff Expert/Witness: Lisa M. Ferguson 5
ii. Fly Ash 6
Staff accepted the test year amount of expenses in its revenue requirement cost of service 7
to account for the lower amount received by Ameren Missouri through the sale of its fly ash for 8
concrete production. Coal refinement that is currently ongoing at many of the coal energy 9
centers has made the fly ash unsellable. This amount must be included as an increase to Staff’s 10
production cost model results, which are based on the amount of fly ash produced which varies 11
in relationship to the amount of coal burned. If the fly ash is not sold, it creates a cost for 12
disposal for Ameren Missouri. 13
Staff Expert/Witness: Lisa M. Ferguson 14
b. Nuclear Fuel Prices 15
i. Nuclear Fuel Rod Assembly Prices 16
Uranium is a naturally slightly radioactive metal that represents the raw material that 17
undergoes a complex three-stage process, involving conversion, enrichment and fabrication, in 18
order to transform the metal into fuel rod assemblies (long metal tubes filled with precisely 19
fashioned small fuel pellets) that are placed in the Callaway reactor as its source of fuel. The 20
nuclear fuel price represents the cost of all of the fuel rod assemblies that are loaded in 21
the reactor. Staff used in its case forecasted nuclear fuel prices for the period ending 22
December 2014 as provided by Company in its response to Staff Data Request No. 0097. Staff 23
will re-examine the actual nuclear fuel prices at year-end 2014 as part of its true-up audit and 24
will reflect those costs once they are available. 25
ii. Spent-Fuel Costs 26
The Nuclear Regulatory Commission separates wastes into two broad classifications: 27
high-level or low-level waste. High-level radioactive waste consists of “irradiated” or used 28
nuclear reactor fuel (i.e., fuel that has been used in a reactor to produce electricity). The used 29
reactor fuel is in a solid form consisting of small fuel pellets in long metal tubes. Used reactor 30

Page 82
fuel is commonly referred to as “spent fuel.” High level and low level waste will be discussed at 1
length in the next sections of this Report. 2
In this rate case, Staff has not included costs associated with the disposal of spent nuclear 3
fuel as a component of the overall nuclear fuel price that was used as an input for Staff’s 4
production cost model. In the past, a spent-fuel fee component was incorporated in the nuclear 5
fuel prices used for input into the production cost model. However, earlier this year the DOE 6
was ordered by the United States Federal Court to discontinue the collection of this fee effective 7
May 16, 2014. Because of this recent development, Staff has excluded this component of 8
nuclear fuel cost from inclusion in the cost of service calculation. Staff also points out that the 9
reduction in the nuclear waste fee passes through Ameren Missouri’s FAC mechanism. 10
Therefore, the reduction in cost is passed on to electric customers. 11
iii. Spent Fuel and DOE Breach of Contract Settlements with 12 Ameren Missouri 13
The following provides a narrative synopsis of the origination of the spent-fuel fee that 14
was designed to remove and store high-level radioactive waste and the developments which led 15
to the eventual discontinuance of the fee, as well as lawsuits filed by Ameren Missouri against 16
the government for breach of contract associated with the spent-fuel fee. At the end of this 17
section, a chart is presented which summarizes the settlements Ameren Missouri has received to 18
date related to the spent-fuel fee as well as the Company’s accounting treatment of these 19
settlements. 20
In 1982, the United States Congress enacted the Nuclear Waste Policy Act (NWPA), 21
which was signed into law by President Reagan on January 7, 1983. This legislation defined the 22
federal government’s responsibility to provide permanent disposal in a deep geological 23
repository for spent fuel and high-level radioactive waste from commercial and defense 24
activities. Under the NWPA, Ameren Missouri and all other utilities that own and operate those 25
energy centers were responsible for paying the disposal costs to the federal government. 26
A spent-fuel fee was developed to address the disposal of the spent nuclear fuel at one mill, or 27
one-tenth of one cent, for each kilowatt-hour of electricity that each electric utility nuclear 28
energy center generates and sells. The NWPA also required the DOE to review the nuclear 29
waste fee against the cost of the overall nuclear waste disposal program and to propose to the 30
United States Congress any fee adjustment necessary to offset the costs of the program. 31

Page 83
Consistent with the NWPA, Ameren Missouri entered into a contract with the DOE on 1
March 6, 1984. Ameren Missouri’s contract provided that it would pay the government fees that, 2
together with the fees paid by all other utilities under similar contracts, would be sufficient for 3
DOE to implement and operate a program for the prompt removal of the spent nuclear fuel from 4
Ameren Missouri’s Callaway Plant and all other nuclear power plants nationwide. The contract 5
terms required the DOE to commence removal of spent nuclear fuel no later than January 31, 6
1998. The DOE failed to commence removing spent nuclear fuel by January 31, 1998. The 7
United States Court of Appeals for the Federal Circuit held that this failure to commence 8
removal of spent nuclear fuel in 1998 constituted a breach of the government’s contractual 9
obligation to the nuclear utilities that signed contracts with DOE pursuant to the NWPA. 10
In February 2002, after many years of studying its suitability, DOE recommended to 11
President George W. Bush that a site at Yucca Mountain, Nevada, be developed as a long-term 12
geologic repository for high-level waste. On June 3, 2008, the DOE submitted a license 13
application to the U.S. Nuclear Regulatory Commission (“NRC”), seeking authorization to 14
construct a deep geologic repository for disposal of high-level radioactive waste at 15
Yucca Mountain. On March 3, 2010, the DOE filed a motion with the Atomic Safety and 16
Licensing Board (“Board”) seeking permission to withdraw its application for authorization to 17
construct a high-level waste geological repository at Yucca Mountain. The Board denied that 18
request on June 29, 2010, in LBP-10-11, and the parties filed petitions asking the Commission to 19
uphold or reverse this decision. On October 1, 2010, the NRC began orderly closure of its 20
Yucca Mountain activities. The federal government took steps to terminate the Yucca Mountain 21
program, while acknowledging its continuing obligation to dispose of utilities’ spent 22
nuclear fuel. 23
Because of the federal government's efforts to terminate the Yucca Mountain program, 24
the Nuclear Energy Institute, a number of individual utilities, and the National Association of 25
Regulatory Utility Commissioners sued the DOE in the United States Court of Appeals for the 26
District of Columbia Circuit, seeking the suspension of the one mill nuclear waste fee, alleging 27
that the DOE failed to undertake an appropriate fee adequacy review reflecting the current 28
unsettled state of the nuclear waste program. In a June 2012 decision, the court ruled that the 29
DOE's fee adequacy review was legally inadequate and remanded the matter to the DOE. 30
Although the court ruled it has the power to direct the DOE to suspend the fee, the court decided 31
Page 84
that it was premature to do so. Instead, the court ordered the DOE to provide within six months 1
a revised assessment of the amount that should be collected. In January 2013, the DOE issued 2
the revised assessment required by the court. The DOE determined that “neither insufficient nor 3
excess revenues are being collected,” and it proposed no adjustment to the one mill nuclear 4
waste fee. In November 2013, the court rejected the DOE's revised assessment and ordered the 5
DOE to submit a proposal to the United States Congress to reduce the fee to zero. Effective 6
May 16, 2014, the spent-fuel fee was reduced to zero. 7
There are currently two acceptable storage methods for spent fuel after it is removed from 8
the reactor core: (a) Spent-Fuel Pools - where most spent nuclear fuel is safely stored in 9
specially-designed pools at individual reactor sites and (b) Dry Cask Storage – which represents 10
an alternative storage once the spent-fuel pool capacity is reached. 11
As a result of the DOE's failure to begin to dispose of spent nuclear fuel and to fulfill its 12
contractual obligations, in 1999 Ameren Missouri increased the capacity of Callaway’s spent-13
fuel storage pool from its original designed storage capacity of 1,340 spent-fuel assemblies to 14
approximately 2,360 spent-fuel assemblies. This expansion was accomplished by “re-racking,” 15
which involved replacing the existing storage racks with new racks having additional storage 16
capacity. In addition, Ameren Missouri has begun construction of a dry cask storage facility. 17
Ameren Missouri and other nuclear energy center owners sued the DOE to recover costs incurred 18
for re-racking spent-fuel pools, as well as for dry cask storage and other ongoing costs associated 19
with storing spent fuel. Ameren Missouri’s lawsuit to recover damages associated with the 20
re-racking was filed in 2004. The case was formally stayed until early 2010, in order to allow 21
Ameren Missouri to take advantage of rulings obtained in other earlier spent-fuel cases. Ameren 22
Missouri was required to document its damages claim by August 31, 2010. Ameren Missouri 23
had several discussions with the U.S. Department of Justice (“DOJ”), which represents the DOE 24
in spent-fuel litigation, and Ameren Missouri obtained a very good understanding of the terms on 25
which the DOJ would be willing to settle individual cases. The spent-fuel settlement would 26
cover both past and future damages. Essentially, by settling with DOJ, the settling utilities’ past 27
costs are paid by the government when the settlement agreement is signed, and the agreement 28
establishes an administrative claims process pursuant to which the utility may submit claims for 29
ongoing damages annually, for evaluation and payment outside the judicial process. 30
Page 85
In June 2011, Ameren Missouri entered into a settlement agreement that provides for 1
recovery for its re-racking expenditures in 1999 and other related costs as well as all annual 2
recovery of additional spent-fuel storage and related costs incurred from 2010 through 2013, 3
with the ability to extend the recovery period as mutually agreed to by the parties. The parties 4
have agreed in principle to extend the recovery period through 2016. 5
To date, Ameren Missouri has received the following reimbursements: 6
July 2011 $ 10,551,468 7
October 2012 $ 818,692 8
November 2013 $ 6,227,978 9
The July 2011 reimbursement was for re-racking that was completed in 1999, O&M expenses 10
incurred in years prior to 2011, and costs incurred on the new dry cask storage project. For the 11
portion of the settlement received for the re-racking project, Ameren Missouri reduced the 12
plant-in-service and depreciation reserve balances for the applicable plant-in-service accounts by 13
the amount of the proceeds. The prior year O&M reimbursement was recorded below-the-line as 14
miscellaneous non-operating revenue and the reimbursement for the costs incurred on the new 15
dry cask storage project were recorded as a reduction to the Construction Work in Progress 16
balance at that time for that item. The reimbursements received in 2012 and 2013 were related to 17
the new dry cask storage project and Construction Work in Progress was reduced for these 18
reimbursements. 19
The following summarizes how the Company recorded these transactions on their books: 20
Debt (DR) Credit (CR) 21
July 2011 22 DR Acct 131 Cash 9,117,418 23 CR Acct 322 Reactor Plant in Service (9,117,418) 24 25 DR Acct 322 Reactor Plant (Reserve) 2,522, 188 26 CR Acct 403 Depreciation Expense (2,522,188) 27 28 DR Acct 131 Cash 1,360,156 29 CR Acct 421 Miscellaneous Non-Operating Revenue 30 31 (Reimbursement of O&M) (1,360,156) 32 33 DR Acct 131 Cash 73,894 34 CR CWIP (73,894) 35 36

Page 86
October 2012 1 DR Acct 131 Cash 818,692 2 CR CWIP (818,692) 3 4 November 2013 5 DR Acct 131 Cash 6,227,978 6 CR CWIP (6,227,978) 7
Staff does not agree with the Company’s treatment of the $1.36 million of reimbursements it 8
received in July 2011 that related to a reimbursement of prior period O&M costs. By recording 9
the $1.4 million as miscellaneous non-utility operating revenue in a below-the-line account, 10
Ameren Missouri pocketed the refund and made no attempt to return any of these proceeds to the 11
ratepayers that funded these O&M activities. Based upon advice from counsel, attempting to 12
recover this cost during this rate case would constitute retroactive ratemaking, thus Staff does not 13
propose an adjustment. However, Staff recommends that the Commission order the Company to 14
return all future refunds that stem from settlements that Ameren Missouri has reached with DOE 15
to ratepayers Staff believes without such protection from the Commission that unjust and 16
unreasonable rates would result. Staff does agree with the Company’s treatment of the 17
remainder of the settlement in amounts received during 2011. Staff also agrees with the 18
Company with regard to the 2012 and 2013 settlements since the investment costs of the dry cask 19
project will not be charged to ratepayers. 20
In March 2014, Ameren Missouri submitted additional costs to the DOE for 21
reimbursement under the settlement agreement. Ameren Missouri expects to receive a cost 22
reimbursement of approximately $14.9 million during the fourth quarter of 2014 from this 23
submission. Included in these reimbursements are costs related to a dry spent-fuel storage 24
facility Ameren Missouri is constructing at its Callaway Energy Center. Ameren Missouri 25
intends to begin transferring spent-fuel assemblies to this dry spent-fuel storage facility in 2015. 26
Until the facility is completed, Ameren Missouri will apply for reimbursement from the DOE for 27
the cost to construct the dry spent-fuel storage facility along with related allowable costs. 28
Ameren Missouri has indicated that it intends to record these reimbursements in the same way 29
that the reimbursements that were received in 2012 and 2013 were recorded on the Company’s 30
books. Staff intends to monitor this settlement in order to ensure that ratepayers are made whole 31
for the proceeds that are returned to Ameren Missouri. 32

Page 87
In January 2013, the DOE issued its plan for the management and disposal of spent 1
nuclear fuel. The DOE's plan calls for a pilot interim storage facility to begin operation with an 2
initial focus on accepting spent nuclear fuel from shutdown reactor sites by 2021. By 2025, a 3
larger interim storage facility would be available, co-located with the pilot facility. The plan also 4
proposes to site a permanent geological repository by 2026, to characterize the site and to design 5
and to license the repository by 2042, and to begin operation by 2048. 6
Staff Expert/Witness: Lisa M. Ferguson 7
c. Natural Gas Cost 8
i. Variable Natural Gas Cost 9
Staff analyzed natural gas prices over a three-year period ending in July 31, 2014, using 10
data provided in response to Staff Data Request No. 0089 and data submitted by Ameren 11
Missouri as per the 4 CSR 240-3.190 Reporting Requirements for Electric Utilities and Rural 12
Electric Cooperatives rule. Staff calculated the average system price per month using the three 13
years of monthly data ending July 31, 2014. Staff calculated the three-year average natural gas 14
price by month and used these three-year averages for inputs to the fuel model. Staff will 15
continue to review natural gas prices through the true-up period ending December 31, 2014, and 16
will make adjustments as necessary. 17
Staff Expert/Witness: Erin L. Maloney 18
ii. Fixed Natural Gas Cost 19
Staff has included the fixed demand cost of gas for the twelve months ending 20
September 30, 2014, in its recommended revenue requirement. This amount must be added to 21
Staff’s production cost model results, which are based on only the variable commodity cost of 22
gas in order to determine total net fuel and purchased-power expense. Staff will also examine 23
this cost through the true-up cut-off date in this case. 24
Staff Expert/Witness: Lisa M. Ferguson 25
d. Fuel Oil Prices 26
Fuel oil plays a very small part in the total fuel costs of Ameren Missouri. It is mainly 27
used for start-up and auxiliary purposes at the generating stations. The fuel oil price 28
recommended by Staff was calculated from the monthly average fuel oil prices Ameren Missouri 29

Page 88
provided in response to Staff Data Request No. 0073 for the three-year period ending July 31, 1
2014. A single fuel oil price was used in the production cost model. Staff will continue to 2
review fuel oil prices through the true-up period ending December 31, 2014, and will make 3
adjustments as necessary. 4
Staff Expert/Witness: Erin L. Maloney 5
e. Maryland Heights Renewable Center Fuel Cost 6
Ameren Missouri originally entered into an agreement in May 2009, updated in 7
September 2014, with Fred Weber, Inc., to install combustion turbines capable of generating 8
electricity by burning methane gas captured from Fred Weber, Inc.’s solid waste landfill at 9
Maryland Heights, Missouri. In December 2010, IESI MO Champ Landfill, LLC acquired the 10
Fred Weber Sanitary Landfill. The Maryland Heights Renewable Energy Center project 11
increased the Company’s renewable energy capabilities as well as allowing it to meet in part 12
state and federal regulatory requirements to generate or procure a specified percentage of retail 13
electric sales through renewable sources. The Maryland Heights Renewable Energy facility 14
consists of three gas-fired combustion turbine generator units, generating enough electricity to 15
meet the demands of approximately 10,000 homes. Ameren Missouri proposes that these costs 16
be recovered through the Renewable Energy Standard (RES) Accounting Authority Order 17
(AAO) because it more appropriately represents a RES compliance cost than a fuel expense 18
normally recovered through the FAC. Staff witness John P. Cassidy will address these Maryland 19
Heights fuel costs as part of the section of Staff’s Report concerning the RES AAO in 20
Section IX. E, Subsection 20. d. below. In Staff’s fuel production cost model, the generation 21
from Maryland Heights was included in the production cost model as a “must run” generation 22
source with a normalized forced outage rate applied. However, the generation was assigned no 23
cost in the production cost model since this cost will be addressed as part of the RES AAO 24
mechanism under Staff’s recommended treatment. 25
Staff Expert/Witness: Lisa M. Ferguson 26
f. Whole Sale Market Prices 27
Staff analyzed hourly power prices for the three-year period ending September 30, 2014, 28
using day-ahead locational marginal prices (LMP) down-loaded from the MISO website 29
(https://www.misoenergy.org/Pages/Home.aspx). Average market prices were developed during 30

Page 89
each hour for this period. Staff found that the extremely cold weather that occurred in January, 1
February, and March of 2014 caused an uncharacteristic spike in market prices. These 2
uncharacteristically high prices were adjusted with the 2012 and 2013 two-year average peak and 3
off-peak prices. Staff then calculated weighted average monthly prices for each month in the 4
three-year period ending September 30, 2014, and developed peak and off-peak factors for each 5
month based on the ratio of the three-year averages to the test year monthly averages. The 6
hourly average day-ahead prices that occurred in the twelve months ending September 30, 2014, 7
were then adjusted by these monthly factors. The resulting 8,760 hourly prices were used as 8
input to the production cost model. Staff will continue to review market prices and update the 9
average market prices weighted by the actual day-ahead generation sales made by Ameren 10
Missouri through December 31, 2014, for Staff’s true-up filing. 11
Staff Expert/Witness: Erin L. Maloney 12
2. Fuel and Purchased Power Cost Modeling 13
a. Variable Costs 14
Staff estimates the variable fuel and purchased-power expense for Ameren Missouri for 15
the update period, as defined in the Rate Revenues Section IX of Staff’s Cost of Service Report, 16
ending July 31, 2014, to be $671,472,522 including off-system sales, and $719,229,153 17
excluding off-system sales. For this rate case, the model was run with and without off-system 18
sales to estimate the level of off-system sales. 19
To conduct these scenarios, Staff uses the RealTime production cost model to perform 20
an hour-by-hour chronological simulation of Ameren Missouri’s generation and power 21
purchases. Staff uses the model to determine the annual variable cost of fuel and the net 22
purchased-power energy costs and fuel consumption necessary to economically meet Ameren 23
Missouri’s hourly load requirements during the test year (as updated), within the operating 24
constraints of Ameren Missouri’s resources. These results were supplied to Staff witness 25
Lisa M. Ferguson for use in annualizing fuel expense. 26
The RealTime model operates in a chronological fashion, meeting each hour’s 27
energy demand before moving to the next hour. The model schedules generating units to 28
dispatch in a least-cost manner based upon fuel cost and purchased-power cost, while also taking 29
into account generation unit operation constraints. This model closely simulates the way a 30

Page 90
utility should dispatch its generating units and purchase power to meet the net system load in a 1
least-cost manner. 2
Model inputs calculated by Staff are: fuel prices, spot market purchased-power prices and 3
availability, hourly load requirements at transmission, and unit planned and forced outages. Staff 4
relied on Ameren Missouri responses to data requests and workpapers for factors relating to each 5
generating unit. These factors include: capacity of the unit, unit heat-rate curve, primary and 6
startup fuels, ramp-up rate, startup costs, fixed operating and maintenance expense, as well as 7
information from Ameren Missouri’s wholesale loads. Firm purchased-power contract 8
information, such as hourly energy available and prices, are also inputs to the model. 9
Staff model was benchmarked by using Ameren Missouri’s model inputs. The difference 10
between Staff’s model benchmark results and the Ameren Missouri model results, supported by 11
Mark Peters’ direct testimony, was 0.68%. 12
Ameren Missouri is currently installing a solar facility with a capacity of 5.7 megawatts 13
(“MW”). This unit is not included in Staff fuel model for this filing, but is expected to be 14
included in Staff’s true-up filing in this case once Staff determines that the unit meets its 15
declared “fully operational and used for service” requirements. 16
Staff Expert/Witness: Shawn E. Lange 17
b. Planned and Forced Outages 18
Planned and forced outages are infrequent in occurrence and variable in duration. In 19
order to capture this variability, the Ameren Missouri generating unit outages were normalized 20
by averaging six years (2008 through July 2014) of actual values taken from data Ameren 21
Missouri supplied to comply with 4 CSR 240-3.190. 22
Staff Expert/Witness: Shawn E. Lange 23
c. Capacity Contract Prices and Energy 24
Capacity contracts are contracts for a specific amount of capacity (megawatts or “MW”) 25
and a maximum amount of hourly energy (megawatthours or “MWh”). Prices for the energy 26
from these capacity contracts are based on either a fixed contract price or the generating costs of 27
providing the energy. The capacity contract relevant to this case is the Horizon Pioneer Prairie 28
wind contract. 29
Page 91
Actual hourly contract transaction prices were obtained from the Horizon Pioneer Prairie 1
contract provided by Ameren Missouri. The hourly energy was developed by averaging the 2
actual hourly energy from 2010 through July 2014 from data Ameren Missouri supplied to 3
comply with 4 CSR 240-3.190, Reporting Requirements for Electric Utilities and Rural 4
Cooperatives. 5
Staff Expert/Witness: Shawn E. Lange 6
d. Normalization of Hourly Load Requirements at Transmission 7
Hourly net system load is the hourly electric supply necessary to meet the energy hourly 8
demands of both the company’s customers and the company’s own internal needs. It is net of 9
(i.e., does not include) station use, which is the electricity requirement of the company’s 10
generating plants. 11
Due to the presence of air conditioning and the presence of significant electric space 12
heating in Ameren Missouri’s service territory, the magnitude and shape of Ameren Missouri’s 13
net system input is directly related to daily temperatures. Actual and normal daily temperatures 14
provided by Staff witness Seoung Joun Won were used in the analysis. The actual daily 15
temperatures for the modified year period differed from normal daily temperatures. Therefore, 16
to reflect normal weather, daily peak and average net system loads are each adjusted 17
independently, but using the same methodology. 18
Daily average load is the daily energy divided by twenty-four hours and the daily peak is 19
the maximum hourly load for the day. Separate regression models are used to estimate both a 20
base component, which is allowed to fluctuate across time, and a weather- sensitive component, 21
which measures the response to daily fluctuations in weather for daily average loads and peak 22
loads. Independent regression models are necessary because daily average loads respond 23
differently to weather than peak loads do. The model’s regression parameters, along with the 24
difference between normal and actual cooling and heating measures, are used to calculate 25
weather adjustments to both the average and peak loads for each day. The adjustments for each 26
day are added respectively to the actual average and to the peak loads of each day. The starting 27
point for allocating the weather-normalized daily peak and average loads to the hours is the 28
actual hourly loads for the year being normalized. A unitized load curve is calculated for each 29
day as a function of the actual peak and average loads for that day. The corresponding weather-30

Page 92
normalized daily peak and average loads, along with the unitized load curves, are used to 1
calculate weather-normalized hourly loads for each hour of the year. 2
This process includes many checks and balances, which are included in the spreadsheets 3
that are used by Staff. In addition, the analyst is required to examine the data at several points in 4
the process. For more information, the process is described in greater detail in the document 5
“Weather Normalization of Electric Loads, Part A: Hourly Net System Loads.”53 6
After weather normalizing and annualizing usage for Ameren Missouri’s retail customer 7
classes is completed, producing an annual sum of the hourly net system loads that equals the 8
adjusted test year usage, plus losses, is consistent with Staff’s normalized revenues. 9
A factor was applied to each hour of the weather-normalized loads to produce an annual 10
sum of the hourly load requirements at transmission that equals the usage, plus losses, and is 11
consistent with normalized revenues. Once completed, the hourly normalized system loads were 12
used in developing fuel and purchased-power expense. Staff witness Alan J. Bax also used 13
the annual requirement of the net system load in developing Staff’s jurisdictional 14
energy allocator. 15
Staff Expert/Witness: Shawn E. Lange 16
i. System Energy Losses 17
In the MISO market, Ameren Missouri “bids” its load into the associated market at the 18
transmission level, rather than the generation level. Hence, transmission losses are not accounted 19
for when Ameren Missouri bids its loads into the MISO market. In order to model fuel and 20
purchased power costs appropriately, hourly loads utilized in the fuel models used to estimate 21
fuel and purchased-power expense need to be determined at the transmission level rather than at 22
the generation level, identified as the Load Requirement at Transmission (“LRT”). The LRT 23
needs to include the customers’ energy requirements and associated primary and secondary 24
losses (“System Energy Losses”). 25
The basis for calculating energy losses is that LRT equals the sum of Total Sales and 26
System Energy Losses. This can be expressed mathematically as: 27
LRT = Total Sales + System Energy Losses 28
53 Weather Normalization of Electric Loads, Part A: Hourly Net System Loads” (November 28, 1990), written by Dr. Michael Proctor, Manager of the Economic Analysis Department.

Page 93
LRT and Total Sales are known, measured values. System Energy Losses (at the transmission 1
level) are not metered values and may be calculated as follows: 2
System Energy Losses = LRT – Total Sales 3
The System Energy Loss percentage is the ratio of the System Energy Losses at the transmission 4
level to LRT multiplied by 100: 5
System Energy Loss Percentage = (System Energy Losses ÷ LRT) X 100 6
LRT is also equal to the sum of Ameren Missouri’s net generation and net interchange, 7
considered at the transmission level. Net interchange is the difference between off-system 8
purchases and sales. Net generation is the total energy output of each generating plant minus the 9
energy consumed internally to enable its production of electricity at each plant. The output of 10
each generation plant is monitored continuously, as is the net of off-system purchases and sales. 11
Staff calculated a loss percentage of 4.58% of LRT for the twelve-month period ending 12
July 2014. Staff witness Seoung Joun Won used Staff’s calculated loss percentage in the 13
development of hourly loads for Staff’s fuel model. 14
Staff Expert/Witness: Alan J. Bax 15
ii. Solar Load Adjustment 16
There were an unusual amount of solar panel installations within the test year and update 17
period that could affect projections of Ameren Missouri’s load. The rebate on solar installations 18
was $2.00 per watt for applications received before December 31, 2013, and installed before 19
June 30, 2014. Applications received after December 31, 2013, or installations completed after 20
June 30, 2014, would receive a rebate of $1.50 per watt, a 25% reduction.54 The reduction in 21
incentive had a noticeable effect on the amount of solar installations in late July and early August 22
of 2014, as can be seen in Figure 5. Staff expects that future rate cases are unlikely to have such 23
a large amount of solar installations in the test year because of the reduction in solar panel 24
installations due to the incentive reduction and other factors such as the cap on payments. 25
However, for the current case, Staff has included an adjustment to account for the reduction in 26
load due to solar installations. 27
54 The solar rebates also decrease for applications received after December 31, 2014, and installation after June 30, 2015, and for each subsequent year. See Ameren Missouri’s tariff sheet number 88.2 for further details.


Page 95
which has the required equipment to transport the processed limestone to the Sioux facility. 1
There are many variables within each contract including surcharges for different items. Since 2
the last case, additional historical data is available, as well as additional data regarding the SO2 3
removal rate achieved with the scrubbers. Currently, the existing removal rate varies based on 4
numerous variables, but is generally at 92% based on current conditions and regulations. 5
However, in the future, the Company may need to increase the removal rate should the Cross-6
State Air Pollution Rule (CSAPR) go into effect. Currently CSAPR, which provides for 7
reductions in emissions of pollutants, such as SO2 and was scheduled to take effect January 1, 8
2012, has been stayed by the United States Court of Appeals pending judicial review. Staff 9
made adjustments to include only the estimated amount of limestone which would be required to 10
achieve an average of 92% SO2 removal rate at the current terms of the contracts to provide the 11
limestone. As a result, Staff is recommending the test year level for limestone expense of 12
$2,763,736. Staff will reexamine this issue as part of its true-up analysis to determine if any 13
changes to Staff’s adjustment are warranted. 14
Staff Expert/Witness: Lisa M. Ferguson 15
b. Fuel Additive – Activated Carbon 16
In order for the Company to comply with mercury emission limits established by the 17
EPA’s Mercury and Air Toxics Standards (“MATS”), powdered activated carbon is used at 18
Ameren Missouri’s generating units to reduce mercury emissions. The activated carbon is 19
processed, or “activated,” to produce carbon particles with high porosity and surface area. The 20
activated carbon is injected into the flue gas and the flue gas absorbs the activated carbon, and 21
then that activated carbon is captured in electrostatic precipitators. The Sioux generating station 22
has an alternative design that injects the activated carbon in slurry form into SO2 absorber 23
vessels. When the activated carbon is recirculated in the absorbers, the required mercury 24
emission reduction is achieved with significantly less activated carbon due to the SO2 scrubbers 25
installed at that plant compared to the amount of activated carbon that would be necessary at 26
plants that do not have scrubbers installed. The Rush Island and Sioux Energy Centers are the 27
first of Ameren Missouri’s coal generation plants that must meet emission limits established by 28
the MATS rule. Both Rush Island and Sioux are required to meet mercury emissions limits by 29
April 16, 2015, and will begin injecting activated carbon in December 2014 in preparation for 30
meeting the MATS requirements. The Meramec Generating Station and Labadie Energy Center 31
Page 96
have received an extension, but are required to meet mercury emissions limits by April 2016. 1
Activated carbon at Meramec and Labadie is expected to start in the late 2015/early 2016 2
timeframe. Currently, testing of multiple activated carbons from several vendors has been 3
performed at Rush Island in order to complete performance testing on recently installed 4
Activated Carbon Injection (ACI) equipment and also to evaluate the mercury capture efficiency 5
of multiple activated carbons. Testing began at Rush Island in July 2014 and all activated carbon 6
that has been consumed thus far has been for testing purposes. Once the testing is complete, the 7
performance of each type of carbon will be evaluated. A short list of potential suppliers will be 8
compiled and negotiations to procure and transport the carbon to Rush Island will begin. Each of 9
the two ACI units at Rush Island has a silo designed to hold approximately 125 tons of activated 10
carbon. When in operation, the inventory level is expected to be maintained between 20 and 11
125 tons per ACI system. 12
The annual quantities consumed at each energy center are highly dependent on which 13
activated carbon is used, which has yet to be decided. Due to this uncertainty, Staff is unable to 14
determine an ongoing expense level for activated carbon at the time of direct filing. An official 15
vendor will be chosen by Ameren Missouri by December 31, 2014, and supplier and delivery 16
contracts finalized in January 2015. Staff will continue to review and evaluate an appropriate 17
allowance for this cost through the December 31, 2014, true-up period in this case. 18
Staff Expert/Witness: Lisa M. Ferguson 19
D. Payroll and Benefits 20
1. Payroll 21
Staff’s annualized payroll expense was based upon the test year ending March 31, 22
2014, and was adjusted for (a) increases in wage rates, (b) changes in employee levels at the 23
end of September 30, 2014 compared to the test year average, and (c) ** 24
25
**. 26
Subsequent to performing the annualization, Staff distributed its adjustment for payroll 27
expense on a pro rata basis by account according to Ameren Missouri’s actual payroll 28
distribution for the twelve months ended March 31, 2014. Staff made an additional adjustment to 29
normalize the overtime expenses associated with Callaway nuclear facility refuelings which 30
NP
________________________________________________________________________________________________
Page 97
occur periodically every 18 months. This adjustment was also allocated to individual accounts on 1
a pro rata basis. 2
** 3
4
5
6
7
8
9
10
11
12
13
14
** 15
As part of its true-up audit, Staff will exchange the current Callaway refueling adjustment 16
amount which is based on budgeted overtime, with one based on the actual overtime amount 17
resultant of Callaway Refuel 20 which occurred during October and November 2014, once the 18
final amounts are known. Staff will also continue to analyze employee levels and actual salary 19
data, as the true-up information becomes available. Finally, as mentioned in testimony by Staff 20
witness Lisa K. Hanneken (see Section VIII above), Staff will continue to analyze AMS 21
employee positions which are allocated to Ameren Missouri. 22
Staff Expert/Witness: Brian Wells 23
2. Payroll Taxes 24
Staff’s annualization of payroll taxes reflects a decrease in the overall level of Federal 25
Insurance Contributions Act (FICA) Old Age Survivors and Disability Insurance (OASDI), 26
FICA Medicare, Federal Unemployment Tax Act (FUTA), and State Unemployment Tax Act 27
(SUTA) payroll taxes. This decrease in payroll tax is driven by overtime costs associated with 28
Callaway refueling and by Ameren Services expense allocated to Ameren Missouri, as well as 29
Staff’s disallowance of payroll taxes paid on long-term and short-term incentive compensation. 30
NP
________________________________________________________________________________________________________________________________________________________________________________________________________________________________________________________________________________________________________________________________________________________________________________________________________________________________________________________________________________________________________________________________________________________________________________________________________________________________________________________________________________________________________________________________________________________________________________________________

Page 98
As part of its true-up audit, Staff will continue to analyze company employee level and other 1
factors to determine an ongoing level of payroll tax expense. 2
Staff Expert/Witness: Brian Wells 3
3. Accounting Standards Codification (ASC) 715-30 (formerly FAS 87) 4 Pension Costs 5
a. Accounting Standards Codification 715-30 Pension Tracker 6
Staff, Ameren Missouri, and other parties entered into a Stipulation and Agreement 7
(“the 2007 Agreement") in Case No. ER-2007-0002 that addressed the ongoing ratemaking 8
treatment for annual qualified pension cost under the Financial Accounting Standards Board’s 9
(FASB) Accounting Standards Codification (ASC) Subtopic 715-30, formerly known as 10
Financial Accounting Standard No. 87 (“FAS 87”). 11
The 2007 Agreement requires Ameren Missouri to externally fund its annual pension 12
expense and track the difference between its annual funded pension expense and the level 13
included in Ameren Missouri’s rates. The difference between the annual pension cost and the 14
amount included in rates, as accumulated in the tracker, has been included in rate base and 15
amortized over a period of five years as an addition or reduction to pension expense. As 16
Ameren Missouri’s management and administrative functions are provided by Ameren Services 17
employees, all components of Ameren Missouri’s pension expense and rate base amounts 18
include costs that are allocated from Ameren Services. 19
In Ameren Missouri’s last rate case, No. ER-2012-0166, the parties agreed to combine all 20
of the prior pension tracker differences established in Case Nos. ER-2008-0318, ER-2010-0316, 21
and ER-2011-0028 into one combined amount for purposes of amortization. Consistent with the 22
2007 Agreement and subsequent stipulations in Ameren Missouri rate cases, Staff is proposing to 23
reflect pension tracker amounts in rate base as follows: (1) rate base will be reduced by 24
($4,359,589), which represents a regulatory liability resulting from the over-collection in rates of 25
pension expense as compared to the actual expense and funding incurred in this current rate case 26
from August 1, 2012, through September 30, 2014; (2) rate base will be increased by $8,859,443, 27
which represents an estimated unamortized regulatory asset at the true-up cut-off date of 28
December 31, 2014, for the cumulative pension tracker established in Case No. ER-2012-0166. 29
Staff Expert/Witness: Kofi Agyenim Boateng 30

Page 99
b. Annualization 1
Staff adjusted test year qualified pension expense to reflect the Plan Year 2014 expense 2
for FASB ASC Subtopic 715-30 provided by the actuarial firm of Towers Watson55 for Ameren 3
Missouri’s qualified pension plan. Staff used this amount to determine the adjustment necessary 4
to ensure the amount collected in rates is sufficient to recover the estimated pension expense 5
provided by Towers Watson. This is the base expense level that will be utilized in the pension 6
tracker, after rates are established in this case, to determine the difference between pension 7
expense included in rates and the amount actually incurred and funded by Ameren Missouri on 8
an ongoing basis for qualified pension expense. In this proceeding, Staff is proposing to decrease 9
test year expense by an amount of $12,238,436, due to declining pension costs. Additionally, 10
Staff is proposing (1) an adjustment of $11,464 to increase pension amortization expense in 11
respect to the combined pension tracker difference established in Case No. ER-2012-0166, and 12
(2) an adjustment of ($871,918), which represents the annualized amortization related to the 13
current pension tracker in effect since Ameren Missouri’s last rate case. 14
Staff Expert/Witness: Kofi Agyenim Boateng 15
4. Accounting Standards Codification (ASC) 715-60 (formerly FAS 106) 16 Other Post Retirement Benefit Costs (OPEBs) 17
a. Accounting Standards Codification 715-60 OPEBs Tracker 18
The 2007 Agreement also addresses the ratemaking treatment for annual OPEBs 19
cost under the FASB’s ASC Subtopic 715-60, formerly known as Financial Accounting Standard 20
No. 106 (“FAS 106”). As with pension expense, the 2007 Agreement requires Ameren Missouri 21
to externally fund the annual OPEB expense and establish a tracker. The difference between the 22
annual OPEB expense funded by Ameren Missouri and the amount of OPEBs expense included 23
in rates, as accumulated in the tracker, has been included in rate base and amortized over a 24
period of five years as an addition or reduction to OPEBs expense. 25
As with the pension tracker, the parties agreed to combine all prior OPEBs tracker 26
differences established in Case Nos. ER-2008-0318, ER-2010-0036, and ER-2011-0028 into 27
55 Data provided to Staff during a meeting with Ameren Missouri and Towers Watson on October 15, 2014. Also, see Ameren Missouri’s response to Data Request No. 0365.
Page 100
one combined amount in Case No. ER-2012-0166 for purposes of amortization. Consistent 1
with the 2007 Agreement and similar stipulations agreed to in subsequent Ameren Missouri 2
rate cases, Staff is proposing to reflect the differences in rate base as follows: (1) rate base 3
will be reduced by ($5,621,319), which represents a regulatory liability resulting from the 4
over-collection in rates of OPEBs expense as compared to the actual expense and funding 5
incurred in this current rate case from August 1, 2012, through September 30, 2014; (2) rate base 6
will be reduced by ($20,234,885), which represents an estimated unamortized regulatory liability 7
at the true-up cut-off date of December 31, 2014, for the cumulative OPEBs tracker established 8
in Case No. ER-2012-0166. 9
Staff Expert/Witness: Kofi Agyenim Boateng 10
b. Annualization 11
Staff adjusted test year OPEBs expense to reflect the Plan Year 2014 expense for FASB 12
ASC Subtopic 715-60 provided by the actuarial firm of Towers Watson for Ameren Missouri’s 13
post-retirement benefit plan. Staff used this estimated amount to determine the adjustment 14
necessary to ensure the amount collected in rates is sufficient to recover the estimated OPEBs 15
expense provided by Towers Watson. In this proceeding, Staff is proposing to decrease the 16
amount currently collected in rates by an amount of $5,546,799. This reduction reflects a decline 17
in OPEB costs. 18
In addition, Staff is proposing (1) an adjustment of $1,765,624 to increase OPEB 19
amortization expense in respect to the combined OPEB tracker difference established in 20
Case No. ER-2012-0166, and (2) an adjustment of ($1,124,264), which represents the annualized 21
amortization related to the current OPEBs tracker in effect since Ameren Missouri’s last rate 22
case. 23
Staff Expert/Witness: Kofi Agyenim Boateng 24
5. Non-Qualified Pensions Expense 25
In addition to offering qualified pension plan benefits to all of its employees, Ameren 26
Missouri also has a non-qualified pension plan called the Ameren Supplemental Retirement Plan. 27
This plan is designed to attract, retain and motivate selected executives. Ameren Missouri states 28
that the non-qualified plan is unfunded and that the plan benefit payments are made on a monthly 29

Page 101
disbursement basis. Since this plan is not funded, Staff reviewed and determined that a three-year 1
average of the actual payments made to former employees during the calendar years of 2011 2
through 2013 was reasonable as an expense for this retirement program for inclusion in the cost 3
of service. 4
Staff Expert/Witness: Kofi Agyenim Boateng 5
6. Other Employee Benefits 6
Ameren Missouri generally offers a number of benefits to its employees including 7
medical, dental, vision, 401-K and long-term disability benefits. Staff has reflected benefit costs 8
for the twelve months ended September 30, 2014 in its calculation of cost of service. As part of 9
its true-up audit, Staff will continue to analyze employee levels and actual benefit cost data 10
through January 1, 2015, as information becomes available. 11
Staff Expert/Witness: Brian Wells 12
7. Incentive Compensation 13
** 14
15
16
17
18
19
** 20
The criteria Staff uses to evaluate employee incentive plans were established in the 21
Commission’s Report and Order for In re Union Electric Co., Case No. EC-87-114: “At a 22
minimum, an acceptable management performance plan should contain goals that improve 23
existing performance, and the benefits of the plan should be ascertainable and reasonably related 24
to the plan.” 29 Mo. P.S.C. (N.S.) 313, 325 (1987). In the Commission’s Report and Order in 25
In re Kansas City Power & Light Company, Case No. ER-2006-0314, the Commission noted on 26
page 58 that, among other things, “because maximizing EPS could compromise service to 27
ratepayers, such as by reducing customer service or tree-trimming costs, the ratepayers should 28
NP
________________________________________________________________________________________________________________________________________________________________________________________________________________________________________________________________________________________________________________________________________________________________________________________________________________

Page 102
not have to bear that expense.” Thus, Staff recommends the disallowance of any incentive 1
compensation based on earning per share (EPS) performance. 2
a. Short-Term Incentive Compensation 3
** 4
5
6
7
8
9
10
11
12
13
14
15
16
17
18
19
20
21
22
23
24
25
26
27
28
29
30
31
NP
____________________________________________________________________________________________________________________________________________________________________________________________________________________________________________________________________________________________________________________________________________________________________________________________________________________________________
______________________________________________________________________________________________________________________________________________________________________________________________________________________________________________________________________________________________________________________________________________________________________________________________________________________________________________________________________________________________________________________________________________________________________________________________________________________________________________________________________________________________________________________________________________________________
__________________________________________________________________________________________________________________________________________________________________________________________________________________________________________________________________________________________________________________________________________________________________________________________________________________________________________________________________________________________________________________________________________________________________________________________
Page 103
1
. 2
3
4
5
6
7
8
9
10
11
12
13
14
15
16
17
18
19
20
21
22
23
24
25
26
27
28
29
30
31
NP
__________________________________________________________________________________________
________________________________________________________________________________________________________________________________________________________________________________________________________________________________________________________________________________________________________________________________________________________________________________________________________________________________________________________________________________________________________________________________________________________________________________________________________________________________________________________________________________________________________________________________________________________________________
______________________________________________________________________________________________________________________________________________________________________________________________________________________________________________________________________________________________________________________________________________________________________________________________________________________________________________________________
______________________________________________________________________________________________________________________________________________________________________________________________________________________________________________________________________________________________________________________________________________________________________________________________________________________________________________________________________________________________________________________________________________________________________________________________
Page 104
1
2
3
4
5
6
** 7
b. Long Term Incentive Compensation 8
** 9
10
11
12
13
14
15
** 16
c. Exceptional Performance Bonus (EPB) 17
** 18
19
20
21
22
** 23
Staff’s adjustments for the disallowed portions of incentive compensation include 24
calculations to remove capitalized incentive compensation from rate base. The adjustments to 25
Plant in Service and Accumulated Reserve remove any incentive compensation that has been 26
capitalized from 2002 through estimated December 2014. This adjustment will be updated as a 27
part of the true-up audit with actual capitalized incentive compensation that is booked through 28
December 31, 2014 (the end of the true-up period for this rate case proceeding). 29
Staff Expert/Witness: Sarah Sharpe 30
NP
______________________________________________________________________________________
__________________________________________________________________________________________________________________________________________________________________________________________________________________________________________________________________________________________
__________________________________________________________________________________________________________________________________________________________________________________________________________________________________________________________________________________________________________________________________________________________________________________________________________________________________________________________________________________________
________________________________________________________________________________________________________________________________________________________________________________________________________________________________________________________________________________________________________________________________________________________________________________

Page 105
E. Other Expenses 1
1. Rate Case Expenses 2
Staff’s analysis of rate case expense included a review of the actual amounts spent by 3
Ameren Missouri in previous rate cases and a comparison to the estimated expenses for the 4
current case. As a result, Staff has determined that an appropriate total amount of rate case 5
expense to be included with Staff’s direct filing to be $1,104,706 normalized over 18 months, 6
which results in an annual amount of $796,530. Staff proposes this adjustment with the intention 7
of updating Ameren’s total rate case expense throughout the remainder of this case’s proceedings 8
through and up to two weeks after the filing of reply/true-up briefs in this case. 9
Staff’s normalization period of 18 months is supported ** 10
11
12
13
14
** 15
In addition, Staff reviewed the costs related to work performed by an outside consultant 16
with regard to how Ameren Services allocates costs to Ameren Missouri and to affiliates of 17
Ameren Missouri. Staff has learned through data requests that the Company does not intend to 18
repeat this study in the near future, therefore, Staff has normalized this study over a five-year 19
period and included this normalized amount in the cost of service calculation. 20
Although Staff did not specifically recommend disallowance of consulting costs for 21
performing a CWC lead lag study in Ameren Missouri’s previous rate case, ER-2012-0166, Staff 22
continues to have concerns about Ameren Missouri’s continued reliance upon an outside 23
consultant to perform CWC-related analysis for every rate case. No other large utility has 24
consistently relied upon a consultant to handle CWC issues in rate proceedings before this 25
Commission. Staff has raised this concern in previous rate proceedings such as ER-2010-0036 26
and ER-2011-0028 (please refer to Staff witness Lisa M. Ferguson’s surrebuttal testimony in 27
each case), which asserted that this type of work can be performed in-house by Ameren 28
Missouri. Staff recommends that the Commission disallow all CWC consulting costs in this rate 29
proceeding. These costs should not be considered for recovery in rates in this proceeding because 30
Ameren Missouri already possesses the regulatory experience, knowledge, and resources to 31
NP
__________________________________________________________________________________________________________________________________________________________________________________________________________________________________________________________________________________________________________________________________________
Page 106
handle this entry level accounting issue in-house without the continuous assistance of an outside 1
consultant. 2
The nature of incurring rate case expense in a regulatory proceeding is different from 3
other expenses, as the full expenses related to a rate case filing are not fully known until past the 4
scope of Staff’s discovery periods. While Staff’s direct filing adjustment includes estimated 5
numbers as supplied by Ameren Missouri, Staff will review documentation of expenses incurred 6
through and up to two weeks after the filing of reply/true-up briefs of this case. Staff requests 7
that Ameren Missouri provide all 2014 rate case proceeding documentation as data is available 8
with a final cut-off date to provide such documentation of April 24, 2015, which would allow 9
Ameren Missouri two weeks to gather the final costs incurred. Staff will require a reasonable 10
amount of time to review all provided expenses and documentation and, as soon as practical after 11
receiving such data, intends to update the normalized rate case expense amount to include only 12
Ameren Missouri’s actual incurred expenses. 13
In September 2013, Staff filed a report in Case No. AW-2011-0330 concerning the topic 14
of rate recovery of rate case expense. Within that report, Staff examined recent trends in 15
incurred rate case expense by major Missouri utilities, and discussed several possible options for 16
allocation of rate case expense responsibility between the utility’s shareholders and its 17
customers. In this case, Staff is recommending that Ameren Missouri’s rate case expenses be 18
treated in the traditional manner; that is, the Company should be allowed an opportunity to 19
recover in rates the full amount of reasonable and prudent rate case expenses through an expense 20
normalization approach. However, Staff will continue to monitor the rate case expenses incurred 21
Ameren Missouri and other Missouri utilities in current and future rate proceedings, and Staff 22
reserves the right to propose “sharing” or another appropriate alternative approach to rate 23
recovery of this item in future cases, if appropriate. 24
Staff Expert/Witness: Sarah Sharpe 25
2. Dues and Donations 26
Staff reviewed the list of membership dues paid and donations made to various 27
organizations that were charged to its utility accounts by Ameren Missouri during the test year. 28
Staff is recommending the disallowance of various amounts of dues and donations that were 29
included by Ameren Missouri in its test year expenses. Staff disallowed these dues and 30

Page 107
donations because they were not necessary for the provision of safe and adequate service and 1
thus provide no direct benefits to ratepayers. Allowing the recovery of these expenses by 2
Ameren Missouri through rates causes the ratepayers to involuntarily contribute to these 3
organizations. Examples of items disallowed by Staff are amounts paid to Civic Progress and the 4
Partnership for Downtown St. Louis. 5
In Re: Missouri Public Service, a Division of UtiliCorp United, Inc., Case No. 6
ER-97-394, et al., Report an Order, 7 Mo.P.S.C.3d 178, 212 (1998), the Commission stated: 7
The Commission has traditionally disallowed donations such as these. 8 The Commission finds nothing in the record to indicate any discernible 9 ratepayer benefit results from the payment of these donations. The 10 Commission agrees with Staff in that membership in the various 11 organizations involved in this issue is not necessary for the provision of 12 safe and adequate service to the MPS ratepayers. 13
In addition to the above disallowances, Staff removed all costs related to lobbying that were 14
included in the membership dues to the various organizations as well as dues related to the 15
Edison Electric Institute (EEI); these items are discussed further detail in the following 16
paragraphs. 17
Staff Expert/Witness: Jason Kunst 18
3. Lobbying 19
As part of its analysis of dues, Staff determined that some of the organizations use a 20
percentage of member payments to fund government affairs or lobbying activities. Staff 21
traditionally disallows the cost of these actives and therefore has removed the associated 22
amounts from Ameren Missouri’s test year expense level. 23
Staff Expert/Witness: Jason Kunst 24
4. Edison Electric Institute (EEI) Dues 25
According to the information obtained from EEI’s website (www.eei.org), EEI is an 26
association that represents investor-owned electric utilities and their industrial affiliates. The 27
information reviewed by Staff related to EEI clearly shows that part of EEI’s function is to 28
represent the electric utility industry in legislative and regulatory matters before federal, state, 29
and local government entities. By necessity, this role includes engagement in lobbying activities 30
by EEI. 31

Page 108
In Case No. ER-83-49, In the Matter of Kansas City Power & Light Co., 26 Mo. P.S.C. 1
(N.S.) 233 (Aug. 30, 1983), the Commission stated its position respecting EEI dues: 2
In the Company’s late rate case, ER-82-66, the Commission reiterated its 3 position that while there may be some possible benefit to the Company’s 4 ratepayers from the Company’s membership in EEI, the dues would be 5 excluded as an expense until the Company could better quantify the 6 benefit accruing to the both Company’s ratepayers and shareholders. 7
The Commission has re-affirmed Staff’s position in subsequent rate proceedings. 8
In Re: Kanas City Power & Light Co., Case Nos. EO-85-185 et al., Report and Order, 9
28 Mo.P.S.C. (N.S.) 228, 259 (1986), the Commission stated: 10
The argument that allocation is not necessary if the benefits lessen the cost 11 of service to the ratepayers by more than the cost of the dues, misses the 12 point. 13
It is not determinative that the quantification of benefits to the ratepayer is 14 greater that the EEI dues themselves. The determining factor is what 15 proportion of those benefits should be allocated to the ratepayer as 16 opposed to the shareholder. It is obvious that the interests of the electric 17 industry are not consistently the same as those of the ratepayers. The 18 ratepayers should not be required to pay the entire amount of the EEI dues 19 if there is benefit accruing to the shareholders from the EEI membership 20 as well. The Commission finds this to be the case. The Company has 21 been informed in prior rate cases that it must allocate its quantified 22 benefits from membership in EEI. That has not been done herein. 23 Therefore, no portion of EEI dues will be allowed in this case. 24
Based on the above guidance, Staff has disallowed the entire amount of EEI dues recorded in the 25
test year by Ameren Missouri. 26
Staff Expert/Witness: Jason Kunst 27
5. Insurance Expense 28
Ameren Missouri maintains insurance policies with various third-party insurance 29
providers for the purpose of mitigating potential risk of financial loss. Insurance coverage for 30
Ameren Missouri includes crime, nuclear property, non-nuclear property, nuclear liability, 31
terrorism, boiler and machinery, directors and officers, worker’s compensation, fiduciary, 32
marine, and cyber liability. Staff adjusted the expenses associated with each of these policies to 33
take into account the most current premium amounts in order to determine an ongoing level of 34
insurance expense. 35

Page 109
However, certain insurance contracts which went into effect after August 31, 2014, were 1
not made available to Staff for review at the time of this direct testimony filing. Staff will review 2
all insurance contracts that went into effect subsequent to August 31, 2014, through 3
December 31, 2014, when they are available and will make any necessary changes. 4
Staff Expert/Witness: Brian Wells 5
6. Vegetation Management and Infrastructure Inspection Programs 6
Ratemaking for Ameren Missouri’s Vegetation Management and Infrastructure 7
Inspection Programs have several different aspects to be accounted for, such as the annual level 8
of expense, the tracker mechanism, and the amortizations related to prior reconciliations of the 9
tracker mechanism, each of which is explained more fully below. 10
a. Annual Expense 11
Staff adjusted the non-labor test year expense level associated with Ameren Missouri’s 12
vegetation management and infrastructure inspections programs by ($1,719,351) and $(168,254), 13
respectively, to reflect a normalized level based on a three-year average of each of these expense 14
levels at October 31, 2014. 15
Staff will re-examine the actual costs for each these programs through the end of the 16
true-up period December 31, 2014, to determine if further adjustment is necessary and/or 17
appropriate based upon updated information. 18
b. Trackers 19
As described in the Report and Order in Case No. ER-2008-0318: 20
In 2006, AmerenUE experienced extensive service outages due to severe 21 thunderstorms in the summer and ice storms in the winter. In response to 22 concerns that AmerenUE and other electric utilities had failed to properly 23 maintain their electric distribution systems, the Commission promulgated 24 new rules designed to compel Missouri’s electric utilities to do a better job 25 of maintaining their electric distribution facilities to enhance the reliability 26 of electric service to customers…. In promulgating the stricter standards, 27 the Commission anticipated utilities would have to spend more money to 28 comply. Therefore, both rules include provisions that allow the utility a 29 means to recover to the extra costs it incurs to comply with the 30 requirements of the rule. 31

Page 110
As a result, the Commission established tracker mechanisms to ensure the Ameren Missouri 1
would recover these costs, while protecting ratepayers from paying in excess of actual costs 2
incurred. 3
In Case No. ER-2012-0166, the Commission ordered a new base for the tracker for 4
vegetation management and infrastructure inspection costs in the amount of $54.1 million and 5
$6.2 million, respectively. The amounts reflected in rates were compared to the actual amount 6
incurred for the twelve-months ending September 30, 2014, to identify any over or 7
under-collection. Staff has identified a net under-collection for the period August 1, 2012, 8
through September 30, 2014, in the amount of $537,397. Staff recommends this under-collection 9
be amortized over three years consistent with Commission orders in previous cases. This net 10
under-collection amount represents a $2,155,647 under-collection for vegetation management 11
and a ($1,618,550) over-collection for infrastructure inspections. The annualized amortization 12
recommended is $718,649 and ($539,517), respectively, for a total annualized amortization of 13
$179,132. This amortization amount is further addressed in the section below. 14
In this case, Staff is recommending that the trackers related to both the Vegetation 15
Management and Infrastructure Inspection Programs be ended due to the fact that Ameren 16
Missouri has completed its cycles for each of these programs, and that the costs for these items 17
are not significantly fluctuating from year to year. 18
c. Amortizations 19
As a result of Ameren Missouri’s last rate case, Case No. ER-2012-0166, all Vegetation 20
Management and Infrastructure Inspection amortizations from that case and previous cases were 21
combined into one amount. Each combined program amortization was then amortized over a 22
three-year period ending December 2015. Staff proposes that any unamortized amount related to 23
this amortization established in Case No. ER-2012-0166 be rolled into the current amortization 24
established in this proceeding and be amortized over a three-year period so that only one tracker 25
remains. The unamortized amounts established in Case No. ER-2012-0166 at May 31, 2015, 26
is $313,322 and ($154,289) for the Vegetation Management and Infrastructure 27
Inspections Programs, respectively, or a total amount net amount of $159,033. In the current 28
case, Staff has determined that an amount of $2,155,647 for the Vegetation Management 29
Program and an amount of $(1,618,550) for the Infrastructure Inspections Program, for a net 30
total of $537,397, should be amortized. Therefore, the total to be amortized is an amount of 31

Page 111
$696,430 [$159,033 + $537,397 = $696,430] with an annual amortization in the amount of 1
$232,143. 2
Staff Expert/Witness: Lisa K. Hanneken 3
7. Maintenance Expense 4
a. Power Plant Maintenance 5
Staff has reviewed Ameren Missouri’s power plant maintenance costs through 6
September 30, 2014, and is not recommending an adjustment at this time. However, Staff has 7
requested additional data from Ameren Missouri as to the rationale for the recent decrease in 8
these costs and how the decrease may impact unplanned outages; which in turn could affect the 9
costs passed through to ratepayers in the FAC Staff will continue to look at this expense as this 10
new data becomes available. 11
Staff Expert/Witness: Lisa K. Hanneken 12
b. Distribution Maintenance 13
Staff has also reviewed Ameren Missouri’s distribution maintenance costs through 14
September 30, 2014, and is not recommending an adjustment at this time. However, Staff has 15
requested additional data from Ameren Missouri related to this issue to obtain the rationale for 16
the recent decrease in these costs and how the decrease may impact customer outages. Staff will 17
continue to look at this expense as this new data becomes available. 18
Staff Expert/Witness: Lisa K. Hanneken 19
8. Customer Deposit Interest Expense 20
See discussion in Section VII. D, Rate Base-Customer Deposits. 21
Staff Expert/Witness: Jason Kunst 22
9. Property Tax Expense 23
For property tax assessment purposes, each utility company is required to file with its 24
respective taxing authority a valuation of utility property at the beginning of each assessment 25
year, which is January 1. Several months later, based on information provided by the utility, the 26
taxing authority will in turn send the company what are known as “assessed values” for every 27

Page 112
category of the company’s property. The taxing authority will issue to the utility company a 1
property tax rate later in the year. The final step in the process is when the taxing authority 2
issues a property tax bill to the company late in each calendar year with a “due date” of 3
December 31. The billed amount of property taxes is based on the property tax rate applied to 4
the previously determined assessed values of the utility’s plant-in-service balances of January 1 5
of the same year. Staff developed the amount of property tax expense to be included in its cost- 6
of-service calculations based on Ameren Missouri’s actual taxes paid as of December 31, 2013, 7
which are based on investment as of January 1, 2013. Staff will continue to review this issue 8
through the December 31, 2014, true-up in this case in order to determine whether any further 9
adjustments to the cost of service will be necessary. 10
Staff Expert/Witness: Jason Kunst 11
a. Property Tax Refund Tracker 12
During Case No. ER-2011-0028, Ameren Missouri was in the process of appealing 13
approximately $28.9 million in property taxes that had been paid during 2010. The Report and 14
Order issued in that case required Ameren Missouri to track any refunds that were issued so that 15
a future Commission could rule on the appropriate ratemaking treatment for any refunds the 16
Company might receive. In the Report and Order for Case No. ER-2012-0166, the Commission 17
determined that Ameren Missouri was required to give back $2.9 million it had received in 18
property tax refunds to ratepayers over two years, starting with the issuance of new tariffs on 19
January 2, 2013, and ending December 2014. Staff has reviewed the Company’s books and 20
determined that entire amount of the refund has been appropriately accounted for in the two-year 21
amortization and will be fully amortized prior to new rates being established in the current rate 22
case. Therefore, Staff has excluded this amortization from its cost-of-service calculation. 23
However, while Staff’s adjustment will remove the amortization going forward, recovery 24
in rates of this amortization will continue through the date of implementation of rates in this 25
case, anticipated to be May 2015. Therefore, from January 2015 through May 2015, the 26
Company will continue to receive in rates a monthly amount of ($120,849), which will result in a 27
total benefit to customers over and above the original balance to be recovered. Therefore, 28
Staff has addressed the total of this over-collection amount of ($604,245) as part of its 29
amortization issue (see Section IX, Subsection E. 17. b. below) which is being sponsored by 30
Staff witness John P. Cassidy. 31

Page 113
Staff Expert/Witness: Jason Kunst 1
10. Uncollectible Expense 2
Uncollectible expense is the portion of retail rate revenues that Ameren Missouri is 3
unable to collect from retail customers by reason of bill non-payment. After a certain amount of 4
time has passed, delinquent customer accounts are written off by Ameren Missouri and turned 5
over to a third party collection agency for recovery. Through the efforts of a third party 6
collection agency, Ameren Missouri is sometimes successful in collecting a portion of the 7
delinquent amounts owed. 8
Staff examined Ameren Missouri’s actual billed revenues that were never collected (net 9
write-offs) from July 1995 through September 2014 and has included in the cost of service 10
calculation a four-year average (twelve months ending September 2011, 2012, 2013, and 2014) 11
of adjusted electric net write-offs for uncollectible expense. Staff observed through its review 12
that Ameren Missouri is experiencing a high level of net write-offs from year-to-year. Staff 13
expects Ameren Missouri to review its net write-offs and collection policies and institute 14
effective measures as necessary to reduce this ever-increasing amount of net-offs on its books. 15
Staff Expert/Witness: Kofi Agyenim Boateng 16
11. Advertising Expense 17
In determining its recommended level of allowed advertising expense for Ameren 18
Missouri, Staff applied the principles it has consistently relied on in past rate proceedings by 19
adhering to the Commission’s decision in Re: Kansas City Power and Light Company, Case 20
Nos. EO-85-185 et al.56 In that case, the Commission adopted an approach that classifies 21
advertisements into five categories and provides rate treatment of recovery or disallowance based 22
upon a specific rationale. The five categories of advertisements recognized by the Commission 23
are as follows: 24
1. General: informational advertising that is useful in the provision of adequate 25 service; 26
2. Safety: advertising which conveys the ways to safely use electricity and to 27 avoid accidents; 28
56 Re: Kansas City Power and Light Company, 28 Mo.P.S.C. (N.S.) 228, 269-71 (1986).

Page 114
3. Promotional: advertising used to encourage or promote the use of electricity; 1
4. Institutional: advertising used to improve the company’s public image; 2
5. Political: advertising associated with political issues. 3
The Commission utilized these categories of advertisements to explain that a utility’s 4
revenue requirement should: (1) always include the reasonable and necessary cost of general and 5
safety advertisements; (2) never include the cost of institutional or political advertisements; 6
and (3) include the cost of promotional advertisements only to the extent the utility can provide 7
cost-justification for the advertisements.57 8
In Ameren Missouri Case No. ER-2008-0318,58 the Commission stated that the standards 9
for advertising announced in the KCPL case should be imposed on a “campaign” basis rather 10
than on an “ad-by-ad” basis: 11
In the future, Staff would do well to examine advertisements on a 12 campaign basis rather than becoming ensnared in the effort to evaluate 13 individual ads within a larger campaign. If on balance a campaign is 14 acceptable then the cost of individual advertisements within that campaign 15 should be recoverable in rates. If the campaign as a whole is unacceptable 16 under the Commission’s standards, then the cost of all advertisements 17 within that larger campaign should be disallowed.59 18
In accordance with these Commission decisions, Staff recommends adjustments to exclude the 19
costs of all institutional advertising directly charged to Ameren Missouri or allocated from the 20
Ameren Service Company level from recovery in rates in the current case. A quantification of 21
Staff’s proposed advertising disallowance, as well as the advertisements themselves, is attached 22
as Appendix 4, Schedule JK-1. General and safety advertising costs that were directed towards 23
benefit to existing customers were not adjusted by Staff. Staff's proposes to disallow 24
approximately $1.5 million of total advertising cost based upon the ad by ad review established 25
in the KCPL standard. 26
Only three of the Company’s campaigns were found to be acceptable under the 27
Commission’s ER-2008-0318 advertising standards. Staff’s position in this case is that only the 28
costs of the individual ads should be disallowed from rates as directed by the KCPL standard. 29
57 Id. 58 In the Matter of Union Electric Company d/b/a AmerenUE, 18 Mo.P.S.C.3d 306, 396-398 (2009). 59 Id., at 398.

Page 115
However, should the Commission choose to disallow advertising on a campaign basis as 1
referenced in the Order for Case No. ER-2008-0318, Staff recommends that the Commission 2
disallow approximately $1.7 million of total advertising costs under that specific criterion. 3
Finally MEEIA-related advertising costs were not reviewed or addressed as part of the 4
current rate case. All costs pertaining to MEEIA related-advertisements incurred during the test 5
year were removed from the cost of service calculation as part of the MEEIA expense adjustment 6
that is sponsored by Staff witness John P. Cassidy. MEEIA-related advertisements will be 7
reviewed and addressed by Staff as part of its prudence reviews of all MEEIA related program 8
costs in Case No. EO-2015-0029. 9
Staff Expert/Witness: Jason Kunst 10
12. Gross Receipt Tax Expense 11
See the discussion in Section IX. A. 4. b., Adjustment to Remove Gross Receipt Tax. 12
Staff Expert/Witness: Kofi Agyenim Boateng 13
13. Lockbox Function 14
** 15
16
17
18
19
20
21
22
23
24
25
26
27
28
29
NP
________________________________________________________________________________________________________________________________________________________________________________________________________________________________________________________________________________________________________________________________________________________________________________________________________________________________________________________________________________________________________________________________________________________________________________________________________________________________________________________________________________________________________________________________________________________________________________________________________________________________________________________________________________________________________________________________________________________________________________________

Page 116
1
2
3
4
5
6
7
** 8
Staff Expert/Witness: Brian Wells 9
14. New Bill Format Expense 10
During the test year in this case, the twelve-months ending March 31, 2014, Ameren 11
Missouri incurred costs related to changing to a full-page bill format that was implemented in 12
October 2014. Prior to this implementation, Ameren Missouri was using postcards to bill its 13
customers. Staff has reviewed all developmental costs that occurred in the test year with regards 14
to this change and recommends normalizing these costs over a four-year period. 15
Staff has also reviewed billing expenses in the test year ending March 31, 2014, to 16
determine an annualized level of cost to include in the cost-of-service calculation in this case 17
with regards to Ameren Missouri’s utilization of the new full-page bill format going forward. 18
Staff Expert/Witness: Jason Kunst 19
15. Sioux Construction Accounting 20
Ameren Missouri began construction of the Sioux Wet Flue Gas Desulfurization Project 21
(“Sioux WFGD” or “scrubbers”) during April 2005. The First Nonunanimous Stipulation and 22
Agreement approved by the Commission in Ameren Missouri’s rate case, Case No. 23
ER-2010-0036, stated that Ameren Missouri could receive construction accounting for this 24
project until costs were reflected in rates at the effective date of rates as part of its next rate 25
proceeding or January 1, 2012, whichever occurred earlier. On September 3, 2010, Ameren 26
Missouri filed a subsequent application before the Commission seeking a rate increase as part of 27
Case No. ER-2011-0028. As part of that rate case, the Commission established a July 31, 2011, 28
NP
________________________________________________________________________________________________________________________________________________________________________________________________________________________________________________________________________________________________________________________________________________________________________________________________________________________________________________________________________________________________________________
Page 117
effective date of rates. The scrubbers were installed at the Sioux station in a major construction 1
project that was declared in service during November 2010. 2
As a result, two separate construction accounting deferral amounts were amortized over 3
22 years and 20 years, respectively. In this case, Staff reviewed the test year amortization 4
expense levels and verified the Company is correctly amortizing these two amounts. In addition, 5
Staff reviewed amounts related to contra accounts set up to reflect the equity portion of the 6
amortization. While Generally Accepted Accounting Principles (GAAP) forbid booking by non-7
regulated entities of any of the equity component of a carrying-cost calculation, regulatory 8
accounting allows it for accrual of Allowance for Funds Used During Construction (AFUDC); 9
therefore Staff has made adjustments to remove the contra accounts used during the test year to 10
allow both the equity and debt components of AFUDC to be in included in the revenue 11
requirement. 12
Staff Expert/Witness: Lisa K. Hanneken 13
16. Test Year Storm Cost Annualization and Storm Tracker 14
In Ameren Missouri’s Case No. ER-2012-0166, the Commission approved Ameren 15
Missouri’s request to implement a two-way tracking mechanism for its non-labor major storm 16
restoration costs. As part of the approval, the Commission established a base level of non-labor 17
related major storm restoration operations and maintenance (“O&M”) costs at $6,800,000 in 18
rates. The Company’s actual non-labor storm costs above or below the base level established by 19
the Commission are to be tracked to create either a regulatory asset or liability, which will then 20
be amortized for recovery in Ameren Missouri’s next rate case. Additionally, the Commission 21
ordered Ameren Missouri to credit storm assistance revenue as an offset to major storm expenses 22
within the two-way storm cost tracker. 23
As of September 30, 2014, Ameren Missouri has recorded a regulatory liability of 24
$4,745,688 through the storm tracker. Staff will update this storm tracker balance through 25
December 31, 2014 when it performs its true-up audit as part of this rate proceeding. Ameren 26
Missouri has proposed to amortize the liability resulting from the over-collection of storm costs 27
through customer rates over the actual non-labor major storm costs incurred over a five-year 28
period. Staff accepts Ameren Missouri’s proposed five-year amortization period for the storm 29
regulatory liability. 30

Page 118
In this rate filing, Ameren Missouri states that it does not intend to rebase the amount 1
($6,800,000) established in the Company’s last rate case, No. ER-2012-0166. However, Staff 2
has reflected a normalized level of non-labor major storm expenses in its case based upon a 3
60-month period ending on September 30, 2014. Staff will continue to review actual non-labor 4
related major storm costs through December 31, 2014, which represents the Commission 5
established true-up cutoff in this rate proceeding. Finally, Staff recommends that the 6
Commission discontinue the storm cost tracking mechanism that was implemented in the last 7
rate proceeding because standard ratemaking methods already exist to appropriately address 8
non-labor storm costs. When a utility files a rate case, storm costs that have occurred during the 9
test year can be normalized based upon actual test year, update or true-up levels or through 10
multi-year averages. When extraordinary storms occur in between rate cases that cause lengthy 11
and widespread outages, the Company can seek permission from the Commission to defer those 12
non-labor storm restoration costs as a regulatory asset on their balance sheet for recovery in a 13
subsequent rate case. Finally, it is also Staff’s position that non-labor storm costs do not rise to a 14
level that warrants continuous tracking. 15
Staff Expert/Witness: Kofi Agyenim Boateng 16
17. Prior Storm CostAmortization Expense 17
In Ameren Missouri’s File Nos. ER-2008-0318 and ER-2007-0002, the Commission 18
granted Ameren Missouri the opportunity to recover its major storm restoration costs through 19
customer rates. In Ameren Missouri’s last rate case, ER-2012-0166, the parties agreed to extend 20
the recovery period of the unamortized storm costs from those rate cases (including the 21
Accounting Authority Order storm cost deferral granted in Case No. ER-2008-0318) over an 22
additional two-year period from January 2, 2013, through January1, 2015. This was done to 23
prevent over-recovery of these costs by the Company and, also, to better synchronize the end of 24
the amortization periods with future rate case recovery. These amortizations will expire 25
approximately at the end of December 31, 2014. Staff estimates that Ameren Missouri will 26
over-recover approximately $1,474,522 from these storm costs from January 2015 through May 27
2015, before the new rates from this rate case proceeding become operational. Staff proposes to 28
net this over-recovery amount with the remaining unamortized storm cost balance ($66,667) 29
Page 119
approved in ER-2010-0036. Staff witness John P. Cassidy addresses this issue further in this 1
Report (see Section IX, Subsection E. 17. b. below) as part of his amortization expense analysis. 2
In File No. ER-2010-0036, the Company recorded approximately $10.4 million of 3
non-labor-related storm restoration operations and maintenance (“O&M”) costs during the test 4
year ending March 31, 2009. In its Report and Order in that case, the Commission allowed 5
Ameren Missouri to include $6.4 million in its cost of service for storm restoration costs, while 6
the remaining $4 million test year storm cost was to be amortized and recovered over a five-year 7
period from July 1, 2010, through June 30, 2015. At the end of May 2015, the effective date of 8
rates in the current rate proceeding, the unamortized balance related to this storm amortization 9
will be $66,667. Staff recommends that this amount be netted with the over-recovered 10
amortization amount discussed earlier in this section. 11
Staff Expert/Witness: Kofi Agyenim Boateng 12
18. Amortizations of Regulatory Assets and Liabilities 13
a. Netting of Regulatory Asset and Liability Amortizations 14
Ameren Missouri has currently in place several amortizations related to rate recovery of 15
various items that have been previously approved by the Commission. Based on its review in 16
this case, Staff has found that six existing amortizations have expired or will expire by 17
December 31, 2014; therefore, Ameren Missouri will over-collect in rates for these particular 18
amortizations through the May 30, 2015, effective date of rates in this case. Staff also found that 19
that one existing amortization, in which Ameren Missouri is returning property tax refunds to 20
ratepayers, also will expire on December 31, 2014, and, as a result, Ameren Missouri will 21
over-refund this amount to ratepayers through May 30, 2015, as a result of this amortization. 22
Finally, there are two existing amortizations that will expire on June 30, 2015, just one month 23
beyond the May 30, 201560, effective date of rates in this case; however, Ameren Missouri’s 24
direct filed case contains no proposed adjustment to take this fact into account. Staff proposes to 25
combine the respective balances for these nine amortizations as of May 30, 2015, both positive 26
and negative. Combining the balances in this manner shows that at May 30, 2015, Ameren 27
Missouri will have a net over-collection from ratepayers in rates of approximately $1.4 million 28
60 The amortization balance taken at May 31, 2015, just one day beyond the effective date of rates.

Page 120
for these nine amortizations on a combined basis. The following chart lists each of these nine 1
amortizations and their respective over-collection and under-collection through the effective date 2
in rates in this case, and provides a calculation for the total $1.4 million of over-collection that 3
should be returned to ratepayers: 4
May 30, 2015 5 Amortization 6 Over/(Under) Rate Case 7 Recovery Expiration Status First Established 8
RSG $ 113,619 12/31/14 Over-Collected ER-2100-0028 9
SO2 $ 483,697 12/31/14 Over-Collected ER-2010-0028 10
2007 Storm $ 44,560 12/31/14 Over-Collected ER-2007-0002 11
2008 AAO Storm $ 1,193,888 12/31/14 Over-Collected ER-2008-0318 12
2008 Storm $ 236,104 12/31/14 Over-Collected ER-2008-0318 13
2009 Storm $ (66,667) 06/30/15 Under-Collected ER-2010-0028 14
Property Tax Refund $ (604,245) 12/31/14 Over-Refunded ER-2012-0166 15
Equity Issuance $ (220,935) 06/30/15 Under-Collected ER-2010-0028 16
VSE/ISP $ 244,792 12/31/14 Over-Collected ER-2010-0028 17
Net Over-Collection $ 1,424,813 18
Staff maintains that these amortizations were not intended to provide the Company an 19
unnecessary windfall through over-collection at the expense of ratepayers nor were they 20
designed to harm the Company through an unintended under-collection from ratepayers. 21
Therefore, Staff recommends that these nine amortizations be combined and that the 22
approximate $1.4 million of net over-collection be returned to ratepayers through an 23
amortization period of three years beginning with the effective date of rates in this rate case. 24
b. New and Continuing Regulatory Asset and Liability 25 Amortizations 26
Ameren Missouri has in place several other ongoing amortizations and proposes to 27
introduce five additional amortizations as part of this rate case. Ameren Missouri has four 28
existing Energy Efficiency (EE) regulatory asset amortizations and is proposing to initiate a 29
fifth EE amortization to address deferred pre-MEEIA program costs that occurred subsequent to 30
the July 31, 2012, true-up cut-off point and prior to the January 2, 2013, effective date of rates in 31

Page 121
Ameren Missouri most recent prior rate case, Case No. ER-2012-0166. Staff has reset the 1
amortization period of one of the EE amortizations because it will expire within 14 months of the 2
May 30, 2015, effective date of rates in this rate case. Staff has also included in its case a 3
six-year amortization of the deferred pre-MEEIA program costs that were incurred since the 4
true-up cut-off in the prior rate case. Staff addresses the EE regulatory asset amortizations in 5
greater detail in a section found earlier in this Report. 6
Ameren Missouri also proposes to include an adjustment to reduce amortization expense 7
by approximately $1.5 million to reflect a five-year amortization of the storm tracker regulatory 8
liability of approximately $7.6 million. The $7.6 million represents an estimate of the amount 9
incurred by Ameren Missouri through December 31, 2014 related to major storm events below 10
the base level of the non-labor O&M storm cost of $6.8 million. Staff has examined the actual 11
non-labor major storm costs incurred by Ameren Missouri since the true-up cut-off in the last 12
case through September 30, 2014, and has included a five-year amortization of an approximate 13
$4.7 million storm tracker liability. As a result, Staff has reduced amortization expense by 14
approximately $949,138 to include a five-year amortization of that regulatory liability. Staff 15
witness Kofi Agyenim Boateng addressed the amortization of the storm cost regulatory liability 16
resulting from the last rate case earlier in this report. 17
The Company also proposes to include an additional amortization to address the variation 18
in costs from base levels for vegetation management and infrastructure inspection costs since the 19
true-up cut-off in the last case. Please refer to the vegetation management and infrastructure 20
inspection section of this report as sponsored by Staff witness Lisa K. Hanneken for a further 21
discussion of Staff’s proposed treatment for these amortizations as well as Staff’s position 22
concerning the vegetation management and infrastructure tracker. In addition, Staff has included 23
amortizations of the expense associated with the Financial Accounting Standards Board 24
Interpretation Number 48 (“FIN 48”) related to “uncertain tax positions,” as well as for Sioux 25
scrubber construction accounting. For additional discussion with regard to these amortizations, 26
please refer to the FIN 48 and Sioux construction accounting sections sponsored by Staff witness 27
Hanneken. 28
The Company has also proposed three new amortizations that address deferred solar 29
rebates, a loss of revenues associated with a lengthy Noranda Aluminum Inc. (“Noranda”) 30
outage due to an ice storm that occurred in January 2009, and costs associated with Fukushima 31
Page 122
studies. Staff has included a three-year amortization of all solar rebate spending incurred by 1
Ameren Missouri, plus a ten percent cost adder, according to the terms contained within the 2
stipulation and agreement approved by the Commission as part of Ameren Missouri Case No. 3
ET-2014-0085. Staff also included ten year amortization of costs associated with a mandatory 4
study to address nuclear power safety in the aftermath of the Fukushima incident. 5
Staff Expert/Witness: John P. Cassidy 6
19. Noranda Accounting Authority Order (“AAO”) Lost Revenue 7 Deferral 8
In Case No. EU-2012-0027, the Commission granted Ameren Missouri permission to 9
defer certain lost revenues (or “fixed costs” as characterized by Ameren Missouri) that it was 10
unable to recover when the Noranda Aluminum Smelter lost power in late January 2009 due to a 11
severe ice storm that struck southeast Missouri. Due to the power outage, Noranda ceased 12
operations for several months. Ameren Missouri is proposing to include approximately 13
$7.1 million in the cost-of-service calculation in this rate case, which represents a five-year 14
amortization of the $35.6 million of total lost revenues associated with the Noranda Aluminum 15
Smelter outage. Staff opposes Ameren Missouri’s proposal to include an amortization of the lost 16
revenues for recovery in rates to be determined by the Commission in this case. It is 17
inappropriate to attempt to recover lost revenues from a period approximately five years ago, and 18
subsequent to the conclusion of three prior general rate cases (ER-2010-0036, ER-2011-0028 19
and ER-2012-0166), in order to boost overall earnings during the timeframe of the current rate 20
proceeding. It is generally not appropriate to either defer or to recover lost revenue in rates. Staff 21
will further explain its position and address this issue as part of its rebuttal testimony scheduled 22
to be filed on January 16, 2015. 23
Staff Expert/Witness: John P. Cassidy 24
20. Energy Efficiency Regulatory Asset Amortizations 25
Ameren Missouri has four existing Demand Side Management (“DSM”) Energy 26
Efficiency (“EE”) regulatory asset amortizations that were implemented in previous Ameren 27
Missouri rate cases. The unamortized balances of each of these amortizations are also included 28
in rate base to allow a return on the unrecovered balances. In this rate proceeding, Staff proposes 29

Page 123
to reset the EE amortization that was established in Ameren Missouri Case No. ER-2010-0036. 1
This particular EE amortization is scheduled to expire in July 2016, which is only fourteen 2
months after the effective date of rates in this case. Ameren Missouri would over recover for this 3
particular amortization unless it filed for another rate increase no later than August 2015. 4
Therefore, Staff proposes to reset this amortization to provide recovery for the unamortized 5
balance at the May 30, 2015, effective data of rates established by the Commission for this rate 6
case over a two-year period beginning on that date. 7
As part of this rate case, Ameren Missouri proposes to initiate a fifth EE amortization to 8
address DSM deferred pre-MEEIA program costs that occurred after the July 31, 2012, true-up 9
cut-off point and prior to the January 2, 2013, effective date of rates in Case No. ER-2012-0166. 10
Staff has included a six-year amortization of the deferred pre-MEEIA program costs that were 11
incurred after the true-up cutoff in the prior rate case. Staff has also included this unamortized 12
balance in rate base consistent with establish ratemaking treatment for these costs. 13
Staff Expert/Witness: John P. Cassidy 14
21. Renewable Energy Standard 15
a. Summary 16
The Missouri Renewable Energy Standard ("RES")61 was enacted as a voter initiative 17
petition in November 2008. Provisions of the resulting statute and regulations require Ameren 18
Missouri (and the other investor-owned utilities) to meet certain requirements regarding the use 19
of renewable energy while not exceeding the one percent (1%) retail rate impact limit. The RES 20
requires Ameren Missouri to provide a rebate ($2.00 per installed watt)62 to its retail customers 21
for installation of solar electric systems on their premises. Ameren Missouri filed requesting to 22
suspend solar rebate payments on October 11, 2013, in Case No. ET-2014-0085. The 23
Commission approved a non-unanimous stipulation and agreement, by an order effective 24
November 23, 2013, which set a specified level63 for solar rebate payments.64 The Commission 25
61 Mo. Rev. Stat. § 393.1020 (2000). 62 For systems becoming operational on or before June 30, 2014. 63 $91.9 million incurred subsequent to July 31, 2012. 64 Case No. ET-2014-0085

Page 124
approved a tariff, effective September 19, 2014, allowing Ameren Missouri to suspend payment 1
of solar rebate payments in 2014 and beyond once they reach the specified level.65 2
Utilization of a Standard Offer Contract (“SOC”) for the purchase of Solar Renewable 3
Energy Certificates ("S-RECs") from customer-owned solar electric systems is optional for the 4
utility companies.66 The Commission approved tariffs for 2013 to provide for a SOC at five 5
dollars ($5) per S-REC with an annual expenditure limit of one million dollars ($1,000,000). 6
Because House Bill 142, effective August 28, 2013, includes a condition on solar rebates 7
requiring customers to transfer the first ten (10) years of S-RECs to the utility which eliminated 8
the need for Ameren Missouri to utilize a SOC, the tariffs were revised to limit the SOC funding 9
to those customers who submitted interconnection applications by August 27, 2013. 10
For calendar years 2011 through 2013, the RES requires Ameren Missouri to generate or 11
purchase two percent (2%) of its retail sales using renewable energy resources, and this year the 12
renewable energy requirement increases to five percent (5%) of its retail sales.67 Ameren 13
Missouri must derive two percent (2%) of the renewable energy requirement from solar energy.68 14
RECs can be banked for three (3) years and utilized for future compliance purposes.69 Ameren 15
Missouri files annually a RES Compliance Plan and a RES Compliance Report.70 Each RES 16
Compliance Plan provides information regarding the utility’s plan for the current calendar year 17
and the subsequent two (2) calendar years. The RES Compliance Report is a status report on the 18
utility’s compliance for the preceding calendar year. For the 2013 calendar year, Ameren 19
Missouri utilized renewable energy and RECs from Keokuk Hydro-electric Generation Station 20
and the Pioneer Prairie wind PPA for the non-solar requirement and retired S-RECs from various 21
third-party brokers for the solar requirement.71 22
Staff Expert/Witness: Claire M. Eubanks 23
65 Case No. ET-2014-0350 66 Commission Rule 4 CSR 240-100 (4)(H)1. 67 Mo. Rev. Stat. § 393.1030 .1 (2000). 68 Mo. Rev. Stat. § 393.1030.1(4) (2000). 69 “An unused credit may exist for up to three years from the date of its creation.” Mo. Rev. Stat. § 393.1030.2 (2000). 70 Ameren Missouri filed its RES Plan for 2014-2016 and its RES Report for calendar year 2013 in Case No. EO-2014-0291. 71 Case No. EO-2014-0291, Renewable Energy Standard Compliance Report, pg 10.

Page 125
b. Renewable Energy Standard Costs 1
Renewable Energy Standard (RES) costs consist of items such as customer solar 2
renewable energy credits (“RECs”)72, non-customer solar RECs, wind RECs and water RECs. 3
In Ameren Missouri Case No. ER-2011-0028, the Commission ordered that: 4
Ameren Missouri shall include $885,266 in its rates for ongoing solar 5 rebate expenses. Ameren Missouri shall accumulate in an AAO the 6 amount it has paid for solar rebates from the beginning of the program 7 until new rates become effective in this case. The recovery of those costs 8 and future costs deferred in the AAO will be decided in Ameren 9 Missouri’s next rate case.73 10
In Ameren Missouri Case No. ER-2012-0166, the Commission ordered the following with regard 11
to the establishment of a base RES level to include in rates in order to track against: 12
Ameren Missouri shall include a base level of $4,656,595 for REC 13 compliance costs in the rates established in this case and shall track any 14 variation in those costs through an Accounting Authority Order for future 15 recovery in its next rate case.74 16
In that case, the Commission also ruled on the recovery of the deferred costs that had 17
accumulated through the July 31, 2012, true-up cutoff in the previous rate case: 18
Ameren Missouri shall recover $6.3 million in past RES costs amortized 19 over three years with the unamortized balance not included in rate base.75 20
In the current rate case, ER-2014-0258, Ameren Missouri has requested that the base 21
level of RES costs be increased to approximately $10.1 million from the previous $4.7 million 22
level that is reflected in current rates. Ameren Missouri’s proposed level is based upon an 23
estimate of RES costs through December 31, 2014, as well as the cost of methane fuel used to 24
power its Maryland Heights Energy center. Staff has included Ameren Missouri’s level of 25
estimated RES spending as a place holder until more current actual RES spending becomes 26
available. Staff has also included a calculation for methane fuel as determined by volumes 27
developed by Staff’s RealTime production cost model and contractual prices in effect at 28
June 15, 2014. Staff will continue to analyze actual RES spending through the December 31, 29
2014, true-up cut-off and may propose adjustments to this level as a result of the true-up audit. 30 72 Through the use of Standard Offer Contract (“SOC”). 73 ER-2011-0028, Report and Order, p. 101. 74 ER-2012-0166, Report and Order, p. 54. 75 Id., p. 56.

Page 126
Staff Expert/Witness: John P. Cassidy 1
c. RES AAO Regulatory Asset/(Liability) Amortizations 2
Staff examined a listing of RES expenditures from August 1, 2012 through December 31, 3
2012, in order to determine the variation in incurred RES compliance costs that occurred 4
compared to the $885,266 base level included in rates established in Case No. ER-2011-0028. 5
Staff also examined all RES expenditures from January 1, 2013, through October 31, 2014, in 6
order to determine the variation in incurred costs from the $4.7 million base level included by the 7
Commission in rates in Case No. ER-2012-0166. Staff determined that Ameren Missouri’s 8
actual spending was $830,432 lower than what was actually in rates during the period covering 9
August 1, 2012, through October 31, 2014. Therefore, this difference represents a regulatory 10
liability and Staff proposes to return this over-recovery to ratepayers over three years consistent 11
with the Commission’ order in Case No. ER-2012-0166. 12
As mentioned earlier in the section above, the Commission ordered that a deferred 13
regulatory asset balance of $6.3 million of RES costs that had accumulated through the July 31, 14
2012, true-up cut-off point in Case No. ER-2012-0166 should be amortized over three years with 15
no inclusion in rate base. By the May 30, 2015, effective date of rates in this case, this 16
amortization would be fully recovered within seven additional months or by December 31, 2015. 17
Therefore, Staff proposes to reset the $1.2 million unamortized balance at May 30, 2015, for a 18
two-year recovery period. 19
Staff Expert/Witness: John P. Cassidy 20
d. Maryland Heights Energy Center Methane Fuel Costs Included In 21 RES AAO 22
Ameren Missouri was granted a variance as part of Case No. ER-2012-0166 to allow for 23
recovery of landfill methane gas costs associated with the Maryland Heights Energy Center in 24
the fuel adjustment clause. As part of this rate case, Ameren Missouri has proposed and Staff 25
agrees that the Maryland Heights Energy Center fuel costs are RES compliance costs and should 26
be excluded from the Net Base Energy Cost (NBEC) and should also be precluded from 27
recovery of subsequent changes in this fuel cost through Ameren Missouri’s FAC mechanism. 28
Staff has included a $3.1 million level of methane fuel costs as part of its $10.1 million overall 29
RES base level inclusion as discussed earlier in this report. In addition, it should be noted that 30
Page 127
Staff is including an annualized and normalized level of generation from the Maryland Heights 1
Energy Center as part of its production cost model. However, Staff assigned a zero cost to that 2
generation in order to exclude this from the NBEC and to appropriately include Maryland 3
Heights Energy Center methane fuel costs as a RES compliance cost. Staff’s $3.1 million level 4
of methane fuel cost was determined by multiplying the quantity of methane fuel burned in 5
Staff’s production cost model by the most current contractual fuel price at June 15, 2014. 6
Staff Expert/Witness: John P. Cassidy 7
e. Pioneer Prairie Wind Contract 8
Ameren Missouri entered into a contract with Pioneer Prairie Wind Farm I LLC in 2009 9
to obtain wind power at a $69 per MW price. As part of this case, Ameren Missouri proposes to 10
split this $69 per MW contractual price into two cost components that would receive differing 11
ratemaking treatment. Ameren proposes to assign $49 per MW as an energy cost and to include 12
this amount in the pricing of Pioneer Prairie wind purchases in the NBEC. The remaining 13
$20 per MW is the estimated REC cost and would be included in the RES AAO for recovery. 14
Staff agrees with Ameren Missouri’s proposed ratemaking treatment for purposes of this rate 15
case only. Staff reserves the right to propose a different split in all future general rate cases, 16
FAC cases and RES cases in order to take into account any significant changes in circumstances 17
that may occur in the future. 18
Staff Expert/Witness: John P. Cassidy 19
22. Solar Rebates 20
The Commission approved a Non-Unanimous Stipulation and Agreement in Ameren 21
Missouri Case No. ET-2014-0085, which allows Ameren Missouri to defer all solar rebate 22
spending up to approximately $91.9 million, plus a 10% cost adder to that amount to account for 23
“carrying costs,” and then calls for an amortization of that balance over three years in a 24
subsequent rate case. Through its discovery in this case, Staff has determined that Ameren 25
Missouri deferred and accumulated in a regulatory asset account approximately $87.4 million on 26
solar rebates through October 31, 2014. Coupled with the 10% cost adder of approximately $8.7 27
million, Ameren Missouri is eligible to seek recovery of approximately $96.1 million over a 28
three-year amortization period. Therefore, Staff has included approximately $32 million in 29

Page 128
amortization expense in the cost-of-service calculation to be consistent with the terms of the 1
Non-Unanimous Stipulation and Agreement in Case No. ET-2014-0085. Staff recommends that 2
this amortization begin on the Commission established May 30, 2015, operation-of-law date in 3
the rate case. Staff will continue to examine Ameren Missouri’s solar rebate spending through 4
the January 1, 2015, true-up cut-off date established by the Commission for this rate case. Staff 5
will make further adjustments in the true-up audit in order to address any additional solar rebate 6
spending through that point in time. 7
Staff Expert/Witness: John P. Cassidy 8
23. FASB Interpretation No. 48 (“FIN 48”) Amortization 9
Generally Accepted Accounting Principles (GAAP) provide rules for recording the effect 10
of tax deferral resulting from temporary book-tax differences in FIN 48 and SFAS 109. FIN 48 11
(mostly codified at ASC 740-10) is an official interpretation of United States accounting rules 12
that requires businesses to analyze and disclose income tax risks. During the course of the 13
Company’s tax filings with Internal Revenue Service (IRS), certain amounts will be included 14
related to uncertain tax positions that the Company has taken with respect to temporary book-tax 15
differences. At the time they file their taxes, the Company will not know whether the uncertain 16
tax positions will be allowed or disallowed until the completion of the audits of its tax returns by 17
the IRS. When a business takes uncertain tax positions, which may not be sustained by tax 18
authorities, those risks must be disclosed for financial reporting purposes. Income tax expense, 19
just as any other expense, must be generally recognized when income is earned. Credits or other 20
items that reduce this tax are recognized only if it is more likely than not that the reductions will 21
be sustained by tax authorities. 22
Per the Stipulation and Agreement in Ameren Missouri Case No. ER-2011-0028, in order 23
to resolve the Company’s FIN 48 liability balance for that case, reflecting uncertain tax 24
positions, it was agreed that: 25
The Company shall establish a tracking mechanism to account for the time 26 value of the differences, if any, between the amounts accrued to reflect 27 uncertain tax positions in the FIN 48 liability balance, and the amounts 28 that the Company actually must pay pursuant to final, unappealable 29 resolution of the uncertain tax positions based on final settlements with the 30 Internal Revenue Service (“IRS”) or final, unappealable rulings from 31

Page 129
administrative agencies or courts to which IRS audits are appealed (“Final 1 Resolution”). 2
Once the IRS determines that the uncertain tax position is allowable, then the Company will 3
receive a settlement based on the amount that was filed as uncertain. In the Company’s most 4
recent rate case (Case No. ER-2012-0166), the amortization balance of the 2005-2006 tax year 5
settlement of $1,919,696 was amortized over a 3-year period from January 2013 – December 6
2015 at the monthly rate of $53,325. 7
In addition to this previous amortization, in this case Staff has learned that Ameren 8
Missouri has received confirmation of the settlement of its 2007-2010 taxes which will need to 9
be amortized as well. At the time of this filing, Staff has not been provided with the data 10
necessary to include this amount. However, Staff will continue its review regarding this item as 11
more information becomes available in this case. 12
Given the first balance for the 2005-2006 settlement is due to be fully amortized in 13
December 2015, which is only seven months after the Operation-of-Law Date in this case, 14
Staff believes that the current balance as of May 2015 should be rolled into the total of the new 15
2007-2010 amortization. However, since an analysis of the second settlement has yet to be 16
performed, Staff has reset the dating of the current amortization so that the amortization will run 17
through November 2016, which resulted in a total annual amount of $248,848 for the first 18
settlement. 19
Ameren Missouri has also indicated that its 2011 settlement may be finalized in 20
December 2014. If this settlement is determined, Staff will review it as part of its true-up audit as 21
well. 22
Staff Expert/Witness: Lisa K. Hanneken 23
24. Missouri Energy Efficiency Investment Act (“MEEIA”) Costs in Test 24 Year 25
As part of the Ameren Missouri’s Missouri Energy Efficiency Investment Act (MEEIA) 26
application in Case No. EO-2012-0142, a stipulation and agreement was reached by the parties to 27
that case on July 5, 2012, and later approved by the Commission. As a result, in Ameren 28
Missouri’s last rate case, No. ER-2012-0166, Staff recommended that the Commission approve 29
an overall inclusion of $80 million for MEEIA-related program costs. Approximately 30
Page 130
$49.1 million represented one-third of the estimated program costs for eleven MEEIA 1
demand-side management (“DSM”) programs related to an overall three-year program plan. In 2
addition, approximately $30.5 million was reflected in rates in Ameren Missouri’s last rate case 3
that addressed Ameren Missouri’s retention of a share of projected net benefits of the MEEIA 4
programs. Consistent with the terms of this settlement, in January 2014, Ameren Missouri 5
implemented a MEEIA rider which is intended to recover MEEIA costs outside of base rates, 6
and also track changes in costs associated with these programs and either charge customers for 7
any under-collection in overall costs or return to customers all that were over-collected, 8
with interest. Due to the implementation of this MEEIA rider, it is necessary to remove all 9
MEEIA-related revenues and expenses from the test year to avoid double counting for these 10
revenues and expenses. Therefore, Staff has removed from inclusion in the cost-of-service 11
calculation in this rate case approximately $38 million of MEEIA-related expenses that were 12
incurred during the test year. For a complete discussion of Staff’s exclusion of MEEIA-related 13
revenues that were removed from the test year, please refer to the MEEIA Revenues in Test Year 14
section of this Report as sponsored by Staff witness Kofi Agyenim Boateng. 15
Staff Expert/Witness: John P. Cassidy 16
25. Callaway Refueling Adjustment 17
Ameren Missouri’s Callaway nuclear power plant undergoes a refueling and maintenance 18
outage process approximately every 18 months. While refueling takes place, the Company 19
typically completes numerous maintenance activities, performs inspections and testing and also 20
completes any necessary capital improvements. The Company refueled the Callaway nuclear 21
power plant during the months of October and November of 2014 (“Refuel 20”), which was 22
outside the test year ending March 31, 2014 for this case. Since the actual costs of Refuel 20 are 23
not yet known by Staff, for purposes of this filing Staff will include two-thirds of the actual cost 24
of the prior Callaway refueling (“Refuel 19”) in its case. The actual costs for Refuel 19 are 25
similar to those budgeted for Refuel 20. Since the Company refuels the Callaway nuclear power 26
plant on an eighteen-month cycle, the cost of refueling must be normalized to reflect the amount 27
incurred during a twelve-month period. Refuel 19, which occurred between April 8, 2013, and 28
May 28, 2013, resulted in approximately $28.8 million in non-labor operations and maintenance 29
(“O&M”) cost. However, Company has indicated that approximately $23.2 million of non-labor 30

Page 131
O&M cost was recorded during the test year for this rate case (April 1, 2013, through March 31, 1
2014), and approximately $5.7 million was recorded prior to the test year (i.e., prior to April 1, 2
2013). Staff has issued a data request to verify Ameren Missouri’s assertion that $5.7 million of 3
non-labor O&M for Refuel 19 was recorded on its books prior to the actual start of the refueling. 4
Based on the information Staff has been provided to date, Staff’s normalization 5
adjustment removes approximately $4.0 million from the test year to reflect an amount of 6
non-labor O&M that represents two-thirds of the approximately $28.8 million of non-labor 7
maintenance project costs associated with Refuel 19. All labor-related costs associated with the 8
Callaway refueling are addressed in Staff’s payroll annualization as discussed by Staff witness 9
Brian Wells. Staff adjusted expense to include approximately $19.2 million in Staff’s cost of 10
service calculation in order to normalize non-labor-related maintenance expenses associated with 11
the Company’s refueling of the Callaway nuclear power plant. 12
Staff will examine the non-labor maintenance costs associated with Callaway Refuel 20 13
through December 31, 2014, as part of the true-up audit once those costs are finalized and 14
provided to Staff. If the Refuel 20 costs prove to be reasonable, they will be normalized and 15
included in Staff’s revenue requirement recommendation instead of the Refuel 19 costs. 16
Staff Expert/Witness: Lisa M. Ferguson 17
26. Low-level Radioactive Waste Expense 18
Low-level radioactive waste (LLRW) includes items that have become contaminated with 19
radioactive material or have become radioactive through exposure to neutron radiation. This 20
waste typically consists of contaminated protective shoe covers and clothing, wiping rags, mops, 21
filters, reactor water treatment residues, equipment and tools, and tissues. The radioactivity can 22
range from just above background levels found in nature to very highly radioactive in certain 23
cases such as parts from inside the reactor vessel in a nuclear power plant. The Nuclear 24
Regulatory Commission (NRC) has developed a classification system for LLRW based on its 25
potential hazards. The NRC has specified disposal and waste requirements for each of the three 26
classes of waste—Class A, B, and C—that are acceptable for disposal in near-surface facilities. 27
These classes have progressively higher levels of concentrations of radioactive material, with 28
Class A having the lowest and Class C having the highest level. The NRC reports that Class A 29
waste accounts for approximately 96 percent of the total volume of LLRW. 30

Page 132
The Low-level Radioactive Waste Policy Amendments Act of 1985 gave the states 1
responsibility for the disposal of the LLRW that is accumulated at their reactor sites. The Act 2
encouraged the states to enter into compacts that would allow them to dispose of waste at a 3
common disposal facility. The NRC regulates the management, storage and disposal of 4
radioactive waste produced as a result of NRC-licensed activities. The agency has entered into 5
agreements with 32 states, called Agreement States, to allow these states to regulate the 6
management, storage and disposal of certain nuclear waste. The commercial radioactive waste 7
that is regulated by the NRC or the Agreement States is of three basic types: high-level waste, 8
mill tailings, and low-level waste. The most common methods of LLRW storage and disposal 9
are: Decay-In-Storage (DIS), Transfer to an Authorized Recipient for Disposal, and Extended 10
Interim Storage. LLRW can be disposed of in facilities that are licensed by either the NRC or an 11
Agreement State in accordance with health and safety requirements. Once a licensee decides to 12
ultimately dispose of LLRW, it must be disposed of at a licensed facility. The Low-level 13
Radioactive Waste Policy Amendments Act also authorized the states to enter into compacts that 14
would allow several states to dispose of waste at a joint disposal facility. There are four existing 15
and active LLRW disposal facilities in the United States that accept various types of low-level 16
waste, all of which are located and licensed for commercial operation in Agreement States. The 17
facilities have been designed, constructed, and operated to meet safety standards. The operator 18
of the facility must also extensively characterize the site on which the facility is located and 19
analyze how the facility will perform for thousands of years into the future. 20
EnergySolutions has its Barnwell operations, located in Barnwell, South Carolina. 21
Currently, Barnwell accepts waste from all U.S. generators except those in the Rocky Mountain 22
and Northwest Compacts. Beginning in 2008, Barnwell will only accept waste from the Atlantic 23
compact states (Connecticut, New Jersey, and South Carolina). Ameren Missouri initially used 24
this location for LLRW other than filter and resin waste. Barnwell is licensed by the state of 25
South Carolina to receive wastes in Classes A-C. U.S. Ecology, located in Richland, 26
Washington, accepts waste from the Northwest and Rocky Mountain compacts. Richland is 27
licensed by the State of Washington to receive wastes in Classes A-C. EnergySolutions Clive 28
Operations, located in Clive, Utah, accepts waste from all regions of the United States. Clive is 29
licensed by the state of Utah for Class A waste only. Waste Control Specialists, LLC, (“WCS”) 30
located near Andrews, Texas, accepts waste from the Texas Compact generators and outside 31
Page 133
generators with permission from the Compact. WCS is licensed by the state of Texas for Classes 1
A, B, and C waste. In addition, beginning in 2012, the Waste Control Specialists, LLC, facility 2
in Andrews, Texas, began disposal operations. Ameren Missouri now has the ability to send all 3
LLRW to the Utah and Texas locations. 4
** 5
6
7
8
9
10
11
12
13
14
15
16
17
18
19
20
21
22
23
24
25
26
27
28
29
** Staff has included this 30
NP
____________________________________________________________________________________________________________________________________________________________________________________________________________________________________________________________________________________________________________________________________________________________________________________________________________________________________________________________________________
______________________________________________________________________________________________________________________________________________________________________________________________________________________________________________________________________________________________________________________________________________________________________________________________________________________________________________________________________________________________________________________________________________________________________________________________________________________________________________________________________________________________________________________________________________________________________________________________________________
________________________________________________________________________________________________________________________________________________________________________________________________________________________________________________________________________________________________________

Page 134
actual expense level in the cost-of-service calculation and will continue to examine these costs 1
through the true-up cut-off date in this case for possible revision. 2
Staff Expert/Witness: Lisa M. Ferguson 3
27. Lease Expense 4
During the test year, Ameren Missouri incurred expenses related to leases on land, 5
equipment, and facilities utilized to provide its service. Staff reviewed Ameren Missouri’s 6
lease expense for the test year and annualized it to reflect an overall decrease in the ongoing 7
expense level. 8
Staff Expert/Witness: Brian Wells 9
28. PSC Assessment 10
The operations of the Missouri Public Service Commission are funded by assessments 11
levied upon the utility companies under its jurisdiction. The required funding level from each 12
utility is re-evaluated each year and a new assessment is billed to each regulated utility on July 13
1st. All of the assessments collected in total are used to meet the Commission’s operating costs 14
for regulating those utilities. Staff’s PSC assessment adjustment represents the difference 15
between the amount of PSC assessment recorded on Ameren Missouri’s electric books during 16
the test year, or the twelve months ending March 31, 2014, and the most recent PSC assessment 17
that went into effect as of July 1, 2014 (fiscal year 2015), which is within the 18
Commission-established true-up cutoff of December 31, 2014. Staff has annualized the 19
Company’s PSC assessment expense by using the most current assessment that was issued on 20
July 1, 2014. 21
Staff Expert/Witness: Brian Wells 22
29. Corporate Franchise Tax 23
Corporate franchise taxes are paid as a cost of doing business within the state. Ameren 24
Missouri has assets in the state of Missouri and assets franchised in the state of Illinois at the 25
Kinmundy, Goose Creek, Raccoon Creek, Venice and Pinckneyville sites. The cost-of-service 26
adjustment includes all taxes related to Ameren Missouri assets, whether the assets reside in 27
Missouri or Illinois. Staff’s adjustment for the on-going expense level is based upon the actual 28

Page 135
paid taxes for 2014, as filed per Form MO-FT with the state of Missouri and Form CDBCAB 1
with the state of Illinois, which included all applicable tax credits. 2
Staff Expert/Witness: Sarah Sharpe 3
30. Outside Services - External Auditors 4
Staff reviewed the test year costs related to services provided by PricewaterhouseCoopers 5
LLP (PwC) to Ameren and subsequently allocated to Ameren Missouri. Staff has made an 6
adjustment to remove costs which should not be included in Ameren Missouri’s customers’ rates 7
that related to the divesture of certain Ameren entities sold to Dynegy on December 2, 2013. 8
Staff Expert/Witness: Lisa K. Hanneken 9
31. SO2 Allowance Tracker 10
In Case No. ER-2007-0002, the Commission established an accounting mechanism to 11
track Ameren Missouri’s SO2 emission allowance sales revenues, net of SO2 expenses. 12
The Company realizes SO2 revenues from gains on the sale of SO2 emission allowances. 13
SO2 expenses are a result of the premiums/discounts that arise from differences in the actual 14
level of SO2 content in coal received compared to the assumed level of content in the coal 15
contracts. Beginning on January 1, 2007, the Company was required to account for all 16
SO2 premiums, net of any SO2 discounts, in a regulatory liability account. The Commission also 17
ordered that all gains from SO2 allowance sales, in excess of $5,000,000, be recorded in this 18
same regulatory liability account. This regulatory liability account, referred to as the 19
SO2 Tracker, also accumulates interest at Ameren Missouri’s short-term borrowing rate. 20
This SO2 tracker was continued as part of Case No. ER-2008-0318; however, in Case No. 21
ER-2010-0036, the SO2 tracker was discontinued, and it was agreed that, going forward, the cost 22
associated with the SO2 premiums, net of discounts, and the revenues from gains on the sale of 23
SO2 emission allowances will be included in Ameren Missouri’s Fuel Adjustment Clause. 24
Therefore, tracking of SO2 -related costs was discontinued on June 21, 2010, the effective date of 25
new rates in Case No. ER-2010-0036. 26
While the tracker was discontinued, the balance continued to be amortized and as of 27
December 2012 was $2,321,821. The amortization of this balance was reset as part of Case No. 28
ER-2012-0166 with a $96,742 monthly amortization amount to be amortized over a two-year 29

Page 136
period, through December 2014. Therefore, at the end of the true-up period in this case, the 1
balance will be reduced to zero through the amortization process and no new amortization is 2
necessary. As a result, Staff has made an adjustment to the test year amortization expense 3
amount of $1,160,904 to eliminate this item on a going-forward basis. 4
However, while Staff’s adjustment will remove the amortization going forward, rate 5
recovery of this item will continue through the date of implementation of rates in this case, 6
anticipated to be May 2015. Therefore, from January 2015 through May 2015, the Company 7
will continue to receive in rates a monthly amount of $96,742 which is over and above the 8
original balance to be recovered. Staff witness John P. Cassidy addresses this issue further in 9
this Report (see Section IX, Subsection E. 17. b. above) as part of his amortization 10
expense analysis. 11
Staff Expert/Witness: Lisa K. Hanneken 12
32. Board of Directors Fees & Expenses 13
During the test year ending March 31, 2014, Ameren Missouri was allocated a substantial 14
portion of Ameren Corporation’s board of director fees, retainers, stock options, travel related 15
costs and facility rentals. Historically, these costs have been retained at the Ameren Services 16
Company (“AMS”) level. As part of this rate case, Staff first learned that AMS actually began 17
allocating these parent company related costs beginning in September 2011. Staff’s position in 18
this rate case is that all of these costs represent a parent company ownership cost that should be 19
retained at the AMS level, and not allowed in Ameren Missouri customer rates. Furthermore, 20
many of the costs being allocated are duplicative or unreasonable and excessive. For example 21
Ameren Missouri already has its own separate board of directors and a board conference room 22
that is located in the Ameren Missouri’s general headquarters located in St. Louis, Missouri, for 23
which the associated costs are included in Staff’s case. In addition, Ameren Missouri is being 24
allocated costs associated with flying Ameren Corporation board members to St. Louis on 25
private corporate chartered jets and for the cost of board meetings and hotel stays at the Four 26
Seasons Hotel located in downtown St. Louis as well as at the Ritz-Carlton Hotel located in 27
Clayton, Missouri. Finally, Staff has submitted data requests seeking additional information 28
regarding the Ameren Corporation board of directors’ fees and all parent company related 29
expenses that are now being allocated to Ameren Missouri from AMS, but has not yet received 30

Page 137
responses to these data request. At this time, Staff has removed these costs from its cost of 1
service calculation and will further assess this information once it is made available. 2
Staff Expert/Witness: Jason Kunst 3
33. Miscellaneous Expenses 4
During the test year, Ameren Missouri booked numerous costs to various Federal Energy 5
Regulatory Commission (FERC) Uniform System of Accounts (USOA) expense accounts. After 6
reviewing these expenditures, Staff has removed a total of $415,094 from the Company’s 7
test year costs for items which provided no benefit to ratepayers. Charges removed include items 8
such as sponsorships of community and sporting events, donations, and other similar items. 9
Items of note include $87,893 for the ALT Leadership forum held at Busch Stadium featuring 10
guest speaker Tony LaRussa, $72,953 for tickets and meals at St. Louis Cardinals, St. Louis 11
Rams, and St. Louis Blues games which included employee personal use, and $24,180 to 12
refurbish the “Season’s Greetings” sign displayed at company headquarters. 13
Staff Expert/Witness: Jason Kunst 14
34. Snow Removal Costs 15
During the test year, Ameren Missouri incurred abnormally high levels of costs 16
associated with snow removal from numerous sites that they conduct various operations. Based 17
upon a review of the National Oceanic and Atmospheric Association (“NOAA”) website, Staff 18
determined that snowfall levels experienced in St. Louis during the winter of 2013-2014, which 19
lies within the Commission established test year for this rate case (twelve months ending 20
March 31, 2014) represented the tenth highest snowfall accumulation on record. Therefore, Staff 21
normalized these costs through the use of a five-year average in order to reflect a more 22
representative ongoing level for snow removal costs. 23
Staff Expert/Witness: Brian Wells 24
35. Taum Sauk Failure Expense Removal 25
Ameren Missouri has agreed to hold ratepayers harmless for costs associated with the 26
Taum Sauk reservoir failure in 2005 and all related clean-up activities. Staff has adhered to the 27
Commission’s decision on this issue in Case No. ER-2007-0002 by removing all Taum Sauk 28

Page 138
related expense from the cost of service calculation in each Ameren Missouri rate case that 1
followed. Per the Report and Order from the 2007 case: 2
On December 14, 2005, the upper reservoir at AmerenUE’s Taum Sauk 3 pumped storage facility in Reynolds County, Missouri ruptured, allowing 4 1.5 billion gallons of water to rush down the side of a mountain and 5 through Johnson’s Shut-Ins State Park. AmerenUE claims to accept full 6 responsibility for the reservoir failure and the resulting damages. Since 7 AmerenUE will not be allowed to include the Taum Sauk expenses in its 8 cost of service as calculated for this case, those costs will not be recovered 9 from ratepayers and will instead have to be paid with shareholder funds. 10
Therefore, in this rate case proceeding, Staff has removed $627,764 from the cost of 11
service calculation for expenses related to ongoing liability and litigation costs related to the 12
Taum Sauk failure. 13
Staff Expert/Witness: Sarah Sharpe 14
36. Low-Income Weatherization Program 15
The Ameren Missouri low-Income Weatherization Program is not a MEEIA program. 16
Therefore with respect to the Ameren Missouri Low Income Weatherization program, Staff 17
recommends the Commission order: 18
1) That the Ameren Missouri un-utilized low-income 19
weatherization funds from previous allocations remain in the Missouri 20
State Environmental Improvement and Energy Resource Authority 21
(“EIERA”) account for future use by the Ameren Missouri Weatherization 22
Agencies; 23
2) That Ameren Missouri continue to collect $1.2 million in 24
rates annually, of which $1.14 million will be for low-income 25
weatherization as currently allocated between the Weatherization 26
Agencies, and $60,000 allocated annually to the biennial evaluation of the 27
low-income weatherization program if determined by the Ameren 28
Missouri stakeholders to be appropriate; 29
3) That the second evaluation of Ameren Missouri’s 30
weatherization program include a component that evaluates the impact on 31
the gas service of the weatherization of the Company’s low-income 32
Page 139
customers that are provided both natural gas and electricity from Ameren 1
Missouri; and 2
4) That the timing of any evaluation subsequent to the second 3
biennial evaluation should be at the discretion of the Company in 4
consultation with the stakeholder group, but not less often than every 5
five years. 6
There are specific programs designed to help low-income customers with energy conservation. 7
Low-income consumers often live in housing that is energy inefficient with substandard 8
insulation and other deficiencies. These customers would benefit from building shell energy 9
conservation measures such as weatherization or more energy-efficient appliances. Missouri 10
Low Income Weatherization Assistance Program (“Weatherization Program”) is administered by 11
the Missouri Department of Economic Development, Division of Energy (“DED-DE”) using 12
federal, state, and utility funding. The DED-DE Weatherization Program is administered locally 13
by Community Action Agencies or other local agencies (“Weatherization Agencies”). The 14
Ameren Missouri Weatherization Program is administered by the DED-DE and the thirteen 15
DED-DE Weatherization Agencies listed in Appendix 3, Schedule HEW 1-1. In addition, the 16
areas served by all the DED-DE Weatherization Agencies in Missouri, with those receiving 17
funding from Ameren Missouri annotated, are shown in Appendix 3, Schedule HEW 1-2. 18
Ameren Missouri has chosen to use the Missouri State EIERA to administer their weatherization 19
funds. Ameren Missouri deposits its annual authorized low income weatherization funds for the 20
DED-DE and the Weatherization Agencies it supports with the EIERA. Subsequently, the 21
EIERA provides these funds to Ameren Missouri’s Weatherization Agencies. 22
Through the American Recovery and Reinvestment Act (“ARRA”), special federal 23
funding of $128 million was provided for the DED-DE Weatherization Program for the period of 24
April 2009 – June 2013 (“ARRA Period”). The ARRA provided an average of $6,500 of 25
weatherization for households with income at 200% or less of the Federal Poverty Guidelines 26
(FPG). In the three-year period (2006-2008), prior to the ARRA Period, federal funding for the 27
DED-DE Weatherization Program was approximately $18 million and the average amount of 28
weatherization per household was $3,000. The Weatherization Agencies had until June 2013 to 29
utilize the ARRA funding. The 200% of FPG qualification was continued and the spending limit 30

Page 140
of $6,500 was retained and is indexed each year so the most recent maximum expenditure was 1
$6,987. 2
In the October 24, 2012, ORDER APPROVING STIPULATION AND AGREEMENT 3
REGARDING LOW INCOME WEATHERIZATION PROGRAM76 (“Order”) in Case No. 4
ER-2012-0166, Ameren Missouri was ordered to continue its annual payments of $1.2 million 5
for funding of weatherization of homes of low-income Ameren Missouri electric customers and 6
was authorized to collect $1.2 million in rates annually for the Ameren Missouri low-income 7
weatherization program. For the current Program Year 2014, the budget has been modified 8
for the period as shown in Appendix 3, Schedule HEW 1-1. Due to a carryover of funds 9
from the previous year, ** ** was available at EIERA. During the 2014 Program 10
Year, ** ** (88%) was utilized by the Ameren Missouri Weatherization Agencies 11
to weatherize 393 homes, so ** ** (12%) was carried over into the 2015 program 12
year. Some of the under-utilization of Ameren Missouri funds is because of the Weatherization 13
Agencies’ focus on using the initial federal and supplemental Low Income/Heating Energy 14
Assistance Program (LIHEAP) funding. After the end of the ARRA period in March 2013, the 15
Weatherization Agencies used any Ameren Missouri funds to help provide for a higher level of 16
weatherization activity than before ARRA. The allocation and actual expenditure of each of the 17
Ameren Missouri Weatherization Agencies in the 2014 program year is also shown in 18
Appendix 3, Schedule HEW 1-1. 19
The Missouri State EIERA was established to manage and disburse federal and other 20
weatherization funds for DED-DE to the Weatherization Agencies according to DED-DE 21
guidelines. Currently, Ameren Missouri and other Missouri jurisdictional utilities utilize the 22
EIERA to manage their weatherization funds. The funds at the EIERA are invested to earn a 23
return until they are distributed so the value of the funds is enhanced. 24
Staff recommends that the Ameren Missouri unutilized low-income weatherization funds 25
from previous allocations remain in the EIERA account for future use. In addition, in order have 26
some additional Ameren Missouri funds for weatherization now that ARRA funds are no longer 27
available, Staff recommends that Ameren Missouri continue to collect $1.2 million in rates and 28 76 Public Service Commission, State of Missouri, Case No. ER-2012-0166, ORDER APPROVING STIPULATION AND AGREEMENT REGARDING LOW INCOME WEATHERIZATION PROGRAM: In the Matter of Union Electric Company d/b/a Ameren Missouri’s Tariffs to Increase its Annual Revenues for Electric Service, Issued October 24, 2012, effective Date November 3, 2012.
NP
____________
______

Page 141
provide annual funding of low-income weatherization, as currently allocated between the 1
Weatherization Agencies, and to the biannual evaluation of the low-income weatherization 2
program. Consistent with the provisions of the Order, this is intended to provide $120,000 as 3
the maximum funding for each evaluation. In the event an evaluation costs less than $120,000, 4
the remaining funds will serve to reduce the next annual $60,000 withholding. Staff notes 5
that the due date of the first evaluation was modified by the Commission Order in Case No. 6
ET-2012-0358 from April 30, 2012, to July 31, 2012. 7
Ameren Missouri is unique among jurisdictional utilities in having combination 8
customers. Therefore, the Order provided for a second evaluation including a component that 9
evaluates the impact on the gas service of the weatherization of the Company’s low-income 10
customers that are provided both natural gas and electricity from Ameren Missouri. Recently the 11
Laclede Gas Company has also agreed to furnish natural gas records for some Ameren Missouri 12
Electric customers. These results will be beneficial to the Company, Laclede Gas, Staff, the 13
Office of the Public Counsel and DED-DE in understanding the overall impact of weatherization 14
on low-income households. The low-income weatherization program and evaluation is being 15
conducted in consultation with the Ameren Missouri energy efficiency stakeholder group. 16
Staff does not support the continuous biannual evaluations of the Ameren Missouri 17
Weatherization Program. Before the second evaluation the stakeholder group should determine 18
goals for the second evaluation so it will provide additional significant results that will justify the 19
expense of the evaluation. Staff recommends that any subsequent evaluations should be at the 20
discretion of the Company in consultation with the stakeholder group. 21
Staff Expert/Witness: Henry E. Warren, PhD 22
37. Keeping Current Pilot Program 23
Ameren Missouri introduced its pilot Keeping Current energy assistance program in 24
October 2010 as a 2-year low-income pilot program and was renewed for another 2 years 25
effective June 30, 2013. The program was developed in collaboration with AARP, Consumers 26
Council of Missouri, Missouri Office of Public Counsel, Missouri Public Service Commission, 27
Missouri Industrial Energy Consumers, and the Missouri Retailers Association. 28
Customers are screened for eligibility by the local Keeping Current agency (“Agency”) in 29
their area. The two components of the program are: a year-round program that provides 30

Page 142
monthly bill credits and reduce arrearages for customers who stay current on monthly payments. 1
And a cooling program that provides bill credits in June, July, and August to offset air 2
conditioning costs. 3
The objectives of the Keeping Current Program are to improve affordability for very 4
low-income customers, promote a healthy and safe level of usage, utilize agencies that already 5
serve low-income households, and link participation to application for Weatherization and 6
LIHEAP. 7
Ameren Missouri seeks to extend the program for another two-year term, increase 8
eligibility from 100% of Federal Poverty Level to 135%, change the heating bill credits range 9
from $10.00-$55.00 to $60.00 to $90.00 for electric heating customers and from $5.00-$20.00 to 10
$25.00-$30.00 for non-electric heating customers, and to allow an Agency to request a one-time 11
re-enrollment for a customer experiencing a short-term, unanticipated financial hardship, who 12
previously would be removed automatically from the Program and not allowed back for twelve 13
months after having defaulted on two consecutive payments. 14
a. Evaluation 15
Apprise Inc. completed in November 2012 an assessment of the program’s design, 16
operations, and impact. It evaluated the Collaborative’s planning conference calls, reviewed 17
program documents, interviewed Ameren managers, and conducted two sets of interviews 18
concerning the program’s operations and how it progressed and evolved. It also conducted 19
telephone interviews of participants and conducted an analysis of the effect of the program on 20
affordability, bill payment, and collections actions. 21
b. Keeping Current Statistics 22
United Way data on Keeping Current participation: 23
Enrollments and Active Participants – Between October 2010 and 24
August 2012, 636 customers applied to enroll in the Programs. As of August 2012, 1,447 were 25
active program participants, including 1015 Cooling Program (CP) participants, 280 Electric 26
Heat Program (EHP) participants and 152 Alternative Heat Program (AHP) participants. 27
Poverty Level – Fifty-eight percent of active EHP participants, 44% of 28
AHP participants, and 14% of CP participants had income below 50% of the poverty level. 29
Vulnerable Households – Eighty-nine percent of all participants had one 30
or more household members who were elderly, disabled, or at or below six years of age. 31

Page 143
Arrearages – At enrollment, EHP participants averaged $913 in arrearages 1
and AHP participants averaged $764 in arrearages. Thirty-four percent of EHP and 27% of AHP 2
participants had arrearages over $1,000. 3
LIHEAP and WAP – Ninety-one percent of participants received LIHEAP, 4
27% received WAP services; almost all of the participants applied for these programs. 5
Employment Status – Most of the heating participants were unemployed 6
and most of the CP participants were retired. While about (23 - 30% were employed), 1% of the 7
CP participants were employed. 8
Agency Activity – Almost one-third of the enrollments came through the 9
Human Development Corporation of Metro St. Louis. Most other agencies enrolled fewer than 10
100 customers and had fewer than 50 active participants. 11
c. Agency Feedback 12
Thirteen agencies were interviewed in 2011 and 13 more were interviewed in 2012. 13
Managers and caseworkers reported that though they are becoming more comfortable with the 14
Ameren training, they needed more training on program benefits, targeting specific groups, 15
required apply for LIHEAP and weatherization services, and providing clients with energy 16
conservation education. Agencies said: 17
Ameren customer service representatives were not well equipped to 18
answer questions about the program. 19
The United Way website was easy to use, but caseworkers needed access 20
to more information through it, including the client’s budget billing amount. 21
The program was time-intensive. 22
The income guideline was too low (proposed to increase in this case). 23
Target groups (the elderly, disabled and families with children under five) 24
were difficult to reach. The elderly, in particular, were reluctant to ask for energy assistance, and 25
were difficult to recruit for participation. 26
d. Customer Feedback 27
Program participants said: 28
Household Demographics. 29

Page 144
o Home Ownership – Thirty-four percent of year-round active (including both 1
EHP and AHP), 18% of year-round inactive, and 11% of CP participants 2
owned their homes, which limits their control over their electric usage. 3
o Education –Fifty-two percent of the year-round active participants, 37% of 4
the year-round inactive participants, and 29% of the summer participants had 5
some college. 6
o Income Sources – Most CP participants were elderly, 73% had retirement 7
income, and only 4% had employment income. Twenty-eight percent of 8
year-round active and 33% of year-round inactive participants had 9
employment income. Thirty-one percent of year-round active participants 10
and 18% of year-round inactive participants had retirement income. 11
o Assistance – Forty percent of the year-round and 25% of the CP participants 12
received public assistance. Close to 80% of all participants received food 13
stamps or lived in public or subsidized housing. 14
o Unemployment – Fifty percent of the year-round active, 54% of the year-15
round inactive, and 7% of the CP participants had someone in the household 16
who was unemployed and looking for work in the past 12 months. 17
Program Knowledge and Participation 18
o Program Information – Most of the year-round participants learned about the 19
program through their local agency. CP participants were also likely to learn 20
about the program through a social worker, senior coordinator, or their 21
housing complex. 22
o Enrollment Reasons – The most common reason for enrolling was to reduce 23
electric bills. Year-round participants were also wanted to avoid shutoff, 24
have budget bills, or reduce their arrearages. 25
o Enrollment Difficulty – Participants did not say that enrollment was difficult, 26
but a large number said that it was difficult to make up-front cash payment 27
toward their arrearages as a condition of enrolling. Forty percent of the year-28
round active and 34% of year-round inactive participants said that it was 29
difficult to make the payment. 30

Page 145
o Most Important Program Benefit – Participants said the most important 1
benefit was equal monthly bills, followed by bill credit, arrearage reduction, 2
and avoiding shutoff. They also said Ameren should encourage all low-3
income customers to participate in budget billing. 4
o Bill Credit and Arrearage Reduction Benefit Knowledge – Only 37% of the 5
year-round active and 23% of the year-round inactive participants could 6
correctly state the monthly credit amount. However, 62% of the CP 7
participants correctly reported their summertime bill credit amount and a few 8
could state the correct arrearage reduction monthly amount. Participants said 9
that Agency staff should spend more time educating them on the benefits of 10
the program and how to read their monthly bills. 11
o Referrals – Only 24% of year-round active participants, 37% of year-round 12
inactive participants and 18% of CP participants said that the agency referred 13
them to other services for low income households when they applied for 14
Keeping Current. They also said that Agencies should spend more time 15
helping customers to find and apply for other services and benefits. 16
Program Impacts – Keeping Current Program helped customers pay their Ameren 17
bill, meet other needs, and use their air conditioning. However, a majority reported 18
that they needed even more assistance to pay their Ameren bill. 19
o Ameren Bill Payment Difficulty – Seventy-one percent of year-round active 20
participants stated that it was very difficult to pay their Ameren bill prior to 21
enrollment, 12% said it was very difficult to pay their bill while participating 22
in the program. 23
o Assistance Needed –Fifty percent of year-round active participants, 69% of 24
year-round inactive participants, and 73% of CP participants said they needed 25
additional assistance to pay their bill. 26
o Other Financial Problems – Participants were less likely to report that they 27
skipped paying their bill or went without food, medicine, medical or dental 28
service, mortgage or rent, telephone or cable, credit care or loan, and car 29
payments after they began participating in Keeping Current. 30

Page 146
o Air Conditioning Use – Participants were less likely to not use their air 1
conditioning when they wanted for fear of what the bill would be 44% of 2
those in the CP stated that they did not use their air conditioning prior to 3
enrolling, 33% said that they did not use their air conditioning while 4
participating in the CP. Percentages for the subgroup of elderly CP 5
participants (who comprised most of the CP participants) were very similar. 6
The year-round participants were more likely to state that they restricted their 7
air conditioning usage prior to participating in the program and had a larger 8
reduction in the percentage who said that they did so. 9
o Changes in Cooling Usage – Twenty-six percent of the CP participants 10
reported that they changed the way they cool their home as a result of the CP. 11
Among those, 11% said that they used their air conditioner more often and 12
7% kept their home at a cooler temperature. 13
LIHEAP and Weatherization Assistance – All participants are required to apply for 14
LIHEAP and Weatherization (if they have not already received weatherization 15
services). 16
o LIHEAP Assistance – The survey found that only 28% of year-round active 17
and 35% of CP participants reported that they received LIHEAP in the past 18
year. Participants said that those who did not receive LIHEAP did not apply 19
for it because they did not know about it. If they applied for Keeping Current 20
when LIHEAP enrollment was not open, they should have been notified to 21
apply when enrollment reopened. 22
o Weatherization Assistance – The survey found that 31% of active year-round 23
participants and 21% of CP participants received weatherization assistance, 24
some had already received weatherization and some were on a waiting list. 25
Program Satisfaction – Participants rated the Program as very or somewhat 26
important in helping to meet their needs (92 to 98% across the different program 27
participant groups). They were likely satisfied with the agency that enrolled them 28
and with the program as a whole (100% of year-round active participants and 95% of 29
the CP participants were very or somewhat satisfied with the program). 30

Page 147
The year-round inactive participants were less likely to report that they were 1
satisfied. 2
e. Keeping Current Impacts 3
Bill Credits – Seventy-one percent of the participants received the bill credit in the 4
first month after enrollment, declining to only 24% in the twelfth month after 5
enrollment. Total bill credits averaged $153 for EHP participants and $60 for AHP 6
participants. 7
Arrearage Reduction – 57% percent received arrearage reduction in the first month 8
after enrollment, the percent declining each month. Participants who began with 9
arrearages reduced those by $221 (average) in the year following enrollment. 10
Affordability – Participants reduced their bills and received credits. EHP participants 11
reduced their payment obligation by $278, or 15%, and AHP by $104, or 7%. 12
Bill Payment Impacts – Participants were more likely to pay their full bill and less 13
likely to miss payments following program enrollment. EHP participants increased 14
net bill payment coverage rate by 12% and AHP by 13%. 15
Energy Assistance –Participation did not alter the likelihood of receiving LIHEAP, 16
and LIHEAP dollars received declined due to reduced funding. EHP participation 17
did increase the amount of other types of energy assistance received. 18
Collections Impacts – Participation reduced collections notices, service terminations, 19
and payment arrangements. 20
f. Recommendation 21
Based on Staff review of the program evaluation by Apprise, Inc. and the changes made 22
to the program, Staff recommends the Keeping Current pilot program continue with the annual 23
contribution approximately $581,000 from a customer surcharge $500,000 Ameren Missouri 24
contributing $500,000 annually. 25
Staff supports the changes in eligibility and support amounts, recommends better training 26
of Ameren customer service representatives to increase referrals to Agencies, and better training 27
of Agency personnel to enroll participants in all of the services to which they are entitled. 28
Although other programs may not be directly associated with affordability of utilities, they 29
Page 148
indirectly effect payment ability, because a household that receives other services has money 1
freed up to pay its utility bill. 2
Staff Expert/Witness: Kory Boustead 3
g. Keeping Current program - Removal of Revenue and Expense 4
Staff has removed all amounts related to Ameren Missouri’s low-income surcharge, titled 5
the “Keeping Current” program. This program’s costs and revenues are accounted for outside of 6
Staff’s Cost of Service calculation. 7
Staff Expert/Witness: Sarah Sharpe 8
F. Depreciation Expense 9
1. Staff Recommendation 10
Staff’s recommended depreciation rates for Ameren Missouri electric operations are 11
shown in Appendix 3, Schedule AWR-1. 12
2. Depreciation and Depreciation Rate Overview 13
a. Plant In Service Review 14
During the Ameren Missouri 2012 electric rate case (Case No. ER-2012-0166), 15
issues were raised by Staff concerning Ameren Missouri’s plant records, specifically that some 16
plant recorded on its books appeared to no longer be in service or, when Staff asked to view it, 17
Ameren Missouri could not locate it. In March of 2013, Ameren Missouri initiated a review 18
of the Production Plant, Distribution Plant and Transmission Plant assets on its books. 19
Ameren Missouri conducted a full inventory of its unitized77 production (steam, nuclear, 20
hydraulic, and other) assets. For the Transmission and Distribution assets consisting of over 21
700 substations, Ameren Missouri site-reviewed its plant in service at 50 randomly-selected 22
substations. Ameren Missouri did not review non-unitized, miscellaneous, land, and asset 23
retirement obligations (AROs). 24
This plant in service review resulted in retirement entries for plant on Ameren Missouri’s 25
books, even though that plant had been previously removed from service. These retirements 26 77 Unitized plant consists of plant recorded as property units for retirement. Non-unitized plant in service represents recent additions of capital that are in service, but not yet recorded as retirement units with detailed item descriptions.

Page 149
were entered periodically during the review as having occurred on the date Ameren Missouri 1
discovered them during the review. No cost of removal or salvage was booked for these 2
retirements. The table titled, “Ameren Missouri Asset Review Summary - Additional 3
Retirements,” below presents the approximate dollar amounts of plant retired as a result of 4
this review. 5
6
7
A reduction of approximately $4.5 million in depreciation expense would occur due to 8
the $198 million additional retirements if depreciation rates remained unchanged, but Staff is 9
recommending a change in depreciation rates in this case. A majority of these additional 10
retirements were recorded during the fourth quarter of 2013, and are included in the depreciation 11
study data submitted in this rate case. John Spanos of Gannett Fleming, Ameren Missouri’s 12
depreciation consultant, submitted a depreciation study as part of his direct testimony in this rate 13
case. The $198 million of additional retirements included in his depreciation study reduces 14
average service lives, and thus results in an increase in depreciation rates, which, in turn, adds 15
approximately $4.5 million back into depreciation expense for this case. 16
Ameren Missouri Plant Asset Review SummaryAdditional Retirements In Millions of Dollars 4th Qtr 2013
Assets Not Reviewed
PlantTotal
Booked Assets
Non Unitized
Land, ARO & Other
Misc Items
Total Assets
reviewed
% of Assets
reviewed
Additional Retires
Retired As % of Assets
Retired As % of Reviewed
Steam Production 3,849 1,127 42 92 2,505 65.1% 83 2.1% 3.3%
Hydraulic Production 444 112 13 3 289 65.1% 26 5.9% 9.1%
Other Production 1,258 422 7 5 815 64.8% 9 0.7% 1.1%
Callaway 2,851 83 10 17 2,663 93.4% 78 2.7% 2.9%
Total Generation 8,402 1,744 72 118 6,271 74.6% 197 2.3% 3.1%
Substation sample 74 73 98.8% 1 1.2% 1.2%
Total Reviewed 8,476 1,744 72 118 6,345 74.9% 198 2.3% 3.1%
GP Amortization 207 Reviewed As Vintages 207 100.0% 55 26.3% 26.3%
Other Accounts 0
Total Plant 14,659 6,552 44.7% 252 1.7% 3.8%

Page 150
Depreciation Staff does not consider Ameren Missouri’s $198 million of additional 1
retirements a rate-making issue in this case. In June of 2014, Staff met with Ameren Missouri 2
personnel at their headquarters located in St Louis. Topics discussed at that meeting included the 3
methods Ameren Missouri used when conducting its physical inventory, the breadth of the plant 4
in service actually physically inventoried, the type and quantity of retirements that resulted from 5
the inventory, and the procedural controls that were in place to help ensure the accuracy of its 6
book records versus its actual plant in service. It is Staff’s opinion that Ameren Missouri has 7
significantly improved its current plant records, and if procedural controls put in place in recent 8
years are actually practiced, these improvements should continue into the future. It is also 9
Staff’s opinion that Ameren Missouri should continually strive toward more stringent internal 10
controls to aid in identifying when units of property are removed from service. 11
b. General Plan Amortization 12
Staff recognizes that the record-keeping procedural controls discussed above for 13
Production Plant units of property are not suited to General Plant accounts that are made up of 14
large numbers of smaller items with lesser values that are widely distributed over many facility 15
sites. Therefore, for certain specific General Plant accounts, Staff recommends that the alternate 16
method of depreciation accounting Ameren Missouri witness Spanos proposes in his direct 17
testimony be used. This alternate method is often referred to as “amortization accounting,” 18
“vintage year accounting,” or “General Plant Amortization” (“GP Amortization”). If the 19
Commission approves a switch to GP Amortization for specific accounts as Mr. Spanos proposes 20
and Staff recommends, then approximately $55 million of additional retirements will be recorded 21
to Ameren Missouri’s General Plant accounts at the effective date of the Commission’s order. 22
These GP Amortization retirements are shown in the Ameren Missouri Asset Review Summary 23
table above, bringing the total plant asset review retirements to approximately $253 million, or 24
approximately 1.7% of total plant in service. 25
The GP Amortization retirements are inherent to the process of switching to a vintage 26
amortization method in that all units of property recorded on the company’s books that have a 27
vintage date older than the amortization period are retired. Going forward for these GP 28
Amortization accounts, the dollars of plant in service shown on the company’s books will 29
represent all vintage property that has not exceeded its amortization life. The dollars 30
representing a vintage will be retired at the end of the amortization period. In practice, the 31

Page 151
dollars in service, and the resultant deprecation (amortization) expense, will represent vintage 1
dollars, and not the actual units of property in service. 2
For this rate case, the additional retirements associated with a change to GP Amortization 3
will reduce annual depreciation expense by approximately $6.0 million. 4
In addition to the retirements inherent to a switch to GP Amortization, an adjustment to 5
the accumulated reserves for each GP Amortized account is necessary. This adjustment is to 6
align the accumulated reserves with the appropriate amount of deprecation (amortization) 7
associated with each vintage amortized account. If the Commission adopts Staff’s 8
recommendation and approves Ameren Missouri’s proposal to use the General Plant 9
Amortization method, the accumulated depreciation reserve for these accounts will exceed the 10
appropriate amortization amount by approximately $25 million. Ameren Missouri proposes to 11
return this $25 million to ratepayers over five years at approximately $5 million per year as a 12
reduction in depreciation expense used to determine revenue requirement in this rate case. 13
While Staff agrees with switching the depreciation accounting methodology for certain 14
general plant accounts, Staff does not agree with Ameren Missouri’s proposal to return the 15
$25 million of General Plant excess depreciation reserves by $5 million a year. Staff 16
recommends transferring this General Plant reserve excess to reserve accounts for two of 17
Ameren Missouri’s steam production plant facilities that have a deficit in accumulated 18
depreciation. In essence, the excess depreciation dollars that have been paid in customer rates 19
for the general plant accounts would be credited (transferred) to steam production accounts. 20
One of these steam production facilities is Venice, a retired facility. The Venice steam 21
production plant was retired in 2002, and environmental cleanup, demolition, and disposal were 22
completed in 2013. During three visits over the past several years, Staff has observed the 23
progression of the removal of the steam production plant at Venice. The cost of removal and 24
salvage for these large plants often continues for many years, and is recorded to the company’s 25
plant depreciation reserves. The Venice steam plant accounts currently show an accumulated 26
depreciation reserve deficit of $17,219,969. Staff recommends that $17,219,969 of the 27
$25 million general plant excess be transferred to the Venice steam plant depreciation reserve 28
account in order to eliminate the approximate $17.2 million depreciation reserve balance 29
currently reflected on Ameren Missouri’s books for the retired Venice steam plant. Staff 30
recommends that the remainder of the $25 million general plant excess reserve, approximately 31

Page 152
$7.8 million, be transferred to Ameren Missouri’s Uniform Systems of Accounts (USOA) 1
depreciation reserve account 312 for its Meramec boilers. The Meramec steam plant accounts in 2
aggregate show an accumulated reserve deficit of approximately $77 million, with the majority, 3
$74 million, attributable to the Meramec boilers account 312. Ameren Missouri has announced 4
it plans to retire the Meramec steam plant in 2022; therefore, it is expected to be the next 5
“Venice” with respect to recording additional cost to reserves for environmental cleanup, 6
demolition and disposal. Therefore, after the reserve deficit for Venice is accounted for, Staff 7
recommends transferring the approximately $7.8 million of excess depreciation reserve resulting 8
from the switch to the GP Amortization method to Meramec boilers USOA account 312. 9
Note: The above referenced reserve excesses and deficiencies are shown as of 10
December 31, 2013. The numbers are shown to represent the nature of the transactions and 11
the approximate magnitude; all these numbers will be updated through the December 31, 2014, 12
true-up date for this rate case. 13
As part of the stipulation and agreements that were entered into and subsequently 14
approved by the Commission in Kansas City Power & Light Company’s and KCP&L Greater 15
Missouri Operations Company’s 2012 general rate increase cases, Case Nos. ER-2012- 0174 and 16
ER-2012-0175, respectively, these two electric utilities are permitted to utilize the GP 17
Amortization methodology. Staff recommends the Commission adopt Ameren Missouri’s 18
proposal in this rate proceeding to switch to GP Amortization. 19
The Federal Energy Regulatory Commission (FERC) allows, without specific 20
authorization, the use of vintage year accounting (GP Amortization) for general plant accounts as 21
a bookkeeping method that eliminates unitization and record-keeping requirements associated 22
with individual items of property, and allows companies to record only the total cost of plant 23
additions for the year as a vintage group for each account, provided all of the following 24
requirements are met: 25
1. the individual classes of assets for which vintage year accounting is 26 followed are high-volume, low-value items; 27
2. there is no change in existing retirement unit designations, for purposes of 28 determining when expenditures are capital or expense; 29
3. the cost of the vintage groups is amortized to depreciation expense over 30 their useful lives and there is no change in depreciation rates resulting from the 31 adoption of the vintage year accounting; 32

Page 153
4. interim retirements are not recognized; 1
5. salvage and removal cost relative to items in the vintage categories are 2 included in the accumulated depreciation account and assigned to the oldest 3 vintage first; and 4
6. properties are retired from the affected accounts that, at the date of the 5 adoption of vintage year accounting, meet or exceed the average service life of 6 properties in that account. 7
7. Additional Requirement: As part its recommendation to the Commission 8 in this rate case, Staff requests that the Commission order Ameren Missouri to 9 comply with one requirement in addition to the requirements listed above. 10 Specifically, the account also must have a demonstrated zero net salvage. 11
c. Retirement of the Meramec Plant 12
Depreciation Staff does not oppose Ameren Missouri’s proposed retirement date of 2022 13
for the computation of depreciation rates for its Meramec steam plant accounts in this rate case. 14
However, Staff recognizes that the actual retirement date of the Meramec steam plant is in no 15
way defined by, or a function of, an estimated date used to compute depreciation rates, and 16
future proposed plant retirement dates may change. 17
Ameren Missouri’s proposed 2022 retirement date for the Meramec steam production 18
facility yields a life for depreciation rate computation that is five years shorter than the 19
Commission ordered in Case No. ER-2010-0036 (“2010 rate case”). The 2010 rate case is 20
Ameren Missouri’s most recent prior rate case where a general depreciation review occurred that 21
included a depreciation study. 22
In the 2010 rate case, Ameren Missouri proposed a retirement date of 2022 for the 23
Meramec steam production facility, and submitted a Black and Veatch study on steam plant life 24
that supported the 2022 retirement date for Meramec. Staff did not oppose the 2022 retirement 25
date in the 2010 case. However, interveners in the 2010 case did oppose the 2012 retirement 26
date, and, ultimately, the Commission ordered a five-year extension to Ameren Missouri’s 27
proposed Meramec life span to a retirement date of 2027. In the current Ameren Missouri rate 28
case, Ameren Missouri witness Larry Loos sponsors a Black and Veatch study that supports a 29
2022 retirement date for Meramec. 30

Page 154
The use of a 2022 date versus a 2027 date for the expected retirement of the Meramec 1
steam plant increases depreciation expense, (computed on Dec 31, 2013, plant balances), by 2
approximately $17 million per year for this rate case. 3
d. Retirement of the Rush Island Plant 4
Depreciation Staff does not oppose Ameren Missouri’s proposed use of a retirement date 5
of 2045 as a basis to compute depreciation rates for the Rush Island steam plant accounts. 6
Ameren Missouri has proposed using the year 2045 as the retirement date for the Rush 7
Island steam production facility, as opposed to a date of 2046 that was used to calculate the 8
current depreciation rates. The Black & Veatch 2010 study shows 2046 while the 2013 update 9
shows 2045. This one-year change is proposed by Ameren Missouri due to the timing of the 10
retirements of other steam plant. A one-year shorter life span for the Rush Island steam plant 11
will increase depreciation expense, computed on December 31, 2013, plant balances, by 12
approximately $0.4 million per year for this rate case. However, Staff recognizes that the actual 13
retirement date is in no way defined by, or a function of, an estimated date used for a 14
depreciation rate computation, and future proposed plant retirement dates may change. 15
e. Staff’s Review of Ameren Missouri’s Submitted Depreciation 16 Study 17
Staff continues to review Ameren Missouri’s depreciation study sponsored by its witness 18
Mr. Spanos. Staff has requested and received further information and clarification on specific 19
questions related to Mr. Spanos’ study. At this time, Staff has reviewed the historical retirement, 20
cost of removal and salvage data files, conducted a depreciation analysis using Staff’s version of 21
the Gannett Fleming depreciation software, and verified the depreciation study results submitted 22
by Mr. Spanos. Staff’s findings agree with the depreciation rates Mr. Spanos proposes on behalf 23
of Ameren Missouri, with the exception of two of the distribution plant accounts, USOA 24
Account 364 (Poles and Fixtures) and USOA Account 369.01 (Overhead Services). Staff is of 25
the opinion that the accrual of net salvage for these two accounts is excessive. 26
At December 31, 2013, Ameren Missouri’s accumulated depreciation reserves contained 27
accruals for future cost of removal of $6,138,979 for steam plant, $8,759,515 for hydro plant, 28
and $788,572,119 for all other plant accounts. Staff’s position is that the $800 million is 29
sufficient to provide for any near-term interim cost of removal. 30

Page 155
Ameren Missouri’s proposed depreciation rate for Account 364 (Poles and Fixtures) is 1
computed using a negative net salvage of 150%. This is an assumption that to remove these 2
poles and fixtures in the future it will cost 150% of the original cost to install them. The result is 3
an accrual rate to accomplish an accumulated accrual of 250% of the original cost over the life of 4
the asset. Even though the negative 150% net salvage assumption is supported by historical cost 5
of removal and salvage data, Staff believes that any current accrual of more than twice the 6
original cost on a long-lived asset, a net salvage more negative than 100% negative, is excessive. 7
This account has a composite remaining life for the current dollars in service of approximately 8
34 years. 9
As long as poles and wires continue to be used to serve customers, retirements and 10
additions will continuously occur, such that a composite remaining life of approximately 11
34 years will be continually pushed into the future, remaining each year at 30 or more years for 12
many years into the future. Since this is a continuously-living account, that is a mass asset 13
account where worn or damaged components are replaced while the asset continues to provide 14
the same basic service, with an average service life of approximately 45 years, a significant 15
portion of the future net salvage percentage for cost of removal is a function of inflation. 16
There is no expectation in the foreseeable future that the composite remaining life will approach 17
zero; therefore, the inflation component will provide sufficient accruals to address any cost of 18
removal in the foreseeable future, even if the net salvage is limited to a negative 100%. For 19
accounts accruing more than 100% for cost of removal, there is reasonable expectation that 20
accumulated reserves could exceed original cost, which would result in a negative rate base for 21
that account. For a continuously-living account, Staff’s position is that it is not practical or 22
prudent to recommend a depreciation rate that is expected to produce a negative rate base. 23
Therefore, Staff recommends a maximum rate of accrual for cost of removal of 100%, which is a 24
negative 100% net salvage for Account 364. Staff’s recommended depreciation rate for Account 25
364 using a negative 100% net salvage component is 3.55%. Ameren Missouri proposes a 26
depreciation rate using a negative 150% net salvage component—5.03%. Staff’s 27
recommendation results in a deprecation accrual rate of approximately $14 million per year less 28
than Ameren Missouri’s proposal. 29
Ameren Missouri’s proposed depreciation rate for USOA Account 369.01 (Overhead 30
Services) is computed using a negative net salvage of 200%. For the same reasons discussed 31

Page 156
above for USOA Account 364, Staff recommends a negative net salvage of 100% for this 1
account. USOA Account 369.1 is currently contributing a negative rate base of approximately 2
$52 million; where accumulated reserves are $231 million for only $179 million of original cost 3
plant, and has a composite remaining life of approximately 30 more years. Staff’s recommended 4
depreciation rate for Account 369.01 using a negative 100% net salvage component is 2.37%. 5
Ameren Missouri proposes a depreciation rate using a negative 200% net salvage component—6
5.72%. Staff’s recommendation results in a deprecation accrual rate of approximately $6 million 7
per year less than Ameren Missouri’s proposal. 8
Staff recommends adding two new plant account depreciation rates that Ameren Missouri 9
did not address, USOA Account 344 Generators – Wind with a depreciation rate of 6.81%, and 10
USOA Account 363 – Energy Storage Equipment (Batteries) with a depreciation rate of 11.76%. 11
These two plant accounts’ depreciation rates were taken from a depreciation study and proposal 12
Mr. Spanos filed on behalf of Kansas City Power & Light Company on October 30, 2014, in its 13
pending general rate increase case, Case No. ER-2014-0370. Ameren Missouri currently does 14
not have plant recorded in either of these accounts. Staff is recommending that the Commission 15
approve the use of these two new depreciation account rates for possible future additions that 16
Ameren Missouri may place in service prior to any future rate case that would address 17
depreciation rates. 18
f. Depreciation Expense – Truncation of Terminal Net Salvage 19
Ameren Missouri’s depreciation rates proposal, and Staff’s recommended depreciation 20
rates schedule, include depreciation rates for steam, nuclear, and hydraulic production plant 21
accounts that are intentionally computed to eliminate collection of expected future terminal net 22
salvage. Future terminal net salvage is net of cost of removal and salvage expected to occur in 23
the future when a large facility is removed from service and retired. It is essentially the future 24
expected cost of the process of environmental cleanup, demolition, and disposal of the facility. 25
The Commission’s Report and Order for The Empire District Electric Company 26
(“Empire”), Case No. ER-2004-0570, dated March 10, 2005, made a distinction between interim 27
and terminal net salvage. The Commission stated on page 53 of the order in that case that “the 28
Commission will not allow the accrual of any amount for Terminal Net Salvage of Production 29
Plants.” The current depreciation rates ordered by the Commission for Ameren Missouri 30
incorporate a net salvage rate term in the depreciation rate computation for its steam, nuclear, 31

Page 157
and hydraulic production plant accounts that specifically excludes the accrual of terminal net 1
salvage, leaving only accruals for interim net salvage. As an example, the basic net salvage 2
analysis for this rate case yields a net salvage rate of negative 16.9% for all steam plant accounts. 3
Ameren Missouri witness Spanos introduced a procedure in his direct testimony 4
depreciation study for the Ameren Missouri 2010 rate case that examines each production plant 5
facility to estimate expected future needs for interim versus terminal net salvage for each account 6
and applies a weighted average correction to eliminate terminal net salvage. The Commission 7
Report and Order for the 2010 case directed that the depreciation rates derived from Mr. Spanos’ 8
study be approved, with the exception of the Commission’s extension of life span for the 9
Meramec plant by five years. The depreciation rates ordered by the Commission in the 2010 rate 10
case are the current ordered depreciation rates for Ameren Missouri. For the current rate case, 11
this same procedure to eliminate terminal net salvage results in a negative 3.9% net salvage rate 12
for all steam plant accounts. The difference in annual depreciation accruals for steam plant is 13
approximately $30 million lower for a negative 3.9% net salvage rate versus a negative 16.9% 14
net salvage rate. 15
At December 31, 2013, Ameren Missouri’s accumulated depreciation reserves contained 16
accruals for future cost of removal of $6,138,979 for steam plant, $8,759,515 for hydro plant, 17
and $788,572,119 for all other accounts. Thus, Ameren Missouri’s accumulated depreciation 18
reserves currently contain over $800 million for future cost of removal. Staff recognizes that 19
future terminal cost of removal will occur and will be addressed in future rate cases when a large 20
production facility is removed from service. In the interim, Staff anticipates that this $800 21
million already accrued for the overall plant cost of removal is sufficient to provide for Ameren 22
Missouri’s needs until that future rate case. 23
The few steam production plants that have been retired in Missouri where Staff has 24
retirement, cost of removal, and salvage data for the retired facility, tend to show a positive net 25
salvage in the early years after retirement due to the sale of salvageable components. Any 26
dollars collected from salvage are recorded to depreciation reserves, but subsequent cleanup cost 27
such as ash pond closures, flue stack removal and asbestos removal, which are also recorded to 28
deprecation reserves, gradually offset any salvage dollars received. For the Venice steam plant 29
facility, the net cost to remove the facility over the 11 years after retirement accumulated to 30
approximately $24 million. 31

Page 158
3. Staff’s Depreciation Summary 1
The table below is a comparison of annual depreciation accruals, using plant balances as 2
of December 31, 2013, based on Ameren Missouri’s currently ordered depreciation rates versus 3
Ameren Missouri’s proposed depreciation rates and Staff’s currently recommended deprecation 4
rates. 5
6
7
Staff’s recommended depreciation rates for Ameren Missouri electric operations would, 8
as reflected in the above table, result in an annual depreciation expense that would be 9
approximately 0.3% less than the current deprecation rates in effect, and 3.6% less than Ameren 10
Missouri’s proposal. Staff’s recommended depreciation rates are shown in Appendix 3, 11
Schedule AWR-1. 12
Staff Expert/Witness: Arthur W. Rice, PE 13
Comparisons Annual Accruals Using Plant Balances at 12/31/2013
Current
Depreciation
Rates
Company
Proposal
Staff
Proposal
Company
Proposal
Increase
Staff
Proposal
Increase
$/yr $/yr
Meramec 29,409,352 46,350,679 46,350,679 16,941,327 16,941,327
(5 year shorter life span)
General Plant Amortization 17,523,414 11,517,684 11,517,684 (6,005,730) (6,005,730)
5 Year Amortization of Over Accruals
In GP Amortized Accounts(4,985,427) 0 (4,985,427) 0
Account 364, 150% versus 100% Net
salvage52,740,391 48,430,977 34,164,180 (4,309,414) (18,576,211)
Account 369.01, 200% versus 100%
Net salvage13,834,043 10,230,844 4,247,645 (3,603,199) (9,586,398)
All Other Accounts 300,243,705 316,393,755 316,229,969 15,986,264 15,986,264
Summary
Overall Company 413,750,905 427,938,512 412,510,157 14,187,607 (1,240,748)

Page 159
4. Project First (Enterprise System) 1
During the twelve-months ending September 30, 2011, the test year of Case No. 2
ER-2012-0166, Ameren Missouri initiated Project First to replace a number of Ameren 3
Corporation’s unsupported and high-risk financial systems. While several components of that 4
project were taken into account in the last case, Phase II of this project took place in July 2014, 5
subsequent to the test year in this case. Therefore Staff will continue its review of the costs 6
associated with Phase II as part of its true-up audit in this case. 7
Staff Expert/Witness: Jason Kunst 8
5. Capitalized Depreciation 9
Expenses related to construction are accumulated in construction-work-in-progress 10
accounts, and are only eligible to be included in rates subsequent to the completion of the 11
project. The capitalized expenses include depreciation expense associated with assets used in 12
construction such as power operated equipment and transportation equipment. Capitalized 13
depreciation expenses must be subtracted from the depreciation expense calculated using 14
Ameren Missouri’s total plant-in-service balances in order to prevent double recovery. 15
Therefore, Staff has deducted capitalized depreciation from its total depreciation expense in 16
order to arrive at the amount of depreciation expense associated with operations and maintenance 17
related functions. 18
Staff Expert/Witness: Brian Wells 19
6. Eliminate Depreciation on Coal Cars 20
Staff removed from its case the estimated amount of depreciation expense accrued for 21
Ameren Missouri’s coal cars as of December 31, 2014. This cost is reflected as part of fuel costs 22
that are included as an input in Staff’s production cost model, and should not be included in 23
annualized depreciation expense. 24
Staff Expert/Witness: Lisa M. Ferguson 25

Page 160
G. Income Tax 1
Income tax expense, as calculated by Staff, is largely consistent with the methodology 2
used in Ameren Missouri’s last rate case, Case No. ER-2012-0166. The adjustments made by 3
Staff begin by taking adjusted net operating income before taxes and adding to or subtracting 4
from net income various timing differences in order to obtain net taxable income for ratemaking 5
purposes. These “add back” and/or subtraction adjustments are necessary to identify new 6
amounts for the tax deductions that are different from those levels reflected in the income 7
statement as revenues or expenses. The adjustments are the result of various book versus tax 8
timing differences and the effect of such differences under separate tax methods: flow-through 9
versus normalization. A tax timing difference occurs when the timing used in reflecting a cost 10
(or revenue) for financial reporting purposes (book purposes) is different than the timing 11
required by the IRS in determining taxable income (tax purposes). Current income tax reflects 12
timing differences consistent with the timing required by the IRS. The tax timing differences 13
used in calculating taxable income for computing current income tax are as follows: 14
Add Back to Operating Income Before Taxes: 15
Book Depreciation Expense 16
Book Depreciation Charged to O&M 17
Transmission Amortization 18
Hydraulic Amortization 19
Callaway Post Operational Costs 20
Intangible Amortization 21
Subtractions from Operating Income: 22
Interest Expense – Weighted Cost of Debt X Rate Base 23
Tax Straight-Line Depreciation 24
Nuclear Decommissioning 25
Production Income Deduction 26
Preferred Dividend Deduction 27
The tax normalization method defers for ratemaking purposes the deduction taken for tax 28
purposes for certain tax timing differences. The effect of use of tax normalization is to allow 29

Page 161
utilities the net benefit of certain net tax deductions for a period of time before those benefits are 1
passed on to the utility’s customers in rates. The flow-through tax method essentially provides 2
for the same tax deduction taken as a deduction for ratemaking purposes as is taken for tax 3
purposes. Under either the tax normalization or tax flow-through approach, the resulting net 4
taxable income for ratemaking is then multiplied by the appropriate federal, state and city tax 5
rates to obtain the current liability for income taxes. A federal tax rate of 35 percent, a state 6
income tax rate of 6.25 percent, and a city tax rate of 0.1009 percent were used in calculating 7
Ameren Missouri’s current income tax liability. The difference between the calculated current 8
income tax provision and the per book income tax provision is the current income tax provision 9
adjustment. 10
Staff will review income tax expense as part of its true-up audit and make additional 11
adjustments as necessary. 12
Staff Expert/Witness: Lisa K. Hanneken 13
X. Fuel Adjustment Clause (FAC) 14
A. Policy 15
In summary, Staff makes the following recommendations to the Commission regarding 16
Ameren Missouri’s FAC: 17
Continuation of Ameren Missouri’s FAC with modifications; 18
Ameren Missouri’s FAC tariff sheets should be revised to reflect re-basing of 19
the Winter and Summer Base Factors78. Staff’s recommendation will be 20
discussed in Staff’s Class Cost-of-Service/Rate Design Report to be filed on 21
December 19, 2014; 22
Ameren Missouri’s FAC tariff sheets should be revised to clarify that the fuel 23
costs related to the Company’s landfill gas generating plant known as Maryland 24
Heights Energy Center are excluded from the FAC; and 25
Ameren Missouri should provide additional monthly filings that will aid Staff 26
in performing FAC tariff, prudence and true-up reviews. 27
Staff Expert/Witness: Matthew J. Barnes 28 78 The Winter Base Factors are applicable from October through May. The Summer Base Factors are applicable from June through September.

Page 162
1. History 1
Senate Bill 17979 (“SB 179”) was passed and enacted in 2005. It authorizes 2
investor-owned electric utilities to file applications with the Commission requesting authority to 3
make periodic rate adjustments outside of general rate proceedings for their prudently-incurred 4
fuel and purchased-power costs. SB 179 granted the Commission the authority to approve, 5
modify, or reject the electric utility’s request. SB 179 also states that the rate schedules 6
implementing these rate adjustments outside of rate cases may provide the electric utility with 7
incentives to improve the efficiency and cost-effectiveness of its fuel and purchased-power 8
procurement activities. 9
Prior to the passage of SB 179, fuel and purchased-power costs were estimated and 10
included in the determination of the utility’s annual revenue requirement in general rate 11
proceedings. If the electric utility managed its fuel and purchased-power procurement activities 12
in a manner that allowed it to reliably serve its customers at a cost lower than what was included 13
in its annual revenue requirement in its last general rate proceeding, the savings were retained by 14
the electric utility. If actual fuel and purchased-power costs were greater than the cost included 15
in the annual revenue requirement in its last general rate proceeding, the electric utility absorbed 16
the increased cost. 17
Ameren Missouri, then doing business as AmerenUE, first requested that the 18
Commission authorize it to use a FAC when it filed a general electric rate increase case, Case 19
No. ER-2007-0002, on July 3, 2006. This request was made prior to the finalization of the 20
Commission’s FAC rules.80 In its May 22, 2007, Report and Order in that case, the Commission 21
concluded: 22
After carefully considering the evidence and arguments of the parties, and 23 balancing the interests of ratepayers and shareholders, the Commission 24 concludes that AmerenUE’s fuel and purchased power costs are not 25 volatile enough [to] justify the implementation of a fuel adjustment clause 26 at this time. 27
Ameren Missouri filed another general electric rate increase case on April 4, 2008, docketed as 28
Case No. ER-2008-0318. In its February 2009, Report and Order in that case, the Commission 29
authorized Ameren Missouri, still then doing business as AmerenUE, to begin implementation of 30 79 Section 386.266, RSMo. 2010 Cum. Supp. 80 4 CSR 240-3.161 and 4 CSR 240-20.090.

Page 163
a FAC. Ameren Missouri filed another general rate increase case on July 24, 2009, docketed as 1
Case No. ER-2010-0036. In its Report and Order in Case No. ER-2010-0036, the Commission 2
concluded AmerenUE should be allowed to continue its FAC with modifications. Revised tariff 3
sheets, including FAC tariff sheets, became effective in that case on June 21, 2010. 4
On August 31, 2010, Staff filed in Case No. EO-2010-0255 the results of its first FAC 5
prudence audit which covered Ameren Missouri’s accumulation periods 1 and 2 (March 1, 2009, 6
through September 30, 2009). In its Report and Order issued on April 27, 2011, in that case, 7
the Commission determined that “Ameren Missouri acted imprudently, improperly and 8
unlawfully when it excluded revenues derived from power sales agreements with [American 9
Electric Power Operating Companies (“AEP”)] and [Wabash Valley Power Association 10
(“Wabash”)] from off-system sales revenue when calculating the rates charged under its fuel 11
adjustment clause.” Ameren Missouri began flowing back revenues from the AEP and Wabash 12
contracts, plus accrued interest, of approximately $18 million in the twelve-month recovery 13
period beginning with its October 2011 billing month. 14
On July 30, 2010, just 37 days after the changes to the rates in Ameren Missouri’s 15
general rate case (Case No. ER-2010-0036) became effective; Ameren Missouri filed another 16
rate case docketed as Case No. ER-2011-0028. In that case Ameren Missouri requested, and 17
received, authority to continue its FAC with a few minor changes. The tariff changes from Case 18
No. ER-2011-0028 became effective July 31, 2011. 19
On December 1, 2010, Ameren Missouri initiated Case No. ER-2010-0274, seeking to 20
true-up its first recovery period. As a part of this true-up filing, Ameren Missouri asserted that 21
the Base Factor (BF) rates in the original FAC tariff sheets were calculated incorrectly and that it 22
was entitled to the additional revenue that would have been collected had the BF rates been 23
correctly calculated. In its June 29, 2011, Report and Order issued in that case, the Commission 24
authorized Ameren Missouri to include the under-collection amount for that true-up period and 25
for all subsequent true-up filings in which the incorrect BF rates calculations had an impact. 26
This positive adjustment to the true-up amount was also included in the twelve-month recovery 27
period beginning October 2011 and, as ordered, subsequent true-up filings included the corrected 28
BF rates, as applicable. 29
On October 28, 2011, Staff filed in Case No. EO-2012-0074 its report of the results of its 30
second prudence audit with respect to the revenue margins from Ameren Missouri’s contracts to 31
Page 164
sell energy to AEP and Wabash for the time period of October 1, 2009, through May 31, 2011. 1
In its report, Staff recommended that the Commission order Ameren Missouri to refund the 2
revenue margins with interest from the AEP and Wabash contracts for the time period of October 3
1, 2009, through May 31, 2011, based on the Commission’s decision in Case No. EO-2010-0255. 4
A hearing in that case was held on June 21, 2012 and the Commission issued a Report and Order 5
ordering Ameren Missouri to refund the revenue margins with interest from the AEP and 6
Wabash contracts for the time period of October1, 2009, through May 31, 2011, based on the 7
Commission’s decision in Case No. EO-2010-0255. 8
On February 3, 2012, Ameren Missouri initiated a general rate case, Case No. ER-2012-9
0166, seeking changes to Ameren Missouri’s rates. In that case Ameren Missouri requested, and 10
received, authority to continue its FAC with modifications for inclusion of transmission 11
expenses, re-basing of the BFs, and additional language related to Midwest Independent System 12
Operator (MISO) charges for inclusion in Ameren Missouri’s FAC. The tariff changes from 13
Case No. ER-2012-0166 became effective January 2, 2013. 14
Staff Expert/Witness: Matthew J. Barnes 15
2. Summary of Ameren Missouri’s Fuel and Purchased Power Costs Net 16 Off-System Sales Revenues 17
Chart 1 below shows, for each full accumulation period81 since the Commission 18
authorized Ameren Missouri’s FAC, a summary of Ameren Missouri’s Actual Net Energy Cost 19
(“ANEC),82 Net Base Energy Cost (“NBEC”), and the under-collection of fuel and purchased- 20
power costs minus off-system sales revenues through its permanent rates. The least squares 21
linear regression line, also known as a linear regression trendline, represents a rising trend for 22
Ameren Missouri’s ANEC, NBEC, and the under-collection amount for each accumulation 23
period. 24
81 Accumulation Period 1 was not a full accumulation period because it only covered the three calendar months of March 2009 through May 2009. All other accumulation periods cover four calendar months. 82 Actual Net Energy Cost is defined in Ameren Missouri’s FAC tariff sheet, MO. P.S.C. Schedule 6, Original Sheet No. 73.1, as: Fuel Costs and revenues (FC) plus Purchased-Power Costs and revenues (PP) plus costs and revenues for SO2 and NOx emissions allowances (E) minus Off-system Sales Revenues (OSSR). The formula appears as: ANEC = FC + PP + E – OSSR.
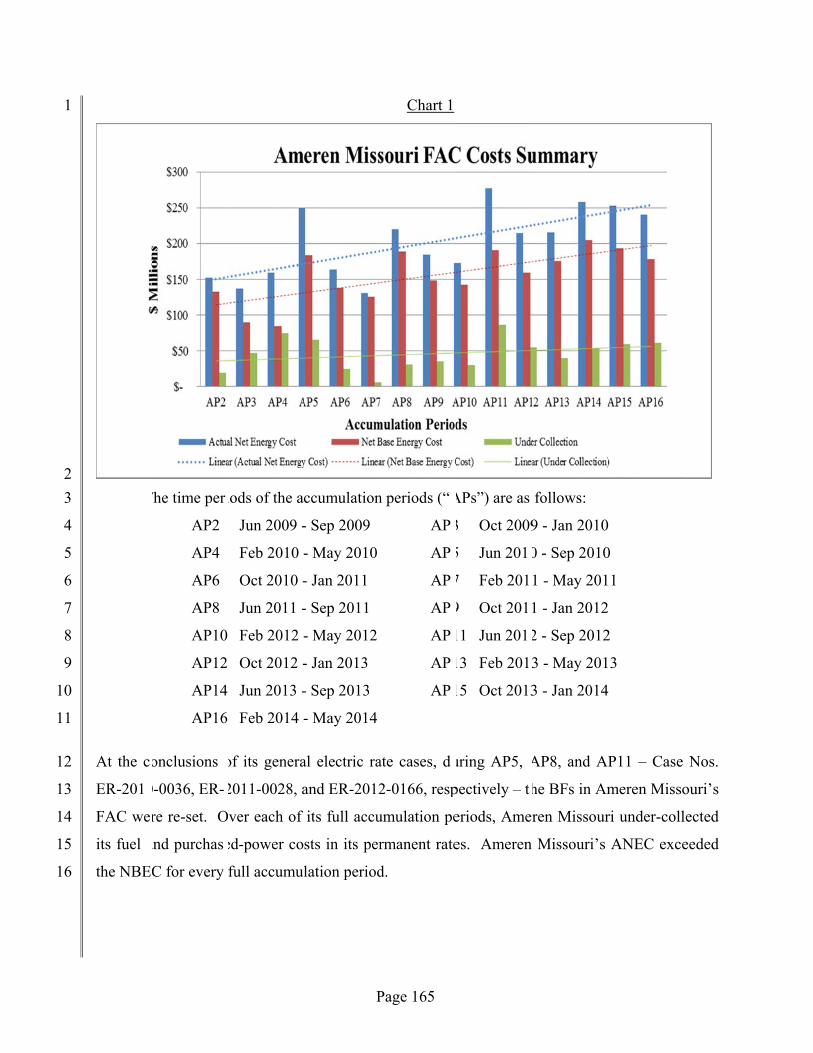
1
2
3
4
5
6
7
8
9
10
11
12
13
14
15
16
At the c
ER-201
FAC we
its fuel
the NBE
The time per
AP2
AP4
AP6
AP8
AP10
AP12
AP14
AP16
onclusions
0-0036, ER-
re re-set. O
and purchas
C for every
iods of the ac
Jun 2009 -
Feb 2010 -
Oct 2010 -
Jun 2011 -
Feb 2012 -
Oct 2012 -
Jun 2013 -
Feb 2014 -
of its genera
2011-0028, a
ver each of
ed-power co
full accumul
P
ccumulation
- Sep 2009
- May 2010
- Jan 2011
- Sep 2011
- May 2012
- Jan 2013
- Sep 2013
- May 2014
al electric ra
and ER-2012
its full accu
sts in its per
lation period
Page 165
Chart 1
n periods (“
AP
AP
AP
AP
AP
AP
AP
ate cases, d
2-0166, resp
umulation pe
rmanent rate
d.
APs”) are as
3 Oct 2009
5 Jun 201
7 Feb 201
9 Oct 2011
11 Jun 201
13 Feb 201
15 Oct 2013
uring AP5,
pectively – t
eriods, Ame
es. Ameren
follows:
9 - Jan 2010
0 - Sep 2010
1 - May 201
1 - Jan 2012
2 - Sep 2012
3 - May 201
3 - Jan 2014
AP8, and AP
he BFs in Am
ren Missour
Missouri’s
0
1
2
3
P11 – Case
meren Misso
ri under-coll
ANEC exce
Nos.
ouri’s
lected
eeded


Page 169
Table 1 above contains a comparison of Ameren Missouri’s FERC account expenses and 1
revenues, annual kWh’s, cents per kWh, and NBEC approved in the last general rate case, Case 2
No. ER-2012-0166 and Ameren Missouri’s proposed NBEC in this case. Ameren Missouri’s 3
proposed fuel and purchased-power expenses declined a total of 0.29 percent compared to the 4
fuel and purchased-power expenses approved in Case No. ER-2012-0166. Ameren Missouri’s 5
proposed FAC revenues declined a total of 32.82 percent compared to the revenues approved in 6
Case No. ER-2012-0166. The main driver for Ameren Missouri’s proposed increase in BF rates 7
is the decrease of 38.69 percent in off-system sales revenues in the test year for Case No. 8
ER-2014-0258 relative to the off-system sales revenues approved in Case No. ER-2012-0166. 9
Staff recommends continuation of Ameren Missouri’s FAC with modifications. Ameren 10
Missouri’s fuel and purchased-power costs less off-system sales revenues continue to be volatile, 11
beyond the control of the Company, and are large, representing approximately 50 percent of 12
Ameren Missouri’s proposed annual revenue requirement increase for this case. 13
Staff Expert/Witness: Matthew J. Barnes 14
3. Maryland Heights Energy Center 15
The Maryland Heights Energy Center is a renewable energy generation facility and its 16
fuel costs are currently included in Ameren Missouri’s FAC. The Commission’s rules relating to 17
recovery of Renewable Energy Standard83 costs do not allow recovery of RES compliance costs 18
in a FAC. Ameren Missouri requested a waiver from rule 4 CSR 240-20.100(6)(A)16 in its last 19
general rate case -- Case No. ER-2012-0166. Rule 4 CSR 240-20.100(6)(A)16 states, “RES 20
compliance costs shall only be recovered through an RESRAM or as part of a general rate 21
proceeding and shall not be considered for cost recovery through an environmental cost recovery 22
mechanism or fuel adjustment clause or interim energy charge.” The Commission approved the 23
Company’s waiver and ordered Ameren Missouri to work with stakeholders to determine the 24
treatment of RES compliance costs before the Company’s next general rate case. The Company 25
has met with stakeholders and agreed to remove the Maryland Heights Energy Center’s fuel 26
costs from its FAC. Staff will reflect the removal of the Maryland Heights Energy Center’s fuel 27
83 4 CSR 240-20.100(6)(A)16

Page 170
costs when it files Staff’s exemplar tariff sheets December 19, 2014, in its Class Cost-of-1
Service/Rate Design Report. 2
Staff Expert/Witness: Matthew J. Barnes 3
4. Loss Study - Compliance With FAC Rules 4
Ameren Missouri supplied Staff with a loss study in conjunction with the filing of their 5
2012 rate case (ER-2012-0166). Although the Company did not file a loss study in the current 6
case, the loss study provided in 2012, dated December 2011, allows Ameren to remain in 7
compliance with the rule requiring a current loss study regarding requesting the initiation or the 8
continuance of a FAC per 4 CSR 240-20.090(9). Ameren has reported that the Company plans 9
to formulate a new loss study in 2015 and provide it to the Commission Staff by the end of the 10
year. This loss study will be based on actual data compiled in calendar year 2014. Ameren will 11
remain in compliance with the aforementioned rule provided that a loss study is provided in 2015 12
as proffered. 13
Staff Expert/Witness: Alan J. Bax and Matthew J. Barnes 14
5. Additional Filing Requirements 15
Due to the accelerated Staff review process necessary with FAC adjustment filings,84 just 16
as it did in the last Ameren Missouri rate cases, Case Nos. ER-2010-0036, ER-2011-0028, and 17
ER-2012-0166, Staff is recommending the Commission order Ameren Missouri to do the 18
following to aid Staff in performing FAC tariff, prudence and true-up reviews: 19
As part of the information Ameren Missouri submits when it files a tariff 20
modification to change its Fuel and Purchased Power Adjustment rate, include 21
Ameren Missouri’s calculation of the interest included in the proposed rate; 22
In addition to the monthly reports required by 4 CSR 240-3.161(5), provide 23
Ameren Missouri’s MISO ASM market settlements and revenue neutrality 24
uplift charges; 25
84 The Company must file its FAC adjustment 60 days prior to the effective date of its proposed tariff sheet. Staff has 30 days to review the filing and make a recommendation to the Commission. The Commission then has 30 days to approve or deny Staff’s recommendation.

Page 171
Maintain at Ameren Missouri’s corporate headquarters or at some other 1
mutually-agreed-upon place within a mutually-agreed-upon time for review, a 2
copy of each and every nuclear fuel, coal and transportation contract Ameren 3
Missouri has that is in or was in effect for the previous four years; 4
Within 30 days of the effective date of each and every nuclear fuel, coal 5
and transportation contract Ameren Missouri enters into, provide both notice 6
to Staff of the contract and opportunity to review the contract at 7
Ameren Missouri’s corporate headquarters or at some other mutually-agreed-8
upon place; 9
Maintain at Ameren Missouri’s corporate headquarters or provide at some 10
other mutually-agreed-upon place within a mutually-agreed-upon time, a copy 11
for review of each and every natural gas contract Ameren Missouri has that is 12
in effect; 13
Within 30 days of the effective date of each and every natural gas contract 14
Ameren Missouri enters into, provide both notice to Staff of the contract and 15
an opportunity for review of the contract at Ameren Missouri’s corporate 16
headquarters or at some other mutually-agreed-upon place; 17
Provide a copy of each and every Ameren Missouri hedging policy that is in 18
effect at the time the tariff changes ordered by the Commission in this rate 19
case go into effect for Staff to retain; 20
Within 30 days of any change in an Ameren Missouri hedging policy, provide 21
a copy of the changed hedging policy for Staff to retain; 22
Provide a copy of Ameren Missouri’s internal policy for participating in the 23
MISO ASM, including any Ameren Missouri sales/purchases from that 24
market that is in effect at the time the tariff changes ordered by the 25
Commission in this rate case go into effect for Staff to retain; 26
If Ameren Missouri revises any internal policy for participating in the MISO 27
ASM, within 30 days of that revision, provide a copy of the revised policy 28
with the revisions identified for Staff to retain; and 29
The monthly as-burned fuel report supplied by Ameren Missouri required by 30
4 CSR 3.190(1)(B) shall explicitly designate fixed and variable components of 31

Page 172
the average cost per unit burned including commodity, transportation, 1
emission, tax, fuel blend, and any additional fixed or variable costs associated 2
with the average cost per unit reported (Staff is willing to work with Ameren 3
Missouri on the electronic format of this report). 4
Staff Expert/Witness: Matthew J. Barnes 5
B. Fuel Adjustment Clause Heat Rate and Efficiency Testing 6
Whenever an electric utility requests that a Rate Adjustment Mechanism (RAM) such as 7
a FAC be continued or modified, Commission Rule 4 CSR 240-3.161(3)(Q) specifies that the 8
electric utility shall file specific information as part of its direct testimony in a general rate 9
proceeding: 10
(Q) The results of heat rate tests and/or efficiency tests on all the electric 11 utility’s nuclear and non-nuclear steam generators, HRSG, steam turbines 12 and combustion turbines conducted within the previous twenty-four (24) 13 months; 14
The Commission authorized Ameren Missouri’s FAC in Case No. ER-2008-0318. The FAC was 15
continued with modifications in Case Nos. ER-2010-0036, ER-2011-0028 and ER-2012-0166. 16
Ameren Missouri is requesting that its FAC again be continued with modifications in the current 17
general rate proceeding, Case No. ER-2014-0258. 18
Company witness Lynn M. Barnes filed testimony that included Schedule LMB-1 with 19
several attachments that identify supply-side and demand-side resources expected to meet 20
Ameren Missouri’s load requirements and which also contain the results of the most recent heat 21
rate/efficiency tests for many of Ameren Missouri's generating units. 22
Attachment C to Schedule LMB-1 lists the supply-side and demand-side resources 23
expected to meet the Ameren Missouri load and reserve requirements for years 2014-2017. The 24
data in the table lists the resource name, ownership, primary fuel type, average heat rate at full 25
load, and projected generation for the four true-up years.85 26
Attachment D to Schedule LMB-1 contains the results of the most recent heat rate tests 27
for Ameren Missouri’s coal-fired units performed in accordance to the heat rate/efficiency 28
85 Direct testimony of Company witness Lynn M. Barnes; page 13 of Schedule LMB-1.

Page 173
testing processes implemented in connection with the initial approval of the FAC in Case No. 1
ER-2008-0318. 2
The most recent reports (Performance Reports) of heat rate tests completed on Ameren 3
Missouri’s coal-fired units, data from heat rate testing at the Callaway Plant, and available heat 4
rate test results for Ameren Missouri’s combustion turbine generating (CTG) units are included 5
in Attachment D.86 6
Staff’s literal interpretation of the “previous 24 months” rule requirement is to mean the 7
previous twenty-four months from the rate case filing date of July 3, 2014, which would require 8
the heat rate tests to have been conducted no earlier than July 3, 2012, unless the Commission 9
grants a Company-submitted waiver that establishes good cause for not meeting this 10
requirement. However, Ameren Missouri has presented additional documentation in response to 11
Staff’s Data Request No. 0272.1 that includes an email dated 2009, between Staff engineer 12
Michael E. Taylor and Ameren Missouri’s Manager of Performance and Reliability, Ken 13
Stuckmeyer, ** 14
15
**87 16
Staff’s review of the testimony filed in the previous rate case, ER-2012-0166, by Staff witness 17
Michael E. Taylor88 finds no mention or acknowledgement of the “rolling 24-month period “but 18
does find statements supporting the “pervious 24 months” rule requirement. Staff has found no 19
other evidence supporting the “rolling 24-month” interpretation or allowing a waiver from the 20
rule requirement in favor of a “rolling 24-month” interpretation. Therefore, Staff is using the 21
literal interpretation of the rule requirement for this review. 22
Staff’s review of the testimony of Company Witness Lynn M. Barnes and Ameren 23
Missouri’s response to Data Request Nos. 0272.1, 0272.2 and 0336 to confirm that each 24
generating unit’s fuel costs that are included in the FAC RAM calculation meets the “previous 25
24-month” heat rate testing rule requirement are summarized in the table below that lists the 26
units not meeting this requirement. 27
28 86 Ibid. 87 Ameren Missouri Response to Data Request MPSC 0272.1 88 Rate Case ER-2012-0166, Staff Report for Revenue Requirement Cost of Service, July 6, 2012, pages 174 and 175.
NP
________________________________________________________________________________________________________________________________________________________________________________

Page 174
Units with fuel costs included in the FAC RAM and with Heat Rate tests after July 3, 2012
Dates of Latest Heat Rate
Test
Audrain CT 4 8-19-2014
Audrain CT 5 7-24-2014
Audrain CT 6 7-24-2014
Audrain CT 7 7-24-2014
Audrain CT 8 7-24-2014
Raccoon CT 3 7-22-2014
Kinmundy 1 CT 8-21-2014
Kinmundy 2 CT 8-04-2014
Pinckneyville 7 CT 8-19-2014
Venice 3 CT 8-20-2014
Venice 4 CT 8-20-2014
1
Staff recommends that the Commission grant Ameren Missouri a waiver for the 2
generating units that are included in the table above. Staff notes that these generating units are 3
used infrequently and represent a very small percentage of the generation fleet output. Ameren 4
Missouri utilizes real-time performance monitoring systems on their generating units, except for 5
the oldest Combustion Turbine units, to continuously optimize the heat rate by making 6
operational adjustments.89 Staff’s review confirms that the all of the units in the above table 7
utilize real-time performance monitoring systems.90 8
Ameren Missouri’s generation resources are dispatched in the MISO market as a function 9
of their offered cost relative to the MISO Locational Marginal Price (LMP) at the unit node and 10
subject to the unit’s operating characteristics and commitment status.91 Units will be dispatched 11
to run by MISO when the LMP is below the units’ offered cost.92 This method of dispatching 12
the generating units assures that only the most cost effective supply-side resources are used to 13
service Ameren Missouri’s load requirements. 14 89 Direct testimony of Company witness Mark C. Birk, Case No. ER-2008-0318, page 3, lines 7-17. 90 Direct testimony of Company witness Mark C. Birk, Case No. ER-2008-0318, Schedule MCB-E3. 91 Ameren Missouri Response to Data Request No. 0336. 92 Ibid.

Page 175
Staff finds the heat rate/efficiency testing information and results for the generating units 1
to be reasonable. 2
Staff Expert/Witness: Randy S. Gross 3
XI. Other Issues 4
A. Smart Grid Status 5
This section provides information only concerning the history and current status of 6
Ameren Missouri’s Smart Grid deployment and does not address any particular revenue 7
requirements in this rate case. 8
Ameren Missouri has been “100 percent deployed” with Automated Meter Reading 9
(AMR)93 meters since 2000 (only 18 customer meters are non-AMR meters per customer 10
request). Of Ameren Missouri’s 1.23 million total AMR meters, 16,827 meters are configured 11
for time-of-use/demand reporting and 2,077 are configured for 15-minute interval reporting for 12
industrial and large commercial customer use.94 The remaining meters report daily kWhs for 13
residential and small commercial customer use. Customers can view monthly usage, create an 14
energy profile for their home or business, and explore options for energy savings by utilizing the 15
Ameren Energy Savings Toolkit. There are no Advanced Meter Infrastructure95 (AMI) meters 16
on Ameren Missouri’s system. 17
In September 2009, Ameren Missouri completed a study comparing the costs and 18
benefits of AMR versus AMI meters for its service territory and concluded at that time that the 19
benefits of AMI did not outweigh the estimated costs of deployment, but committed to closely 20
monitor other AMI deployments with plans to revisit this issue in the future. 96 21
In January of 2014, Ameren Missouri completed a comprehensive benefit cost analysis 22
for AMI deployment and in August of 2014, a supplement to the January report was added to 23
93 These are “one-way” meters that transmit monthly customer energy usage by using a radio frequency (“RF”) signal. 94 Ameren Missouri Response to Data Request No. 0266. 95 These are “two-way” meters that transmit customer energy usage typically on 15-minute intervals and also receive utility information. 96 Ameren Missouri Presentation; “The Smart Grid @ AmerenUE”, May 18, 2010, item 84, EFIS File No. EW-2009-0292.

Page 176
include two new deployment options.97 Ameren Missouri currently does not have a detailed 1
AMI deployment plan98 ** 2
**99 ** 3
4
5
**100 6
Since its last general rate case in 2012 (Case No. ER-2012-0166), Ameren Missouri has 7
upgraded and modernized its AMR system with the deployment of new field equipment that 8
provides increased network capacity for adding additional meters and increased communication 9
flexibility.101 10
New field equipment includes Concentrators and Collectors in addition to the existing 11
Cell Masters and Micro Cell Controllers (“MCC”). The Concentrator receives wireless radio 12
broadcasts from the electric meters and then transmits digital information to the Collectors. 13
The Collectors receive the information from the Concentrators and then transmit bundled 14
digital information in “packets” to a central operating system for processing. Currently there are 15
4 Collectors, 258 Concentrators, 90 Cell Masters, and 9,056 MCCs in Ameren Missouri’s service 16
territory.102 17
Ameren Missouri currently has 37 all-electric and hybrid service vehicles including: 18
six passenger vehicles, six 45-foot aerial Eaton hybrid system trucks and twenty-five 37-foot 19
aerial trucks with an Altec hybrid system.103 Three level 2 (240 volt) charging stations; two at 20
Ameren’s main headquarters and one at Ameren’s Power Operations Training Center, are 21
available to charge these vehicles and the passenger vehicles can also utilize a 110-volt outlet for 22
charging.104 Ameren participated in an Electric Power Research Institute (EPRI) demonstration 23
project, which is documented in a September 2014 EPRI final report,105 that utilized the 24
Chevrolet Volt hybrid car. Ameren Missouri also participated with St. Louis Clean Cities on a 25
97 Ameren Missouri Response to Data Request No. 0268. 98 Ameren Missouri Response to Data Request No. 0269. 99 Ameren Missouri Response to Data Request No. 0268. 100 Ibid. 101 Ameren’s Smart Grid report dated February, 2012. 102 Ameren Missouri Response to Data Request No. 0267. 103 Ameren Missouri Response to Data Request No. 0270. 104 Ibid. 105 Ameren Missouri Response to Data Request No. 0271.
NP
____________________________________________________________________________________________ ______________________________________________________________________________________________________________________________________________________________________________________

Page 177
Plug-In Readiness Task Force as a means of monitoring initial discussions on how to create a 1
local market for new Plug-In Hybrid Electric Vehicles (“PHEVs”). An August 2009 technology 2
study concluded that there are no significant electrical system impacts anticipated until PHEV 3
penetration in the service territory approaches approximately 150,000 vehicles.106 Ameren 4
currently has no plans to expand its service vehicle fleet and its current assessment confirms that 5
the electrical infrastructure will be sufficient to handle the impact of electric vehicle charging.107 6
Ameren Missouri has focused investments to improve its electric system grid service 7
reliability, operating efficiency, asset optimization, and the energy delivery infrastructure. 8
Ameren Missouri has deployed both mature and new technology solutions on their system.108 9
Mature technology solutions include the following. 10
Smart Line Capacitors; 11
Automatic Voltage Regulation and Control; 12
Microprocessor Digital Relaying; 13
Supervisory Control and Data Acquisition (SCADA); 14
Smart Line Switches; 15
Smart line capacitors; 16
Automatic Supply Line Transfer; and, 17
Outage Management System. 18
New technology solutions include the following: 19
Transformer Insulating Oil Dissolved Gas Monitors; 20
High Voltage Bushing Monitors; 21
Fiber Optic Winding Temperature Sensor; 22
Comprehensive Analysis Monitor; 23
Multi-Function Transformer Temperature Monitor; 24
Phase Measurement Units (“PMUs”); 25
Faulted Circuit Indicators (“FCIs”); 26
Smart Line Regulators; 27
106 Ameren Missouri Presentation; “The Smart Grid @ AmerenUE”, May 18,2010, item 84, EFIS File No. EW-2009-0292. 107 Ameren Missouri Response to Data Request No. 0270. 108 Ameren Missouri Responses to Data Requests No. 0248 through and including No. 0265.

Page 178
Wide Area Networks (“WANs”); 1
Field Area Networks (“FANs”); and, 2
Local Area Network (“LANs”). 3
Schedule RSG-1 contains a more detailed description of the mature technology solutions and the 4
new technology solutions employed by Ameren Missouri. 5
Staff Expert/Witness: Randy S. Gross 6
B. Light Emitting Diode (LED) Street and Area Lighting 7
Pursuant to paragraph 4 of the Nonunanimous Stipulation and Agreement Regarding 8
Certain Revenue Requirement Issues,109 in Ameren Missouri’s most recent electric general rate 9
case, Case No. ER-2012-0166, Ameren Missouri performed and submitted to the Commission an 10
evaluation report of potential service offerings for a replacement of all existing street lights with 11
Light Emitting Diode (LED) Lighting rates. Ameren Missouri submitted its LED evaluation 12
report to the Commission on July 31, 2013, in Case No. EO-2013-0367. The results of the LED 13
evaluation report show that a replacement of all existing street lights with LED lights was not 14
expected to be cost effective at that time. However, Ameren Missouri recognized that some 15
customers may have installed or may wish to install LED lighting. Thus, Ameren Missouri 16
offers unmetered LED lighting rates as an energy-only option under the Company’s current 6(M) 17
rate schedule.110 Under the unmetered LED lighting rates, customers have the choice to install 18
LED street and area lights which are purchased, owned, and maintained by the customer. 19
Staff recommends that the Commission order Ameren Missouri to continue to study the 20
cost-effectiveness of replacement of all or parts of existing company-owned street lights with 21
LED lights, and, no later than twelve (12) months following the Commission’s Report and Order 22
in this case, to file either proposed LED lighting tariffs or an update to the Commission on when 23
it will file a proposed LED lighting tariff to replace existing company-owned street lights. 24
Staff Expert/Witness: Hojong Kang, Ph.D. 25
109 Approved through the Commission’s order dated on October 10, 2012. 110 MO.P.S.C. Schedule No. 6 1st Revised Sheet No. 59 and No. 59.1 with the effective date of October 30, 2013.

Page 179
Appendices 1
Appendix 1: Staff Credentials 2
Appendix 2: Support for Staff Cost of Capital Recommendation 3
Appendix 3: Alphabetical Listing of Testimony Schedules 4
Appendix 4: Advertising 5