Stacy R. Stewart Cyclone Report Hurricane Felix 7-19 September 2001 Stacy R. Stewart National...
10
-1- Tropical Cyclone Report Hurricane Felix 7-19 September 2001 Stacy R. Stewart National Hurricane Center 30 November 2001 Felix was the second major hurricane (category 3 on the Saffir-Simpson Hurricane Scale) of the season. It remained over the open waters of the eastern Atlantic Ocean, but briefly threatened the Azores Islands. a. Synoptic History Felix developed from a tropical wave and associated weak surface low that crossed the African coast on 5 September. The wave and low pressure area tracked westward for the next two days. On 6 September, QuikSCAT satellite wind data (not shown) indicated that a surface circulation near the wave axis had become better defined. Deep convection continued to increase and weak banding features developed later that day as the system tracked a few hundred miles south of the Cape Verde Islands. By early 7 September, QuikSCAT satellite wind data and nearby ship observations indicated the low pressure system had become better defined with westerly winds of 10 to 15 kt noted about 120 n mi southwest of the low-level center. Deep convection became more centralized and banding features became more pronounced in visible satellite imagery. Dvorak satellite intensity estimates indicated the system had developed into Tropical Depression Seven at 1200 UTC that same day about 360 n mi southwest of the Cape Verde Islands. The “best track” chart of Felix’s path is given in Fig. 1, while the best track positions and intensities are listed in Table 1. Wind and pressure plots are shown in Figs. 2 and 3, respectively. Tropical Depression Seven tracked rapidly westward between 18 to 20 kt for the next day or so. Despite the otherwise favorable upper-level ridging across the system, the depression failed to develop any further. It is surmised that the rapid westward motion may have been associated with a low-level shear condition, which resulted in the deep convection becoming displaced farther to the east of the low-level center. Another possibility, based on satellite water vapor and AMSU (Advanced Microwave Sounding Unit) temperature data, is that the surrounding environment was more stable than usual, which could also have been an inhibiting factor to maintaining persistent deep convection near the center. By 1800 UTC on 8 September, convection became disorganized and QuikSCAT surface wind data, plus a few ship reports, indicated that Tropical Depression Seven had degenerated into a northeast-to-southwest oriented open wave about 650 n mi west-southwest of the Cape Verde Islands. The wave tracked westward at around 15 kt for the next 36 hours. An unfavorable vertical shear pattern developed across the system when an upper-level trough amplified southward into the deep tropics to the west of the wave. Eventually, the southwesterly upper-level shear relaxed enough to allow for the redevelopment of deep convection near the mid-level vorticity center late on 9 September. By 0600 UTC 10 September, conventional satellite data suggested that a closed surface circulation had reformed and the system became again Tropical Depression Seven. A QuikSCAT overpass (data not shown) at 0816 UTC confirmed the existence of a broad cyclonic circulation in
Transcript of Stacy R. Stewart Cyclone Report Hurricane Felix 7-19 September 2001 Stacy R. Stewart National...

-1-
Tropical Cyclone ReportHurricane Felix
7-19 September 2001
Stacy R. StewartNational Hurricane Center
30 November 2001
Felix was the second major hurricane (category 3 on the Saffir-Simpson Hurricane Scale)of the season. It remained over the open waters of the eastern Atlantic Ocean, but briefly threatenedthe Azores Islands.
a. Synoptic History
Felix developed from a tropical wave and associated weak surface low that crossed theAfrican coast on 5 September. The wave and low pressure area tracked westward for the next twodays. On 6 September, QuikSCAT satellite wind data (not shown) indicated that a surface circulationnear the wave axis had become better defined. Deep convection continued to increase and weakbanding features developed later that day as the system tracked a few hundred miles south of theCape Verde Islands. By early 7 September, QuikSCAT satellite wind data and nearby shipobservations indicated the low pressure system had become better defined with westerly winds of10 to 15 kt noted about 120 n mi southwest of the low-level center. Deep convection became morecentralized and banding features became more pronounced in visible satellite imagery. Dvoraksatellite intensity estimates indicated the system had developed into Tropical Depression Seven at1200 UTC that same day about 360 n mi southwest of the Cape Verde Islands. The “best track” chartof Felix’s path is given in Fig. 1, while the best track positions and intensities are listed in Table 1.Wind and pressure plots are shown in Figs. 2 and 3, respectively.
Tropical Depression Seven tracked rapidly westward between 18 to 20 kt for the next dayor so. Despite the otherwise favorable upper-level ridging across the system, the depression failedto develop any further. It is surmised that the rapid westward motion may have been associated witha low-level shear condition, which resulted in the deep convection becoming displaced farther to theeast of the low-level center. Another possibility, based on satellite water vapor and AMSU(Advanced Microwave Sounding Unit) temperature data, is that the surrounding environment wasmore stable than usual, which could also have been an inhibiting factor to maintaining persistentdeep convection near the center. By 1800 UTC on 8 September, convection became disorganizedand QuikSCAT surface wind data, plus a few ship reports, indicated that Tropical Depression Sevenhad degenerated into a northeast-to-southwest oriented open wave about 650 n mi west-southwestof the Cape Verde Islands.
The wave tracked westward at around 15 kt for the next 36 hours. An unfavorable verticalshear pattern developed across the system when an upper-level trough amplified southward into thedeep tropics to the west of the wave. Eventually, the southwesterly upper-level shear relaxed enoughto allow for the redevelopment of deep convection near the mid-level vorticity center late on 9September. By 0600 UTC 10 September, conventional satellite data suggested that a closed surfacecirculation had reformed and the system became again Tropical Depression Seven. A QuikSCAToverpass (data not shown) at 0816 UTC confirmed the existence of a broad cyclonic circulation in

-2-
the surface wind field.Tropical Depression Seven tracked west-northwestward and maintained a steady intensity
of 30 kt for the next 24 hours. By 1200 UTC 11 September, the depression had acquired moreconvective banding features and satellite intensity estimates indicated the system had becomeTropical Storm Felix.
The cyclone gradually turned northwestward and slowly intensified, reaching hurricanestrength around 0000 UTC on 13 September. Shortly after reaching hurricane status, Felix underwenta period of rapid intensification (RI) in which the cyclone strengthened 30 kt in an 18 h period. It isestimated that Felix reached a peak intensity of 100 kt around 0000 UTC 14 September, when it wassituated about 1400 miles southwest of the Azores Islands. It maintained that intensity until 0600UTC, after which it began to recurve to the northeast and gradually turned more eastward ahead ofan approaching mid-latitude trough.
Shortly after reaching its peak intensity, Felix began to weaken at a slow but steady pace asupper-level westerly shear began to increase. Late on 16 September, Felix turned northeastward andbegan moving over much cooler water. The cyclone weakened to tropical storm status at 1200 UTC17 September, when it stalled about 350 miles southwest of the Azores. Increasing upper-levelnorthwesterly shear and cold upwelling (as indicated by sea-surface temperature reports from nearbybuoys and ships) caused Felix to weaken more rapidly as it drifted southward over its cold wake. Itweakened to a depression at 1800 UTC 18 September and dissipated at 0000 UTC on 19 September,when it was about 400 miles southwest of the Azores Islands.
b. Meteorological Statistics
Observations in Felix (Figs. 2 and 3) include satellite-based Dvorak technique intensityestimates from the Tropical Analysis and Forecast Branch (TAFB), the Satellite Analysis Branch(SAB) and the U. S. Air Force Weather Agency (AFWA). Felix’s peak intensity of 100 kt at 0000and 0600 UTC on 14 September is based on a Dvorak satellite classification of 102 kt (T5.5) fromthe TAFB.
The period of rapid intensification that occurred is not unusual for a tropical cyclone thatmoves through a weakness in the subtropical ridge. Once on or just north of the ridge axis, the upper-level shear is usually at a minimum, which allows for the inner-core circulations to become morevertically aligned. Figures 4a and 4b are 85 GHz microwave satellite images of Felix obtained fromthe Defense Meteorological Satellite Program (DMSP). The images clearly show a significantchange in the inner-core region, as well as the outer banding features, during the 21 h period betweenthe two images. As often is the case during RI periods, the eye diameter of Felix at the end of the RIcycle had contracted down to nearly half its original size. It also worth noting that the first indicationof an eye in the microwave data became evident several hours before it appeared in conventionalsatellite imagery (data not shown).
Ship reports of tropical storm force winds associated with Felix are given in Table 2. Pressurereports from drifting buoys 41644 and 44765 were critical in determining the strength of Felix sincesatellite intensity estimates became less reliable once the cyclone began to lose its central deepconvection and overall convective organization.
There were no reports of tropical storm force winds in the Azores Islands because Felixrapidly weakened and eventually turned southwestward away from the islands.c. Casualty and Damage Statistics

-3-
No reports of damage or casualties associated with Hurricane Felix were received by theNational Hurricane Center.
d. Forecast and Warning Critique
Average official track errors (with the number of cases in parentheses) for Felix were 33 (27),57 (25), 72 (23), 90 (21), and 142 (17) n mi for the 12, 24, 36, 48, and 72 h forecasts, respectively.These errors are much better than the previous 10-year averages, especially in the 24-72 h timeperiods. (Table 3). The Aviation (AVNI) model was the only forecast guidance to outperform theofficial forecast throughout 72 h forecast period..
The average intensity errors were similar to the long-term averages through 48h, but weresignificantly better at 72 h. The average official intensity errors were 6, 11, 14, 15, and 16 kt for the12, 24, 36, 48, and 72 h forecasts, respectively. For comparison, the average official intensity errorsover the 10-yr period 1991-2000 are 7, 11, 14, 16, and 20 kt, respectively. The SHIPS intensityforecast model had errors similar the official forecast. The GFDI performed slightly better through36 h, but was worse at 48 and 72 h. The AVNI intensity forecasts were significantly worse (almostdouble) than the official and SHIPS forecasts at all time periods.
No watches or warnings were required for Hurricane Felix.
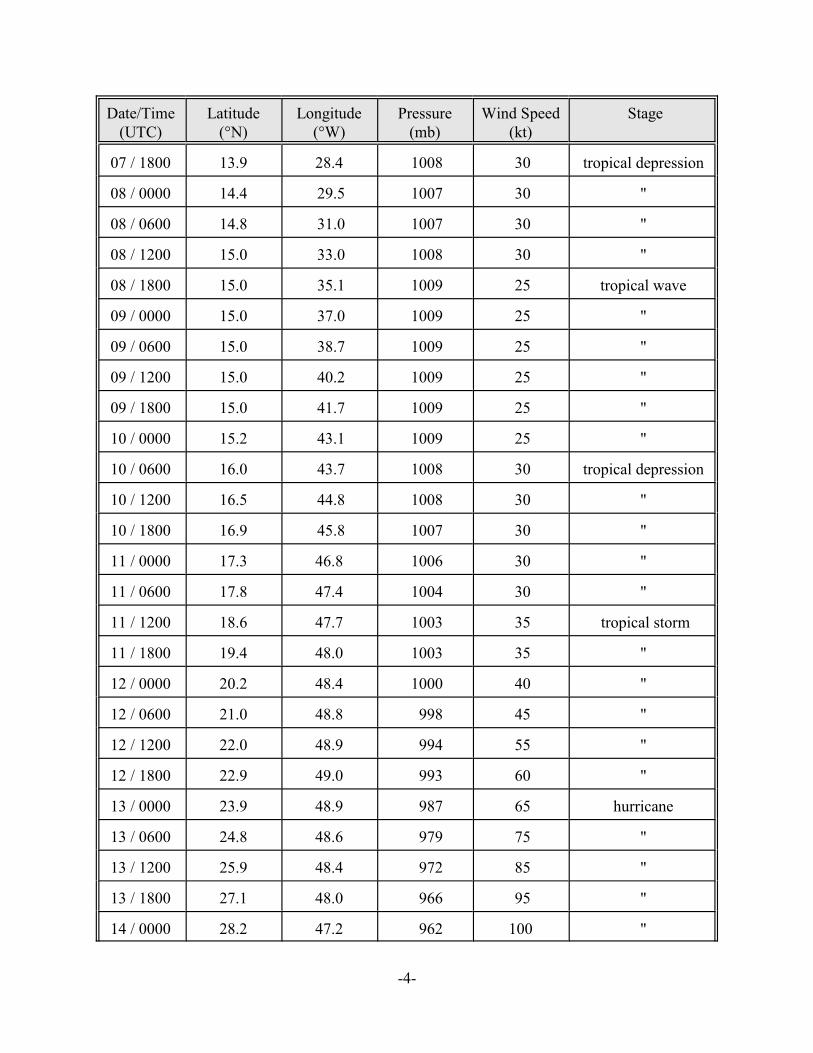
Table 1. Best track for Hurricane Felix, 7-19 September 2001.
-4-
Date/Time(UTC)
Latitude(°N)
Longitude(°W)
Pressure(mb)
Wind Speed(kt)
Stage
07 / 1800 13.9 28.4 1008 30 tropical depression
08 / 0000 14.4 29.5 1007 30 "
08 / 0600 14.8 31.0 1007 30 "
08 / 1200 15.0 33.0 1008 30 "
08 / 1800 15.0 35.1 1009 25 tropical wave
09 / 0000 15.0 37.0 1009 25 "
09 / 0600 15.0 38.7 1009 25 "
09 / 1200 15.0 40.2 1009 25 "
09 / 1800 15.0 41.7 1009 25 "
10 / 0000 15.2 43.1 1009 25 "
10 / 0600 16.0 43.7 1008 30 tropical depression
10 / 1200 16.5 44.8 1008 30 "
10 / 1800 16.9 45.8 1007 30 "
11 / 0000 17.3 46.8 1006 30 "
11 / 0600 17.8 47.4 1004 30 "
11 / 1200 18.6 47.7 1003 35 tropical storm
11 / 1800 19.4 48.0 1003 35 "
12 / 0000 20.2 48.4 1000 40 "
12 / 0600 21.0 48.8 998 45 "
12 / 1200 22.0 48.9 994 55 "
12 / 1800 22.9 49.0 993 60 "
13 / 0000 23.9 48.9 987 65 hurricane
13 / 0600 24.8 48.6 979 75 "
13 / 1200 25.9 48.4 972 85 "
13 / 1800 27.1 48.0 966 95 "
14 / 0000 28.2 47.2 962 100 "

Date/Time(UTC)
Latitude(°N)
Longitude(°W)
Pressure(mb)
Wind Speed(kt)
Stage
-5-
14 / 0600 29.3 46.6 962 100 "
14 / 1200 30.1 45.5 966 95 "
14 / 1800 30.9 44.3 970 90 "
15 / 0000 31.2 42.8 970 90 "
15 / 0600 31.5 41.4 970 90 "
15 / 1200 31.7 39.5 970 90 "
15 / 1800 32.1 37.6 975 85 "
16 / 0000 32.1 36.0 975 85 "
16 / 0600 32.6 34.8 976 80 "
16 / 1200 33.4 33.3 977 75 "
16 / 1800 34.3 32.4 979 70 "
17 / 0000 35.1 32.0 981 70 "
17 / 0600 35.4 31.7 983 65 "
17 / 1200 35.3 31.5 985 60 tropical storm
17 / 1800 35.2 31.8 990 55 "
18 / 0000 35.0 32.0 995 45 "
18 / 0600 34.8 32.0 998 40 "
18 / 1200 34.7 31.9 1001 35 "
18 / 1800 34.7 31.7 1002 30 tropical depression
19 / 0000 34.6 31.6 1002 25 "
19 / 0600 dissipated
14 / 0000 28.2 47.2 962 100 minimum pressure
14 / 0600 29.3 46.6 962 100 "

-6-
Table 2. Selected ship reports for Hurricane Felix, 7-19 September 2001.
Date/Time(UTC)
Ship call signLatitude
(°N)Longitude
(°W)Wind
dir/speed (kt)Pressure
(mb)
13 / 1200 ELSW5 27.5 45.8 120 / 33 1011.0
16 / 1800 KAKG 36.4 32.2 090 / 35 1000.5
17 / 1200 C6PW2 37.5 33.8 040 / 34 1008.0
Table 3. Preliminary track forecast evaluation (homogeneous sample) for Hurricane Felix, 7-19September 2001. Forecast errors for tropical storm and hurricane stages (n mi) are followed by thenumber of forecasts in parentheses. Errors smaller than the NHC official forecast are shown in bold-face type.
Forecast TechniqueForecast Period (h)
12 24 36 48 72
CLIP 51 (27) 122 (25) 200 (23) 267 (21) 454 (17)
GFDI 29 (27) 58 (25) 85 (23) 120 (21) 219 (17)
LBAR 34 (27) 63 (25) 89 (23) 114 (21) 187 (17)
AVNI 29 (27) 44 (25) 61 (23) 89 (21) 129 (17)
BAMD 52 (27) 96 (25) 137 (23) 169 (21) 231 (17)
BAMM 43 (27) 87 (25) 126 (23) 162 (21) 228 (17)
BAMS 47 (27) 89 (25) 127 (23) 173 (21) 280 (17)
NGPI 36 (27) 69 (25) 103 (23) 134 (21) 194 (17)
UKMI 38 (27) 73 (25) 98 (23) 108 (21) 137 (17)
GUNS 30 (27) 61 (25) 89 (23) 110 (21) 150 (17)
NHC Official 33 (27) 57 (25) 72 (23) 90 (21) 142 (17)
NHC Official(1991-2000 mean)
44 (2049) 82 (1835) 118 (1646) 151 (1475) 226 (1187)

Figure 1. Best track positions for Hurricane Felix, 7-19 September 2001.
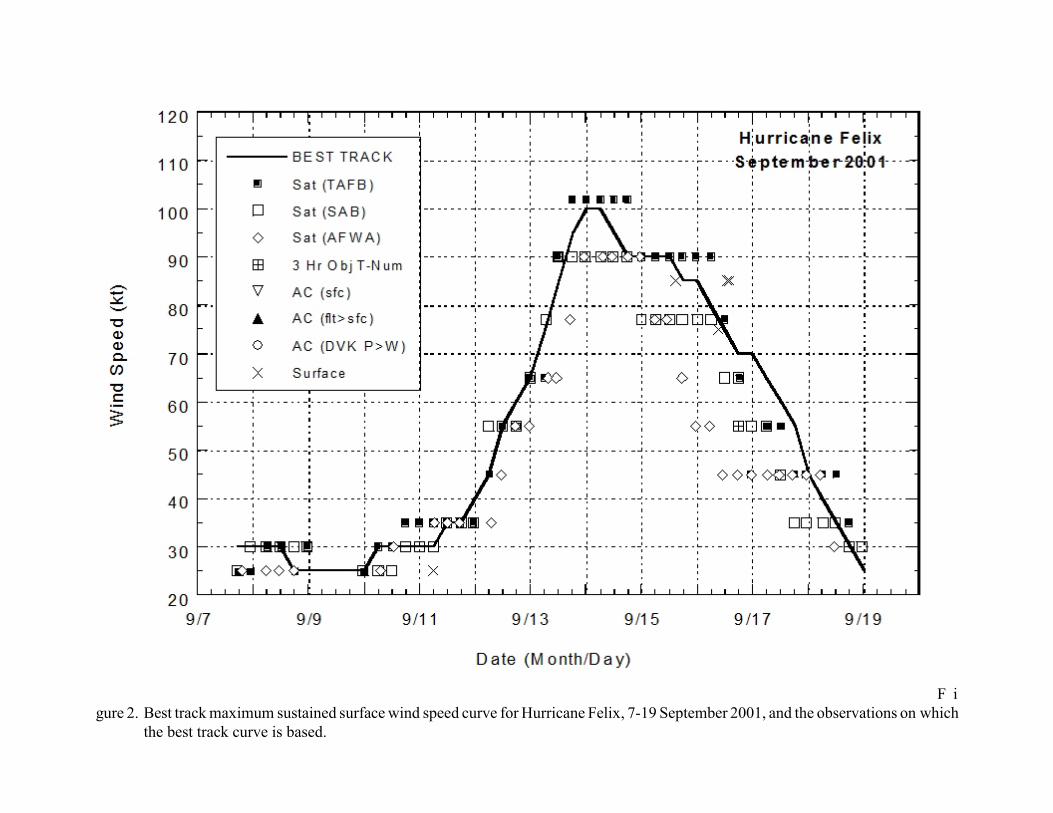
F igure 2. Best track maximum sustained surface wind speed curve for Hurricane Felix, 7-19 September 2001, and the observations on which
the best track curve is based.
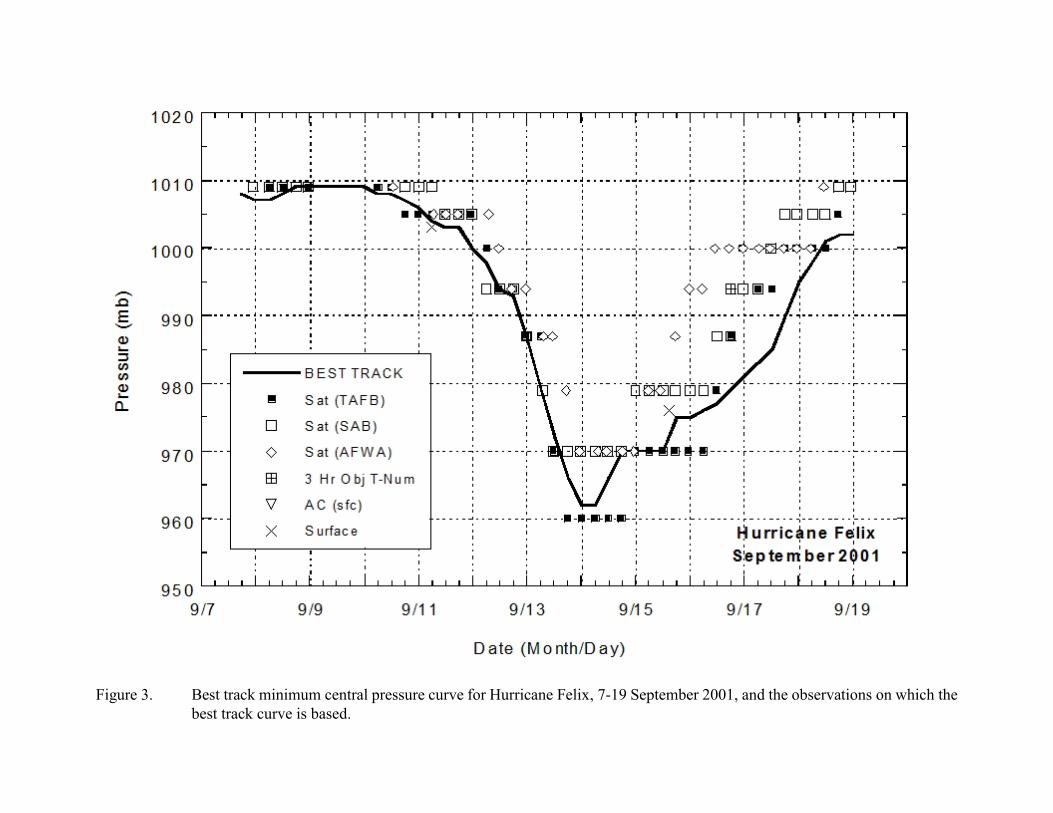
Figure 3. Best track minimum central pressure curve for Hurricane Felix, 7-19 September 2001, and the observations on which thebest track curve is based.

Figure 4. Microwave satellite imagery (85 GHZ) from the DMSP Special Sensor Microwave Imager (SSMI). At 0028 UTC 13September (figure 4a), an eye is clearly defined near 24N 48.5W when Felix was at 65 kt and beginning a period of rapid intensification.By 2107 UTC (figure 4b), Felix had completed the RI cycle and was near 95 kt. Note the significant change in the eye and the bandingstructure during the 21 h period. Felix reached its intensity a few hours after the image time in figure 4b. It is important to note that an eyedid not become evident in conventional infrared imagery until 0645 UTC when the first image became available after a 3 h satellite eclipseperiod. Even then, the eye was only weakly apparent and did not become clearly defined until 1115 UTC.
a b