
Stacked Greenfield and Brownfield ROZ Fairways in the ...
26
Stacked Greenfield and Brownfield ROZ Fairways in the Illinois Basin Geo-Laboratory: Co-optimization of EOR and Associated CO 2 Storage Nathan Webb - PI Nathan Grigsby, Fang Yang, Scott Frailey U.S. Department of Energy National Energy Technology Laboratory 2020 Carbon Storage Virtual Project Review Meeting September 8, 2020 DOE Project Number DE-FE0031700
Transcript of Stacked Greenfield and Brownfield ROZ Fairways in the ...

Stacked Greenfield and Brownfield ROZ Fairwaysin the Illinois Basin Geo-Laboratory:
Co-optimization of EOR and Associated CO2 Storage
Nathan Webb - PINathan Grigsby, Fang Yang, Scott Frailey
U.S. Department of Energy
National Energy Technology Laboratory2020 Carbon Storage Virtual Project Review Meeting
September 8, 2020
DOE Project Number DE-FE0031700

Program Overview
– Funding: $4,373,828
• DOE Share: $3,455,947
• Cost Share: $ 917,881
– Project Performance Dates: 2/1/19 to 1/31/23
– Project Participants:
• University of Illinois – Illinois State Geological Survey (Prime)
• Podolsky Oil Co.
• Projeo Corp.
• Indiana Geological and Water Survey

Program Overview Objectives
DOE Program
• Develop specific subsurface engineering approaches leveraging CO2 injection field tests and applied research and development, that address research needs critical for advancing CCS to commercial scale
Stacked ROZ Fairways in ILB Geo-Laboratory
• Screen for ROZs using analysis of empirical data and basin evolution modeling
• Characterize stacked brownfield/greenfield siliciclastic ROZs at field laboratory sites
• Conduct injection tests and collect and analyze core and logs at field laboratory sites
• Employ calibrated simulation models and life-cycle analyses for identifying development strategies

Technical ApproachProject Milestones
BP: Task Milestone titlePlanned
completionActual completion Verification method
BP 1 Task 1 Complete project management plan 03/01/2019
(year 1)
03/01/2019PMP file
BP 1 Task 1 Project kickoff meeting 02/01/2019
(year 1)
11/06/2018Presentation file
BP 2 Task 4 Finalize plan for data collection and
testing at greenfield laboratory sites
07/31/2020
(year 2)
7/31/2020 Report in subsequent quarterly
reportBP 2 Task 5 Finalize plan for data collection and
testing at brownfield laboratory sites
04/30/2020
(year 2)
11/28/2019 Report in subsequent quarterly
reportBP 2 Task 5 Complete testing of fluid and core
samples of target CO2 reservoir(s) from
field laboratory sites
03/01/2021
(year 3)Report in subsequent quarterly
report
BP 3 Task 6 Complete strategies for co-optimization of
CO2-EOR and storage in stacked reservoirs
(w/ROZs and depleted reservoirs)
01/31/2022
(year 3)Report in subsequent quarterly
report
BP 3 Task 6 Complete fairway maps 10/31/2022
(year 4)
Report in subsequent quarterly
reportBP 3 Task 1 Document project results 01/31/2023
(year 4)Submit final report
Milestones provide success criteria for gaging the qualitative and quantitative
performance of the project and are decision points to determine if the project should
proceed.

Technical ApproachRisk Matrix
Perceived Risk
Risk Rating
Mitigation/Response Strategy
Prob. Impact Overall
(Low, Med, High)Financial Risks:
Field laboratory test budget exceeded
Low Med Low If additional cost occurs due to the delay of field personnel or equipment issues, change in duration or number of ROZs tested would be reduced
Cost/Schedule Risks:
Delay in field activities due to severe weather condition
Low Med Low A project meeting would be held among research team and field personnel to reschedule and reprioritize tasks
Technical/Scope Risks:
Delay in acquiring data Low Med Low Assemble and digitize existing ISGS and literature data to provide preliminary estimates and update data when available
Injection test failure due to a well integrity
Low Med Low Identify analogous wells within the field operated by the same company
The risk matrix is used to identify, assess, monitor and mitigate technical uncertainties
and schedule, budgetary and environmental risks associated with the project
Perceived Risk
Risk RatingMitigation/Response
StrategyProb. Impact Overall
(Low, Med, High)Management Risks:
Occasional unavailability of personnel
Med Low Low
If staff time is mandatory to keep on schedule, non-project staff will be available to work on project temporarily.
Loss of key personnel Low Med LowTemporarily allocate tasks among team and initiate hire
Planning and Oversight Risks:
Well cannot be drilled in year 2 due to rig availability or weather
Low Low LowGreenfield lab schedule will be moved up and switched with the brownfield schedule
EH&S Risks:
Field laboratory sites in environmentally sensitive areas
Med Med Med Use existing infrastructure and non-invasive sampling and testing techniques
External Factor Risks:
An operator becomes unavailable to facilitate data collection and testing in the field laboratory
Low Med Med Coordinate with backup operators at other suitable field laboratory sites

Project Tasks
Data Analyses
Greenfield LaboratoryBasin ROZ Resource Assessment
Brownfield Laboratory
Identification
and Characterization
Conceptual
Model and
ROZ Modeling
Analog
BasinsSite
Characterization
Injection
and
Pressure Transient
Tests
Core
Flood and
Fluid Analyses
Site Characterization
Data
Acquisition
and Pressure Transient
Tests
Core
Flood and
Fluid Analyses
Greenfield Development Scenarios
Reservoir Simulations
Individual ROZ Maps Individual Seal Maps
Brownfield Development Scenarios
Reservoir Simulations
Techno-Economics
Life Cycle Analyses
Quantification/Classification of
Storage and EOR Resources
Stacked ROZ and Conventional Reservoir
Fairway Maps
Co-optimized ROZ Development Strategies
3 -
Res
ou
rce
Ass
ess
men
t
4,5
-Fi
eld
La
b T
esti
ng
6 - Synthesis of R&D
2 - ROZ Screening2019
2019-20212020
2021-2023

ROZ Screening• Selected four formations for
regional characterization based on:‒ Geologic properties (porosity,
permeability, fairway potential)
‒ ROZ indicators (oil shows, core with So>0, DSTs with sulfur water – e.g. Trentham and Melzer 2013)
‒ Data availability (well logs, core)

Resource Assessment
Identifying and characterizing ROZs in selected formations• Identification based on
historical data • Characterization using well
log analysis– Constrain parameters by
formation for log analysis• Input: Rw, porosity, m, clay
properties• Output: POWC, OWC, Sor
– Extrapolate OWC and Sor to prospect boundaries to estimate OOIPs

Field Laboratory Tests
Greenfield Site
• Performing pressure transient tests in existing well with validated greenfield ROZ
• Conduct short term CO2
injection test (huff n’ puff) to acquire oil rate change
– Characterize ROZ
– Demonstrate efficacy of CO2-EOR in ROZ
• Field work ongoing through remainder of 2020
Brownfield Site
• Drilled new well for reservoir characterization
– Collected core and logs to validate Cypress ROZ
• Correlating with previous field laboratory RST logging
• Investigating geologic controls on residual oil saturation
• Refining geologic interpretation
– Sampled reservoir fluids
– Performed drill stem test
• Field work completed fall 2019
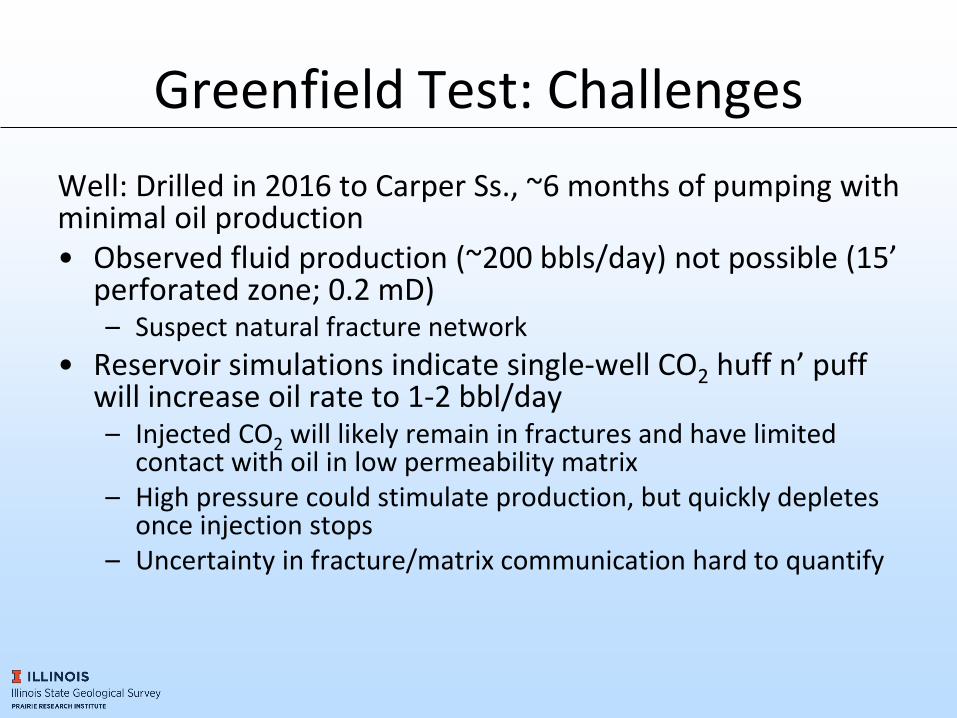
Greenfield Test: Challenges
Well: Drilled in 2016 to Carper Ss., ~6 months of pumping with minimal oil production• Observed fluid production (~200 bbls/day) not possible (15’
perforated zone; 0.2 mD)– Suspect natural fracture network
• Reservoir simulations indicate single-well CO2 huff n’ puff will increase oil rate to 1-2 bbl/day – Injected CO2 will likely remain in fractures and have limited
contact with oil in low permeability matrix– High pressure could stimulate production, but quickly depletes
once injection stops– Uncertainty in fracture/matrix communication hard to quantify

Greenfield Test: Simulations
• Natural fracture model to match historical water production
• Include negative skin and molecular diffusion
Base model
• Analyze sensitivity of injection rate and duration, soak period, water injection on oil response
• Design limits and recommendationsHnP
• Predict field-scale responseLine drive

Greenfield Test: Simulations• Higher rate
and volume is desired
• Given 60 t/d, total 1,000 t CO2, injection duration and soak time had little effect on oil response
• Two cycles of HnP could be beneficial
ScenariosInjection time (d)
Cumulative injection (tonne)
Peak oil rate (stb/d)
Cumulative oil at 1-mont production
(stb)
14-day soak
16 960 1.1 158 480 1.1 134 240 1.1 11
7-day soak16 960 1.2 178 480 1.2 144 240 1.2 12

Greenfield Test: Design
• Pressure transient test– Attempt to confirm natural fracture network and
determine if it permits communication between units
• Huff n’ Puff – Design to maximize oil rate increase
• Use equipment from previous ISGS CO2-EOR project
• Inject volume of CO2 that the budget allows (~1000 tons) at pump capacity (~60 tons/day)
– Use findings to improve reservoir simulations to see if higher injection rate, more volume, more injectors would yield more oil

Brownfield Lab: Characterization
• Analyzing core and logs collected in 2019
• Correlating and mapping stacked ROZs and conventional reservoirs
– Seven producing reservoirs; additional formations with oil indicators
Ullin Limestone

Brownfield Lab: Characterization
HCl reacting
Oil bled from opposing core face
Face of fracture has frosted appearance
Bleeding oil
Fluorescence more prominent
In cemented area/along bedding planes
~0.5” halo of calcite cement along fracture

Brownfield Lab: Characterization
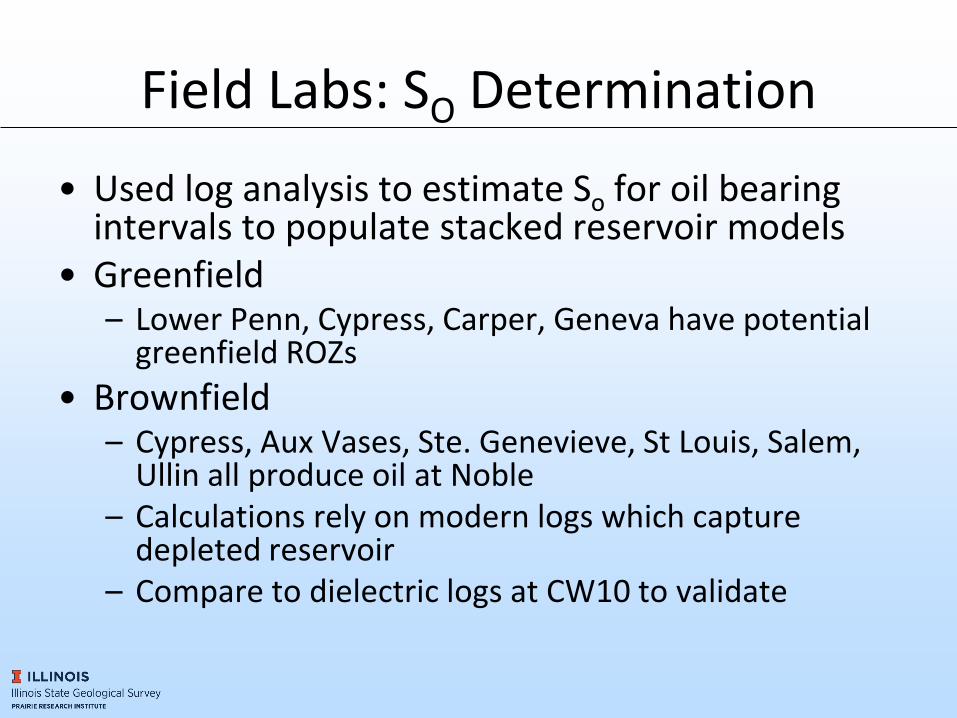
Field Labs: SO Determination
• Used log analysis to estimate So for oil bearing intervals to populate stacked reservoir models
• Greenfield– Lower Penn, Cypress, Carper, Geneva have potential
greenfield ROZs
• Brownfield – Cypress, Aux Vases, Ste. Genevieve, St Louis, Salem,
Ullin all produce oil at Noble– Calculations rely on modern logs which capture
depleted reservoir – Compare to dielectric logs at CW10 to validate
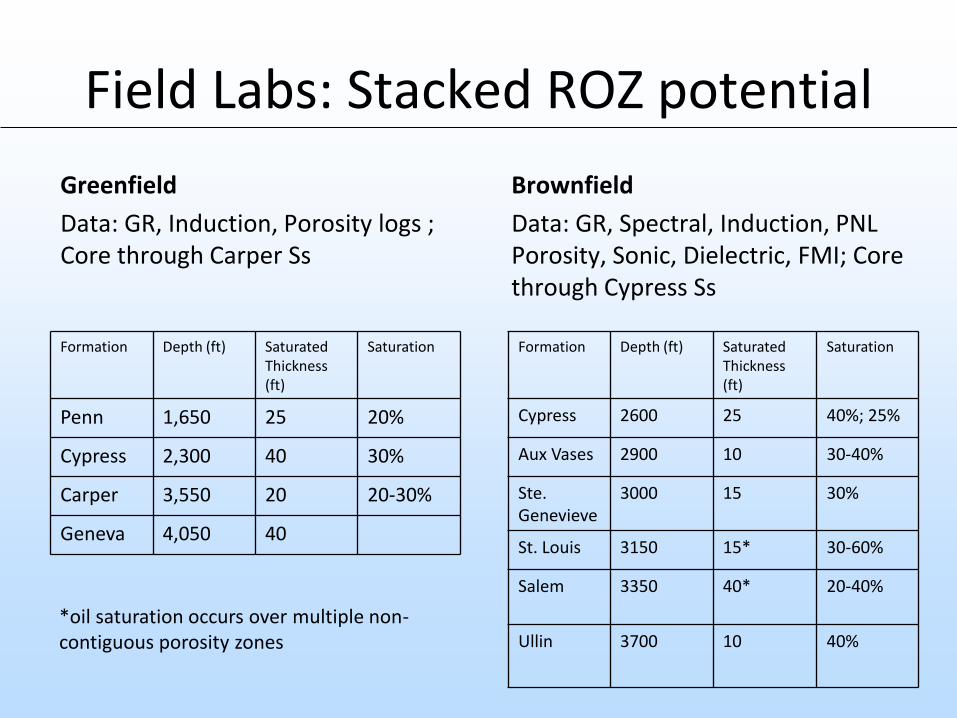
Field Labs: Stacked ROZ potential
Greenfield
Data: GR, Induction, Porosity logs ; Core through Carper Ss
Brownfield
Data: GR, Spectral, Induction, PNL Porosity, Sonic, Dielectric, FMI; Core through Cypress Ss
Formation Depth (ft) Saturated Thickness (ft)
Saturation
Penn 1,650 25 20%
Cypress 2,300 40 30%
Carper 3,550 20 20-30%
Geneva 4,050 40
Formation Depth (ft) Saturated Thickness (ft)
Saturation
Cypress 2600 25 40%; 25%
Aux Vases 2900 10 30-40%
Ste. Genevieve
3000 15 30%
St. Louis 3150 15* 30-60%
Salem 3350 40* 20-40%
Ullin 3700 10 40%
*oil saturation occurs over multiple non-contiguous porosity zones
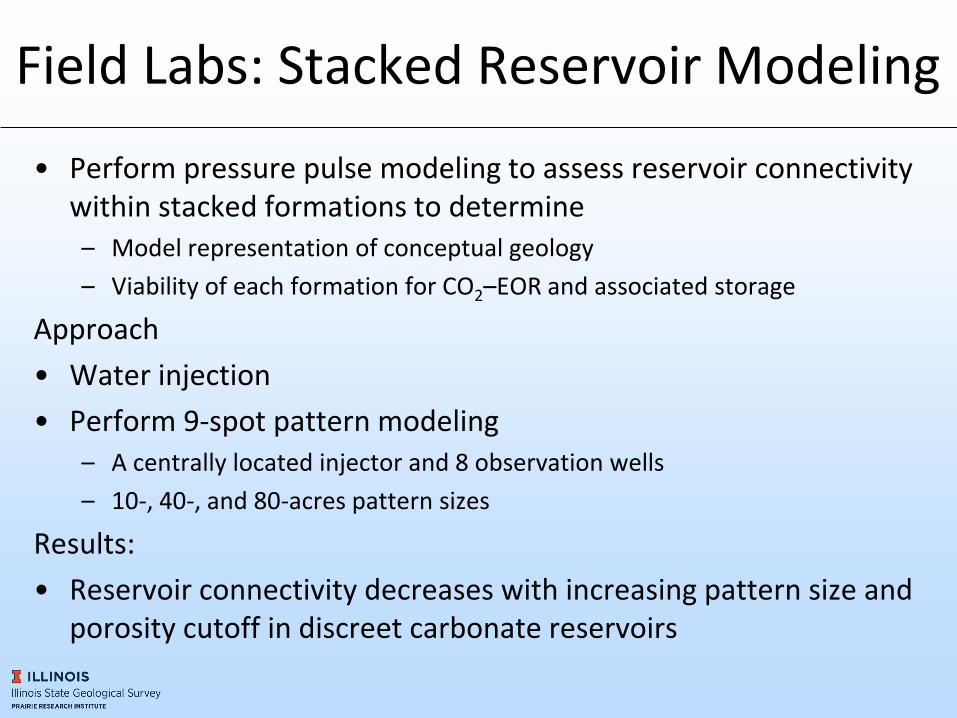
• Perform pressure pulse modeling to assess reservoir connectivity within stacked formations to determine – Model representation of conceptual geology
– Viability of each formation for CO2–EOR and associated storage
Approach
• Water injection
• Perform 9-spot pattern modeling– A centrally located injector and 8 observation wells
– 10-, 40-, and 80-acres pattern sizes
Results:
• Reservoir connectivity decreases with increasing pattern size and porosity cutoff in discreet carbonate reservoirs
Field Labs: Stacked Reservoir Modeling

Synergy opportunities
• Methodologies for finding and characterizing ROZs in mature basins developed as part of this study are applicable in other basins
– We look forward to comparing the results with findings from the Williston and Powder River Basins
• Siliciclastic ROZs in other basins are expected to have similar characteristics to Illinois Basin ROZs
– Lessons learned from CO2 flooding in siliciclastics in the Powder River Basin would be applicable to our ROZs

Project summary
Key Findings
• Selected ILB formations have oil indicators outside of productive areas and potential for ROZs
• Reservoir simulations indicate 1,000 t CO2 huff n’ puff will increase oil rate to 1-2 bbl/day in 15’ thick, low perm Carper Ss.
Lessons Learned
• Field laboratory research requires extra attention to detail to:
– Reconcile schedule (project vs. operator vs. weather), meet all stated objectives, stay on budget
Future Work
• Complete regional characterization of selected ROZs
• Complete analysis of Brownfield core and logs
• Complete field laboratory research
– Design injection test for greenfield site

Acknowledgments
• Research herein supported by US Department of Energy contract number DE-FE0031700, FPM Andrea McNemar
• Through a university grant program, IHS Petra, Geovariences Isatis, and Landmark Software were used for the geologic, geocellular, and reservoir modeling, respectively
• For project information, including reports and presentations, please visit:
http://www.isgs.illinois.edu/research/ERD/NCO2EOR

Appendix: Benefit to the program
• Goal: The Storage Infrastructure Technology Area research effort is carrying out regional characterization and small- and large-scale field projects to demonstrate that different storage types in various formation classes, distributed over different geographic regions, both onshore and offshore, have the capability to permanently store CO2 and provide the basis for commercial-scale CO2 projects. This, working together with the two other research areas, address significant technical challenges in order to meet program goals that support the scale-up and widespread deployment of CCS.
• Benefits Statement: This research will potentially demonstrate CO2 -EOR and associated storage as an economically feasible option for small-middle size operators in the Illinois Basin and drive demand for CO2 and investment in infrastructure.

Appendix: Project Overview Goals
DOE Program
• ROZs:- formation, characterization,
and associated storage in conjunction
with EOR
• Co-optimizing CO2-EOR with
associated storage in storage
complexes that have stacked
reservoirs
Stacked ROZ Fairways in ILB Geo-Laboratory
• Identify and characterize primarily siliciclastic ROZs and quantify the CO2-EOR and associated storage resource using data collected and test results from greenfield and brownfield field laboratory sites
• Design economic development strategies to co-optimize CO2-EOR and associated storage in stacked storage complexes using reservoir simulations calibrated to field laboratory test results
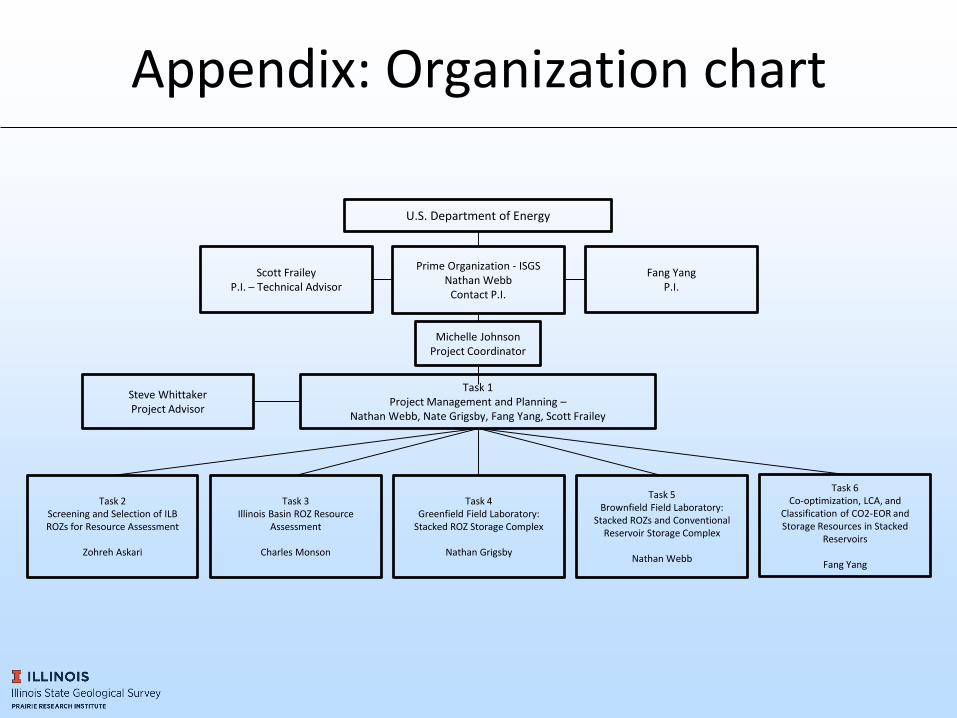
Appendix: Organization chart
U.S. Department of Energy
Prime Organization - ISGSNathan Webb
Contact P.I.
Scott FraileyP.I. – Technical Advisor
Fang YangP.I.
Michelle Johnson Project Coordinator
Task 2 Screening and Selection of ILB ROZs for Resource Assessment
Zohreh Askari
Task 3 Illinois Basin ROZ Resource
Assessment
Charles Monson
Task 5 Brownfield Field Laboratory:
Stacked ROZs and Conventional Reservoir Storage Complex
Nathan Webb
Task 6 Co-optimization, LCA, and
Classification of CO2-EOR and Storage Resources in Stacked
Reservoirs
Fang Yang
Task 1Project Management and Planning –
Nathan Webb, Nate Grigsby, Fang Yang, Scott Frailey
Task 4Greenfield Field Laboratory:
Stacked ROZ Storage Complex
Nathan Grigsby
Steve WhittakerProject Advisor
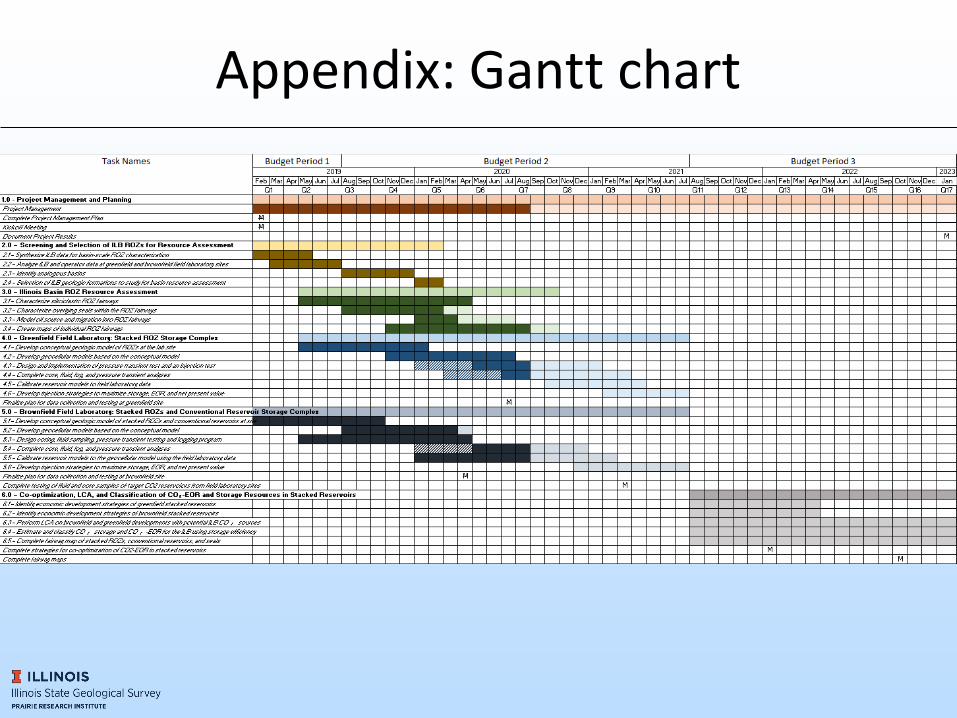
Appendix: Gantt chart


