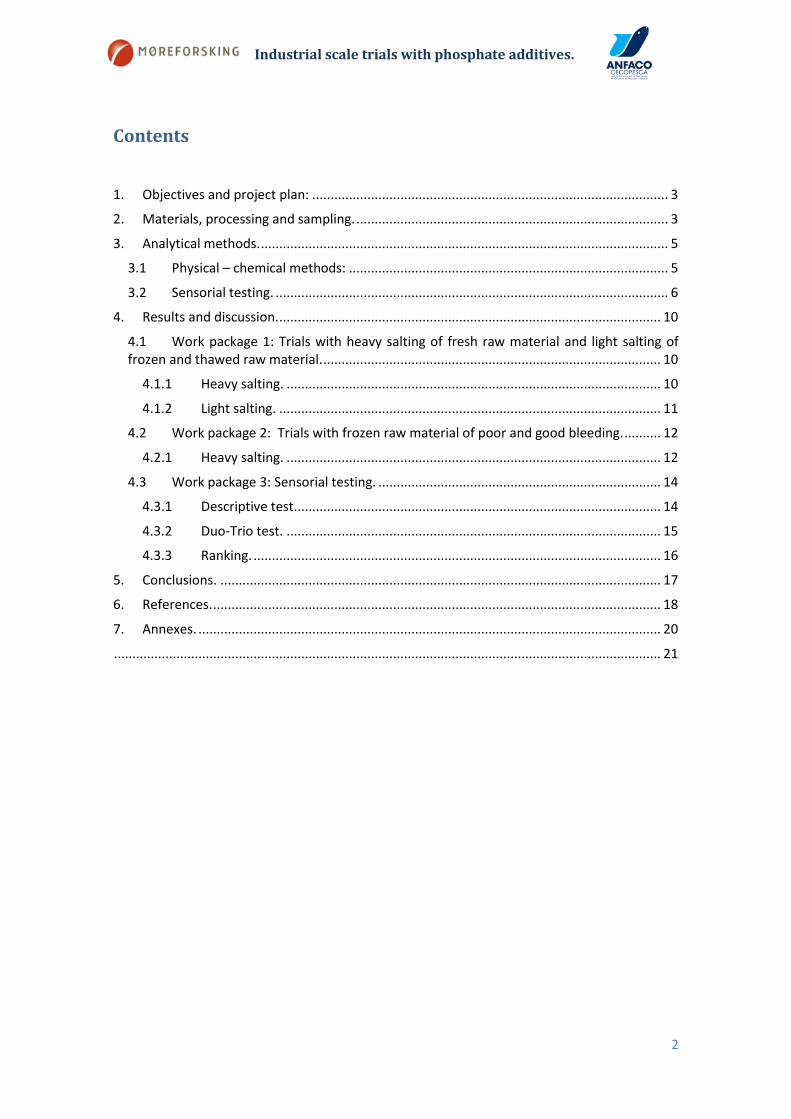
Stabilizing quality of light and heavy salted cod
31
Authors: Ingebrigt Bjørkevoll, Rodrigo G. Reboredo, Trygg Barnung, Kristine Kvangarsnes, Lorena Formoso, Turid Standal Fylling, Sjurdur Joensen og Bjørn Gundersen. Stabilizing quality of light and heavy salted cod Industrial scale trials with phosphate additives
-
Upload
vuongnguyet -
Category
Documents
-
view
217 -
download
0
Transcript of Stabilizing quality of light and heavy salted cod
1
Authors: Ingebrigt Bjørkevoll, Rodrigo G. Reboredo, Trygg Barnung, Kristine Kvangarsnes, Lorena Formoso, Turid Standal Fylling, Sjurdur Joensen og Bjørn Gundersen.
Stabilizing quality of light and heavy salted cod Industrial scale trials with phosphate additives
Industrial scale trials with phosphate additives.
2
Contents 1. Objectives and project plan: ................................................................................................. 3
2. Materials, processing and sampling. ..................................................................................... 3
3. Analytical methods. ............................................................................................................... 5
3.1 Physical – chemical methods: ....................................................................................... 5
3.2 Sensorial testing. ........................................................................................................... 6
4. Results and discussion. ........................................................................................................ 10
4.1 Work package 1: Trials with heavy salting of fresh raw material and light salting of frozen and thawed raw material. ............................................................................................ 10
4.1.1 Heavy salting. ...................................................................................................... 10
4.1.2 Light salting. ........................................................................................................ 11
4.2 Work package 2: Trials with frozen raw material of poor and good bleeding. .......... 12
4.2.1 Heavy salting. ...................................................................................................... 12
4.3 Work package 3: Sensorial testing. ............................................................................. 14
4.3.1 Descriptive test. ................................................................................................... 14
4.3.2 Duo-Trio test. ...................................................................................................... 15
4.3.3 Ranking. ............................................................................................................... 16
5. Conclusions. ........................................................................................................................ 17
6. References. .......................................................................................................................... 18
7. Annexes. .............................................................................................................................. 20
..................................................................................................................................................... 21
Industrial scale trials with phosphate additives.
3
1. Objectives and project plan: The main objective of this project was to document the effects phosphates have on light salted
and salt-cured fish during processing and storage. The specific work packages that have been
addressed were:
- Work package 1: Large scale light and heavy salting of cod.
In this part of the project, split cut fresh cod caught with net and long line was heavy salted.
For the production of light salted cod, frozen and thawed long line and trawler caught cod
were used. This work package was carried out the first and second half of 2012.
- Work package 2: Large scale heavy salting of good and poor bled cod raw
materials.
Split cod from a frozen trawler catch was heavy salted. Raw materials were poorly (direct
slaughtered) or normally bled prior to processing onboard for the evaluation of quality and
how the two raw material qualities was affected by phosphate. This work package was carried
out the second half of 2012.
- Work package 3: Sensorial testing of raw and cooked cod loins
Heavy salted cod loins were submitted to sensorial testing by a taster panel. Visual
appearance of heavy salted loins and sensorial features of desalted and cooked samples were
determined. This sensorial testing was carried out at ANFACO-CECOPESCA facilities in October
2012.
2. Materials, processing and sampling.
Materials in this project consisted on fillets or split cod, either fresh or frozen raw materials,
heavy salted, light-salted, and brines. Heavy salting was carried out by injection of 17% brine
added 0, 2 or 4% phosphate followed by pickle salting with the addition of approximately 100 l
brine containing 0, 2 or 4% phosphate with a ratio of 1 part brine to 6 parts fish.
Work package 1:
For the study of heavy salted cod, fresh raw materials were caught off the coast of Northern
Norway by coastal vessels in February 2012 using long-line and net catching methods. Freshly
split cod was submitted to heavy salting, and a five sample set of raw materials was directly
frozen and stored in deep-freeze for chemical analysis. Heavy salted groups consisted of a
control sample set (without the use of phosphates) and two levels of CARNAL 2110 treatment
(2% and 4% w/w). For each one of the 6 heavy salted cod groups, 5 samples were analyzed
chemically. After 14 days of pickle salting, brine samples were also collected for each of the 6
heavy salted groups from WP1. Each of the groups was composed of three replicates.
For the light salted experiments, at sea frozen cod, caught by trawler or long-line, was filleted
Industrial scale trials with phosphate additives.
4
after thawing. The experiments consisted of a control sample set (without the use of
phosphates) and two levels of CARNAL 2110 treatment (1% and 2% w/w). Each one of the 6
groups included 5 samples of raw materials and light salted cod for chemical analysis.
Work package 2:
Cod harvested in March 2012 by a net trawler were poorly or well bled before being gutted
and directly after frozen on-board. After thawing, cod materials were industrially heavy salted
and stored in chilled conditions up to 7 months. Heavy salted groups consisted of a control
sample set (without the use of phosphates) and two levels of CARNAL 2110 treatment (2% and
4% w/v). Brines from each one of the 6 heavy salted groups in WP2 were also collected. For
the chemical determination 3 samples of raw materials and heavy salted cod from each group
were analyzed.
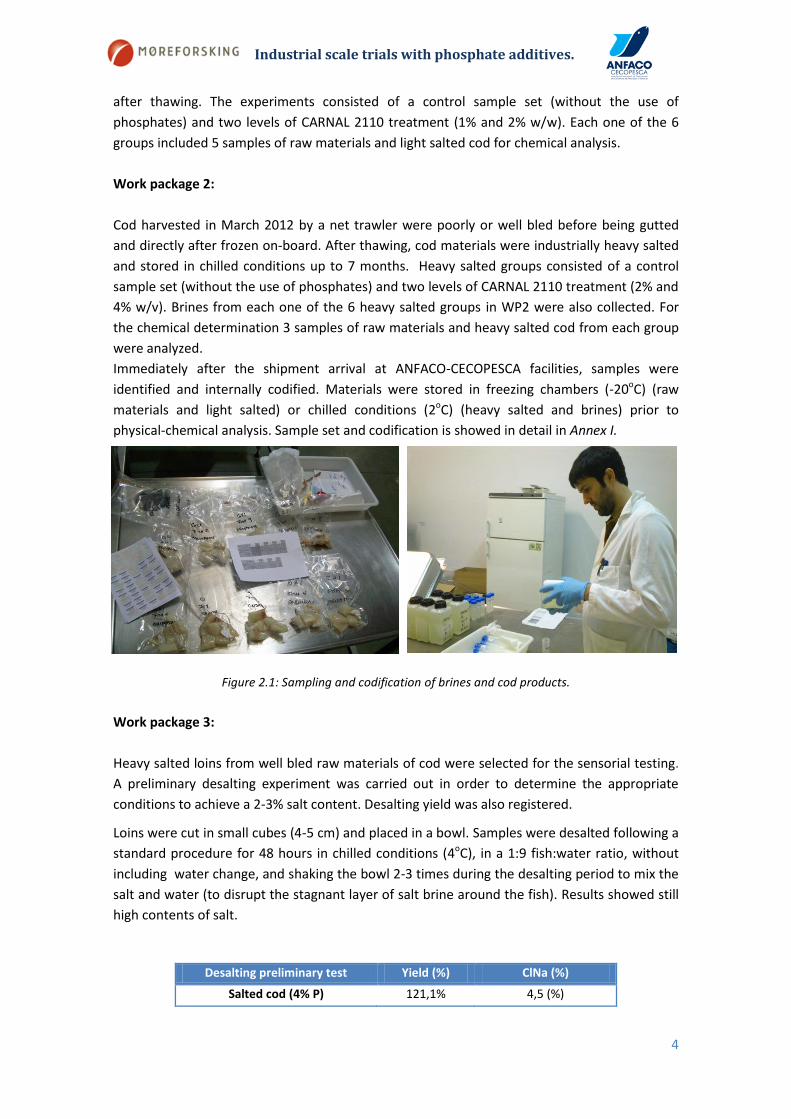
Immediately after the shipment arrival at ANFACO-CECOPESCA facilities, samples were
identified and internally codified. Materials were stored in freezing chambers (-20oC) (raw
materials and light salted) or chilled conditions (2oC) (heavy salted and brines) prior to
physical-chemical analysis. Sample set and codification is showed in detail in Annex I.
Figure 2.1: Sampling and codification of brines and cod products.
Work package 3:
Heavy salted loins from well bled raw materials of cod were selected for the sensorial testing.
A preliminary desalting experiment was carried out in order to determine the appropriate
conditions to achieve a 2-3% salt content. Desalting yield was also registered.
Loins were cut in small cubes (4-5 cm) and placed in a bowl. Samples were desalted following a
standard procedure for 48 hours in chilled conditions (4oC), in a 1:9 fish:water ratio, without
including water change, and shaking the bowl 2-3 times during the desalting period to mix the
salt and water (to disrupt the stagnant layer of salt brine around the fish). Results showed still
high contents of salt.
Desalting preliminary test Yield (%) ClNa (%)
Salted cod (4% P) 121,1% 4,5 (%)
Industrial scale trials with phosphate additives.
5
Salted cod (control 0% P) 120,3% 5,8 (%)
One water renewal was introduced at 24h, but salt residuals were still high.
Desalting preliminary test Yield (%) ClNa (%)
Salted cod (2% P) 116,2% 4,8%
In order not to change total desalting time, a second water change was performed at 32 h. The
final residuals were optimal (2-3%).
Desalting preliminary test Yield (%) ClNa (%)
Salted cod (2% P) 120,1% 3,1%
Finally selected desalting procedure was 48 hours desalting time at 5oC, with two water
changes (after 24 and 32 hours), 2-3 times of stirring and a fish:water ratio of 1:9.
For the cooking of cod samples for sensorial testing, the cube-samples were steamed putting
them individually into aluminum foil trays, placed on the oven tray, which contained water for
making steam. Temperature during the boiling process was 200 oC for about 8 minutes, until
the core temperature of the product was 60-65oC. Note that the samples were cooked in their
own juice, with no salt or any other ingredient added.
3. Analytical methods.
3.1 Physical – chemical methods:
- Fat oxidation.
Primary and secondary fat oxidation in the samples was determined using Peroxides and
TBARS indexes. The method used for peroxides quantification is based on the iodine titration
with a sodium thiosulfate solution, and starch as indicator (AOAC Official method 965.33
(1965); Cox, H.E. & Pearson, D. (1962)). Fat extraction from fish tissue was carried out using
chloroform in the presence of sodium sulfate and propyl gallate to prevent further oxidation
during analytical procedure. Peroxide value (PV) is considered to represent the quantity of
active oxygen (milliequivalents O2) contained in 1 kg of lipid and which could oxidize the
potassium iodide.
Within the wide variety of options for TBARS analysis, the method used was the one proposed
by Vyncke (1970), including some modifications by Cervantes et al. (1984). This method
consists of a reaction between the lipid material and the 2-thiobarbituric acid to create a red-
pink color which is measured at 532 nm in a UV/VIS spectrophotometer (Perkin Elmer Lambda
25). TBA-results are expressed as µmol malonaldehyde (MAD) in 1 Kg of muscle tissue.
- Analysis of minerals.
Mineral determinations of cod samples involved a complete digestion of the samples in
pressurized vessels with HNO3 ((65%) (Trace analysis grade:Scharlau) and H2O2 (30%
Suprapur:Merck) as oxidizing agent. Samples underwent an 18 min. heating program in a
Industrial scale trials with phosphate additives.
6
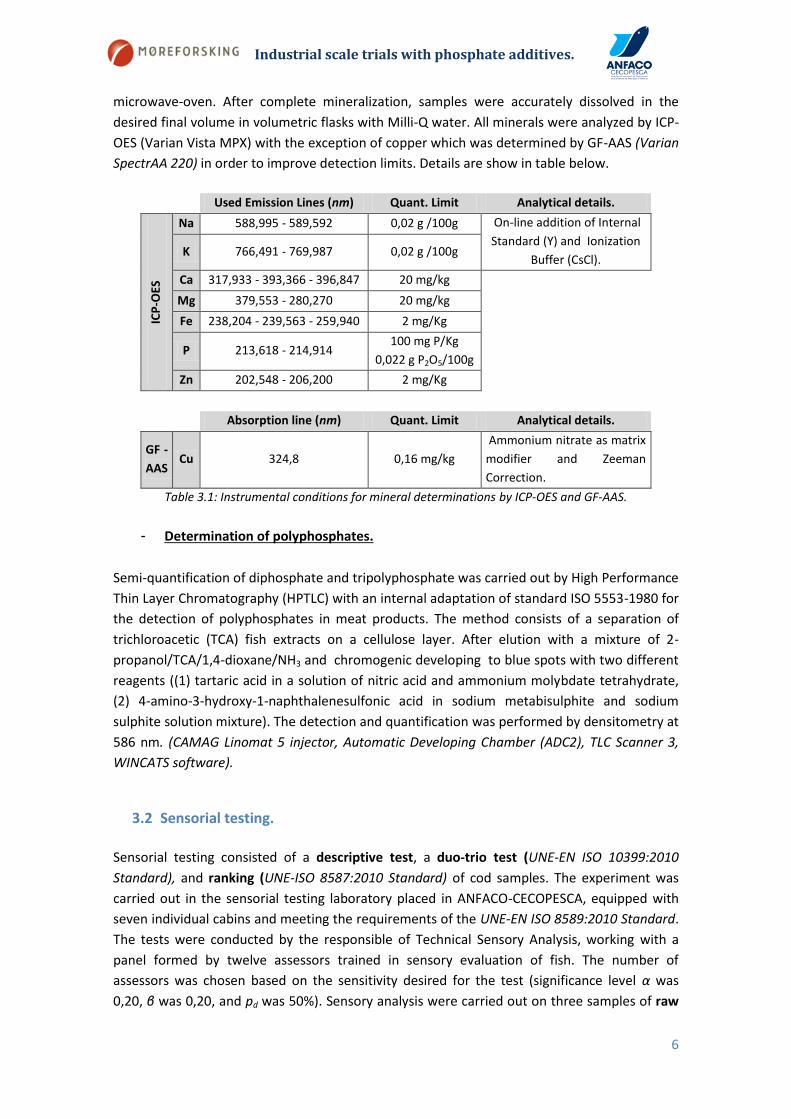
microwave-oven. After complete mineralization, samples were accurately dissolved in the
desired final volume in volumetric flasks with Milli-Q water. All minerals were analyzed by ICP-
OES (Varian Vista MPX) with the exception of copper which was determined by GF-AAS (Varian
SpectrAA 220) in order to improve detection limits. Details are show in table below.
Used Emission Lines (nm) Quant. Limit Analytical details.
ICP
-OES
Na 588,995 - 589,592 0,02 g /100g On-line addition of Internal
Standard (Y) and Ionization
Buffer (CsCl). K 766,491 - 769,987 0,02 g /100g
Ca 317,933 - 393,366 - 396,847 20 mg/kg
Mg 379,553 - 280,270 20 mg/kg
Fe 238,204 - 239,563 - 259,940 2 mg/Kg
P 213,618 - 214,914
100 mg P/Kg
0,022 g P2O5/100g
Zn 202,548 - 206,200 2 mg/Kg
Absorption line (nm) Quant. Limit Analytical details.
GF -
AAS Cu 324,8 0,16 mg/kg
Ammonium nitrate as matrix
modifier and Zeeman
Correction.
Table 3.1: Instrumental conditions for mineral determinations by ICP-OES and GF-AAS.
- Determination of polyphosphates.
Semi-quantification of diphosphate and tripolyphosphate was carried out by High Performance
Thin Layer Chromatography (HPTLC) with an internal adaptation of standard ISO 5553-1980 for
the detection of polyphosphates in meat products. The method consists of a separation of
trichloroacetic (TCA) fish extracts on a cellulose layer. After elution with a mixture of 2-
propanol/TCA/1,4-dioxane/NH3 and chromogenic developing to blue spots with two different
reagents ((1) tartaric acid in a solution of nitric acid and ammonium molybdate tetrahydrate,
(2) 4-amino-3-hydroxy-1-naphthalenesulfonic acid in sodium metabisulphite and sodium
sulphite solution mixture). The detection and quantification was performed by densitometry at
586 nm. (CAMAG Linomat 5 injector, Automatic Developing Chamber (ADC2), TLC Scanner 3,
WINCATS software).
3.2 Sensorial testing.
Sensorial testing consisted of a descriptive test, a duo-trio test (UNE-EN ISO 10399:2010
Standard), and ranking (UNE-ISO 8587:2010 Standard) of cod samples. The experiment was
carried out in the sensorial testing laboratory placed in ANFACO-CECOPESCA, equipped with
seven individual cabins and meeting the requirements of the UNE-EN ISO 8589:2010 Standard.
The tests were conducted by the responsible of Technical Sensory Analysis, working with a
panel formed by twelve assessors trained in sensory evaluation of fish. The number of
assessors was chosen based on the sensitivity desired for the test (significance level α was
0,20, β was 0,20, and pd was 50%). Sensory analysis were carried out on three samples of raw

Industrial scale trials with phosphate additives.
7
and steamed (previously desalted) cod, processed with different concentrations of
polyphosphates, in order to describe and to characterize the samples.
- Descriptive test.
The Descriptive Test allows characterizing samples by evaluating the intensity of different
quality parameters by the assessors using a scale from 1 to 9 points. The tests were conducted
by the responsible of Technical Sensory Analysis, working with a panel of twelve assessors
trained in sensory evaluation of fish.
For the performance of tests, assessors were provided with a set of each of the samples. The
preparation of various sets of samples was treated identically, with the same approximated
amount of product and the same provision in aluminium trays for single use. The samples were
identified with a 3 digit code chosen at random, so that the assessors could not obtain
information that could affect the results (Table 3.2).
PRODUCT REFERENCE
Boiled cod 501 0% polyphosphates
Boiled cod 397 2% polyphosphates
Boiled cod 263 4% polyphosphates
Table 3.2: Sample codification in the descriptive test.
The samples were presented simultaneously to testers so that the person consulted could
punctuate the evaluated quality parameters. Once tested by each assessor, the results were
processed by the assessor team management for the application of consequent data
processing.
- Duo-trio test.
Analysis carried out with samples of steamed (previously desalted) cod, processed with
different concentrations of polyphosphates, in order to determine whether a perceptible
sensory difference exists between samples of two products. As the products were familiar for
the assessors, it was used the constant reference technique.
Assessors received a set of three samples (i.e. a triad), one sample of which was labelled as a
reference and the other two samples had different codes. The assessors were informed that
one of the coded samples was the same as the reference and that one was different. Based on
the instructions given prior to the test, the assessors reported either which of the coded
samples they believed to be different from the reference.
The products considered and evaluated in the test were the following:
PRODUCT CODIFICATION
Boiled (previously desalted) cod 856 0% polyphosphates
Boiled (previously desalted) cod 132 4% polyphosphates

Industrial scale trials with phosphate additives.
8
Table 3.3: Sample codification for the duo-trio test.
The preparation of samples was treated identically, with the same approximated amount of
product and the same provision in aluminium trays for single use. The samples were identified
with a 3 digit code chosen at random, so that the assessors could not obtain information that
could alter the results.
The samples were presented simultaneously to assessors so that the person consulted could
point out the sample that was identified as different. Once tested by each assessor, the results
were processed by the assessor team management for the application of consequent data
processing.
- Ranking test.
The Ranking Test determines whether there are significant differences among the samples
submitted, also defining an order among the different samples. Applied procedure has been
based on the UNE-ISO 8587:2010 Standard.
The samples considered and evaluated in the test were the following:
PRODUCT REFERENCE Nº UNITS
Salt fish loins 713 0% polyphosphates 3 units
Salt fish loins 456 2% polyphosphates 3 units
Salt fish loins 980 4% polyphosphates 3 units
Table 3.4: Sample codification for the ranking test.
For performance of tests, testers were provided with a set of each of the samples (coded 713,
456 and 980). The different sets of samples were made up of subsamples of salted fish loins
samples. The preparation of various sets of samples was treated identically, with the same
approximated amount of product and the same provision in plastic dishes for single use. The
samples were identified with a 3 digit code chosen at random, so that the assessors could not
obtain information that could alter the results.
The samples were presented simultaneously to testers so that the person consulted could
classify the order of each sample. Once tested by each assessor, the results were processed by
the assessor team management for the application of consequent data processing. Various
tests were developed for the statistical treatment of data as follows:
- Comparison between samples: Friedman Test
This test allows establishing the significance of the differences detected by the assessors
among the three samples tested.
F value of the Friedman test is determined as follows:
F= (12/(J*P*(P+1)))*(Ra2 + Rb
2 + Rc2) - (3*J*(P+1))

Industrial scale trials with phosphate additives.
9
Where:
J is the number of assessors (10)
P is the number of samples (3)
R is the sums of the rankings assigned to the set P of samples for the J assessors.
Comparing the F value of Friedman test calculated for each attribute, with the critical value
tabulated for a significance level of 0.05 and 0.01, it may be concluded with a risk of error of
5% and 1%, whether there are significant differences among the samples for this attribute or
not. Critical Values for ten assessors and three samples for a significance level of 0.05 and 0.01
are respectively 6,200 and 9,600.
- Signification of differences (Test of minimal significant differences-MDS)
If there are significant differences among samples, it is possible to identify the pairs of samples
that differ significantly from each other based on the values of their sums of orders. So, with
two samples i and j, and Ri and Rj their sums of orders, using a normal approximation the two
samples will be different if:
│Ri – Rj│≥ MSD = 1,96 * [(J*P*(P+1))/6]1/2 (level 0,05) - INDIVIDUAL RISK (considering each
pair of samples)
│Ri – Rj│≥ MDS = 2,91 * [(J*P*(P+1))/6]1/2 (level 0,05) - GLOBAL RISK (considering the whole
test)
Comparing the different pairs of samples with the calculated value MDS for a significance level
of 0.05, we have the pairs of samples that differ.
Thus, for a significance level of 0.05, if there are 3 samples and 10 assessors to carry out the
test, it must be satisfied that │Ri - Rj│ ≥ 8.77 (considering each pair of samples) to conclude
that there are differences in a determined attribute in that pair of samples. Moreover, if it is
considered the whole test, it must be satisfied that │Ri – Rj│≥ 13.01.
- Page Test
To assess whether there is a natural order among the three sets of samples for one attribute
or not, there must be performed the Page test, which compares a value L calculated with the
tabulated value for a significance level of 0.05 or, where appropriate, 0,01.
L = Ra + (2*Rb) + (3*Rc)
For one attribute, comparing the sum of ordinations L with the tabulated value for a
significance level of 0.05 or 0.01, we can determine if there is a natural order among samples.
For significance level of 0.05, tabulated value for 10 assessors and 3 samples is 128, and for a
significance level of 0.01, tabulated value is 131. To conclude that there is a natural order
among the three sets of samples for one attribute, it must be satisfied that calculated L ≥
tabulated L.
Industrial scale trials with phosphate additives.
10
4. Results and discussion.
4.1 Work package 1: Trials with heavy salting of fresh raw material and light
salting of frozen and thawed raw material.
The aim of this work package was to determine differences during and after processing
between fish from different catching methods and whether the use of additives affected
quality characters during storage.
4.1.1 Heavy salting.
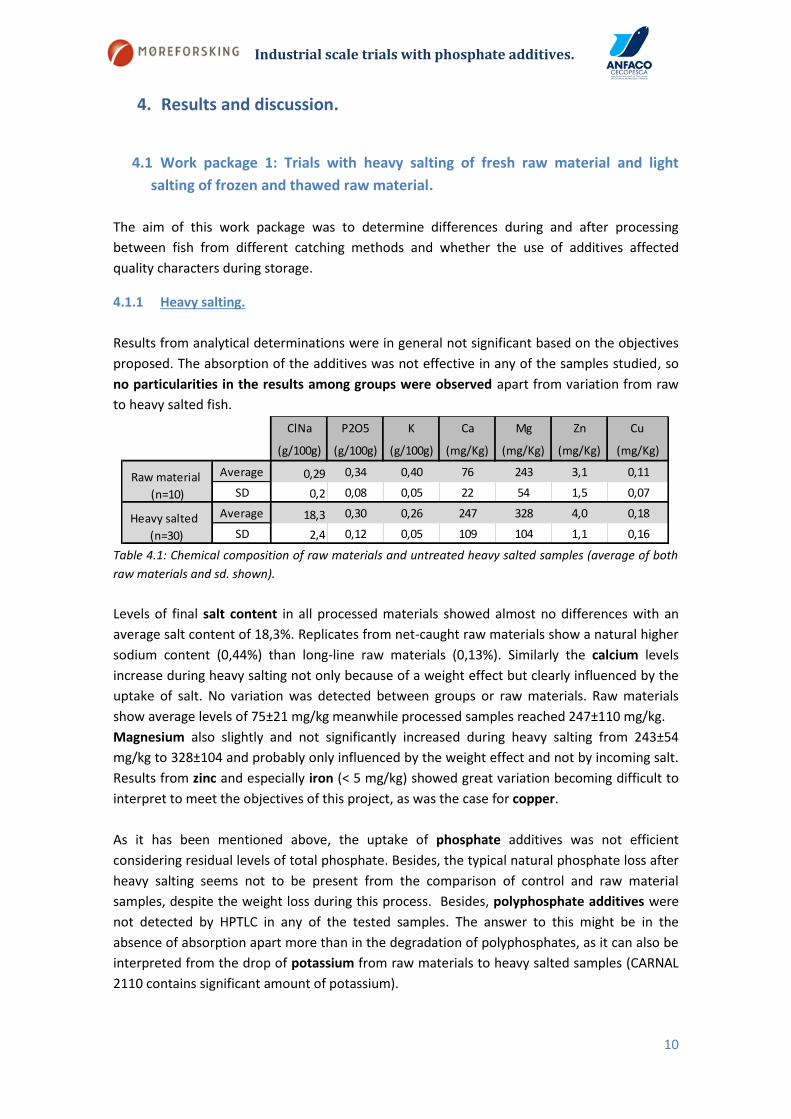
Results from analytical determinations were in general not significant based on the objectives
proposed. The absorption of the additives was not effective in any of the samples studied, so
no particularities in the results among groups were observed apart from variation from raw
to heavy salted fish.
Table 4.1: Chemical composition of raw materials and untreated heavy salted samples (average of both
raw materials and sd. shown).
Levels of final salt content in all processed materials showed almost no differences with an
average salt content of 18,3%. Replicates from net-caught raw materials show a natural higher
sodium content (0,44%) than long-line raw materials (0,13%). Similarly the calcium levels
increase during heavy salting not only because of a weight effect but clearly influenced by the
uptake of salt. No variation was detected between groups or raw materials. Raw materials
show average levels of 75±21 mg/kg meanwhile processed samples reached 247±110 mg/kg.
Magnesium also slightly and not significantly increased during heavy salting from 243±54
mg/kg to 328±104 and probably only influenced by the weight effect and not by incoming salt.
Results from zinc and especially iron (< 5 mg/kg) showed great variation becoming difficult to
interpret to meet the objectives of this project, as was the case for copper.
As it has been mentioned above, the uptake of phosphate additives was not efficient
considering residual levels of total phosphate. Besides, the typical natural phosphate loss after
heavy salting seems not to be present from the comparison of control and raw material
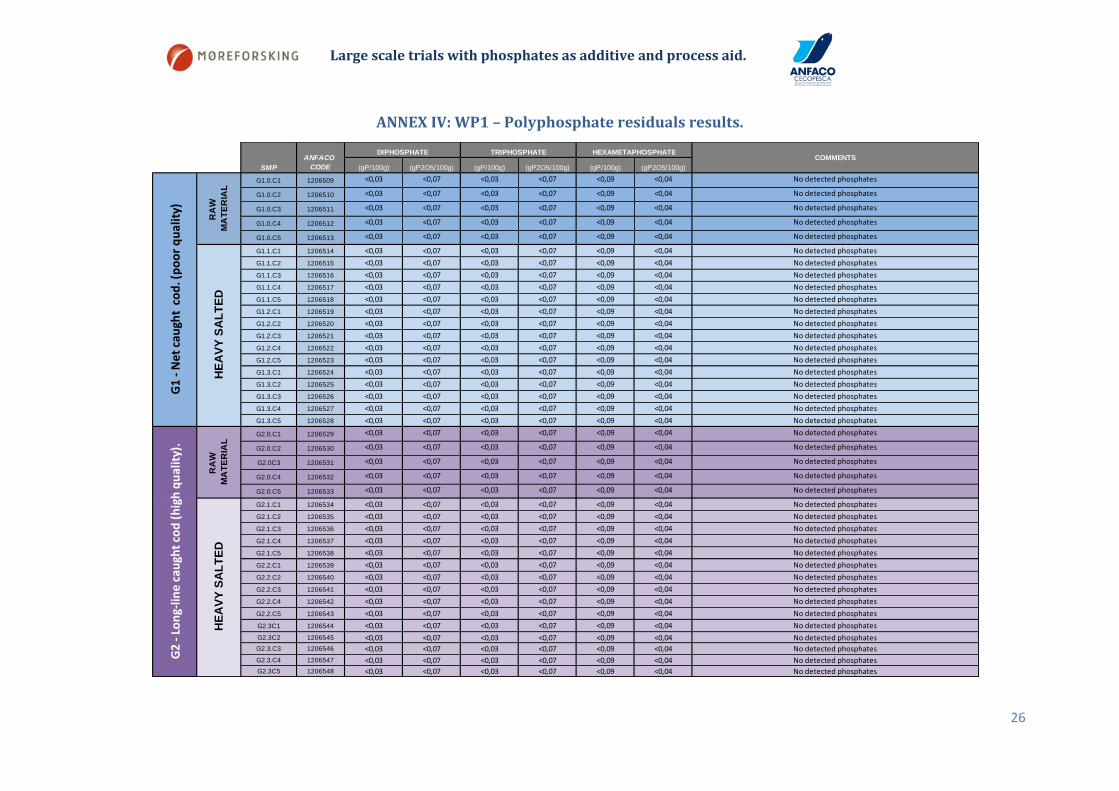
samples, despite the weight loss during this process. Besides, polyphosphate additives were
not detected by HPTLC in any of the tested samples. The answer to this might be in the
absence of absorption apart more than in the degradation of polyphosphates, as it can also be
interpreted from the drop of potassium from raw materials to heavy salted samples (CARNAL
2110 contains significant amount of potassium).
ClNa P2O5 K Ca Mg Zn Cu
(g/100g) (g/100g) (g/100g) (mg/Kg) (mg/Kg) (mg/Kg) (mg/Kg)
Average 0,29 0,34 0,40 76 243 3,1 0,11
SD 0,2 0,08 0,05 22 54 1,5 0,07
Average 18,3 0,30 0,26 247 328 4,0 0,18
SD 2,4 0,12 0,05 109 104 1,1 0,16
Raw material
(n=10)
Heavy salted
(n=30)

Industrial scale trials with phosphate additives.
11
Neither primary nor secondary oxidation were detected in any of the samples since almost the
full data set show peroxides and TBARS values below or close to the quantification limit.
Results from the analysis of brines collected from the pickle salting step showed an increasing
phosphate level with the amount of CARNAL 2110 used in each group, but final contents were
lower than expected. This could be explained by the dilution of phosphates by the liquid loss
from the cod during salting. Calcium and magnesium in brines were in the same range as
muscle samples showing that diffusion ending up in a balance among both phases has taken
place for these elements. No trend in the amount of iron and zinc present in brines was
detected. Again, variation in the data and the low number of replicates does not allow making
any conclusion concerning the effect of phosphates on sequestering of these metals from fish
tissues.
Table 4.2: Mineral results from pickle salting brines.
4.1.2 Light salting.
Light salted samples undergo an internal diffusion of the brine injected into the cod muscle,
leading to a yield gain (weight) which affects the contents of the elements in fish muscle. The
more evident was the increase in salt levels (ClNa) from 0,55±0,19 % in raw materials to 1,13
±0,17 % in light salted fillets. To the contrary, phosphates and potassium levels were slightly
reduced because of the total weight increase in control samples, but the inclusion of CARNAL
2110 seemed to compensate this effect (not statistically significant). Calcium and magnesium
were also slightly reduced because of the yield increase meanwhile iron contents varied too
much between groups and replicates to make any interpretation. Zinc levels remained
constant with 2,5 ± 0,5 mg/Kg as an average for all samples. All samples showed copper levels
below 0,20 mg/kg.
P2O5 Ca Mg Fe Zn
mg P2O5/L mg/L g/L mg/L mg/L
Average 1513 207 237 1,5 0,38
SD 56 4 6 0,2 0,04
Average 3728 194 140 2,3 0,34
SD 177 9 10 1,2 0,03
Average 4787 176 137 1,4 0,42
SD 498 18 31 0,1 0,06
Average 1058 405 577 1,1 0,26
SD 70 4 15 0,2 0,05
Average 2337 314 383 1,2 0,21
SD 61 6 6 0,1 0,01
Average 3077 308 447 1,6 0,37
SD 25 3 12 0,0 0,01
G1
- N
et
cau
ght
co
d.
(po
or
qu
alit
y)
G2
- L
on
g-li
ne
cau
ght
cod
(hig
h q
ual
ity)
.
BR
INE
G1.1.
G1.2
G1.3
G2.1
G2.2
G2.3

Industrial scale trials with phosphate additives.
12
Table 4.3: Mineral results from light salted samples.
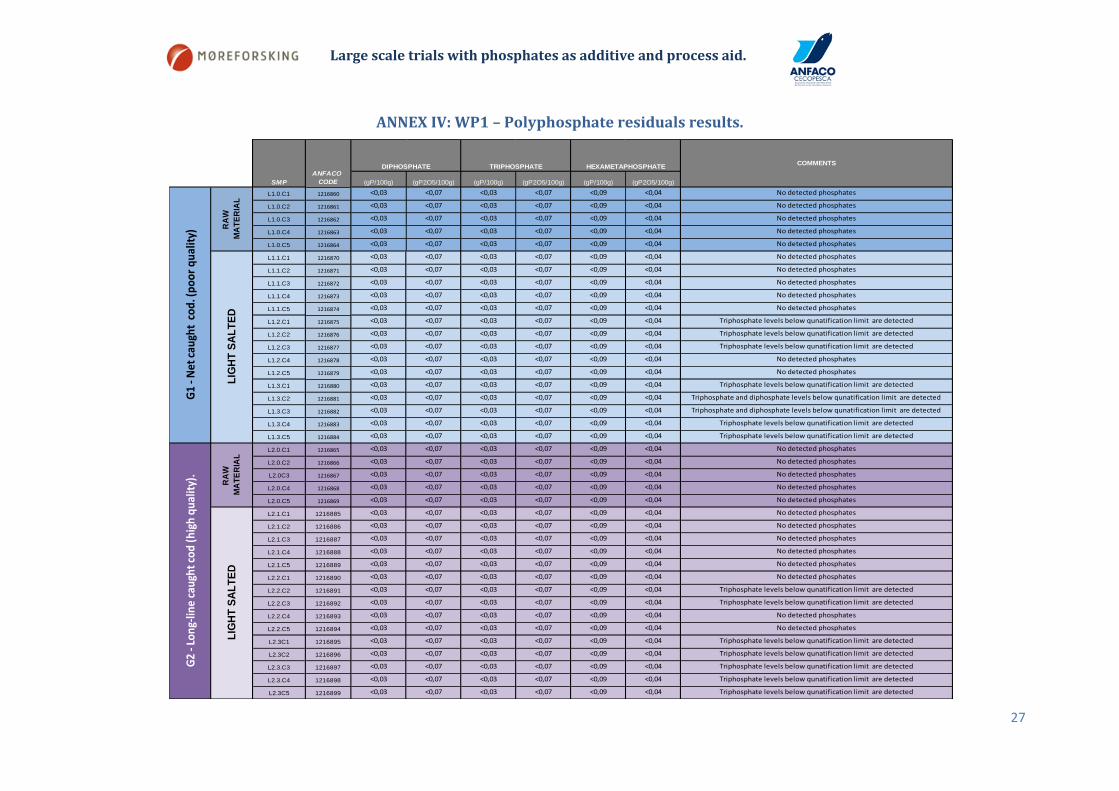
Trace levels of tripolyphosphate (below the quantification limit) were detected in light salted
samples both for all 1% and 2% CARNAL 2110 addition groups.
As well as for the heavy salted samples, practically no oxidation was observed in any of the
samples. PV in all groups and raw material were below quantification limit (<2 meq.O2/Kg fat)
and TBARS showed values under 3,2 µmol MAD/Kg muscle.
4.2 Work package 2: Trials with frozen raw material of poor and good bleeding.
The objective of this work package was to determine the effect of phosphate additives in fish
from different bleeding practices. It was expected that residual blood in muscle from direct
slaughtered raw materials developed a more intense oxidative effect than in optimal bled
samples, and the protection of phosphates could be therefore detected.
4.2.1 Heavy salting.
Concerning the levels of minerals, almost no differences were observed between well bled and
directly slaughtered cod. Results mainly varied from raw materials to fully salted cod and
among groups (Control, 2%, 4% CARNAL 2110 addition).
Levels of salt rose from 0.7% in raw material to 18.0% in the heavy salted product. Salt
contents almost equal the first trial values for fully salted cod, but it was observed an
unexpected increase in raw material levels with values 2 times first trial results. Alike, calcium
significantly increased from raw materials to heavy salted samples, meanwhile magnesium,
which remained still in the first trial, slightly drops in this case when processed. As in the first
trial, iron, copper and zinc levels were low and values do not allow to obtain any information
of significance.
ClNa P2O5 K Ca Mg Fe Zn
(g/100g) (g/100g) (g/100g) (mg/Kg) (mg/Kg) (mg/Kg) (mg/Kg)
Average 0,54 0,39 0,36 87 322 7,7 2,5
SD 0,15 0,05 0,06 45 90 9,2 0,8
Average 0,96 0,32 0,28 67 252 14,4 2,5
SD 0,13 0,05 0,04 22 73 13,3 0,6
Average 1,13 0,37 0,31 78 262 10,8 2,4
SD 0,16 0,06 0,03 29 75 6,1 0,6
Average 1,20 0,45 0,35 85 280 12,9 2,3
SD 0,21 0,08 0,06 28 71 6,8 0,5
Average 0,56 0,36 0,34 90 293 8,4 2,5
SD 0,24 0,04 0,08 42 72 6,4 0,7
Average 1,04 0,32 0,30 89 251 7,3 2,3
SD 0,13 0,07 0,04 48 89 5,2 0,8
Average 1,11 0,34 0,30 97 291 8,4 2,6
SD 0,09 0,06 0,03 30 85 5,8 0,1
Average 1,32 0,42 0,33 90 286 10,0 2,1
SD 0,10 0,10 0,05 33 76 7,5 0,4L.2.3
LIG
HT
SA
LT
iIN
G
Unprocessed
raw material
Unprocessed
raw material
Fro
zen
raw
mat
eria
ls
fro
m n
et t
raw
ling.
Fro
zen
raw
mat
eria
ls
fro
m L
on
g-lin
e
L1.1.
L1.2
L.2.1
L.2.2
L1.3
Industrial scale trials with phosphate additives.
13
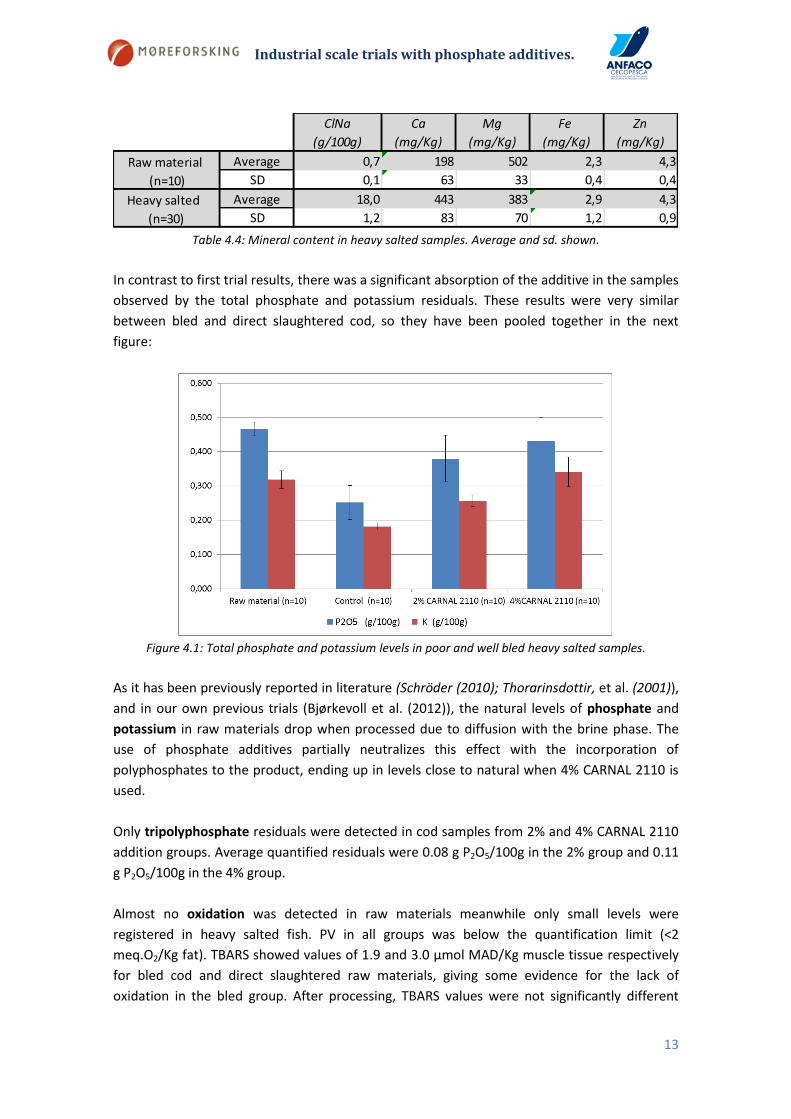
Table 4.4: Mineral content in heavy salted samples. Average and sd. shown.
In contrast to first trial results, there was a significant absorption of the additive in the samples
observed by the total phosphate and potassium residuals. These results were very similar
between bled and direct slaughtered cod, so they have been pooled together in the next
figure:
Figure 4.1: Total phosphate and potassium levels in poor and well bled heavy salted samples.
As it has been previously reported in literature (Schröder (2010); Thorarinsdottir, et al. (2001)),
and in our own previous trials (Bjørkevoll et al. (2012)), the natural levels of phosphate and
potassium in raw materials drop when processed due to diffusion with the brine phase. The
use of phosphate additives partially neutralizes this effect with the incorporation of
polyphosphates to the product, ending up in levels close to natural when 4% CARNAL 2110 is
used.
Only tripolyphosphate residuals were detected in cod samples from 2% and 4% CARNAL 2110
addition groups. Average quantified residuals were 0.08 g P2O5/100g in the 2% group and 0.11
g P2O5/100g in the 4% group.
Almost no oxidation was detected in raw materials meanwhile only small levels were
registered in heavy salted fish. PV in all groups was below the quantification limit (<2
meq.O2/Kg fat). TBARS showed values of 1.9 and 3.0 µmol MAD/Kg muscle tissue respectively
for bled cod and direct slaughtered raw materials, giving some evidence for the lack of
oxidation in the bled group. After processing, TBARS values were not significantly different
ClNa Ca Mg Fe Zn
(g/100g) (mg/Kg) (mg/Kg) (mg/Kg) (mg/Kg)
Average 0,7 198 502 2,3 4,3
SD 0,1 63 33 0,4 0,4
Average 18,0 443 383 2,9 4,3
SD 1,2 83 70 1,2 0,9
Raw material
(n=10)
Heavy salted
(n=30)
Industrial scale trials with phosphate additives.
14
among control and phosphate addition groups, with 5.0 µmol MAD/Kg muscle tissue as an
average.
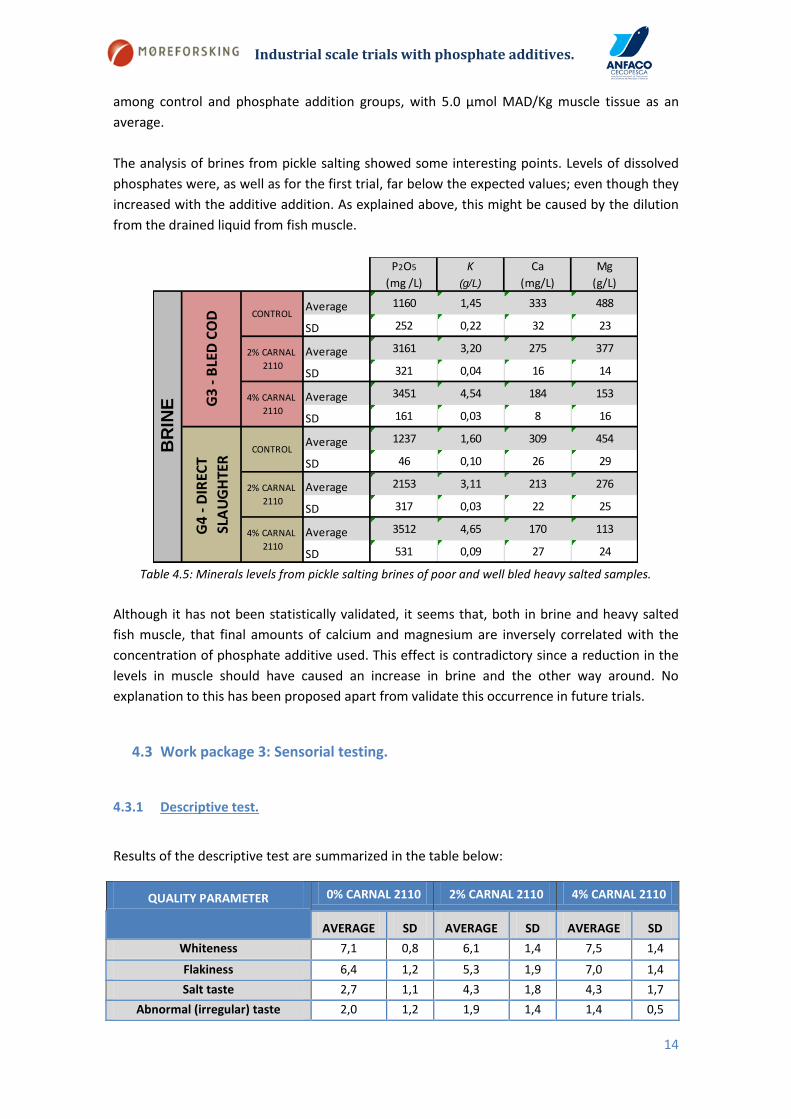
The analysis of brines from pickle salting showed some interesting points. Levels of dissolved
phosphates were, as well as for the first trial, far below the expected values; even though they
increased with the additive addition. As explained above, this might be caused by the dilution
from the drained liquid from fish muscle.
Table 4.5: Minerals levels from pickle salting brines of poor and well bled heavy salted samples.
Although it has not been statistically validated, it seems that, both in brine and heavy salted
fish muscle, that final amounts of calcium and magnesium are inversely correlated with the
concentration of phosphate additive used. This effect is contradictory since a reduction in the
levels in muscle should have caused an increase in brine and the other way around. No
explanation to this has been proposed apart from validate this occurrence in future trials.
4.3 Work package 3: Sensorial testing.
4.3.1 Descriptive test.
Results of the descriptive test are summarized in the table below:
P2O5 K Ca Mg
(mg /L) (g/L) (mg/L) (g/L)
Average 1160 1,45 333 488
SD 252 0,22 32 23
Average 3161 3,20 275 377
SD 321 0,04 16 14
Average 3451 4,54 184 153
SD 161 0,03 8 16
Average 1237 1,60 309 454
SD 46 0,10 26 29
Average 2153 3,11 213 276
SD 317 0,03 22 25
Average 3512 4,65 170 113
SD 531 0,09 27 24
CONTROL
2% CARNAL
2110
4% CARNAL
2110
G3
- B
LED
CO
DG
4 -
DIR
ECT
SLA
UG
HTE
R
BR
INE
CONTROL
2% CARNAL
2110
4% CARNAL
2110
QUALITY PARAMETER 0% CARNAL 2110 2% CARNAL 2110 4% CARNAL 2110
AVERAGE SD AVERAGE SD AVERAGE SD
Whiteness 7,1 0,8 6,1 1,4 7,5 1,4
Flakiness 6,4 1,2 5,3 1,9 7,0 1,4
Salt taste 2,7 1,1 4,3 1,8 4,3 1,7
Abnormal (irregular) taste 2,0 1,2 1,9 1,4 1,4 0,5
Industrial scale trials with phosphate additives.
15
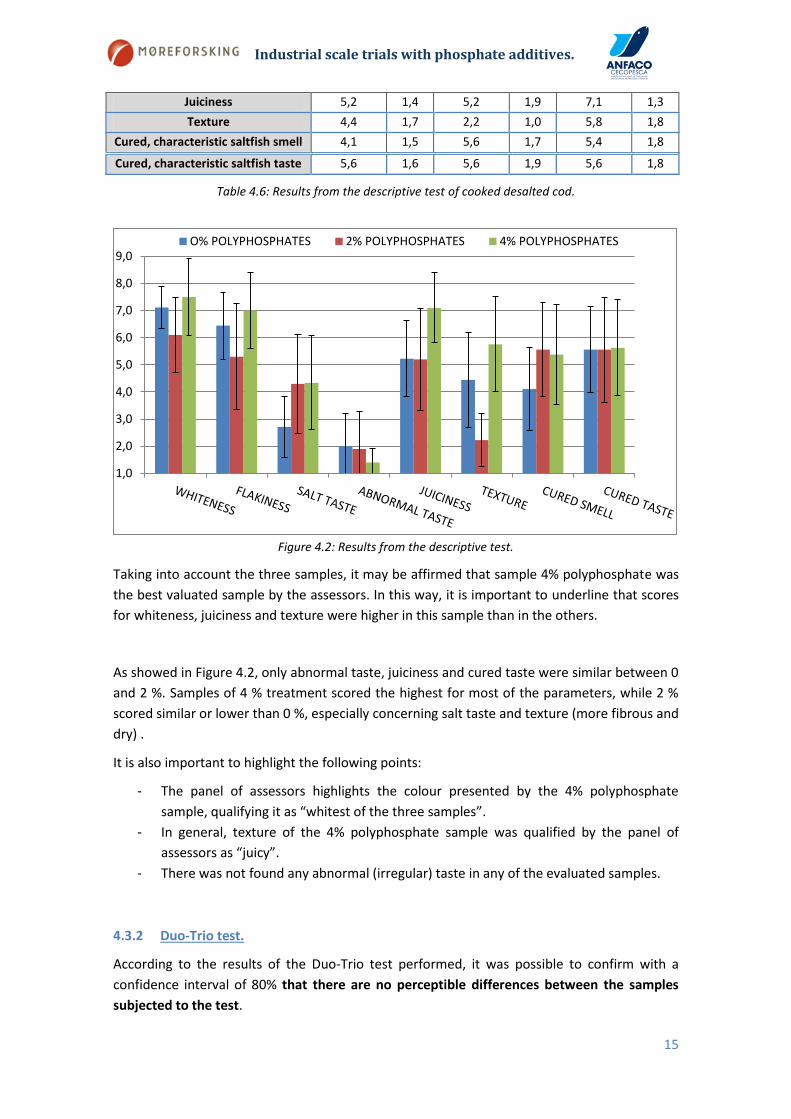
Table 4.6: Results from the descriptive test of cooked desalted cod.
Figure 4.2: Results from the descriptive test.
Taking into account the three samples, it may be affirmed that sample 4% polyphosphate was
the best valuated sample by the assessors. In this way, it is important to underline that scores
for whiteness, juiciness and texture were higher in this sample than in the others.
As showed in Figure 4.2, only abnormal taste, juiciness and cured taste were similar between 0
and 2 %. Samples of 4 % treatment scored the highest for most of the parameters, while 2 %
scored similar or lower than 0 %, especially concerning salt taste and texture (more fibrous and
dry) .
It is also important to highlight the following points:
- The panel of assessors highlights the colour presented by the 4% polyphosphate
sample, qualifying it as “whitest of the three samples”.
- In general, texture of the 4% polyphosphate sample was qualified by the panel of
assessors as “juicy”.
- There was not found any abnormal (irregular) taste in any of the evaluated samples.
4.3.2 Duo-Trio test.
According to the results of the Duo-Trio test performed, it was possible to confirm with a
confidence interval of 80% that there are no perceptible differences between the samples
subjected to the test.
1,0
2,0
3,0
4,0
5,0
6,0
7,0
8,0
9,0O% POLYPHOSPHATES 2% POLYPHOSPHATES 4% POLYPHOSPHATES
Juiciness 5,2 1,4 5,2 1,9 7,1 1,3
Texture 4,4 1,7 2,2 1,0 5,8 1,8
Cured, characteristic saltfish smell 4,1 1,5 5,6 1,7 5,4 1,8
Cured, characteristic saltfish taste 5,6 1,6 5,6 1,9 5,6 1,8
Industrial scale trials with phosphate additives.
16
QUESTION ANSWERS RESULT
Reference
Sample
Different
sample
Signification
Level
Perceptibly
differences
Which sample do you think that is
different from the reference sample?
5 7 0.20 NO
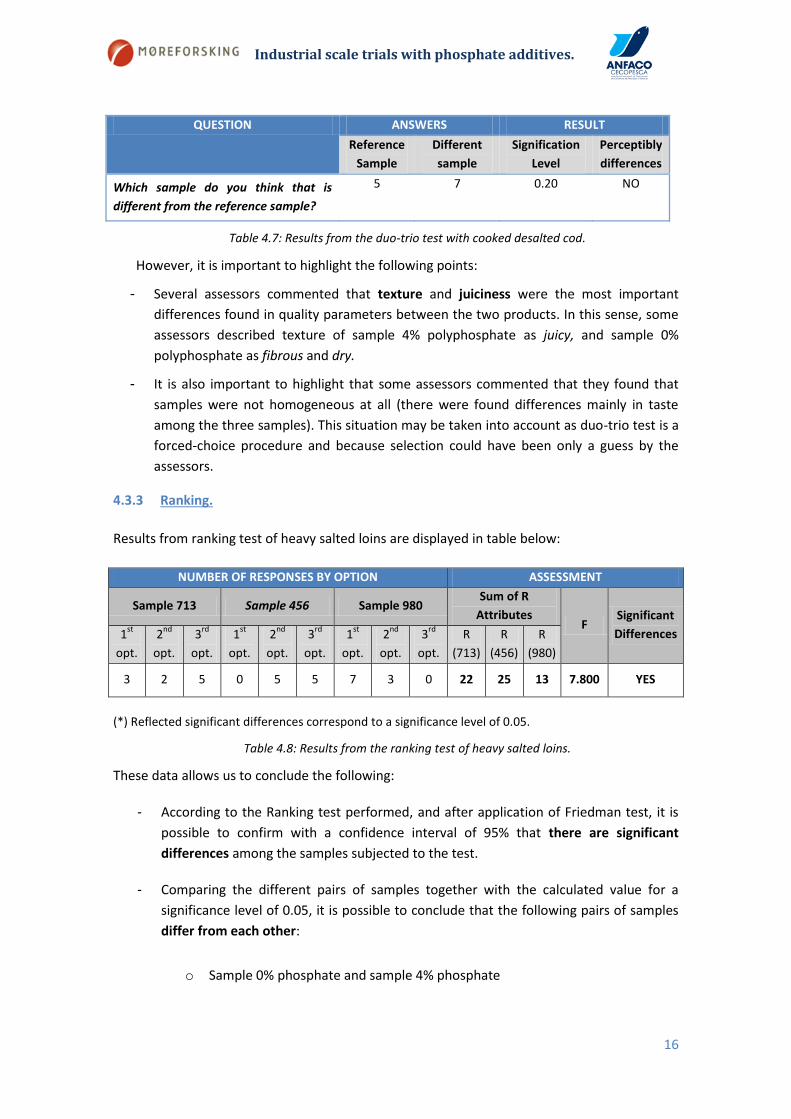
Table 4.7: Results from the duo-trio test with cooked desalted cod.
However, it is important to highlight the following points:
- Several assessors commented that texture and juiciness were the most important
differences found in quality parameters between the two products. In this sense, some
assessors described texture of sample 4% polyphosphate as juicy, and sample 0%
polyphosphate as fibrous and dry.
- It is also important to highlight that some assessors commented that they found that
samples were not homogeneous at all (there were found differences mainly in taste
among the three samples). This situation may be taken into account as duo-trio test is a
forced-choice procedure and because selection could have been only a guess by the
assessors.
4.3.3 Ranking.
Results from ranking test of heavy salted loins are displayed in table below:
NUMBER OF RESPONSES BY OPTION ASSESSMENT
Sample 713 Sample 456 Sample 980 Sum of R
Attributes F
Significant
Differences 1st
opt.
2nd
opt.
3rd
opt.
1st
opt.
2nd
opt.
3rd
opt.
1st
opt.
2nd
opt.
3rd
opt.
R
(713)
R
(456)
R
(980)
3 2 5 0 5 5 7 3 0 22 25 13 7.800 YES
(*) Reflected significant differences correspond to a significance level of 0.05.
Table 4.8: Results from the ranking test of heavy salted loins.
These data allows us to conclude the following:
- According to the Ranking test performed, and after application of Friedman test, it is
possible to confirm with a confidence interval of 95% that there are significant
differences among the samples subjected to the test.
- Comparing the different pairs of samples together with the calculated value for a
significance level of 0.05, it is possible to conclude that the following pairs of samples
differ from each other:
o Sample 0% phosphate and sample 4% phosphate
Industrial scale trials with phosphate additives.
17
o Sample 2% phosphate and sample 4% phosphate
- Comparing the critical value of Page test tabulated with the calculated value, we can
conclude that, with a confidence interval of 99%, there is a natural order among the
individual samples, being this:
R Sample 4% P ≤ RSample 0% P ≤ RSample 2% P
- It means that Sample 4% polyphosphate is considered the best sample of this ranking
by the assessors, and that Sample 2% polyphosphate is considered the least preferred
sample of this ranking by the assessors.
It is also important to highlight the following points:
- The panel of assessors highlights the colour presented by the sample 4%
polyphosphate, describing it as “whitest of the three samples”.
- In general, texture and smell were qualified by the panel of assessors as “quite similar in
the three samples”.
5. Conclusions.
The lack of chemical oxidation in light salted and heavy salted samples limited
considerably the possibilities to access the effect of phosphates on fish fat preservation
during processing and storage. In addition, the apparent absence of absorption of
additives in the first trial, also limited the study of the effects of phosphates in products
from fresh raw materials of a different catch method (long-line/ net), and salted
samples from these raw materials. The results show that the phosphate uptake is
considerably higher in frozen raw materials than fresh raw materials after heavy salting.
We find no good explanation for this observation. Calcium present in heavy salted cod
depends on levels present in salt and the final salt level in the product. Evidences have
been detected concerning an existing balance between brine and muscle contents due
to diffusion in calcium and magnesium.
The utilization of total iron contents as a marker of residual blood is not effective since
results are low and varying, and not corresponding to visual evaluation of blood content
in the muscle. Other markers should be studied in the future to measure the blood level
and evaluate the influence of residual blood on oxidation and surface discolouration.
Copper contents are also very low and it seems not feasible to correlate copper
contents with quality grading of the product after processing, if a real influence from
these low copper contents exist on fish surface yellowing.
The comparison of levels in brines and muscle seems to show that if any chelation
effect from phosphates on oxidizing elements is present it does not lead these elements
to leak out from muscle tissue to brine.
In light salted samples, since diffusion takes place only internally, the levels of minerals
and residual phosphates are only conditioned by the final weight increase and the
Industrial scale trials with phosphate additives.
18
amount of salt and additives used in injection. Degradation of phosphate additives is
present during frozen storage due to lack of pyrophosphate and only trace residuals of
tripolyphosphate.
When diffusion from muscle to brine and vice versa is present, natural levels of
phosphates are reduced far below natural levels. Only the addition of significant
amounts of phosphate additives compensates this loss.
The utilization of CARNAL 2110 in brines during processing (injection + pickle salting
brines) in 4% concentration seems to improve sensorial quality of cod products. Colour
and more intensely texture were the attributes underlined by the sensorial panel as
more affected. Additions of a 2% concentration did not lead to significant differences
to control samples, and even a reduction in quality was detected for some sensorial
parameters.
6. References.
- Agilent Technologies. (2011). Analysis of Environmental Samples with the Agilent 710-
ES Following US EPA Guidelines. Agilent Application notes series.
- AOAC. (2000). 965.33.Peroxide Value of Oils and Fats. Official methods of Analysis of
AOAC International. 17th Edition, vol II, chapter 41, p 42.
- Bjørkevoll I., Barnung T., Kvangarsnes K., Tobiassen T., Akse L. and Reboredo R.G.
(2012). Phosphate treatment of light and heavy salted cod products. Report no.MA
12/15.
- Cervantes E. & Robles-Martinez, C. (1984).Determination of thiobarbituric acid
reactive substances (TBARS) in fish tissue by an improved distillation—
spectrophotometric method. Journal of the Science of Food and Agriculture, 35
(1984), pp. 1248–1254.
- Cox H. E., & Pearson, D. (1962).The Chemical Analysis of Foods. Chemical Publishing
Co Inc. New York p 421.
- Esaiassen, M., Østli, J., Joensen, S., Prytz, K., Olsen, J. V., Carlehög, M., et al. (2005).
Brining of cod fillets: effects of phosphate, salt, glucose, ascorbate and starch on yield,
sensory quality and consumers liking. LWT - Food Science and Technology, 38, 641-
649.
- Krzynowek J, Panunzio J. (1995). Practical application of thin-layer chromatography for
detection of polyphosphates in seafood. Journal of AOAC 78:1328–1332.
- ISO (1980). ISO 5553-1980. Meat and meat products. Detection of polyphosphates.
International Organization for Standardization.
- Kin S, Schilling MW, Silva JL, Smith BS, Jackson V, Kim T. (2009). Effects of phosphate
type on the quality of vacuum tumbled catfish fillets. Inst. of Food Technologist
Annual Meeting, Anaheim, Calif., June 7-10, 155-09.
- Kin S., Schilling M.W., Smith B.S., Silva J.L., Jackson V., Kim T.J. (2010). Phosphate Type
Affects the Quality of Injected Catfish Fillets. Journal of food Science—Vol. 75, Nr. 1,

Industrial scale trials with phosphate additives.
19
- Kruse R. (2004). Qualitativer dünnschichtchromatografischer Nachweis von
kondensierten Phosphaten in Fischereierzeugnissen. Landesamt f. Verbraucherschutz
u. Lebensmittelsicherheit, Institut für Fischkunde Cuxhaven. Unpublished.
- Lauritzsen K, Akse L, Johansen A, Joensen S, Sorensen NK, and Olsen, R.L. (2004a).
Physical and quality attributes of salted cod (Gadus morhua L.) as affected by the state
of rigor and freezing prior to salting. Food Research International, 37(7), 677-688.
- Lauritzsen K, Akse L, Gundersen B, Olsen RL. (2004b). Effects of calcium, magnesium
and pH during salt-curing of cod (Gadus morhua L.). J Sci. Food Agric 84:683–92.
- Lauritzsen K. (2004c). Quality of salted cod (Gadus morhua L.) as influenced by raw
material and salt composition. [PhD Thesis]. Norwegian College of Fishery Science,
Univ. of Tromsø, 51 p.
- Nguyen M.V., Jonsson J.O., Thorkelsson G., Arason S., Gudmundsdottir
A.,Thorarinsdottir K.A.(2012a). Quantitative and qualitative changes in added
phosphates in cod (Gadus morhua) during salting, storage and rehydration. LWT-Food
Science and Technology, 47,126 –32.
- Nguyen M.V, Arason S., Thorkelsson G., Gudmundsdottir A., Thorarinsdottir K.A. , Vu
B.N. (2012b). Effects of Added Phosphates on Lipid Stability During Salt Curing and
Rehydration of Cod (Gadus morhua). Journal of the American Oil Chemists' Society.
Volume 90, Issue 3 , pp 317-326.
- Oliveira H.,Pedro S., Nunes M.L., Costa R.,Vaz-Pires P. (2012). Processing of salted cod
(Gadus spp.): A Review. Comprehensive Reviews in Food Science and Food
Safety.Volume 11, Issue 6, pages 546–564.
- Regulation (EU) No 1129/2011 of 11 November 2011 amending Annex II to Regulation
(EC) No 1333/2008 of the European Parliament and of the Council by establishing a
Union list of food additives.
- Schröder, U. (2010). Changes in Phosphate and Water Content During Processing of
Salted Pacific Cod (Gadus macrocephalus). Journal of Aquatic Food Product
Technology, 19, 16-25.
- Thorarinsdottir, K.A., Arason, S.G., Gogason, S.G. and Kristbergson, K. (2001).Effects of
Phosphate on Yield, Quality and Water-Holding Capacity in the Processing of Salted
Cod (Gadus morhua)’, Journal of Food Science 66: 821–26.
- Thorarinsdottir, K.A. (2010a). The influence of salting procedures on the
characteristics of heavy salted cod. [PhD Thesis] Department of Food technology,
Engineering and nutrition. Lund University, Sweeden.
- Thorarinsdottir,K.A., Bjorkevoll,I., Arason, S.G., (2010b). Production of salted cod in
the Nordic countries. Variation in quality and characteristics of the salted products.
NORA (Journal 510-036).
- Thorarinsdottir, K. A., Arason, S., Sigurgisladottir, S., Valsdottir, T., & Tornberg, E.
(2011). Effects of different pre-salting methods on protein aggregation during heavy
salting of cod fillets. Food Chemistry, 124, 7-14.
- UNE-EN ISO 10399:2010 Standard. Sensory Analysis. Methodology. Duo-Trio test.
- UNE-EN ISO 8587:2010 Standard. Sensory Analysis. Methodology. Ranking test.
- UNE-ISO 6658:2008 Standard. Sensory Analysis of foodstuffs. Methodology. General
guidance.

Industrial scale trials with phosphate additives.
20
- UNE-EN ISO 8589:2010 Standard. Sensory Analysis. General guidance for design of
tasting rooms.
- UNE-EN ISO 5492:2010 Standard. Sensory Analysis. Vocabulary.
- UNE-EN ISO 5553:1980. Meat and meat products. Detection of polyphosphates.
International Organization for Standardization.
- Vyncke, W. (1970). Direct determination of the thiobarbituric acid value in
trichloracetic acid extracts of fish as a measure of oxidative rancidity.
FetteSeifenAnstrichmiltel, Leinfelden 12: 1084-1087.
7. Annexes.

Large scale trials with phosphates as additive and process aid.
21
ANNEX I: WP1- Sampling
GROUPA/C internal
code
Carnal 2110
(0%) - 1A/C internal code
Carnal 2110 (2%) -
2A/C internal code
Carnal 2110 (4%) -
3
1206514 G1.1.C1 1206519 G1.2.C1 1206524 G1.3.C1
1206515 G1.1.C2 1206520 G1.2.C2 1206525 G1.3.C2
1206516 G1.1.C3 1206521 G1.2.C3 1206526 G1.3.C3
1206517 G1.1.C4 1206522 G1.2.C4 1206527 G1.3.C4
1206518 G1.1.C5 1206523 G1.2.C5 1206528 G1.3.C5
1206534 G2.1.C1 1206539 G2.2.C1 1206544 G2.3.C1
1206535 G2.1.C2 1206540 G2.2.C2 1206545 G2.3.C2
1206536 G2.1.C3 1206541 G2.2.C3 1206546 G2.3.C3
1206537 G2.1.C4 1206542 G2.2.C4 1206547 G2.3.C4
1206538 G2.1.C5 1206543 G2.2.C5 1206548 G2.3.C5
HEA
VY
SA
LTED
G1 - Net
caught.
G2 - Long-
line caught.
GROUPA/C internal
code
Raw material
(Frozen)
1216860 L1.0.C1
1216861 L1.0.C2
1216862 L1.0.C3
1216863 L1.0.C4
1216864 L1.0.C5
1216865 L2.0.C1
1216866 L2.0.C2
1216867 L2.0C3
1216868 L2.0.C4
1216869 L2.0.C5
RA
W M
ATE
RIA
L LI
GH
T
SALT
ED L1 - Net
caught.
L2 - Long-line
caught.
GROUPA/C internal
code
Raw material
(Frozen)
1206509 G1.0.C1
1206510 G1.0.C2
1206511 G1.0.C3
1206512 G1.0.C4
1206513 G1.0.C5
1206529 G2.0.C1
1206530 G2.0.C2
1206531 G2.0C3
1206532 G2.0.C4
1206533 G2.0.C5
G1 - Net
caught.
G2 - Long-line
caught.
RA
W M
ATE
RIA
L H
EAV
Y
SALT
ED
GROUPA/C internal
code
Carnal 2110
(0%) - 1A/C internal code
Carnal 2110 (1%) -
2A/C internal code
Carnal 2110 (2%) -
3
1216870 L1.1.C1 1216875 L1.2.C1 1216880 L1.3.C1
1216871 L1.1.C2 1216876 L1.2.C2 1216881 L1.3.C2
1216872 L1.1.C3 1216877 L1.2.C3 1216882 L1.3.C3
1216873 L1.1.C4 1216878 L1.2.C4 1216883 L1.3.C4
1216874 L1.1.C5 1216879 L1.2.C5 1216884 L1.3.C5
1216885 L2.1.C1 1216890 L2.2.C1 1216895 L2.3.C1
1216886 L2.1.C2 1216891 L2.2.C2 1216896 L2.3.C2
1216887 L2.1.C3 1216892 L2.2.C3 1216897 L2.3.C3
1216888 L2.1.C4 1216893 L2.2.C4 1216898 L2.3.C4
1216889 L2.1.C5 1216894 L2.2.C5 1216899 L2.3.C5
L2 - Long-line
caught.
LIG
HT
SA
LTED
L1 - Net
caught.
GROUPA/C internal
code
Carnal 2110
control (0%) - 1A/C internal code
Carnal 2110 (2%) -
2A/C internal code
Carnal 2110 (4%) -
3
1206549 G1.1.B1 1206552 G1.2.B1 1206555 G1.3.B1
1206550 G1.1.B2 1206553 G1.2.B2 1206556 G1.3.B2
1206551 G1.1.B3 1206554 G1.2.B3 1206557 G1.3.B3
1206558 G2.1.B1 1206561 G2.2.B1 1206564 G2.3.B1
1206559 G2.1.B2 1206562 G2.2.B2 1206565 G2.3.B2
1206560 G2.1.B3 1206563 G2.2.B3 1206566 G2.3.B3
BR
INE
G1 - Net
caught.
G2 - Long-
line caught.

Large scale trials with phosphates as additive and process aid.
22
ANNEX II: WP1 - Oxidation results.
G1.0.C1 1206509 <2,0 3,6
G1.0.C2 1206510 <2,0 2,7
G1.0.C3 1206511 <2,0 1,8
G1.0.C4 1206512 <2,0 <1,8
G1.0.C5 1206513 <2,0 <1,8
G1.1.C1 1206514 <2,0 3,2
G1.1.C2 1206515 <2,0 4,1
G1.1.C3 1206516 <2,0 3,6
G1.1.C4 1206517 <2,0 3,2
G1.1.C5 1206518 <2,0 2,7
G1.2.C1 1206519 <2,0 3,2
G1.2.C2 1206520 <2,0 3,2
G1.2.C3 1206521 <2,0 2,7
G1.2.C4 1206522 <2,0 1,8
G1.2.C5 1206523 <2,0 1,8
G1.3.C1 1206524 <2,0 2,7
G1.3.C2 1206525 <2,0 3,2
G1.3.C3 1206526 <2,0 2,7
G1.3.C4 1206527 <2,0 2,7
G1.3.C5 1206528 <2,0 3,2
G2.0.C1 1206529 <2,0 <1,8
G2.0.C2 1206530 <2,0 <1,8
G2.0C3 1206531 <2,0 <1,8
G2.0.C4 1206532 <2,0 4,1
G2.0.C5 1206533 <2,0 <1,8
G2.1.C1 1206534 <2,0 4,1
G2.1.C2 1206535 <2,0 3,2
G2.1.C3 1206536 <2,0 2,7
G2.1.C4 1206537 <2,0 2,7
G2.1.C5 1206538 <2,0 3,6
G2.2.C1 1206539 <2,0 5,4
G2.2.C2 1206540 <2,0 3,2
G2.2.C3 1206541 <2,0 5,0
G2.2.C4 1206542 <2,0 2,7
G2.2.C5 1206543 <2,0 5,0
G2.3C1 1206544 <2,0 3,6
G2.3C2 1206545 <2,0 3,2
G2.3.C3 1206546 <2,0 2,3
G2.3.C4 1206547 <2,0 2,7
G2.3C5 1206548 <2,0 1,8
SMP
ANFACO
CODE
PEROXIDES
INDEX
(meq.O2/Kg.fat)
TBA INDEX (µmol
MAD/Kg muscle
tissue)G
1 - N
et c
augh
t c
od
. (p
oo
r q
ual
ity)
RA
W
MA
TE
RIA
L
HE
AV
Y S
AL
TE
D
G2
- Lo
ng-
line
cau
ght
cod
(h
igh
qu
alit
y).
RA
W
MA
TE
RIA
L
HE
AV
Y S
AL
TE
D
L1.0.C1 1216860 <2,0 <1,8
L1.0.C2 1216861 <2,0 3,2
L1.0.C3 1216862 <2,0 1,8
L1.0.C4 1216863 <2,0 2,3
L1.0.C5 1216864 <2,0 2,3
L1.1.C1 1216870 <2,0 2,3
L1.1.C2 1216871 <2,0 <1,8
L1.1.C3 1216872 <2,0 1,8
L1.1.C4 1216873 <2,0 1,8
L1.1.C5 1216874 <2,0 2,3
L1.2.C1 1216875 <2,0 1,8
L1.2.C2 1216876 <2,0 <1,8
L1.2.C3 1216877 <2,0 2,3
L1.2.C4 1216878 <2,0 1,8
L1.2.C5 1216879 <2,0 2,3
L1.3.C1 1216880 <2,0 <1,8
L1.3.C2 1216881 <2,0 <1,8
L1.3.C3 1216882 <2,0 2,3
L1.3.C4 1216883 <2,0 1,8
L1.3.C5 1216884 <2,0 1,8
L2.0.C1 1216865 <2,0 <1,8
L2.0.C2 1216866 <2,0 2,7
L2.0C3 1216867 <2,0 <1,8
L2.0.C4 1216868 <2,0 <1,8
L2.0.C5 1216869 <2,0 1,8
L2.1.C1 1216885 <2,0 <1,8
L2.1.C2 1216886 <2,0 1,8
L2.1.C3 1216887 <2,0 <1,8
L2.1.C4 1216888 <2,0 1,8
L2.1.C5 1216889 <2,0 1,8
L2.2.C1 1216890 <2,0 <1,8
L2.2.C2 1216891 <2,0 <1,8
L2.2.C3 1216892 <2,0 1,8
L2.2.C4 1216893 <2,0 <1,8
L2.2.C5 1216894 <2,0 1,8
L2.3C1 1216895 <2,0 <1,8
L2.3C2 1216896 <2,0 <1,8
L2.3.C3 1216897 <2,0 2,3
L2.3.C4 1216898 <2,0 1,8
L2.3C5 1216899 <2,0 1,8
RA
W
MA
TE
RIA
L
LIG
HT
SA
LT
ED
SMP
ANFACO
CODE
PEROXIDES
INDEX
(meq.O2/Kg.fat)
G2
- Lo
ng-
line
cau
ght
cod
(h
igh
qu
alit
y).
RA
W
MA
TE
RIA
L
LIG
HT
SA
LT
ED
TBA INDEX (µmol
MAD/Kg muscle
tissue)
G1
- N
et
cau
ght
co
d. (
po
or
qu
alit
y)

Large scale trials with phosphates as additive and process aid.
23
ANNEX III: WP1 - Minerals results.
Na ClNa P P2O5 K Ca Mg Fe Zn Cu
(g/100g) (g/100g) (g/100g) (g/100g) (g/100g) (mg/Kg) (mg/Kg) (mg/Kg) (mg/Kg) (mg/Kg)
G1.0.C1 1206509 0,26 0,66 0,12 0,27 0,37 98 276 1,4 2,4 0,13
G1.0.C2 1206510 0,22 0,56 0,14 0,32 0,41 269 332 1,7 2,6 0,07
G1.0.C3 1206511 0,14 0,36 0,16 0,37 0,47 82 278 2,8 2,9 0,12
G1.0.C4 1206512 0,15 0,38 0,16 0,37 0,44 67 257 30,6 36,3 0,08
G1.0.C5 1206513 0,10 0,25 0,12 0,27 0,37 57 231 5,1 6,6 0,3
G1.1.C1 1206514 7,32 18,6 0,14 0,32 0,21 195 313 <2 <2 0,16
G1.1.C2 1206515 7,70 19,6 0,18 0,41 0,21 245 422 <2 3,8 0,10
G1.1.C3 1206516 8,66 22,0 0,1 0,23 0,3 211 220 1,9 <2 0,16
G1.1.C4 1206517 6,21 15,8 0,1 0,23 0,21 365 395 <2 4,6 0,41
G1.1.C5 1206518 6,33 16,1 0,14 0,32 0,22 172 406 <2 5,1 0,2
G1.2.C1 1206519 7,35 18,7 0,22 0,50 0,24 666 357 <2 4,9 0,12
G1.2.C2 1206520 6,42 16,3 0,1 0,23 0,21 197 155 <2 2,3 0,12
G1.2.C3 1206521 8,09 20,6 0,12 0,27 0,25 166 207 1,2 3 0,09
G1.2.C4 1206522 6,59 16,8 0,1 0,23 0,26 244 241 <2 <2 0,15
G1.2.C5 1206523 6,75 17,2 0,14 0,32 0,24 196 237 <2 <2 0,18
G1.3.C1 1206524 7,73 19,6 0,16 0,37 0,28 134 198 <2 <2 0,14
G1.3.C2 1206525 6,86 17,4 0,16 0,37 0,28 197 230 1,8 4,1 0,23
G1.3.C3 1206526 7,91 20,1 0,12 0,27 0,35 138 181 0,97 3,5 0,07
G1.3.C4 1206527 6,08 15,5 0,3 0,69 0,26 146 248 1,3 4,5 0,36
G1.3.C5 1206528 6,29 16,0 0,16 0,37 0,25 260 255 <2 5,4 0,12
G2.0.C1 1206529 0,04 0,10 0,10 0,23 0,29 31 131 1,2 1,7 0,03
G2.0.C2 1206530 0,05 0,13 0,16 0,37 0,40 75 215 1,4 2,4 0,08
G2.0C3 1206531 0,06 0,15 0,22 0,50 0,43 83 275 <2 <2 0,12
G2.0.C4 1206532 0,05 0,13 0,14 0,32 0,40 89 222 1,6 3 0,06
G2.0.C5 1206533 0,06 0,15 0,16 0,37 0,43 99 211 1,3 2,8 0,14
G2.1.C1 1206534 6,78 17,2 0,1 0,23 0,17 455 570 <2 5,2 0,17
G2.1.C2 1206535 8,00 20,3 0,1 0,23 0,21 283 413 1,1 3,7 0,19
G2.1.C3 1206536 8,30 21,1 0,08 0,18 0,25 303 374 2,7 3,3 0,10
G2.1.C4 1206537 6,69 17,0 0,06 0,14 0,2 270 339 6,1 2,7 0,13
G2.1.C5 1206538 6,27 15,9 0,12 0,27 0,19 267 521 <2 4,1 0,16
G2.2.C1 1206539 6,29 16,0 0,24 0,55 0,24 273 470 <2 5,9 0,15
G2.2.C2 1206540 7,17 18,2 0,1 0,23 0,27 177 293 3 3,2 0,07
G2.2.C3 1206541 8,94 22,7 0,1 0,23 0,36 163 298 <2 3,7 0,08
G2.2.C4 1206542 7,62 19,4 0,08 0,18 0,33 187 268 5,9 3,3 0,08
G2.2.C5 1206543 5,81 14,8 0,12 0,27 0,23 250 367 <2 5,5 0,24
G2.3C1 1206544 7,02 17,8 0,14 0,32 0,26 417 467 <2 5,3 0,08
G2.3C2 1206545 7,52 19,1 0,1 0,23 0,3 202 323 <2 2,4 0,93
G2.3.C3 1206546 8,55 21,7 0,1 0,23 0,35 225 385 <2 2,5 0,04
G2.3.C4 1206547 9,00 22,9 0,1 0,23 0,35 208 291 4,5 3,4 0,23
G2.3C5 1206548 5,99 15,2 0,12 0,27 0,26 208 400 <2 4,6 0,17
G1
- N
et
cau
ght
co
d.
(po
or
qu
alit
y) RA
W
MA
TE
RIA
L
HE
AV
Y S
AL
TE
D
G2
- L
on
g-lin
e c
augh
t co
d (
hig
h q
ual
ity)
.
RA
W
MA
TE
RIA
L
HE
AV
Y S
AL
TE
D
SMP ANFACO CODE

Large scale trials with phosphates as additive and process aid.
24
ANNEX III: WP1 - Minerals results.
P P2O5 Ca Mg Fe Zn Cu
GROUPA/C internal
code g P/L g P2O5/L mg/L g/L mg/L mg/L mg/L
G1.1.B1 1206549 0,66 1,51 209 0,24 1,31 0,34 <0,4
G1.1.B2 1206550 0,64 1,46 203 0,23 1,61 0,39 <0,4
G1.1.B3 1206551 0,69 1,57 210 0,24 1,66 0,42 <0,4
G1.2.B1 1206552 1,65 3,77 201 0,15 3,62 0,38 <0,4
G1.2.B2 1206553 1,69 3,88 198 0,14 1,88 0,33 <0,4
G1.2.B3 1206554 1,54 3,53 184 0,13 1,44 0,32 <0,4
G1.3.B1 1206555 1,98 4,54 165 0,13 1,41 0,41 <0,4
G1.3.B2 1206556 1,95 4,46 196 0,17 1,37 0,36 <0,4
G1.3.B3 1206557 2,34 5,36 166 0,11 1,5 0,48 <0,4
G2.1.B1 1206558 0,45 1,02 405 0,58 1,26 0,32 <0,4
G2.1.B2 1206559 0,50 1,14 408 0,56 1,03 0,25 <0,4
G2.1.B3 1206560 0,44 1,01 401 0,59 0,91 0,22 <0,4
G2.2.B1 1206561 1,05 2,41 321 0,38 1,24 0,22 <0,4
G2.2.B2 1206562 1,01 2,31 312 0,38 1,17 0,2 <0,4
G2.2.B3 1206563 1,00 2,29 309 0,39 1,11 0,22 <0,4
G2.3.B1 1206564 1,34 3,08 306 0,46 1,67 0,36 <0,4
G2.3.B2 1206565 1,33 3,05 307 0,44 1,62 0,38 <0,4
G2.3.B3 1206566 1,35 3,10 312 0,44 1,59 0,36 <0,4
ANFACO CODE
G1
- N
et
cau
ght
co
d.
(po
or
qu
alit
y)
BR
INE
G2
- L
on
g-li
ne
cau
ght
cod
(h
igh
qu
alit
y).

Large scale trials with phosphates as additive and process aid.
25
ANNEX III: WP1 - Minerals results.
Na ClNa P P2O5 K Ca Mg Fe Zn Cu
(g/100g) (g/100g) (g/100g) (g/100g) (g/100g) (mg/Kg) (mg/Kg) (mg/Kg) (mg/Kg) (mg/Kg)
L1.0.C1 1216860 0,15 0,38 0,18 0,41 0,35 60,7 282,4 24,0 3,7 0,17
L1.0.C2 1216861 0,31 0,79 0,14 0,32 0,45 42,2 202,1 1,2 1,6 <0,16
L1.0.C3 1216862 0,18 0,46 0,16 0,37 0,32 67,3 316,6 3,8 2,1 0,21
L1.0.C4 1216863 0,21 0,53 0,18 0,41 0,30 154,7 367,5 5,0 2,5 <0,16
L1.0.C5 1216864 0,22 0,56 0,20 0,46 0,36 109,8 443,0 4,5 2,8 <0,16
L1.1.C1 1216870 0,36 0,92 0,14 0,32 0,25 65,6 266,1 10,3 3,0 0,22
L1.1.C2 1216871 0,38 0,97 0,12 0,27 0,26 66,0 220,9 37,1 2,8 0,16
L1.1.C3 1216872 0,42 1,07 0,12 0,27 0,32 31,7 143,0 2,8 1,7 <0,16
L1.1.C4 1216873 0,3 0,76 0,16 0,37 0,25 79,8 308,5 13,6 2,2 <0,16
L1.1.C5 1216874 0,43 1,09 0,16 0,37 0,32 91,1 323,9 8,3 3,0 <0,16
L1.2.C1 1216875 0,35 0,89 0,18 0,41 0,33 63,7 241,3 15,1 2,8 0,17
L1.2.C2 1216876 0,49 1,25 0,14 0,32 0,27 81,7 278,0 17,5 2,2 0,18
L1.2.C3 1216877 0,49 1,25 0,12 0,27 0,34 35,8 141,4 2,9 1,5 0,18
L1.2.C4 1216878 0,42 1,07 0,18 0,41 0,30 109,2 325,4 12,3 2,2 0,17
L1.2.C5 1216879 0,48 1,22 0,18 0,41 0,32 100,1 321,5 6,3 3,1 0,16
L1.3.C1 1216880 0,47 1,19 0,16 0,37 0,34 67,4 228,0 19,5 2,7 <0,16
L1.3.C2 1216881 0,34 0,86 0,2 0,46 0,25 119,7 358,5 14,3 2,9 0,16
L1.3.C3 1216882 0,57 1,45 0,16 0,37 0,36 48,3 185,4 19,1 2,2 <0,16
L1.3.C4 1216883 0,5 1,27 0,22 0,50 0,37 88,2 311,2 5,1 1,5 <0,16
L1.3.C5 1216884 0,49 1,25 0,24 0,55 0,41 99,1 315,4 6,7 2,4 <0,16
L2.0.C1 1216865 0,11 0,28 0,14 0,32 0,23 62,0 249,2 17,4 3,5 0,18
L2.0.C2 1216866 0,30 0,76 0,14 0,32 0,45 41,7 200,7 1,7 1,9 <0,16
L2.0C3 1216867 0,16 0,41 0,16 0,37 0,34 80,0 294,8 11,8 1,7 <0,16
L2.0.C4 1216868 0,21 0,53 0,16 0,37 0,30 141,9 334,3 3,4 2,4 <0,16
L2.0.C5 1216869 0,33 0,84 0,18 0,41 0,37 124,5 386,6 7,7 2,9 <0,16
L2.1.C1 1216885 0,40 1,02 0,12 0,27 0,25 56,8 193,5 11,9 2,2 0,21
L2.1.C2 1216886 0,42 1,07 0,14 0,32 0,31 357,0 212,0 2,6 2,0 <0,16
L2.1.C3 1216887 0,38 0,97 0,1 0,23 0,29 44,0 158,6 1,8 1,6 0,17
L2.1.C4 1216888 0,36 0,92 0,16 0,37 0,31 147,8 334,3 13,2 3,6 <0,16
L2.1.C5 1216889 0,49 1,25 0,18 0,41 0,35 107,3 357,8 6,9 2,1 <0,16
L2.2.C1 1216890 0,40 1,02 0,12 0,27 0,26 76,2 238,1 18,5 2,5 0,16
L2.2.C2 1216891 0,47 1,19 0,12 0,27 0,32 53,8 171,5 4,0 2,5 <0,16
L2.2.C3 1216892 0,40 1,02 0,16 0,37 0,28 111,8 344,4 5,8 2,6 0,17
L2.2.C4 1216893 0,45 1,14 0,16 0,37 0,31 121,0 319,7 6,6 2,8 <0,16
L2.2.C5 1216894 0,46 1,17 0,18 0,41 0,34 120,2 379,5 7,2 2,6 <0,16
L2.3C1 1216895 0,47 1,19 0,16 0,37 0,28 68,0 239,3 20,4 2,1 <0,16
L2.3C2 1216896 0,54 1,37 0,12 0,27 0,30 46,5 175,1 1,0 1,6 0,18
L2.3.C3 1216897 0,54 1,37 0,20 0,46 0,30 129,3 349,5 5,1 2,2 <0,16
L2.3.C4 1216898 0,56 1,42 0,22 0,50 0,36 102,1 321,8 10,1 2,0 <0,16
L2.3C5 1216899 0,49 1,25 0,22 0,50 0,39 104,1 345,0 13,4 2,6 <0,16
SMP ANFACO CODE
G1
- N
et
cau
ght
co
d.
(po
or
qu
alit
y) RA
W
MA
TE
RIA
L
LIG
HT
SA
LT
ED
G2
- L
on
g-lin
e c
augh
t co
d (
hig
h q
ual
ity)
.
RA
W
MA
TE
RIA
L
LIG
HT
SA
LT
ED
Large scale trials with phosphates as additive and process aid.
26
ANNEX IV: WP1 – Polyphosphate residuals results.
(gP/100g) (gP2O5/100g) (gP/100g) (gP2O5/100g) (gP/100g) (gP2O5/100g)
G1.0.C1 1206509 <0,03 <0,07 <0,03 <0,07 <0,09 <0,04 No detected phosphates
G1.0.C2 1206510 <0,03 <0,07 <0,03 <0,07 <0,09 <0,04 No detected phosphates
G1.0.C3 1206511 <0,03 <0,07 <0,03 <0,07 <0,09 <0,04 No detected phosphates
G1.0.C4 1206512 <0,03 <0,07 <0,03 <0,07 <0,09 <0,04 No detected phosphates
G1.0.C5 1206513 <0,03 <0,07 <0,03 <0,07 <0,09 <0,04 No detected phosphates
G1.1.C1 1206514 <0,03 <0,07 <0,03 <0,07 <0,09 <0,04 No detected phosphates
G1.1.C2 1206515 <0,03 <0,07 <0,03 <0,07 <0,09 <0,04 No detected phosphates
G1.1.C3 1206516 <0,03 <0,07 <0,03 <0,07 <0,09 <0,04 No detected phosphates
G1.1.C4 1206517 <0,03 <0,07 <0,03 <0,07 <0,09 <0,04 No detected phosphates
G1.1.C5 1206518 <0,03 <0,07 <0,03 <0,07 <0,09 <0,04 No detected phosphates
G1.2.C1 1206519 <0,03 <0,07 <0,03 <0,07 <0,09 <0,04 No detected phosphates
G1.2.C2 1206520 <0,03 <0,07 <0,03 <0,07 <0,09 <0,04 No detected phosphates
G1.2.C3 1206521 <0,03 <0,07 <0,03 <0,07 <0,09 <0,04 No detected phosphates
G1.2.C4 1206522 <0,03 <0,07 <0,03 <0,07 <0,09 <0,04 No detected phosphates
G1.2.C5 1206523 <0,03 <0,07 <0,03 <0,07 <0,09 <0,04 No detected phosphates
G1.3.C1 1206524 <0,03 <0,07 <0,03 <0,07 <0,09 <0,04 No detected phosphates
G1.3.C2 1206525 <0,03 <0,07 <0,03 <0,07 <0,09 <0,04 No detected phosphates
G1.3.C3 1206526 <0,03 <0,07 <0,03 <0,07 <0,09 <0,04 No detected phosphates
G1.3.C4 1206527 <0,03 <0,07 <0,03 <0,07 <0,09 <0,04 No detected phosphates
G1.3.C5 1206528 <0,03 <0,07 <0,03 <0,07 <0,09 <0,04 No detected phosphates
G2.0.C1 1206529 <0,03 <0,07 <0,03 <0,07 <0,09 <0,04 No detected phosphates
G2.0.C2 1206530 <0,03 <0,07 <0,03 <0,07 <0,09 <0,04 No detected phosphates
G2.0C3 1206531 <0,03 <0,07 <0,03 <0,07 <0,09 <0,04 No detected phosphates
G2.0.C4 1206532 <0,03 <0,07 <0,03 <0,07 <0,09 <0,04 No detected phosphates
G2.0.C5 1206533 <0,03 <0,07 <0,03 <0,07 <0,09 <0,04 No detected phosphates
G2.1.C1 1206534 <0,03 <0,07 <0,03 <0,07 <0,09 <0,04 No detected phosphates
G2.1.C2 1206535 <0,03 <0,07 <0,03 <0,07 <0,09 <0,04 No detected phosphates
G2.1.C3 1206536 <0,03 <0,07 <0,03 <0,07 <0,09 <0,04 No detected phosphates
G2.1.C4 1206537 <0,03 <0,07 <0,03 <0,07 <0,09 <0,04 No detected phosphates
G2.1.C5 1206538 <0,03 <0,07 <0,03 <0,07 <0,09 <0,04 No detected phosphates
G2.2.C1 1206539 <0,03 <0,07 <0,03 <0,07 <0,09 <0,04 No detected phosphates
G2.2.C2 1206540 <0,03 <0,07 <0,03 <0,07 <0,09 <0,04 No detected phosphates
G2.2.C3 1206541 <0,03 <0,07 <0,03 <0,07 <0,09 <0,04 No detected phosphates
G2.2.C4 1206542 <0,03 <0,07 <0,03 <0,07 <0,09 <0,04 No detected phosphates
G2.2.C5 1206543 <0,03 <0,07 <0,03 <0,07 <0,09 <0,04 No detected phosphates
G2.3C1 1206544 <0,03 <0,07 <0,03 <0,07 <0,09 <0,04 No detected phosphates
G2.3C2 1206545 <0,03 <0,07 <0,03 <0,07 <0,09 <0,04 No detected phosphates
G2.3.C3 1206546 <0,03 <0,07 <0,03 <0,07 <0,09 <0,04 No detected phosphates
G2.3.C4 1206547 <0,03 <0,07 <0,03 <0,07 <0,09 <0,04 No detected phosphates
G2.3C5 1206548 <0,03 <0,07 <0,03 <0,07 <0,09 <0,04 No detected phosphates
G1
- Net
cau
ght
co
d. (
po
or
qu
alit
y)G
2 - L
on
g-lin
e ca
ugh
t co
d (
hig
h q
ual
ity)
.
RA
W
MA
TE
RIA
L
HE
AV
Y S
AL
TE
D
RA
W
MA
TE
RIA
L
COMMENTSDIPHOSPHATE TRIPHOSPHATE
SMP
ANFACO
CODE
HEXAMETAPHOSPHATE
HE
AV
Y S
AL
TE
D
Large scale trials with phosphates as additive and process aid.
27
ANNEX IV: WP1 – Polyphosphate residuals results.
(gP/100g) (gP2O5/100g) (gP/100g) (gP2O5/100g) (gP/100g) (gP2O5/100g)
L1.0.C1 1216860 <0,03 <0,07 <0,03 <0,07 <0,09 <0,04 No detected phosphates
L1.0.C2 1216861 <0,03 <0,07 <0,03 <0,07 <0,09 <0,04 No detected phosphates
L1.0.C3 1216862 <0,03 <0,07 <0,03 <0,07 <0,09 <0,04 No detected phosphates
L1.0.C4 1216863 <0,03 <0,07 <0,03 <0,07 <0,09 <0,04 No detected phosphates
L1.0.C5 1216864 <0,03 <0,07 <0,03 <0,07 <0,09 <0,04 No detected phosphates
L1.1.C1 1216870 <0,03 <0,07 <0,03 <0,07 <0,09 <0,04 No detected phosphates
L1.1.C2 1216871 <0,03 <0,07 <0,03 <0,07 <0,09 <0,04 No detected phosphates
L1.1.C3 1216872 <0,03 <0,07 <0,03 <0,07 <0,09 <0,04 No detected phosphates
L1.1.C4 1216873 <0,03 <0,07 <0,03 <0,07 <0,09 <0,04 No detected phosphates
L1.1.C5 1216874 <0,03 <0,07 <0,03 <0,07 <0,09 <0,04 No detected phosphates
L1.2.C1 1216875 <0,03 <0,07 <0,03 <0,07 <0,09 <0,04 Triphosphate levels below qunatification limit are detected
L1.2.C2 1216876 <0,03 <0,07 <0,03 <0,07 <0,09 <0,04 Triphosphate levels below qunatification limit are detected
L1.2.C3 1216877 <0,03 <0,07 <0,03 <0,07 <0,09 <0,04 Triphosphate levels below qunatification limit are detected
L1.2.C4 1216878 <0,03 <0,07 <0,03 <0,07 <0,09 <0,04 No detected phosphates
L1.2.C5 1216879 <0,03 <0,07 <0,03 <0,07 <0,09 <0,04 No detected phosphates
L1.3.C1 1216880 <0,03 <0,07 <0,03 <0,07 <0,09 <0,04 Triphosphate levels below qunatification limit are detected
L1.3.C2 1216881 <0,03 <0,07 <0,03 <0,07 <0,09 <0,04 Triphosphate and diphosphate levels below qunatification limit are detected
L1.3.C3 1216882 <0,03 <0,07 <0,03 <0,07 <0,09 <0,04 Triphosphate and diphosphate levels below qunatification limit are detected
L1.3.C4 1216883 <0,03 <0,07 <0,03 <0,07 <0,09 <0,04 Triphosphate levels below qunatification limit are detected
L1.3.C5 1216884 <0,03 <0,07 <0,03 <0,07 <0,09 <0,04 Triphosphate levels below qunatification limit are detected
L2.0.C1 1216865 <0,03 <0,07 <0,03 <0,07 <0,09 <0,04 No detected phosphates
L2.0.C2 1216866 <0,03 <0,07 <0,03 <0,07 <0,09 <0,04 No detected phosphates
L2.0C3 1216867 <0,03 <0,07 <0,03 <0,07 <0,09 <0,04 No detected phosphates
L2.0.C4 1216868 <0,03 <0,07 <0,03 <0,07 <0,09 <0,04 No detected phosphates
L2.0.C5 1216869 <0,03 <0,07 <0,03 <0,07 <0,09 <0,04 No detected phosphates
L2.1.C1 1216885 <0,03 <0,07 <0,03 <0,07 <0,09 <0,04 No detected phosphates
L2.1.C2 1216886 <0,03 <0,07 <0,03 <0,07 <0,09 <0,04 No detected phosphates
L2.1.C3 1216887 <0,03 <0,07 <0,03 <0,07 <0,09 <0,04 No detected phosphates
L2.1.C4 1216888 <0,03 <0,07 <0,03 <0,07 <0,09 <0,04 No detected phosphates
L2.1.C5 1216889 <0,03 <0,07 <0,03 <0,07 <0,09 <0,04 No detected phosphates
L2.2.C1 1216890 <0,03 <0,07 <0,03 <0,07 <0,09 <0,04 No detected phosphates
L2.2.C2 1216891 <0,03 <0,07 <0,03 <0,07 <0,09 <0,04 Triphosphate levels below qunatification limit are detected
L2.2.C3 1216892 <0,03 <0,07 <0,03 <0,07 <0,09 <0,04 Triphosphate levels below qunatification limit are detected
L2.2.C4 1216893 <0,03 <0,07 <0,03 <0,07 <0,09 <0,04 No detected phosphates
L2.2.C5 1216894 <0,03 <0,07 <0,03 <0,07 <0,09 <0,04 No detected phosphates
L2.3C1 1216895 <0,03 <0,07 <0,03 <0,07 <0,09 <0,04 Triphosphate levels below qunatification limit are detected
L2.3C2 1216896 <0,03 <0,07 <0,03 <0,07 <0,09 <0,04 Triphosphate levels below qunatification limit are detected
L2.3.C3 1216897 <0,03 <0,07 <0,03 <0,07 <0,09 <0,04 Triphosphate levels below qunatification limit are detected
L2.3.C4 1216898 <0,03 <0,07 <0,03 <0,07 <0,09 <0,04 Triphosphate levels below qunatification limit are detected
L2.3C5 1216899 <0,03 <0,07 <0,03 <0,07 <0,09 <0,04 Triphosphate levels below qunatification limit are detected
SMP
ANFACO
CODE
DIPHOSPHATE TRIPHOSPHATE HEXAMETAPHOSPHATECOMMENTS
G1
- Net
cau
ght
co
d. (
po
or
qu
alit
y)
RA
W
MA
TE
RIA
L
LIG
HT
SA
LT
ED
G2
- Lo
ng-
line
cau
ght
cod
(h
igh
qu
alit
y).
RA
W
MA
TE
RIA
L
LIG
HT
SA
LT
ED

Large scale trials with phosphates as additive and process aid.
28
ANNEX V: WP2 – Sampling.
GROUPA/C internal
code
Carnal 2110 control
(0%) - 1
A/C internal
codeCarnal 2110 (2%) - 2
A/C internal
code
Carnal 2110
(4%) - 3
1210116 G3.1.C1 1210121 G3.2.C1 1210126 G3.3.C1
1210117 G3.1.C2 1210122 G3.2.C2 1210127 G3.3.C2
1210118 G3.1.C3 1210123 G3.2.C3 1210128 G3.3.C3
1210119 G3.1.C4 1210124 G3.2.C4 1210129 G3.3.C4
1210120 G3.1.C5 1210125 G3.2.C5 1210130 G3.3.C5
1210131 G4.1.C1 1210136 G4.2.C1 1210141 G4.3.C1
1210132 G4.1.C2 1210137 G4.2.C2 1210142 G4.3.C2
1210133 G4.1.C3 1210138 G4.2.C3 1210143 G4.3C3
1210134 G4.1.C4 1210139 G4.2.C4 1210144 G4.3.C4
1210135 G4.1.C5 1210140 G4.2.C5 1210145 G4.3.C5
GROUPA/C internal
code
Carnal 2110 control
(0%) - 1
A/C internal
codeCarnal 2110 (2%) - 2
A/C internal
code
Carnal 2110
(4%) - 3
1210146 G3.1.B1 1210149 G3.2.B1 1210152 G3.3.B1
1210147 G3.1.B2 1210150 G3.2.B2 1210153 G3.3.B2
1210148 G3.1.B3 1210151 G3.2.B3 1210154 G3.3.B3
1210155 G4.1.B1 1210158 G4.2.B1 1210161 G4.3.B1
1210156 G4.1.B2 1210159 G4.2.B2 1210162 G4.3.B2
1210157 G4.1.B3 1210160 G4.2.B3 1210163 G4.3B3
BR
INE
S
G3 - BRINE BLED COD
G4 - BRINE DIRECT
SLAUGHTER
HE
AV
Y S
AL
TE
D
G3 - BLED COD
G4 - DIRECT
SLAUGHTER
GROUPA/C internal
codeRaw material
1210106 G3.0.C1
1210107 G3.0.C2
1210108 G3.0.C3
1210109 G3.0.C4
1210110 G3.0.C5
1210111 G4.0.C1
1210112 G4.0.C2
1210113 G4.0C3
1210114 G4.0.C4
1210115 G4.0.C5
G3 - BLED COD
G4 - DIRECT
SLAUGHTER
RA
W M
ATE
RIA
L H
EAV
Y
SALT
ED

Large scale trials with phosphates as additive and process aid.
29
ANNEX VI: WP2 – Oxidation and polyphosphate residuals results.
(gP/100g) (gP2O5/100g) (gP/100g) (gP2O5/100g) (gP/100g) (gP2O5/100g)
G3.0.C1 1210106 <2,00 <1,8 <0,03 <0,07 <0,03 <0,07 <0,09 <0,04 No detected phosphates
G3.0.C2 1210107 <2,00 2,7 <0,03 <0,07 <0,03 <0,07 <0,09 <0,04 No detected phosphates
G3.0.C3 1210108 <2,00 1,8 <0,03 <0,07 <0,03 <0,07 <0,09 <0,04 No detected phosphates
G3.0.C4 1210109 <2,00 <1,8 <0,03 <0,07 <0,03 <0,07 <0,09 <0,04 No detected phosphates
G3.0. C5 1210110 <2,00 3,2 <0,03 <0,07 <0,03 <0,07 <0,09 <0,04 No detected phosphates
G3.1.C1 1210116 <2,00 5,4 <0,03 <0,07 <0,03 <0,07 <0,09 <0,04 No detected phosphates
G3.1.C2 1210117 <2,00 5,0 <0,03 <0,07 <0,03 <0,07 <0,09 <0,04 No detected phosphates
G3.1.C3 1210118 <2,00 6,4 <0,03 <0,07 <0,03 <0,07 <0,09 <0,04 No detected phosphates
G3.1.C4 1210119 <2,00 <1,8 <0,03 <0,07 <0,03 <0,07 <0,09 <0,04 No detected phosphates
G3.1.C5 1210120 <2,00 5,0 <0,03 <0,07 <0,03 <0,07 <0,09 <0,04 No detected phosphates
G3.2.C1 1210121 <2,00 4,1 <0,03 <0,07 <0,03 <0,07 <0,09 <0,04 Triphosphate below quantification limit is detected.
G3.2.C2 1210122 <2,00 5,0 <0,03 <0,07 <0,03 <0,07 <0,09 <0,04 No detected phosphates.
G3.2.C3 1210123 <2,00 4,5 <0,03 <0,07 <0,03 <0,07 <0,09 <0,04 No detected phosphates
G3.2.C4 1210124 <2,00 3,2 <0,03 <0,07 <0,03 <0,07 <0,09 <0,04 Triphosphate below quantification limit is detected.
G3.2.C5 1210125 <2,00 3,6 <0,03 <0,07 0,03 0,08 <0,09 <0,04 Only triphosphate is detected and quantified.
G3.3.C1 1210126 <2,00 4,5 <0,03 <0,07 <0,03 <0,07 <0,09 <0,04 Triphosphate below quantification limit is detected.
G3.3.C2 1210127 <2,00 5,4 <0,03 <0,07 <0,03 <0,07 <0,09 <0,04 Triphosphate below quantification limit is detected.
G3.3.C3 1210128 <2,00 5,4 <0,03 <0,07 <0,03 <0,07 <0,09 <0,04 Triphosphate below quantification limit is detected.
G3.3.C4 1210129 <2,00 6,8 <0,03 <0,07 0,04 0,09 <0,09 <0,04 Only triphosphate is detected and quantified.
G3.3.C5 1210130 <2,00 4,5 <0,03 <0,07 0,04 0,1 <0,09 <0,04 Only triphosphate is detected and quantified.
G4.0.C1 1210111 <2,00 1,8 <0,03 <0,07 <0,03 <0,07 <0,09 <0,04 No detected phosphates
G4.0.C2 1210112 <2,00 2,7 <0,03 <0,07 <0,03 <0,07 <0,09 <0,04 No detected phosphates
G4.0.C3 1210113 <2,00 2,7 <0,03 <0,07 <0,03 <0,07 <0,09 <0,04 No detected phosphates
G4.0.C4 1210114 <2,00 3,6 <0,03 <0,07 <0,03 <0,07 <0,09 <0,04 No detected phosphates
G4.0. C5 1210115 <2,00 <1,8 <0,03 <0,07 <0,03 <0,07 <0,09 <0,04 No detected phosphates
G4.1.C1 1210131 <2,00 5,0 <0,03 <0,07 <0,03 <0,07 <0,09 <0,04 No detected phosphates
G4.1.C2 1210132 <2,00 5,4 <0,03 <0,07 <0,03 <0,07 <0,09 <0,04 No detected phosphates
G4.1.C3 1210133 <2,00 5,9 <0,03 <0,07 <0,03 <0,07 <0,09 <0,04 No detected phosphates
G4.1.C4 1210134 <2,00 6,4 <0,03 <0,07 <0,03 <0,07 <0,09 <0,04 No detected phosphates
G4.1.C5 1210135 <2,00 4,5 <0,03 <0,07 <0,03 <0,07 <0,09 <0,04 No detected phosphates
G4.2.C1 1210136 <2,00 4,1 <0,03 <0,07 <0,03 <0,07 <0,09 <0,04 Triphosphate below quantification limit is detected.
G4.2.C2 1210137 <2,00 5,4 <0,03 <0,07 <0,03 <0,07 <0,09 <0,04 Triphosphate below quantification limit is detected.
G4.2.C3 1210138 <2,00 <1,8 <0,03 <0,07 <0,03 <0,07 <0,09 <0,04 Triphosphate below quantification limit is detected.
G4.2.C4 1210139 <2,00 5,9 <0,03 <0,07 0,03 0,08 <0,09 <0,04 Only triphosphate is detected and quantified.
G4.2.C5 1210140 <2,00 5,9 <0,03 <0,07 0,03 0,07 <0,09 <0,04 Only triphosphate is detected and quantified.
G4.3.C1 1210141 <2,00 4,5 <0,03 <0,07 0,05 0,12 <0,09 <0,04 Only triphosphate is detected and quantified.
G4.3.C2 1210142 <2,00 4,5 <0,03 <0,07 0,04 0,1 <0,09 <0,04 Only triphosphate is detected and quantified.
G4.3C3 1210143 <2,00 11,3 <0,03 <0,07 0,05 0,12 <0,09 <0,04 Only triphosphate is detected and quantified.
G4.3.C4 1210144 <2,00 3,6 <0,03 <0,07 0,07 0,16 <0,09 <0,04 Only triphosphate is detected and quantified.
G4.3.C5 1210145 <2,00 5,9 <0,03 <0,07 0,05 0,1 <0,09 <0,04 Only triphosphate is detected and quantified.
DIPHOSPHATE TRIPHOSPHATE HEXAMETAPHOSPHATECOMMENTS
SMP ANFACO CODEPEROXIDES INDEX
(meq.O2/Kg.fat)
TBA INDEX
(µmol MAD/Kg
muscle tissue)G
3 -
BLE
D C
OD
RA
W
MA
TE
RIA
L
HE
AV
Y S
AL
TE
D
G4
- D
IREC
T SL
AU
GH
TER
RA
W
MA
TE
RIA
L
HE
AV
Y S
AL
TE
D

Large scale trials with phosphates as additive and process aid.
30
ANNEX VII: WP2 – Minerals results.
Na ClNa P P2O5 K Ca Mg Fe Zn Cu
GROUP(g/100g) (g/100g) (g/100g) (g/100g) (g/100g) (mg/Kg) (mg/Kg) (mg/Kg) (mg/Kg) (mg/Kg)
G3.0.C1 1210106 0,26 0,66 0,22 0,50 0,34 164 477 2,9 4,5 <0,16
G3.0.C2 1210107 0,27 0,69 0,20 0,46 0,34 161 510 2,3 4,2 <0,16
G3.0.C3 1210108 0,34 0,86 0,20 0,46 0,33 283 523 2,2 3,9 <0,16
G3.0.C4 1210109 0,24 0,61 0,20 0,46 0,31 155 453 <2 4,8 <0,16
G3.0.C5 1210110 0,33 0,84 0,20 0,46 0,31 174 530 <2 4,4 <0,16
G3.1.C1 1210116 6,7 17,0 0,1 0,23 0,18 430 477 2 3,6 <0,16
G3.1.C2 1210117 6,5 16,5 0,12 0,27 0,19 611 460 2,9 5,4 0,25
G3.1.C3 1210118 6,6 16,8 0,12 0,27 0,17 588 494 2,4 4,9 0,17
G3.1.C4 1210119 6,4 16,3 0,12 0,27 0,18 475 490 2,9 4,5 0,22
G3.1.C5 1210120 6,3 16,0 0,1 0,23 0,17 510 544 4,2 4,3 0,2
G3.2.C1 1210121 6,6 16,8 0,18 0,41 0,23 432 445 3 6,4 0,21
G3.2.C2 1210122 6,3 16,0 0,16 0,37 0,25 428 371 3,9 5,2 0,23
G3.2.C3 1210123 6,4 16,3 0,16 0,37 0,24 451 387 1,7 3,8 0,18
G3.2.C4 1210124 6,6 16,8 0,18 0,41 0,25 404 452 3,9 4,1 0,37
G3.2.C5 1210125 6,7 17,0 0,24 0,55 0,24 1022 517 3,2 4,1 0,22
G3.3.C1 1210126 7,5 19,1 0,18 0,41 0,32 363 335 2,2 7,2 0,23
G3.3.C2 1210127 7,1 18,0 0,18 0,41 0,35 371 349 2,7 4,9 0,22
G3.3.C3 1210128 7,5 19,1 0,16 0,37 0,26 371 326 2,6 4,0 0,25
G3.3.C4 1210129 7,4 18,8 0,14 0,32 0,31 391 275 4,5 3,9 0,19
G3.3.C5 1210130 7,3 18,6 0,16 0,37 0,30 586 374 2,6 4,7 0,16
G4.0.C1 1210111 0,22 0,56 0,22 0,50 0,37 130 452 <2 4 <0,16
G4.0.C2 1210112 0,27 0,69 0,20 0,46 0,31 300 482 2 3,6 <0,16
G4.0C3 1210113 0,29 0,74 0,20 0,46 0,29 180 519 <2 4,2 <0,16
G4.0.C4 1210114 0,33 0,84 0,20 0,46 0,29 280 546 <2 4,7 <0,16
G4.0.C5 1210115 0,26 0,66 0,20 0,46 0,30 157 527 2 4,5 <0,16
G4.1.C1 1210131 7,7 19,6 0,08 0,18 0,17 460 352 4,8 3,9 <0,16
G4.1.C2 1210132 6,9 17,5 0,1 0,23 0,18 467 359 2,2 3,3 0,21
G4.1.C3 1210133 7,6 19,3 0,16 0,37 0,19 1874 389 6,1 4,0 0,20
G4.1.C4 1210134 7,5 19,1 0,1 0,23 0,19 507 359 2,4 4,8 0,23
G4.1.C5 1210135 7,9 20,1 0,1 0,23 0,2 480 358 1,8 4,9 0,22
G4.2.C1 1210136 6,9 17,5 0,14 0,32 0,28 386 337 1,6 3,7 0,2
G4.2.C2 1210137 7 17,8 0,16 0,37 0,26 341 385 1,7 3,9 0,23
G4.2.C3 1210138 6,8 17,3 0,14 0,32 0,27 382 335 1,7 3,7 0,18
G4.2.C4 1210139 7,3 18,6 0,16 0,37 0,28 455 380 3,4 3,3 0,17
G4.2.C5 1210140 7,4 18,8 0,14 0,32 0,27 354 352 2,5 3,9 0,2
G4.3.C1 1210141 7,2 18,3 0,22 0,50 0,39 380 318 1,8 3,8 0,21
G4.3.C2 1210142 7,5 19,1 0,22 0,50 0,37 636 284 5,5 3,8 0,23
G4.3C3 1210143 7,5 19,1 0,18 0,41 0,36 346 309 2 3,8 0,19
G4.3.C4 1210144 7,5 19,1 0,22 0,50 0,37 439 345 3,1 3,5 0,2
G4.3.C5 1210145 7,6 19,3 0,22 0,50 0,39 351 329 2,4 3,8 0,2
SMP
ANFACO
CODE
G3
- B
LED
CO
D
RA
W
MA
TE
RIA
L
LIG
HT
SA
LT
ED
G4
- D
IREC
T SL
AU
GH
TER
RA
W
MA
TE
RIA
L
LA
IGH
T S
AL
TE
D

Large scale trials with phosphates as additive and process aid.
31
ANNEX VII: WP2 – Minerals results.
Na ClNa P P2O5 K Ca Mg Fe Zn Cu
GROUP Code A/C (g/L) (g/L) (g/L) (g/L) (g/L) (mg/L) (mg/L) (mg/L) (mg/L) (mg/L)
G3.1.B1 1210146 99,8 253,7 0,40 0,92 1,24 363 514 1,1 <0,20 0,06
G3.1.B2 1210147 93,9 238,7 0,50 1,15 1,42 336 474 1,1 0,3 0,03
G3.1.B3 1210148 94,5 240,2 0,62 1,42 1,68 300 475 1,2 0,22 0,02
G3.2.B1 1210149 93,5 237,7 1,22 2,79 3,2 260 374 1,4 <0,20 0,02
G3.2.B2 1210150 94 238,9 1,44 3,30 3,16 292 392 1,4 <0,20 0,02
G3.2.B3 1210151 94,1 239,2 1,48 3,39 3,24 273 365 1,1 <0,20 0,02
G3.3.B1 1210152 90,3 229,5 1,50 3,44 4,55 176 139 0,77 <0,20 0,02
G3.3.B2 1210153 101,8 258,8 1,58 3,62 4,56 192 170 1,4 <0,20 <0,02
G3.3.B3 1210154 93,3 237,2 1,44 3,30 4,5 186 149 1,4 <0,20 0,02
G4.1.B1 1210155 91,7 233,1 0,52 1,19 1,5 322 459 0,89 <0,20 0,04
G4.1.B2 1210156 99,9 253,9 0,56 1,28 1,7 326 480 1,1 <0,20 0,02
G4.1.B3 1210157 97,2 247,1 0,54 1,24 1,59 279 423 0,71 <0,20 0,02
G4.2.B1 1210158 104,2 264,9 0,78 1,79 3,14 191,3 247 1,7 0,34 0,02
G4.2.B2 1210159 99,2 252,2 1,02 2,34 3,08 212 292 1,7 0,4 <0,02
G4.2.B3 1210160 97,9 248,9 1,02 2,34 3,12 236 289 1 <0,20 <0,02
G4.3.B1 1210161 104,7 266,1 1,38 3,16 4,74 159 93 1,5 0,59 <0,02
G4.3.B2 1210162 99,7 253,4 1,80 4,12 4,57 201 140 1,8 0,66 0,02
G4.3B3 1210163 108,4 275,6 1,42 3,25 4,63 151 105 1,2 0,58 0,07
BR
INE
G4
- D
IREC
T
SLA
UG
HTE
RG
3 -
BLE
D C
OD


![Untitled-1 [] Dry Roasted Salted Kernels OMUR OMUR Roasted Salted Peanut OMUR OMOR Kabak Roasted Salted Pumpkin Seeås OMOR Roasted Peeled Huelnuts OMOR OMOR . Roasted & Spice OMOR](https://static.fdocuments.in/doc/165x107/5cc7480888c993103f8b59e1/untitled-1-dry-roasted-salted-kernels-omur-omur-roasted-salted-peanut-omur-omor.jpg)