Stabilization Wedges: Mitigation Tools for the Next Half-Century Robert Socolow Princeton University...
39
Stabilization Wedges: Mitigation Tools for the Next Half- Century Robert Socolow Princeton University [email protected] Future of Energy Series Center for the Environment Harvard University April 5, 2006 This talk is based on a paper by Stephen Pacala and Robert Socolow, published in the August 13, 2004, issue of Science, 305 (5686), pp. 968- 972, and its Supporting Online Material, available at www.princeton.edu/~cmi
-
date post
21-Dec-2015 -
Category
Documents
-
view
214 -
download
0
Transcript of Stabilization Wedges: Mitigation Tools for the Next Half-Century Robert Socolow Princeton University...

Stabilization Wedges: Mitigation Tools for the Next Half-Century
Robert SocolowPrinceton University
Future of Energy SeriesCenter for the Environment
Harvard UniversityApril 5, 2006
This talk is based on a paper by Stephen Pacala and Robert Socolow, published in the August 13, 2004, issue of Science, 305 (5686), pp. 968-972,
and its Supporting Online Material, available at www.princeton.edu/~cmi

What if the fossil fuel future is robust, but the Greenhouse problem is severe?
Will the fossil fuel system wither away?
YES NO
Will the case for Greenhouse damage wither away?
YES A nuclear or renewables world unmotivated by climate.
Most people in the fuel industries and most of the public have been here
NO Environmentalists, nuclear advocates are often here.
OUR WORKING ASSUMPTIONS
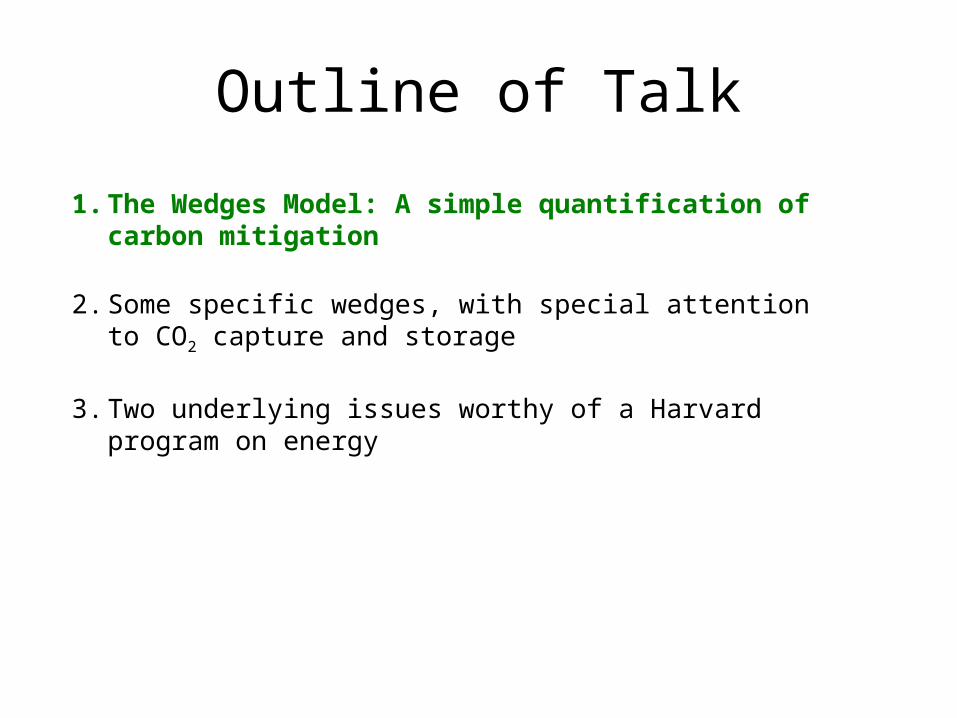
Outline of Talk
1. The Wedges Model: A simple quantification of carbon mitigation
2. Some specific wedges, with special attention to CO2 capture and storage
3. Two underlying issues worthy of a Harvard program on energy

20552005
14
7
1955
0
1.9
2105
Past Emissions
Historical emissions
Billion of Tons of Carbon Emitted per Year

20552005
14
7
1955
0
1.9
2105
The Stabilization Triangle
OInterim Goal
Billion of Tons of Carbon Emitted per Year
Currently
projected path
= “ramp”
Historical emissions
Flat path
Stabilization Triangle

(380)
(850)
The Stabilization Triangle: Beat doubling or accept tripling
Values in parentheses are ppm. Note the identity (a fact about the size of the Earth’s atmosphere): 1 ppm = 2.1 GtC.
14
7
21
1955 2055 21052005
850 ppm
500 ppm
Ramp = Delay
Flat = Act Now
1.9(320)
(470)
(530) (750)
(500)(500)
(500)(850)
Business A
s Usual
2155 2205
GtC/yr
Historicalemissions
Stabilizationtriangle

The Interim Goal is Within Reach
Reasons for optimism that global emissions in 2055 need not exceed today’s emissions:
•The world today has a terribly inefficient energy system.
•Carbon emissions have just begun to be priced.
•Most of the 2055 physical plant is not yet built

20552005
14
7
Billion of Tons of Carbon Emitted per Year
1955
0
Currently
projected path
Flat path
Historical emissions
1.9
2105
14 GtC/y
7 GtC/y
Seven “wedges”
Wedges
O

What is a “Wedge”?A “wedge” is a strategy to reduce carbon emissions that grows in 50 years from zero to 1.0 GtC/yr. The strategy has already been commercialized at scale somewhere.
1 GtC/yr
50 years
Total = 25 Gigatons carbon
Cumulatively, a wedge redirects the flow of 25 GtC in its first 50 years. This is 2.5 trillion dollars at $100/tC.
A “solution” to the CO2 problem should provide at least one wedge.
Outline of Talk
1. The Wedges Model: A simple quantification of carbon mitigation
2. Some specific wedges, with special attention to CO2 capture and storage
3. Two underlying issues worthy of a Harvard program on energy

Electricity
TransportationHeating
Allocation of 6.2 GtC/yr
Electricity: 40%Fuels used directly: 60%

Energy Efficiency
Decarbonized Electricity
Fuel Displacement by Low-Carbon Electricity
Forests & Soils DecarbonizedFuels
Stabilization Triangle
2004 2054
7 GtC/y
14 GtC/y
Fill the Stabilization Triangle with Seven Wedges
MethaneManagement

ElectricityElectricityEffort needed by 2055 for 1 wedge:
700 GW (twice current capacity) displacing coal power.
NuclearNuclear
Graphic courtesy of NRC
Phase out of nuclear power creates the need for another half wedge.

Wind ElectricityWind Electricity
Effort needed by 2055 for 1 wedge:
One million 2-MW windmills displacing coal power.
Today: 50,000 MW (1/40)
Prototype of 80 m tall Nordex 2,5 MW wind turbine located in Grevenbroich, Germany
(Danish Wind Industry Association)

Pholtovoltaic PowerPholtovoltaic Power
Effort Needed by 2055 for one wedge:
2000 GWpeak (700 times current capacity) 2 million hectares
Graphics courtesy of DOE Photovoltaics Program
Solar thermal power via concentrators (troughs and dishes) is produced at high efficiency, like PV.

Power with Carbon Capture and StoragePower with Carbon Capture and Storage
Graphics courtesy of DOE Office of Fossil Energy
Effort needed by 2055 for 1 wedge:
Carbon capture and storage at 800 GW coal power plants.

Efficient Use of ElectricityEfficient Use of Electricity
buildingsindustry power
Effort needed by 2055 for 1 wedge:
.25% - 50% reduction in expected 2055 electricity use in commercial and residential buildings

Efficient Use of FuelEfficient Use of Fuel
Effort needed by 2055 for 1 wedge:
2 billion cars driven 10,000 miles per year at 60 mpg instead of 30 mpg.
1 billion cars driven, at 30 mpg, 5,000 instead of 10,000 miles per year.

Coal-based Synfuels with CCS* *Carbon capture and storage
Coal-based Synfuels with CCS* *Carbon capture and storage
Effort needed for 1 wedge by 2055
Capture and storage of the CO2 byproduct at plants producing 30 million barrels per day of coal-based synfuels
Assumption: half of C originally in the coal is available for capture, half goes into synfuels.
Graphics courtesy of DOE Office of Fossil Energy
Result: Coal-based synfuels have no worse CO2 emissions than petroleum fuels, instead of doubled emissions.

BiofuelsBiofuels
Effort needed by 2055 for 1 wedge:
2 billion 60 mpge cars running on biofuels instead of gasoline and diesel.
To produce these biofuels: 250 million hectares of high-yield (15 t/ha) crops, one sixth of world cropland.
Challenge: To find ecologically responsible ways to grow biomass for power and fuel on hundreds of millions of hectares.
Usina Santa Elisa mill in Sertaozinho, Brazil (http://www.nrel.gov/data/pix/searchpix.cgi?getrec=5691971&display_type=verbose&search_reverse=1_

Emission Commitments from Capital Investments
Historic emissions, all uses
2003-2030 power-plant lifetime CO2 commitments WEO-2004 Reference Scenario.Lifetime in years: coal 60, gas 40, oil 20.
Deter investments in new long-lived high-carbon stock: (e.g., power plants, buildings). Coordinate “green-field” (new) and “brown-field” (replacement).
Needed: “Commitment accounting.”
Credit for comparison: David Hawkins, NRDC

$100/tC
Form of Energy Equivalent to $100/tC
Natural gas $1.50/1000 scf
Crude oil $12/barrel
Coal $65/U.S. ton
Gasoline 25¢/gallon (ethanol subsidy: 50¢/gallon)
Electricity from coal 2.2¢/kWh (wind and nuclear subsidies: 1.8 ¢/kWh)
Electricity from natural gas 1.0¢/kWh
Today’s global energy system $700 billion/year (2% of GWP)
Carbon emission charges in the neighborhood of $100/tC can enable scale-up of most of the wedges. (PV is an exception.)
$100/tC is approximately the EU trading price for the past six months.

$100/tC ≈ 2¢/kWh induces CCS. Three views.
CCS
Wholesale power w/o CCS: 4 ¢/kWh
Transmission and distribution
A coal-gasification power plant can capture CO2 for an added 2¢/kWh ($100/tC). This:
triples the price of delivered coal;
adds 50% to the busbar price of electricity from coal;
adds 20% to the household price of electricity from coal.
Coal at the power plant
2
6
3
1
} 6
Retail power w/o CCS: 10 ¢/kWh
Plant capital

Do wedge strategies get used up?
For any strategy, is the second wedge easier or harder to achieve than the first? Are the first million two-megawatt wind turbines more expensive or cheaper than the second million two-megawatt wind turbines?
The first million will be built at the more favorable sites.
But the second million will benefit from the learning acquired building the first million.
The question generalizes to almost all the wedge strategies: Geological storage capacity for CO2, land for biomass, river valleys for hydropower, uranium ore for nuclear power, semiconductor materials for photovoltaic collectors.
All present the same question: Will saturation or learning dominate?

Summary: What’s appealing stabilization wedges?
The stabilization triangle:Does not concede doubling is inevitable. Shortens the time frame to within business horizons.
The wedge:Decomposes a heroic challenge (the Stabilization Triangle) into a limited set of monumental tasks.
Establishes a unit of action that permits quantitative discussion of cost, pace, risk.
Establishes a unit of action that facilitates quantitative comparisons and trade-offs.

Outline of Talk
1. The Wedges Model: A simple quantification of carbon mitigation
2. Some specific wedges, with special attention to CO2 capture and storage
3. Two underlying issues worthy of a Harvard program on energy:
A. Redistribution – ethics and technology in a world with limits
B. Prospicience (“the art of looking forward”) – principles and practices in a world with limits

“60% reduction by 2050” (Blair) + “constant global emissions” leaves room for others
Under a constant global emissions cap, if emissions from countries responsible for top half (3.5 GtC/y) of per capita emissions are reduced by 60% (Blair), emissions from the rest can increase by 160%: 50-50 becomes 20-80.
2002: OECD 54%, Transition economies 11%, Developing countries 35%.
CO2 emissions (tC/yr) per capita, 1997, from the 10 largest-emitting countries
5.37 2.15/(US pop. growth)
1.13 1.13/(World pop. growth)
Source: Marland et al., 1999, as presented in Rubin, Fig 12.25(b).
Consensus Building via Wedges?
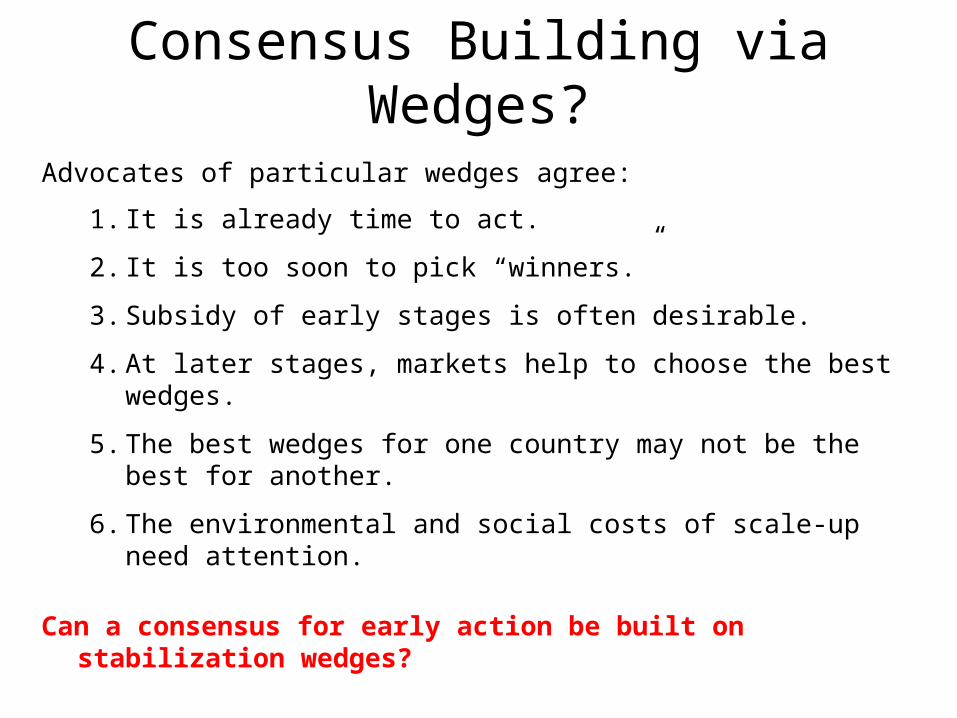
Advocates of particular wedges agree:
1. It is already time to act.
2. It is too soon to pick “winners.”
3. Subsidy of early stages is often desirable.
4. At later stages, markets help to choose the best wedges.
5. The best wedges for one country may not be the best for another.
6. The environmental and social costs of scale-up need attention.
Can a consensus for early action be built on stabilization wedges?

Leapfrogging and Wedges
“To leapfrog”: To introduce advanced technology in developing countries first, industrialized countries later.
Some developing countries can leapfrog to the deployment of advanced concepts, e.g., for city planning, buildings, transport, coal, or biofuels.
The world learns faster, reducing everyone’s costs.
The world compensates those who move first.
Leapfrogging is a path to globally coordinated mitigation.

Carbon and Basic Human NeedsBasic Human Need
People without access (billions)
Sufficiency (per capita-yr)
Carbon required (GtC/yr)
Electricity 1.6 600 kWh 0.15*
Clean cooking fuel
2.6 35 kg propane 0.07
Total 0.22†
*using global average C-intensity of power in 2002: 160 gC/kWh
Instantly meeting Basic Human Needs for electricity and clean cooking fuel would produce only a three percent increase in global CO2 emissions. Including coal and kerosene not burned, net might be a decrease.
†current global carbon emissions: 7 GtC/yr
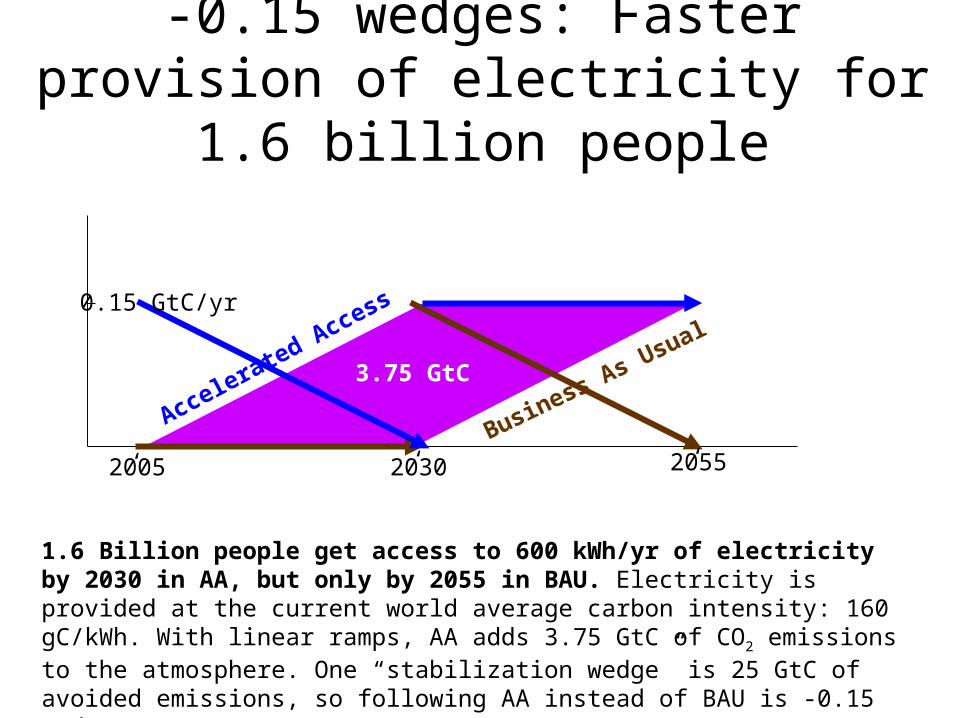
-0.15 wedges: Faster provision of electricity for 1.6 billion people
Business As Usual
Accelerated Access
2005‘ ‘ ‘2030 2055
0.15 GtC/yr
3.75 GtC
1.6 Billion people get access to 600 kWh/yr of electricity by 2030 in AA, but only by 2055 in BAU. Electricity is provided at the current world average carbon intensity: 160 gC/kWh. With linear ramps, AA adds 3.75 GtC of CO2 emissions to the atmosphere. One “stabilization wedge” is 25 GtC of avoided emissions, so following AA instead of BAU is -0.15 wedges.

-0.07 wedges: Faster provision of clean cooking fuels for 2.6 billion people
Business As Usual
Accelerated Access
2005‘ ‘ ‘2030 2055
0.07 GtC/yr
1.75 GtC
2.6 Billion people get access to 35 kg/yr of LPG (propane) or equivalent clean cooking fuel by 2030 in AA, but only by 2055 in BAU. With linear ramps, AA adds 1.75 GtC of CO2 emissions to the atmosphere. One “stabilization wedge” is 25 GtC of avoided emissions, so following AA instead of BAU is -0.07 wedges.

20552005
14
7
Billion of Tons of Carbon Emitted per Year
1955
0
projected path
Flat path
Historical emissions
1.9
2105
14 GtC/y
7 GtC/y
Seven “wedges”
Wedges
O
Basic Human Needs for cooking and electricity

ProspicienceProspicience: “The art [and science] of looking ahead.” We need a new word to describe a new intellectual domain.
In the past 50 years we have become aware of our deep history: the history of our Universe, our Earth, and life. All this is quantitative for the first time.
Can we achieve a comparable quantitative understanding of human civilization at various future times: 50 years ahead vs. 500 vs. 5000 vs. longer?
We have scarcely begun to ask: What are we on this planet to do? What are our goals? What are our responsibilities?
Imagine spending as much effort on our collective destiny on Earth as we spend on our personal destiny in the afterlife!

Where might a discipline of looking ahead be helpful?
Currently, we are unable to think clearly in areas of technology policy where distinctions among future time frames (10, 100, 1000, 10,000 years) are critical.
We are making a mess of nuclear waste policy, We have been distracted by a set of irrelevant time scales, the long half-lives of particular isotopes.
We are finding it difficult to think coherently about the geological storage of CO2. How long should CO2 stay down!
We are in a muddle about Hubbert's peak and other resource issues. Yes, we are using up our best stuff (spending our spectacular endowment), but, yes, there is lots of less good stuff. Details matter.
We are dismayed by the tyranny of the discount rate in much analysis.

Earth Engineering
How should we perform our new role of Earth engineers?
As we learn how the world works as a physical and biological system, we will learn how to manipulate it.
We will struggle over goals: levels of risk, intergenerational and intragenerational equity, responsibility for ecosystems and other species.
We will struggle over processes: Who decides?

“Stabilization”
Do we desire stabilization? When we imagine our destiny, we often imagine a future without change. Won’t our descendants be restless as we are?
Many UN population projections assume stationary populations forever, after some near date (2050). Might we prefer the global population to return by 2200 to two billion, without war or pestilence?
The Framework Convention on Climate Change calls for stabilization of the CO2 concentration. “Stabilization” is a word from control theory. Will we negotiate an optimal CO2 concentration once, and intervene thereafter to keep it constant?
There are no plateaus.

A world transformed by deliberate attention to carbon
A world with the same total CO2 emissions in 2055 as in 2005 will also have:
1. Institutions for carbon management that reliably communicate the price of carbon.
2. If wedges of nuclear power are achieved, strong international enforcement mechanisms to control nuclear proliferation.
3. If wedges of CO2 capture and storage are achieved, widespread permitting of geological storage.
4. If wedges of renewable energy and enhanced storage in forests and soils are achieved, extensive land reclamation and rural development.
5. A planetary consciousness.
Not an unhappy prospect!

Can We Do It?
People are becoming increasingly anxious about our limited understanding of the experiments we are performing on the only Earth we have…
…and are learning that there are ways to live more cautiously.
We should anticipate a discontinuity:
What has seemed too hard becomes what simply must be done.
Precedents include abolishing child labor, addressing the needs of the disabled, and mitigating air pollution.