Stability indicating methods for the determination of cefpodoxime
17
Stability indicating methods for the determination of cefpodoxime proxetil in the presence of its acid and alkaline degradation products Laila abdel-fattah a , Soheir A. Weshahy b , Nagiba Y. Hassan a , Nadia M. Mostafa a , *, Shereen A. Boltia a a Analytical Chemistry Department, Faculty of Pharmacy, Cairo University, Kasr El-Aini St., ET-11562 Cairo, Egypt b Pharmaceutical Chemistry Department, Faculty of Pharmaceutical Sciences & Pharmaceutical Industry , Future University, Al-Tagamoe Alkhames, new Cairo, Cairo, Egypt * Corresponding author E-mail address:[email protected] Abstract Four different, accurate, sensitive and reproducible stability-indicating methods for the determination of cefpodoxime proxetil (CPD) in the presence of its acid and alkaline degradation products are presented. The first method is based on derivative spectrophotometry. Second derivative spectrophotometry was applied where CPD was determined at 261 nm in the presence of its acid degradation product and also third derivative spectrophotometry was applied where CPD was determined at 282 nm in the presence of its alkaline degradation product. The second method is based on the first derivative of ratio spectrophotometry ( 1 DD) of CPD at 215 nm and 255 nm in the presence of its acid degradation product and at 243 nm in the presence of its alkaline degradation product. The third method is ratio subtraction spectrophotometry where the drug is determined at 232 nm in laboratory prepared mixtures of CPD and its acid or alkaline degradation product. Calibration graphs were established for 4.0-40.0 μg/ml for CPD determination by the three spectrophotometric methods. The fourth method is an isocratic reversed -phase HPLC procedure, a Zorbax C 8 column was used to separate CPD from its acid and alkaline degradation product using acetonitrile: water: triethylamine (60:40:1, v/v/v) as a mobile phase and detection at 232 nm. The suggested procedures were successfully applied for the analysis of CPD in bulk powder and in pharmaceutical preparations. The results obtained by applying the proposed methods were statistically analyzed and compared with those obtained by the official method. Keywords cefpodoxime proxetil, stability indicating method, degradation, high-performance liquid chromatography Introduction Cefpodoxime proxetil (CPD), an orally absorbed, broad spectrum, third-generation cephalosporin, is a prodrug that is de-esterified in vivo to its active metabolite, cefpodoxime. It demonstrates strong activity against pathogens frequently associated with the upper respiratory tract, urinary tract, skin and soft tissue infections [1- 2] Various techniques have been utilized for the determination of CPD in body fluids and pharmaceuticals; these include spectrophotometric [3-7]. chromatographic [8-12], electrochemical [13-14] and However, although the selectivity and the detection limits have been improved in these methods, these are time consuming methods and little of them which exposed to stability of CPD [9]. Therefore simple and easy techniques have been investigated for the determination of CPD as intact form in presence of its acid and alkaline induced degradation products. These methods include spectrophotometric methods and HPLC method. Experimental Apparatus - Spectrophotometric studies were carried out with Shimadzu 1651 dual beam UV-Vis spectrophotometer with a fixed slit width (2 nm) connected to an IBM-PC computer loaded with Shimadzu UVPC software. - High- performance liquid chromatography (HPLC) analysis was performed on a liquid chromatography consisted of: An isocratic pump (Agilant model G1310A) An ultraviolet variable wavelength detector (model G1314 A, Agilant 1100 series). Laila abdel-fattah et al. / International Journal of Pharmaceutical and Biological Research (IJPBR) ISSN : 0976- 285X Vol 3 Issue 6 Dec 2012-Jan 2013 223
Transcript of Stability indicating methods for the determination of cefpodoxime

Stability indicating methods for the determination of cefpodoxime proxetil in
the presence of its acid and alkaline degradation products
Laila abdel-fattaha , Soheir A. Weshahyb, Nagiba Y. Hassana , Nadia M. Mostafaa ,*, Shereen A. Boltia a
a Analytical Chemistry Department, Faculty of Pharmacy, Cairo University, Kasr El-Aini St., ET-11562 Cairo, Egypt
b Pharmaceutical Chemistry Department, Faculty of Pharmaceutical Sciences & Pharmaceutical Industry , Future University, Al-Tagamoe Alkhames, new Cairo, Cairo, Egypt
* Corresponding author E-mail address:[email protected]
Abstract
Four different, accurate, sensitive and reproducible stability-indicating methods for the determination of cefpodoxime proxetil (CPD) in the presence of its acid and alkaline degradation products are presented. The first method is based on derivative spectrophotometry. Second derivative spectrophotometry was applied where CPD was determined at 261 nm in the presence of its acid degradation product and also third derivative spectrophotometry was applied where CPD was determined at 282 nm in the presence of its alkaline degradation product. The second method is based on the first derivative of ratio spectrophotometry (1DD) of CPD at 215 nm and 255 nm in the presence of its acid degradation product and at 243 nm in the presence of its alkaline degradation product. The third method is ratio subtraction spectrophotometry where the drug is determined at 232 nm in laboratory prepared mixtures of CPD and its acid or alkaline degradation product. Calibration graphs were established for 4.0-40.0 μg/ml for CPD determination by the three spectrophotometric methods. The fourth method is an isocratic reversed -phase HPLC procedure, a Zorbax C8 column was used to separate CPD from its acid and alkaline degradation product using acetonitrile: water: triethylamine (60:40:1, v/v/v) as a mobile phase and detection at 232 nm. The suggested procedures were successfully applied for the analysis of CPD in bulk powder and in pharmaceutical preparations. The results obtained by applying the proposed methods were statistically analyzed and compared with those obtained by the official method.
Keywords cefpodoxime proxetil, stability indicating method, degradation, high-performance liquid chromatography
Introduction
Cefpodoxime proxetil (CPD), an orally absorbed, broad spectrum, third-generation cephalosporin, is a prodrug that is de-esterified in vivo to its active metabolite, cefpodoxime. It demonstrates strong activity against pathogens frequently associated with the upper respiratory tract, urinary tract, skin and soft tissue infections [1-2] Various techniques have been utilized for the determination of CPD in body fluids and pharmaceuticals; these include spectrophotometric [3-7]. chromatographic [8-12], electrochemical [13-14] and However, although the selectivity and the detection limits have been improved in these methods, these are time consuming methods and little of them which exposed to stability of CPD [9]. Therefore simple and easy techniques have been investigated for the determination of CPD as intact form in presence of its acid and alkaline induced degradation products. These methods include spectrophotometric methods and HPLC method.
Experimental
Apparatus
- Spectrophotometric studies were carried out with Shimadzu 1651 dual beam UV-Vis spectrophotometer with a fixed slit width (2 nm) connected to an IBM-PC computer loaded with Shimadzu UVPC software.
- High- performance liquid chromatography (HPLC) analysis was performed on a liquid chromatography consisted of:
An isocratic pump (Agilant model G1310A) An ultraviolet variable wavelength detector (model G1314 A, Agilant 1100 series).
Laila abdel-fattah et al. / International Journal of Pharmaceutical and Biological Research (IJPBR)
ISSN : 0976- 285X Vol 3 Issue 6 Dec 2012-Jan 2013 223

A Rheodyne injector (model 7725I, Rohnert Park, CA., USA) equipped with 20μl injector loop, Agilant (USA).
Hamilton syringe (50 μl) Stationary phase is Zorbax C8 (5µm , 4.6 x 150 mm) Analytical column. - Infrared (IR) spectrometer, vector 22 (Bruker Optics, Ettlingen, Germany) - The mass spectra were performed on Shimadzu Qp-2010 operated on EI mode at 70 eV.
Materials
Pure Sample
Cefpodoxime proxetil was kindly supplied by Pharco / Rexcel , Egypt. Its purity was found to be 99.50 ± 0.56 according to HPLC official method (8).
Pharmaceutical dosage forms
- Orelox film coated tablets (Sanofi Aventis), batch no 7FH5E labeled to contain cefpodoxime proxetil equal to 100 mg cefpodoxime / tablet.
- Orelox suspension (Sanofi Aventis), batch no 7FE1E labeled to contain cefpodoxime proxetil equal to 40 mg cefpodoxime / 5 ml.
Reagents and solvents
All reagents and solvents used throughout this work were of analytical pure grade. - Water was obtained in a Milli-Q water purification system (Millipore), - Acetonitrile and triethylamine are HPLC- grade; E. Merck (Darmstadt, Germany). - Methanol and dimethyl formamide (DMF); (Prolabo, West Chester, PA, USA) - HCl (1M HCl), NaOH (1M NaOH), ammonium hydroxide (30%) and ammonium acetate; (ADWIC) – (El
Nasr Pharmaceutical & Chemical Co. Egypt)
Degraded samples
Preparation of acid degradation product of CPD; 1mg ml -1
It was prepared by adding 25 ml 1M HCl to 100 mg CPD and reflux for 1.5 hours. The solution was neutralized and quantitavely transferred into 100-ml volumetric flask and the volume was completed with water to the mark.
Preparation of alkaline degradation product of CPD; 1mg ml -1
It was prepared by adding 25 ml 1M NaOH to 100 mg CPD and reflux for 1 hour. The solution was neutralized and quantitavely transferred into 100-ml volumetric flask and the volume was completed with water to the mark.
Elucidation of the structure of degradation products
Complete degradation was achieved, as investigated by thin layer chromatography using methanol: ammonium hydroxide (10: 0. 1, v/v) as a developing solvent. The solution was neutralized and evaporated under vacuum to dryness. The degradation products were dissolved using 20 ml dimethyl fomamide (to avoid dissolution of NaCl). DMF extract was evaporated again under vacuum to dryness and extracted using 5 ml methanol. The methanolic extract was evaporated at room temperature to give crystals of degradation products. The structure of the isolated degradation product was elucidated using IR, and mass spectrometry.
Standard stocks and working solutions
- Standard stock solutions of CPD, its acid degradation product and its alkaline degradation product (1 mg ml-1) of each.
- Working standard solutions of CPD, its acid degradation product and its alkaline degradation product (100 μg ml-1) of each.
- Working standard solutions of CPD, its acid degradation product and its alkaline degradation product (200 μg ml-1) of each.
- Laboratory prepared mixtures of different ratios of CPD with either its acid or alkaline degradation product from 10 to 90%.
Procedures
Spectrophotometric Methods
Construction of calibration curves:
Aliquots of CPD working standard solution (100 μg ml-1) equivalent to 100-1000 μg of CPD were accurately transferred into series of 25-ml volumetric flasks, volume was completed with water. The absorption spectra were recorded in the range of 200-400 nm.
Laila abdel-fattah et al. / International Journal of Pharmaceutical and Biological Research (IJPBR)
ISSN : 0976- 285X Vol 3 Issue 6 Dec 2012-Jan 2013 224

The same procedures were applied to construct calibration graphs of both the acid and the alkaline degradation products of CPD using the corresponding working standard solution (100 μg ml-1) of each.
Recording the absorption spectra of laboratory prepared mixtures
Aliquots from 9 to 1 ml were separately transferred from CPD working standard solution (100 μg ml-1) into 25-ml volumetric flasks. To the previous solutions, aliquots of 1 to 9 ml of acid degradation product of CPD working standard solution (100 μg ml-1) were added separately and the volume was completed with water. The absorption spectra were recorded in the range of 200-400 nm. The same procedures were applied to record the absorption spectra of laboratory prepared mixtures of CPD and its alkaline degradation product using the corresponding working standard solution (100 μg ml-1) of each.
Derivative spectrophotometric method
Second derivative spectrophotometry was applied to the absorption spectra of CPD and its acid degradation product binary mixtures with Δλ = 8 nm. CPD was determined at 261 nm. Third derivative spectrophotometry was applied to the absorption spectra of CPD and its alkaline degradation product binary mixtures with Δλ = 8 nm. CPD was determined at 282 nm.
The first derivative ratio spectrophotometric method (1DD)
The absorption spectra of CPD and its acid degradation product binary mixtures were divided by standard spectrum of the acid degradation product (40 μg ml-1). From the ratio spectra thus obtained, first derivatives calculated with Δλ = 4 nm, were recorded. CPD was determined at 215 and 255 nm. The absorption spectra of CPD and its alkaline degradation product binary mixtures were divided by standard spectrum of the alkaline degradation product (40 μg ml-1). From the ratio spectra thus obtained, first derivatives calculated with Δλ = 4 nm, were recorded. CPD was determined at 243 nm.
Ratio subtraction spectrophotometric method
The absorption spectra of CPD and its acid degradation product binary mixtures were divided by standard spectrum of the acid degradation product (20 μg ml-1) to obtain a plateau region, subtraction of the absorbance values of the plateau region and multiplication of the obtained spectra by the divisor spectrum of the acid degradation product (20 μg ml-1) then the final obtained spectra will correspond to CPD. The same procedures were applied to the spectra of CPD and its alkaline degradation product binary mixtures using the standard spectrum of alkaline degradation product (20 μg ml-1) as divisor.
HPLC method
Chromatographic conditions
Chromatograms of CPD with either its acid or alkaline degradation products were recorded under the following parameters: - Flow rate was 1ml/min. at ambient temperature. - Detector was adjusted at 232 nm. - Column was Zorbax C8 (5µm, 4.6 x 150 mm.), Analytical column - Mobile phase was acetonitrile: water: triethylamine (60:40:1, v/v). (The mobile phase was filtered using 0.45 μm membrane filter and degassed by ultrasonic vibrations for 15 min.)
Construction of calibration curve
Aliquots of CPD working standard solution (200 μg ml-1) equivalent to 30-1000 μg were accurately transferred into series of 10-ml volumetric flasks, volume was completed with mobile phase. The prepared samples were analyzed using the previously mentioned chromatographic conditions using 50 μg ml-1 of CPD as an external standard.
Determination of CPD in the presence of either its acid or alkaline degradation products
Aliquots from 4.5 to 0.5 ml were separately transferred from CPD working standard solution (200 μg ml-1) into 10-ml volumetric flasks. To the previous solutions, aliquots of 0.5 to 4.5 ml of acid degradation product of CPD working standard solution (200 μg ml-1) were added separately and the volume was completed with mobile phase. The prepared samples were analyzed using the previously mentioned chromatographic conditions using 50 μg ml-1 of CPD as an external standard. The same procedures were applied to analyze the laboratory prepared mixtures of CPD and its alkaline degradation product using the corresponding working standard solution (200 μg ml-1) of each.
Laila abdel-fattah et al. / International Journal of Pharmaceutical and Biological Research (IJPBR)
ISSN : 0976- 285X Vol 3 Issue 6 Dec 2012-Jan 2013 225

Analysis of pharmaceuticals
Analysis of tablets
A total of 10 tablets were weighed and finely powdered. An amount equivalent to 100 mg was weighed, transferred to 100-ml volumetric flask, stirred with 10 ml methanol then the volume was completed with water. The solution was filtered. Further dilution was made using either water (for spectrophotometric procedures) or mobile phase (for HPLC procedure).
Analysis of suspension
The contents of 3 bottles were extracted using 50 ml methanol then filtration was performed into 100-ml volumetric flask, the volume was completed with water. Further dilution was made using either water (for spectrophotometric procedures) or mobile phase (for HPLC procedure).
Results and Discussion
Degradation of CPD
CPD was degraded by refluxing with 1M HCl or 1M NaOH and the degradation process were monitored by spotting on TLC plates using methanol: ammonium hydroxide (10: 0.1, v/v) as developing system. Only one spot different than that of CPD was observed, for either acid or alkaline degradation products. It was found that complete degradation of CPD occurred after 1.5 hrs and 1 hr for acid and alkaline degradation process, respectively. According to Koda et al (15, 16) study for the degradation of cefixime drug, the suggested acid and alkaline degradation pathways of CPD were illustrated in scheme 1. The acid and alkaline degradation products were separated and their structures confirmed by IR and mass spectrometry. The IR spectrum of intact CPD figure ( 1a ) shows that the characteristic band at 1763.58 cm-1 originating from the lactam carbonyl group was not observed in IR spectra of both acid and alkaline degradation products figures ( 1b & 1c ), respectively which indicates the opening of ß- lactam ring upon degradation. The absorption band at 1678.73 cm-1 corresponding to carbonyl group of ester in intact CPD was disappeared in both acid and alkaline degradation products IR spectra which refer to the ester hydrolysis of cefpodoxime proxetil prodrug releasing cefpodoxime. The proposed structures of acid and alkaline degradation products of CPD were further confirmed by mass spectrometry where ion peaks at m/z 444 and 443 which are equivalent to molecular weights of acid and alkaline degradation products were showed at figures (2a & 2b), respectively.
Laila abdel-fattah et al. / International Journal of Pharmaceutical and Biological Research (IJPBR)
ISSN : 0976- 285X Vol 3 Issue 6 Dec 2012-Jan 2013 226

Figure (1a): IR spectrum of intact CPD
Figure (1b): IR-spectra of acid degradation product of CPD
3430
.74
3329
.5
1375
.96
1273
.75
1220
.72
1077
.05
907.
344
741.
496
561.
184
1456
.96
1535
.06
1678
.73
1763
.58
1620
.88 29
85.2
7
2938
.02
2825
.2
2359
.48
3744
.12
2930
.31
2360
.44
3415
.31 16
53.6
6
1398
.14
1215
.9 66
5.32
1
1035
.59
Laila abdel-fattah et al. / International Journal of Pharmaceutical and Biological Research (IJPBR)
ISSN : 0976- 285X Vol 3 Issue 6 Dec 2012-Jan 2013 227
Figure (1c): IR-spectra of alkaline degradation product of CPD
Figure (2a): Mass spectrum of acid degradation product of CPD
Figure (2b): Mass spectrum of alkaline degradation product of CPD
Spectrophotometric methods
Derivative spectrophotometry
Fig. 3 shows the absorption spectra corresponding to CPD with its acid and alkaline degradation products (20 μg ml-1) of each with sufficiently overlapped spectra. This overlap could be resolved by applying second derivative spectrophotometry by which CPD could be determined in presence of its acid degradation product, fig. (4a). Peak amplitudes could be measured at 261 nm (at which acid degradation product give zero value) to determine
3740
.26
1121
.4
2927
.41 23
60.4
4
2067
.32
1616
.06
3432
.67
1425
.14
625.
788
%T
Laila abdel-fattah et al. / International Journal of Pharmaceutical and Biological Research (IJPBR)
ISSN : 0976- 285X Vol 3 Issue 6 Dec 2012-Jan 2013 228

CPD in laboratory prepared mixtures of CPD and its acid degradation product. While CPD could be analyzed in presence of its alkaline degradation product by applying third derivative at 282 nm, fig. (4b). CPD could be determined in the presence of up to 80% of acid or alkaline degradation products by derivative spectrophotometry, table 1. The effect of Δλ was tested and it was found to be suitable to use Δλ = 8 for both second and third derivative.
Table 1: Results of the analysis of laboratory prepared mixtures containing different ratios of CPD with either the acid degradate or alkaline degradate by the proposed spectrophotometric methods
Recovery % of intact CPD
% Concentration Derivative
spectrophotometry First derivative of ratio
spectrophotometry Ratio subtraction
spectrophotometry Degradation
Of intact CPD
In presence of its acid degradate
In presence
of its alkaline
degradate
In presence of its acid degradate
In presence
of its alkaline
degradate
In presence
of its acid
degradate
In presence
of its alkaline
degradate
μg/ml
2D261 3D282
1DD215 1DD255
1DD243 10 36.00 100.22 97.68 100.68 98.12 100.22 98.99 100.34 20 32.00 100.20 99.34 100.19 97.89 100.69 99.73 99.48 30 28.00 98.57 100.63 100.38 98.4 100.2 98.34 99.33 40 24.00 98.25 100.23 100.64 98.61 100.27 100.36 100.36 50 20.00 100.04 100.88 99.84 98.63 99.56 99.74 100.23 60 16.00 99.94 101.40 100.09 99.36 99.81 100.97 99.52 70 12.00 99.78 101.27 100.31 101.50 99.15 100.14 100.97 80 8.00 99.44 99.19 100.76 105.81* 97.5 100.65 100.33 90 4.00 114.73* 122.47* 121.28 * 122.93* 100.84 98.71 100.08
Mean 99.56 100.03 100.36 98.93 99.8 99.74 100.07
S.D. 0.75 1.27 0.32 1.23 1.00 0.90 0.53
R.S.D.% 0.76 1.27 0.32 1.24 1.00 0.90 0.53
* Rejected values
Laila abdel-fattah et al. / International Journal of Pharmaceutical and Biological Research (IJPBR)
ISSN : 0976- 285X Vol 3 Issue 6 Dec 2012-Jan 2013 229

Figure 3: Absorption spectra of CPD (__), acid degradate (- - -) and alkaline degradate (….), 20 μg ml-1 for each.
-2
-1.5
-1
-0.5
0
0.5
1
1.5
2
200 250 300 350 400
Wavelength (nm)
Pea
k am
plitu
de
Figure 4a: Second derivative of CPD (___) and acid degradate (…..) spectra, 20 μg ml-1 for each
261 nm
Laila abdel-fattah et al. / International Journal of Pharmaceutical and Biological Research (IJPBR)
ISSN : 0976- 285X Vol 3 Issue 6 Dec 2012-Jan 2013 230

-1.5
-0.5
0.5
1.5
2.5
200 250 300 350 400
Wavelength (nm)
Pea
k am
plitu
de.
Figure 4b: Third derivative of CPD (___) and alkaline degradate (…..) spectra, 20 μg ml-1 for each.
The first derivative ratio spectrophotometric method (1DD)
Fig. (5a) shows the ratio spectra of laboratory prepared mixtures of CPD and its acid degradation product (spectra divided by the standard spectrum of a 40 μg ml-1 of acid degradation product then first derivative was applied). Peak amplitudes at 215 nm and 255 nm were proportional to CPD concentration and it could be determined in the presence of its acid degradation product in binary mixture up to 80% and 70% of acid degradation product at 215nm and 255 nm, respectively, table 1. Peak amplitudes at 300 nm did not give satisfactory results.
-5
-3
-1
1
3
5
7
200 250 300 350
Wavelength (nm)
Pea
k A
mp
litu
de
Figure 5a: First derivative of ratio spectra of laboratory prepared mixtures of CPD ( 4-36 μg ml-1 ) and its acid degradate ( 36-4 μg ml-1 )
using 40 μg ml-1 of acid degradate as divisor.
Fig. (5b) shows the first derivative of ratio spectra of laboratory prepared mixtures of CPD and its alkaline degradation product (using 40 μg ml-1 of alkaline degradation product as divisor). Peak amplitudes at 243 nm were proportional to CPD concentration and it could be determined in the presence of alkaline degradation product in binary mixture up to 90% of alkaline degradation product, table 1. Peak amplitude at 295 nm did not give satisfactory results. The ratio spectra derivative method permits the use of different concentrations of degradation products as divisor to obtain different calibration graphs. For selecting the suitable divisor, concentrations of both
282 nm
255 nm
215 nm
Laila abdel-fattah et al. / International Journal of Pharmaceutical and Biological Research (IJPBR)
ISSN : 0976- 285X Vol 3 Issue 6 Dec 2012-Jan 2013 231

degradation products in range 4-40 μg ml-1 were tested. A concentration of 40 μg ml-1 of acid and alkaline degradation products as divisors gave highest correlation coefficient values, being an indication of quality of fitting the data to straight line. The influence of Δλ for the first derivative spectra was also tested. It was found to be suitable to use the value of Δλ = 4 nm.
-8
-6
-4
-2
0
2
4
6
8
200 250 300 350
Wavelength (nm)
Pea
k a
mp
litu
de
Figure 5b: First derivative of ratio spectra of laboratory prepared mixtures of CPD ( 4-36 μg ml-1 ) and its alkaline degradate ( 36- 4 μg ml-1
) using 40 μg ml-1 of alkaline degradate as divisor.
Ratio subtraction spectrophotometry
The theory of ratio subtraction method [17] depends on that the method was applied for determination of mixtures of drug (X) and its degradate (Y) where the spectrum of the degradate is extended than the other, as shown in (Fig. 3). The determination of CPD could be achieved by scanning the zero order absorption spectra of the laboratory-prepared mixtures, then dividing them by a carefully chosen concentration of standard degradation product to produce a new ratio spectra that represents X/Y + constant, as shown in Fig. (6a, 6d); then, subtraction of the absorbance values of these constants in plateau as shown in Fig. (6b, 6e) followed by multiplication of the obtained spectra by the divisor as shown in Fig.(6c, 6f); finally, the original spectra of CPD, which are used for direct determination of CPD at 232 nm, could be obtained and the concentration from the corresponding regression equation could be calculated. This can be summarized as follows:
= + = + constant (1)
+ constant _ constant = (2)
× Y' = X (3)
243 nm
Laila abdel-fattah et al. / International Journal of Pharmaceutical and Biological Research (IJPBR)
ISSN : 0976- 285X Vol 3 Issue 6 Dec 2012-Jan 2013 232

Figure 6a: Division spectra of laboratory prepared mixtures of CPD (X) and its acid degradate (Y), using 20 μg ml-1 of acid degraded (Y’)
as divisor.
Figure 6b: Division spectra of laboratory prepared mixtures of CPD (X) and its acid degradate (Y), using 20 μg ml-1 of acid degraded (Y’) as
divisor, after subtraction of the constant.
A (
X+
Y)/
Y'
Wavelength (nm)
Wavelength (nm)
A [
(X/Y
') -
con
stan
t
Laila abdel-fattah et al. / International Journal of Pharmaceutical and Biological Research (IJPBR)
ISSN : 0976- 285X Vol 3 Issue 6 Dec 2012-Jan 2013 233

Figure 6c: Zero order absorption spectra of CPD obtained by the proposed method for the analysis of laboratory prepared mixtures of CPD and its acid degradate after multiplication by the divisor Y’ (20 μg ml-1 of acid degraded).
Figure 6d: Division spectra of laboratory prepared mixtures of CPD (X) and its alkaline degradate (Y), using 20 μg ml-1 of alkaline
degradate (Y’) as divisor.
Wavelength (nm)
Wavelength (nm)
A(X
/Y'x
Y')
A
(X
+Y
)/Y
'
Laila abdel-fattah et al. / International Journal of Pharmaceutical and Biological Research (IJPBR)
ISSN : 0976- 285X Vol 3 Issue 6 Dec 2012-Jan 2013 234

Figure 6e: Division spectra of laboratory prepared mixtures of CPD (X) and its alkaline degradate (Y), using 20 μg ml-1 of alkaline
degradate (Y’) as divisor, after subtraction of the constant.
Figure 6f: Zero order absorption spectra of CPD obtained by the proposed method for the analysis of l aboratory prepared mixtures of
CPD and its alkaline degradate after multiplication by the divisor Y’ (20 μg ml-1 of alkaline degradate).
The constant can be determined directly from the curve by the straight line which is parallel to the wavelength axis in the region where the degradate is extended. The correct choice of the divisor is fundamental, as, if the concentration of the divisor increases or decreases, the resulting constant value will be proportionally decreased or increased. A linear correlation was obtained between the absorbance and the corresponding concentration of CPD at its corresponding wavelength. Fig. (6a) shows ratio spectra of laboratory prepared mixtures of CPD and its acid degradation product (spectra divided by carefully chosen the standard spectrum of a 20 μg ml-1 of acid degradation product). These spectra gave plateau at region 355-370 nm, the values at this region is subtracted figure (6b), the obtained spectra were then multiplied by the spectrum of divisor, figure (6c). CPD could be determined at 232 nm in the presence of acid degradation product in binary mixture up to 90% of acid degradation product, table 1 Also spectra of laboratory prepared mixtures of CPD and its alkaline degradation product (spectra divided by carefully chosen standard spectrum of 20 μg ml-1 of alkaline degradation product) were shown in figure (6d). These spectra gave plateau at region 345-368 nm, the values at this region is subtracted, figure (6e). The
Wavelength (nm)
Wavelength (nm)
A [
(X/Y
') –
con
stan
t ]
A(X
/Y'x
Y')
Laila abdel-fattah et al. / International Journal of Pharmaceutical and Biological Research (IJPBR)
ISSN : 0976- 285X Vol 3 Issue 6 Dec 2012-Jan 2013 235
obtained spectra were then multiplied by the spectrum of divisor, figure (6f). CPD could be determined at 232 nm in the presence of alkaline degradation product in binary mixture up to 90% of alkaline degradation product, table 1
HPLC method
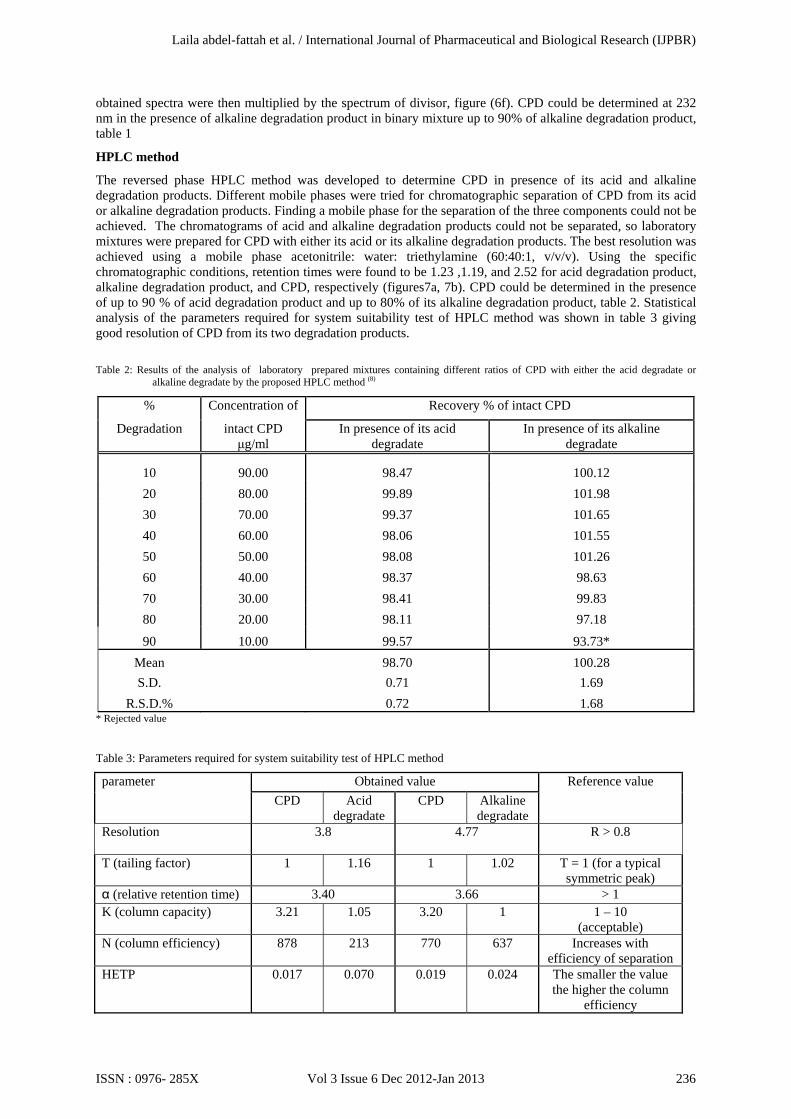
The reversed phase HPLC method was developed to determine CPD in presence of its acid and alkaline degradation products. Different mobile phases were tried for chromatographic separation of CPD from its acid or alkaline degradation products. Finding a mobile phase for the separation of the three components could not be achieved. The chromatograms of acid and alkaline degradation products could not be separated, so laboratory mixtures were prepared for CPD with either its acid or its alkaline degradation products. The best resolution was achieved using a mobile phase acetonitrile: water: triethylamine (60:40:1, v/v/v). Using the specific chromatographic conditions, retention times were found to be 1.23 ,1.19, and 2.52 for acid degradation product, alkaline degradation product, and CPD, respectively (figures7a, 7b). CPD could be determined in the presence of up to 90 % of acid degradation product and up to 80% of its alkaline degradation product, table 2. Statistical analysis of the parameters required for system suitability test of HPLC method was shown in table 3 giving good resolution of CPD from its two degradation products.
Table 2: Results of the analysis of laboratory prepared mixtures containing different ratios of CPD with either the acid degradate or alkaline degradate by the proposed HPLC method (8)
% Concentration of Recovery % of intact CPD
Degradation intact CPD μg/ml
In presence of its acid degradate
In presence of its alkaline degradate
10 90.00 98.47 100.12
20 80.00 99.89 101.98
30 70.00 99.37 101.65
40 60.00 98.06 101.55
50 50.00 98.08 101.26
60 40.00 98.37 98.63
70 30.00 98.41 99.83
80 20.00 98.11 97.18
90 10.00 99.57 93.73*
Mean 98.70 100.28
S.D. 0.71 1.69
R.S.D.% 0.72 1.68 * Rejected value
Table 3: Parameters required for system suitability test of HPLC method
parameter Obtained value Reference value
CPD Acid degradate
CPD Alkaline degradate
Resolution
3.8 4.77 R > 0.8
T (tailing factor) 1 1.16 1 1.02 T = 1 (for a typical symmetric peak)
α (relative retention time) 3.40 3.66 > 1 K (column capacity) 3.21 1.05 3.20 1 1 – 10
(acceptable) N (column efficiency) 878 213 770 637 Increases with
efficiency of separation HETP 0.017 0.070 0.019 0.024 The smaller the value
the higher the column efficiency
Laila abdel-fattah et al. / International Journal of Pharmaceutical and Biological Research (IJPBR)
ISSN : 0976- 285X Vol 3 Issue 6 Dec 2012-Jan 2013 236

Figure 7a: HPLC chromatograms of a mixture of acid degradate of CPD (1) and CPD (2), [50 μg ml-1] for each.
Figure 7b: HPLC chromatograms of a mixture of alkaline degradate of CPD (1) and CPD (2), [50 μg ml-1] for each.
(1)
(2)
(1) (2)
Laila abdel-fattah et al. / International Journal of Pharmaceutical and Biological Research (IJPBR)
ISSN : 0976- 285X Vol 3 Issue 6 Dec 2012-Jan 2013 237

Table 4. Assay validation of the proposed methods for the determination of CPD
Parameter Derivative
spectrophotometry First derivative of ratio spectrophotometry Ratio subtraction
spectrophotometry HPLC
2D261 3D282
1DD215 1DD255
1DD243
Accuracy 99.97 99.93 99.96 99.91 100.83 99.89 ± 0.88 100.16
(Mean ± S.D.) ± 0.34 ± 0.46 ± 0.54 ± 0.76 ± 0.38 ± 0.83
Precision
Repeatability a
0.27 0.16 0.23 1.02 0.32 1.11 0.18
Intermediate precision b
0.54 0.75 0.57 0.86 0.51 0.85 1.05
Linearity range μg/ml
4.00 - 40.00 μg/ml 3.00 – 100.00 μg/ml
Regression equation
A = 0.0224C + 0.0118
A =.0415C - 0.0007
A = 0.043C - 0.0586
A = 0.1776 C - 0.0933
A = 0.2177 C + 0.0073
A= 0.029 C + 0.0015
A= 0.0188 C + 0.0439
Correlation coefficient
1 0.9999 0.9999 0.9999 0.9999 0.9999 1
SE of intercept 0.0011 0.0027 0.0042 0.023 0.0168 0.0031 0.0028
SD of intercept 0.0035 0.0085 0.0133 0.073 0.0532 0.0098 0.0188
LOD μg/ml 0.23 0.3 0.45 0.59 0.36 0.49 0.49
LOQ μg/ml 0.68 0.89 1.35 1.79 1.07 1.48 1.46 a The intraday (n = 3), average of (8, 20, 32 μg ml-1) of CPD by the proposed methods. b The interday (n = 3), average of (16, 24, 36 μg ml-1) of CPD by the proposed methods.
Assay validation of the four proposed methods and statistical analysis of regression equations were reported in table 4. The proposed methods were also applied for the determination of CPD in its dosage forms and the results obtained were shown in table 5. The proposed methods was compared statistically with the official method [8] (HPLC method using 0.02 M ammonium acetate: acetonitrile (6: 4, v/v) as mobile phase) and no significant difference was obtained as shown in table 6 Table 5: Determination of CPD in pharmaceutical formulations and application of standard addition technique
Derivative
spectrophotometry First derivative of ratio spectrophotometry Ratio subtraction HPLC
2D261 3D282
1DD215 1DD255
1DD243 spectrophotometry Orelox tablet
104.97 ± 0.98
103.66 ± 1.66
103.43 ± 0.21
100.06 ± 0.89
103.87 ± 0.66 102.05 ± 1.74
101.82 ± 1.68
Standard addition
technique mean ± SD
100.25 ± 0.67
99.88 ± 0.57
100.71 ± 0.30
100.72 ± 0.78
100.55 ± 0.71
100.49 ± 0.38 100.06 ± 0.96
Orelox suspension
107.20 ± 0.16
108.48 ± 0.11
107.19 ± 0.88
108.86 ± 0.63
107.55 ± 0.57
108.51 ± 0.66 101.69 ± 0.15
Standard addition
technique mean ± SD
99.95 ± 0.66
100.06 ± 0.39
100.25 ± 0.32
100.17 ± 0.84
100.68 ± 0.42
99.88 ± 0.94 100.05 ± 0.79
Laila abdel-fattah et al. / International Journal of Pharmaceutical and Biological Research (IJPBR)
ISSN : 0976- 285X Vol 3 Issue 6 Dec 2012-Jan 2013 238

Table 6: Statistical analysis of the results obtained by the proposed methods and the official method (8)
Parameter Derivative spectrophotometry
First derivative of ratio spectrophotometry
Ratio subtraction spectrophotometry
HPLC Official method (8) *
2D261 3D282
1DD215 1DD255
1DD243
Mean 100.12 100.26 100.66 99.56 100.54 99.93 99.80 100.22
S.D. 1.06 0.73 0.91 0.97 0.79 0.76 0.77 1.19
n 6 6 6 6 6 6 8 5
Variance 1.13 0.53 0.83 1.13 0.65 0.58 0.59 1.43 F value 1.26
(5.05) 2.66
(5.05) 1.71
(5.05) 1.50
(5.05) 2.27
(5.05) 2.45
(5.05) 2.39
(3.97)
Student's t-test
0.148 (2.262)
0.069 (2.262)
0.696 (2.262)
1.016 (2.262)
0.618 (2.262)
0.095 (2.262)
0.910 (2.179)
The values between parenthesis are the corresponding theoretical values of t and F at (P = 0.05) * Official method is HPLC method using 0.02 M ammonium acetate: acetonitrile (6: 4, v/v) as mobile phase
Conclusion
Four methods were presented for the analysis of CPD in pure powder and in pharmaceutical formulations and could determine CPD in the presence of its acid and alkaline degradation products. The suggested methods are simple, fast and can be used in routine and quality control analysis of intact CPD in raw material and pharmaceutical formulations without interference of degradation products or excipients.
REFERENCES
[1] Chocas EC, Paap CM, Godley PJ; Ann Pharmacother (1993), 27(11):1369–1377. [2] Fulton B, Perry CM; Pediatr Drugs (2001), 3(2):137–158. [3] Srinivasa R. Y., Chowdary K. P.and Seshagiri R. N ; Chemical Analysis (Warsaw), 2004, 49 (1), 111-116. [4] Seshagiri R, Reddy, M. N., Srinivasa R. Y. and Murthy, T. K.; Indian Drugs, 2001, 38 (8), 439-441. [5] El Walily, A. F. M., Gazy, A. A. K., Belal, S. F. and Khamis, E. F.; Spectroscopy Letters, 2000, 33 (6), 931-948. [6] Rao J. V., Rao, M. R. P., Nagini, N.and Prabhakar, G; Indian Drugs, 2000, 37 (5), 255-256. [7] El-Walily, A. F. M., Gazy, A. A., Belal, S. F.and Khamis, E. F; Journal of Pharmaceutical and Biomedical Analysis, 2000, 22 (2),
385-392. [8] The U.S.Pharmacopoeia, 30th edition, U.S.Pharmacopeial Convention, Rockville, MD, (2007), 1673-1675. [9] Thomas, A. B., Dighe, S. B., Nanda, R. K., Kothapalli, L. P., Jagdale, S. N. And Deshpande A. D; Journal of Liquid Chromatography
& Related Technologies, 2010, 33 (17-20), 1689-1703. [10] Date, A. A. and Nagarsenker, M. S.; Chromatographia, 2007, 66 (11/12), 905-908. [11] Zou, W. B., Xue, J. and Hu, C. Q; Chromatographia, 2007, 65 (1-2), 69-75. [12] Kakumanu, V. K., Arora, V. K. and Bansal, A. K.; Journal of Chromatography B, 2006, 835 (1-2), 16-20. [13] Aleksic, M., Ilic, M.and Kapetanovic; Journal of Pharmaceutical and Biomedical Analysis, 2004, 36 (4), 899-903. [14] Reddy T. M., Sreedhar, M. and Reddy, S. J; Journal of Pharmaceutical and Biomedical Analysis, 2003, 31 (4), 811-818. [15] Koda S., Kitamura S., Miyamae A, Yasuda T., and Morimoto Y.; Int. J. Pharm., 1990 59, 217. [16] Koda S., Namiki Y., Tanabe T., Kobayashi T., Tanabe J., Okimora Y. and Morimoto Y; J. Pharm. Sci., 1987, 76, 208. [17] El-Bardicy M.G., Lotfy H.M., El-sayed M.A. and El-Tarras M.F.; J. AOAC Int., 2008, 91 (2), 299.
Laila abdel-fattah et al. / International Journal of Pharmaceutical and Biological Research (IJPBR)
ISSN : 0976- 285X Vol 3 Issue 6 Dec 2012-Jan 2013 239