STA215 INFERENCE ABOUT POPULATION MEANS
47
STA215 INFERENCE ABOUT POPULATION MEANS Al Nosedal. University of Toronto. Summer 2017 June 22, 2017 Al Nosedal. University of Toronto. Summer 2017 STA215 INFERENCE ABOUT POPULATION MEANS
Transcript of STA215 INFERENCE ABOUT POPULATION MEANS

STA215INFERENCE ABOUT POPULATION MEANS
Al Nosedal.University of Toronto.
Summer 2017
June 22, 2017
Al Nosedal. University of Toronto. Summer 2017 STA215 INFERENCE ABOUT POPULATION MEANS

INFERENCE ABOUT A POPULATION MEAN.
Al Nosedal. University of Toronto. Summer 2017 STA215 INFERENCE ABOUT POPULATION MEANS

Conditions for Inference about mean
We can regard our data as a simple random sample (SRS)from the population. This condition is very important.
Observations from the population have a Normal distributionwith mean µ and standard deviation σ. In practice, it isenough that the distribution be symmetric and single-peakedunless the sample is very small. Both µ and σ are unknownparameters.
Al Nosedal. University of Toronto. Summer 2017 STA215 INFERENCE ABOUT POPULATION MEANS

Standard Error
When the standard deviation of a statistic is estimated from data,the result is called the standard error of the statistic. The standarderror of the sample mean x̄ is s√
n.
Al Nosedal. University of Toronto. Summer 2017 STA215 INFERENCE ABOUT POPULATION MEANS

Travel time to work
A study of commuting times reports the travel times to work of arandom sample of 1000 employed adults. The mean is x̄ = 49.2minutes and the standard deviation is s = 63.9 minutes. What isthe standard error of the mean?
Al Nosedal. University of Toronto. Summer 2017 STA215 INFERENCE ABOUT POPULATION MEANS

Solution
The standard error of the mean is
s√n
=63.9√10000
= 2.0207 minutes
Al Nosedal. University of Toronto. Summer 2017 STA215 INFERENCE ABOUT POPULATION MEANS

The one-sample t statistic and the t distributions
Draw an SRS of size n from a large population that has theNormal distribution with mean µ and standard deviation σ. Theone-sample t statistic
t∗ =x̄ − µs/√n
has the t distribution with n − 1 degrees of freedom.
Al Nosedal. University of Toronto. Summer 2017 STA215 INFERENCE ABOUT POPULATION MEANS

The t distributions
The density curves of the t distributions are similar in shapeto the Standard Normal curve. They are symmetric about 0,single-peaked, and bell-shaped.
The spread of the t distributions is a bit greater than of theStandard Normal distribution. The t distributions have moreprobability in the tails and less in the center than does theStandard Normal. This is true because substituting theestimate s for the fixed parameter σ introduces more variationinto the statistic.
As the degrees of freedom increase, the t density curveapproaches the N(0, 1) curve ever more closely. This happensbecause s estimates σ more accurately as the sample sizeincreases. So using s in place of σ causes little extra variationwhen the sample is large.
Al Nosedal. University of Toronto. Summer 2017 STA215 INFERENCE ABOUT POPULATION MEANS

Density curves
-4 -2 0 2 4
0.0
0.1
0.2
0.3
0.4
Std. Normalt(2)t(9)
Al Nosedal. University of Toronto. Summer 2017 STA215 INFERENCE ABOUT POPULATION MEANS

Density curves
-4 -2 0 2 4
0.00.1
0.20.3
0.4
Std. Normalt(29)
Al Nosedal. University of Toronto. Summer 2017 STA215 INFERENCE ABOUT POPULATION MEANS

Density curves
-4 -2 0 2 4
0.00.1
0.20.3
0.4
Std. Normalt(49)
Al Nosedal. University of Toronto. Summer 2017 STA215 INFERENCE ABOUT POPULATION MEANS

Critical values
Use Table C or software to finda) the critical value for a one-sided test with level α = 0.05 basedon the t(4) distribution.b) the critical value for 98% confidence interval based on the t(26)distribution.
Al Nosedal. University of Toronto. Summer 2017 STA215 INFERENCE ABOUT POPULATION MEANS

Solution
a) t∗ = 2.132b) t∗ = 2.479
Al Nosedal. University of Toronto. Summer 2017 STA215 INFERENCE ABOUT POPULATION MEANS

More critical values
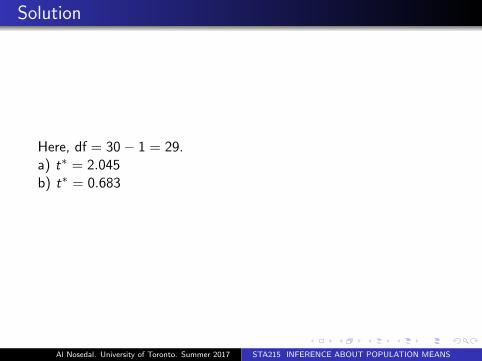
You have an SRS of size 30 and calculate the one-samplet-statistic. What is the critical value t∗ such thata) t has probability 0.025 to the right of t∗?b) t has probability 0.75 to the left of of t∗?
Al Nosedal. University of Toronto. Summer 2017 STA215 INFERENCE ABOUT POPULATION MEANS
Solution
Here, df = 30− 1 = 29.a) t∗ = 2.045b) t∗ = 0.683
Al Nosedal. University of Toronto. Summer 2017 STA215 INFERENCE ABOUT POPULATION MEANS

The one-sample t confidence interval
Draw an SRS of size n from a large population having unknownmean µ. A level C confidence interval for µ is
x̄ ± t∗s√n
where t∗ is the critical value for the t(n − 1) density curve witharea C between −t∗ and t∗. This interval is exact when thepopulation distribution is Normal and is approximately correct forlarge n in other cases.
Al Nosedal. University of Toronto. Summer 2017 STA215 INFERENCE ABOUT POPULATION MEANS

Critical values
What critical value t∗ from Table C would you use for a confidenceinterval for the mean of the population in each of the followingsituations?a) A 95% confidence interval based on n = 12 observations.b) A 99% confidence interval from an SRS of 18 observations.c) A 90% confidence interval from a sample of size 6.
Al Nosedal. University of Toronto. Summer 2017 STA215 INFERENCE ABOUT POPULATION MEANS

Solution
a) df = 12− 1 = 11, so t∗ = 2.201.b) df = 18− 1 = 17, so t∗ = 2.898.c) df = 6− 1 = 5, so t∗ = 2.015.
Al Nosedal. University of Toronto. Summer 2017 STA215 INFERENCE ABOUT POPULATION MEANS

Example: Ancient air
The composition of the earth’s atmosphere may have changed overtime. To try to discover the nature of the atmosphere long ago, wecan examine the gas in bubbles inside ancient amber. Amber istree resin that has hardened and been trapped in rocks. The gas inbubbles within amber should be a sample of the atmosphere at thetime the amber was formed. Measurements on specimens of amberfrom the late Cretaceous era (75 to 95 million years ago) givethese percents of nitrogen:63.4 65 64.4 63.3 54.8 64.5 60.8 49.1 51.0Assume (this is not yet agreed on by experts) that theseobservations are an SRS from the late Cretaceous atmosphere. Usea 90% confidence interval to estimate the mean percent ofnitrogen in ancient air (Our present-day atmosphere is about78.1% nitrogen).
Al Nosedal. University of Toronto. Summer 2017 STA215 INFERENCE ABOUT POPULATION MEANS

Solution
µ = mean percent of nitrogen in ancient air. We will estimate µwith a 90% confidence interval.With x̄ = 59.5888, s = 6.2552, and t∗ = 1.860 (df = 9− 1 = 8),the 90% confidence interval for µ is
59.5888± 1.860
(6.2552√
9
)59.5888± 3.8782
55.7106 to 63.4670
Al Nosedal. University of Toronto. Summer 2017 STA215 INFERENCE ABOUT POPULATION MEANS

# Step 1. Entering data;
nitrogen=c(63.4 ,65,64.4,63.3,54.8,
64.5,60.8,49.1,51.0);
# Step 2. Constructing CI;
t.test(nitrogen,conf.level=0.90);
Al Nosedal. University of Toronto. Summer 2017 STA215 INFERENCE ABOUT POPULATION MEANS

##
## One Sample t-test
##
## data: nitrogen
## t = 28.5785, df = 8, p-value = 2.43e-09
## alternative hypothesis: true mean is not equal to 0
## 90 percent confidence interval:
## 55.71155 63.46622
## sample estimates:
## mean of x
## 59.58889
Al Nosedal. University of Toronto. Summer 2017 STA215 INFERENCE ABOUT POPULATION MEANS

Example
The following sample data are from a normal population: 10, 8,12, 15, 13, 11, 6, 5.a. What is the point estimate of the population mean?b. What is the point estimate of the population standarddeviation?c. With 95 % confidence, what is the margin of error for theestimation of the population mean?d. What is the 95 % confidence interval for the population mean?
Al Nosedal. University of Toronto. Summer 2017 STA215 INFERENCE ABOUT POPULATION MEANS

Solution
a. x̄ = 10.b. s = 3.4641.c. margin of error = t∗
s√n
= 2.365( 3.4641√8
) = 2.8965.
d. (x̄ − t∗(s√n
), x̄ + t∗(s√n
))
(7.1039, 12.896).
Al Nosedal. University of Toronto. Summer 2017 STA215 INFERENCE ABOUT POPULATION MEANS

R Code
# Step 1. Entering data;
dataset=c(10, 8, 12, 15, 13, 11, 6, 5);
# Step 2. Finding CI;
t.test(dataset);
Al Nosedal. University of Toronto. Summer 2017 STA215 INFERENCE ABOUT POPULATION MEANS

R Code
##
## One Sample t-test
##
## data: dataset
## t = 8.165, df = 7, p-value = 7.999e-05
## alternative hypothesis: true mean is not equal to 0
## 95 percent confidence interval:
## 7.103939 12.896061
## sample estimates:
## mean of x
## 10
Al Nosedal. University of Toronto. Summer 2017 STA215 INFERENCE ABOUT POPULATION MEANS

Example
A simple random sample with n = 54 provided a sample mean of22.5 and a sample standard deviation of 4.4.a. Develop a 90% confidence interval for the population mean.b. Develop a 95% confidence interval for the population mean.c. Develop a 99% confidence interval for the population mean.
Al Nosedal. University of Toronto. Summer 2017 STA215 INFERENCE ABOUT POPULATION MEANS

Solution
a. (x̄ − t∗(s√n
), x̄ + t∗(s√n
))
(22.5− 1.676( 4.4√54
), 22.5 + 1.676( 4.4√54
))
(21.496, 23.503).b. (22.5− 2.009( 4.4√
54), 22.5 + 2.009( 4.4√
54))
(21.297, 23.703).c. (22.5− 2.678( 4.4√
54), 22.5 + 2.678( 4.4√
54))
(20.896, 24.103).
Al Nosedal. University of Toronto. Summer 2017 STA215 INFERENCE ABOUT POPULATION MEANS

The one-sample t test
Draw an SRS of size n from a large population having unknownmean µ. To test the hypothesis H0 : µ = µ0, compute theone-sample t statistic
t∗ =x̄ − µ0
s/√n
In terms of a variable T having the t(n − 1) distribution, theP-value for a test of H0 againstHa : µ > µ0 is P(T ≥ t∗).Ha : µ < µ0 is P(T ≤ t∗).Ha : µ 6= µ0 is 2P(T ≥ |t∗|).These P-values are exact if the population distribution is Normaland are approximately correct for large n in other cases.
Al Nosedal. University of Toronto. Summer 2017 STA215 INFERENCE ABOUT POPULATION MEANS

Is it significant?
The one-sample t statistic for testingH0 : µ = 0Ha : µ > 0from a sample of n = 20 observations has the value t∗ = 1.84.a) What are the degrees of freedom for this statistic?b) Give the two critical values t from Table C that bracket t∗.What are the one-sided P-values for these two entries?c) Is the value t∗ = 1.84 significant at the 5% level? Is itsignificant at the 1% level?d) (Optional) If you have access to suitable technology, give theexact one-sided P-value for t∗ = 1.84?
Al Nosedal. University of Toronto. Summer 2017 STA215 INFERENCE ABOUT POPULATION MEANS

Solution
a) df = 20 -1 = 19.b) t∗ = 1.84 is bracketed by t = 1.729 (with right-tail probability0.05) and t = 2.093 (with right-tail probability 0.025). Hence,because this is a one-sided significance test,0.025 < P-value < 0.05.c) This test is significant at the 5% level because theP-value < 0.05. It is not significant at the 1% level because theP-value > 0.01.
Al Nosedal. University of Toronto. Summer 2017 STA215 INFERENCE ABOUT POPULATION MEANS

Solution d)
1 - pt(1.84,df=19);
## [1] 0.04072234
# pt gives you the area to the left of 1.84
# for a T distribution with df =19;
Al Nosedal. University of Toronto. Summer 2017 STA215 INFERENCE ABOUT POPULATION MEANS

Is it significant?
The one-sample t statistic from a sample of n = 15 observationsfor the two-sided test ofH0 : µ = 64Ha : µ 6= 64has the value t∗ = 2.12.a) What are the degrees of freedom for t∗?b) Locate the two-critical values t from Table C that bracket t∗.What are the two-sided P-values for these two entries?c) is the value t∗ = 2.12 statistically significant at the 10% level?At the 5% level?d) (Optional) If you have access to suitable technology, give theexact two-sided P-value for t∗ = 2.12.
Al Nosedal. University of Toronto. Summer 2017 STA215 INFERENCE ABOUT POPULATION MEANS

Solution
a) df = 15 -1 = 14.b) t∗ = 2.12 is bracketed by t = 1.761 (with two-tail probability0.10) and t = 2.145 (with two-tail probability 0.05). Hence,because this is a two-sided significance test, 0.05 < P-value < 0.10.c) This test is significant at the 10% level because theP-value < 0.10. It is not significant at the 5% level because theP-value > 0.05.
Al Nosedal. University of Toronto. Summer 2017 STA215 INFERENCE ABOUT POPULATION MEANS

Solution d)
2*(1 - pt(2.12,df=14));
## [1] 0.05235683
# pt gives you the area to the left of 2.12
# for a T distribution with df =12;
Al Nosedal. University of Toronto. Summer 2017 STA215 INFERENCE ABOUT POPULATION MEANS

Example
H0 : µ = 12Ha : µ > 12A sample of 25 provided a sample mean x̄ = 14 and a samplestandard deviation s = 4.32.a. Compute the value of the test statistic.b. Use the t distribution table to compute a range for the p-value.c. At α = 0.05, what is your conclusion?
Al Nosedal. University of Toronto. Summer 2017 STA215 INFERENCE ABOUT POPULATION MEANS
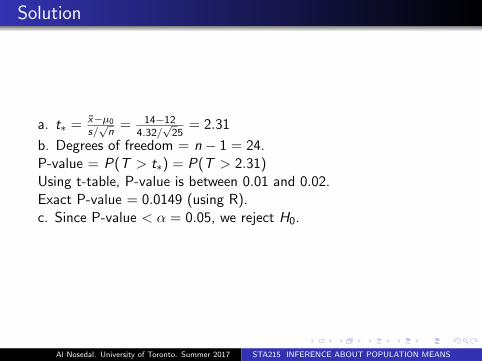
Solution
a. t∗ = x̄−µ0
s/√n
= 14−124.32/
√25
= 2.31
b. Degrees of freedom = n − 1 = 24.P-value = P(T > t∗) = P(T > 2.31)Using t-table, P-value is between 0.01 and 0.02.Exact P-value = 0.0149 (using R).c. Since P-value < α = 0.05, we reject H0.
Al Nosedal. University of Toronto. Summer 2017 STA215 INFERENCE ABOUT POPULATION MEANS

Example
H0 : µ = 18Ha : µ 6= 18A sample of 48 provided a sample mean x̄ = 17 and a samplestandard deviation s = 4.5.a. Compute the value of the test statistic.b. Use the t distribution table to compute a range for the p-value.c. At α = 0.05, what is your conclusion?
Al Nosedal. University of Toronto. Summer 2017 STA215 INFERENCE ABOUT POPULATION MEANS

Solution
a. t∗ = x̄−µ0
s/√n
= 17−184.5/√
48= −1.54
b. Degrees of freedom = n − 1 = 47.P-value = 2P(T > |t∗|) = 2P(T > | − 1.54|) = 2P(T > 1.54)Using t-table, P-value is between 0.10 and 0.20.Exact P-value = 0.1303 (using R).c. Since P-value > α = 0.05, we CAN’T reject H0.
Al Nosedal. University of Toronto. Summer 2017 STA215 INFERENCE ABOUT POPULATION MEANS

Ancient air, continued
Do the data of our Example (see above) give good reason to thinkthat the percent of nitrogen in the air during the Cretaceous erawas different from the present 78.1%? Carry out a test ofsignificance at the 5% significance level.
Al Nosedal. University of Toronto. Summer 2017 STA215 INFERENCE ABOUT POPULATION MEANS

Solution
Is there evidence that the percent of nitrogen in ancient air wasdifferent from the present 78.1%?1. State hypotheses. H0 : µ = 78.1% vs Ha : µ 6= 78.1%.2. Test statistic. t∗ = x̄−µ0
σ/√n
= 59.5888−78.16.2553/
√9
= −8.8778
3. P-value. For df = 8, this is beyond anything shown in Table C,so P-value < 0.001.4. Conclusion. Since P-value < 0.001, we reject H0. We have verystrong evidence that Cretaceous air is different from modern air.
Al Nosedal. University of Toronto. Summer 2017 STA215 INFERENCE ABOUT POPULATION MEANS

t.test(nitrogen,alternative="two.sided", mu=78.1);
Al Nosedal. University of Toronto. Summer 2017 STA215 INFERENCE ABOUT POPULATION MEANS

##
## One Sample t-test
##
## data: nitrogen
## t = -8.8778, df = 8, p-value = 2.049e-05
## alternative hypothesis: true mean is not equal to 78.1
## 95 percent confidence interval:
## 54.78065 64.39713
## sample estimates:
## mean of x
## 59.58889
Al Nosedal. University of Toronto. Summer 2017 STA215 INFERENCE ABOUT POPULATION MEANS

Example
The Employment and Training Administration reported the U.S.mean unemployment insurance benefit of $ 238 per week. Aresearcher in the state of Virginia anticipated that sample datawould show evidence that the mean weekly unemploymentinsurance benefit in Virginia was below the national level.a. Develop appropriate hypotheses such that rejection of H0 willsupport the researcher’s contention.b. For a sample of 100 individuals, the sample mean weeklyunemployment insurance benefit was $231 with a sample standarddeviation of $80. What is the p-value?c. At α = 0.05, what is your conclusion?.
Al Nosedal. University of Toronto. Summer 2017 STA215 INFERENCE ABOUT POPULATION MEANS

Solution
a. H0 : µ = 238 vs Ha : µ < 238.b. t∗ = x̄−µ0
s/√n
= 231−23880/√
100= −0.88
Degrees of freedom = n − 1 = 99.Using t table, P-value is between 0.10 and 0.20c. P-value > 0.05, we CAN’T reject H0. Cannot conclude meanweekly benefit in Virginia is less than the national mean.
Al Nosedal. University of Toronto. Summer 2017 STA215 INFERENCE ABOUT POPULATION MEANS

Robust Procedures
A confidence interval or significance test is called robust if theconfidence level or P-value does not change very much when theconditions for use of the procedure are violated.
Al Nosedal. University of Toronto. Summer 2017 STA215 INFERENCE ABOUT POPULATION MEANS

Using t procedures
Except in the case of small samples, the condition that thedata are an SRS from the population of interest is moreimportant than the condition that the population distributionis Normal.
Sample size less than 15: Use t procedures if the data appearclose to Normal (roughly symmetric single peak, no outliers).If the data are clearly skewed or if outliers are present, do notuse t.
Sample size at least 15: The t procedures can be used exceptin the presence of outliers or strong skewness.
Large samples: The t procedures can be used even for clearlyskewed distributions when the sample is large, roughly n ≥ 40.
Al Nosedal. University of Toronto. Summer 2017 STA215 INFERENCE ABOUT POPULATION MEANS