St. John’s University Student Managed Investment … Tree Stores stock for inclusion in the St....
24
St. John’s University Student Managed Investment Fund Highlights • Dollar Tree plans to use excess cash to improve store base, new technology and logistic measures, investments in other viable dollar store concepts, and possibly stock repurchase or dividend activity. • Dollar Tree has been transitioning its store base to a new, larger 10- 12K square feet versus 5-6K prior. The company is moving away from a smaller mall-based concept. These stores produce significantly greater sales volumes with equivalent first year returns. • The recent acquisition of Greenbacks Stores has given Dollar Tree the highest current market share in the West Coast at 44%. • Management continues to improve vendor relationships and obtain better-known and higher quality brands/products in the stores, which we believe is resulting in increased customer traffic. • Dollar Tree reported Q3 EPS of $0.31, up 15% from last year. Management also reaffirmed its previous Q4 guidance. DOLLAR TREE STORES, INC. December 2, 2003 Rating: BUY Key Statistics Price: 31.50 52-Wk. High: 39.75 52-Wk. Low: 17.40 Shares Out .(mil): 115.6 Inst. Hldgs.: 88% Avg. Volume (000): 1,561 Dividend (ann): $0.00 Book Value/Share: $8.04 Fiscal Year End: 1-Feb Keith Denninger [email protected] Brian Bauer [email protected] Eneida Lacij [email protected] Daniel Ariza [email protected] Sub-Industry: General Merchandise Stores Investment Research Equity h
-
Upload
nguyenduong -
Category
Documents
-
view
214 -
download
0
Transcript of St. John’s University Student Managed Investment … Tree Stores stock for inclusion in the St....

St. John’s University Student Managed Investment Fund
Highlights
• Dollar Tree plans to use excess cash to improve store base, new technology and logistic measures, investments in other viable dollar store concepts, and possibly stock repurchase or dividend activity.
• Dollar Tree has been transitioning its store base to a new, larger 10-12K square feet versus 5-6K prior. The company is moving away from a smaller mall-based concept. These stores produce significantly greater sales volumes with equivalent first year returns.
• The recent acquisition of Greenbacks Stores has given Dollar Tree the highest current market share in the West Coast at 44%.
• Management continues to improve vendor relationships and obtain better-known and higher quality brands/products in the stores, which we believe is resulting in increased customer traffic.
• Dollar Tree reported Q3 EPS of $0.31, up 15% from last year. Management also reaffirmed its previous Q4 guidance.
DOLLAR TREE STORES, INC.
December 2, 2003 Rating: BUY Key Statistics Price: 31.50 52-Wk. High: 39.75 52-Wk. Low: 17.40 Shares Out .(mil): 115.6 Inst. Hldgs.: 88% Avg. Volume (000): 1,561 Dividend (ann): $0.00 Book Value/Share: $8.04 Fiscal Year End: 1-Feb Keith Denninger [email protected] Brian Bauer [email protected] Eneida Lacij [email protected] Daniel Ariza [email protected]
Sub-
Indu
stry
: G
ener
al M
erch
andi
se S
tore
s
Investment Research Equity h

Please refer to the end of this report to obtain important disclosure information SMIF Investment Research December 2, 2003
Executive Summary Analysis of Dollar Tree Stores The Dollar Tree concept is one of the most profitable in retailing with an average first year new store ROI at about 100%. This provides a one-year payback of invested capital, which means the company has the ability to internally finance its own growth. Dollar Tree stock is currently undervalued at its current price of $31.50. The current stock price is below our target price of $43.28. Recommendation Based on our research and analysis, we are recommending the purchase of 300 shares at market order of Dollar Tree Stores stock for inclusion in the St. John’s University Student Managed Investment Fund portfolio. Reasons for buy recommendation
- The current stock price of $31.50 is undervalued when compared to our target price of $43.28. - Dollar Tree has been doubling the size of their stores, which is resulting in continued greater sales
volumes. - There is little downside price risk - The one year total return exceeds the S&P500 - Revenue growth is outpacing the S&P500 - Dollar tree is the largest retailer of general merchandise at the $1 fixed price point with over 2,500
stores in the United States - Management continues to improve vendor relationships and obtain better- known and higher
quality brands/products in the stores, which we believe is resulting in increased customer traffic
Company Overview
Dollar Tree Stores, Inc (NASDAQ: DLTR) is the largest single-price-point retailer in the United
States. It started as a variety store in 1953 by K. Perry, known as K& K 5&10. Later in the 70`s and 80`s the store evolved into a multi-state chain of toy stores. The first Dollar Tree Store opened in 1986 in Dalton, GA. Today, the company operates in 47 states with more than 2,400 stores under the names of Dollar Tree, Dollar Express, Dollar Bills, Only One Dollar and Only One $. Its headquarters are in Chesapeake, VA. Beginning in 2003, Dollar Tree began opening predominantly larger stores (approx. 8,000-10,000 sq. ft.). 40% of its sales come from consumables, necessities that are purchased on a fairly regular basis regardless of the economy1. This mix consists of cleaners, household goods and grocery store items. Food offerings are focused around snacks and singe-serviced conveniences such as beverages and candy. The remaining 60% of sales come from discretionary items such as candles, party goods, toys, house wares
1 DLTR Annual Report
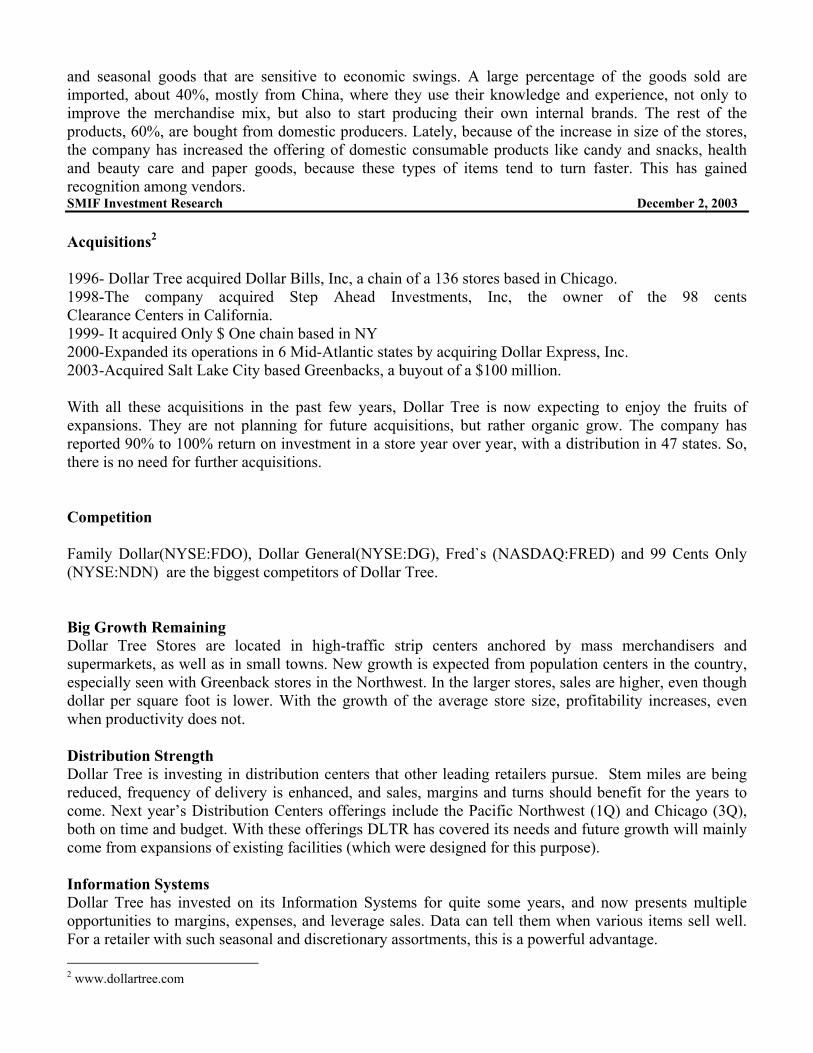
and seasonal goods that are sensitive to economic swings. A large percentage of the goods sold are imported, about 40%, mostly from China, where they use their knowledge and experience, not only to improve the merchandise mix, but also to start producing their own internal brands. The rest of the products, 60%, are bought from domestic producers. Lately, because of the increase in size of the stores, the company has increased the offering of domestic consumable products like candy and snacks, health and beauty care and paper goods, because these types of items tend to turn faster. This has gained recognition among vendors. SMIF Investment Research December 2, 2003 Acquisitions2 1996- Dollar Tree acquired Dollar Bills, Inc, a chain of a 136 stores based in Chicago. 1998-The company acquired Step Ahead Investments, Inc, the owner of the 98 cents Clearance Centers in California. 1999- It acquired Only $ One chain based in NY 2000-Expanded its operations in 6 Mid-Atlantic states by acquiring Dollar Express, Inc. 2003-Acquired Salt Lake City based Greenbacks, a buyout of a $100 million. With all these acquisitions in the past few years, Dollar Tree is now expecting to enjoy the fruits of expansions. They are not planning for future acquisitions, but rather organic grow. The company has reported 90% to 100% return on investment in a store year over year, with a distribution in 47 states. So, there is no need for further acquisitions. Competition Family Dollar(NYSE:FDO), Dollar General(NYSE:DG), Fred`s (NASDAQ:FRED) and 99 Cents Only (NYSE:NDN) are the biggest competitors of Dollar Tree. Big Growth Remaining Dollar Tree Stores are located in high-traffic strip centers anchored by mass merchandisers and supermarkets, as well as in small towns. New growth is expected from population centers in the country, especially seen with Greenback stores in the Northwest. In the larger stores, sales are higher, even though dollar per square foot is lower. With the growth of the average store size, profitability increases, even when productivity does not. Distribution Strength Dollar Tree is investing in distribution centers that other leading retailers pursue. Stem miles are being reduced, frequency of delivery is enhanced, and sales, margins and turns should benefit for the years to come. Next year’s Distribution Centers offerings include the Pacific Northwest (1Q) and Chicago (3Q), both on time and budget. With these offerings DLTR has covered its needs and future growth will mainly come from expansions of existing facilities (which were designed for this purpose). Information Systems Dollar Tree has invested on its Information Systems for quite some years, and now presents multiple opportunities to margins, expenses, and leverage sales. Data can tell them when various items sell well. For a retailer with such seasonal and discretionary assortments, this is a powerful advantage. 2 www.dollartree.com

Recovery is Sensitive3 The company is subject to consumer trends and consumer confidence. They do better in good economic times just like anyone else. But their advantage is that even though times are bad, they still do well, because the products they offer are so basic to the American family and prices are very affordable. As the economy recovers and consumers feel freer to spend, major improvements are obvious in certain SMIF Investment Research December 2, 2003 categories, for example the company expects to sell 38 million rolls of wrapping paper this year, 80 million gift bags, 26 million pairs of reading glasses, etc Michael Porter Analysis Rivalry There are many competitive forces faced by Dollar Tree, like the nearby competition from other large discount retail chains in the country, however the company likes being in a destination location where there is plenty of shopper activity. A lot of traffic is generated by Wal-Mart, but Dollar Tree stores are not 200,000-square-foot operations like they are, with the parking issues that come with an operation that size. With them, a customer is in and out in 20 minutes or less. Dollar Tree chooses to focus on one entry-level price point. And a store like Wal-Mart does not and cannot. Another way the store tries to differentiate from similar single-priced store is the bright colors and the way the items are arranged in the store. Threat of New Entrants Even though Dollar Tree is the largest discount retailer, they still face the threat of new entrants. Being in the industry that they are, there are always new little shops popping out around the corner selling bargains. However, there are several barriers to entry for such debutants: Ability to Import The regular retailers have a somewhat complicated supply chain. They're getting vendors to take the inventory risk. Discount retailers cannot do that because of the great risks involved. Instead, they import so they can offer products at a lower price. There are really no middle-people between the consumer and the manufacturer. Dollar Tree is a one Middleman shop. They go around the world to find products. If they meet their criteria and they think they can sell them, they bring them in -- and always charge a dollar. For new entrants in the industry the ability to import is almost impossible, because it runs very high costs. Economies of scale This is a golden rule of economics and very true in this industry. The bigger the company is, the better chance has for survival from all the driving forces of competition. This affects the productivity of each store, lower margins, high inventory turnover, high efficiency, and ultimately high profitability. As long as a company claims its territory in supply and distribution channels, and closeness it creates with the customers, it is very hard for new small companies to step foot. Cost of Capital Cost of Capital is one of the major barriers to entry. Investors come across important questions like how to get the money to invest, should the stores be rented or bought, how to evaluate the property, etc. Dollar 3 Business Week

Tree has done many acquisitions, which put it to a very preferable position in the industry regarding Cost of Capital. Threat of Substitute Products4 The discount stores feel less threatened from substitute products than the rest of the retailing industry. Reason for that is the nature of these products, combined with the price they are offered. Most of the SMIF Investment Research December 2, 2003 items are consumable goods, purchased by every family no matter what the income is. As a matter of fact, in the last few years, more consumers have been turning their back to large discount retailers such as Wal-Mart or Kmart and have looked for cheaper products and cheaper brands in dollar stores. Bargaining Power of Suppliers Suppliers exert power in the industry by threatening to raise prices or reduce quality. Powerful suppliers can squeeze industry profitability if firms are unable to recover cost increases. Supplier products have few substitutes, however they are not differentiated, which reduces the threat of bargaining power. Bargaining Power of Buyers5 Since Dollar Tree sells at fixed prices and has no power over price changes, they have a love affair with their customers. They use their buying power and company focus to always search for best quality and values that can be shown for the one price point. Year over year, they have been able to bring that buying power and bring forth a stronger product mix and a bigger and better store, which has translated into improvement in their sales. Recent News Latest news that affects the performance of the company’s stock: Sales increase 19.4% in the third quarter.6 Dollar Tree reported record sales for the third quarter of $665.2 million in Nov 6,2003, in-line with company guidance, and an increase of 19.4% over $556.9 million reported in last year’s fiscal third quarter. This was a result of this years Halloween falling on a Friday, which boosted up the sales. Consumer confidence is already changing and even higher sale figures are expected for the last quarter. The stores are now themed for the holidays, well-stocked with exciting seasonal product and high-value everyday basics. Record third-quarter earnings per share.7 Third quarter earnings per share were released last week on November 25, and they were much better than the earnings of the third quarter from the previous year, respectively $0.31 per share for 2003, compared with $0.27 per share for 2002. Continuing with the fourth Quarter, the company’s guidance for sales falls between $880 to $905 million, explained by the increase in the store space. Greenbacks Acquisition.8 The acquisition of Greenbacks puts Dollar Tree in a strong competitive position in the Western U.S. and opens up significant opportunity to grow market share through existing revenue and further expansion in the Western US where the discount retailers are under stored. Greenbacks is an appropriate fit for Dollar Tree with an average store size of 11,500 gross square feet, a 4 DLTR Annual Report 5 www.hoovers.com 6 Yahoo Finance 7 www.dollartree.com 8 www.hoovers.com

single price point strategy, and a similar consumable mix. With an estimated of $142 million and $160 million in years 2004 and 2005, we expect Greenbacks stores will add $0.03 to 2004 EPS and $0.04 to 2005 EPS. SMIF Investment Research December 2, 2003
Industry Analysis Overview Consumer money drives the economy, and the retail industry is where consumers spend that money. The retail industry is composed of wholesalers, distributors, manufacturers, and individual retail stores. Over the past few years, the face of the individual retail store has changed. “Mom & Pop” stores no longer have a significant presence in the industry, as they have been virtually wiped out by larger, cost-efficient retailers. Even traditional department stores have felt the pressure imposed on them by these retailing giants. These larger stores can be broken down into four separate categories: Mass merchandisers (Target, Wal Mart), category killers (Home Depot), discount clubs (Costco), and specialty retailers (Banana Republic). Mass merchandisers are retailers that provide a wide variety of products at relatively discounted prices. They provide a one-stop shop for people, allowing them to shop for clothes, household goods, and entertainment all at once. Category killers are retailers that focus on one area of the market and put all of their resources into it. Discount clubs charge a membership fee to join, but members enjoy the benefit of purchasing products, usually in bulk, for very low prices. Specialty retailers situate themselves in one part of the market, and produce high-quality products for that specific area. These retailers have changed the dynamics of the entire industry by using their economies of scale to force their smaller competitors out of business. Out of these segments, mass merchandisers and discount clubs have targeted “Middle America” as their primary customer base. Consumers recognize the value that these stores provide, and have flocked to them, indicated by their significant growth in revenue during 2001, while Federated Department Stores experienced a decline in revenue during the same period. Below is a chart of the industry’s largest mass merchandisers and discount stores: Ticker Name Market Capitalization TTM Sales $ Employees Industry Average 14,714.835 19,645.287 121859 WMT Wal-Mart Stores, Inc. 243,102.297 254,522.000 1400000 TGT Target Corporation 35,293.281 46,653.000 306000 KSS Kohl's Corporation 16,403.322 9,904.682 19000 S Sears, Roebuck & Co. 14,000.933 41,388.000 289000 WMMVY Wal-Mart de Mexico S.A. (ADR) 12,337.164 .000 92708 FD Federated Department Str. 8,973.942 15,228.000 113000 MAY The May Department Stores Company 8,556.896 13,222.000 55000 JCP J.C. Penney Company, Inc. 6,763.633 32,340.000 228000 DLTR Dollar Tree Stores, Inc. 3,650.846 2,895.077 8600

KMRT Kmart Holding Corporation 2,729.783 27,437.000 212000 SKS Saks Incorporated 2,108.879 5,927.632 29640
Source: cnnfn.com

8 | Dollar Tree Stores, Inc.
SMIF Investment Research December 2, 2003 Rise of Dollar Stores9 As consumers have focused their spending on value-driven products, retailers have taken notice. Dollar stores have been around for quite some time, but have been on the rise in recent years, creating their own niche in the retailing industry. After posting solid sales growth of 6.8 percent in 2002, which followed 2001’s sales growth of 10.9 percent, dollar stores are sustaining momentum as one of the hottest retail sectors of the decade. The growth in sales can be attributed to rapid expansion, solid same store sales gains, and increasing consumer interest in the format. These stores allow customers to purchase seasonal and everyday goods at the fixed price of $1. Dollar stores have been gaining popularity over the years. Since 1997, the percentage of households that shop in dollar stores has increased from twenty-six percent to thirty-six percent, clearly indicating that the dollar store format is on the rise. Consumers realize that these stores possess tremendous value and quality products that they can use on an everyday basis. Industry Life Cycle While the retail industry as a whole may be in the mature stage of its life cycle, the dollar sector is clearly still in its growth stage. According to Retail Forward estimates, there are enough untapped geographic locations in the U.S. to support another 15,000-dollar stores before the industry reaches maturity. This growth has been fueled by the leading companies who have been investing in their distribution networks and increasing the number of products in their stores, hoping to improve their in-store presentation, which will keep customers coming back. Not only are the retailers themselves benefiting from this growth, suppliers are as well. As more and more customers turn to dollar stores, market share is taken away from other retailers, creating a mutually beneficial opportunity for suppliers and dollar store retailers. Retailers will look to form relationships with suppliers that can provide them with quality merchandise, and suppliers will produce the highest-quality products possible at a given cost in order to maintain their business. Market Trends The retail market’s performance, more so than any other industry, coincides with the overall health of the economy. Retailers experience their most prolific gains when the economy performs well. When the economy under-performs, retail chains recognize the recession in their income statements. Dollar stores, however, are not hurt as much by a recession as the larger retail outlets are. The products they provide are products that can be used everyday at the affordable price of $1, making them an excellent source for substitute goods. They are also able to remain profitable in a contracting economy by improving efficiency of their operations through using customer information to create a more targeted offering of products, allowing them to cut down the amount they purchase. We are currently in a time of economic recovery, which is extremely beneficial for the retail industry. One of the most comprehensive measures of the economic activity is gross domestic product (GDP). The third quarter of 2003 saw the GDP increase by 8.2 percent, one percentage point more than the estimate. For the year, GDP has steadily increased, indicating a turning point in the economy. The following chart 9 Retail Forward press release 6/17/03

9 | Dollar Tree Stores, Inc.
SMIF Investment Research December 2, 2003 shows how GDP has risen over the first three quarters of 2003, and was taken from the Bureau of Economic Analysis.
Real GDP Growth (2003)
0123456789
0123456789
Q1 Q2 Q3
Percent
Along with the rise in GDP was an increase in real disposable income, which is the amount of income available for the purchase of goods and services and for personal savings. A low value can indicate that individuals have a limited ability to participate in the community, therefore restricting the quality of life. According to the Bureau of Economic Analysis, real disposable income increased 0.4 percent in the month of October after it had been down in September. Although this increase in real disposable income did not spur an increase in real consumer spending, since October of last year, real disposable income and consumer spending have increased 3.0 percent and 3.6 percent, respectively. Another indicator that consumers are ready to spend more is the Consumer Confidence Index. According to the Conference Board, the Consumer Confidence Index has surged from 81.7 in October, to 91.7 in November. Consumer confidence is now at its highest level since the fall of 2002, and signals that consumers will end this year much more upbeat than when the year began. Below is a chart, courtesy of the Conference Board, showing how consumer confidence has increased since the summer.
10 | Dollar Tree Stores, Inc.
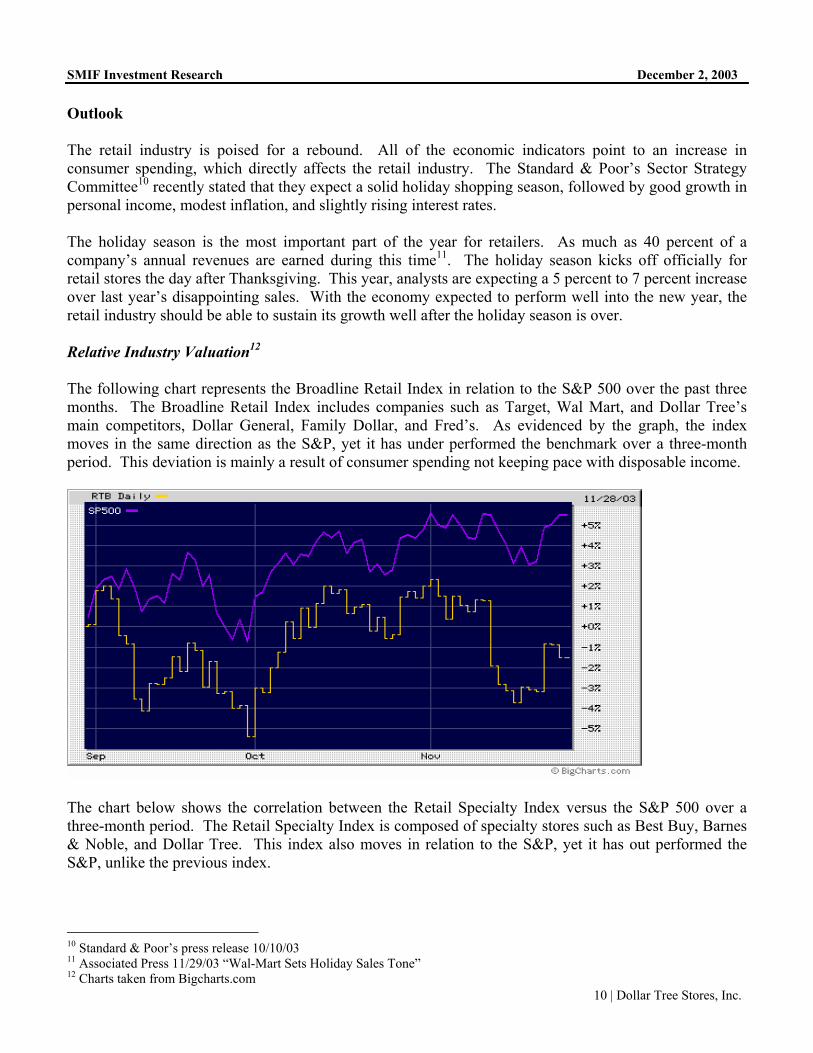
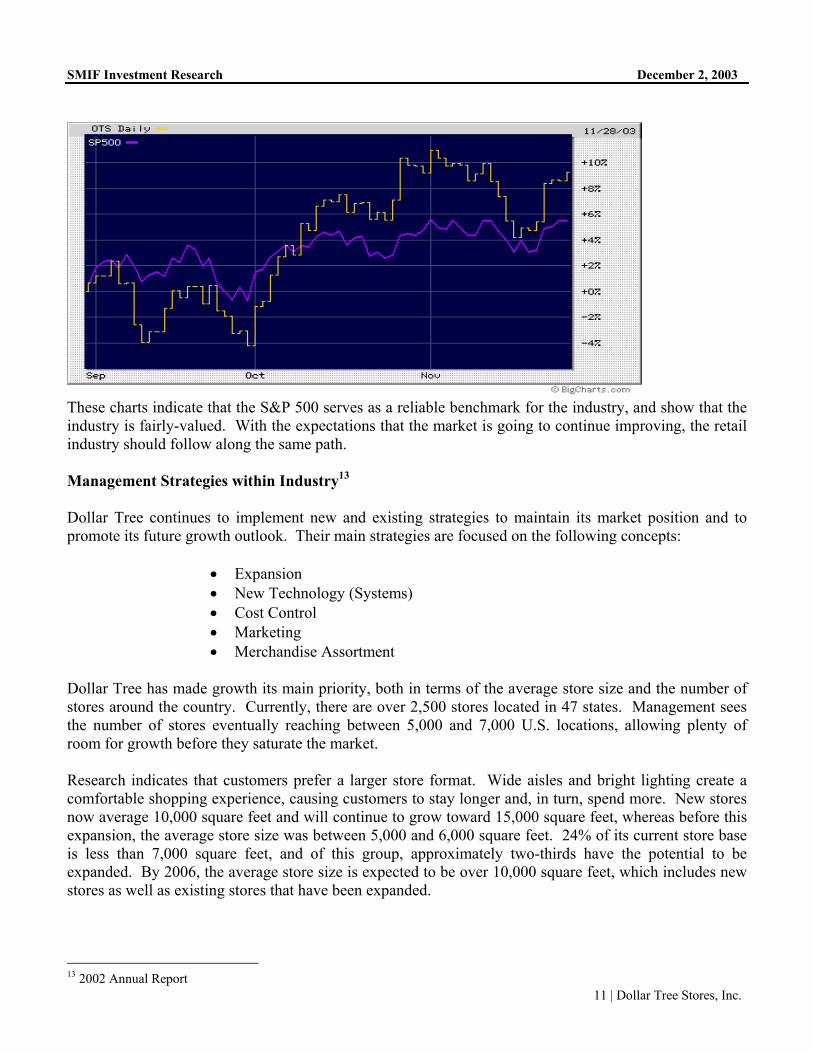
SMIF Investment Research December 2, 2003 Outlook The retail industry is poised for a rebound. All of the economic indicators point to an increase in consumer spending, which directly affects the retail industry. The Standard & Poor’s Sector Strategy Committee10 recently stated that they expect a solid holiday shopping season, followed by good growth in personal income, modest inflation, and slightly rising interest rates. The holiday season is the most important part of the year for retailers. As much as 40 percent of a company’s annual revenues are earned during this time11. The holiday season kicks off officially for retail stores the day after Thanksgiving. This year, analysts are expecting a 5 percent to 7 percent increase over last year’s disappointing sales. With the economy expected to perform well into the new year, the retail industry should be able to sustain its growth well after the holiday season is over. Relative Industry Valuation12 The following chart represents the Broadline Retail Index in relation to the S&P 500 over the past three months. The Broadline Retail Index includes companies such as Target, Wal Mart, and Dollar Tree’s main competitors, Dollar General, Family Dollar, and Fred’s. As evidenced by the graph, the index moves in the same direction as the S&P, yet it has under performed the benchmark over a three-month period. This deviation is mainly a result of consumer spending not keeping pace with disposable income.
The chart below shows the correlation between the Retail Specialty Index versus the S&P 500 over a three-month period. The Retail Specialty Index is composed of specialty stores such as Best Buy, Barnes & Noble, and Dollar Tree. This index also moves in relation to the S&P, yet it has out performed the S&P, unlike the previous index.
10 Standard & Poor’s press release 10/10/03 11 Associated Press 11/29/03 “Wal-Mart Sets Holiday Sales Tone” 12 Charts taken from Bigcharts.com
11 | Dollar Tree Stores, Inc.
SMIF Investment Research December 2, 2003
These charts indicate that the S&P 500 serves as a reliable benchmark for the industry, and show that the industry is fairly-valued. With the expectations that the market is going to continue improving, the retail industry should follow along the same path. Management Strategies within Industry13 Dollar Tree continues to implement new and existing strategies to maintain its market position and to promote its future growth outlook. Their main strategies are focused on the following concepts:
• Expansion • New Technology (Systems) • Cost Control • Marketing • Merchandise Assortment
Dollar Tree has made growth its main priority, both in terms of the average store size and the number of stores around the country. Currently, there are over 2,500 stores located in 47 states. Management sees the number of stores eventually reaching between 5,000 and 7,000 U.S. locations, allowing plenty of room for growth before they saturate the market. Research indicates that customers prefer a larger store format. Wide aisles and bright lighting create a comfortable shopping experience, causing customers to stay longer and, in turn, spend more. New stores now average 10,000 square feet and will continue to grow toward 15,000 square feet, whereas before this expansion, the average store size was between 5,000 and 6,000 square feet. 24% of its current store base is less than 7,000 square feet, and of this group, approximately two-thirds have the potential to be expanded. By 2006, the average store size is expected to be over 10,000 square feet, which includes new stores as well as existing stores that have been expanded.
13 2002 Annual Report

12 | Dollar Tree Stores, Inc.
SMIF Investment Research December 2, 2003 Although these larger stores generate lower sales per square foot than the smaller stores, by inviting customers to stay longer, they generate more sales. The average transaction at a small store is between $3 and $5 versus $9 and $10 at the larger stores. Since they do not have the luxury of increasing prices on certain items to increase net sales, their increase in net sales is a direct result from square footage growth. Square footage growth is expected to grow 20% in 2004, with the majority of the growth occurring in the first three quarters. On average, the first year ROI for a new store is 100%14, which makes the Dollar Tree concept one of the most profitable in retailing. Because invested capital is paid back after only one year, the company has the ability to internally finance its growth, which will be advantageous once interest rates increase. Dollar Tree’s distribution channel has also undergone expansion. They have seven distribution centers located throughout the country. They plan on opening their eighth distribution center in Ridgefield, Washington during the first quarter of 2004, and open their Joliet, Illinois distribution center in the third quarter of 2004. Dollar Tree will not need to open a new distribution center for quite some time after these two projects are completed, which will provide excellent expense leverage later next year. Managing costs is essential for Dollar Tree to maintain its $1 price point. Cost control continues to be a main driver in their financial success, and has allowed them to maintain or improve their gross margin even though freight rates are expected to increase over the next year. New technology, such as Point-of-Sale scanning systems, has provided management with information that allows them to buy the right amount of a specific product at the right time. By knowing how products sell and where they sell best, they are able to bring goods to the right distribution centers and ship them more efficiently to the stores when they are needed. This is especially useful during the holiday season because it allows them to match their stocking periods with the products that are demanded, and to match their staffing levels when stores are busiest. There are approximately 1,645 stores with Point-of-Sale systems installed, and management expects to install the system in all remaining stores by the end of 2004. As a result of Point-of-Sale systems, inventory can be reduced by as much as 10%. Banking transaction fees have also been reduced with the recent installation of a financial switch to hose their debit and credit card transactions. They plan on reducing their exposure to “bad checks” by launching a check verification system in 2004. With these two systems, management predicts overall cost savings of $1.3 million. Other technology that Dollar Tree has benefited from include back-office systems that allow paperwork to be transmitted electronically, saving both time and money, and new energy-management systems that allow them to centrally manage the stores’ lighting and climate control. Dollar Tree continues to attract new customers through its marketing techniques. In 2003, they introduced their “Believe it!” campaign, which was designed to make potential customers aware that every product in a Dollar Tree store really is only $1. They will continue to use television, radio, and print media to advertise grand openings, build brand awareness in new markets, increase customer traffic, and showcase unique products and seasonal offerings. Having an assortment of merchandise is another trait of Dollar Tree. They are constantly looking for products that they can sell for $1 without compromising their emphasis on quality products. The 14 Wachovia Securities report 10/28/03
13 | Dollar Tree Stores, Inc.
SMIF Investment Research December 2, 2003 availability of brand-name merchandise has been on the rise as manufacturers choose to do business with them. The increase in quality, brand name merchandise, paired with their expansion has enabled Dollar Tree stores to become a destination for shoppers. Consumers know that they can go to a Dollar Tree store to purchase anything from cleaning supplies and kitchen gadgets, to party supplies and holiday decorations. Competence of Management Dollar Tree’s management has performed extremely well over the past few years. Their managerial philosophy is based on three values: Attitude, Judgment, and Commitment. Managers enforce these values, and impose them upon the employees so that they are responsible, courteous, do the right things for the right reasons, and respect the company and themselves. By practicing these values, management has been able to grow the company into the largest single price-point retailer, and has also performed well for the shareholders. Despite economic factors that have impacted the stock price, management has done an exceptionally good job of managing equity to maximize stock value. The stock price went from a low of $3.20 in 1995 to its current price of $31.50. The stock price reflects profits, which have increased every year since it went public in 1993. Operating in a fast-paced, low-margin retail market requires exceptional management to be able to buy products at a low enough price to be able to profit from them by selling them at $1. Management is constantly faced with economic barriers that threaten to impede growth if measures are not taken. In order to combat these factors, management has utilized several strategies to maintain margins while costs have increased, and have developed plans for future growth. No other mid-cap growth specialty retailers have experienced the extraordinary growth that Dollar Tree has. Key Officers15 Macon F. Brock, Jr. Chief Executive Officer and Chairman of the Board Mr. Brock is 61 years old and founded Dollar Tree in 1986. He has been CEO since 1993, and Chairman of the Board since 2001. He directs the overall operations of Dollar Tree. John F. Megrue Vice Chairman of the Board Mr. Megrue is 44 years old and has been Vice Chairman of the Board since 1993. He also serves as Chairman of the Board for Hibbett Sporting Goods, Inc. Bob Sasser President and Chief Operating Officer Mr. Sasser is 51 years old and has been President since 2001 and COO since 1999. Before joining Dollar Tree, he served as Senior Vice President, Merchandise and Marketing of Roses Stores, Inc. from 1997. Frederick C. Coble Chief Financial Officer Mr. Coble is 42 years old and has been CFO since 1998. Prior to that, he served as Senior Vice President, Finance from 1997 and as Vice President, Controller from 1991. H. Ray Compton Executive Vice President and Director
15 Forbes.com

14 | Dollar Tree Stores, Inc.
SMIF Investment Research December 2, 2003 Mr. Compton is 60 years old and founded Dollar Tree with Mr. Brock in 1986. From 1986 to 1998, he served as Chief Financial Officer before becoming Executive Vice President.
Fundamental Analysis Ratio Analysis
Ratio Analysis is a form of Financial Statement Analysis that is used to obtain a quick indication of a firm's financial performance in several key areas. The ratios are categorized as Liquidity Ratio, Profitability Ratios, Asset Management Ratios and Debt Management Ratios.
This Analysis compares Dollar Tree with its own ratio over the last four years. At the same time it compares Dollar Tree with its main competitors and the industry. Dollar tree main competitors are Dollar General Corporation, Fred’s Inc., family dollar stores and 99 cents only stores and the industry being analyzed is the Discount variety stores industry. It is important to note that there are more than 2,500 stores in the U.S.
Liquidity Ratios Short-term Solvency Ratios attempt to measure the ability of a firm to meet its short-term financial obligations. In other words, these ratios seek to determine the ability of a firm to avoid financial distress in the short-run.
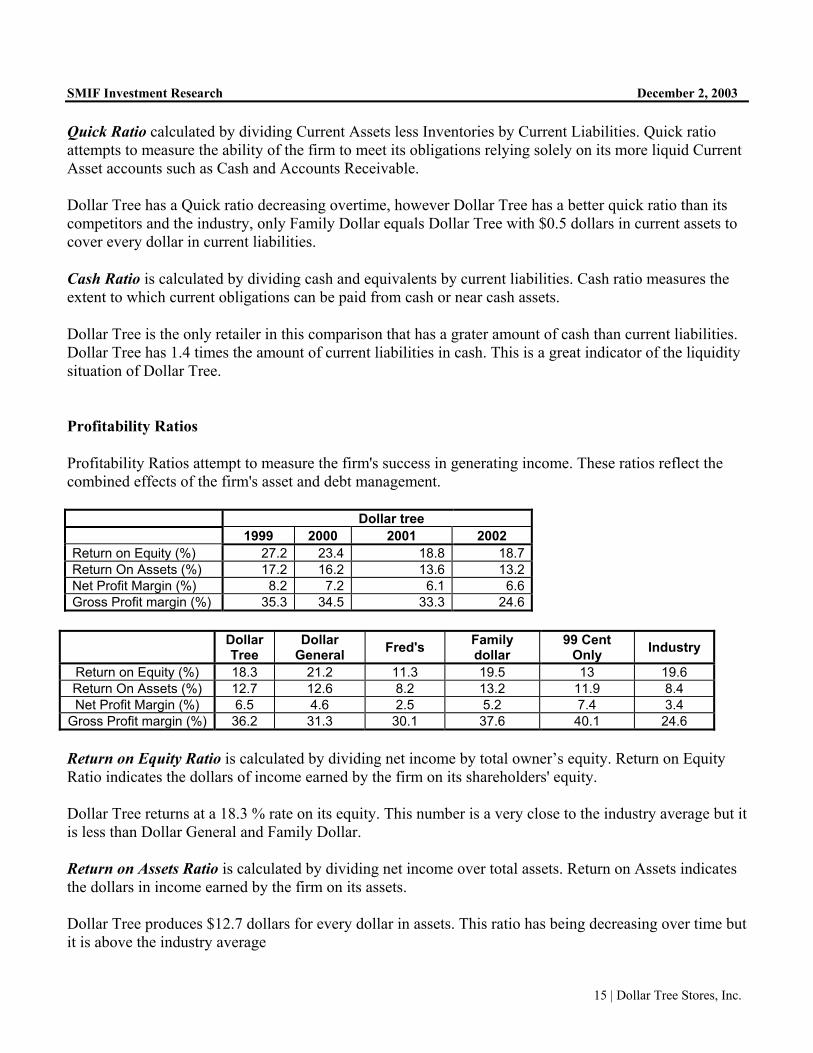
Dollar tree 1999 2000 2001 2002
Current Ratio 2.5 2.7 2.8 2.9Quick Ratio 1.1 1.03 1.2 1.1Cash Ratio 1.177 1.04 1.18 1.41
Dollar
Tree Dollar General Fred's Family dollar
99 Cent Only Industry
Current Ratio 3.1 2.2 2.9 2.1 7 1.2Quick Ratio 0.5 0.2 0.2 0.5 4 0.3Cash Ratio 1.41 0.18 0.09 0.347 0.208 N/A
Current Ratio is calculated by dividing Current Assets by Current Liabilities. Current Ratio measures the ability of the company to cover current liabilities with its current assets. The Current Ratio should be greater than one. Dollar Tree has $3.1 dollars in current assets for every dollar in current liabilities. This ratio grows over the last years which, mean a higher liquidity. At the same time Dollar Tree has a great ratio for the most recent activity. Only 99 Cent Only outperforms Dollar Tree.
15 | Dollar Tree Stores, Inc.
SMIF Investment Research December 2, 2003 Quick Ratio calculated by dividing Current Assets less Inventories by Current Liabilities. Quick ratio attempts to measure the ability of the firm to meet its obligations relying solely on its more liquid Current Asset accounts such as Cash and Accounts Receivable. Dollar Tree has a Quick ratio decreasing overtime, however Dollar Tree has a better quick ratio than its competitors and the industry, only Family Dollar equals Dollar Tree with $0.5 dollars in current assets to cover every dollar in current liabilities.
Cash Ratio is calculated by dividing cash and equivalents by current liabilities. Cash ratio measures the extent to which current obligations can be paid from cash or near cash assets.
Dollar Tree is the only retailer in this comparison that has a grater amount of cash than current liabilities. Dollar Tree has 1.4 times the amount of current liabilities in cash. This is a great indicator of the liquidity situation of Dollar Tree.
Profitability Ratios
Profitability Ratios attempt to measure the firm's success in generating income. These ratios reflect the combined effects of the firm's asset and debt management.
Dollar tree 1999 2000 2001 2002
Return on Equity (%) 27.2 23.4 18.8 18.7Return On Assets (%) 17.2 16.2 13.6 13.2Net Profit Margin (%) 8.2 7.2 6.1 6.6Gross Profit margin (%) 35.3 34.5 33.3 24.6
Dollar
Tree Dollar
General Fred's Family dollar
99 Cent Only Industry
Return on Equity (%) 18.3 21.2 11.3 19.5 13 19.6 Return On Assets (%) 12.7 12.6 8.2 13.2 11.9 8.4 Net Profit Margin (%) 6.5 4.6 2.5 5.2 7.4 3.4
Gross Profit margin (%) 36.2 31.3 30.1 37.6 40.1 24.6 Return on Equity Ratio is calculated by dividing net income by total owner’s equity. Return on Equity Ratio indicates the dollars of income earned by the firm on its shareholders' equity. Dollar Tree returns at a 18.3 % rate on its equity. This number is a very close to the industry average but it is less than Dollar General and Family Dollar. Return on Assets Ratio is calculated by dividing net income over total assets. Return on Assets indicates the dollars in income earned by the firm on its assets. Dollar Tree produces $12.7 dollars for every dollar in assets. This ratio has being decreasing over time but it is above the industry average

16 | Dollar Tree Stores, Inc.
SMIF Investment Research December 2, 2003 Net Profit Margin is calculated by dividing Net Income by Sales. Net Profit Margin indicates the dollars in income that the firm earns on each dollar of sales. Dollar Tree has a great Net Profit Margin in comparison to the industry and its main competitors. Gross Profit Margin is calculated by dividing gross profits by sales. Gross Profit Margin indicates how efficient a business is using its, production, labor and distribution processes. 39.5 % of sales are left after subtracting cost of good sold in the case of Dollar Tree. This ratio has been decreasing over the last four years. Now that the economy is recovering this ratio has increased from 24.6 in 2002 to 39.5% in the last four months. Asset Management Ratios Asset Management Ratios attempt to measure the firm's success in managing its assets to generate sales.
Dollar tree 1999 2000 2001 2002
Assets turnover 2.1 2.3 2.2 1.5 Inventory Turnover 4.7 4.9 4.6 3.7
Dollar Tree Dollar General Fred's Family
dollar 99 Cent
Only Industry
Assets turnover 2.2 2.8 3.6 2.7 1.8 2.6 Inventory Turnover 3.5 4 4.2 4 5.2 6.8
Assets Turnover Ratio is calculated by dividing Sales by Net Assets. Assets Turnover ratio measures how productively the firm is managing its Assets to generate Sales. Dollar Tree has an asset Turnover ratio that has decreased over time, these number is consistent with their opening of new stores all over the U.S. However we can see a recovery in the most recent activity due to their new supply management system that helps the improvement of inventory management Inventory Turnover Ratio is calculated by dividing Cost of Goods Sold by Inventory. Inventory Turnover Ratio measures the firm's management of its Inventory. In general, a higher Inventory Turnover Ratio is indicative of better performance since this indicates that the firm's inventories are being sold more quickly. However, if the ratio is too high then the firm may be losing sales to competitors due to inventory shortages. Dollar Tree has a lower inventory turnover than the industry because they are expanding in different areas and constructing new distribution centers. Debt Management Ratios Debt Management Ratios attempt to measure the firm's use of Financial Leverage and ability to avoid financial distress.
17 | Dollar Tree Stores, Inc.
SMIF Investment Research December 2, 2003
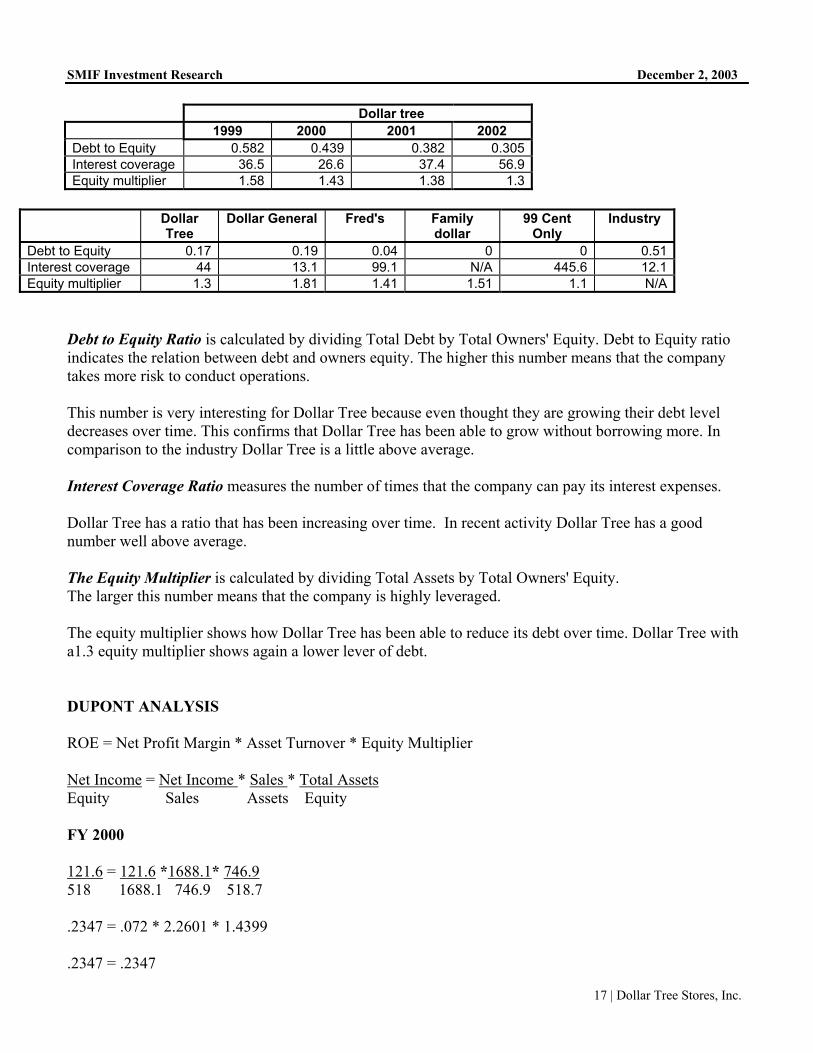
Dollar tree 1999 2000 2001 2002
Debt to Equity 0.582 0.439 0.382 0.305Interest coverage 36.5 26.6 37.4 56.9Equity multiplier 1.58 1.43 1.38 1.3
Dollar
Tree Dollar General Fred's Family
dollar 99 Cent
Only Industry
Debt to Equity 0.17 0.19 0.04 0 0 0.51Interest coverage 44 13.1 99.1 N/A 445.6 12.1Equity multiplier 1.3 1.81 1.41 1.51 1.1 N/A
Debt to Equity Ratio is calculated by dividing Total Debt by Total Owners' Equity. Debt to Equity ratio indicates the relation between debt and owners equity. The higher this number means that the company takes more risk to conduct operations. This number is very interesting for Dollar Tree because even thought they are growing their debt level decreases over time. This confirms that Dollar Tree has been able to grow without borrowing more. In comparison to the industry Dollar Tree is a little above average. Interest Coverage Ratio measures the number of times that the company can pay its interest expenses. Dollar Tree has a ratio that has been increasing over time. In recent activity Dollar Tree has a good number well above average. The Equity Multiplier is calculated by dividing Total Assets by Total Owners' Equity. The larger this number means that the company is highly leveraged. The equity multiplier shows how Dollar Tree has been able to reduce its debt over time. Dollar Tree with a1.3 equity multiplier shows again a lower lever of debt. DUPONT ANALYSIS ROE = Net Profit Margin * Asset Turnover * Equity Multiplier Net Income = Net Income * Sales * Total Assets Equity Sales Assets Equity FY 2000 121.6 = 121.6 *1688.1* 746.9 518 1688.1 746.9 518.7 .2347 = .072 * 2.2601 * 1.4399 .2347 = .2347

18 | Dollar Tree Stores, Inc.
SMIF Investment Research December 2, 2003 FY 2001 123.1 = 123.1 * 1,987.3 * 902 651.7 1,987.3 902.0 651.7 .1888 = .0619 * 2.203 * 1.384 .1888 = .1888 FY 2002 154.6 = 154.6 * 2,329.2 * 1,116.4 855.4 2,329.2 1,116.4 855.4 .1807 = .06637 * 2.08634 * 1.305 .1807 = .1807 The Du Pont analysis shows that ROE has decreased over time due to several factors. First of all, Net Profit Margin decreased from 7.2% in 2000 to 6.1% in 2001 driving ROE down. From 2001 to 2002 the bigger change was the decrease in asset turnover from 2.203 to 2.08. Finally the equity multiplier has been decreasing over time showing that the company has a smaller lever of debt. RISK FACTORS There are several risk factors that mat affect Dollar Tree operations:
• Political or economic negative changes may reduce consumer confidence and spending and consequently reduce Dollar Tree sales.
• Future increases in operating and merchandise costs including shipping rates, freight costs, fuel costs, wage levels, inflation, competition and other adverse economic factors because Dollar Tree sells at the fixed $1.00 price point.
• No significant economic barriers may increase competition. • Increase in price or decrease of quality of imported goods. Since Dollar Tree imports 40% of
their inventory any change in price or quality may affect Dollar Tree profitability. • Disruption in the availability of quality, low costs merchandise in sufficient quantities to
maintain growth. • Interest rates changes and foreign currency rate fluctuation.
INVESTMENT DRIVERS There are several reasons for expecting the price of Dollar Tree stock to increase in the near future:

19 | Dollar Tree Stores, Inc.
SMIF Investment Research December 2, 2003
• Dollar Tree is successful at opening new stores through mergers and acquisitions. As a matter of fact Dollar Tree has a first year ROI for new stores of 100%. This means that Dollar Tree has a one-year payback of invested capital and that the company is able to internally finance its growth. Furthermore Dollar Tree is opening bigger stores in order to improve consumer responsiveness.
• Actual economic recovery has a positive effect on consumer spending in this industry. • In 2002, Dollar Tree implemented the supply chain management system that has being helping
Dollar Tree inventory management and cost reduction. • Dollar Tree stores are leading between more than 2500 discounting stores in the U.S. • Dollar Tree buys approximately 60% of its merchandise domestically and directly imports the
remaining 40%. Dollar Tree doesn’t rely mainly on imported products like others discount retailers. This is an advantage from the completive stand- point.
Technical Analysis
DLTR All Data
This chart shows how Dollar Tree Stores has performed since becoming a publicly traded company in 1995.

20 | Dollar Tree Stores, Inc.
SMIF Investment Research December 2, 2003 2-year chart Dollar Tree Stores (DLTR) vs. Family Dollar Stores (FDO) & S&P500
This two-year chart shows how Dollar Tree Stores compares versus its main competitor Family Dollar Stores and the S&P500. Excluding May and April of 2003, both Dollar Tree Stores and Family Dollar Stores have outperformed the S&P500. Since June 2003, both companies have significantly outperformed the S&P500. At this point in time, Family Dollar is slightly outperforming Dollar Tree Stores. 6-month chart Dollar Tree Stores vs. Family Dollar & S&P500
This six-month chart shows how Dollar Tree Stores and Family Dollar Stores have performed during the recent bull market. Dollar Tree Stores has performed the best during this time period. Its record sales in Q3 and positive Q4 guidance should continue to drive the stock up.
21 | Dollar Tree Stores, Inc.
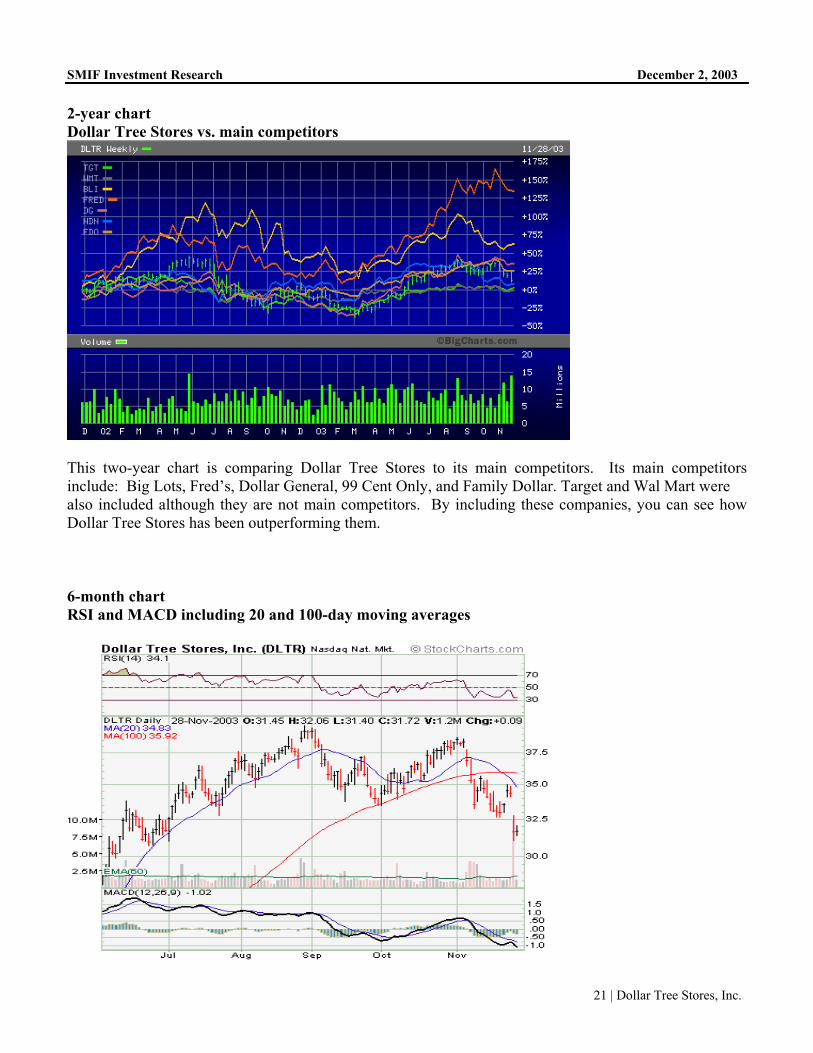
SMIF Investment Research December 2, 2003 2-year chart Dollar Tree Stores vs. main competitors
This two-year chart is comparing Dollar Tree Stores to its main competitors. Its main competitors include: Big Lots, Fred’s, Dollar General, 99 Cent Only, and Family Dollar. Target and Wal Mart were also included although they are not main competitors. By including these companies, you can see how Dollar Tree Stores has been outperforming them. 6-month chart RSI and MACD including 20 and 100-day moving averages

22 | Dollar Tree Stores, Inc.
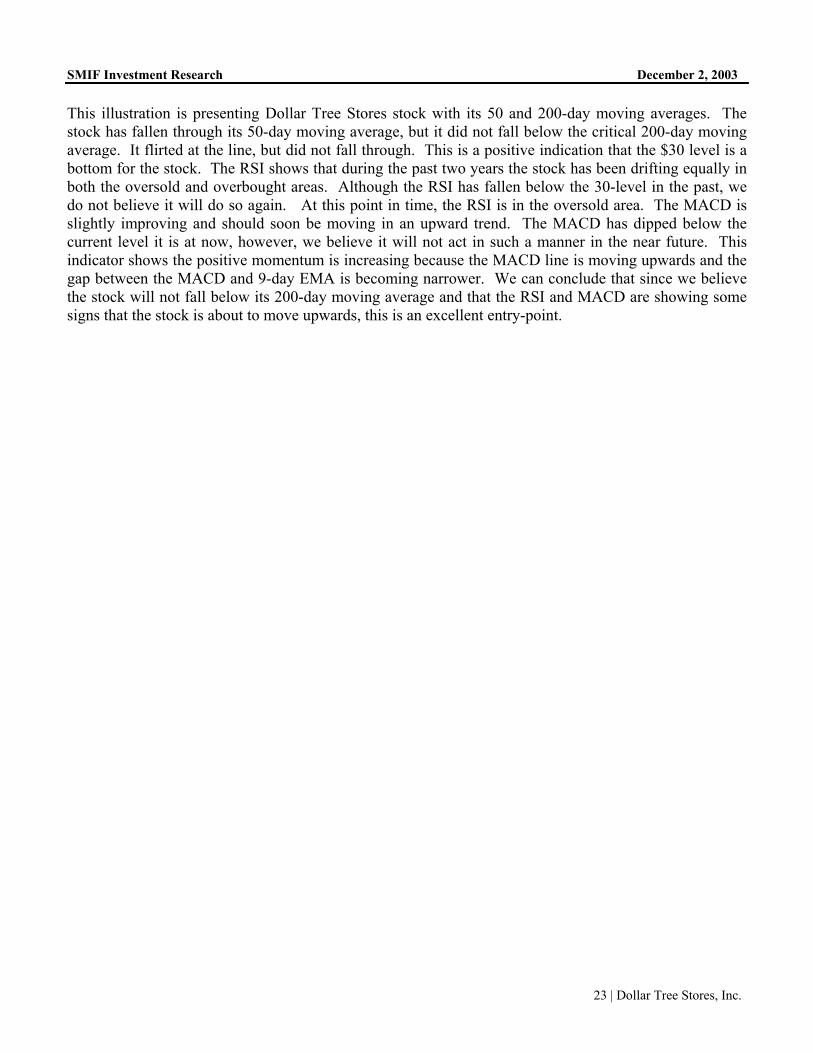
SMIF Investment Research December 2, 2003 This six-month chart illustrates the recent stock trend for Dollar Tree Stores. As shown, the stock price has dipped below both the 20 and 50 day moving averages. This is a bearish signal. The Relative Strength Indicator (RSI), which is a momentum oscillator that compares the magnitude of a stock’s recent gains with the magnitude of a stock’s recent losses, is showing us that Dollar Tree Stores is significantly oversold. It is also showing that momentum towards a higher stock price is neutral. We can conclude that although the stock is oversold and appears to be at a cheap price, it does not have much momentum pushing the stock price higher in the near future. The 30 level indicates a stock is oversold and 70 indicates it is overbought. The 50 level can help tilt bearish or bullish. The RSI appears to be at a flat point around the 30 level and will likely move upwards, not down, when it begins to move again. The Moving Average Convergence Divergence histogram (MACD) is one of the simplest and most reliable technical indicators. It uses moving averages, which are lagging indicators, to include some trend-following characteristics. The MACD (thick black line) is the difference between a security’s 26-day and 12-day exponential moving averages. The 9-day exponential moving average (thin blue line) serves as a crossover point. The histogram is positive when MACD is above the 9-day EMA and negative when MACD is below the 9-day EMA. This MACD histogram for Dollar Tree Stores, is showing us that the MACD is below the 9-day EMA. This indicates that the momentum for the Dollar Tree Stores stock is negative. A closer look will reveal that although the MACD is below the 9-day EMA, the MACD is beginning to turn upwards resulting in a narrower gap between the two lines and a line closer to the zero level, which is positive. 2-year chart RSI and MACD including 50 and 200-day moving averages
23 | Dollar Tree Stores, Inc.
SMIF Investment Research December 2, 2003 This illustration is presenting Dollar Tree Stores stock with its 50 and 200-day moving averages. The stock has fallen through its 50-day moving average, but it did not fall below the critical 200-day moving average. It flirted at the line, but did not fall through. This is a positive indication that the $30 level is a bottom for the stock. The RSI shows that during the past two years the stock has been drifting equally in both the oversold and overbought areas. Although the RSI has fallen below the 30-level in the past, we do not believe it will do so again. At this point in time, the RSI is in the oversold area. The MACD is slightly improving and should soon be moving in an upward trend. The MACD has dipped below the current level it is at now, however, we believe it will not act in such a manner in the near future. This indicator shows the positive momentum is increasing because the MACD line is moving upwards and the gap between the MACD and 9-day EMA is becoming narrower. We can conclude that since we believe the stock will not fall below its 200-day moving average and that the RSI and MACD are showing some signs that the stock is about to move upwards, this is an excellent entry-point.

24 | Dollar Tree Stores, Inc.
SMIF Investment Research December 2, 2003
Disclosure
Any analyst principally responsible for the analysis of any security or issuer included in this report certifies that the views expressed accurately reflect such research analyst's personal views about subject securities or issuers and certifies that no part of his or her compensation was, is, or will be directly or indirectly related to the specific recommendation or views contained in the research report. The research analyst, a member of the team, or a member of the research analyst’s household does not have a financial interest in any stocks mentioned in this report. The Student Managed Investment Fund has no knowledge of any material conflict of interest involving the companies mentioned in this report and the Fund. The Student Managed Investment Fund does not make a market in the shares of DLTR. The research analyst or a member of the team does not have an actual material conflict of interest relative to any stocks mentioned in this report. The research analyst, a member of the team, or a member of the household does not serve as an officer, director, or advisory board member of any stocks mentioned in this report. St. John’s University Student Managed Investment Fund 2003, all rights reserved. 8000 Utopia Parkway, Jamaica, NY 11439