

ST. JAMES’S PLACE WEALTH MANAGEMENT - NOMURA · 1 St. James’s Place: overview •Leading UK...
27
ST. JAMES’S PLACE WEALTH MANAGEMENT SEPTEMBER 2011
Transcript of ST. JAMES’S PLACE WEALTH MANAGEMENT - NOMURA · 1 St. James’s Place: overview •Leading UK...
ST. JAMES’S PLACE WEALTH MANAGEMENT
SEPTEMBER 2011

1
St. James’s Place: overview • Leading UK Wealth Management Company
– Established 1991 – UK listed with market cap of c.£1.8bn – £29.1bn in FUM – Target market £50k to £5 million free investable assets
• Differentiated business model – Manufacturer and distributor – Own dedicated distribution - the Partnership – Distinct investment management approach
• Well positioned to benefit from long-term market growth – Favourable demographic trends – Increasing tax burden
2
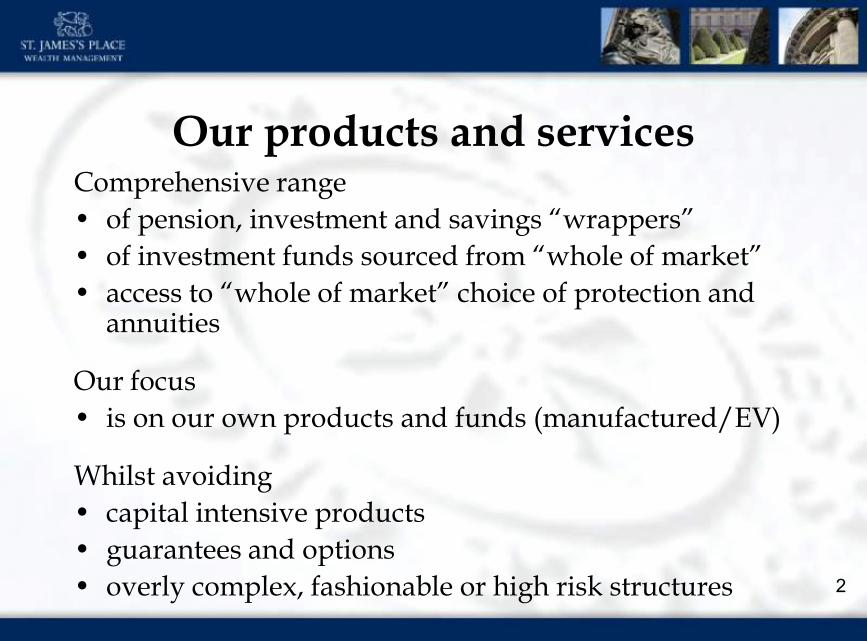
Our products and services Comprehensive range • of pension, investment and savings “wrappers” • of investment funds sourced from “whole of market” • access to “whole of market” choice of protection and
annuities
Our focus • is on our own products and funds (manufactured/EV)
Whilst avoiding • capital intensive products • guarantees and options • overly complex, fashionable or high risk structures

External product providers
4

• High quality self-employed team of c.1600 advisors –Average age is 48 –Above average productivity –90%+ per annum retention rate
5
Dedicated Distribution – the Partnership

Geographic Distribution Age Profile
5%
13%
4%
24% 16%
11%
3%
2%
The Partnership 30 June 2011
6
<357%
35-4528%
45-5542%
55-6520%
65+3%
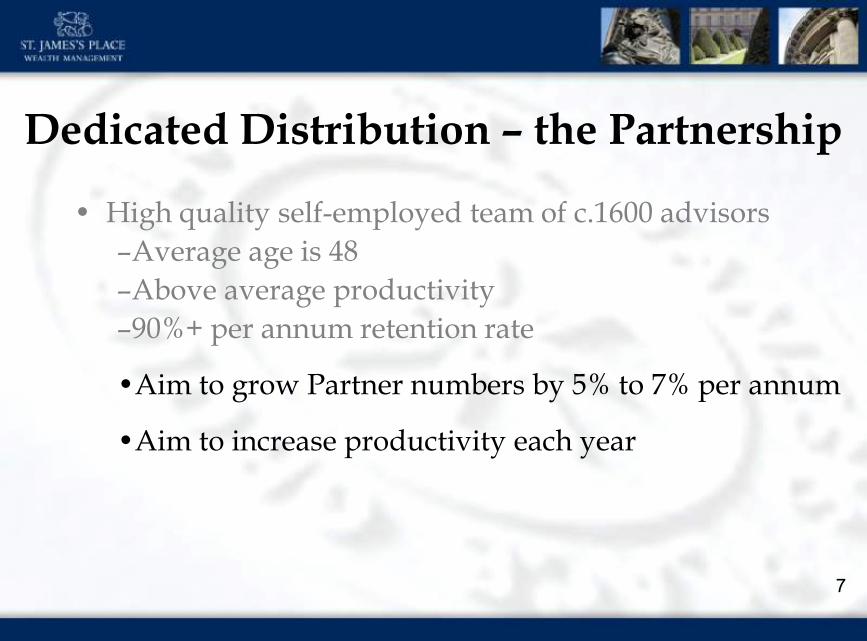
• High quality self-employed team of c.1600 advisors –Average age is 48 –Above average productivity –90%+ per annum retention rate
•Aim to grow Partner numbers by 5% to 7% per annum
•Aim to increase productivity each year
7
Dedicated Distribution – the Partnership

8
The Growth Model
NEW BUSINESS Target
15 – 20% pa
CAPACITY No. of Partners
PRODUCTIVITY
New Business Per Partner

9
Growing Number of Partners
1601
0200400600800
10001200140016001800
2007 2008 2009 2010 2011
Num
ber o
f Par
tner
s
+8% +7%
+9%
30 June
+6% +3%
10
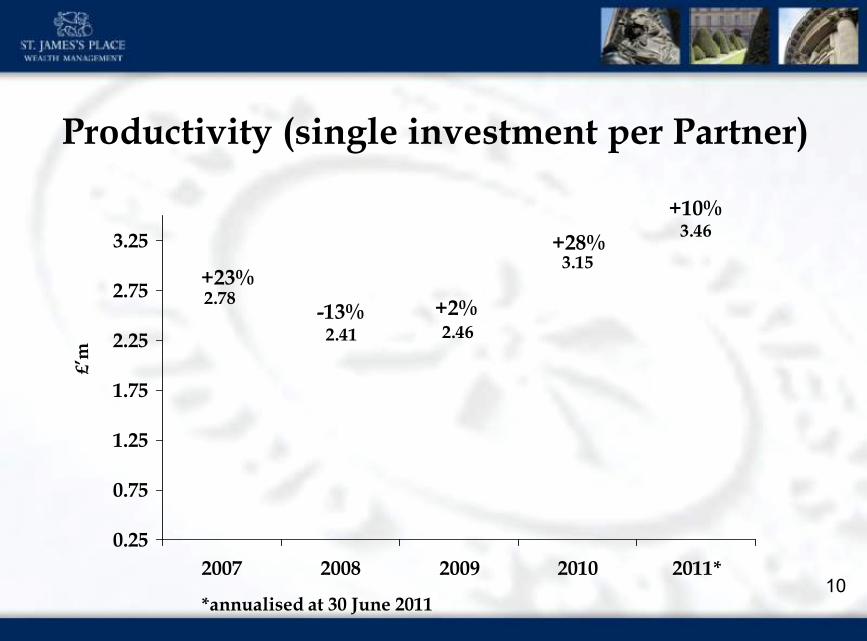
Productivity (single investment per Partner)
3.46
3.15
2.462.41
2.78
0.25
0.75
1.25
1.75
2.25
2.75
3.25
2007 2008 2009 2010 2011*
+23% -13% +2%
*annualised at 30 June 2011
+28% +10%

Compound APE Growth – rolling five years (June to June)
2002-2007 2003-2008 2004-2009 2005-2010 2006-2011 11
20%
15% 17.4%
25.5%
18.8%
Growth
22.7%
17.7%

12
New Business (APE)
185.2 204.6154.7 148.8 177.3
221.0
349.1
428.6 419.0 440.8
581.8
050
100150200250300350400450500550600
2000 2001 2002 2003 2004 2005 2006 2007 2008 2009 2010
-24% +10%
-4% +19%
+58%
+25%
+23%
+42%
-2% +5%
+32%
First half 2011 £335.6 million up 15%

13
Benefits of our own distribution • New business and expenses are more predictable • Spread of production • Less exposed to market pressures • Greater control over quality of new business • Ability to build and maintain distribution led culture • Better retention of business • Ability to build stronger client advocacy

Investment Management
14

Our approach to investment management
Appoint the Fund Managers
Sets Performance objectives
Risk Management & Strategy
Decisions: Change Firm?
Change Manager? No Change?
Input / advice from Stamford Associates 'Manages the Managers'
Investment Committee
15
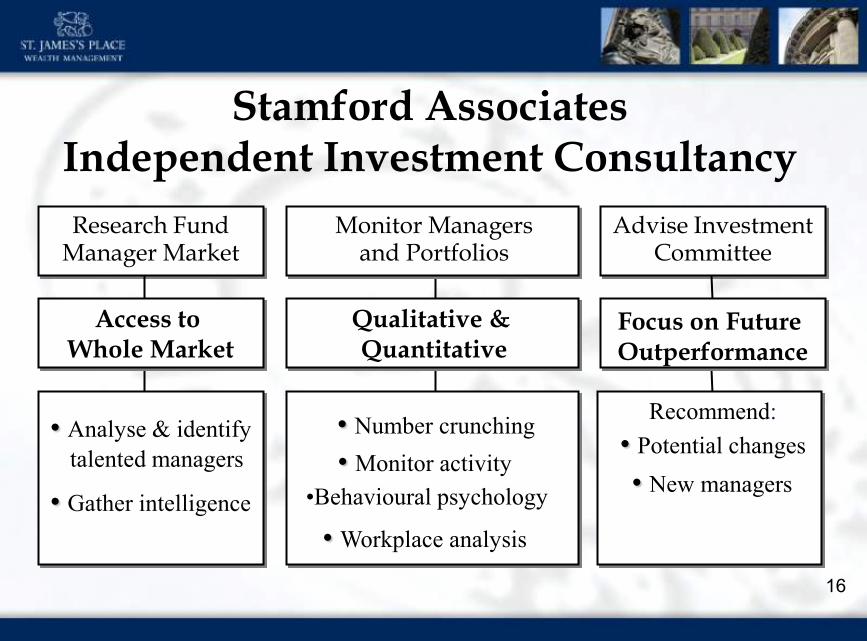
Stamford Associates Independent Investment Consultancy Research Fund
Manager Market Monitor Managers
and Portfolios
Recommend: • Potential changes • New managers
Advise Investment Committee
Access to Whole Market
Qualitative & Quantitative
Focus on Future Outperformance
• Analyse & identify talented managers
• Gather intelligence
• Number crunching • Monitor activity
•Behavioural psychology
• Workplace analysis
16
17
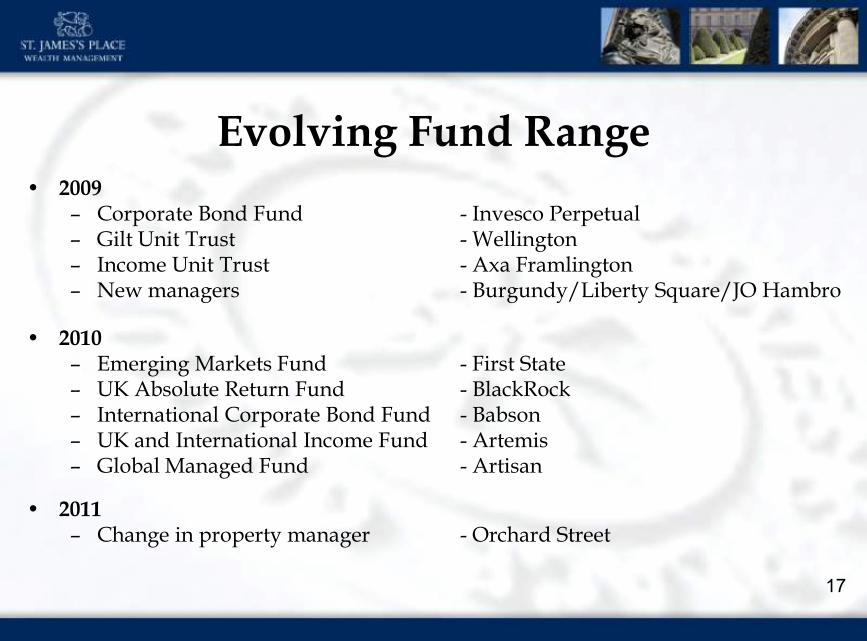
• 2009 – Corporate Bond Fund - Invesco Perpetual – Gilt Unit Trust - Wellington – Income Unit Trust - Axa Framlington – New managers - Burgundy/Liberty Square/JO Hambro
• 2010 – Emerging Markets Fund - First State – UK Absolute Return Fund - BlackRock – International Corporate Bond Fund - Babson – UK and International Income Fund - Artemis – Global Managed Fund - Artisan
• 2011
– Change in property manager - Orchard Street
Evolving Fund Range
19
Benefits of investment management approach
• No in-house managers so no conflict of interest
• Benefit from Investment Committee experience & expertise
• Ability to appoint the best fund managers with wholesale purchasing power
• Continuous monitoring plus quarterly reviews
• Easy to change manager – reduced churn
• Free switching for clients
• Significantly improved retention of funds

20
Funds under management
0
5
10
15
20
25
30
2001 2002 2003 2004 2005 2006 2007 2008 2009 2010
-6% +11% +34% +20%
+25% +29%
+18%
17%p.a. compound growth over the last 5 and 10 years
-10%
+31%
+26% 27.0
30 June 2011: £29.1 billion

Review of first half of 2011
21

Review of first half of 2011 New business
• Total single investment of £2.73 billion up 14% • APE of £335.6 million up 15% • Manufactured proportion 93%
Funds under management
• Continued c95% retention of client assets • Net inflow of funds of £1.7 billion up 13% • Funds under management £29.1 billion up 8% since
start of year and 30% over 12 months
22

Review of first half 2011 Partnership
• Continued strong recruitment and retention • Partnership numbers 1,601 up 3% • 60% of Partnership diploma qualified • A further 25% of Partnership within 1 or 2 exams
23

Review of first half 2011 Profits
• EEV new business profit £127.7 million up +27% • EEV operating profit £183.6 million up +13% • IFRS operating profit £55.3 million up +52% • Cash result £30.8 million up +65%
Other Financials
• EEV net asset value of 379.6 pence per share • IFRS net asset value of 127.4 pence per share • Interim dividend 3.2 pence up 58%
24

25
Outlook • Familiar and well respected brand / business
• Loyal client base (Partners and investors)
• Continued strong recruitment
• Resilient Investment Management Approach
• Strong solvency position
• Strong market for advice
• Favourable market place
• Uniquely placed business

Financial Conferences 26