St. Bonaventure Friday Financial Forum September 26, 2014
56
Business Friday Forum What is Financial Planning Accumulation, Distribution and Transfer of Wealth St. Bonaventure Business Student Friday Forum September 26, 2014
-
Upload
kevin-wenke -
Category
Career
-
view
41 -
download
2
Transcript of St. Bonaventure Friday Financial Forum September 26, 2014

Business Friday Forum
What is Financial PlanningAccumulation, Distribution and Transfer of Wealth
St. Bonaventure Business Student Friday Forum
September 26, 2014

Agenda
Discuss the Business of Personal Finance What is Financial Planning What are Some of the Products and Services What is the Role of a Financial Planner What opportunity is there for a college
graduate in this industry The Money You Can Make The Impact You Can Have on the Life of Others

Who is Kevin Wenke
Kevin Wenke From Olean NY BS From SUNY Fredonia (1993) MBA From University of Tennessee
(1999) Started with MetLife in 2003
IAR in 2004 CFP in 2008 CLU in 2008
Decision Tree Financial in 2009 “Comfort Investing” Book 2014

What is the Average 25 Year Old College Graduates Biggest Asset?
The #1 Answer Is Usually “My Car”

Explanation
Current Age 25 Earning average of $50,000 per year Work until age 65 Never Get a Raise = $2,000,000 Get an average raise of 3.5% throughout
career


The Accumulation, Distribution and Transfer of Wealth

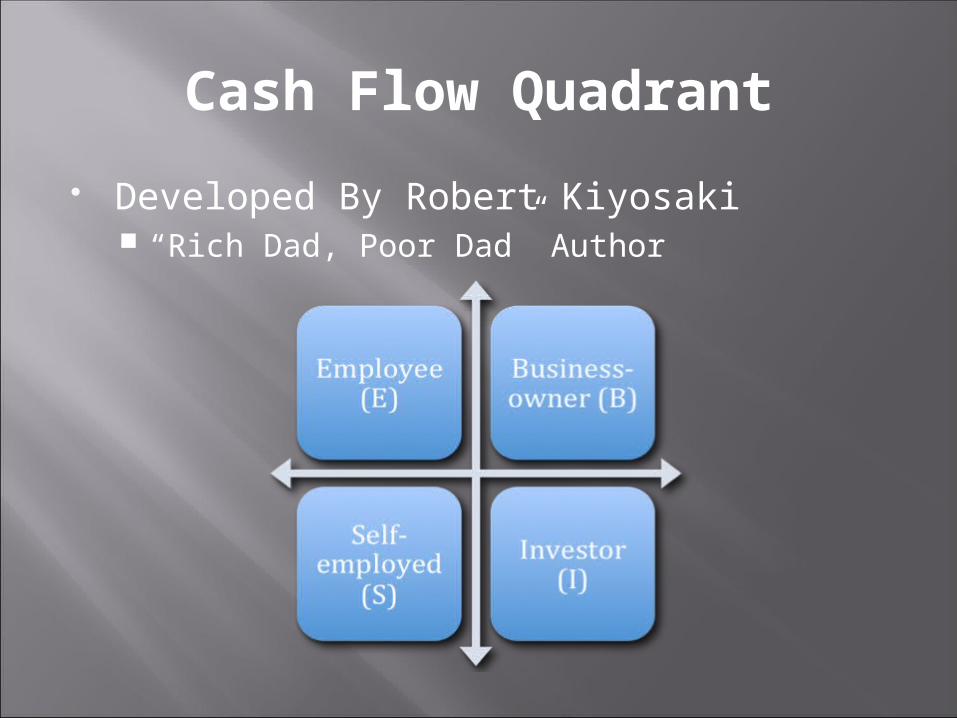
Cash Flow Quadrant
Developed By Robert Kiyosaki “Rich Dad, Poor Dad” Author


Where Do “Do It Yourself” Investors Get Investment Advice?
Media Experts
Newspapers
Television
Radio
Tips from Family and Friends

Quantitative Analysis of Investor Behavior
Produced by Dalbar since 1994 In the Period of 1984-2013, The Average
DIY Investor: Earned an Average CAGR in the Stock Market
of 3.69% The S&P 500 had a CAGR of 11.11%
Earned an Average CAGR in Fixed Income of 0.7%
The Barclay’s Bond Index had a CAGR of 7.67%

investment Cycle of emotions
Depression
Euphoria
Optimism
Excitement Anxiety
Fear Relief
Optimism

Individual DIY InvestorsHave A Great System of:

Where There is a Problem

Common Way Financial Planners Get Paid
Gain Clients and Manage Their Portfolio’s Average Fee Charged is ~ 2.5% of the
portfolio 1% is paid to the Financial Planner meeting with
Clients 1% is paid to the Portfolio Manager 0.5% is paid in various expenses and trading
costs
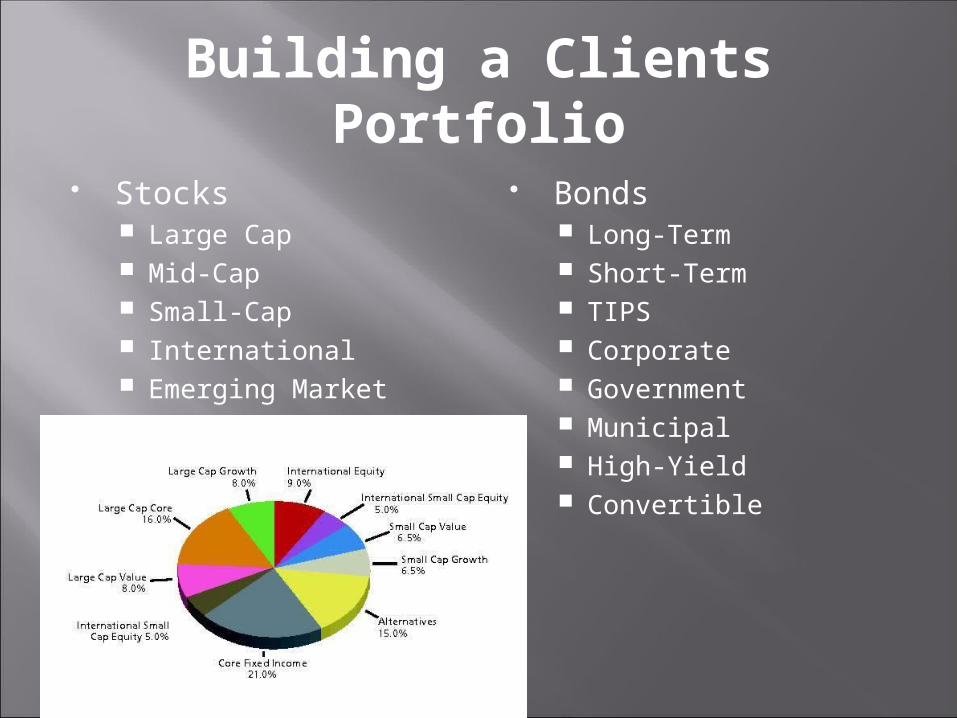
Building a Clients Portfolio
Stocks Large Cap Mid-Cap Small-Cap International Emerging Market
Bonds Long-Term Short-Term TIPS Corporate Government Municipal High-Yield Convertible
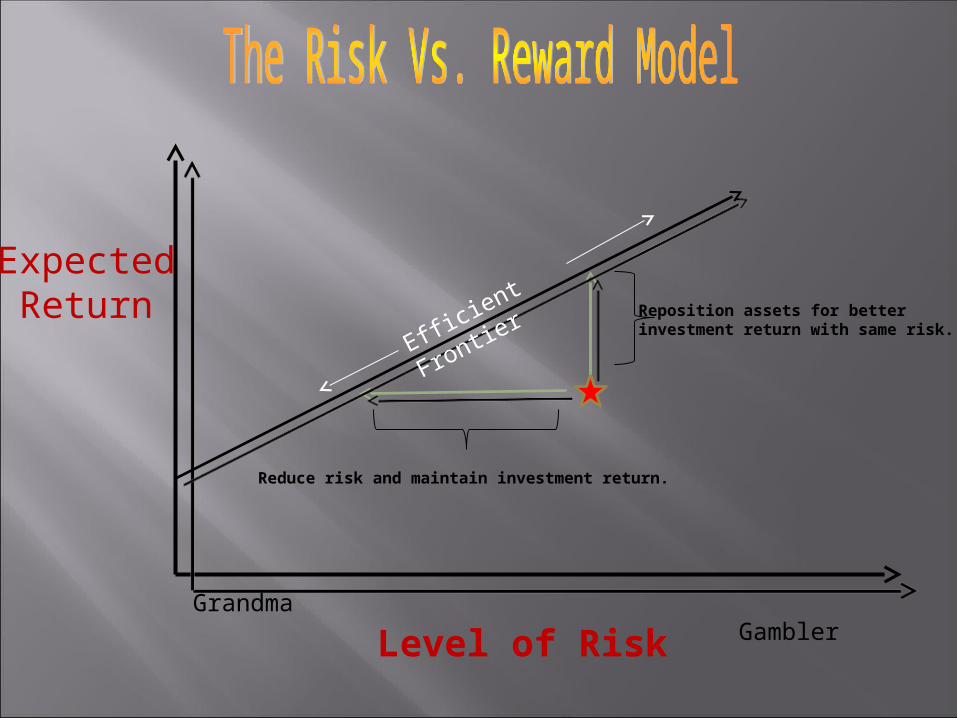
Level of Risk
ExpectedReturn Reposition assets for better
investment return with same risk.
Reduce risk and maintain investment return.
Grandma Gambler
Efficient Frontier

100%
Regression to the Mean
50% 50%

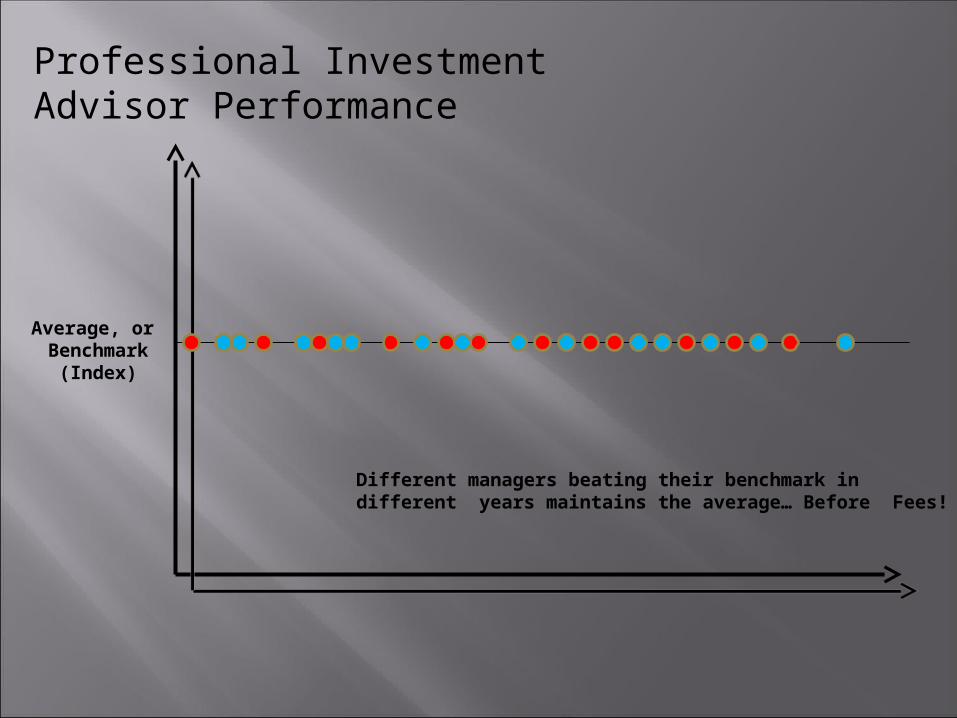
Professional InvestmentAdvisor Performance
Average, or Benchmark
(Index)
Different managers beating their benchmark in different years maintains the average… Before Fees!
Asset Managers that beat their Benchmark
Asset Managers that lagged their Benchmark
Average, or Benchmark
(Index)
Professional InvestmentAdvisor Performance
Different managers beating their benchmark in different years maintains the average… Before Fees!

Benchmark
Fund Manager Performance
Different managers beating their benchmark in different years maintains the average… Before Fees!
AccountPerformance

Hypothetical Account Performance(the Index Minus 2.5% Fee)
Hypothetical Stock Market Movement
The Fees Effect
"It is difficult to systematically beat the market. But it is not difficult to systematically throw money down a rat hole by generating commissions (and other costs)." -- Michael Jensen, professor, Harvard University
PerformanceCosts toInvestors

Some Real Numbers
The S&P 500 had a CAGR of 11.11% from 1984-2013 $100,000 $2,374,000
If a 2.5% Fee was Levied Against that Return $100,000 $1,186,000

“Robo-Advisors”
Investors don’t want to “Watch Their Own Money”
Investors Understand that Asset Managers Typically Don’t “Beat the Market”
Investors Don’t Want to Pay High Fee’s on Average Performance
Software Based Advisors (Wealth Front and Future Advisor) are Charging 0.5% for their Service Using Low Cost ETF’s and Mutual Funds (Cumulative Fee <0.7%)

Some Real Numbers
The S&P 500 had a CAGR of 11.11% from 1984-2013 $100,000 $2,374,000
If a 0.7% Fee was Levied Against that Return $100,000 $1,958,000

However
According to the Dalbar Report, the average DIY investor who earned a CAGR of 3.69% in stocks would have only turned $100,000 into $304,000.

Other Considerations
“Past Performance Doesn’t Guarantee Future Results”
Nothing Contractual ensuring a return basically says “invest at your own risk because we aren’t standing behind our service.”
Aggressive portfolio’s fell by around 50% from their highs at points in 1987, 2000-2002 and 2008.
Investors changed advisors and advisors got PTSD Bonds are Used to Reduce Volatility
30 Years of Falling Interest Rates has made professionally managed and rebalanced portfolio’s look like they are “beating” their averages.

Other Considerations
Other than Growth and Income, Stocks and Bonds typically provide no additional economic benefits to the investor holding them. Ford – 100 shares for 6 months x-plan pricing Wriggly sends shareholders a pack of gum
each year…….
Point - Investors buy Stocks and Bonds for Growth and Income

Is this possible
Help an investor limit the amount of investment losses they can experience to an absolute amount. Helping to manage emotions and allow investor to
comfortably “buy low and sell high” Reduce the risk to a portfolio when interest rates
increase and or Allow an investor to have a large portion of their
wealth positioned more stable asset Allowing them to be in a position of power and control
Without sacrificing long-term investment returns While providing additional benefits to their
comprehensive financial plan?
Reduce Risk and Reduce Volatility
With Out Sacrificing Long-Term Performance

Investing In Stocks vs. Options

Benefits of Using Call Options
Purchasing the right to purchase an asset in the future at a predetermined price.
Positive Leverage – Unlimited Upside Potential Call Options don’t force investor to risk 100% of
their capital Transfer the downside risk to the seller of
the call option Cost effective for investors to obtain -
$0.65 per contract and $5 per trade Contract is equal to 100 shares of stock

The Use of Call Options Can Help Prevent This Behavior
Depression
Euphoria
Optimism
Excitement Anxiety
Fear Relief
Optimism

Potential Negative of Using Call Options
Must Compensate Seller For Their Risk Premium is based on future “strike price”,
contract term, current risk free interest rate and volatility of underlying asset.
This Premium Can Come From The Earnings of Remaining Money Not At Risk In Option
Ideally remaining money should be safe, have a stable value, be liquid while providing a decent rate of return

Constructing a Portfolio
Fixed Income Securities Low Variance and Standard Deviation
Cash Bonds TIPS MLPs BDCs MBSs

These Securities Are StillInterest Rate Sensitive
The Contract That Guaranteesa Minimum Rate or Return

What is Cash Value Life Insurance
Life Insurance Companies Invest Premiums Into a Diversified Portfolio of Fixed Income Securities.
The Manage and Retain Interest Rate Risk for Policy Owners.

Assets Life Insurance Companies Hold
They own 17% of US Corporate Debt Control $6.5 Trillion Dollars of Assets This Amount Would Increase the More
Premium Collect Compete with Investment Banks for Corporate
Debt Underwriting.
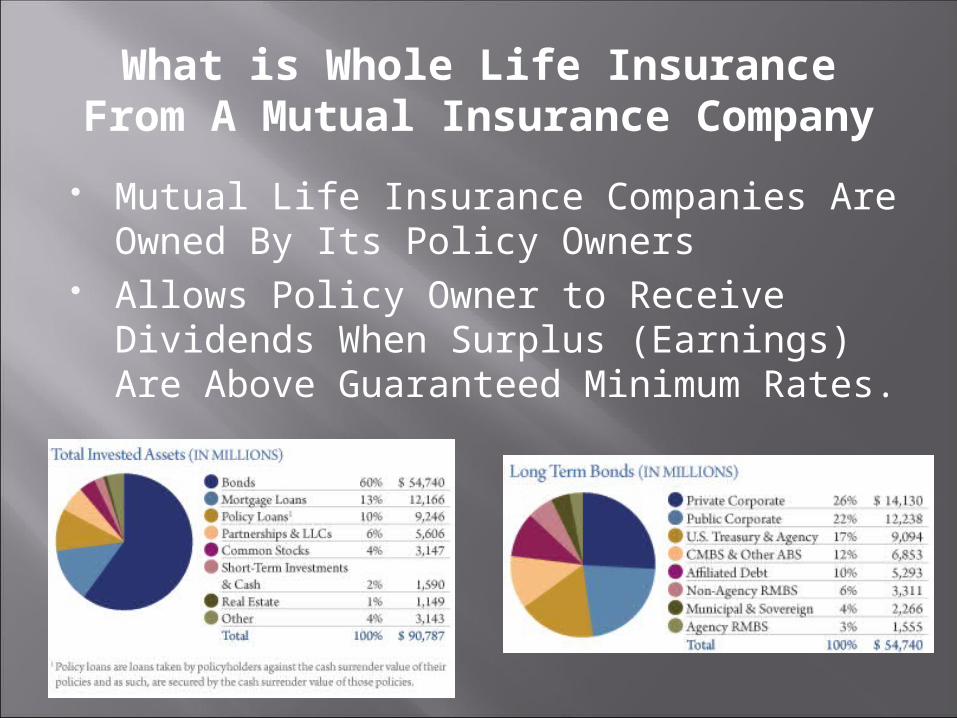
What is Whole Life InsuranceFrom A Mutual Insurance Company
Mutual Life Insurance Companies Are Owned By Its Policy Owners
Allows Policy Owner to Receive Dividends When Surplus (Earnings) Are Above Guaranteed Minimum Rates.

Contracted Minimal ReturnPlus Equity Ownership
Owners of Whole Life Receive Dividends Which Are Derived From: The Earnings of the Life Insurance Companies Insurance
Business The Earnings of the Fixed Income Portfolio The Earnings from their other insurance business
Annuities Disability Long-Term Care Term and Universal Life Insurance
The Earnings From Other Interests the Insurance Company Controls Brokerage, Mutual Fund and Asset Management
Businesses

Criticism of Cash Value Life Insurance
Expenses are Front-Loaded – Takes Years to “Break-Even” Requires a long term commitment.

They “Never Perform” As Illustrated!
30 Year Dividend Interest Rate History 1983 - 2012
4.00
6.00
8.00
10.00
12.00
14.00
Guardian Northwestern MassMutual* New York Life
30 Year Average Return: Guardian 8.98% Northwestern 8.69% MassMutual* 9.10% New York Life 8.67%
CAGR of the S&P 500 1983-201210.87% (Growth and Dividend Reinvestment)
Life Insurance Dividend Rate Does Not Reflect Cost of Insurance

Return Comparison Risk vs. Return
SP 500 (1984-2013) CAGR of 11.1% (when
dividends are reinvested)
Assumes No Fee’s Best Year
38.0% (1995) Worst Year
-37.2% (2008) Standard Deviation
17.1%
Call Options and Whole Life Insurance CAGR of 11.68%
Considers Average 2.5% deducted for COI
Best Year Worst Year Standard Deviation*
18.6 Beta = 1.0

Call Options and Cash Value Life Insurance

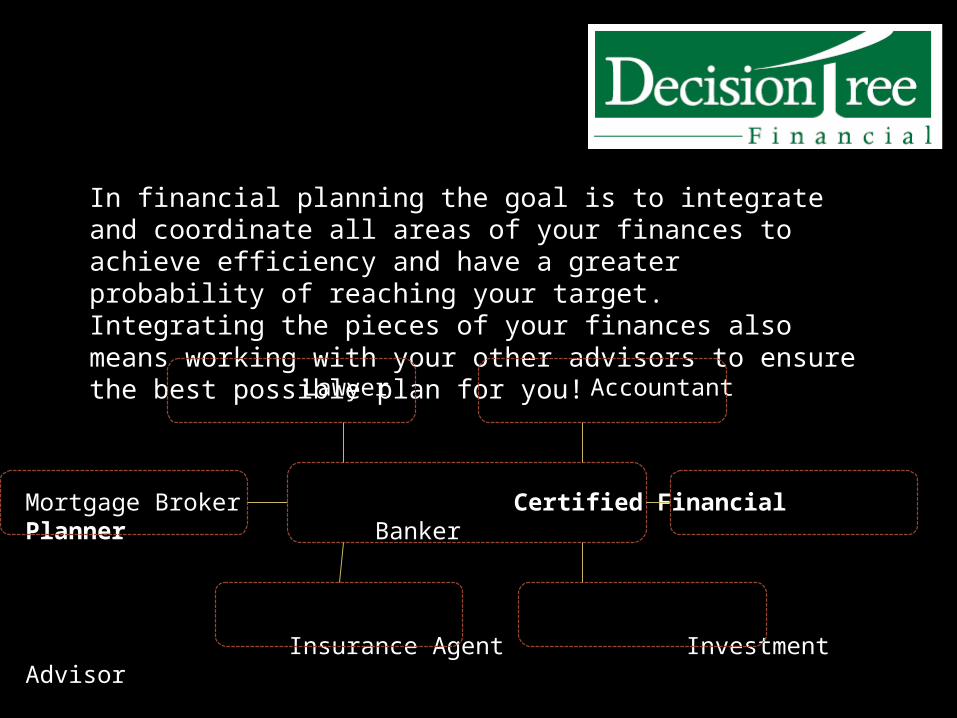
In financial planning the goal is to integrate and coordinate all areas of your finances to achieve efficiency and have a greater probability of reaching your target. Integrating the pieces of your finances also means working with your other advisors to ensure the best possible plan for you!
Lawyer Accountant
Mortgage Broker Certified Financial Planner Banker
Insurance Agent Investment Advisor

What Is Earning Potential Of Commission Based Insurance? Life Insurance
30-100% of FY Premiums 2-10% on premiums paid after 1st year.
Fixed Annuities 3-5% of Contribution
Disability Insurance 50-100% FY Premium 10-20% On Premium After 1st Year
Long-Term Care 50-100% FY Premium 10-20% On Premium After 1st Year

Potential Earnings?
Show 2 New People a Week how to Reallocate $500 per month into life insurance with this strategy Could come from their Earnings or Assets
Already Invested $600,000 Annual Premium at 50%
Commission


Question and Answers
More Information at my Website: Http://www.DecisionTreeFinancial.com Http://www.KevinWenke.HubPages.com Please Share and Follow Me On:
FaceBook Twitter Google+ YouTube Pinterest SlideShare

Thank You