SSC-401 STATE OF THE ART IN HULL RESPONSE MONITORING SYSTEMS · of the art in Hull Response...
103
SSC-401 STATE OF THE ART IN HULL RESPONSE MONITORING SYSTEMS This document has been approved for public release and sale; its distribution is unlimited SHIP STRUCTURE COMMITTEE 1997
Transcript of SSC-401 STATE OF THE ART IN HULL RESPONSE MONITORING SYSTEMS · of the art in Hull Response...
SSC-401
STATE OF THE ARTIN
HULL RESPONSE MONITORINGSYSTEMS
This document has been approvedfor public release and sale; its
distribution is unlimited
SHIP STRUCTURE COMMITTEE
1997
Technical Report Documentation Page1. Report No.
SSC-4012. Government Accession No.
PB98-1004313. Recipient’s Catalog No.
4. Title and Subtitle
State of the Art in Hull Monitoring Systems5. Report Date
August 19976. Performing Organization Code
7. Author(s)
S.B. Slaughter, Dr. M.C. Cheung, D. Sucharski, & B. Cowper8. Performing Organization Report No.
SR-13739. Performing Organization Name and Address
MCA Engineers, Inc.10. Work Unit No. (TRAIS)
2960 Airway Avenue, #A-103Costa Mesa, CA 92626
11. Contract or Grant No.
DTCG23-95-C-E0101112. Sponsoring Agency Name and Address
Ship Structure CommitteeC/O US Coast Guard
13. Type of Report and Period Covered
Final Report
2100 Second Street, SWWashington, DC 20593
14. Sponsoring Agency Code
G-M15. Supplementary Notes
Sponsored by the Ship Structure Committee and its member agencies16. Abstract
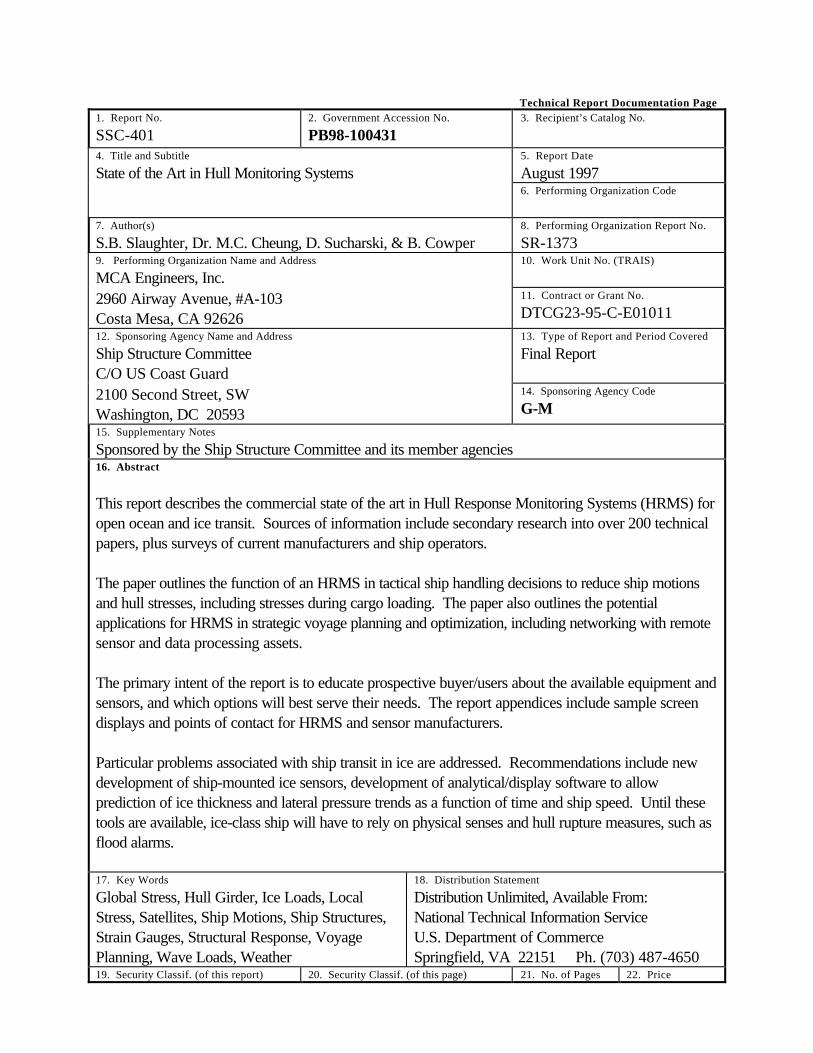
This report describes the commercial state of the art in Hull Response Monitoring Systems (HRMS) foropen ocean and ice transit. Sources of information include secondary research into over 200 technicalpapers, plus surveys of current manufacturers and ship operators.
The paper outlines the function of an HRMS in tactical ship handling decisions to reduce ship motionsand hull stresses, including stresses during cargo loading. The paper also outlines the potentialapplications for HRMS in strategic voyage planning and optimization, including networking with remotesensor and data processing assets.
The primary intent of the report is to educate prospective buyer/users about the available equipment andsensors, and which options will best serve their needs. The report appendices include sample screendisplays and points of contact for HRMS and sensor manufacturers.
Particular problems associated with ship transit in ice are addressed. Recommendations include newdevelopment of ship-mounted ice sensors, development of analytical/display software to allowprediction of ice thickness and lateral pressure trends as a function of time and ship speed. Until thesetools are available, ice-class ship will have to rely on physical senses and hull rupture measures, such asflood alarms.
17. Key Words
Global Stress, Hull Girder, Ice Loads, LocalStress, Satellites, Ship Motions, Ship Structures,Strain Gauges, Structural Response, VoyagePlanning, Wave Loads, Weather
18. Distribution Statement
Distribution Unlimited, Available From:National Technical Information ServiceU.S. Department of CommerceSpringfield, VA 22151 Ph. (703) 487-4650
19. Security Classif. (of this report) 20. Security Classif. (of this page) 21. No. of Pages 22. Price

Unclassified Unclassified 107PC - A07MF - A02

TABLE OF CONTENTS
Chapter Page1.0 EXECUTIVE SUMMARY 1
2.0 INTRODUCTION AND INDUSTRY OVERVIEW 32.1 Current and Future HRMS Applications 32.2 An Industry Overview by Survey 3
3.0 THE SEA ENVIRONMENT AND VESSEL RESPONSE 63.1 Environmental Phenomena 6
3.1.1 Wind 63.1.2 Ocean Waves 73.1.3 Ice 9
3.2 Vessel Response 103.2.1 Ship Motions 103.2.2 Hull Stress 103.2.3 Stability 133.2.4 Powering 13
4.0 HRMS FUNCTIONAL REQUIREMENTS 144.1 Ship-Based HRMS Functional Requirements 144.2 HRMS Functional Requirements Based on Route 144.3 HRMS Functional Subsystem Breakdown 16
5.0 REMOTE SENSING AND INFORMATION NETWORKS 185.1 Remote Sensor Platforms 185.2 Communication/Information Networks 215.3 Integration of Weather Forecasting and Ship Response 22
6.0 HRMS SENSORS 246.1 Strain Gauges 25
6.1.1 Short Baseline(SBL) Strain Gauges 256.1.2 Long Baseline (LBL)Strain Gauges 266.1.3 Derived Moment and Stress Measurements 266.1.4 Developmental Strain/Stress Measurement 26
6.2 Ship Motion Sensors 286.3 Environmental Sensors 296.4 Other Sensors 316.5 Sensors for Ice-Class Vessels 316.6 Recommended Sensor Range and Accuracy 34

(Continued Next Page) v

TABLE OF CONTENTS (continued)
Chapter Page7.0 SHIPBOARD DATA TRANSMISSION 36
7.1 Hard Wiring 367.2 Radio Link 367.3 Fiber Optic Network 377.4 Power Supply and Distribution 37
8.0 CENTRAL PROCESSING UNIT (CPU) 388.1 CPU Hardware & Operating System 388.2 Software Considerations 388.3 Data Storage 398.4 Networking 39
9.0 DISPLAY 409.1 Regulatory Requirements 409.2 Display Design Driven by Users 419.3 Warnings, Alarms, and Event Predictions 429.4 Human Factors 43
10.0 LOGISTIC SUPPORT 4410.1 Logistic Support Procurement Considerations 4410.2 Manufacturer Survey Results 4610.3 Operator Survey Results 46
BIBLIOGRAPHY 48
APPENDIX A: List of HRMS & Sensor Manufacturers A-1APPENDIX B:Display Screens B-1APPENDIX C: Summary of Secondary Research on Ice Loads C-1APPENDIX D: Blank Survey Forms D-1

vi
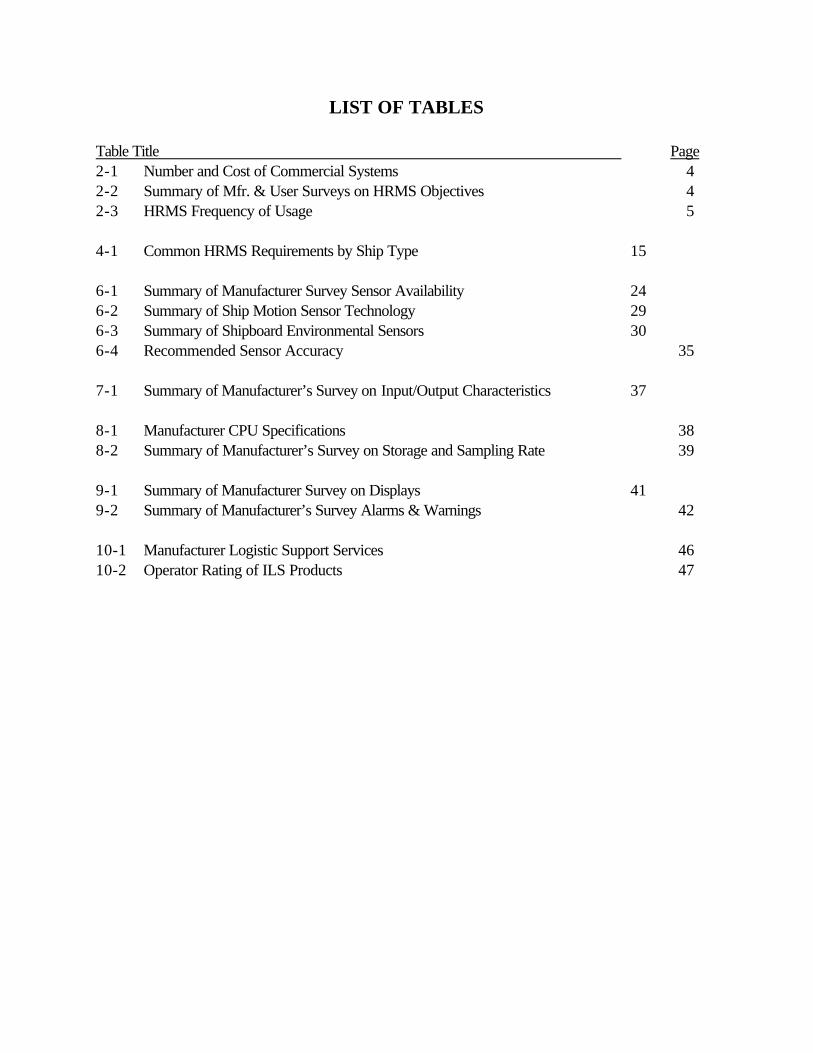
LIST OF TABLES
Table Title Page2-1 Number and Cost of Commercial Systems 42-2 Summary of Mfr. & User Surveys on HRMS Objectives 42-3 HRMS Frequency of Usage 5
4-1 Common HRMS Requirements by Ship Type 15
6-1 Summary of Manufacturer Survey Sensor Availability 246-2 Summary of Ship Motion Sensor Technology 296-3 Summary of Shipboard Environmental Sensors 306-4 Recommended Sensor Accuracy 35
7-1 Summary of Manufacturer’s Survey on Input/Output Characteristics 37
8-1 Manufacturer CPU Specifications 388-2 Summary of Manufacturer’s Survey on Storage and Sampling Rate 39
9-1 Summary of Manufacturer Survey on Displays 419-2 Summary of Manufacturer’s Survey Alarms & Warnings 42
10-1 Manufacturer Logistic Support Services 4610-2 Operator Rating of ILS Products 47

vii
STATE OF THE ART IN HULL RESPONSE MONITORING SYSTEMS
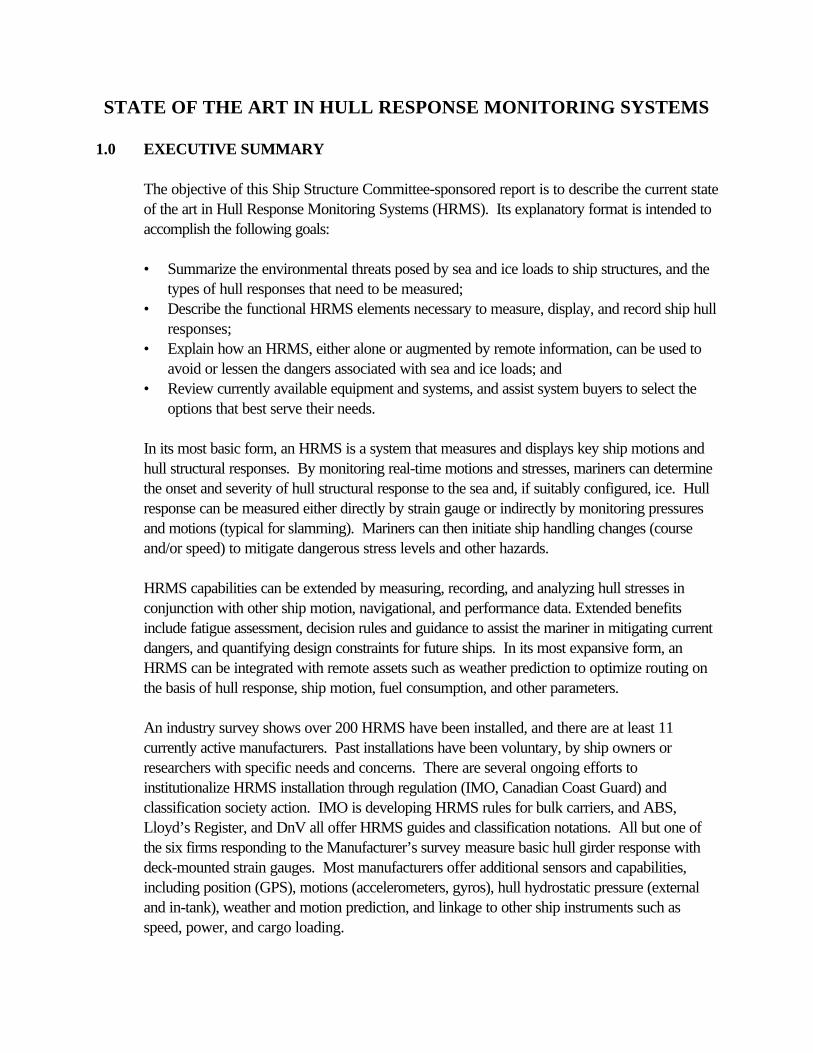
1.0 EXECUTIVE SUMMARY
The objective of this Ship Structure Committee-sponsored report is to describe the current stateof the art in Hull Response Monitoring Systems (HRMS). Its explanatory format is intended toaccomplish the following goals:
• Summarize the environmental threats posed by sea and ice loads to ship structures, and thetypes of hull responses that need to be measured;
• Describe the functional HRMS elements necessary to measure, display, and record ship hullresponses;
• Explain how an HRMS, either alone or augmented by remote information, can be used toavoid or lessen the dangers associated with sea and ice loads; and
• Review currently available equipment and systems, and assist system buyers to select theoptions that best serve their needs.
In its most basic form, an HRMS is a system that measures and displays key ship motions andhull structural responses. By monitoring real-time motions and stresses, mariners can determinethe onset and severity of hull structural response to the sea and, if suitably configured, ice. Hullresponse can be measured either directly by strain gauge or indirectly by monitoring pressuresand motions (typical for slamming). Mariners can then initiate ship handling changes (courseand/or speed) to mitigate dangerous stress levels and other hazards.
HRMS capabilities can be extended by measuring, recording, and analyzing hull stresses inconjunction with other ship motion, navigational, and performance data. Extended benefitsinclude fatigue assessment, decision rules and guidance to assist the mariner in mitigating currentdangers, and quantifying design constraints for future ships. In its most expansive form, anHRMS can be integrated with remote assets such as weather prediction to optimize routing onthe basis of hull response, ship motion, fuel consumption, and other parameters.
An industry survey shows over 200 HRMS have been installed, and there are at least 11currently active manufacturers. Past installations have been voluntary, by ship owners orresearchers with specific needs and concerns. There are several ongoing efforts toinstitutionalize HRMS installation through regulation (IMO, Canadian Coast Guard) andclassification society action. IMO is developing HRMS rules for bulk carriers, and ABS,Lloyd’s Register, and DnV all offer HRMS guides and classification notations. All but one ofthe six firms responding to the Manufacturer’s survey measure basic hull girder response withdeck-mounted strain gauges. Most manufacturers offer additional sensors and capabilities,including position (GPS), motions (accelerometers, gyros), hull hydrostatic pressure (externaland in-tank), weather and motion prediction, and linkage to other ship instruments such asspeed, power, and cargo loading.

While HRMS applications to wave-induced structural response has matured as an industry,most applications on ice-class ships has been for research purposes. Attempts have been madeto provide an “operational” display of measurements to assist safe navigation in ice.Unfortunately, these systems have had limited practical use, and bridge displays are commonlyturned off. A review of the requirements for ice-class vessels found that system response,sensor type, data acquisition, and environmental requirements are met by available open watersystems. However, the arrangement and offsets of sensors, and the software requirements forice load measurement and display are quite different from those for open sea loads. The iceapplication review has identified the following needs not met by the state of the art, for whichR&D funding is recommended:
• Shipboard sensors to locate and measure ice in adverse conditions• Either new hull response sensor development or new analytical software using
existing sensor input to monitor, display, and perform trend analysis of ice loading.
Until this technology is developed, ice-class vessels must rely on hull integrity sensors (floodalarms, etc.) and remote sensor networks (satellite, aircraft, fixed stations) for safe navigationthrough ice.
An HRMS has three complimentary goals aboard ship:
(1) minimize the risk of encountering dangerous seas and ice,(2) alert the mariner to the onset and severity of those conditions not avoided, and(3) provide ship handling guidance to mitigate their effect.
These operational goals strongly influence the display and remote sensing integration aspects ofHRMS design. Shipboard users emphasize the clear presentation of a limited data set andsystem reliability. Shore-side maintenance support personnel use recorded HRMS data tomonitor the condition of a ship’s structure. The design community uses HRMS data to quantifydesign criteria and improve structural design. For these reasons, shore-side users emphasize theimportance of sensor accuracy, data storage, and long-term fatigue data acquisition. OptimalHRMS design must therefore be based on a number of factors:
• Type of ship and cargo• Trade route characteristics• User objectives.
This report explains the types of measurements and HRMS characteristics important to eachapplication, and then describes the industrial state of the art and the equipment available to meetuser needs.
2.0 INTRODUCTION AND INDUSTRY OVERVIEW
Although mariners have always monitored their ships through their physical senses, hullmonitoring has only emerged as a separate technology over the last 30 years, in parallel withmicro-computer technology. Developments have been spurred by regulatory bodies,classification societies, universities, and ship owner/operators.
2.1 Current and Future HRMS Applications
This report summarizes the current state of the art in Hull Response Monitoring Systems. It isbased upon secondary research (including a review of over 200 technical papers) and onManufacturer and Operator surveys. Assessments are made of the types of measurements, theequipment and sensors used, how the results are stored and displayed, and how these systemsare linked into other information networks. This review of the industry reveals a current state ofthe art oriented toward the tactical (shipboard) level, and a developing role in computerizedstrategic voyage planning:
At-Sea Operational GuidanceThe primary role of the HRMS is to alert ship’s force to the onset and severity of hull structuralrisk. To the extent developed, the HRMS may provide ship handling guidance to lessen theseverity of ship motions and hull stresses, including storm avoidance using weather predictions.These functions are fully supported by the current industry state of the art1.
Route and Schedule PlanningWhen linked with remote sensing systems to project near-term weather predictions, routing andscheduling can be altered to minimize storm encounter and maximize trip efficiency. Thisfunction is theoretically complex, requiring the combination of ship response characteristics(either calculated or determined empirically through HRMS measurements) with weatherpredictions on some probability basis. Because of the statistical and random nature of iceloading, the use of an HRMS to record trends in ship response has been limited, the majority ofsuccessful systems being for research and development, including design data collection.Advances in satellite imagery for ice navigation, in concert with radar and onboard displays,have led to improvements in ice route selection that rely little on shipboard response sensors.
2.2 An Industry Overview by Survey
Brief surveys were conducted among HRMS manufacturers and users to determine the currentstatus of HRMS deployment. The answers have been used throughout this report to describethe state of the art. Initial inquiries identified 11 manufacturers that currently market commercialHRMS. Appendix A contains a list and points of contact for all identified manufacturers.Seven manufacturers completed the survey, and limited information on two additional
1 Robinson (ABS Surveyor, 1995) provides a general overview on how HRMS can be used in tactical situations to
assist the mariner. He mentions the contributions an HRMS can make for crews that are less well trained, onships where it is more difficult to physically feel hull structural response.

manufacturers was obtained by secondary research. Survey answers for the number of systemsbuilt and basic system cost (excluding installation) are provided in Table 2-1. The difference incost among manufacturers is not statistically significant, since the question was phrased in$50,000 price bands and there were variations in the equipment provided in basic systems.
Table 2-1: Number and Cost of Commercial SystemsManufacturer No. HRMS Built Basic HRMS Cost
(excluding install.)Ocean Systems 88 < $50,000BMT-SeaTech 63 < $50,000Strainstall 44 $50,000 - $100,000SMS 21 < $50,000MCA Engineers 10 < $50,000Concept Systems 5 < $50,000SafetyOne 0 TBD
Note: Base systems varied -- a large number of Ocean System HRMS wereweather service with no hull stress, SafetyOne offered fiber optics.
More interesting were results from both manufacturers and users (only 8 responded to thesurvey) concerning HRMS objectives, tabulated in Table 2-2. Results reveal some differencesin manufacturer and user objectives. However, the user survey database is heavily slantedtoward US ships and one company, and does not necessarily reflect world-wide or countrywide statistics. Perhaps the only definitive conclusion is that US manufacturers and users do notyet seem overly concerned about meeting classification society requirements. One user did notbelieve classification society notation would reduce insurance rates, but believed that maintainingthe class notation would incur additional survey and repair costs.
Table 2-2: Summary of Manufacturer and User Surveys on HRMS ObjectivesManufacturers User/Operators
HRMS Objective VeryImportant Desirable
NotImportant
VeryImportant Desirable
NotImportant
Minimize slam/motions 7 - - 2 5 -Monitor hull stress 6 1 - 2 1 1Optimize Routing 2 5 - 1 3 3Engineering studies 4 3 - 4 - -Classification Society 3 2 2 - - 1Other (reduce repairs) 2Other (cargo loading) 1 1
Note: Not all respondents checked all survey boxes .

One of the most important questions asked of mariners was the frequency that current HRMSwere used during varying weather conditions. The results are shown in Table 2-3.
Table 2-3: HRMS Frequency of UsageWeather/Time Often Sometimes Seldom/Never
Storm Seas - Night 5 - -Storm Seas - Day 5 - -Moderate Seas - Night 2 2 -Moderate Seas - Day 2 2 -Mild Seas - Night 2 3 -Mild Seas - Day 2 3 -
Note: Not all responders checked all boxes. Support personnel did not answer this question.
Other interesting Operator Survey results included estimated cost (including installation) at anaverage of $100,000. This is more than twice the Manufacturer Survey. Differences could bedue to lack of information by the respondents or cost of installation. It is apparent that the costof installing equipment and running cable can be a significant percentage if done in a shipyard, afactor to be considered when specifying an HRMS. Users were split 4-1-3 on whether thesystem justified the cost (4 yes, 1 no, 3 not sure).
Blank survey forms have been enclosed in Appendix D. These may prove useful as purchasinginformation checklists or user Quality Feedback forms.
3.0 THE SEA ENVIRONMENT AND VESSEL RESPONSE
Different ship types, cargoes, routes, and modes of operation represent different risks, and theoptimal HRMS for a given application should consider all environmental factors and shipresponses critical to ship safety and performance. The three key environmental factors arewind, waves, and ice. Hull response is characterized either directly or indirectly by shipmotion (six degree of freedom), hull stress (global and local), stability, and poweringperformance.
Seas which are severe relative to the size and characteristics of a vessel can threaten itsstructural integrity, overwhelm its stability and buoyancy, impose damaging dynamic loads onthe cargo, and result in motions that diminish the effectiveness and comfort of the crew andpassengers. Ice hazards can sink a ship in a single catastrophic event. Although waves and iceare the primary sources of danger to ship structures, other environmental factors increase thepotential danger. Wind impairs ship stability and available power. Impaired visibility (fog,storm conditions, or nightfall) - increases the probability of damage by waves and ice. Even lesssevere weather can cause structural damage (springing, fatigue, etc.) resulting in repair expenseand lost productivity. Mitigating these danger and economic loss is a primary objective of anHRMS.
This chapter summarizes the external environment and typical responses for various ship types.By understanding the specific risks relative to their ship, the owner/operator can understand thekey phenomena requiring monitoring. Section 3.1 describes environmental phenomena, andSection 3.2 describes typical hull response for several ship types.
3.1 Environmental Phenomena
The key environmental threats to ship safety are wind, waves and ice. Wind plays a role as thesource of wave energy (most weather prediction codes are based on wind vector maps) and asa mitigating factor for stability and powering. It is not the intent herein to review the entire bodyof knowledge on weather, rather to explain how certain facets impact ship safety andperformance.
3.1.1 Wind
Wind results from geographic differences in barometric pressure, generally caused bytemperature differences. Storm waves are the result of wind, and wind measurements reportedby ships (in the Volunteer Observation Ship program) and other sources form the basis forNOAA and National Weather Service marine weather forecasts. Wind also directly impactsstability and performance. The athwartship wind vector induces a relatively constant heelingmoment which must be subtracted from the ship’s dynamic righting energy curve. Wind heelingmoment is a maximum typically when the ship is in a ballast (light) draft condition. Windincreases overall ship resistance, an effect that can be significant in storm conditions for shipswith large above-water projected areas. Since the wind may not be aligned with the principle

wave direction, both ship motion and ship performance will favor one angle to the waves versusthe symmetric direction. This fact has implications for computerized voyage optimization.
3.1.2 Ocean Waves
Ocean waves are generated by the transfer of energy and momentum from the wind to the sea2.Wave growth is limited by the equilibrium between wind energy input and the energy loss due tobreaking waves and non-linear transfer across the spectrum. In practice equilibrium can beapproximated as a function of wind duration and fetch. The worst sea conditions are associatedwith sustained moderate winds followed by a cyclonic storm. The significant wave heights aretypically more severe than those generated by hurricane-force storm winds (over 75 MPH)without prior sustained wind levels.3
Ocean waves are generalized into two broad categories. Storm waves (including extreme wavegroups) are found near the source of the disturbance that generated the wave system andinclude the full range of possible frequency components. Swells are the longer period, morepersistent components of the wave system which have propagated away from the storm. Bothwave categories pose hazards for ships at sea, but can have differing impacts on HRMS design.
Storm Waves and Wave GroupsStorm waves are characterized by a full range of frequency components and confused direction.The superposition of short and long period wave components creates a multi-directional waveenvironment, possibly complicated by swells from other weather systems. These conditionscreate waves and wave groups capable of producing large vessel responses. Wave groups formfrom the interaction of waves of different speed, and are common in rising, narrow banded,storm spectra seas. Wave groups consist of a finite series of regular waves with heights that varyfrom a maximum at the center of the set to minimums at the two ends. Even if the wave heightsare not large, their nearly equal periods may cause severe synchronous vessel response ifencounter frequency is close to a ship motion natural frequency.
In addition to regular groups of larger amplitude waves, storms produce extreme wave groups(EWGs) with unusually energetic and possibly breaking waves4. Unlike the almost solitary
2 Kroukovsky-Korvin, B. V.; “Theory of Seakeeping,” SNAME 1961. Initially the energy/momentum exchange is
linear, favoring waves traveling at the same speed as the mean wind. The process changes to include a couplingbetween wind turbulence and the existing or developing wave system, causing an exponential rate of wavegrowth and a large range of wavelengths. The sea continues to build until reaching a maximum somewhatbeyond its equilibrium condition with the seas then declining to final form.
3 Ochi, Michel K.; “Marine Environment and its Impact on the Design of Ships and Marine Structures,” SNAMETransactions Vol. 101, pp 673-704, 1993.
4 Ming-Yang Su; “Characteristics of Extreme Wave Groups, IEEE (Oceans ‘84). Both phenomena may be the resultof sideband instabilities rather than a simple beat. Waves propagating together experience local energy levelvariation as they interact, due to the non-linearity of the free surface condition In some cases, resonant couplingmay occur between wave components so that the mean value is non-zero. In that case the direction of energytransfer between wave components depends on their phases and results in some components extracting energyand growing at the expense of adjacent waves. The highest or extreme waves are found within EWGs which arethought to develop from such resonant coupling between a central wave and its sidebands.

higher waves in a regular wave group, EWGs have a mean length of about three waves with acentral extreme wave of unusual height and steepness. The central wave may be on the order oftwo to three times the height of waves outside the EWG, symmetrically positioned between atleast two adjacent waves which are also higher than the significant wave height of thesurrounding sea. The greater heights and close spacing of the three central waves in an EWGcan suddenly produce multiple, closely spaced towering walls of water and deep troughs, withsevere implications for ship safety.
Wave groups are also sites for breaking waves. Some observations suggest that more than twothirds of the breaking waves occur within storm wave groups. Breaking seems to occur mostcommonly in high energy waves near the center of wave groups and over a wide range ofsteepness. Recent analysis suggests that breaking irregular waves in a typical real sea may be aconsequence of the resonant coupling between the central wave and its sidebands in an EWG5.Breaking waves are dangerous because of the energy transferred suddenly to a vessel. Theenergy from a breaking wave may be four times as great as for a non-breaking wave, possiblyresulting in damage to a vessel’s structure or capsizing. The prediction and avoidance (ormitigation) of storm sea phenomena is a primary objective for an HRMS. In particular, theability to detect “monster” waves may be a worthy research objective for HRMS development,if detection (and response) can be initiated in time.
SwellsAs a wave system propagates from its source, the shorter length, lower energy componentsdissipate, leaving a residue of longer waves segregated by wave period (longer waves movefaster). These swells are the waves most commonly encountered at sea, accounting fornotorious conditions like the rollers of the “roaring forties” in the Southern Ocean. Swells followgreat circles and may travel great distances, especially in the Pacific Ocean. After traveling morethan 90° of the earth’s circumference, swell energy intensifies as alternate great circles convergetoward the anti-focus at 180° from the site of the wave system’s generation.6 Typically swellenergy travels at a velocity on the order of about 50 km/hour, and within a few hundred miles ofthe source, waves with periods less than 12 seconds have disappeared. Swells may retain theircharacteristic form for great distances even after passing though regions of severe adversewinds. Swells of 12 - 15 second period are a major cause of fatigue damage in longer ocean-going ships, producing higher hull girder bending stresses in large ships than do moderatestorms. The constant period nature of swells makes them a potential source of ship motionresonant response.
5 The resonant interaction between the central wave and its sidebands causes energy to transfer between the
trough and crest and the back and front faces within the central wave. As the energy of the crest and front aresimultaneously increased at the expense of the trough and back, the wave forms a steepening front face and thehorizontal velocity at the crest increases until it exceeds the wave’s celerity, forming a jet as the wave spills orbreaks. The complex energy transfer between the core EWG waves and within the central wave may make itdifficult to predict the likelihood of breaking waves by a single criteria such as wave steepness. For example,there is some evidence from sea data that suggests that waves may break at sea with steepness of about onethird the value derived as a breaking criterion from laboratory tests.
6 Cartwright, D. E.; “The Science of Sea Waves after 25 Years: Theoretical and Technical Knowledge,” RINA 1974.

3.1.3 Ice
There is an internationally accepted terminology for ice forms and conditions, coordinated bythe World Meteorological Organization. The terminology is used as a basis for reporting iceconditions by the Ice Branch, Environment Canada, and is outlined in the seventh edition onMANICE (1989). Some of the more common ice types are described below:
Drift / Pack Ice: Term used in a wide sense to include any area of ice, other than fast ice,no matter what form or how it is disposed. When area concentration ishigh (70%), drift ice may be replaced by the term pack ice.
Fast Ice: Ice that forms and remains fast along the coast, and is attached to theshore, an ice wall, an ice front, between shoals, or grounded icebergs.If Fast Ice is thicker than 2 meters above sea level, it is called an iceshelf.
Floe: Any relatively flat piece of ice 20 meters or more across.
Other ice types include ice island, ice shelf, icebergs, and nilas ice (thin elastic crust of ice).Ridged ice is ice that has been piled haphazardly one piece over another in the form of ridges orwalls, and is usually found in first year ice. The dynamics of pack ice may result in the ice beingput under pressure, frequently leading to deformation of the ice cover (ridged ice). Both thelateral pressure and the deformed ice ridges can impact safe navigation.
Different forms of ice can be distinguished on the basis of their place of origin and stage ofdevelopment, such as lake and river ice, sea ice, and glacier ice. Types of lake ice are identifiedas new (<5 centimeters), thin (5-15 centimeters), medium (15-30 centimeters), thick (30-70centimeters), and very thick (>70 centimeters). Sea ice is categorized as new ice, young ice(10-30 centimeters), first-year ice (30-over 200 centimeters), and old ice, stronger and usuallythicker than first year ice. Except for higher ice-class vessels, collision with old ice should beavoided. Excessive speed is considered to be a major cause of ship damage from ice.7
Ice imperils only the most northern and southern latitudes, and its presence is generallypredictable on a seasonal basis along defined trade routes. Examples include freshwater ice inthe Great Lakes and saltwater ice impeding trade in northeastern Canada and northernEuropean sea ports (Russia, Baltic Sea, etc.). Satellites and aircraft-based radars can usuallydifferentiate between first year and multi-year ice using scatterometry to measure the strength ofthe reflected signal.
3.2 Vessel Response
Given the dangers that exist in the marine environment, it is possible to define the types of hullresponse that may require monitoring.. This section describes general types of hull responses.
7 Ice Navigation in Canadian Waters, Canadian Coast Guard, Transport Canada Report TP5064E, 1992.

Table 4-1 in the next report section summarizes ship motions and stresses of importance tovarious ship classes. Hull responses can be categorized as follows:
• Ship motions• Hull Stresses• Stability• Powering
3.2.1 Ship Motions
Ships respond to ocean waves in six degrees of freedom: three translational (surge, sway, andheave) and three rotational (roll, pitch, and yaw). Roll, pitch, and heave are generally of mostconcern from either a synchronous motion aspect or extreme motion aspect. Responses are afunction of mass (including entrained water), damping (linear and nonlinear), restoring rates (i.e.,spring rates determined by hull geometry), and degree of resonance. Principle of NavalArchitecture (SNAME) contains a detailed explanation of ship motions. The implications ofship motion response for ship safety and performance can be summarized as follows:
Roll: Roll angle increases hydrostatic pressure head in fluid tanks, impairs reserve transversestability, and causes crew discomfort. Roll acceleration induces lateral cargo loads thatmust be resisted by horizontal constraints. Excessive roll motions in a storm will usuallycause the master to turn the ship into the waves, which usually increases hull girderstress. Since most roll damping is non-linear, synchronous roll can result in very largeangles. Roll can also induce sloshing in cargo oil tanks.
Pitch: Pitch accelerations generate vertical loads at the ends of the ship. Extreme pitch anglesresult in slamming, which in turn induces both local and global stress distributions.Synchronous pitch is common in head seas in waves of length about equal to ship’slength. Pitch (and trim) angles also induce hydrostatic pressure head increases at oneend of fluid (cargo or ballast) tanks. Pitching induces longitudinal sloshing in tanks,particularly in partially filled tanks.
Heave: Closely coupled with pitch, heave resonance is common in head seas. The key impactsare vertical cargo acceleration and increased relative deck/wave velocity.
3.2.2 Hull Stress
Hull girder stresses can be classified as either global or local in nature. Global hull girderstresses can be further categorized as either quasi-static, whipping, or springing. Local hullstresses can be induced by a number of different phenomena, including cargo loads, waverefraction, slamming, and ice impact. Each of these types of hull response are explained in thefollowing paragraphs.
Global Stress: Quasi-Static Hull Girder Stress

This term refers to both stillwater and wave-induced hull girder shears and bending momentsthat occur at the wave frequency. Stillwater loads accrue from differences in the loading curveand buoyancy curve along the ship. Maximum allowable stillwater stress values are establishedby the classification societies. Care must be taken during cargo loading and unloading thatmaximum allowable in-port values are not exceeded. Wave-induced hull girder shears andmoments are caused by the cyclic buoyancy of the wave superimposed on the ship geometry inquasi-static balance with ship mass accelerations. The sinusoidal moment component is alsotypically estimated by classification society rules to facilitate calculation of hull girder stress.Moment values are more a function of the projected wave length superimposed on the hull(wave length / cosine of the heading angle) than on the encounter frequency. However, pitchand heave resonance (a function of encounter frequency versus motion natural frequency) canincrease hull girder moment.
Large hull girder bending moments in response to extra-ordinary waves may result in structuraldamage that is global in nature, whereas smaller moments applied for millions of cycles may leadto fatigue at structural details.
Global Stress: Hull Girder WhippingWhipping refers to vibration of the hull girder in its first (two-noded) vertical and lateral bendingmodes as the result of some impulse load, such as slamming or ice ramming. Slams occur onboth the bottom and on the flare at the vessel’s bow. Bottom slamming occurs when the relativemotion between the vessel and the sea is severe enough to lift the forefoot clear of the sea. Theslam occurs as the bow re-enters the sea. Flare slamming may occur as the result of relativemotion between the vessel and the sea even without bow emergence, but can also occur withlittle relative motion between the vessel and the sea if the wave is steep enough. Bottom slamsare usually of shorter duration than flare slams8. The dominant slam depends on the ship type.A high-speed containership with finer lines forward and a flaring bow may experience greatereffect from a flare slam than a bottom slam, but the opposite will be true for a full-form tankerwith little flare. Whipping moment components of the same order of magnitude as the quasi-static moment have been recorded on an aircraft carrier experiencing flare slam9. Whippingvibrations and decay mechanisms are not well understood, but are generally less severe inflexible (i.e., high L/D ratio) ships. The whipping moment components are usually smallcompared to the quasi-static moment, but their frequency is high. Some work suggests thatwhipping may increase fatigue damage by 20% to 30%.10
Global Stress: SpringingSpringing is a steady state, two-noded vertical hull vibration excited by a wave encounterfrequency at or near the primary hull resonant frequency. Springing frequencies are typically anorder of magnitude greater than quasi-static bending (about one to two hertz), and the resultingsuperimposed moment contribution may be significant, especially with respect to fatigue.
8 Lewis, E. V.; “Structural Dynamics of Ships,” Royal Institute of Naval Architects, 1974.9 Lewis, E. V.; “Structural Dynamics of Ships,” Royal Institute of Naval Architects, 1974.10 Lacey, P. B. & Chen, H.; “Improved Passage Planning Using Weather Forecasting, Maneuvering Guidance, and
Instrumentation Feedback,” SNAME Los Angeles Metropolitan Section paper, 1993.

Springing is experienced by full-form ships with large L/D ratios (such as Great Lakes carriers)in small and moderate seas11.
Local Stress: Cargo LoadsCargo loading anomalies can often result in localized structural problems. Examples includeuneven loading in bulk ships (hypothesized to be the source of a number of bulk ship losses) andunequal hydrostatic pressure heads across tank boundaries. The ABS SafeHull codespecifically considers checkerboard loading in cargo and ballast tanks as a worst case. Loadingsequence can result in temporarily excessive local and global stress problems.
Local Stress: Wave RefractionAlthough hull girder stresses are not significant unless the wave projected length approximatesthe ship’s length, smaller waves impinging on the sides of ship can cause localized long termfatigue damage and cracking. The effect is intensified by wave reflection in beam seas. This hasbeen a problem on some TAPS trade tankers.
Local Stress: SlammingIn addition to exciting hull girder whipping, slamming causes damage to local bow structures.Bottom slamming in full-form ships usually results in dishing of the bottom shell plate, whereasflare slamming results in dishing of the side shell and sometimes loss of the flare strake.
Local Stress: Ice TransitLocal ice loads on a ship’s structure are complex. The danger of pollution from structuraldamage is more a function of local ice loading than global ship hull loading. Shipboardmeasurements have shown that amidships hull girder stresses induced by ice are typically lessthan those induced by open-ocean waves. The pressure and force encountered during ship-iceimpacts are random, and follow log-normal type probability distributions12. The area of the hullthat is highly stressed due to ice impact is dependent upon the type of operation (ramming,turning, etc.), and the local strength and geometry of the structure. Ice loads are non-uniform,such that high loads can be applied to a relatively small area of the hull (i.e., 0.5 m2). Inaddition, these loads can occur at a number of locations on the hull, predominately over the bowarea. In this respect, local ice loads are more difficult to “measure” than slamming loads. TableC-3 (Appendix C) provides information on ice loading strain rates. The table values indicatethat strain rates for ice loading in the local structure are similar to those for the global response,and that both of these are not significantly different from those experienced from sea loading.
3.2.3 Stability
A ship’s stability is a function of its geometric form, weight distribution, watertight integrity,and tank arrangement. Stability can be adversely affected by a number of environmental
11 Robinson (ABS Surveyor, June 1995) briefly describes the role of HRMS in analyzing springing problems on
Great Lakes ships.12 St. John et al, “Ice Impact Load Measurement Aboard the ODEN During the International Arctic Ocean
Expedition (1991),” SNAME Icetech ‘94, March 1994.

factors. Severe roll angles may lead to flooding of open ports or spaces as well as transverseshifting of cargo. Green water and icing may add topside weight. Ships perched on wavecrests may lose a significant amount of form derived stability, and be susceptible to broaching orcapsizing. Hull breaches during ice transit may lead to flooding or pollution, and possibly tosinking. Long-term averaging of roll angle can identify combinations of wind heel andpermanent list. Roll period averaging can deduce changes in metacentric height. The key pointis that stress monitoring is not necessarily the only benefit of HRMS.
3.2.4 Powering
Ship power plants are often based on calm water power curves plus allowances for losses inwind and waves. In fact, ship schedule and fuel performance are highly dependent upon theselected routing. Voyage planning based on predicted weather and known ship characteristicscan result in significant fuel savings and reduced repair bills, and sometimes result in earlierarrival. HRMS can be used to determine the relationship between ship performance (addedresistance, power) and weather (wind, sea state) on a full scale basis (see Section 5).

4.0 HRMS FUNCTIONAL REQUIREMENTS
When developing an HRMS for a specific ship installation, a number of questions must beconsidered:
• What types of environmental loading is the ship susceptible to?• Who are the system users (or “customers”), and what are their needs?• What measurements are required to provide the necessary data?
The answers will drive the specification of all HRMS subsystems. This chapter brieflycategorizes HRMS along these dimensions, and will provide a functional subsystem breakdownof a typical HRMS.
4.1 Ship-Based HRMS Functional Requirements
Many of the critical HRMS measurements are specific to ship type. Table 4-1 provides asummary list of key hull responses based on ship type, some obvious and some subtle. The keypoint is that ship characteristics should be reviewed when determining HRMS requirements.
4.2 HRMS Functional Requirements Based on Route
Trade routes have a significant impact on the loads that may be critical for a given ship design.For example, ship scantlings developed using ABS rules are generally based on North Atlanticservice with a cosine-squared wave heading distribution. This is a relatively conservative designbasis for ship class designs where actual trade routes are not known, or no fixed route will apply(typical for Military SeaLift Command charters). However, certain repetitive routes mayemphasize structural susceptibility to certain types of loads. Examples include:
• Ships intended to operate in polar regions will be subject to ice. HRMS sensingconsiderations could include hull stresses in ice zones, detection of floating ice, and remotesensor networks warning of ice pack / free ice locations.13
• Ships operating in tropic climates usually do not have wave-induced fatigue problemsbecause of the large time spent in calm conditions. Key concerns may be limited to weatherupdates (for major storms), stresses during cargo loading, and ship motions under certainswell conditions.
• TAPS trade tankers are subject to high winds, frequent storm seas, and very directional seastates.14 Cargo runs are made south with principal seas to starboard, ballast runs with seasto port, sometimes resulting in localized fatigue patterns.
• North Sea ships often see very steep waves due to shoaling effects on regular sea waves.Hull girder bending, slamming, and green water are all key concerns.
13 In order to maintain year-round port access, remote sensing / icebreaking networks have been formed in the
Baltic and Northeastern Canadian regions. The existence and location of ice is continually monitored by shore,sea, and aircraft assets, and icebreakers are dispatched as necessary to open shipping lanes.
14 Witmer, D. J. & Lewis, J. W.; “Operational and Scientific Hull Structural Monitoring on TAPS Trade Tankers,”SNAME Transactions Vol. 102, pp. 501-533, 1994

• Great Lakes bulk ships, typically designed with high Length/Depth ratios, are susceptible tospringing under certain lake wave conditions.
It is not possible to list all ship route variations herein. It is important for HRMS specification toconsider the types of environmental loads peculiar to the ship trade routes, and to includesensors to monitor the resulting key hull responses. Part of this research includes investigatingpast structural problems on the ship(s) in question as well as other similar ships involved in thesame trade.
Table 4-1: Common HRMS Requirements by Ship TypePassenger Ship • Ship Motion (roll)
• Bow Flare SlamTanker/Products Carrier • Midship Hull Girder Stress
• Bow/amidships Side Shell Stiffeners• Forefoot Slam• Explosive environment
Bulk Ships • Stillwater Hull Girder Stresses (cargo loading)• Cargo Hold Frame Stresses• Stress Concentrations at Hatch Corners• Forefoot Slam
Container Ships • Stress Concentrations at Hatch Corners• Hull Girder Torsion• Bow Flare Slam• Green Water over Bow• Whipping / Cargo Accelerations
LNG / Internal Tank • Forefoot Slam• Temperature / Explosive Atmosphere• Sloshing
Barges / Platforms • Towline / Mooring Tension• Motions & Inertial Forces• Lateral Motion
Naval Combatant • Bow Flare Slam• Firing Control Plane Deflections

4.3 HRMS Functional Subsystem Breakdown
Although commercially available HRMS’s can vary widely in sensor type, overall design intent,and general design, they can be functionally segmented into the following subsystems.
SensorsThe sensor subsystem includes all measuring devices provided with the HRMS, including localpower supplies, distributed signal processing, and test equipment. Power is often suppliedlocally to avoid the cost of running cable from the CPU. However, the quality of power atsome shipboard locations may be poor due to the size of other equipment in the area. A typicalexample is a strain gauge installed near the bow. Power surges associated with winch andwindlass operation may adversely affect sensor performance. Decisions must also be madeconcerning sensor output signal processing. If this function is performed at the CPU, then thecosts associated with multiple sensor installation can be reduced. However, analog signals arevery sensitive to degradation from cabling and junction box connections.
Input/OutputThe I/O subsystem consists of the data transmission network between sensor output and CPU,or between the CPU and remote network, and includes any signal conversion equipmentinherent to the transmission method. There are three available methods of data transmission:cabling, fiber optic cable, and radio link. Cabling is the most common method, and is relativelysimple on ships with protected passageways running between the Deck House (CPU) andsensor locations. However, ships carrying explosive cargoes require intrinsically safe cablinginstallations, and standard high-voltage cable may not be possible. Fiber optic cable datatransmission has been successfully proven in experimental trials, but the higher cost (due mainlyto signal conversion) and lack of prior commercial applications are drawbacks. SMS andMCA offer short-wave radio transmission, and have successfully installed this I/O variation onseveral barges and tankers. The only reported field problem has been occasional signal“spikes” due to radio interference (walkie-talkie, etc.).
CPUThe Central Processing Unit (CPU) is the heart of any HRMS, consisting of the centralcomputer hardware and software used to transform sensor signals into user-friendly datadisplays, to store certain data sets, and to transmit information into remote networks. All of themanufacturer survey responders currently use 486 or Pentium personal computers running onMicrosoft DOS or Windows. Data storage varies in type and capacity among manufacturers,including magnetic disk, tape, and optical disk.
One key aspect of an HRMS CPU is its ability to link with other shipboard systems, includingnavigational systems (particularly GPS if installed), cargo loading computers, ship poweringmonitors (RPM, SHP), environmental sensors (wind), and communication networks (includingMARSAT or other).
Display

Although data display is normally considered a part of the CPU function, we list it as a separatefunctional subsystem due to a number of specific design criteria. Displays must be user friendlyto control, easy to read, provide all relevant data to the user, and not interfere with night-timevision. An HRMS display competes with other bridge equipment for space and the mariner’sattention. It should therefore be unobtrusive until such time as realistic safety limits areexceeded, when the nature and severity of the alarm should be clearly and rapidly assimilated.
Remote NetworkAlthough this subsystem extends beyond the physical limits of the ship and therefore the basicdefinition of an HRMS, the integration of the shipboard system with both remote sensornetworks and information distribution systems represents the future of the industry and theultimate goal of the system -- to reduce danger to the ship. Section 5.0 briefly summarizes thecurrent status of remote sensing and communication networks.
The remainder of this SSC report describes HRMS requirements and current industrial state ofthe art in terms of the preceding functional subsystem breakdown structure. Section 6.0describes sensors, Section 7.0 describes Input/Output, Section 8.0 describes CPU functions,Section 9.0 discusses Display issues, and Section 5 summarizes remote sensing.

5.0 REMOTE SENSING AND INFORMATION NETWORKS
The basic HRMS described in Section 4.0 is a ship-based unit with limited (line of sight) sensorrange that provides the mariner with environmental and hull response data on a real-time basis.As such, it is a tactical system, capable of alerting the mariner to immediate dangers andassisting with ship handling decisions. However, a ship-bound HRMS does not providestrategic data, and cannot show the best course to avoid future storms, ice, or other dangers tonavigation and operation. By combining shipboard systems with remote sensor platformsthrough information/communication networks, it is possible to optimize ship routing on the basisof weather predictions, ship motion, fuel economy, and/or other constraints. Although adetailed discussion of remote sensing is beyond the scope of this report, this section brieflydescribes the state of the art and the potential to improve ship performance through optimizedvoyage planning.
5.1 Remote Sensor Platforms
There are a number of environmental sensor platforms deployed throughout the world toprovide data for both generalized and specific maritime purposes. These include fixed landstations, ocean buoys, ships, aircraft, and satellites. The capabilities and roles of each sensorplatform are described in the following paragraphs.
Fixed Land SensorsAlthough mostly limited to meteorological measurements (wind speed and direction,temperature, precipitation), land-based stations can provide Over-the-Horizon wind estimatesusing high frequency (6-28 Mhz) radio waves reflected off the ionosphere.15 Current usage isgenerally limited to meteorological reports, water depth16, and ice sightings.
Ocean BuoysThe Ocean Data Acquisition System (ODAS) is a network of buoys anchored in the deepocean areas off North America. Operated by the National Data Buoy Center (NDBC), morethan sixty buoys routinely provide weather and oceanographic data from stations in the Atlantic,Pacific Gulf of Mexico and Great Lakes via satellite transmissions to the National WeatherService (NWS). The buoys process twenty-minute sensor data sets and transmit the resultseach hour to the NDBC for further processing and weather/wave forecasting. The data from theODAS buoys is reported to be accurate within +/- one meter per second and +/- 10 degreesfor wind speed and direction.
15 Georges, T. M. & Harlan, J. A.; “Ocean-Monitoring Tests with the US Air Force Over-the-Horizon Radars”16 Tessier et al (1993) and Smith (1993) describes the development of COWLIS (Coastal Ocean Water Level
Information System, now called ODIN), a remote water-depth sensor information network developed to improvethe safety and efficiency of shipping along the St. Lawrence Seaway and eastern Canadian ports. Shippers canoptimize cargo load draft for current navigable river depths on a near-real-time basis.

ShipsWeather reports are routinely forwarded every six hours to NOAA from ships participating inthe US Voluntary Observing Ship Program. Observations include weather (temperature andwind speed) and best estimates of sea, ice, and visibility. The Voluntary Ship ObservationProgram provides about 30,000 reports from about 1000 ships each month. The data isdistributed by the national Ocean Weather Service via the Global Telecommunications Systemto most countries, and is routinely used for weather forecasting17. The program has existed forseveral decades and is a lineal descendent of the USCG Ocean Weather Station shipsestablished about fifty years ago. Wave prediction is the most important use of this data forHRMS. State of the art wave forecasting can predict enroute wave conditions from ageographic grid of barometric pressure or wind conditions over the ocean as much as five daysin advance, making it practical to avoid the worst seas by prudently choosing course and speed.
AircraftAlthough the most publicized use of aircraft involves hurricane tracking, they are also usedroutinely to scout ice conditions in polar regions18. Aircraft have also been used as SyntheticAperture Radar (SAR)19 platforms for estimating sea states, but applications to date have beenexperimental in nature.
SatellitesAlthough satellite sensing technology has progressed rapidly since its inception in the 1960’s, theaccuracy and data processing capabilities have only recently been sufficient to support accurateweather forecasting. Sensor development has been focused in three areas: AVHRR to sensesea temperature and map sea currents, radar altimetry to measure wave height, andscatterometry to indicate wind vectors and ice.
AVHRR (Advanced High Resolution Radiation) sensors have been flown on satellites byNOAA since 1978. AVHRR sensors detect infra-red radiation as a measure of the seasurface temperature. There are usually two AVHRR satellites in polar orbit on 24 hourcycles, phased 12 hours apart for day and night readings. AVHRR data is most helpful tooceanographers for tracking ocean currents, but it has been used to assist ocean racingyachts. Clouds interfere with AVHRR sensors, but useful information can sometimes beobtained by constructing a composite image from multiple images.
17 Baron (1990) provides an overview of the VOS program, including VOS/GOS, GTS (Global Telecommunications
System), and GDPS (Global Data Processing System). Szabados (1985) describes the semi-automated datacollection and transmission system installed aboard some ships to improve the quality and timeliness of weatherreports from VOS ships.
18 “Ice Performance and Navigation,” Ice Tracks-Summer 1996, a Canarctic company publication, summarizes icetracking. Canarctic equipped the MV Arctic with down-link stations for SAR and NOAA imagery. Leavitt, E. D.& McAvoy, G.; “Remote Sensing in Ice Navigation,” MTS Journal Vol 21 (1987) briefly summarize typicalairborne sensors, including pulse radars for measuring ice thickness.
19 Alpers (1992) provides an overview of SAR measurement of wave spectra, particularly the growing consensus insignal processing to obtain accurate wave data.

Radar altimetry is measurement of the distance between the spacecraft and the wave profileby radar. First demonstrated aboard NASA’s GEOS-3 in the mid 1970’s, altimetryaccuracy was not sufficient until the 1990’s to support HRMS objectives. Accuratemeasurement requires accurate knowledge of the satellite orbital variations, and in cloudconditions, the ability to correct for electrons in the ionosphere and water vapor in theatmosphere. Errors as great as ten meters were not uncommon until the launch ofTOPEX/Poseidon in 1992. Its orbit is known within +/-10 cm and it carries two pulse-limited radar altimeters capable of reducing antenna pointing angles and atmosphericinterference. As a result, TOPEX/Poseidon can measure sea surface distances within threecentimeters and wave heights within thirteen centimeters. Significant wave height can bedetermined from the shape of the radar altimeter return pulse (calm seas with low wavesreturn a condensed pulse, rough seas with high waves return a stretched pulse). Since thereis a high degree of correlation between wind speed and wave height, altimetrymeasurements should improve future forecasts. There is only one TOPEX/Poseidonsatellite currently on line, directed primarily towards research. Applications to state-of-the-art route optimization is likely within the next decade.
Satellite radars can measure sea wind vectors using a process called scatterometry.Scatterometry measures the strength of the return pulse of a radar altimeter to infer theroughness of the observed segment of the sea surface. A calm sea is a good reflector andreturns a strong pulse, but rough seas scatter the signal and weaken the return pulse. Speedis estimated from empirical correlation between return signal strength and wind speed. Thewind vector (speed and direction) is determined by using multiple beams that look at thesame spot on the sea surface from two orthogonal directions. The concept of satellite radaranemometry using scatterometry was first demonstrated aboard Skylab in the 1970’s andhas since matured as a technology. It was found that wind speed (rather than wave heightas previously supposed) correlated well with the loss of return signal strength.Scatterometry requires intensive computer reduction into wind speed and wave forecast, abarrier to real-time processing that continues to erode with advancements in computertechnology. Scatterometry accuracy suffers from the double-inference and also from rain,which reduces surface signal reflection. However, the most recent technical papers indicatethe potential for satisfactory results20.
Satellite-mounted radars have also proved effective in monitoring the ice pack. The strengthof the return signal is often effective in differentiating between first-year and multi-year ice.
20 Luscombe and Montpetit (1992) summarize the state of the art in satellite-based SAR (Synthetic Aperature
Radar) and supplementary sensors as applied to the Canadian Ice Community.

5.2 Communication/Information Networks
Data transfer among ships, sensor platforms, and shore-side computer processing assets21 hasevolved from an HF Radio infrastructure to a combined communication satellite -telephone(including the Internet22) infrastructure.
The current (but retiring) state of the art consists of Inmarsat A analog satellites in highgeosynchronous orbit. Four satellites are sufficient to cover the earth at its 22,000-mile orbit,but earth antennas are larger (and time delays longer) because of the distance. Inmarsat B, C,and M satellites featuring higher data transmission rates are now being added. Inmarsat B willreplace Inmarsat A over the next few years, and Inmarsat C is expected to satisfy GlobalMarine Distress and Safety System (GMDSS) regulations. Inmarsat M is similar to B, butslightly slower and less expensive. Inmarsat P is a future service under development to competewith the non-geosynchronous Low Earth Orbiting Satellites (LEOS)23. With 10 satellites at6,400 miles and 12 ground stations, communication is immediate with smaller equipment thanthe other Inmarsat services. GM/Hughes is expanding its Spaceway geosynchronous orbitsystem to nine satellites for full earth coverage as a response to competition from the LEOprojects.
Several LEOS-based communication systems are currently in development. ORBCOMM haslaunched the first of its 600-mile orbit satellites. A network of 36 satellites, accessible with ahand-held transmitter, will be suitable for digital data and limited packet size since groundcommunication is not continuous. IRIDIUM is the Motorola-Lockheed-Sprint systemconsisting of 66 LEOS orbiting at 500 miles. The system includes inter-satellite linking and apaging service. Since LEOS are not geo-synchronous, marine users benefit from systemsdeveloped to compete in the land-bound cellular phone market. Globalstar is a 48 satellitesystem that relies on ground “gateways” for linkage. At the far end of LEO technology isTeledesic, an 840-satellite network flying at 700 km (435 miles)24. This brainchild of Bill Gates(Microsoft) and Craig McCaw will reportedly cost $9 billion and will not be in place until 2001.Of all the LEO projects, it is most acclimated to high-volume computer data transfer.
The current challenges facing the communications infrastructure are transmission rate, cost, andstandardization. It would appear the existing competitive pressures to improve satellitecommunication performance will match development efforts in ship voyage planning.
21 Viehoff (1990) discusses the advantages and disadvantages of downlinking satellite AVHRR directly to the ship
versus to a shore data processing facility.22 McClain (1993) describes the California State University-Fresno WeatherLink networking tool for maintaining
and updating its selective weather database, including reports and satellite images.23 Story, Eugene D., “Future Prospects for Maritime Data Communications,” SNAME California Joint Sections
Meeting, 21 April 1995. Mr. Story, president of Marine Management Systems Inc., provides an excellentsynopsis of communications satellite systems and some of the standardization problems facing the marineshipboard information industry.
24 Gilder, George, “Ethersphere,” Forbes ASAP, October 10, 1994. Gilder provides a thorough discussion of thecompetition between cellular/digital satellite consortiums, with extensive comment on the Teledesic system.

5.3 Integration of Weather Forecasting and Ship Response.
The ideal integration between remote sensing and ship routing would consist of general(strategic) voyage route optimization based on weather predictions and calculated shipresponse25, updated and modified by an HRMS feedback loop at the ship (tactical) level toadjust ship handling for optimal performance and hull response in actual conditions. A numberof the key elements to this ideal system are already state of the art, including:
• Weather prediction (wind vectors and waves) using meteorological computer models.These models currently use buoy data and ship reports to generate wind vector grids andultimately storm movement and wave height estimates. The current buoy/ship data sourcepreference will probably swing to satellite assets as cost and computer processing timedrops, and satellite area coverage and sensor reliability increases.
• Characterization of ship wave response using SMP and related ship motion programs,• Improved computer software and hardware, and• HRMS systems capable of measuring local phenomena and the resulting ship response.
The missing elements are primarily system integration assets, including low-cost real-time datatransmission and processing, and software capable of projecting an optimum route throughpredicted weather on the basis of known wind and wave performance. It should be possibleusing probability decision trees to develop an optimal voyage, including heading and speed, toreach a destination with minimum hull response and fuel consumption within a given time. Sucha program would need continuous updating, but could be run ashore with results and expertguidance forwarded to the ship. Optimization programs could be analyzed for design constraintsensitivity to determine what ship changes would most improve economic efficiency (such asadding anti-roll devices to improve resistance to beam seas).
The potential of voyage planning was best demonstrated by ARCO Marine in 199326. TwoTAPS trade sister tankers departed San Francisco for Valdez at the same time and in the sameballast condition. Operating within a narrow corridor where timing and speed were the primarycontrol variables, the ship with voyage planning arrived 21 hours earlier (it departed a few hoursearlier), and the ship without voyage planning absorbed $400,000 in repair costs due to wave-induced damage.
Special-purpose integrated remote sensor networks are already in use to improve accessibilityto ice-bound ports in both Canada27 and the Baltic Sea. Aircraft, shore, and shipboard sensor
25 Dr. Henry Chen (1988) has been a lead proponent of this approach, describing the general methodology in Sea
Technology (1988) and reducing it in practice to shipboard equipment installation (Ocean Systems, Inc.).26 Lovdahl, Lacey, and Chen, “Advances in Computer Based Onboard Voyage Planning,” SNAME 1995 California
Joint Sections Meeting, April 22, 1995. Voyage planning was performed using weather predictions (wave heightand direction) from Ocean Systems.
27 ENFOTEC operates the ICENAV information service, which collects information on ice movement, ice edges,current dynamics, and other weather data using satellites (RADARSAT, ERS-1), aircraft SAR, and other remote

and processing assets are linked to map real-time ice conditions and to dispatch ice breakerswhen and where necessary to open shipping lanes. Application of networked remote and localsensor platforms to optimize routing for wind and waves is still developmental as an overalltechnology, but several companies have initiated R&D efforts to correlate HRMS sensorreadings with sea state, a key step in characterizing ship response to weather28
assets, and transmits the assembled information to ships (letter from David Green, ENFOTEC to Bruce Cowper,Fleet Technology Limited, dated June 13, 1996).
28 MCA Engineers has found strong correlation between forefoot pressure sensors and bow accelerometers in LNGHRMS data for regular seas. Both SMS and MCA have ongoing R&D efforts to back-calculate sea state fromHRMS sensor readings, and SMS has experimented with route optimization for TAPS trade tankers.

6.0 HRMS SENSORS
Sensor selection is the foundation for HRMS effectiveness. Sensors must be carefully designedand located to provide useful data. For example, strain gauges must be configured and locatedproperly to measure the desired stress component, and wind sensors must be located clear ofairstream altering shapes that distort measurement of true wind velocity. Sensors also must bedesigned for reliability and maintenance access, since their need is greatest when the weather isworst.
This report section provides a brief description of commercially available sensors, typical rangesand accuracy, and limitations. This description should allow an HRMS buyer to specify thecharacteristics suitable to his application at reasonable or optimal cost.
Table 6-1 summarizes the sensor suite offered by the manufacturers responding to the projectsurvey. None of the responders manufactured systems developed specifically for ice.However, a number of experimental systems have been installed on ice breakers, cutters, andsimilar vessels. Sensor characteristics and performance are described in a separate sectionunique to ice environs.
Table 6-1: Summary of Manufacturer Survey Sensor AvailabilityCompany Navi-
gationShip
Motions
ShipAccel.
Pressure HullStres
s
Slam Weather
Predict
Wind/Waves
Ship’sPower
BMT-SeaTech X X Flare/Bow
Deck,Side,Tank
X Wave SpeedHP
RPMConcept Systems X X X Side/
BottomDeck,Tank,Shell
X Wave
MCA Engineers X X X Bottom Deck X Wind SpeedHP
RPMOcean Systems* X X X X Wind
WaveSafetyOne X All
ZonesX Wind Speed
HPRPM
SMS X X X Side/Bottom
AllZones
X X WindWaves
SpeedHP
RPMStrainstall X Flare/
BowAll
ZonesX HP
RPM* Offered as part of Sperry Integrated Bridge package containing other sensors

6.1 Strain Gauges
Strain gauges are the primary method of evaluating the stress condition in the hull material.Although foil (electro-resistive) and long baseline gauges have long dominated shipboardinstallations, new technologies have been proven to provide equivalent technical performancethough possibly at higher cost. For purposes of this discussion, strain gauges are categorized as:
• Short baseline (measuring strain in material samples less than 1-inch long)• Long baseline (typically 2 meters long, oriented along stress axis of interest)• derived (estimated hull girder bending moment and stress using motion sensors)• Developmental (proven technology but not yet commercial state of the art)
6.1.1 Short Baseline (SBL) Strain Gauges
Short baseline gauges are typically 1/4-inch wire grids either bonded or welded to the structure.Foil resistance changes as the foil is stretched, providing a corresponding linear electrical signalusing a Wheatstone bridge. Strain displacements are typically measured along one, two, orthree axes, depending on the type of data required (axial strain can be read from a single axis).SBL gauges are the only reasonable option to derive shear stresses.
Relative advantages include low component cost, universal acceptance in the engineeringcommunity, and the ability to install in small spaces, particularly where a direct measurement oflocalized “hot spot” stress is desired. Disadvantages include directional accuracy (the foilelement must be properly aligned), installation-related bond failure (particularly in tanks)29, shortfatigue life, and analog signal degradation at cable junctions.30 Analog signals can be adverselyaffected by electrical noise and stray magnetic fields. Foil gauges are subject to temperatureerrors because of dissimilar metal temperature coefficients, but these effects can becompensated electrically using a temperature-compensated gauge with Wheatstone wiring.
Most foil gauges are bonded to the target structure using an epoxy. Weldable strain gauges area sub-group of the foil type, and are spot welded to compatible materials when epoxy bondingis not feasible or reliable.
The small voltages and currents used in electro-resistive SBL gauge design make themintrinsically safe in explosive atmospheres (but the power supplies may not be).
6.1.2 Long Baseline (LBL) Strain Gauges
29 Conversations with several “foil” strain gauge installers indicates reliability is highly dependent on the quality ofthe installation, including surface preparation, proper epoxy procedures, and the gauge/cable connection.30 Sensors provided with A/D conversion as close as possible to the gauge reduce the potential inaccuraciesassociated with electrical cabling.

Long Baseline (LBL) strain gauges are the configuration typically specified and provided for hullgirder stress measurements on commercial ships. They consist of long rods (about two meters)fixed at one end to the deck structure. Strain is measured by measuring displacement of the rodfree end relative to a fixed point on the structure. The length of the gauge allows relativelyaccurate uniaxial stress, provided the gauges are located so as to exclude secondary or tertiarystress distributions. Rod displacement is typically measured using one of three techniques:
• Linear potentiometer - this method is simple and uses low voltage and current. However,resistor life is limited (about 1 year), and contact problems often lead to noise spikes in theoutput.
• Linear Variable Differential Transformer (LVDT) - because this sensor has no contacts, itexhibits longer life and very precise measurement. However, the higher power requirementsmake it difficult to pass stringent intrinsic safety standards.
• Linear Displacement Transducer (Magnetostrictive Sensor) - this device measures the timeinterval between an interrogating pulse and a return pulse, generated by a magnet connectedto the rod free end. This device has longer life (no contacts) and is available with anIntrinsic Safety rating for use in hazardous materials, but is relatively expensive (about$1500).
6.1.3 Derived Moment and Stress Measurements
Significant research has been conducted into predicting hull girder moments and stresses usingship motion sensor readings in combination with calculated hull response characteristics31.Although this approach simplifies the sensor suite and support equipment required onboard theship, the accuracy is not within ABS guidelines for either real-time stress (strain) display (+/- 5micro-strains32) or fatigue “bin” sorting (50 micro-strain). Derived measurements have shownclose correlation in some applications33
6.1.4 Developmental Strain/Stress Measurement
This final category incorporates several emerging technologies with the potential for shipboardapplication. These include fiber optics, acoustic, and laser/radar ranging. The followingparagraphs provide a brief explanation and potential application for each.
31 Lovdahl, Lacey, and Chen, “Advances in Computer Based Onboard Voyage Planning,” 1995 SNAME Joint
California Sections Meeting, April 22, 1995. The authors acknowledge the contributions in hull stress predictionby Dr. Paul Kaplan of Hydromechanics, Inc. See also Kaplan, P., “Computer Simulation/Prediction of ShipMotions and Loads in a Seaway,” Seakeeping and Weather Symposium, RINA, London, 1995.
32 Micro-strains are the change in length of a gauge element normalized (divided) by the gauge length.33 Cheung and Vo at MCA Engineers have found close correlation between bow forefoot pressure and bow vertical
acceleration on an LNG tanker in regular waves. The correlation was sufficiently close to use bow accelerationfor slam prediction while the forefoot pressure gauge was awaiting installation.

Fiber Optics:Fiber optic strain gauges have been deployed and demonstrated at sea experimentally34. Theyare susceptible to the same temperature errors as SBL gauges. Although the fibers and gaugesare relatively inexpensive to procure and install, the coupling requirements render themexpensive, beyond “commercial state of the art” for conventional metal ships.
There are two primary types of fiber optic gauge design. The Bragg’s grating style35 measuresthe length change between two transverse “scores”, or grates. The distance between scoresestablishes whether the gauge is SBL or LBL in nature. Multiple gauges can be installed on asingle fiber, keyed by differing lengths between scores. Because of this feature, the BraggsGrate type gauge could be considered in applications where a large number of collocated straingauges are required, such as instrumentation of large panel areas for localized ice-inducedstresses. However, reliability would become a major factor, since fiber failure could cause“Christmas Light” failure of a large number of gauges. The I/O coupling problem is morecomplex for this style than for the second type. The Fabray-Perot gauge is an SBL style gaugemeasuring the length change between opaque bands at the end of the fiber. Only one gauge ispossible per fiber, but the coupling problems are not complicated by multiplexing.
Because of the I/O coupling cost, fiber optic strain gauges should be considered beyond thecommercial state of the art. Far less expensive and reliable gauges are available for typicalstrain measurements. Specific applications favoring the use of optic fibers include:
• Applications requiring large numbers of gauges in an explosive or liquid-immersedenvironment
• Military applications sensitive to Electro-Magnetic Pulse (EMP)• Unusual size or weight constraints• Availability of existing fiber optic trunk lines/coupling equipment36
• Strain in composite materials, where conventional strain gauges are unreliable and difficult toinstall. The composite materials community may drive fiber optic strain gauge developmentover the next decade.
Acoustic Strain GaugeAcoustic strain gauges37 measure sound waves induced into metal structures usingelectromagnetic acoustic transducers (EMATs). Developed specifically for instrumenting andinspecting bridges, they do not need to be in direct contact (i.e., they work through paint andrust) and are portable. Even if cost is not commercially competitive with other types of strain
34 Most noticeably, hundreds of fiber optic strain gauges were installed on the propeller on the USCGC Polar Star.
Fiber optics were used to overcome problems of size and cable routing associated with standard strain gauges.35 Xu et al (1994) describe temperature-insensitive installations of Bragg type gauges. Background on optic fiber
gauge types and applications was obtained from Dr. John Kosmatka, University of California - San Diego.36 Metre and Curran (1990) describe an optic fiber data network for a submarine combat system. SafetyOne, in
responding to the manufacturer’s survey, described their development of a fiber optic I/O network as a preludeto their HRMS.
37 The only manufacturer found to date is SonicForce Corporation, 30 Adrian Court, Burlingame, CA 94010, (415)692-4477.

gauges, acoustic gauges may be extremely valuable for calibration and verification. The firstcommercial units are anticipated to be available in late 1996.
Laser/Radar RangingThe current state of the art in surveying and ranging, whether by laser or radar, is about +/- 1mm (this equates to about +/- 1,000 psi over a 30-meter gauge length. Greater accuracy byradar would require shorter wavelength and/or phase measurement. However, radarwavelengths this short are impacted by atmospheric moisture. It is possible to measure withgreater accuracy using lasers, but at the expense of greater power and also with the risk ofmoisture-induced errors.
The measurement of strain over large distances is of limited value, since only average stress isderived over the measurement length. However, a single transmitter illuminating multiple targetscould be used to derive the stress distribution over the length of the ship, using only oneinstrumented emitter and receiver. We found no instances of near-term commercial applicationof this concept.
6.2 Ship Motion Sensors
Ships respond to a wave environment in six degrees of freedom: three translational and threerotational. Although roll, pitch, and heave are the most extreme and therefore the motions mostoften measured, the other motions (particularly surge) may become important in quantifying shippowering performance in waves. Ship motions represent key limits to operation for many typesof ships. Considerations include:
• Roll - crew comfort, stability, cargo loads, hydrostatic pressures• Pitch - hull girder stress, slam, green water, cargo loads, hydrostatic pressure• Heave - springing, cargo loads, hydrostatic pressure
Because ship motions are six degrees of freedom, it is often difficult to separate individualmotions, particularly if sensors are not located at the center of rotational motion. The use ofaccelerometers to separate motion components is often complicated by local structuralresonance problems. For instance, bow accelerometers often exhibit high readings whenlowering and raising the anchor. The current state of the art for motion sensors is summarized inTable 6-238
38 The table format and comments are adapted from a paper by Ashcroft, Goebel, and Hennessy, “Technology
Integration for Vessel Operations,” SNAME 1995 Joint California Sections Meeting, April 22, 1995.

Table 6-2: Summary of Ship Motion Sensor TechnologyMotion Sensor Type Advantages Potential Problems
Vertical Gyro Reliable, may be able to useexisting ship unit.
Drift, cost, power
Roll Magnetometer Moderate cost Calibration on steel ships&
PitchSolid State
Gyro (crystal)Low cost & power, unitspackaged with integral rates& displacements
Sensitive to external vibration
Solid StateGyro
(Optic Fiber)
New laser ring technology, nomoving parts
Expensive, not yetcommercialized for ship use
“Watson Meter” Reliable, accurate forpendulum-based design
Moderate cost ($2500)
Bubble / SimplePendulum
Low cost Inaccurate when not at centerof motion.
Gyro Compass Current state of the art Expensive, frequent serviceSolid State
Gyro (KVH)Low cost combination of rategyro and flux gate compass.
Unproved, unknown life andreliability
Yaw(Heading)
Solid StateGyro
(Optic Fiber)
New laser ring technology, nomoving parts
Expensive, not yetcommercialized for ship use
Flux GateCompass
OK for small vessels oncecompensated, low cost
Difficult to uses effectivelyunless able to swing vessel forcompensation
Magnetometer Moderate cost Calibration on steel shipsPiezoelectric
AccelerometerGood for machinery vibrationmeasurements
Unsuitable for ship responsefrequencies
SurgeSway
PiezoresistiveAccelerometer
Low cost, OK for short termship motions
Subject to temperature,cross-axis errors
Heave ServoAccelerometer
Excellent stability, accuracy,reliability
Expensive
CapacitativeAccelerometer
Moderate cost, performancenearing that of servoaccelerometers
Cross axis sensitivity higherthan for servo accelerometers
6.3 Environmental Sensors
This category includes all sensors that take direct measurements of the environment, includingwind, waves, temperature, ice, and location (navigation). Shipboard environmental sensors areusually less accurate than ship response (motion) sensors, and in many cases the remote sensingtechnology is more accurate. Ice sensors are non-existent beyond visual observation, remote
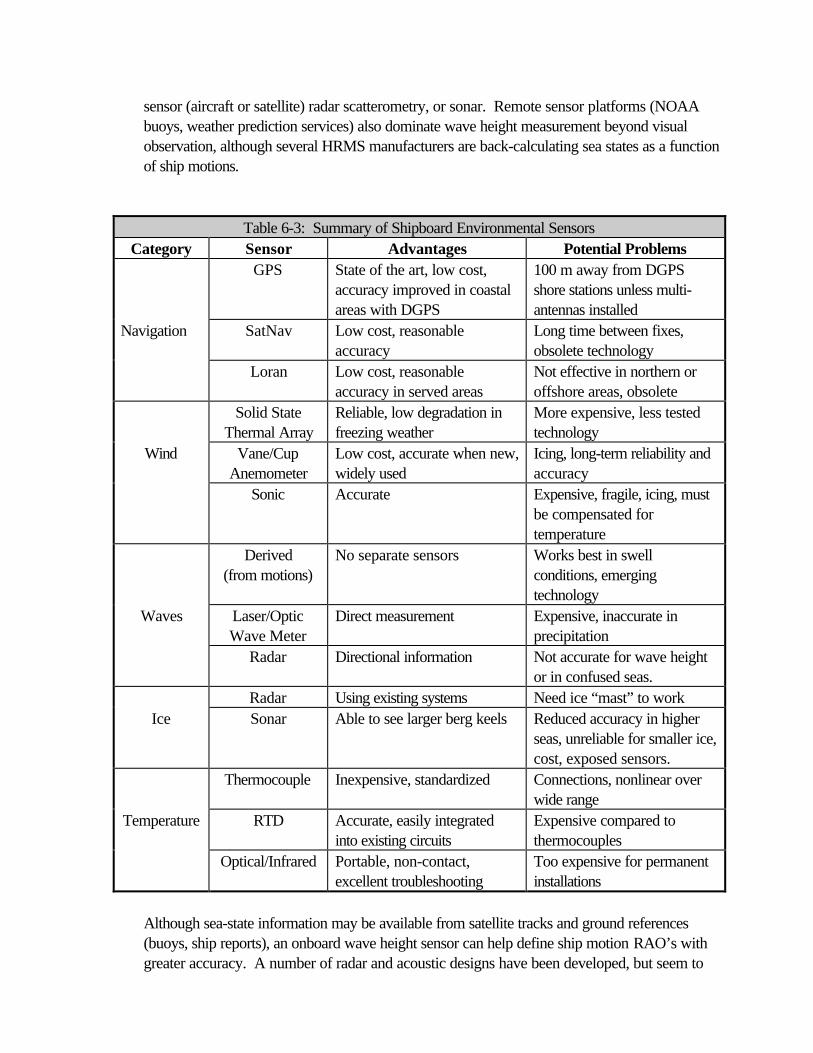
sensor (aircraft or satellite) radar scatterometry, or sonar. Remote sensor platforms (NOAAbuoys, weather prediction services) also dominate wave height measurement beyond visualobservation, although several HRMS manufacturers are back-calculating sea states as a functionof ship motions.
Table 6-3: Summary of Shipboard Environmental SensorsCategory Sensor Advantages Potential Problems
GPS State of the art, low cost,accuracy improved in coastalareas with DGPS
100 m away from DGPSshore stations unless multi-antennas installed
Navigation SatNav Low cost, reasonableaccuracy
Long time between fixes,obsolete technology
Loran Low cost, reasonableaccuracy in served areas
Not effective in northern oroffshore areas, obsolete
Solid StateThermal Array
Reliable, low degradation infreezing weather
More expensive, less testedtechnology
Wind Vane/CupAnemometer
Low cost, accurate when new,widely used
Icing, long-term reliability andaccuracy
Sonic Accurate Expensive, fragile, icing, mustbe compensated fortemperature
Derived(from motions)
No separate sensors Works best in swellconditions, emergingtechnology
Waves Laser/OpticWave Meter
Direct measurement Expensive, inaccurate inprecipitation
Radar Directional information Not accurate for wave heightor in confused seas.
Radar Using existing systems Need ice “mast” to workIce Sonar Able to see larger berg keels Reduced accuracy in higher
seas, unreliable for smaller ice,cost, exposed sensors.
Thermocouple Inexpensive, standardized Connections, nonlinear overwide range
Temperature RTD Accurate, easily integratedinto existing circuits
Expensive compared tothermocouples
Optical/Infrared Portable, non-contact,excellent troubleshooting
Too expensive for permanentinstallations
Although sea-state information may be available from satellite tracks and ground references(buoys, ship reports), an onboard wave height sensor can help define ship motion RAO’s withgreater accuracy. A number of radar and acoustic designs have been developed, but seem to

work best for fixed platforms. An over-the-bow unit was developed using a Thorn/EMI pulsedinfrared band laser mounted over the bow (looking forward, at a 12.5° angle from vertical)conditioned to remove ship motions from the relative motion readings.39 The Russians have alsopioneered development in this area.40 Pulsed laser wave height gauges range in cost from $15Kto $30K, depending on the amount of signal conditioning and modification.
Shipboard wind measurements form the backbone of the VOS program. Thousands of reportsare collected for meteorological forecasting. Wind measurement accuracy suffers fromairstream flow interference by the ship’s hull and house, and by distance above sea level.Selecting and documenting the least impacted sensor location is important. Locations atop themast are best, but suffer impaired maintenance access. Table 6-3 summarizes the current stateof the art for shipboard environmental sensors.
6.4 Other Sensors 41
Other sensors that may either be a part of an HRMS or may need to be integrated include:
• Ship performance measurements, including shaft RPM, Horsepower, and speed through thewater, will provide measures of propulsion efficiency relative to environmental conditions.Speed and heading (covered under yaw sensors) are important marks to evaluate therelative effectiveness of ship handling changes.
• Pressure gauges are used in an HRMS most frequently to measure slamming pressures andin-tank loads. Germanishe Lloyd’s is initiating a project to instrument hydrostatic pressureson a bulk ship. Underwater gauges should be replaceable without entering drydock.Pressure gauges should not be overly damped if slam pressure accuracy is desired. Theuser surveys indicated that pressure sensors were the most frequent HRMS equipmentfailure.42
6.5 Sensors for Ice-Class Vessels
Ice sensors can be grouped into two categories: avoidance sensors for open ocean transit andhull stress monitors for transit through sheet ice. The first category is beyond the scope of thisproject, but current technology is summarized for reference.
39 Ship Structures Committee Report No. 362.40 Sviridov, S. A.; “States of Arts on Laser Remote Sensing Techniques of Sea Surface Roughness in Russia,” IEEE
Oceans ‘93, page I-473.41 Ashcroft, Goebel, and Hennessy (Scientific Marine Services, Inc.) provide an excellent summary of the current
design status of a number of miscellaneous ship sensors in “Technology Integration for Vessel Operations.”42 Most of the surveys came from ships using one specific pressure gauge model: replacement units have been
much more reliable.

Remote SensingA number of countries maintain an iceberg surveillance and notification system for alertingmarine traffic to the presence of icebergs. The emphasis is shifting from terrestrial sensor assets(ships, buoys, and aircraft) to satellites43 as the technology matures.
Visual / RadarVisual lookout is still the most reliable sensor for ice of all sizes, but is of course limited bydarkness and weather. Radar is effective in identifying ice with a large above-water profile, butnot for barely awash ice (particularly as the weather rises). Pulse radars are under evaluationfor measuring ice thickness, but dependability is questionable44.
SonarSuccess has been mixed. Although sonar can identify larger ice keels if the waves are not toohigh, effectiveness decreases with decreasing ice size. Sonar sensors are also in an exposedlocation, and will likely be damaged during transit of sheet ice45.
It is apparent that prudent mariners must use all available resources to avoid ice in open waters,including visual, radar, and remote networking.
Hull Stress Monitoring for Ice-Induced LoadsNone of the respondents to the manufacturer’s survey provide ice-induced hull responsesensors or support equipment beyond what is normally provided for open ocean operations.The most common use of HRMS on ice-class vessels has been for research purposes, thoughattempts have been made to provide an “operational” display of the measurements to assist insafe navigation in ice. As part of this project, Fleet Technology Limited conducted a literaturesearch and informal industry survey to evaluate and define the current state of the art in ice hullmonitoring. Tables C-1 and C-2 in Appendix C summarize their findings for both localized andglobal hull responses on a number of vessels. Key findings included:
• Localized hull structure stresses frequently exceed material yield strength during icebreaking.An ability to adjust strain gauge zero-offsets must be provided for reset after plasticdeformation.
• Amidships hull girder stresses are generally less in icebreaking conditions than during typicalopen ocean storm transit. Maximum hull girder stresses during ice operations may occurwell forward of amidships, a consideration if hull girder strength is tapered fore (and aft) ofthe amidships 40% length.
43 Blackford et al (1994) describe the use of SAR and AVHRR satellite sensors to guide yacht racers and
oceanographic ships clear of ice in the southern polar area. McIntyre et al (1994) provide an excellent summaryof ice measurement and discrimination using various satellite radars.
44 Leavitt & McAvoy (198?) describe helo-mounted pulse radars in the VHF band to estimate ice thickness,including problems with accuracy. Echert et al (1992) describe their results in measuring ice thickness using theEM31 Ground Conductivity Meter. Accuracy is less for thinner ice, since the unit depends on differences inconductivity between the ice and the water underneath. Future developments of this device may lead tosatisfactory on-the-go measurements.
45 Leavitt & McAvoy (198?) also summarize work in hull-mounted ice-sensing sonars.

• Strain rates for ice loading in the local structure are similar to those for the global response,and both are not significantly different from global responses experienced from open sealoading.
• Localized ice loads (and potential hull breach) are not uniform and not well correlated withaverage loads (hence breach is difficult to predict from trend analysis). In other words, it isnot uncommon to breach the hull even though a distributive strain gauge grid indicatesstresses have not exceeded yield.
• The location and orientation of strain gauges depends on the ship structural arrangements.Therefore a specific requirement is not feasible.
• It would be prudent to measure local loads at areas other than the bow, where ice damagecan occur (midship waterline, etc.).
• The required number of sensors is dependent on a number of factors, therefore it is better tospecify the area of coverage rather than the number of sensors.
• A system measuring noise or other indicator of total energy expended during icebreakingmay offer an alternative means of covering large hull areas. Such a system is not state of theart, and must be developed.
• Current HRMS hardware and data acquisition equipment used in non-ice applications issuitable or adaptable to ice operation. However, sensor offset, arrangement, andanalytical/display software is quite different than for open sea loads.
These findings suggest the following developmental needs for ice-class vessels:
(1) Development of ship-mounted all-weather equipment capable of detecting ice masses insufficient time to take corrective action (changing speed and/or direction). Ship-mounted systems should be integrated with remote systems capable of displayingregional ice conditions.
(2) Development of sensor grids and analysis/display software capable of predicting packice characteristics, such as thickness and lateral pressure, as a function of speed anddirection.
(3) Development of sensor grids or new sensors capable of detecting hull structural yieldand rupture. In the interim, ships operating in pack ice must rely on reactive measuressuch as flood/other alarms for breach warning, inner hull separation of pollutants, ice-class scantlings, and similar measures.
Sensors and foundations installed on ships operating in arctic regions have additionalrequirements, including:
Temperature: +30oC to -50oCIcing: Up to 1 meter thick in exposed locationsAccelerations: +/- 2.0 g’sSampling Frequency 100 Hz for global and regional structureMaterial: Nil Ductility transition temperature of -50oC

for critical structural applications6.6 Recommended Sensor Range and Accuracy
It is not possible to fully specify the sensor suite characteristics for all applications. Commonsense must be applied to specifying sensors and HRMS capabilities. If the HRMS objective isto provide bridge personnel with visual indications of ship response, then the required accuracyand sampling rate are relatively low. If HRMS objectives include determination of maximumvalues for establishing operational policy and future design criteria, then accuracy and samplingfrequency must be better. Table 6-4 provides recommendations for three levels of purpose:ABS minimums (as indicative of classification society requirements), a minimum based onmanufacturer practice and bridge visual requirements, and one based on research objectives.The table values should be considered guidance only, and individual specifications should bebased on user need.

Table 6-4: Recommended Sensor AccuracySensor ABS Requirement Visual/Mfr Research
Navigation None 100 m As requiredRoll/Pitch: Range: None +/- 45.0 degrees +/- 45 degrees Accuracy: None +/- 1.0 degrees +/- 0.5 degreesYaw/Hdg: Range: None 360 degrees 360 degrees Accuracy: None +/- 1.0 degrees +/- 0.5 degreesAccel. : Range: None +/- 1.0 g +/- 5 g’s Accuracy: +/- 0.01 g’s +/- 0.02 g’s +/- 0.005 g’s Frequency: 3X req’d response 5 Hz As requiredStrain Gauge (no ice): Range: Yield Yield Ultimate Accuracy: +/- 5 micro-strain +/- 25 micro-strain +/- 5 micro-strain Sampling Frequency: 5 Hz 5 Hz 100 HzFatigue - bin size 50 micro-strain 50 micro-strain 10 micro-strainStrain Gauge (ice): Range: No difference Yield Ultimate Accuracy No difference +/- 25 micro-strain +/- 5 micro-strain Sampling Frequency No difference 100 Hz 100 Hz46
Wind: Speed None 0-40 m/sec 0-50 m/sec Accuracy None +/- 2.0 m/sec +/- 0.5 m/sec Angle None +/- 5.0 degrees +/- 1.0 degreesWave: Height None +/- 0.5 m +/- 0.1 m Period None +/- 0.5 sec +/- 0.1 secShip Perf. Accuracy: Speed None +/- 0.5 knot +/- 0.1 knot RPM None +/- 1.0 rpm +/- 0.1 rpm HP None +/- 2% +/- 1%Hydrostatic Pressure: Range: None 0 - 0.5 MPa 0 - 0.5 MPa Accuracy: None +/- 1.0% +/- 0.1%
46 It may be necessary to sample at much higher frequencies if performing research on individual hull panels
subject to high frequency impulse loading, such as HI-Shock. NAVSEA recommends sampling frequencies atleast twice the anti-aliasing filters. Sampling rates are part of a trade-off with data storage space andhardware/software capability.

7.0 SHIPBOARD DATA TRANSMISSION
The cabling infrastructure required to route power to CPU and sensor modules, and to transmitdata from sensors to the CPU, is the most straightforward (but often the most expensive) part ofan HRMS. There are a number of factors driving the selection of the power/data transmissionsubsystem:
• Number, location, and power/signal requirements of sensors• Signal degradation due to power variance, cable length, terminal corrosion, etc.• The presence of existing passageways or cable trunks in which to run new cable• Explosion hazards in various parts of the ship• Installation costs for new cable
Given these design factors, there are only a few options for the data transmission system:
1. Hard wiring2. Radio link between some or all modules3. Optic fiber network4. Combination
This report section briefly examines the advantages and disadvantages of each approach,delineating key options.
7.1 Hard Wiring
Hard wiring is the most common approach to installing hull monitoring systems. Protectedlongitudinal passageways require the least cable and installation expense, but such passagewaysdo not exist on many ship types, including tankers and product carriers. Several types ofshielded and grounded cable are available, and low-smoke manufacture is recommended forpassageways. Cables need to be grounded to prevent the possibility of static charge,particularly in an explosive atmosphere. Prior opinion (and USCG rules) indicated armoredcable for external applications. Long cable lengths and end connections sometimes lead tosignal degradation. Where applicable this can be overcome by providing pre-processors nearthe sensors.
7.2 Radio Link
Radio links between sensors and the CPU are only offered by two of the HRMS manufacturersresponding to the survey. Radio links have the advantages of eliminating spark hazard in anexplosive atmosphere and eliminating the cost of running wire (but at the expense of the radiotransmitter and antenna installations). This advantage is significant when cabling must be run inexposed areas where no existing cable trunk exists. However, radio linking becomes lessadvantageous in systems with a large number of distributed sensors, requiring multiple radiotransmitters. Radio transmission is susceptible to signal interference, causing erroneous data

blips. If needed, these blips can be removed from data storage by filtering or by a verificationprotocol between transmitter and receiver.
7.3 Fiber Optic Network
Fiber optic strain sensors have been used on an experimental basis for propeller blade stressmonitoring and by SafetyOne for hull girder stress sensors. However, there are no commercialsystems that currently feature fiber optic data transmission. Potential advantages includeinherent safety in explosive atmospheres and light weight/small size applications. Fiber opticsare being introduced into large numbers of military applications because of the inherentresistance to electro-magnetic pulse. The military development may ultimately push the cost ofoptic signal connectors and decoders down until a shipboard HRMS network is economical.
7.4 Power Supply and Distribution
Some HRMS manufacturers fully power all components from the CPU. This sometimesrequires the installation of additional, heavier cabling over long distances. Alternatives includelocal power supplies taken from the ship’s existing power distribution system. The risk in thisapproach is the quality of the supplied power - voltage spikes are common, particularly inforward areas where limited power may be supplied for large machinery. Power supplies musttherefore incorporate sufficient filtering and choking to maintain sensor power supply withinmanufacturer’s specified limits. ABS requires a minimum 4-hour Uninterruptible Power Supply(UPS) for units meeting the requirement of HM3-Voyage Data Monitoring.
Table 7-1: Summary of Manufacturer’s Survey on Input/Output CharacteristicsCompany Data Xmission
MethodI/O Channels Intrinsically
Safe?BMT-SeaTech Hard Wire 17 - 32 YesConcept Systems* RS485 Data
Link*> 64 Yes
MCA Engineers Radio LinkHard wire
9 - 16 Yes
Ocean Systems Hard Wire 9 - 16 NoSafetyOne Optic Fiber > 64 YesSMS Hard Wire
Radio Link> 64 Yes
Strainstall Hard Wire 9 - 16 Yes* Concept Systems offers radio link and fiber optic compatibility for some applications

8.0 CENTRAL PROCESSING UNIT (CPU)
The CPU is the central processing unit for the distributed HRMS. It queries the sensors,collects and processes the readings, and displays (and stores) the results in a user-friendlyformat.
8.1 CPU Hardware & Operating System
All respondents to the Manufacturer’s Survey supply IBM-compatible personal computers(most currently supply 486-66 or Pentium units) running on either MicroSoft DOS or Windows.None of the respondents listed either Apple or RISC/Workstation equipment. Buyers oftenhave the choice of having the computer dedicated to the HRMS or being available for othershipboard purposes. However, manufacturers prefer dedicated PC’s to maintain configurationcontrol over the HRMS. The cost of a single service call to reconfigure a sailor-modifiedsystem will generally be more than the cost of another PC. Table 8-1 summarizes themanufacturer’s survey responses for CPU questions.
Table 8-1: Manufacturer CPU SpecificationsManufacturer Hardware Operating System
BMT-SeaTech Pentium MS/DOS & Windows/NTConcept Systems Pentium MS Windows/NTMCA Engineers 486-66 Mhz MS/DOS & Windows/NTOcean Systems 486 or better MS/DOS & WindowsSafetyOne IBM Compatible MS Windows/NTSMS 486-66 Mhz MS/DOSStrainstall 486-66 MS/DOS & Windows
8.2 Software Considerations
Manufacturers generate their own proprietary codes to convert sensor readings, perform real-time calculations in support of display functions and statistical summaries, estimate sea-statecharacteristics from ship motions, and perform other specialty functions. Portions of thesoftware related to special purpose “cards” can be procured off-the-shelf. Specifically, cardsand software that poll sensors at rates up to 100,000 Hz are available. However, such high-rate polls exceed the capacity for hard disk transfer, and will fill available buffer storage rapidly.It is possible to trigger high polling rates for limited periods of time, subject to buffer storagelimits.
The most serious issues related to operating and specialty software are compatibility andconfiguration control. It is not atypical for HRM systems to be specially configured on a ship-by-ship basis, providing different sensor suites, alarms, and display screens. These differencessometimes result in problems for systems that use the same operating systems and specialtypackages. A change in operating system software (such as from Windows 3.1 to Windows 95
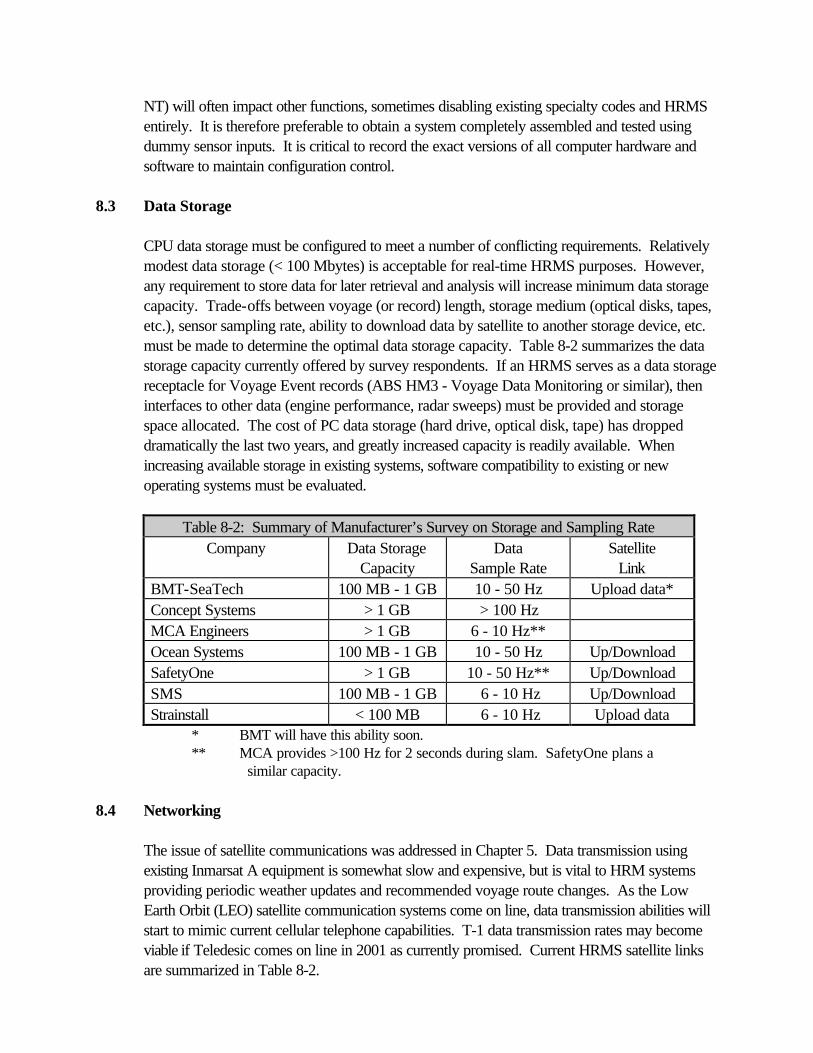
NT) will often impact other functions, sometimes disabling existing specialty codes and HRMSentirely. It is therefore preferable to obtain a system completely assembled and tested usingdummy sensor inputs. It is critical to record the exact versions of all computer hardware andsoftware to maintain configuration control.
8.3 Data Storage
CPU data storage must be configured to meet a number of conflicting requirements. Relativelymodest data storage (< 100 Mbytes) is acceptable for real-time HRMS purposes. However,any requirement to store data for later retrieval and analysis will increase minimum data storagecapacity. Trade-offs between voyage (or record) length, storage medium (optical disks, tapes,etc.), sensor sampling rate, ability to download data by satellite to another storage device, etc.must be made to determine the optimal data storage capacity. Table 8-2 summarizes the datastorage capacity currently offered by survey respondents. If an HRMS serves as a data storagereceptacle for Voyage Event records (ABS HM3 - Voyage Data Monitoring or similar), theninterfaces to other data (engine performance, radar sweeps) must be provided and storagespace allocated. The cost of PC data storage (hard drive, optical disk, tape) has droppeddramatically the last two years, and greatly increased capacity is readily available. Whenincreasing available storage in existing systems, software compatibility to existing or newoperating systems must be evaluated.
Table 8-2: Summary of Manufacturer’s Survey on Storage and Sampling RateCompany Data Storage
CapacityData
Sample RateSatellite
LinkBMT-SeaTech 100 MB - 1 GB 10 - 50 Hz Upload data*Concept Systems > 1 GB > 100 HzMCA Engineers > 1 GB 6 - 10 Hz**Ocean Systems 100 MB - 1 GB 10 - 50 Hz Up/DownloadSafetyOne > 1 GB 10 - 50 Hz** Up/DownloadSMS 100 MB - 1 GB 6 - 10 Hz Up/DownloadStrainstall < 100 MB 6 - 10 Hz Upload data
* BMT will have this ability soon.** MCA provides >100 Hz for 2 seconds during slam. SafetyOne plans a
similar capacity.
8.4 Networking
The issue of satellite communications was addressed in Chapter 5. Data transmission usingexisting Inmarsat A equipment is somewhat slow and expensive, but is vital to HRM systemsproviding periodic weather updates and recommended voyage route changes. As the LowEarth Orbit (LEO) satellite communication systems come on line, data transmission abilities willstart to mimic current cellular telephone capabilities. T-1 data transmission rates may becomeviable if Teledesic comes on line in 2001 as currently promised. Current HRMS satellite linksare summarized in Table 8-2.
9.0 DISPLAY
An HRMS display includes the graphic user interface (GUI) between the system and the user,plus any audio alarms. Modern computer programs allow the combination of real-time sensordata feeds with realistic visual displays that convey a high quality of information to the user.Display considerations include:
• Regulatory/classification society requirements• Concise information transmittal to all system users• Alarm needs and effectiveness• Human factors
This report section provides a framework for evaluating display requirements. Sample colorplots for several commercially available systems are provided in Appendix B.
9.1 Regulatory Requirements
Although Lloyds, DnV, and other regulatory agencies also have requirements for HRMS, wewill summarize American Bureau of Shipping requirements since they will most likely drive USinstallations in the near future. ABS requirements are relatively few and not overly restrictive,and include:
• Real-time or near-real-time display of critical parameters (slam warnings, green waterwarnings, motions, accelerations) on the bridge. The display must show trend over time asrelated to warning levels. Warning levels must generally be developed on the basis of ABSrule-allowable values or comprehensive analysis and/or testing, and must be submitted forapproval.
• Hull girder stress displays must show both stillwater and wave-induced components.Stresses must be shown as a function of time and longitudinal position. A display forstillwater stresses must be provided at the cargo operations area. Displays must show theeffects of speed or heading change over a relatively short period (10 minutes) to indicate tothe helmsman how ship handling changes are affecting stresses.
• Intensity reduction and revised color schemes must be provided for night-time operation soas not to impact mariner night vision.
• Alarms must not be overly sensitive or unnecessarily worrisome to prevent helmsman“sensory overload.” Sensory overload has been a significant problem for ice-induced hullstress monitoring systems.
Although the ABS Guide is not overly restrictive on display format, the requirements are difficultto meet using only one screen, or two screens with minimal switching. User-oriented displayrequirements are reviewed in the following section.

9.2 Display Design Driven by Users
The manufacturer’s survey indicated that most HRMS manufacturers provide five or morescreens, including real-time sensor displays, statistical averages, and replay (not real time)capability. Table 9-1 summarizes the results for several manufacturer survey questions.
An HRMS buyer should consider the needs of all system users. Users will certainly includeship’s force, but may also include support personnel tasked with developing operating policyand future ship design specifications. Different users will have different HRMS display priorities,such as:
Bridge Personnel- Emphasis on real-time data display- Minimum number of screens with maximum quality of information- Intuitive screens with simple shapes and pictures- Easy-to-see warning or alarm conditions- Simple controls
Cargo Loading Personnel- Single screen showing hull girder stress versus limits
Shore Support Personnel- Multiple screens with “data mining” options- Ability to replay and summarize- Emphasis on statistical measures- Ability to back-track responses to original sensors & wave conditions
Ship’s force and shore personnel will often have different display needs, and they may not beable to articulate specific needs until they have some operational experience with the system. Ingeneral, shipboard user needs will take precedence, but it is apparent from the manufacturer’ssurvey that all needs can be met.
Table 9-1: Summary of Manufacturer Survey on DisplaysCompany No. of
SensorsReal-TimeDisp. Per.
StatisticalPer. Avg.
ReplayPeriod
No. ofScreens
BMT-SeaTech All > 60 min 5 min-1 day > 2 hr > 10Concept Sys. All 1 min 5 min > 2 hr 1-4MCA Engineers All 1 min 5 min > 2 hr 1-4Ocean Systems All 1-60 min 5 min-1 day > 2 hr 5-10SafetyOne* On dmd On dmd On dmd On dmd On dmdSMS All > 60 min < 2 hr > 10Strainstall All 1-60 min 5 min > 2 hr > 10
*SafetyOne has not yet built a commercial system, but offers any range of display. Other companies will provide additional display capability if tasked as well.


Different HRMS manufacturers have resolved the display design problem in different ways.Appendix B contains display screens for several manufacturers. MCA provides a primaryoperational screen (Appendix B, page B-2) that displays the real-time value of all sensors usingrelatively simple shapes. Individual sensor traces are plotted in detail on secondary screens(page B-3), and trip summary experience for any sensor can be plotted as a function of shipposition trace (page B-4). Ocean Systems emphasizes weather prediction and voyage routing,and several of their screens (provided as part of an integrated Sperry Bridge design) are shownon Appendix page B-5. SMS emphasizes the use of simple hull shapes and bar graphs in theirscreen designs (page B-6). SafetyOne has developed display screens suitable for a largenumber of strain sensors as well as classification society style hull girder bending moment andfatigue plots (pages B-7 and B-8). Strainstall provides one of the more intricate views of a hullgirder with its CAD-style hull and bar graph plots (pages B-9).
9.3 Warnings, Alarms, and Event Predictions.
All surveyed manufacturers included visual and audible alarms. Table 9-2 summarizes thefunctions provided with alarms (visual and audible) and predicted on the basis of trend analysis,ship motion calculation, or other procedure.
Table 9-2: Summary of Manufacturer’s Survey Alarms & WarningsCompany Warnings (Visual/Audio) Event Prediction
Name Slam HullStress
PitchAccel
LoadPlan
Slam ShipMot’n
WeatherResponse
ArrivalTime
Fuel
BMT-SeaTech X X X X X X XConcept Systems X X XMCA Engineers X X X XOcean Systems X X X X X X X XSafetyOne X X X XSMS X X X X XStrainstall X X
Ice Alarms - The user’s survey indicated no specific complaints about HRMS alarms fortypical ocean-going systems. This was not the case for systems developed to measure ice-induced hull stresses. Interviews with personnel aboard ships fitted with ice hull monitoringsystems indicated that systems had been disconnected, primarily because of constant alarmssignals from local stress sensors. Bridge personnel tended to use physical indications of overallice resistance, primarily sound and ship motion, to determine ice-breaking limits. If one defineslocalized hull failure as a breach in watertight integrity, then there is no dependable correlationbetween global and local ice-induced hull stresses. Local yielding and failure can occur underrelatively light ice conditions, or may not occur in ice thick enough to stop the ship. There is aneed for further ice-class vessel sensor development as outlined in Section 6.5.

9.4 Human Factors
There are a number of human factors to be considered in any HRMS system. The best designstypically result from an interactive development process that teams the designer with the user.Witmer and Lewis47 credit much of their success in introducing HRMS onto BP tankers to theinteractive process between SMS engineers and ship’s force in developing the display screens.Key HRMS considerations include:
Night-time OperationsAn HRMS is most valuable at night in storm conditions, when bridge personnel cannot see thewave environment. It is important that the system have color schemes and light intensitycontrols to prevent interference with the watch-stander’s night vision. These requirements placea premium on lower frequency colors (red) and simple shapes that require a minimum ofcontrasting.
Color SelectionMariners have natural and trained perceptions of the relative importance of colors. In theUnited States, red and orange are associated with danger, whereas blue and green areassociated with acceptable or non-threatening conditions. Many, but not all, other culturesshare these color preferences, and crew nationality should be considered in control and displaydesign. Display screen color selection can generally be changed with very minor softwarechanges. HRMS buyers should not be hesitant to request color changes for screen graphicsand sensor displays.
Screen LocationScreen location will typically be a function of bridge layout, and is best determined by thecustomer rather than the manufacturer. When considering or specifying a system, the ability toview the HRMS screens on other video display terminals (possibly port navigation ECDIS)would be beneficial, particularly in crowded bridge arrangements. Screen location should alsobe considered in the context of priority during storm situations. Those sensors the crewconsider most important should be located most central to the helmsman’s field of view.
Heads-Up Display (HUD)48 is not yet state of the art for shipboard bridge controls. Weanticipate the automotive industry will lead commercial HUD development, and most automakers already have HUD’s in the R&D stage.
47 Witmer and Lewis, “Operational and Scientific Hull Structural Monitoring on TAPS Trade Tankers,” SNAME
Transactions Volume 102, 1994.48 Heads-Up Display is the process of superimposing optically generated images, such as gauge displays, with
line-of-sight vision using an intervening glass surface.

10.0 LOGISTIC SUPPORT
Most marine organizations (including the US Navy) have learned that an integrated LogisticSupport Plan is necessary for the successful introduction of new hardware at sea. Success inHRMS implementation and logistic support depends greatly on management support at both thecorporate and shipboard level. Maintaining HRMS equipment in proper running order isnecessary not only to support ship handling decisions but also to maintain classification whereapplicable49. Section 10.1 describes the logistic support facets to be considered by a buyer,and lists some of the options available. Sections 10.2 and 10.3 summarize the manufacturer andoperator survey responses respectively.
10.1 Logistic Support Procurement Considerations
Integrated Logistics Support refers to the overall design and system attributes necessary tooperate and maintain the equipment. In new one-off systems, it is not unusual for ILS costs toapproach those of the equipment procured. The following paragraphs summarize the ILSconsiderations for the HRMS.
TrainingTraining in system use, maintenance, and repair should be provided to all applicable crewmembers, including those with purchasing or supervisory control of the system. The besttraining includes actual use under adverse environmental conditions, whether simulated or actual.However, this type training is also the most expensive. The ship operator/owner must assesstheir own programs and personnel when deciding on training plans. Several levels are possible:
(a) Shoreside Training - this is generally the least expensive approach, since a large number ofpersonnel can be accommodated at one time. However, it is often the least effective sincethe training environment is usually not realistic and crew attentiveness may be lacking.
(b) Computer-based training (CBT) - CBT has several advantages. It allows the operator/userto train at their own speed and schedule. Although more costly initially, there are no follow-on costs for new crew members or refresher training unless the system is changedsignificantly. It facilitates at-sea training using the actual equipment. Disadvantages includethe loss of interaction with manufacturer’s personnel and loss of system use during trainingperiods. CBT requires personal discipline to make time to complete the training evolution.CBT effectiveness is enhanced through feedback on trainee problems and performance.
(c) At-Sea Training - Because of the individualized attention and realistic operating conditions,properly developed at-sea training will provide the best quality. However, it must be
49 The ABS “Guide for Hull Condition Monitoring Systems” specifies yearly surveys plus calibration and special
survey requirements. The unqualified requirement to maintain all HRMS gear in full operating condition maypreclude an owner’s desire to obtain classification society notation unless other conditions (such as a reductionin insurance rates) apply.
repeated for new crew members, and cost is usually higher because of the large amount ofconsulting time required.
(d) Operating Manuals - Operating manuals should be a part of any training program. The USmilitary has MIL-SPECS defining minimum content and standards. ABS requires anOperating Manual containing instructions on HRMS use, how to interpret results,maintenance and repair, sensor set-up and calibration, and verification procedure.Technical Manual quality is best when verification testing is invoked. Manual medium (hardcopy, CD/ROM) should be consistent with other manuals on the ship. Hard copies take uproom, but are accessible in the event of power or computer failure.
ReliabilityEquipment reliability is a function of operating environment, equipment design, componentprocurement, and system manufacture and installation. Lack of attention in any area can resultin poor system performance. There a number of ways a purchaser can evaluate and/or specifythe level of reliability in an HRMS:
• Interview other customers with parallel applications• Specify warranty, burn-in, and/or delivery/acceptance testing• Review manufacturer’s written QA plan (ISO 9000, MIL-I-45208, etc.)• Review/define levels of redundancy in combination with in-port and at-sea repair capability.• Review components against applicable “Qualified Parts” lists.• Require validation proof for minimum figure of merit, such as MTBF (Mean Time Between
Failures).
Reliability specifications involve cost, and the buyer must evaluate the relative importance ofvarious portions of the system. For example, the required reliability for data storage will differfor a user interested in real-time ship handling versus one interested in Voyage Event Records.
Maintenance & RepairAn HRMS buyer must be concerned with both scheduled and unscheduled maintenancerequirements. Scheduled maintenance can be performed by either the manufacturer or by ship’sforce. If ship’s force is responsible, then Technical Manuals must provide completeprocedures, including safety, tools and equipment, performance standards, and frequency. Welldesigned systems consider ease of maintenance, including access, modular replacement, toolclearance, and component interchangeability. Although onboard maintenance and repaircapability may be desirable from the standpoint of cost or operational flexibility, the increasedship’s force workload may not be acceptable.
Maintainability is often measured by MTTR, or Mean Time To Repair. Technical Manuals canbe improved by invoking verification testing to identify missing information or unforeseenmaintenance problems.
Spare Parts

It is critical that either the manufacturer or user maintain a reasonable spare parts inventory,especially for long-lead or proprietary items. The need (and expense) of spare parts inventoriescan be reduced by making maximum use of interchangeable components, “off-the-shelf”components, and components common to other systems. Spares inventories should be updatedto reflect system modifications.
Configuration ManagementThe rapid pace of computer hardware and software development combined with emergingsensor and network technologies invokes a requirement for Configuration Control.Configuration Control is necessary at both the system and component level, to insure allsubsystems function properly with each other, and that spares and other ILS assets (particularlyTechnical Manuals) are up-to-date.
10.2 Manufacturer Survey Results
All manufacturers responding to the survey offered training and Technical Manuals. Results arelisted in Table 10-1. A prudent buyer would examine examples of training plans and TechnicalManuals as an indication of ILS quality.
TABLE 10-1: Manufacturer Logistic Support ServicesManufacturer Training Operating Manual Maint/Repair Manual
Ashore Aboard Hard Cpy CD/ROM Hard Cpy CD/ROM
BMT-SeaTech X X X X X XConcept Systems X X X XMCA Engineers X X X XOcean Systems X X XSMS X X X XStrainstall X X X X
BMT and Ocean Systems offer On-line Help functions. SafetyOne is not listed since they do not have anyproduction units in place.
10.3 Operator Survey Results
The response rate to the Operator Survey mailing was less than 10%, with only eight responses.Two came from ship’s force on TAPS trade tankers, one from shore support and three fromship’s force on LNG tankers, and one from shore support on container ships. The results,although not statistically significant, are provided in Table 10-2 and 10-3 as empirical evidenceof user perceptions.
TABLE 10-2: Operator Rating of ILS ProductsILS Product: None or Not
ApplicablePoor or Marginal Good or
Excellent

Vendor Training 1 5 2Operating Instructions/Manual 5 3Maintenance/Repair Manual 6Spare Parts Availability 1 5Answers Questions Promptly 6Field Service 8“User Friendly” 1 7Overall Reliability 1 7*
* The most frequently cited equipment problems were pressure sensors and satellite link.

SR-1373:STATE OF THE ART IN HULL RESPONSE MONITORING SYSTEMS
APPENDIX ALIST OF HRMS MANUFACTURERS
UNITED STATESMCA Engineers2960 Airway Avenue #A-103Costa Mesa, CA 92626Phones: Voice (714) 662-0500
FAX (714) 668-0300Email [email protected]
Contact: Tim Vo, HMS Manager
Ocean Systems, Inc. / Sperry1330 Broadway #952Oakland, CA 94612Phones: Voice (510) 835-5431
FAX (510) 835-4202Email [email protected]
Contact: John Murk
Scientific Marine Services, Inc. (SMS)101 State Place, Suite NEscondido, CA 92029Phones: Voice (619) 737-3505
FAX (619) 737-0232E-mail [email protected]
Contact: Frank DeBord, Jr., President
UNITED KINGDOMBMT Seatech Ltd.Grove House, 7 Ocean WayOcean Village, SouthhamptonHampshire S014 3TJ, U.K.Phones: Voice (011) 44-1703-635-122
FAX (011) 44-1703-635-144Contact: Dr. Phil Thompson
** Broadgate LtdUnknown addressPhone: Voice (011) 44-
FAX (011) 44-1454-617-310Contact: Chris Winkley
A-1
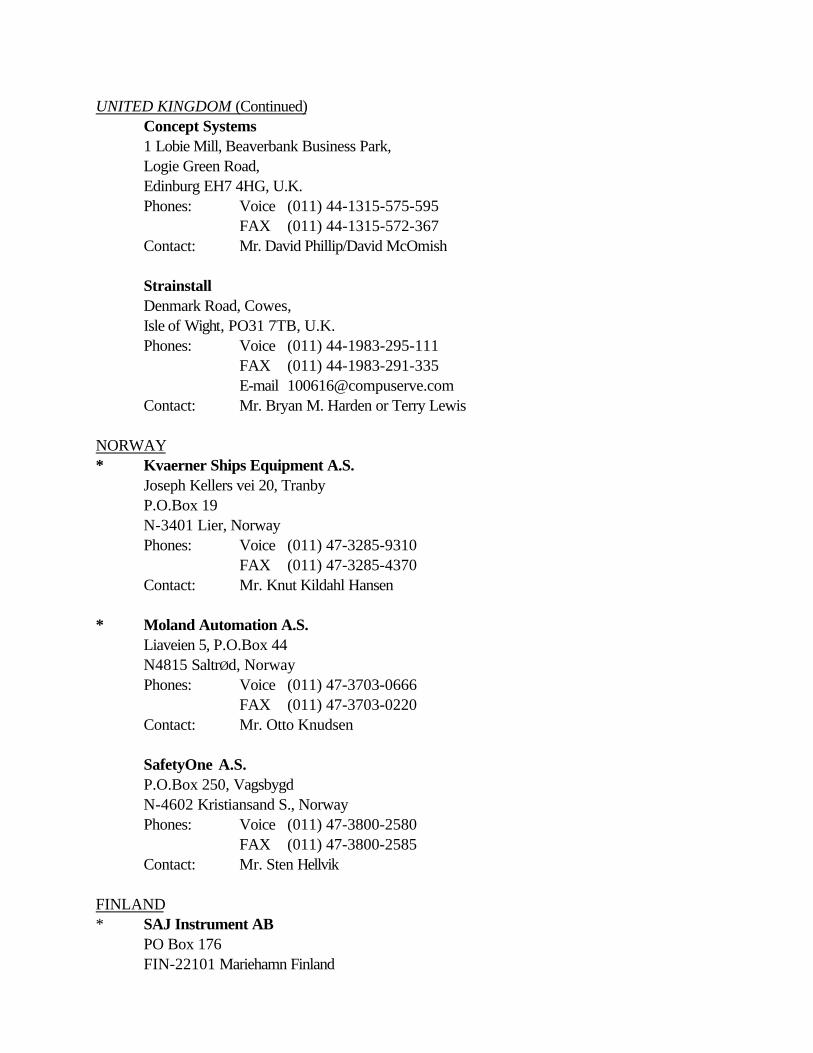
UNITED KINGDOM (Continued)Concept Systems1 Lobie Mill, Beaverbank Business Park,Logie Green Road,Edinburg EH7 4HG, U.K.Phones: Voice (011) 44-1315-575-595
FAX (011) 44-1315-572-367Contact: Mr. David Phillip/David McOmish
StrainstallDenmark Road, Cowes,Isle of Wight, PO31 7TB, U.K.Phones: Voice (011) 44-1983-295-111
FAX (011) 44-1983-291-335E-mail [email protected]
Contact: Mr. Bryan M. Harden or Terry Lewis
NORWAY* Kvaerner Ships Equipment A.S.
Joseph Kellers vei 20, TranbyP.O.Box 19N-3401 Lier, NorwayPhones: Voice (011) 47-3285-9310
FAX (011) 47-3285-4370Contact: Mr. Knut Kildahl Hansen
* Moland Automation A.S.Liaveien 5, P.O.Box 44N4815 SaltrØd, NorwayPhones: Voice (011) 47-3703-0666
FAX (011) 47-3703-0220Contact: Mr. Otto Knudsen
SafetyOne A.S.P.O.Box 250, VagsbygdN-4602 Kristiansand S., NorwayPhones: Voice (011) 47-3800-2580
FAX (011) 47-3800-2585Contact: Mr. Sten Hellvik
FINLAND* SAJ Instrument AB
PO Box 176FIN-22101 Mariehamn Finland

Phones: Voice (011) 358-28-16100FAX (011) 358-28-23199
A-2Notes concerning HRMS Manufacturers:
1. Manufacturer names and points of contact are provided for information only. The inclusion ofany manufacturer does not represent a recommendation or guarantee of any kind. Readers andbuyers should perform their own determination of equipment suitability for purpose.
2. Ocean Systems now provides their weather prediction system as part of the Sperry IntegratedBridge
3. Companies marked with “*” did not respond to the Manufacturer’s Survey4. Broadgate did not respond to the survey. Their primary product was described by secondary
sources as a Voyage Event Recorder. The VER is able to interface with a number of systemsand sensors, including the Strainstall HRMS.
5. SAJ did not respond to the survey. Their product is described in the May 1996 issue50 ofShipping World and Shipbuilder. Their system consist of two dynamic trim/heel measuringsensors installed at either end of the cargo block, allowing measure of the relative trim and heelangles. These can be used to calculate average bending moments and torsion. They also offera through-hull pressure sensor to measure draft.
A-3 50 We extend our appreciation to Robert Sedat at the USCG R&D Center for furnishing this information.
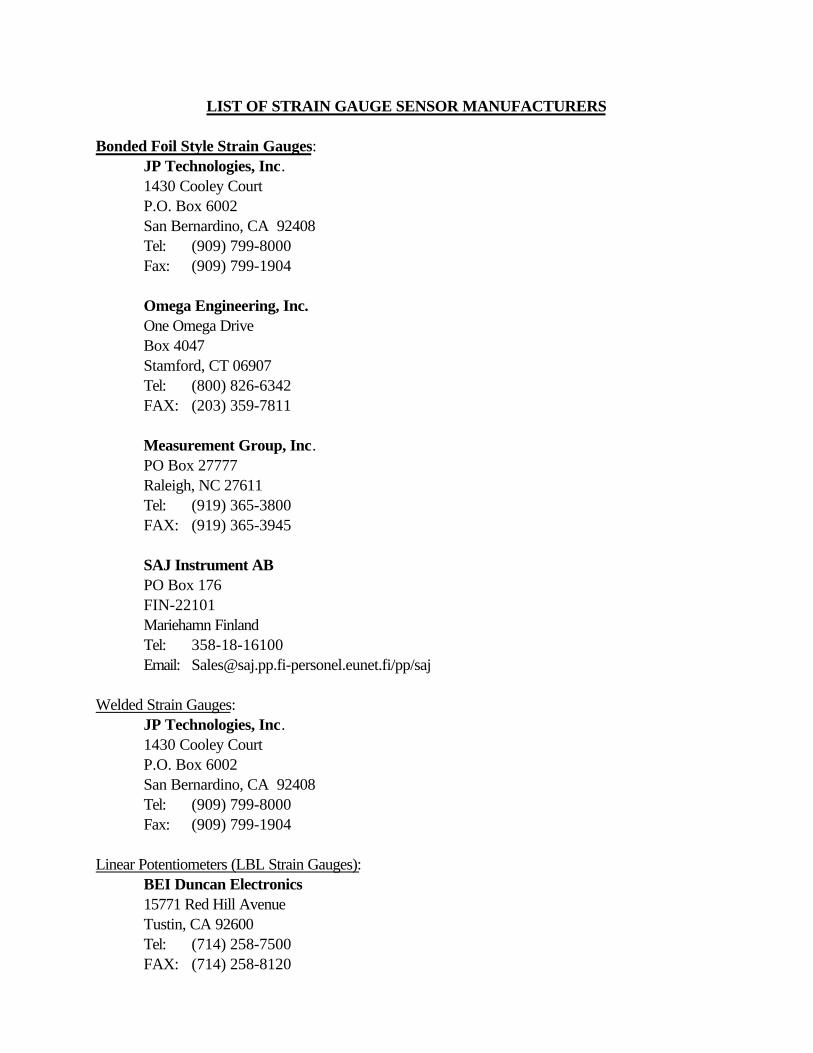
LIST OF STRAIN GAUGE SENSOR MANUFACTURERS
Bonded Foil Style Strain Gauges:JP Technologies, Inc.1430 Cooley CourtP.O. Box 6002San Bernardino, CA 92408Tel: (909) 799-8000Fax: (909) 799-1904
Omega Engineering, Inc.One Omega DriveBox 4047Stamford, CT 06907Tel: (800) 826-6342FAX: (203) 359-7811
Measurement Group, Inc.PO Box 27777Raleigh, NC 27611Tel: (919) 365-3800FAX: (919) 365-3945
SAJ Instrument ABPO Box 176FIN-22101Mariehamn FinlandTel: 358-18-16100Email: [email protected]/pp/saj
Welded Strain Gauges:JP Technologies, Inc.1430 Cooley CourtP.O. Box 6002San Bernardino, CA 92408Tel: (909) 799-8000Fax: (909) 799-1904
Linear Potentiometers (LBL Strain Gauges):BEI Duncan Electronics15771 Red Hill AvenueTustin, CA 92600Tel: (714) 258-7500FAX: (714) 258-8120

A-4
LVDT’s:Lucas Shaevitz7905 N. Route 130Pennsauken, NJ 08110-1489Tel: (609) 662-8000FAX: (609) 662-6281
Omega Engineering, Inc.One Omega DriveBox 4047Stamford, CT 06907Tel: (800) 826-6342FAX: (203) 359-7811
Fiber Optic Strain Gauging:MetriComp Systems Ltd5608-37th Street SWCalgary, AlbertaCanadaT3E 5M6Tel: (403) 246-1983FAX: (403) 240-1512
Pulse-Laser Wave Height SensorThorn/EMI
A-5

SR-1373:STATE OF THE ART IN HULL RESPONSE MONITORING SYSTEMS
APPENDIX B - TYPICAL DISPLAY SCREENS
Screen PageMCA Navigation Screen (Upper Figure) B-2
This screen shows ship’s position on a regional map. Ship motionamplitude can be overlaid on course plot during post-processing
MCA Operational Screen (Lower Figure) B-2Primary real-time screen showing ship motions (visual & digital) plusnavigation and stress bar charts
MCA Ship Motion Screen (Upper Figure) B-3Screen displays ship motion statistical data, and uses SMP to predictthe effect of course heading and speed change on roll and pitch
MCA Trace Screen (Lower Figure) B-3Screen shows trace of any strain gauge (stress) or ship motion overtime. This one illustrates the relationship between bow accelerometerand forefoot emergence (slam).
Safety-One Combined Stress Monitoring Screen (Upper Figure) B-4Screen displays stress for all ship-mounted strain gauges versus position
Safety-One Stress Trend Screen (Lower Figure) B-4Screen highlights single strain gauge where limits have been exceeded,including predicted trend.
Safety-One Fatigue Plot (Upper Figure) B-5Fatigue accumulation based on Miner’s Rule
Safety-One Stillwater Bending Moment (Lower Figure) B-5Screen shows long-term trace of moment with respect to classificationsociety limits
Strainstall Stress Reading B-6Operational screen display of multiple strain gauge locations using bargraphs with adjustable operating limits.
B-1
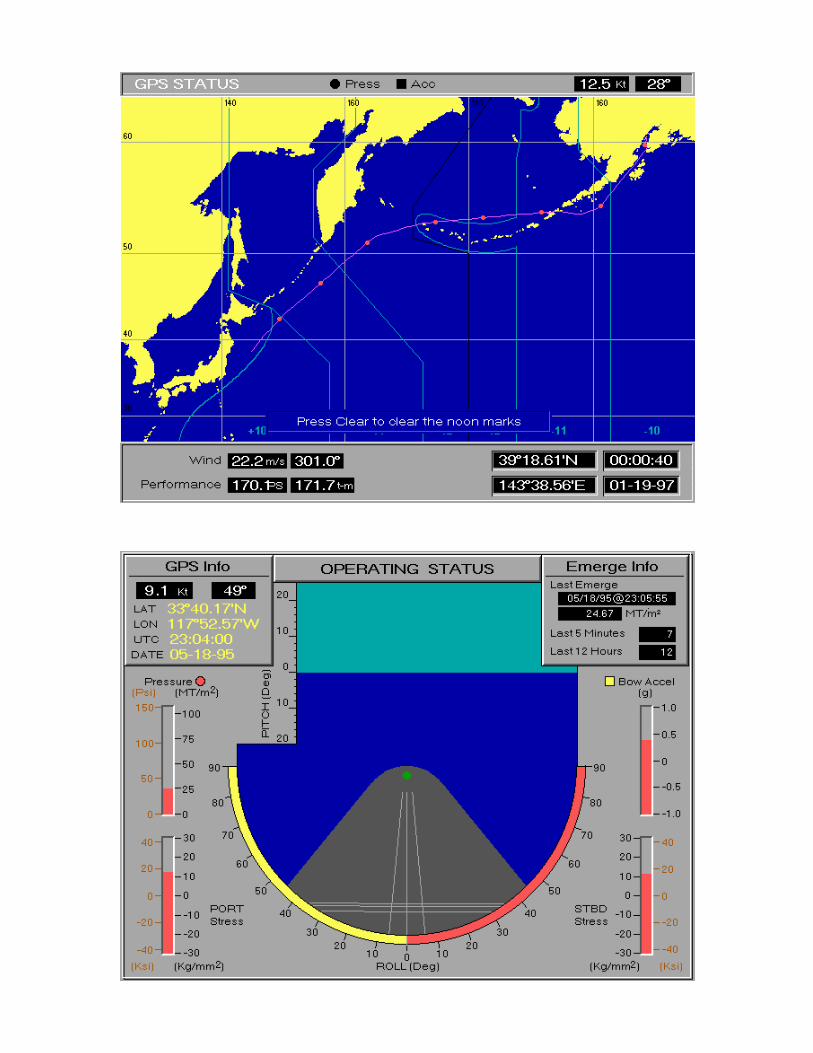


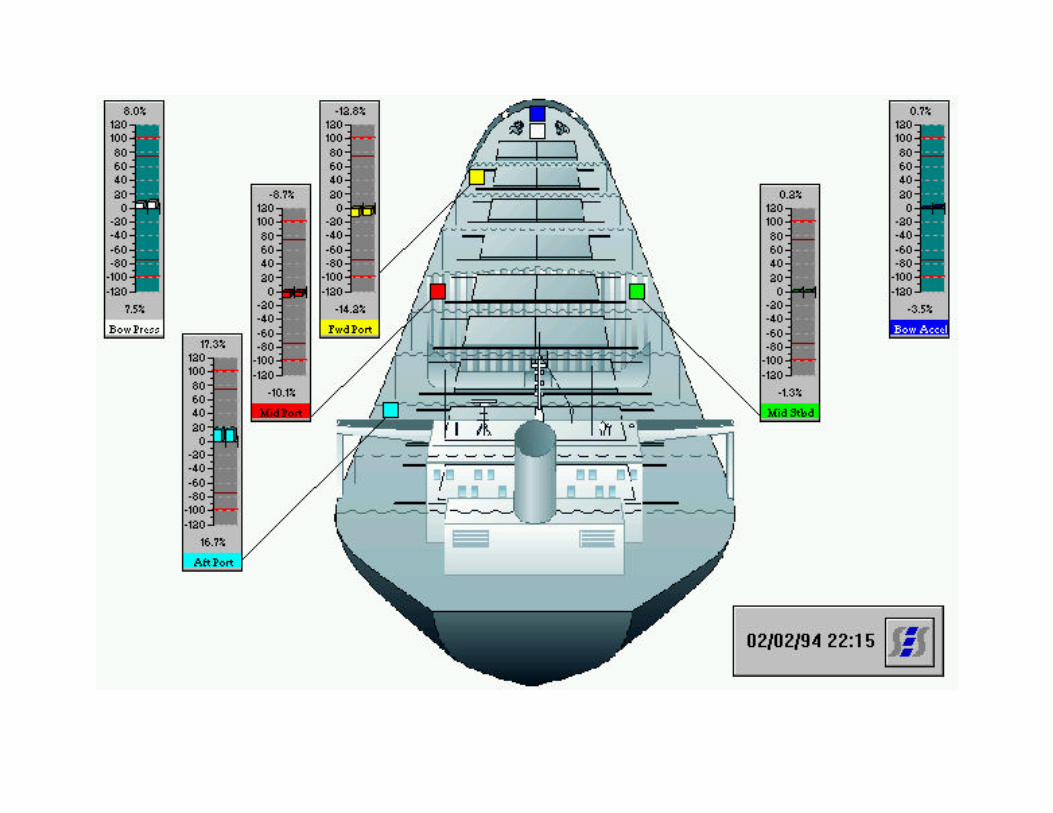

SR-1373:
STATE OF THE ART IN HULL RESPONSE MONITORING SYSTEMS
APPENDIX C: SUMMARY OF SECONDARY RESEARCH ON ICE LOADS
PageTable C-1 - Ice Breaker Hull Stress Measurements - Local Response Characteristics C-2Table C-2: Icebreaker Hull Stress Measurements - Global Response Characteristics C-3Table C-3 - Summary of Strain rates Measured in Ships C-4

C-1

Table C-1 - Icebreaker Hull Stress Measurements - Local Response Characteristics
VesselName
CACClass
Ice Type Location Test Date Data Rate(Hz)
Typical Response Characteristics - Local Loads/Responses
Nat. Freq.(Hz)
Duration (sec.) Max.Stress(MPa)
Location onHull
USCGCPolar Sea
CAC 2 First YearRidges
Beaufort SeaAlaska
October1985
100 NA 0.4 - 1.0 42 Bow CtrlineStem Bar
USCGCPolar Sea
CAC 2 Multi-Year
NorthChukchi Sea
1982 32 NA 0.5 - 1.0 ~ 345 Bow
MV Arctic CAC 4 Multi-Year
Strait BelleIsle
June,1984
NA NA 0.3 - 2.0 256 Bow
MV Arctic CAC 4 First Year EasternArctic
Nov./Dec1986
100 NA 0.3 - 2.0 51 SternFrame 34
MV Arctic CAC 4 Old Ice EasternArctic
Nov./Dec1986
100 NA 0.3 - 2.0 153 SternFrame 40
MV Arctic CAC 4 OpenWaterSlamming
North Atlantic Nov./Dec1986
100 NA NA 34 SternFrame 30
MVKigoriak
CAC 4 Weak 1st&2nd Year
Beaufort SeaNWT
1981(August)
100 NA 0.15 - 0.50 32 Bow
NB Palmer CAC 4 ThickFirst Year
Antarctic August1992
50 NA 0.15 - 0.5 ~138 Bow
Oden CAC 4 DecayingMulti-Year
Arctic Aug-Sep1991
50 NA 0.3 - 0.5 ~ 350 Bow
CCGS LouisS.St.Laurent
CAC 4 Multi-Year
Arctic August1994
100 NA 0.5 - 2.0 ~ 235 Side ShellStern

C-2

Table C-2: Icebreaker Hull Stress Measurements - Global Response Characteristics
Vessel Name CAC Class(Estimated)
Ice Type Location Test Date DataAcquisitionRate (Hz)
Typical Response Characteristics - GlobalLoads/Responses
Nat. Freq.(Hz)
Duration(sec)
Max.Stress(MPa)
Location onHull
USCGC PolarSea
CAC 2 First YearRidges
BeaufortSea Alaska
October1985
100 3.0 0.6 - 1.0 42 01 Deck
MV Arctic CAC 4 First Year Baffin BayArctic
Nov./Dec1986
100 0.9 0.8 - 1.0 47 Main DeckMidships
MV Arctic CAC 4 Old Ice Baffin BayArctic
Nov./Dec1986
100 0.9 0.8 - 1.0 57 Main DeckMidships
MV Arctic CAC 4 OpenWaterSlamming
NorthAtlantic
Nov./Dec1986
100 0.9 0.8 - 1.0 182 Main DeckMidships
MV Kigoriak CAC 4 First YearRidges
BeaufortSeaNWT
1983July
100 2.9 0.15 - 1.45 101 Main Deck
MV Kigoriak CAC 4 Multi-YearRidges
BeaufortSeaNWT
1983October
100 2.9 0.15 - 1.80 NA Main Deck
MV RobertLemeur
CAC 4 First YearRidges
BeaufortSeaNWT
1983July
100 2.2 0.15 - 1.45 128 Main Deck
Notes:1. Local load can be quoted in pressure (i.e., pressure gauge or by interpretation of strain-gauges ). However, the associated area in which the
pressure is applied must be specified. Local panel pressure increases with decreasing area.2. Local Loads: Bow, Side, Bottom, Stern3. Impact duration increases with increasing ramming speed.4. The “rise time” is generally 30% - 50% of the impact duration time.

C-3

Table C-3Summary of Strain rates Measured in Ships
(from Malik, L., Tomin, M. [26])
Vessel NameType
Location andCondition
Strain Rate(sec-1 )
Comments
Sealand McLean SL-7(Container)
Midships(50’ Seas, whipping)
1.1 x 10⁻³ 3.2 x 10⁻³ strain rate if yield strainreached in 1/4 cycle of whipping
Fotini L Ocean(Bulk Carrier)
Midships(Whipping)
9.0 x 10⁻⁴
Stewart J. Cort(Great Lake OreCarrier)
Midships(Springing)
5.1 x 10⁻⁴
Model Tests - 3.2 x 10⁻² Model Testing of CollisionsContainer Ship(Unknown)
- 6.0 x 10⁻³ Analytical estimates based oncollapse time of 0.18 sec. in acollision
I.B Sisu(Baltic Icebreaker)
Bow 6.0 x 10⁻²
0.1 to 0.140.1
- Measured during ice impact- Based upon extreme estimates- suggested to be used in analysis
MV Arctic(OBO)
DeckBow Plate
Bow Frame
7.3 x 10⁻⁴
5.0 x 10⁻³
2.5 x 10⁻³
Maximum Measured DuringRamming Ice
Kigoriak(Icebreaker)
DeckBow Plate
Bow Frame
2.0 x 10⁻³
3.2 x 10⁻³
1.3 x 10⁻³
Maximum Measured DuringRamming Ice
MS Attis Bow 8.8 x 10⁻³ Sea Slamming
C-4

SR-1373:STATE OF THE ART IN HULL RESPONSE MONITORING SYSTEMS
APPENDIX D: MANUFACTURER & OPERATOR SURVEYS
PageHull Response Monitoring System (HRMS) Survey for Manufactures D-2Hull Response Monitoring System (HRMS) Questionnaire for D-7Ship’s Officers/Operators

HULL RESPONSE MONITORING SYSTEM (HRMS)SURVEY FOR MANUFACTURERS
1. Please indicate your objectives for the HRMS: Very Not
Important Desirable ImportantTo minimize slamming or to reduce
ship motions � � �To monitor hull structure stresses due to
wave or ice conditions � � �Optimize routing to avoid weather, save
fuel, or control arrival time � � �Keep records for engineering studies, help
future ship design, etc. � � �To meet classification society (ABS,
Lloyd’s, etc.) designation � � �Other ___________________________ � � � ___________________________ � � �
2. What sensors do you currently offer?Yes Range / Accuracy
Navigation (GPS or other) � ___________________________Ship motions (roll / pitch) � ___________________________Ship accelerations (G-loads) � ___________________________Pressure:
In-Tank � ___________________________Side / Flare / Bow � ___________________________Bottom � ___________________________
Hull stress / strain gauges:Deck � ___________________________Ice zones (bow, etc.) � ___________________________In-tank � ___________________________Bottom shell � ___________________________
Slam detection � ___________________________Weather prediction & routing � ___________________________Environmental:
Wave � ___________________________Wind � ___________________________Ice � ___________________________
Ship Performance:Speed � ___________________________Shaft RPM � ___________________________Horsepower / Fuel � ___________________________
Other ____________________________ D-2

SURVEY (Page 2)
3. Is the system intrinsically safe in explosive atmospheres?� Yes � No
4. How many I/O channels can your system support:� 1 to 8� 9 to 16� 17 to 32� 33 to 64� More than 64 _____
5. How are the sensors connected to the central computer / display console?� Conventional hard wiring� Optic fiber� Radio Link� Other _______________________________________________________
6. What kind of computer is provided with your HRMS:� Apple / Macintosh ____________________________________________� IBM compatible (486, Pentium, etc.) ______________________________� Workstation (Sun, DEC, etc.) ___________________________________� Proprietary / Other ____________________________________________
7. What operating software is provided on the computer:� Apple / Macintosh� Microsoft DOS� Microsoft Windows / NT� UNIX� Other _______________________________________________________
8. What is your data storage capacity?� Less than 1 MB� 1 MB to 100 MB� 100 MB to 1 GB� More than 1 GB
9. What is the data (sensor) sampling rate?� Less than 1 per second (< 1 Hz)� 1 to 5 Hz� 6 to 10 Hz� 10 to 50 Hz� 50 to 100 Hz� More than 100 Hz D-3

SURVEY (Page 3)
10. What kind of Displays are available?� Real Time Display for:
� All sensors� Some sensors� Readings for last 60 seconds or less� Readings for 1 - 60 minutes� Readings for more than 1 hour
� Historical Display� Average for most recent values (last 5 minutes, etc.)� Statistical average (e.g., 24 hours)
� Replay last 2 hours or less� Replay last 2 hours or more� Replay selected extreme events
11. How many screens displays are available in your HRMS?� 1 to 4� 5 to 10� More than 10� Other types of display __________________________________________
____________________________________________________________
12. Does the system provide warnings after exceeding limits?_____ Slam � Visual � Audible_____ Hull Stress � Visual � Audible_____ Pitch Acceleration � Visual � Audible_____ Other ___________ � Visual � Audible
13. Does the system predict events or weather?� Eminent slam� Ship motion amplitudes if course / speed is changed� Ship response through weather forecast� Arrival time� Other _______________________________________________________
14. Do you have the ability to upload or download data by satellite at regular intervals?� Upload data from HRMS� Download weather / ice information� Download weather / ice predictions� Other _______________________________________________________
D-4

SURVEY (Page 4)
15. What types of logistics support do you normally provide?� Training
� Onboard the ship during operations� At your facility or other location ashore
� Operating Manual� Hard copy� CD-ROM, VCR, or similar
� Maintenance / Repair Manual� Hard copy� CD-ROM, VCR, or similar� Computer on-line help or expert systems� Satellite link for trouble shooting
� Data analysis and reporting� Real time or near-real time� Post processing after a voyage or period of time
� Other __________________________________________________________________________________________________________________
16. How many systems have you installed on the following types of ships?_____ Tanker / Liquid Products Carrier_____ Military - Combatant / Supply_____ Container Ship_____ Bulk Carrier_____ RO-RO / Ferry_____ Offshore Drill / Pipelaying / Work vessel_____ Other ________________________ Total Sales to date
17. What is included in your basic or standard HRMS system?Sensors: ___________________________________________
_________________________________________________________________________________________________________________________________
Computer: _________________________________________________________________________________________________________________________________
CPU/Sensor Data Link:� Conventional hard-wire� Radio link� Other _______________________________
D-5

SURVEY (Page 5)
18. Has your basic system been classed by ABS or Lloyd’s?� Yes: Designation is ________________________________� No� Currently under review
19. What is the price for this basic system, not including installation?� Less than $ 50,000� $ 50,000 to $100,000� $100,000 to $250,000� More than $250,000
20. Is there a sales or technical person we can contact if we have additional questions?Name ______________________________Phone ______________________________FAX ________________________________
21. Thank you for your time in completing this survey. The survey was developed inresponse to Ship Structural Committee Project SR1373, administered by the US CoastGuard. The results will be used to generate a report documenting the current state ofthe art in Hull Response Monitoring Systems, including an ASTM specification. Yoursupport in answering this survey will help define the technology and economicfeasibility of Hull Response Monitoring Systems available to the industry.
We would greatly appreciate it if you could enclose any sales or technical brochuresand return the survey to:
MCA Engineers2960 Airway Avenue, # A-103Costa Mesa, CA 92626(714) 662-0500 / 668-0300 FAX
D-6HULL RESPONSE MONITORING SYSTEM (HRMS)
QUESTIONNAIRE FOR SHIP’S OFFICERS / OPERATORS

1. Please indicate your objectives for using an HRMS: Very Sometimes NotUseful Helpful Helpful
To minimize slamming or to reduce shipship motions � � �
To monitor hull structure stresses due towave or ice conditions � � �
Optimize routing to avoid weather, savefuel, or control arrival time � � �
Keep records for engineering studies, helpfuture ship design, etc. � � �
To meet classification society (ABS,Lloyd’s, etc.) designation � � �
Other ___________________________ � � � ___________________________ � � �
2. What type of ship do you serve on or support?� Tanker � Military - Combatant� Products Carrier: type ___ � Military - Supply� Container Ship � Offshore Platform� Bulk Carrier � RO-RO / Ferry� Other ___________________
3. How many ships in your fleet are equipped with HRMS? _______
4. What is your billet or position (Master, Port Engineer, etc.)? _________________
5. How many years have you been at sea? _____
6. What are your main trade routes? (Check all that apply)� North Sea or Baltic Sea� Mediterranean� Atlantic Ocean: _____ Northern _____ Tropical _____ Southern� Pacific Ocean: _____ Northern _____ Tropical _____ Southern _____ TAPS� Gulf of Mexico / Caribbean� US Great Lakes� Arctic / Antarctic� Indian: _____ East _____ West� Other ______________________________________________________
D-7

SURVEY (Page 2)
7. Does your current ship have sensors for measuring the following items? Please checkall that apply.
Yes No Don’t KnowNavigation (GPS - other) � � �Ship motions (roll / pitch) � � �Ship accelerations (G-loads) � � �Pressure:
In-Tank � � �Side / Flare / Bow � � �Bottom � � �
Hull stress / strain gauges:Deck � � �Ice zones (bow, etc.) � � �In-tank � � �Bottom shell � � �
Slam detection � � �Weather prediction & routing � � �Environmental:
Wave � � �Wind � � �Ice � � �
Ship Performance:Speed � � �Shaft RPM � � �Horsepower / Fuel � � �
Other ____________________________
8. How are the sensors connected to the central computer / display console?� Conventional hard wiring� Optic fiber� Radio Link� Other ______________________________________________________
9. What kind of computer is provided with your HRMS:� Apple / Macintosh ____________________________________________� IBM compatible (486, Pentium, etc.) ______________________________� Workstation (Sun, DEC, etc.) ___________________________________� Proprietary / Other ____________________________________________
D-8
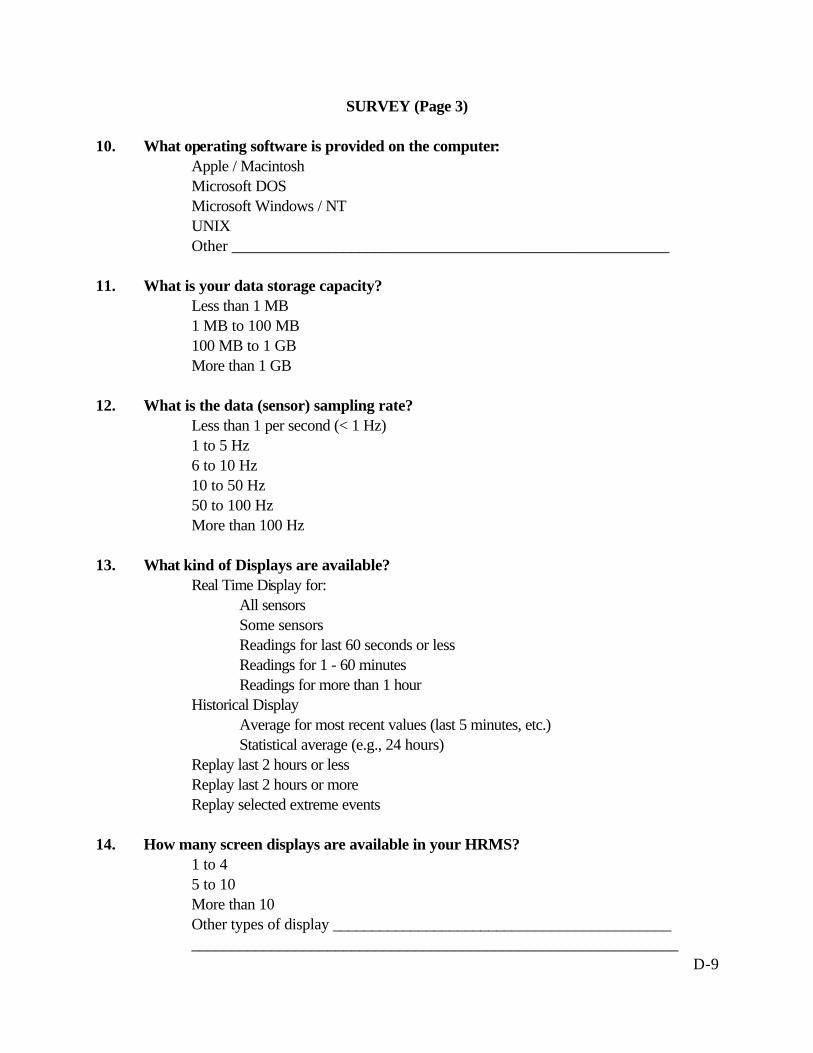
SURVEY (Page 3)
10. What operating software is provided on the computer:� Apple / Macintosh� Microsoft DOS� Microsoft Windows / NT� UNIX� Other _______________________________________________________
11. What is your data storage capacity?� Less than 1 MB� 1 MB to 100 MB� 100 MB to 1 GB� More than 1 GB
12. What is the data (sensor) sampling rate?� Less than 1 per second (< 1 Hz)� 1 to 5 Hz� 6 to 10 Hz� 10 to 50 Hz� 50 to 100 Hz� More than 100 Hz
13. What kind of Displays are available?� Real Time Display for:
� All sensors� Some sensors� Readings for last 60 seconds or less� Readings for 1 - 60 minutes� Readings for more than 1 hour
� Historical Display� Average for most recent values (last 5 minutes, etc.)� Statistical average (e.g., 24 hours)
� Replay last 2 hours or less� Replay last 2 hours or more� Replay selected extreme events
14. How many screen displays are available in your HRMS?� 1 to 4� 5 to 10� More than 10� Other types of display ___________________________________________
_____________________________________________________________D-9

SURVEY (Page 4)15. Does the system provide warnings after readings exceed limits?
_____ Slam � Visual � Audible_____ Hull Stress � Visual � Audible_____ Pitch Acceleration � Visual � Audible_____ Other _______________________________________________________
16. Does the system predict events or weather?� Eminent slam� Ship motion amplitudes if course / speed is changed� Ship response through weather forecast� Arrival time� Other _______________________________________________________
17. Is your system intrinsically safe in explosive atmospheres?� Yes� No
18. Do you have the ability to upload or download data by satellite at regular intervals?� Upload data from HRMS� Download weather / ice information� Download weather / ice predictions� Other ______________________________________________________
19. Have you been trained how to use the system?� Vendor training� Training from other officers / company personnel� Self-taught
20. Do you think the system is “User Friendly?”� Yes� No
21. When and how often do you use the Hull Response Monitoring System: Seldomor Never Sometimes Often
During storm seas at night: � � � in daylight: � � �During moderate seas at night: � � � in daylight: � � �During mild conditions at night: � � �
in daylight: � � �
D-10
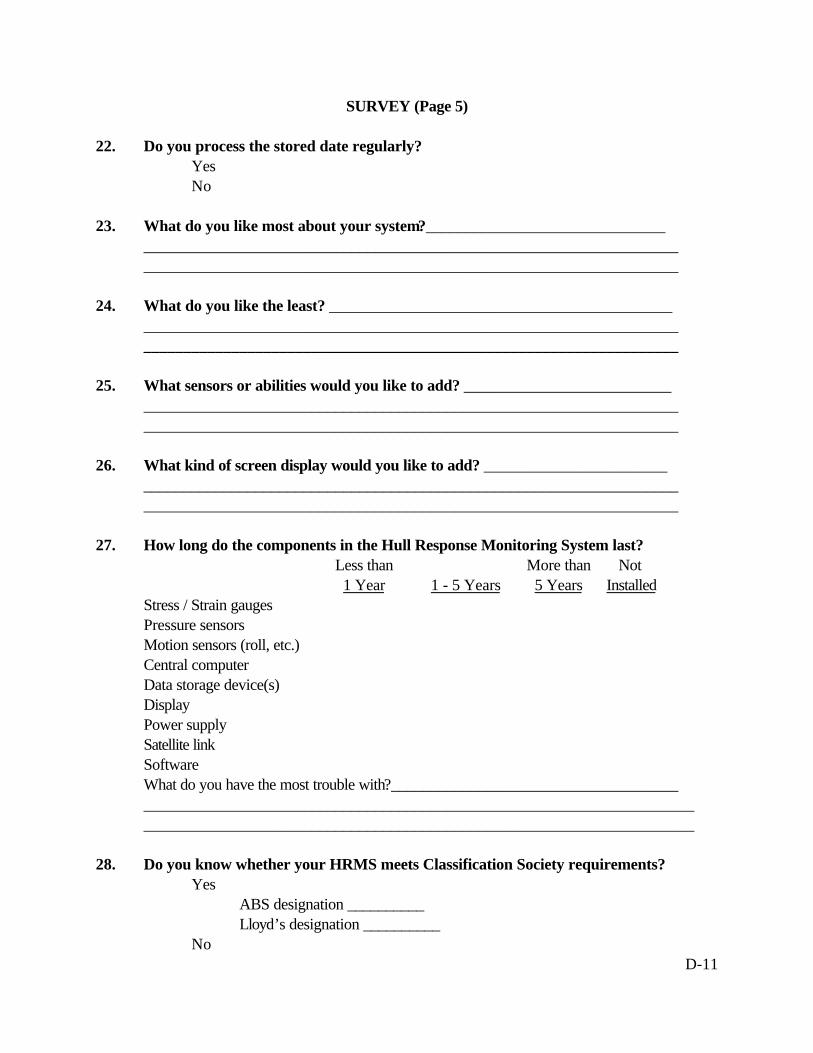
SURVEY (Page 5)
22. Do you process the stored date regularly?� Yes� No
23. What do you like most about your system?____________________________________________________________________________________________________________________________________________________________________
24. What do you like the least? _________________________________________________________________________________________________________________________________________________________________________________
25. What sensors or abilities would you like to add? ________________________________________________________________________________________________________________________________________________________________
26. What kind of screen display would you like to add? _____________________________________________________________________________________________________________________________________________________________
27. How long do the components in the Hull Response Monitoring System last?Less than More than Not 1 Year 1 - 5 Years 5 Years Installed
Stress / Strain gauges � � � �Pressure sensors � � � �Motion sensors (roll, etc.) � � � �Central computer � � � �Data storage device(s) � � � �Display � � � �Power supply � � � �Satellite link � � � �Software � � � �What do you have the most trouble with?______________________________________________________________________________________________________________________________________________________________________________
28. Do you know whether your HRMS meets Classification Society requirements?� Yes
� ABS designation __________� Lloyd’s designation __________
� NoD-11

SURVEY (Page 6)29. Please rank the following vendor support services for effectiveness:
None or Poor or Good orUseless Marginal Excellent
Vendor-supplied training � � �Operating Instructions / Manual � � �Repair Instructions / Manual � � �Availability of spare parts � � �Answers questions promptly � � �Provides service promptly � � �
30. What additions to the Operating Manual / Instructions would help you most?______________________________________________________________________________________________________________________________________________
31. What additions to the Repair / Maintenance Manual would help you most?______________________________________________________________________________________________________________________________________________
32. What additions to the training would help you most?______________________________________________________________________________________________________________________________________________
OPTIONAL
33. Who manufactured your system?Name: _________________________________________Address: _______________________________________
34. Do you know the system cost, including installation?� Less than $ 50,000� $ 50,000 to $100,000� $100,000 to $250,000� More than $250,000
35. Do you think the system benefits justify the cost?� Yes� No
Thank You! Please return to: MCA Engineers2960 Airway Avenue, # A-103Costa Mesa, CA 92626(714) 662-0500 / 668-0300 FAX
D-12

BIBLIOGRAPHY
This bibliography lists most of the papers acquired and reviewed during development of thisreport. Papers have been separated by subject matter, and are alphabetized within those groups.Papers cited in the text of the report are shown with the authors names in bold print.
ICE LOADS AND STRESS REFERENCES (I)
Aldwincle, D. S., PhD. & Lews, K. J.; Prediction of Structural Damage, Penetration and CargoSpillage Due to Ship Collisions with Icebergs, The Society of Naval Architects and MarineEngineers, Ice Tech ‘84, pp D-2 - D14.
Arikaynen, A. I. & Kossov, O. A.; Technological Possibility of Safe Convoy of Non-Ice ClassShips along the Northern Sea Route, Ice Technology for Polar Operations, (Proceedings from 2ndInternational Conference on Ice Technology, Murthy, Paren, Sackinger & Wadhams editors,Computational Mechanics Publicatons) September 1990, pp. 259 - 267.
Canarctic; Ice Performance and Navigation, Ice Tracks, Summer 1996.
Canadian Coast Guard; Ice Navigation in Canadian Waters, Transport Canada Report TP-5064E,1992.
Canadian Coast Guard Northern; Proposed Equivalent Standards for the Construction ofArctic Class Ships, March 16, 1993, Internal Report.
Canadian Marine Drilling Limited; MV Kigoriak and MV Robert Lemeur Full Scale Impact Tests for1983, December, 1983
Canadian Marine Drilling Limited; MV Kigoriak and MV Robert Lemeur 1983 Ice Impact TestsRefinement of Model Ship/Ice Interaction Energies, Reported for Canadian Coast Guard, March,1985.
Carter, D., Laframboise, J. & Peirce, T.; Mathematical Model for Predicting IcebreakerPerformance, Ice Technology for Polar Operations (Proceedings from 2nd International Conferenceon Ice Technology, Murthy, Paren, Sackinger & Wadhams editors, Computational MechanicsPublicatons) September 1990, pp. 177 - 192.
Chen, Y.K., Tunik, A. & Chen, A.; Analysis of Ice Ramming Forces and Hull Structural Responseof the USCGC Polar Sea Based on 1985 Winter Deployment Data, Ship Structural Committee,American Bureau of Shipping Technical Report RD-87011 / OED-87522, 1987.
Cowper, B, Edgecombe, M. & Bayly, I.; System Design and Evaluation of the USCGC Polar Sea,1985 Global Ice Impact Tests, SNAME Arctic Section paper, Calgary, Alberta, November, 1986.

Cowper, B. & Edgecombe, M.; The 1985 Global Ice Impact Tests on the USCGC Polar Sea,Transport Canada Report TP8496E, May 1987.
Daidola, John C. & Sheinberg, Rubin; A Procedure for the Structural Design of Icebreakers andOther Ships Navigating in Ice, SNAME 1988 Transactions, Vol. 96, Society of Naval Architectesand Marine Engineers, 1989, pp. 271-308.
Daley, C. & St. John, J.; Ice Loads and Ship Response to Ice, Report 757C, Arctec Canada &Arctec Incorporated, February, 1984.
Dick, R. & Chung, H.; MV Arctic Statistical Measurements of Structural, Propulsion and SteeringGear System Loads, Canarctic Shipping, Transport Canada Report TP8289E, February, 1987.
Echert, D. C., White, G. B. & Becker, A.; Electromagnetic Induction Sensing of Sea Ice ThicknessUsing the EM31 Ground Conductivity Meter, Oceans ‘92 Proceedings, IEEE Volume 7803-0838-7/92, pp. 753-758.
Edgecombe, M., Smythe, M., & Jolles, W.; Deck Stress Measurements on the Icebreaker RobertLemeur, 1990 Full Scale Tests, SNAME Arctic Section paper, December, 1992.
Enkvist, Ernst., Varsta, Petri. & Riska, Kaj.; The Ship - Ice Interaction Under Arctic Conditions,Proceedings from POAC ‘79 (Port and Ocean Engineering Under Arctic Conditions) at the NorweigianInstitute of Technology, pp 977 - 1002.
Eranti, Esa., Ice Forces in Dynamic Ice Structure Interaction, International Journal of Offshore andPolar Engineers, Vol 2, No. 2, March 1992 (ISSN 1053-5381) Copyright © by the InternationalSociety of Offshore and Polar Engineers, pp 67 - 72.
Fadyeeb, O.B.; Hull Wear-Down Considerations of Icebreaking Ships, Central Marine DesignInstitute (CNIIMF) Transactions, 1991 (available in Russian only).
Fleet Technology Limited; Requirements of Hull Monitoring Systems for Ice-Going Ships,Draft Report, FTL Report No. 4472DFR, November, 1995.
Gerwick, Jr., B. C.; Practical Scenarios and Force Determinations for Iceberg Impact on FxedStructures, Ice Technology for Polar Operations, (Proceedings from 2nd International Conference onIce Technology, Murthy, Paren, Sackinger & Wadhams editors, Computational MechanicsPublicatons) September 1990, pp 204 - 211.
Ghoneim, G. A. M., Hohansson, B. M., Smyth, A. J. & Grinstead, J.; Global Ship Ice Impact ForcesDetermined from Full-Scale Tests and Analytical Modeling of the Icebreakers Canmar Kigoriakand Robert Lemeur, SNAME Transactions, Vol. 92, 1984, pp 253-282, Society of Naval Architectsand Engineers, 1985.
Ghoneim, G. A. M.; Instrumentation for Measuring Forces on Icebreakers, Marine TechnologySociety Journal Vol 21, No. 3, pp 64 - 74.
Glen, I., Daley, C. & Tam, G.; Analysis of the Structure of the Proposed CCG Polar Class 8Icebreaker Under Extreme Ice Loads, SNAME Transactions Vol. 93, 1985, Society of NavalArchitects and Marine Engineers, 1986.
Glen, I. & Zgela, M.; Study of Shipboard Operational Load Monitoring (OLM) Systems, FleetTechnology Limited (FTL) Report No. 4256.4CFR, April, 1995.
Glen, I., & Daley, C.; Ice Impact Loads on Ships, SNAME Spring Meeting - Arctic Section, May,1982.
Glyden, R. & Riska, K.; Ice Load Measurements on Board MS Kemira, Winter 1989, HelsinkiUniversity of Technology, Faculty of Mechanical Engineering Laboratory of Naval Architecture andMarine Engineering, Otaniemi 1989/M-93, 1989.
Gutman, I. M.; Distribution of Extreme Stresses from Ice Loading in the Ship’s Hull, CentralMarine Design Institute (CNIIMF) Transactions, 1991 (available in Russian only).
Hakala, M. & Kivimaa, P.; MV Arctic Ramming Tests Trials Report, Technical Research Centre ofFinland, Report LAI-539B-84, July, 1984.
Karavanov, S. V.; Results of Long-Term Full-Scale Investigations of the Ice Strength of NewIcebreaking Cargo Ships of Arctic Navigation, Central Marine Design Institute (CNIIMF)Transactions, 1991 (available in Russian only).
Korsnes, Reinert & Moe, Geir; Approaches to Find Iceberg Collision Risks for Fixed OffshorePlatforms, International Journal of Offshore and Polar Engineering, Vol 4, No. 1, March 1994 (ISSN1053-5381) pp. 48-52.
Kujala P. & Jukka, V.; Results and Statistical Analysis of the Load Measurements on BoardIcebreaker SISU in Winters 1979 to 1985, Finnish Winter Navigation Research Board, ResearchReport No. 43.
Lowing, M. & Nigh, G.; Stress Measurement Program MS Columbialand, 1983 Voyage, FinalReport, Transport Canada Report TP6257E, February, 1985.
Major, R .A., Berenger, D. M. & Lawrie, C. J. R., A Model to Predict Hull-Ice Impact Loads in theSt. Lawrence, © Copyright 1975 by The Society of Naval Architect and Marine Engineers, pp D1 -D23.

Malik, L. & Tomin, M.; Evaluation of Toughness of Conventional Ship Steels at IntermediateLoading Rate, and its Implications, FTL Report 3331C for CANMET, January 1991.
Massom, R. A.; Satellite Remote Sensing of Polar Snow and Ice: Present Status and FutureDirections, Polar Record, Vol. 31, No. 177, Cambridge Press, April 1995, pp. 99-114.
Minnick, P. V., St. John, J. W., Cowper, B. & Edgecombe, M.; Global Ice Forces and ShipResponse to Ice, Ship Structure Committee Report SSC-341, 1990.
Minnick, P. V. & St. John, J. W.; Global Ice Forces and Ship Response to Ice - A Second Season,Ship Structure Committee Report SSC-343, 1990.
Matsuishi, M., Ikeda, J., Kawakami, H. & Hirago, M.; Ship-Ice Floe Collision Analysis Consideringthe Elastic Deflection of Hull Girder, The Society of Naval Architects and Marine Engineers, IceTech ‘84, pp. E-1 - E13.
Murray, M. A., Finite Element Modelling of the Dynamic Response of the Icebreaker CanmarKigoriak to Ice Ramming Forces, Seventeenth Annual Offshore Technology Conference 1985,Proceedings 1985, Vol 1, pp 423 - 438.
Murthy, T. K. S., Paren, J. G., & Sackinger, W. P.,( Edited by); Ice Technology for PolarOperations, Computational Mechanics Publications, Southhampton, Boston.
Nikitin, V. A., Kolesov, S. A.; Stresses and Forces Under Ice Compacting, International Journal ofOffshore and Polar Engineering, Vol 3, No. 2, June 1993, (ISSN 1053-5381), pp. 139 - 142.
Noble, P., Tam, W., Menon, B. & Bayly, I.; Ice Forces & Accelerations on a Polar ClassIcebreaker, POAC Conference, 1979.
Ranki, Erkki.; Optimum Strengthening of Ship Hull against Arctic Ice, Arctic News Record, Spring1984, pp. 49 - 52.
Riska, K., Matusiak, J., Rintala, S. & Vuroio, J.; Measurement of Ice Pressures and Forces onCanmar Kigoriak During Repeated Trials in 1981, Report # LAI-332-82, , Technical ResearchCentre of Finland, 1982.
Riska, K. & Varsta, P., Structural Ice Loads in the Baltic, Wegemt, 1983.
Sackinger, W. M., Jeffries, M. O. & Li, Fucheng, Interaction of Arctic Offshore Structures withDrifting Ice Islands and Thick Sea Ice Floes, Ice Technology for Polar Operations, pp 211 - 228.
St. John, J. W., Daley, C., & Blount, H.; Ice Loads and Ship Response to Ice, Ship StructureCommittee Report SSC-329, 1984.

St. John, J. W., & Daly, C.; Local Ice Pressures Measured in Thick Level Ice in Antarctica,Maritime Administration Report MA-RD-760-87055, Sept. 1986.
St. John, J. W., Daly, C., Brown, R. & Glen, Ian; Ice Loads and Ship Response to Ice -Consilidation Report, Ship Structure Committee Report SSC-340, 1990.
St. John, J. W., Daley, C., Meyer, J., Brown, R. & Glen, Ian; Ice Loads and Ship Response to Ice - ASecond Season, Ship Structure Committee Report SSC-339, 1990.
St. John , J. W. & Ritch, A.; Ice Load Impact Measurement on the CCGS Louis S. St. Laurentduring the 1994 Arctic Ocean Crossing - A trip report and data summary, STC Report No. 2874,December, 1994.
St. John, J. W. et al; Ice Impact Load Measurement Aboard the ODEN During the InternationalArctic Ocean Expedition (1991), SNAME Icetech ‘94, March, 1994.
St. John, J. W. et al; Ice Loads on the RV Nathaniel B. Palmer, SNAME Arctic Section paper.
St. John, J. W. & Zahn, P. B.; Bering Sea Winter Ice Edge Data Collection Aboard USCGC PolarSea, Volume II - Hull Ice Impact Loads, July 1987.
Thomas, III., W. L. & Schultz, L. A.; Model Tests of a Naval Combatant in Broken Ice Fields, IceTechnology for Polar Operations, pp 155 - 165.
Transport Canada; Proposals for the Revision of the Arctic Shipping Pollution PreventionRegulations, Transport Canada Report TP9981, 1989
Tunik, A. L., Kheisin, D. E. & Kurdyumov, V. A.; Probabilistic Concept of Safe Speeds for ArcticShipping, Ice Technology for Polar Opeations, pp 295 - 306.
Vaughan, H. & Asadi, G.; The Dynamics, Flexural Response, and Damage of Ships in Ice, IceTechnology for Polar Operations, pp 133 - 144.
Voelker, R. P. & Seibold, F.; Polar Ice-Breaker Caught in Active Shear Ridge, Ice Technology forPolar Operations pp 375 - 376.
Voelker, R. P., Seibold, Frederick, Glen, Ian & Bayly, Ian; Eight Years of PerformanceMeasureements Aboard USCG Polar Class Icebreakers, SNAME Transactions Vol. 100, Societyof Naval Architects and Marine Engineers, 1993, pp. 271-289.
Vuroio, J., Riska, K. & Varsta, P.; Long Term Measurements of Ice Pressure and Ice-InducedStresses on the Icebreaker SISU in Winter 1975, Finnish Winter Navigation Research Board,Research Report No. 28.

Nikitin, V. A. & Kolesov, S. A.; Stresses and Forces Under Ice Compacting, International Journal ofOffshore and Polar Engineering, Vol. 3, No.2, June 1993 (ISSN 1053-5381), pp. 139- 142.
WAVE THEORY & SEAKEEPING REFERENCES
Beaumont, J. G. & Robinson, D. W.; Classification Aspects of Ship Flexibility, PhilosophicalTransactions of the Royal Society of London (Math/Physics/Science) 1991, Vol 334, No.1634, pp. 371-389.
Booth, Ian J.; A Coherent Averaging Technique for Resolving Directional Wave Spectra,0-7803-1385-2/93/$3.00 © 1993 IEEE , pp, II-183 - II-201.
Cartwright, D. E.; The Science of Sea Waves After Twenty Five Years, RINA, 1974.
Draper, Lawrence; II. British Work on Wave Climatology, RINA, pp. 5-7.
Hoffman, D., Walden, D. A., Cardone, V. J. & Person, Jr., W. J., Environmental Wave Datafor Determining Hull Structural Loadings, U.S. Coast Guard Headquarters, Washington,D.C. 1977.
Hutchison, B. L.; Seakeeping Studies: A Status Report; SNAME Transactions, Vol.98,1990, Society of Naval Architects and Marine Engineers, 1991.
Korvin-Kroukovsky, B. V.; Theory of Seakeeping; SNAME 1961
Lando, L., Scarsi, G.& Taramasso, A. C.; The Introduction of the Characteristic Groups inRandom Wave Fields, International Journal of Offshore and Polar Engineering, Vol 3, No. 2,June 1993 (ISSN 1053-5381), pp. 93 - 100.
Lewis, E. V.; Structural Dynamics of Ships, RINA, 1974
Marchaj, C. A.; Seaworthiness, International Marine Publishing Co., 1986
Su, Ming-Yang; Characteristics of Extreme Wave Groups, Oceans ‘84, pp. 711-716.
Ochi, M. K.; The Marine Environment and Its Impact on the Design of Ships and MarineStructures; SNAME Transactions Vol. 101, 1993, Society of Naval Architects, 1994
Teng, Chung-Chu et al; The Development of Design Waves and Wave Spectra for Use inOcean Structure Design; SNAME Transactions Vol 102, 1994, Society of Naval Architectsand Marine Engineers, 1994.

Tulin, Marshall P. & Li, Jiyue J.; On the Braking of Energetic Waves, International Journal ofOffshore and Polar Engineering, Vol 2, No.1, March 1992 (ISSN 1053-5381), pp. 46- 53.
Wang, Pei et al; Wave Group Evolution, Wave Deformation, and Breaking: SimulationsUsing LONGTANK, a Numerical Wave Tank; International Journal of Offshore and PolarEngineering, Sept. 1994.
WEB Page; Graduate School of Oceanography; University of Rhode Island, 1996
Zahn, Peter B. and Grim, M.; Determination of Extreme Seas Encountered by OperationalShips, Naval Engineers Journal, May 1995.

GENERAL HRMS REFERENCES
Ashcroft, F.H., Goebel, R.D., and Hennessy, W.F., Technology Integration for VesselOperations, SNAME California Joint Sections, April 1995.
Atwater, R.; Shipboard Wave Height Sensor, Ship Structure Committee Report SSC-362, 1990.
Chen, Dr. Henry; Ship Routing Made Practical, Sea Technology, April 1988 Vol 29, No. 4, pp.47-57.
DeBord, F.W. and Hennessy, B.; Development of a Generalized Onboard Response MonitoringSystem, Ship Structure Committee Report SR-1300, 1987.
Echert, Douglas C., White, Gary B.& Becker, Alex.; Electromagnetic Induction Sensing of Sea IceThickness using the EM31 Ground Conductivity Meter, IEEE 0-7803-0838-7/92 $3.00, 1992.
Fain, R.A.; Design and Installation of Ship Response Insturmentation System Aboard the SL-7Class Container Ship SS Sea-Land McLean, Ship Structure Committee Report SSC-238, 1973.
Fritch, D. J. et al; Results from Full-Scale Measurements of Midship Bending Stresses on Two DryCargo Ships, Ship Structure Committee Report SSC-181, 1967.
Gill, Eric W. & Walsh, John; Extraction of Ocean Wave Parameters from HF BackscatterReceived by a Four-Element Array: Analysis and Application, IEEE Journal of OceanicEngineering, Vol 17, No. 4, October 1, 0364-9059/92$03.00, pp. 376 - 386.
Howell, Randy. & Walsh, John; Measurement of Ocean Wave Spectra Using a Ship-Mounted HFRadar, IEEE Journal of Oceanic Engineering, Vol. 18, No.3, July 1993, 0364-9059/93$03.00, pp.306-310.
Integrated Hull Condition Monitoring Systems - A Solution to Bulker Safety?, Maritime Reporter,December 1994.
Khan, Rafaat H.; Ocean-clutter Model for high-Frequency Radar, IEEE Journal of OceanicEngineering, Vol 16, No. 2, April 1991, 0364-9159/91/0400-0181$01.00, pp. 181-188.
Lacey, P. and Edwards, R.; ARCO Tanker Slamming Study, SNAME California Joint SectionsMeeting/TAPS Tanker Symposium, La Jolla, October, 1991.
Lacey, P. B. & Chen, H.; Improved Passage Planning Using Weather Forecasting, ManeuveringGuidance, and Instrumentation Feedback, SNAME Marine Technology Vol 32, No. 1, January1995.
Lindermann, K. and Robertsson S.; SO3 Project Final Report, USCG Office of Marine Safety 1981.

Lovdahl, R., Lacey, P. & Chen, Dr. Henry; Advances in Computer-Based Onboard VoyagePlanning, SNAME California Joint Sections Meeting, April 1995.
Melitz, D.T., Robertson, E.J., and Davison, N.J.; Structural Performance Management of VLCCs -An Owner’s Approach, SNAME Marine Technology, Vol 29, No 4, pp 250-262, October 1992.
Monitoring for a Lifetime of Hull Safety, Maritime Reporter, June 1994, pp 9 - 10.
Palmer, A. J.& Churnside, J. H., ∆K-Laidar Sensing of the Ocean Surface, IEEE Oceans ‘92, pp.514-517.
Robinson, D.; Hull Monitoring: Opting to Optimize Operational Safety, ABS Surveyor, June1995, pp. 24-28.
Sipes, J.D., MacDonald, J.M., Bowen, M.R., Cojeen, H.P., Salerno, B., Maxham, J.C., & Baxter, J.;Report on the Trans-Alaska Pipeline Service Tanker Structural Failure Study, SNAME MarineStructural Inspection, Maintenance, and Monitoring Symposium, pp VI-A-1-44, March 1991.
Sviridov, S. A.; States of Arts on Laser Remote Sensing Techniques of Sea Surface Roughness inRussia, 0-7803-1385-2/93/$3.00 © 1993 IEEE pp. I-473 - I-481.
Thews, E. R. & Dockery, G. D.; Scattering and Propagation Impacts on Shipboard RadarSystems, CH2882-9/90/000-0401$1.00 © (1990 IEEE), IEEE International Radar Conference, pp.401-408.
Vulovich, R. et al; Characteristics of Hull Stress Measured on a Large Container Ship in RoughSeas, SNAME Transactions Vol. 97, 1989, Society of Naval Architects and Marine Engineers, 1990.
Witmer, David and Cheung, Dr. Maxwell C., The Use of Finite Element Modeling Techniques inthe Investigation of Structural Failure in Ships, SNAME West Coast Tanker OperationsSymposium, Joint California Sections Meeting, pp 2-001-022, October 1991.
Witmer, David and Lewis, J.W.; Operational and Scientific Hull Structural Monitoring on TAPSTrade Tankers, SNAME Transactions Vol 102, 1994, Society of Naval Architects and MarineEngineers, 1995.
Witmer, David and Lewis, J.W.; The BP Oil Tanker Structural Monitoring System, SNAME MarineTechnology, Volume 32, No. 4., October, 1995.
Yasuda, Akio, Kuwashima, Susumu, and Kanai, Yasubumi; A Shipborne-type Wave-Heightmeter for Oceangoing Vessels, Using Microwave Doppler Radar, IEEE Journal of OceanicEngineering, Vol. OE-10, No. 2, April 1983, 0364-9059/85/0400-0138$01.00 © 1985 IEEE.

REMOTE SENSING & SATELLITE REFERENCES
Alpers, Werner; SAR Imaging of Ocean Waves - A Review, IEEE 1992, Vol 91-72810/92, pp.451-454.
Askne, J., Ulander, L.M.H. & Birkeland, D.; ERS-1 SAR Analysis of Arctic Ice ConcentrationDuring the Melt Season, pp 431- 433.
Atkinson, Sr., James H.; State-of-The-Art Technologies for Accurate Navigation and SecureCommunications, 1992 IEEE Oceans ‘92, 0-7803-0838-7/92 $3.00, pp. 13-18.
Baron, Martin S.; The VOS Program and the World Weather Watch, Mariner’s Weather Log,Winter 1990, pp. 32-35.
Beaven, S.G., Gogineni, S. P.& Shanableh, M.; Young Sea Ice Signatures in the Deep Arctic Duringthe Fall Freeze-Up, pp. 434-436.
Beaven, Scott G., Gogineni, S.; Radar Backscatter measurements from Arctic Sea Ice During theFall Freeze-Up, pp. 850- 852.
Blackford, C., Howes, S., Whitelaw, A., Laxon, S., & Mantripp, D.; An Assessment of aDemonstration Project to Supply Near Real Time Sea Ice Information to End Users, SPIEVol. 2319/145, pp. 145-154.
Blomenhofer, H., Hein, Funter W., Blomenhofer, Eduarda T., Werner, W.; Development of a Real-Time DGPS System in the Centimeter Range, 0-7803-1435-2/94 $3.00 © 1994 IEEE, Plan94, pp 532 - 539.
Bogorodsky, Vitale V.& Darovskih, A. N.; Interpretation of Aircraft Sea Ice Microwave Data,IEEE Journal of Ocanic Engineering, Vol. OE-9, December 1984, 0364-9059/84/1200-0344$01.00 © 1984 IEEE.
Brownsword, Chris & Jory, Ian; Developments in Multi-Sensor Ocean Feature Monitoring - theOcean Fronts Feature Analysis System, SPIE Vol 2319/31
Buckley, Joseph R.; Properties of Marine Radar Imagery and Directional Spectra of the SeaSurface, 0-7803-1385-2/93/$3.00 © 1993 IEEE, pp I40 - I45.
Carroll, James V.; Availability Performance Comparisons of Combined Loran-C/GPS and Stand-alone GPS Approach Navigation Systems, pp 77 - 78.
Carsey, Frank.; Review and Status of Remote Sensing of Sea Ice, IEEE Journal of OceanicEngineering, Vol. 14, No. 2, April 1989, 0364-9059/89/0400-0127$01.00

Coon, Max D., Knoke, G. S. & Echert, Douglas C.; Contemporaneous Field measurements ofPack Ice Stress and Ice Strain measurements from SAR Imagery, 0-7803-1385-2/93/$3.00 © 1993 IEEE.
Davidson, D. L., Shuchman, R. A., Johannessen, J. A. & Brown, R. A.; Analysis and Interpretationof ERS-1 SAR Detected Wind Rows Relative to Observed Air-Sea Interaction Processes,0-7803-1385-2/93/$3.00 © 1993 IEEE
Diefes, Debra.; GPS Based Attitude Determining System for Marine navigation, 0-7803-1435-2/94 $3.00 © 1994 IEEE, pp. 806- 812.
Drinkwater, M. R.; Multi-Frequency Imaging Radar Polarimetry of Sea Ice, Ice Technology forPolar Operations, (Proceedings from 2nd International Conference on Ice Technology, Murthy,Paren, Sackinger & Wadhams editors, Computational Mechanics Publicatons) September1990, pp 365-375.
Drinkwater, M. R., Hosseinmostafa, R. & Dierking, W.; C-band Microwave Backscatter of Sea Icein the Weddell Sea during the Winter of 1992, pp 446- 448.
Engen, G., Hohnsen, H., & Korsbakken, E.; Using Cross-Image Spectra in a SAR Ocean WaveInversion Scheme, SPIE 2319/61.
Evans, C., Haimov, S., Moore, R. K.& Hesany, V.; Determination of Ocean EnvironmentalParameters from A Ka-Band Scatterometer, 0-7803-1385-2/93/$3.00 © 1993 IEEE , pp.II-1 - II-4.
Flato, G. M.; A Particle-in-Cell Model for Ice Edge Forecasting, 0-7803-1385-2/93/$3.00 © 1993IEEE.
Garello, R., Proust, S.& Chapron, B.; 2D Ocean Surface SAR Images Simulation: A StatisticalApproach, 0-7803-1385-2/93/$3.00 © 1993 IEEE.
Gauthier, Marie-France& Miville, Bernard.; Operational Use of Remote Sensing Data for IceMonitoring Along Canada’s East Coast - Winter 1992/1993, pp 2005 - 2007.
Georges, T. M. & Harlan, J. A.; Ocean-Monitoring Tests with the U.S. Air Force Over-the-Horizon Radars, pp 220-222.
Gilder, George; Ethersphere, Forbes ASAP, October 10, 1994
Gill, E. W., Howell, R. K., Hickey, K., Walsh, J.& Dawe, B. J.; High Frequency Ground WaveRadar Measurements of Ocean Surface Parameters During the ERS-1 Calibration-Validation Experiment, 0-7803-1385-2/93/$3.00 © 1993 IEEE, pp I-55 - I-60.
Gogineni, G., Moore, R. K., Wang, Q., Gow, A., Onstott, R. G.; Radar Backscatter MeasurementsOver Saline Ice, International Journal of Remote Sensing, 1990, Vol 11, No. 4, 603-615,0143-1161/90/$3.00 © 1990 Taylor & Francis Ltd.
Grabowski, Martha.; The Piloting Expert System: Transition from Off-Line Prototype to On-LineDecision Support, Navigation, Journal of The Institute of Navigation, Vol. 37, No. 1, (Spring1990) pp 1 - 16.
Grandell, J., Pallonen, J. & Hallikainen, M.; Scatterometer Measurements of Arctic Sea Ice at C-Band, pp 853-854.
Harger, Robert O.; A Sea Surface Height Estimator using Synthetic Aperture Radar ComplexImagery, IEEE Journal of Oceanic Engineering, Vol. OE-8, No. 2, April 1983, 0364-9059/83/0400-0071 $01.00 © 1983 IEEE.
Hesany, V., Moore, R. K., Gogineni, S. P. & Holtzman, J. C.; Slope-Induced Nonlinearities onImaging of Ocean Waves, IEEE Journal of Oceanic Engineering, Vol. 16, No. 3, July 1991,0364-9059/91/0700-0279$01.00 © 1991 IEEE, pp 279 - 284.
Hisaki, Yukiharu; Wave Measurement by HF Ocean Radar, pp 209- 211.
Howell, R. & Walsh, John; Measurement of OceanWave Spectra Using Narrow-Beam HF Radar,IEEE Journal of Oceanic Engineering, Vol. 18, No. 3, July , 0364-9059/93$03.00 © 1993IEEE.
Johnsen, Harald & Hogda, Kjell-Arild; Results from Inverting ERS-1 SAR Image Mode Data intoDirectional Ocean Wave Spectra, pp 16 - 18.
Kazansky, A. V. & Izarailsky, Y. G., Grand Parade of the NOAA-Polar Orbiters - New HorizonsBefore Remote Sensing of the Oceans, 0-7803-0838-7/92 $3.00 © 1992 IEEE
Kee, Changdon & Parkinson, Bradford W.; Wide Area Differential GPS as a Future NavigationSystem in the U.S., 0-803-1435-2/94 $3.00 © 1994 IEEE , pp 788-795.
Krishfield, R., Honjo, S., Tucker, III., W. B., Nakanishi, T. & Takizawa, T.; Automated Ice-OceanEnvironmental Buoys (IOEB’s) for the Telemetry of Air, Ice and Ocean Data from thePolar Oceans, 0-7803-1385-2/93/$3.00 © 1993 IEEE, pp II-47 - 52.
Kwok, Ronald & Pang, Amy; Performance of the Ice Motion Tracker at the AlaskaSar Facility,91-72810/92$03.00 © IEEE 1992.
Lachapelle, G., Klukas, R., Qiu, W. & Melgard, T. E.; Single Point Satellite Navigation Accuracy -What the future May Bring, 0-7803-1435-2/94 $3.00 © 1994 IEEE, Plan 94, pp 16 - 22.

Leavitt, E. D. & McAvoy, G.; Remote Sensing in Ice Navigation, MTS Journal, Vol. 21, No. 3, pp. 29-36.
Lecomte, P., Cavanie, A. & Gohin, F.; Recognition of Sea Ice Zones using ERS-1 ScatterometerData.
Long, D. G., Arnold., D. A. & Reed, R.; An Ultra Wide BandRadar for the Study of Air/SeaInteraction, 0-7803-1385-2/93/$3.00 © 1993 IEEE, pp I-37 - I-39.
Long, D. G. & Early, D.; Sea Ice Observed at Enhanced Resolution by SpaceborneScatterometers, 0-7803-1385-2/93/$3.00 © 1993 IEEE.
Luscombe, Anthony & Montpetit, Marie-José; Integrated Multi-Sensor Mission Concepts forthe Canadian Ice Community, IEEE 1992, Vol 91-72810/92, pp. 334-336.
Massom, Robert.; Satellite Remore Sensing of Polar Snow and Ice; Present Status and FutureDirections, Polar Record 31 (177): 99-114 (1995). Printed in Great Britain.
McClain, R. E.; WeatherLink - A Networking Tool for Dynamic Data,” IEEE 1993, Vol 0-7803-1385-2/93, pp. III-344 to III-346.
McIntyre, Neil, Boardman, Diane, Darwin, David & Sullivan, Ken; Validation and Evaluation of aWorkstation for Monitoring Sea Ice, SPIE Vol 2319/134, pp. 134-144.
Millard, Jr., R. C.; Wind Measurements from Buoys: A Sampling Scheme, Journal of GeophysicalResearch, Vol 76, No. 24, August 20, 1970; revised May 17, 1971., pp 5819 - 5828.
Monaldo, Frank, Gerling, Thomas & Tilley, David; A Comparison of SIR-B SAR Derived WaveSpectra from Hurrican Josephine and Wave Model Predictions,
91-72810/92$03.00 © IEEE 1992, pp 468 - 470.
Moore, Richard K.; Radar Sensing of the Ocean IEEE 1985
Nghiem, S. V., Li., F. K., Lou, S. H. & Neumann, G.; Ocean Remote Sensing with Airborne Ku-Band Scatterometer, 0-7803-1385-2/93/$3.00 © 1993 IEEE, pp I-20- I-24.
Nützel, Bernd & Herwig, Heinz; Acoustic and Microwave Backscattering of the Sea Surface, 0-7803-1385-2/93/$3.00 © 1993 IEEE, pp II-13 - II-18.
Onstott, Robert G., Davidson, Kenneth; Coastal Ocean Studies Using Shipbased ScatterometerDuring NORCSEX’91, pp 770- 772.

Orlando, James R., Haykin, Simon; Real-time Radar Detection of Iceberg Shadows, IEEE Journalaof Oceanic Engineering, Vol 15, No.2, April 1990, 0364-9059/90/0400-01112$01.00 ©1990 IEEE.
Orlando, James R., Mann, R., Haykin, S.; Classification of Sea-Ice Imags using a Dual-PolarizedRadar, IEEE Journal of Oceanic Engineering, Vol. 15, No.3, July 1990, 0364-9059/90/0700-02228$01.00 © 1990 IEEE.
Pellegrini, R. R. & Venezia, W. A.; Design, Construction, and Load Testing of a Large ScaleHelicopter Deployed Spar Buoy, 0-7803-1385-2/93/$3.00 © 1993 IEEE, pp II-40- II-45
Qiao, Xiaolin. & Liu, Yongstan; Ship Detection in Heavy Sea Clutter Echoes and Manmade RadioNoise Environment for an On-Shore HF Wave Frequency Agile, CH2882-9/90/0000-0034$1.00 © (1990 IEEE).
Rosenthal, W. & Atanassov, V.; Angular Dependence of SAR Modulation Transfer Function forNear Range Travelling Ocean Waves, pp 10-12.
Rudloff, R.; Application of Satellite Remote Sensing by the German Federal Maritime andHydrographic Agency (the former Deutsches hydrographisches Institut), Geojournal,1991, Vol. 24, No. 1, pp 49 - 52
Rufenach, Clifford & Shuchman, Robert A.; A Doppler Spectral Method of Identifying Water andIce in Marginal-Ice Zone Imagery, pp. 441- 445.
Schuler, D. L. & Lee, J. S.; Polarimetric Radar Techniques for the Measurement of Ocean WaveSpectra, pp 354 - 356.
Selsor, H. D.; Data from the Sea, the U.S. Navy’s AN/WSQ-6 (Series) Drifting Buoy Program, 0-7803-1385-2/93/$3.00 © 1993 IEEE, pp. II-128 - II-133.
Shearman, E. D.; A Review of Methods of Remote Sensing of Sea-SurfaceConditions by HF Radarand Design Considerations for Narrow-Beam Systems, IEEE Journal of OceanicEngineering, Vol. OE-11, No. 2, April 1986, 0364-9059/86/0400-0150$01.00 © 1986 IEEE,pp 150 - 157.
Shuchman, Robert A., Lyden, James D. & Lyzenga, David R.; Estimates of Ocean Wavelength andDirection From X-and L-Band Synthetic Aperture Radar Data Collected During theMarineland Experiment, 0364-9059/83/0400-0090$01.00 © 1983 IEEE, pp 90 - 96.
Shuchman, Robert A., Rufenach, Clifford L. & Johannessen, Ola; The Extraction of Marginal-Ice-Zone Thickness using Gravity Wave Imagery, pp 437 - 440.

Shuchman, Robert A.& Shemdin, Omar H.; Synthetic Aperture Radar Imaging of Ocean WavesDuring the Marineland Experiment, IEEE Journal of Oceanic Engineering, Vol OE-8, No. 2,April 1983,0354-9050/83/0400-0083$01.00 © 1983 IEEE, pp 83-90.
Skey, S. G., Heidorn, K. C., Jarvin, S.& Swail, V. R.; The Measurement of Wind Speed In HighSeas By Meteorological Buoys, 0-7803-1385-2/93/$3.00 © 1993 IEEE, pp II-100 - II-104.
Smith, Thea E.; Canadian Software Provides Centralized Ocean Data, Sea Technology, August1993, Vol. 34, No. 8, pp. 73-76.
Sohne, W., Heinze, O. & Groten, E.; Integrated INS/GPS System for High Precision Navigation,0-7803-1435-2/94 $3.00 © 1994 IEEE, Plan 94, pp. 310 - 313.
Stehwien, W.; Sea Clutter Measurements Using an Airborne X-band Radar, 0-7803-1385-2/93/$3.00 © 1993 IEEE, pp I-25 - I 30.
Story, Eugene D.; Future Prospects for Maritime Data Communications, SNAME CaliforniaJoint Sections Meeting, April 1995.
Stotle, Siegfried; Short Sea Wave Measurements by a Drifting Buoy System, 07803-1385-2/93/$3.00 © 1993 IEEE, pp II-332 - II-335.
Sviridov, S. A. & Sudbin, A. I.; Surface Sensing Method, 0-7803-1385-2/93/$3.00 © 1993 IEEE,pp I-488 - I-491.
Szabados, M. W.; Upgrading Global Weather Forecasts with SEAS, Sea Technology, August1985, Volume 26, No. 8, pp. 10-11, 14.
Tessier, B., Hains, D., Hally, P., O’Reilly, C. T., & de Margerie, S.; ODIN: A new Ocean Dataand Information Network for the St. Lawrence River and the Atlantic Canada Region,Oceans 1993, IEEE Vol 0-7803-1385-2/93, pp. III-43 through III-48.
Timpe, Gerald, Cdr., USCG, Teng, Chung-Chu; Developing Design Wave Criteria for use in DataBuoy Design, 0-7803-0838-7/92 $3.00 © 1992 IEEE, pp 764 - 769.
TOPEX/Poseiden WEB Page, 1996
Van de Voorde, Neil E., Lcdr., USCG & Michelena, Dr., Eduardo D.; WSD/Barometric Test BuoysDeployed in the Gulf of Mexico, 0-7803-1385-2/93/$3.00 © 1993 IEEE, pp. II-105 - II-116.
Van Dyne, Michele & Tsatsoulis, Costas; Extraction and Analysis of Sea Ice Leads from SARImages.

Venezia, W. A., Clark, A. M. & Schmitt, K. F.; Development of a Six Degree of Freedom BuoyDesign and Analysis Program with Validating Data, 0-7803-1385-2/93$3.00 © 1993IEEE, pp I-390-394.
Viehoff, Thomas.; A Shipborne AVHRR-HRPT Receiving and Image Processing System for PolarResearch, International Journal of Remote Sensing, 1990, Vol. II, No. 5, 877-886, 0143-1161/90$3.00 © 1990 Taylor & Francis Ltd.
Wyatt, L. R., Venn, J., Burrows, G. D., Ponsford, A. M., Moorehead, M. D., Van Heteren, J.; HFRadar Measurements of Ocean Wave Parameters During NURWEC, IEEE Journal ofOceanic Engineering, Vol. OE-11, No. 2, April 1996, 0364-9059/86/0400-0219$01.00 ©1986 IEEE, pp 219 - 233.
Ziemer, F. & Rosenthal, W., Measurement of Two-Dimensional Wave Energy Spectra DuringSAXON-FPN’90, 0-7803-1385-2/93/$3.00 © 1993 IEEE, pp II-326 - II-331.
Zurk, Lisa M. & Plant, William J.; Simulations of SAR Imagery of the Ocean Compared with Data,0-7803-1385-2/93/$3.00 © 1993 IEEE, pp III-304 - III-309.
FIBER OPTIC SENSORS
Van Metre, D., Curran, M. E., Cole, R., & Williams, K.; Fiber-Optic Backbone for aSubmarine Combat System,” SPIE Vol 1369 Fiber Optic Sys. for Mobile Platforms IV(1990)
Xu, M. G., Archambault, J. L. & Dakin, J. P.; Structural Bending Sensor Using FibreGratings, SPIE Vol. 2292 Fiber Optic and Laser Sensors XII (1994)/407