SRS - Defense Technical Information Center some perceived loading difficulties due to low ... to be...
25
IARP AD-A227 498 Advanced Technology Tactical Transport (ATTT) SRS TECHNOLOGIES 1500 WILSON BLVD.. SUITE 800 P0. BOX 12707 ARLINGTON, VIRGINIA 22209-8707 (703) 522-5588 WASHINGTON OPERATIONS AT~
Transcript of SRS - Defense Technical Information Center some perceived loading difficulties due to low ... to be...
IARP
AD-A227 498
Advanced TechnologyTactical Transport
(ATTT)
SRSTECHNOLOGIES
1500 WILSON BLVD.. SUITE 800P0. BOX 12707
ARLINGTON, VIRGINIA 22209-8707
(703) 522-5588
WASHINGTON OPERATIONS
AT~

Advanced TechnologyTactical Transport
(ATTT)
j
S R S .........,T E C HN 0L0G I ER S ..
15oo WI LSON BLVD.. SUITE S0 M1P0. BOX 12707 H
ARLINGTON. VIRGINIA 22209-8707(703) 522-5588
WASHINGTON OPERATIONS
90 07 '11 101

4RP
Advanced TechnologyTactical Transport
(ATMT)
Airlift for Special Operations Forces (SOF) has received a great dealof attention since the early 1980's. Possibly the most difficult SOFmission is long-range infiltration and exfiltration of small forces deepbehind enemy lines. In an effort sponsored and funded by OSD,DARPA has conducted a program to investigate unique applications ofaeronautical technology to address this mission.
Starting with a design feasibility study in 1984 by ScaledComposites, Incorporated, the Advanced Technology TacticalTransport program has attempted to provide a solution to theinfiltration/exfiltration task. In addition, DARPA has structured theprogram to gain important insight into innovative developmentmethods.
______ATi3

Mission Profile
* 8500 Pound Payload- Passengers (3500 Lb)- 5000 Lb Cargo
* 2400 nm Round Trip- Departure/Arrival Runway: 5000 Feet- Cruise at 1000 Feet Above Ground Level (AGL)- Mid Point Landing, No Refueling
*1 Mid Point Landing- 1000 Feet, Unprepared Surface- Unload/Reload, No Payload Reduction
230-250 Knots 230-250 Knots1000,
As seen in the mission profile, the task requires a combination ofvery long-range, unrefueled, low-altitude flight with outstandingshort-field landing and take-off performance. Desired airspeed wasgreater than 250 knots, with 230 knots as the minimum.
Scaled Composites chose a tandem wing design to provide therequired lift and wing tank fuel capacity, without excess structuralweight, for a 2400 nm range. A unique, relatively complex, wing flapsystem helped to provide the short field capability. The remainder ofthis briefing explains the important results of the proof-of-conceptphase of the ATFI" program.
_
ATi3

ATTT - Original Configuration
Under contract to DARPA, Scaled Composites Inc. (SCI)constructed a 62% scale Advanced 7'.chnology Tactical Transport(ATFT) Proof-of-Concept (POC) aircraft.
DARPA used the ATFF program as a method for what the PackardCommission called rapid prototyping. That is, the DARPA ATITprogram is an investigation of how the system acquisition process canbe improved through the use of prototypes or demonstrators in the earlyconceptual and preliminary design stages of the acquisition process.
The first configuration of the ATTT POC aircraft was flight testedbetween December 1987 and November 1988. The first flight testreport, covering the baseline aircraft development and performance,was published in November 1988. The aircraft was subsequentlymodified and a second phase of flight tests was conducted betweenApril and July of 1989. The final flight test report was published inSeptember of 1989.
AT3i

62% Scaled Aircraft-Cruciform Tail
P0C Aircraft Dimensions
Forward wing Span: 37.67 Feet
Aft Wing Span(With Original Tips): 47.54 Feet
Aft Wing Span(With Sheared Tips): 53.17 Feet
Total Wing Area: 297.56 Sq. FeetLength: 44.17 Feet
Height: 16.0 Feet
The A'ITF design is not a showcase for recent, dramatic technologyadvances, but rather an attempt to apply available technology to aparticular and difficult tactical mission.
To provide the necessary internal fuel volume for long rangemissions, the AIT design used a tandem-wing configuration with twinengine nacelles. Short takeoff/landing (STOL) capabilities wereenhanced by a unique flap arrangement on both wings. Neither of thesefeatures had previously been tested in a wind tunnel or in flight.
The 62% scale proof-of-concept aircraft was intended tosimultaneously validate the predictions and the aerodynamiccharacteristics of this configuration and obtain as much applicableflight test data as possible to support full-scale development.
ATi3

62% Scaled Aircraft-Bronco Tail
POC Aircraft Dimensions
Forward wing Span: 37.67 Feet <"
Aft Wing Span/Area: 53.17 Feet
Total Wing Area: 297.56 Sq. Feet
Length: 44.17 Feet
Height: 16.0 Feet _
Analysis of the flight test results of the "Cruciform Tail"configuration disclosed a significant deficiency in the directionalstability and engine-out minimum control speed of the airplane as wellas some perceived loading difficulties due to low clearance of the aftcargo door. A major redesign and modification to the basic aircraftconfiguration was then undertaken.
The two engine nacelles were extended aft and configured with avertical tail on each side. A new horizontal tail was designed to setatop the two vertical tails in a configuration similar to that of the OV- 10"Bronco," thus the name, "Bronco Tail" configuration.
AT3
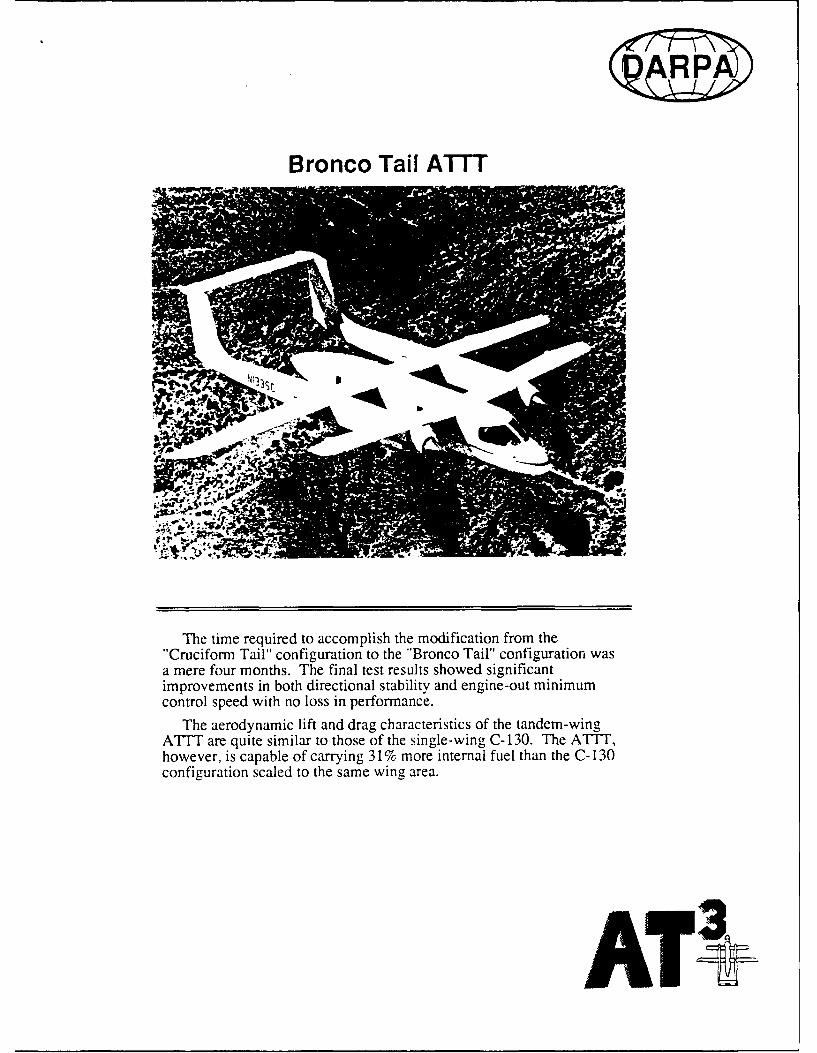
Bronco Tail ATTT
The time required to accomplish the modification from the"Cruciform Tail" configuration to the "Bronco Tail" configuration wasa mere four months. The final test results showed significantimprovements in both directional stability and engine-out minimumcontrol speed with no loss in performance.
The aerodynamic lift and drag characteristics of the tandem-wingATIT are quite similar to those of the single-wing C-130. The ATFT,however, is capable of carrying 31% more internal fuel than the C-130configuration scaled to the same wing area.
AT3

Structure
[ All-Composite Construction- Ease of manufacture and modification.
U Static Load Test- Flight components loaded to design.- Flight test limited to 80% of design.
U Dynamic Load Test- Ground Vibration Test (GVT).- Flutter clearance flight test.
The primary reason for the tandem wing/nacelles design was toprovide the necessary volume for internal fuel. It also allowed the fuelto be distributed away from the centerline cabin/cargo area. Thisconcentrated the fuel, engine, and landing gear loads in the nacelle withthe two wing structures providing a light weight tie-in to the fuselage.For ease of manufacturing and modification, the entire 62% POCaircraft was constructed of composite materials, even though many ofthe components were quite angular and well suited to moreconventional techniques.
Static load tests to the design load factor were performed on bothwings before assembly, and on the vertical and horizontal tail afterassembly on the fuselage. These tests were repeated after the Broncotail modification. As is customary when the flight article is also thestatic test article, the flight test program was restricted to 80% of thedemonstrated design load factor.
A ground vibration test (GVT) was performed on the 62% POCaircraft due to the unique structural configuration and concern forcoupling between the wing bending modes and the nacelles. Fluttermargins were predicted to be adequate by the GVT analysis. Flighttests to clear the flutter envelope were successfully completed on thebaseline configuration. No dynamic structural problems wereencountered during flight testing.
ATi3

Subsystems
JI Flight Controls- Development was required to safely
attain POC envelope (not transferableto full-scale)
J Flaps- Complex but trouble free.
2J Other Systems Performed Well- Electrical, Fuel, Propulsion, Egress,
Communications, etc.
It was anticipated that a boosted, fly-by-wire flight control systemwould be used on a full scale A'flT. A simple manual control systemwas designed for the POC aircraft. This control system requiredextensive rework and modification over the course of the test programin order to retain flight safety and still attain the desired test conditions.This was especially true of the aileron system. All of the controlsystem problems that were encountered were related to the reversiblenature of the linkage and would not occur if standard, irreversiblehydraulic actuators are used on the full-sca'e version.
The flap system was unique to the design and its utility was one ofthe prime program objectives. The fast-acting flap design was allmechanical and quite complex. Complexity was dictated by the largenumber of independent flap surfaces (eight) and the necessity to insurethat large asymmetries did not occur during deployment. In spite of itscomplexity, the system worked well throughout the test program.
Subsystems in the 62% POC aircraft were not designed forapplication to full-scale. The designs were basic, simple, and relativelyrugged. Most of the subsystems- electrical, fuel, propulsion, egress,communications, etc. - performed well over the course of the testprogram.
A T3

Takeoff Performance
3.0
2.5 EBeat Effo I - 641 It
2 Average- 680 ft
A 525 hp; Flaps Rotatfid at 45 KIAS1.0 0 525 hp; Flaps Rotated at Brake Release
. 550 hp; Flaps Roated a! 45 KIAS7 580 hp; Flaps Rotated at 45 KIAS
0.5 o 600 hp; Flaps Rotate at 45 KIAS- Linear Regression o, 0 Data
0 1 1
0 100 200 300 400 500 600 700 800 900Standardized Takeoff Roll (if)
STOL takeoffs at a scaled mid-mission weight were accomplished.Extrapolation of the results to full-scale indicates that a 1000 foottakeoff roll should be obtainable.
Initial concerns about lifting off below Vmca have been alleviatedwith the Bronco tail. The fast-acting flap feature demonstrated a 10%improvement in ground acceleration distance but did not show a similarimprovement in takeoff distance due to the nose-down pitching momentintroduce by rapid flap movement immediately before and during thetakeoff rotation. Even if takeoff attitude could be achieved, the pitchinstability at high power would still be cause for concern.
AT~

Predicted Range
1000 Fuel Reserve, 85002 p1260 Flight test results2400 indicate the2200 .mr ximum sea
level range of a full2000 scale A-T would
' be 2200nm and_0 i "-- the best cruise
'S 600 -speed would be=, 1400 - -
220 knots.
1200 Design1000 Cruat,
1000 - -...
00 1__
100 120 140 160 180 200 220 240 260 280 300
Airspeed-knots
The sea level range for a full ecale AMfl' v as calculated based onthe measured 62% POC aerodynamic flight test data. The variation inspecific fuel consumption (sfc) with power setting was empiricallydetermined based on the 62% flight test data for the P&W PT6-135Aengines and applied to the specified sea level performance of the G.E.CT64-820-4 engine, the initial candidate engine for the full scaleAT. Application of this sfc correction to the original design datareduced the design range from 2400 to 2300nm.
Flight test results indicate that the maximum sea level range of thefull scale ATMT would be about 2200nm, about 100nm less than thecorrected design range.
Best cruise speed would be 220 knots rather than the design speed of230 knots.
ATi:

Predicted Endurance
2 10008 fuel reserve, 85008 pdFIo - ! Flight test results
18 indicate endurance16 - Design of over 12 hours
1 - Crucit. could be routinely14 - - Bronco achieved.
210
100o 120 1440 160 180 200 220 240 260 280 300Airspeed - knots
The sea level endurance for a full-scale AITIT was calculated basedon the measured 62% POC aerodynamic flight test data andempirically determined specific fuel consumption characteristicsmeasured on the POC engine. Maximum sea level endurance is over14 hours, slightly higher than the design point at the best loiter speed
I of 120 knots, but somewhat less than predicted at the higher speeds.
.5
AT

Predicted Range vs. Payload
10009 Fuel Reserve IPayload
2800 Convertled to2600 iot
2400
20 -2-20
" 2000 -
.S 180 . . . . . . . . . . ... . .....
1600 200 kts ______
1400 -240 kts -.........
1200 - " ."280 kts . .
S1000 1V0 2000 4000 6000 8000 10000 12000 14000 16000
Payload WI-Iba
This chart shows range versus payload for a full scale ATTT. Noticethat the range could be extended well beyond the design range byreplacing some of the payload in the cargo bay with a ferry fuel tank.High density payloads above the design value of 8500 pounds couldalso be carried by off-loading fuel to stay within the maximum take-offweight of the airplane.
The trade-off of higher payload weight (concentrated on the aircraftcenterline) and lower fuel weight (distributed along the span) couldincrease wing root bending moments above design values. If carryinghigh density payloads for shorter ranges is a desirable feature for anATTT, a temporary external strut could be installed between thefuselage floor and the engine nacelle to distribute the load.
D ATi

Influence of Propeller Efficiency & SFCEffect of Propeller Efflclency-8500*PIL
24002200 -1-J Propeller Efficiency2M-0 Sea level range reduced=_- leo - 150nmif only 76%I *1o0o W O - propeller efficiency is1204 -- achieved100000 Prop Effidency..76
600-400
100 120 140 160 180 200 220 240 260 280 300Airspeed-knot
Specific Fuel 240 Effe-t of SFC-8500# P/LConsumption 2M
Sea level range reduced 2000
200nmbya12% 1 1800 -
increase in SF0 Is-
*1000 -SFC..52480
400 - - - -
100 120 140 160 180 200 220 240 260 280 300Almrped-knots
Propeller efficiency and specific fuel consumption are the two mostdifficult parameters to extrapolate to full scale. These charts showparametric comparisons of the effect of variations in prop efficiencyand SFC.
If only 76% propeller efficiency can be achieved rather than thedesign value of 86%, the maximum sea level range will be reducedfrom 2200nm to 2050nm, as shown in the top chart.
A 12% increase in specific fuel consumption reduces the sea levelrange from 2200nm to 2000nm, as shown the lower chart.
AT3

Moments of Inertia Measurement
Roll Axis
Pitch Axis
'Me accuracy of the absolute values of stability derivatives extractedfrom dynamic maneuvers is directly related to the accuracy of theaircraft moments of inertia used in the analysis. To provide a validdatabase for later comparison with wind tunnel tests, it was decided tomeasure the inertias of the A'T 62% POC aircraft. Directmeasurements of the total aircraft moments of inertia were performedboth prior to and after the installation of the Bronco tail.
Since no primary structure existed near the cg of the ATIconfiguration, it was possible to cut a hole in the top of the fuselage andsuspend the aircraft from its cg by a single cable. Calibrated springswere attached to the aircraft on each axis. Moments of inertia werethen computed from the measurement of the frequencies at which thesystem oscillated in each axis (using the installed instrumentation rategyros). The direct measure of moments of inertia permitted the stabilityderivatives to be extracted from the flight test data with reasonably highconfidence. This should enhance the value of the flight test data forfull-scale development.
AI'o

Directional Stabilityg 0,30
0.25- - - - A no Ta~i A significant increase in the
~jO2CCifor Tail directional stability derivative-020 . was realized by the Bronco
- - -15 tail modification.
O1 - -o -| Gear Up/z005 - Forward Flaps Up/
~. - - - -Aft Flaps Up0 4 6 10 12 14
Angle of Attack-deg
Gea Up 0.30 ---
Forward Flaps 2T/ 0.25 -
Aft Flaps 330 0.20 - -rono Tail
*_M Crucillorm Tail
0.10 - - U
o W _
0 2 4 6 8 10 12 14Angle of Attack-dog
Control doublet maneuvers were performed periodically during theflight test program to extract stability and control derivatives. Amanual response-matching technique was used.
The flight-test-derived derivatives were used to assess the affects ofconfiguration changes and to verify test results from standard testtechniques such as neutral point determination. By the end of the testprogram, a relatively complete set of stability derivatives had beenobtained on both the cruciform tail and Bronco tail configurations.
The charts above show the significant increase in the directionalstability derivative that was realized by the Bronco tail modification.
AT3

Static Stability - Idle Power5Bronco Tall
0 Centor of Gravity =270 Inches Gear Up/I, ° _- ___._ _ _-'c e _____ Forward Flaps Up/
~Aft Flaps Up
us-20
-15 0 0.5 1.0 1.5 2.0 2.5Ufft Coefficient
Gear Up/ Bronco raell__n__of_
F r F pCnter of Gravity = 270 InchForward Flaps 270/ oAft Flaps 330
-10 U
-15
-0 0.5 1.0 1.5 2.0 2.5Lift Coefficient
To understand the effects of center of gravity (cg) variation onlongitudinal trim, several idle power accelerations and decelerationswith widely varying cg conditions were flown and analyzed. Thestability derivatives extracted from these dynamic maneuvers were usedto correct each test to a common cg. Theoretically, the data pointswould collapse to a single line.
The results shown in the above charts are consistent and areconsidered to be within the overall accuracy of the data.
AT M-

IR
Static Stability - Neutral Point
5 Gear Up/__ _ __Forward Flaps Up/
I~A ft Flaps Up5
-10
o 0.5 1.0 1.5 2.0 2.5
Lift Coeff cint 2
Gear Up/ 15Forward Flaps 27°/ s
Aft Flaps 330 -2 1 i ", --
Li.IttCCeeffcient
10
Sevralide pwe acelraton ante deceravt23insee nit
-10
Litt Coefficient
Several idle power accelerations and decelerations were flown withwidely varying cg conditions. Longitudinal trim curves were analyzedto validate the neutral point determined by Scaled Composites. Thedata was corrected to a cg location which corresponded to the neutralpoint location for that configuration. Theoretically, the data pointswould collapse to a single horizontal line if the neutral points wereaccurate.
The resulting curves shown on the charts above corroborate theneutral point determination for low and moderate lift coefficients.
NI
______%AT-

R
Thrust Effects on Longitudinal Trim -Flaps Up UPForward Flips Up/Aft Flaps Up, cg=270 In.
Analysis of the data 0 M Poweproduced an empirical 0a,,"Pow.,
relationship between _ -idle trim curves and max E -power trim curves. ! -10
Applying this V15relationship to severalidle power trim curvesproduced these_ 25PROJECTED MAX 0 0.5 1.0 1.5 2.0 Z5
power trim curves.- Lft Coefficient
The ACTUAL MAX 5
power trim curves are M 0plotted against thesame idle power trim _. -5curves in the top chart. '. 0 -10
The general trends in - M Powerthe actual max power Itrim curves are well * .20represented by theprojected max power -25 0 0.5 1.0 1.5 2.0 Z5
curves. Lift Coefficient
One of the distinct advantages of the tandem wing twin enginedesign was the opportunity to place approximately 40% of the effectivewing area and 65% of the flapped area within the propeller slipstreamfor STOL performance. The design lift coefficient of 3 was achievedduring the flight test program with flaps down and high power. Theconditions, however, were accompanied by a noticeable static pitchinstability. The instability is a result of the propeller slipstreamproducing a larger lift increment on the forward wing (well forward ofthe cg and immediately behind the prop) than on the aft wing.
Analysis of flight test data produced an empirical relationshipbetween idle power trim curves and max power trim curves. The liftand pitching moment due to thrust were both found to vary with shafthorsepower and with lift coefficient squared. The above charts plot idlepower trim curves with projected and actual max power trim curves.
Although not a precise prediction, the general trends in the actualtrim curves are well represented by the projected curves.
IAT3

R
Thrust Effects on Longitudinal Trim -15 *Up,.,u ! FlopsA, Flops* e Ir. Flaps Down10
-sThe empirical
relationship between0idle trim curves and max
g- 5 power trim curves wasusMa applied to the1 ---- flaps-down
.1 "5 configuration.0.5 1.0 1.5 2.0 2.5 3.0 3.5 The PROJECTED
Lft Coeffildent power trim curves(upper chart) are quite
1 Max Power similar to the ACTUAL10 idle Power power trim curves5 (lower chart) below a lift
& coefficient of 2.;m0
-10 "
-150.5 1.0 1.5 2.0 2.5 3.0 3.5
Lift C-effIclent
The empirical relationship between idle trim curves and max powertrim curves discussed on the previous chart was applied to theflaps-down configuration. The results are shown above.
The projected max power trim curves are quite similar to the actualtrim curves below a lift coefficient of 2. Above this lift coefficient theairplane experienced buffet and the actual trim curves break in a stabledirection.
With flaps down at max power, the airplane is nearly neutrally stableat a nominal cg position of 270 inches.
AT~

ATTT Thrust Effects - Aft Cg
Gear Up/Forward Flaps 27°/Aft Flaps 330, cg--281 In.
1015
o. 5
Power for Level Flight (PLF)0u +I PLIF Predicted
MAX
-5 is MX Predicted
Idle
-1o ' I I0 0.4 0.8 1.2 1.6 2.0 2.4 2.8 3.2
Uft Coefficient
This chart shows that the longitudinal instability that occurred atmax power during one flight with an aft cg position (281 inches) waswell predicted by the empirical thrust-effects equation.
Increasing aircraft-nose-down elevator was required as the liftcoefficient increased above 1.0, reaching a value of plus 15 degreesbefore recovery was initiated.
- AT

Effect of Thrust on Neutral Point300
2W - - - Gear Up/280 - - - -Forward Flaps Up/270 - -- - IDLE _Aft Flaps Up
_t 7 - 525 HP260 i- - 1050 HPJ250
2 16 deg AOA240-,
230 10 0.5 1.0 1.5 2.0 2.5 3.0 3.5 4.0
Uft Coefficient
Gear Up/ ~ 290IDEE
Forward Flaps 270/ 280 - 5_ _
Aft Flaps 33* 270 0- 5oHPt;c260 • 12 deg ADA
250 _,_
240 "i
23OPI I I
0 0.5 1.0 1.5 2.0 2.5 3.0 3.5 4.0Lift Coefficient
Adding the thrust-effects equation to the computations of the neutralpoint generated a new relationship which included the effect of thepower setting. The resulting curves for idle, 50% and max power areshown above.
The pitch instability produced by the slipstream effects on a tandemwing at high power settings is a condition which must be addressed ifhigh power STOL performance is to be realized. Active differentialcontrol of forward and aft flaps may provide a practical solution to theinstability. However, since all of the flap surfaces on the 62% POCaircraft were mechanically linked for safety, it was not possible toinvestigate active differential control of flaps without major controlsystem modification.
AT~

IR
Proof-of-Concept Approach
[1 Substitute subscale flight test article forearly wind tunnel testing
[ Dynamic maneuvers and flight environmentsnot possible in wind tunnels
J Key Technology answers - not all answers
3 Fixed-price contract- Deliverable flight test report- Contractor solely responsible for
configuration control and flight safety
The ATTT program established a different approach to thedevelopment of a new aircraft configuration. It replaced theconventional wind tunnel and associated development with a subscaleflight article. The proof-of-concept aircraft simultaneouslyaccomplished the configuration development normally done in a windtunnel and obtained flight test data in flight environments. The flighttest data included dynamic maneuvers not possible in wind tunnels.
One of the keys to the success was the fact that neither the POC northe full-scale aircraft needed to venture into the transonic region whereflight risks would have been considerably higher without preliminarywind tunnel testing. It remains to be seen whether the design dataobtained will truly shorten the time and effort to develop a full scaleaircraft. Certainly a great deal of knowledge has been obtained about ageneric tandem-wing design.
The procurement method was also new in that the project was doneunder a fixed price contract with specified payment milestones and withno acceptance specifications or delivery of the aircraft to thegovernment. The contractor retained safety responsibility and allconfiguration control of the aircraft throughout construction and flighttesting with minimal government intervention. The result was a wealthof flight test data on a new configuration for relatively little cost.
ATi3

Conclusions
J Design mission is feasible
J Tandem wing exhibited normal handling qualities
J Engine thrust destabilizing in pitch (STOLenvironment)
1 Good flight test database obtained
J POC objectives were achieved
Ji Relaxation of sea level range requirement wouldbe cause for configuration reassessment
[J Production of full-scale prototype would be thenext step
The results of the ATT-i Proof-of-Concept test program indicate thatthe design mission is do-able. The tandem wing configurationexhibited conventional performance and handlig qualities except forthe destabilizing influence of power in t4 TO nnvironment.Furthermore, the design and most of the validatifig data are in place. Ifthis mission, or one of similar range and STOL capabilities is valid, thenext step would be construction of a full scale prototype. Certainly afull-scale A1TT in its current configuration would provide acombination STOL/long-range capability which is not currentlyavailable. However, significant alterations to the design mission,especially a relaxation of the sea-level range requirement, would callfor a reassessment of the applicability of the tandem wingconfiguration.
Even though the program extended over a considerably longer timethan first planned, testing was completed safely, all program objectivesachieved, and an impressive volume of actual flight test data wasobtained on a unique aerodynamic configuration. For this application,the idea of a proof-of-concept flight article and use of a newprocurement process were quite appropriate and successful.
AT%*