
SRR Indicator Review and Revision Results Summary Draft Final 6-16-10
16
Sustainable Rangeland Roundtable Indicator Review and Revision Results Summary Prepared by James R. Bernard Environmental Management Consulting for the SRR Indicators Review and Revision Working Group Austin, Texas June 15-17, 2010
-
Upload
james-bernard -
Category
Documents
-
view
226 -
download
2
Transcript of SRR Indicator Review and Revision Results Summary Draft Final 6-16-10
Sustainable Rangeland Roundtable Indicator Review and Revision Results Summary
Prepared by James R. Bernard
Environmental Management Consulting for the
SRR Indicators Review and Revision Working Group
Austin, Texas June 15-17, 2010
Final Draft for review, 6-16-10
2
Background and Context At the Sustainable Rangelands Roundtable (SRR) meeting in November 2006, participants received a presentation entitled “Six Steps to Taking Indicators from Words to Reportable Measures” created by member James Bernard (attached in summary form as Appendix 1). The process presented was endorsed by SRR as mechanism for revising the SRR indicators. A workshop was planned and convened with the purpose of:
reviewing, verifying, reconcile SRR indicators; updating and/or creating metadata for indicators; reviewing the existing and potential data sets supporting the SRR indicators; identifying data gaps; and developing strategies to improve data acquisition and quality.
To implement the first four steps of the indicator as words to reportable measures process, the SRR agreed to:
Review all 64 indicators for clarity and pose questions about meaning and measurement (Step 1);
Take previous summary metadata work done by SRR (Mitchell, Breckenridge, Tanaka, others) and revise/create summary matrix identifying data sets (Step 2);
Prepare documents that ask questions about the kind of data needed to support indicators (e.g., the Indicator 33 questionnaire attached as Appendix 2);
Consider data screening tool (Step 3) for review and potential use (Step 4) Workshop participants for a daylong session in Denver, Colorado June 14, 2007 were SRR members James Bernard, Bob Breckenridge, Bill Fox, Gary Evans, Ted Heintz, Lori Hidinger, Kristie Maczko, John Mitchell, and John Tanaka with Corrie Knapp serving as recorder.
The workshop participants discussed the SRR indicators in numerical order asking and answering a consistent set of questions:
What does indicator mean/what was it intended to mean? Identify data sets that can support the indicator Where has the indicator been used/developed? Does the indicator measure rangeland ecosystem goods and services compiled by
SRR? Identify indicators that have been fully realized/displayed? Are there indicators to add (better ideas or ties to ecosystem goods/services) or
delete (unmeasurable concepts, duplications) Products of the workshop were to be: Proposed revised indicator names, including additions/deletions Listing of indicators and a matrix of supporting data sets
Final Draft for review, 6-16-10
3
Recommendations for further indicator development/refinement and a “next steps” pathway
In an effort to provide clarity and transparency in the indicator names, the workshop participants incrementally adopted a set of principles and translations: Units of measurement (area, percent) need to defined Change = time component Extent = spatial component Areal extent = acres, square miles What is measured needs to be stated in the name of the indicator Words such as “significant” are redundant when displayed as change over time and
imply a baseline and/or thresholds Words such as “integrity” mean assessment
Examples of revised indicator names would be: #11 Extent of land area of rangeland could become Areal extent of rangeland #15 Density of roads and human structures could become Density of roads and human
structures per area of rangeland #16 Integrity in natural fire regimes on rangeland could become Frequency, intensity,
and extent of natural fire on rangeland A matrix to capture the workshop participant discussion and previous analysis was envisioned to include: Indicator Name Suggested Revised Indicator Name Number of measurements? What does the indicator mean? SRR categorization (core indicator; pilot project indicator) Data status (A, B, C, D; data characterization from Tanaka/Fox/Karl 2005 presentation;
“research” indicator) Data notes, details, constraints (from matrices) Has indicator been operationalized? Used in a published report? Graphically displayed
in some fashion? Questions to ask and answer about indicator Strategy to obtain data, funding; outreach needs; who would champion? Ecosystem services measurement (core processes or specifics)
A draft 26-page matrix was completed April 22, 2010 that expanded to 36 pages by June 13, 2010 and integrated information from: Criteria and Indicators, June 2003; Core Indicators, May 2006; Presentation overheads from 2003, 2006, 2007;

Final Draft for review, 6-16-10
4
Data matrices for each criterion, 2003; Data availability characterization, May 2006; SRR Range and Ecosystem Services by Category, January 2007; Published indicators (U.S. Environmental Protection Agency, 2003; Heinz Center, 2002
and 2008; National Report of Sustainable Forests, 2003); and 14 pages of June 14, 2007 workshop notes.
Matrix summary Broad-scale overarching results include: There are many more than 64 measurements involved in operationalizing the SRR
indicators and 28 indicators are recommended for renaming There have been advances in data collection to support some indicators since 2003 There are indicators that cannot practically be measured There are new indicators to be considered The SRR indicators measure ecosystem goods and services There was a thorough data characterization in 2003 that is useful to measure change There an extensive number of surveys and questionnaires necessary to support many of
the SRR indicators SRR utilized an issue-based framework for identifying criteria, then organized indicators
within issue Total measurements necessary for the 64 SRR indicators and revised indicator names A conservative assessment of the SRR indicators found that the 64 indicators include eight indices involving at least 192 and as many 217 as total measurements.
Criteria 1 (1-10): 30-35 measurements, one index
Criteria 2 (11-20): 29-34 measurements, four indices
Criteria 3 (21-26): 15 measurements, one index
Criteria 4 (27-54): 79-94 measurements, two indices
Criteria 5 (55-64): 39 measurements For clarity, 28 indicator names have been revised using the Working Group’s protocol. Ecosystem Goods and Services Assessment How do the SRR indicators measure ecosystem core processes and goods and services produced by rangelands?
• 34 SRR indicators measure ecosystem core processes and/or goods and services • 21 Indicators measure core processes • 7 indicators measure intangible in-situ services • 8 indicators measure tangible extracted goods
An assessment of ecosystem goods and services measurement by criterion found that:
Final Draft for review, 6-16-10
5
• All Criterion 1 Indicators measure core processes • All Criterion 2 and 3 indicators measure core processes and/or ecosystem goods and
services • One Criterion 4 indicator (#33) measures core processes • Seven of the Criterion 4 indicators measure ecosystem goods and services • None of the Criterion 5 indicators measure core processes or ecosystem goods and
services Supporting data collection/data set update There are a number of newly available data sets and reports relevant to realizing the SRR indicators. A number of ongoing data collection efforts may present opportunities for SRR to utilize data in new ways to support indicator development.
New data sets and monitoring Wadeable Streams Assessment, U.S. Environmental Protection Agency, Office of Water, 2006. Sediment and habitat features, water chemistry, and macroinvertebrate data were collected by US EPA, states, tribes, and other federal agencies from over 1.392 wadeable perennial stream locations in the lower 48 states over a five-year period. Sampling sites were randomly located based on the distribution of first order (smallest) to fifth order streams, so that areas with few stream miles had fewer sampling sites than areas with more stream-miles. All data were collected during the summer index period during base-flow conditions yielding a data value that is not representative for parameters that have considerable temporal variation. http://www.epa.gov/owow/streamsurvey/
The Natural Resources Conservation Service (NRCS) installs, operates, and maintains an
extensive, automated system to collect snowpack and related climatic data in the
Western United States called SNOTEL (for SNOwpack TELemetry). The system evolved
from NRCS's Congressional mandate in the mid-1930's "to measure snowpack in the
mountains of the West and forecast the water supply." The programs began with
manual measurements of snow courses; since 1980, SNOTEL has reliably and efficiently
collected the data needed to produce water supply forecasts and to support the
resource management activities of NRCS and others.
http://www.wcc.nrcs.usda.gov/snow/
Underutilized data sets and monitoring
The Forest Inventory and Analysis (FIA) program of the USDA Forest Service used a
combination of aerial and plot-based data to provide information about all U.S. forested

Final Draft for review, 6-16-10
6
lands through federal-state partnerships. Phase 1 is a remote sensing phase aimed at
classifying the land into forest and non-forest and taking spatial measurements such as
fragmentation, urbanization, and distance variables. This phase has historically been
done using aerial photography, but is changing to a system based on satellite imagery.
Phase 2 consists of a set of field sample locations distributed across the landscape with
approximately one sample location (FIA plot) every 6,000 acres. Forested sample
locations are visited by field crews who collect a variety of forest ecosystem data. Non
forest locations are also visited as necessary to quantify rates of land use change.
Phase 3 consists of a subset of the phase two plots (approximately 1 every 96,000 acres)
which are visited during the growing season in order to collect an extended suite of
ecological data including full vegetation inventory, tree growth, mortality and crown
condition, soil data, lichen diversity, coarse woody debris, and ozone damage. The suite
of data supports indicators presented on separate web pages clickable from
http://fia.fs.fed.us/program-features/indicators/
The USDA Natural Resources Conservation Service conducts the National Resources Inventory (NRI) to capture data on land cover and use, soil erosion, prime farmland soils, wetlands, habitat diversity, selected conservation practices, and related resource attributes on non-federal land. The NRI was conducted on a five-year cycle during the period 1982-1997, but is now conducted annually. NRI data were collected every five years for 800,000 sample sites; annual NRI data collection occurs at slightly less than 25 percent of these same sample sites. Future estimates will also cover Hawaii, Alaska, the Caribbean, and selected Pacific Basin islands.
2007 NRI Rangeland On-Site Data Collection
Began in 2003
On-site data were collected for 1,319 segments in 17 states for 2007.
States have been provided instructional materials, new QA/QC protocols, and
high-resolution photo-based site maps (from their RSL).
NRI Pastureland Pilot
Began in 2005
Grazing lands specialists have developed a set of on-site protocols that are being
proposed for NRI use. These protocols are being tested during 2007 in Colorado,
Florida, Kentucky, Missouri, and Pennsylvania.

Final Draft for review, 6-16-10
7
Pilot study with USFS and BLM
NRCS, USFS, and BLM have conducted a pilot study in 13 central Oregon counties
to investigate how the U.S. can develop a consistent rangeland assessment and
monitoring strategy for all lands regardless of ownership. Data have been
collected for both NRI and USFS-FIA sample locations, using a hybrid set of
protocols. The Sustainable Rangelands Roundtable, Society of Range
Management, Council of Environmental Quality, and numerous other entities are
asking for a scientifically-credible process that will provide common reporting
across private and public U.S. rangelands.
Release of rangeland results
Some initial findings based upon on-site data collected 2003 through 2006 (13,400 data points) is at draft stage with release for Fall/Winter 2010.
NRI data falls into twelve Broad Cover/Use categories:
(1) Cultivated Cropland (7) Urban and Built-up Land (2) Noncultivated Cropland (8) Rural Transportation Land (3) Pastureland (9) Small Water Areas (4) Rangeland (10) Census Water (5) Forest Land (11) Federal Land (6) Other Rural Land (12) Conservation Reserve Program (CRP) Land
Types of data collected on each rangeland point in the study include:
Land cover and land use
Landscape and soils
Ecological site information
Rangeland health
Invasive/noxious plant presence
Disturbance indicators
Conservation practices and resource concerns
Plant composition and patterns
Plant production, cover, density, and height
Instructions and protocols for point data collection include:
Ownership
Final Draft for review, 6-16-10
8
Conservation Reserve Program
Soils
Land Cover/Use
Use of the Land
Irrigation
Conservation Practices
Wetland and Deepwater Habitats
Salinity
Universal Soil Loss Equation Erosion
Resource Concerns
The USDA National Agricultural Statistics Service (NASS) conducts national surveys that measure acres planted and harvested, yields, production, and market prices. The estimates include cash receipts from the marketing of about 150 crop and livestock commodities. NASS conducts annual surveys of livestock herd sizes during January and July of each year. The U.S. Geological Survey’s NAWQA program is using NASS data on chemical use and farm practice information to correlate with soil, land use, water quantity and quality, and other hydrologic data to further investigate the impacts of different management practices and land use activities on water quality. http://www.nass.usda.gov/ The U.S. Department of Agriculture Economic Research Service (ERS) has carefully tracked changes in different land use over the past 50 years in its “Major Uses of Land” series (http://ers.usda,gov.data/majorlanduses/). The ERS “grassland, pasture, and range” category is based on grazing activity rather than land-cover classification. Cropland, as defined by ERS, includes cropland used for crops, cropland used for pasture (including land rotated between crops and pasture use or marginal cropland indefinitely used as pasture), and idle cropland such as lands in the Conservation Reserve Program. ERS uses NASS-published, calendar-year cash receipts for major livestock and commodity-producing states. ERS develops indexes to indicate direction and magnitude of changes in monthly sales quantities and multiplies them by NASS-published monthly prices. Data for other states are developed in cooperation with the NASS state offices, which use all available sources, including informed opinions, often corroborated by data from state survey programs, producer associations and the state’s extension service.
Indicators that cannot be practically measured The indicators of Criterion 5: Legal, Institutional and Economic Framework for Rangeland Conservation and Sustainable Management are contextual information and do not constitute traditional status or trend data. Using a very conservative assessment, some 39 measurements
Final Draft for review, 6-16-10
9
will need to be undertaken to fulfill the legal, institutional, and economic contextual information called for in the details of the indicator names. C5. 55. Land Law and Property Rights. Extent to which laws, regulations, and guidelines clarify property rights and land tenure arrangements, recognize customary and traditional rights of indigenous people, and provide means of resolving property disputes by due process as they relate to the conservation and sustainable management of rangelands C5. 56. Institutions and Organizations. Extent to which governmental agencies, educational institutions, and other for-profit and not-for-profit organizations affect the conservation and sustainable management of rangelands. C5. 57. Economic Policies and Practices. Extent to which economic policies and practices support the conservation and sustainable management of rangelands C5. 58. Public Information and Public Participation. Extent to which laws, regulations, and guidelines, institutions and organizations provide opportunities for: (1) public access to information; and (2) public participation in the public policy and decision-making process relating to rangelands C5. 59. Professional Education and Technical Assistance. Extent to which land management programs and practices support the conservation and sustainable management of rangelands C5. 60. Land Management. Extent to which land management programs and practices support the conservation and sustainable management of rangelands C5. 61. Land Planning Assessment, and Policy Review. Nature and extent of periodic range-related planning, assessment, and policy review activities, including planning and coordination between institutions and organizations C5. 62. Protection of Special Values. Extent to which laws, regulations, and guidelines institutions, and organizations provide for the management of rangelands to conserve special environmental, cultural, social and/or scientific vlaues C5. 63. Measuring and Monitoring. Extent to which agencies, institutions and organizations, devote human and financial resources to measuring and monitoring changes in the condition of rangelands C5. 64. Research and Development. Nature and extent of research and development programs that affect the conservation and sustainable management of rangelands
Indicators that require further implementation steps that can be realized in the near to medium term Three SRR indicators are noted as having data support or having data available for national reporting. An example of this status is: C1. 10. Percent of stream length in rangeland catchments in which stream channel geometry significantly deviates from the natural channel geometry (or revised: Percent of miles in rangeland wadeable streams showing disturbance from reference conditions). Using the U.S. EPA Wadeable Streams Assessment, 2006, Relative Bed Stability (RBS) data from 2000-2004 in the lower 48 states show 25% of wadeable streams to be "most disturbed" and 20% to be "moderately disturbed" with 5% not able to be assessed. Reported by the National Environmental Status and Trend Indicator Project.
In the medium term, four SRR indicators are noted as data gaps and five are noted as having “partial” data support. Another four indicators are noted as needing “additional development.” Indicators that require further implementation steps that can be realized through additional research 21 SRR indicators are noted as needing additional research include:
Final Draft for review, 6-16-10
10
C3. 25. Presence and density of wildlife functional groups on rangeland C3. 26. Annual removal of native hay and non-forage plant materials, landscaping materials, edible and medicinal plants, and wood products C4. 29. Number of visitor days by activity and recreational land class C4. 30. Reported threats to quality of recreational experiences C4. 31. Value of investments in rangeland, rangeland improvements, and recreational tourism infrastructure C4. 33. Areal extent and percentage of rangeland under conservation ownership or control by type of conservation method C4. 34. Expenditures (monetary and in-kind) to restoration activities C4. 35. The threat or pressure on the integrity of cultural and spiritual resource values C4. 42. Presence and tenure of natural resource nongovernmental organizations at the local level C4. 46. Years of education C4. 54. Public beliefs, attitudes, and behavioral intentions towards natural resources C5. 55. Land Law and Property Rights. Extent to which laws, regulations, and guidelines clarify property rights and land tenure arrangements, recognize customary and traditional rights of indigenous people, and provide means of resolving property disputes by due process as they relate to the conservation and sustainable management of rangelands C5. 56. Institutions and Organizations. Extent to which governmental agencies, educational institutions, and other for-profit and not-for-profit organizations affect the conservation and sustainable management of rangelands. C5. 57. Economic Policies and Practices. Extent to which economic policies and practices support the conservation and sustainable management of rangelands C5. 58. Public Information and Public Participation. Extent to which laws, regulations, and guidelines, institutions and organizations provide opportunities for: (1) public access to information; and (2) public participation in the public policy and decision-making process relating to rangelands C5. 59. Professional Education and Technical Assistance. Extent to which land management programs and practices support the conservation and sustainable management of rangelands C5. 60. Land Management. Extent to which land management programs and practices support the conservation and sustainable management of rangelands C5. 61. Land Planning Assessment, and Policy Review. Nature and extent of periodic range-related planning, assessment, and policy review activities, including planning and coordination between institutions and organizations C5. 62. Protection of Special Values. Extent to which laws, regulations, and guidelines institutions, and organizations provide for the management of rangelands to conserve special environmental, cultural, social and/or scientific values C5. 63. Measuring and Monitoring. Extent to which agencies, institutions and organizations, devote human and financial resources to measuring and monitoring changes in the condition of rangelands C5. 64. Research and Development. Nature and extent of research and development programs that affect the conservation and sustainable management of rangelands In assessing the socio-economic subset of the SRR indicators (part of Criterion 3 and all of Criterion 4), an effort was made by Stephanie Kane and J.D. Wulfhorst of the University of Idaho’s Social Science Research Unit to better identify potential data sets, research needs, and to develop rough cost estimates for operationalizing the indicator. Cost estimates for 24 indicators were calculated, two more were dependent on the number of parcels to be considered, and an additional five indicators were characterized as too difficult to calculate given uncertainties in scale, scope, and definition. For six of the indicators, new surveys were identified as necessary to support the indicator with an estimated cost of $107,000 minimum to a maximum of $139,500. 16 indicators were estimated to cost a minimum of $38,000 and require a minimum of 1,560 researcher hours up to a maximum of 1,980 hours.
Overall, Kane noted that:
“In many cases, the data is technically publically available, but the ease of obtaining the data probably varies significantly by geographic region. For instance, what might be available on one
Final Draft for review, 6-16-10
11
BLM state office website might not be available on another. Similarly, what data might be available and of good quality for one recreation area might not be available for another. In addition, as noted, some data would require completion of a Freedom of Information Act (FOIA) request, which could take considerable time. In some cases, the data may not be available and would also be difficult (if not impossible) to collect, either because of logistical concerns (such as difficulties constructing appropriate sampling frames) or because so many assumptions would be required that the data collected would be subject to criticism. In some cases, the assumptions themselves would likely also be affected by regional variation in interpretation (e.g. , how an “immigrant” to the community is defined), thus making comparisons at broader scales difficult.”
New indicators to be considered and indicator issue focal areas A number of rangeland indicators have been developed since the SRR First Approximation report and can be considered for inclusion in the SRR suite of indicators or as potential replacements for existing indicators. A number of issue areas such as climate change and energy development are yielding indicators that are allied to the SRR suite or could be included in the suite. Research needs for additional indicators are identified as appropriate. Rangeland Indicators The following indicators, which have the potential to supplement/complement the SRR indicators, have been published with graphic and/or textual presentations:
Current fire condition classes, U.S. Forest Service Fire Sciences Laboratory
High and moderate fire risk areas and current distribution of salmonids, published paper
Wildland Acres Burned, May through November, 2000, 2005, 2006, 10-year Average, National Interagency Fire Center
Gyyphosate Resistant Weed Species in Each State, 2000-2009, International Survey of Herbicide Resistant Weeds
Conversion of California Rangelands, 1982-1997, National Resource Inventory, USDA, NRCS, Fresno Inventory Coordination and Collection Site
Total Freshwater Withdrawal in 1995 as a Percent of Available Precipitation, SWRR, published paper
Climate Change Indicators
The SRR is working on bringing its indicators and to bear on climate change from the perspectives of ecosystem function and adaptation as well as potential mitigation. Recently realized national climate change indicators published by the U.S. Environmental Protection Agency, May 2010, seek to measure spatial and temporal change as it occurs and include:
Rate of Temperature Change in the United States, 1901–2008

Final Draft for review, 6-16-10
12
Graphic display by U.S. EPA shows how average air temperatures have changed in different parts of the United States since the early 20th century (since 1901 for the lower 48 states, 1905 for Hawaii, and 1918 for Alaska). National Oceanic and Atmospheric Administration’s National Climatic Data Center.
U.S. Lands Under Drought Conditions, 2000–2009
Graphic display by U.S. EPA shows the percentage of U.S. lands classified under drought conditions from 2000 through 2009. The data cover all 50 states plus Puerto Rico. National Drought Mitigation Center.
Precipitation in the Lower 48 States, 1901–2009
Graphic display by U.S. EPA shows how the amount of precipitation in the lower 48 states has changed since 1901. This graph uses the 1901 to 2000 average as a baseline for depicting change. Choosing a different baseline period would not change the shape of the trend. NOAA, 2010.
Rate of Precipitation Change in the United States, 1901–2008
Graphic display by U.S. EPA shows how the amount of precipitation has changed in different parts of the United States since the early 20th century (since 1901 for the lower 48 states; since 1905 for Hawaii). Alaska is not shown because of limited data coverage.
Trends in April Snowpack in the Western United States and Canada, 1950–2000
Graphic display by U.S. EPA shows trends in snow water equivalent in the western United States and part of Canada. Negative trends are shown by red circles and positive trends by blue. U.S. Department of Agriculture’s Natural Resources Conservation Service Water and Climate Center.
Length of Growing Season in the Lower 48 States, 1900–2002: West Versus East
Graphic display by U.S. EPA shows the length of the growing season in the western and eastern United States compared with a long-term average. The trend line was smoothed using an 11-year moving average. Choosing a different long-term average for comparison would not change the shape of the trends. National Oceanic and Atmospheric Administration’s National Climatic Data Center.
United States Plant Hardiness Zones, 1990 Versus 2006
Graphic display by U.S. EPA depicts changes in plant hardiness zones in the lower 48 states between 1990 and 2006. National Oceanic and Atmospheric Administration’s National Climatic Data Center, Arbor Day Foundation, 2006.
Change in Latitude of Bird Center of Abundance, 1966–2005
Graphic display by U.S. EPA shows annual change in latitude of bird center of abundance for 305 widespread bird species in North America from 1966 to 2005. National Audubon Society’s Christmas Bird Count. Percent changes rangeland extent (vegetation types grassland and hardwood woodland) compared to historical conditions across three time periods under each AOGCM emissions

Final Draft for review, 6-16-10
13
scenario combination. 2005-2034, 2035-2064, 2070-2099. California Climate Change Center, 2009.
Indicators requiring additional research, include:
The actual and potential impacts of these changes in climate on biodiversity and ecosystems across the planet have been the focus of numerous studies. These investigations focus on, (1) phenology of organisms, (2) ranges (geographic distributions of species), and (3) composition of and interactions within plant/animal communities.
The actual and potential impacts of climate change on emblematic, charismatic rangeland macro and microfauna and flora
o Sage grouse o Wild horses o Bison o Snow geese o Elk o Pronghorn antelope
Energy Development Indicators Selected indicators from the Sustainable Minerals Roundtable indicator list, 2002, related to energy development on rangelands include:
Status of non-Federal land for exploration and development
Area reclaimed/remediated/restored, reclamation/remediation/restoration scheduled
Compliance status of mines and oil and gas with respect to water quality by 5th code hydrological unit watersheds
Number of 5th code hydrological unit watersheds with mines and oil and gas
Number of permitted extraction or processing sites where water withdrawal causes environmental problems, relative to total number of permitted sites
Ambient environmental quality - number of permitted mine sites where groundwater is contaminated/ total number of permitted mines
Quantity of release into the environment / quantity of output
Value of energy and mineral resource production
Drilling (feet drilled) or number of active drillings
Idle production capacity as it relates to total
Transportation: oil and gas pipelines, electricity transmission lines, rail, trucks, barges, freshwater
Investment in ecosystem enhancement, reclamation, and restoration
Investment: Dollars spent annually on exploration
Investment in education and training
The degree to which a county is dependent on a resource affected by the resource development/minerals/energy activity
Dependency of a nonrenewable resource dependent county on the minerals/energy activity
Nonrenewable resource dependent counties as a percentage of all counties
Final Draft for review, 6-16-10
14
Social effects within a community reliant on resource development (local effects, these must be compared against a baseline, e.g., other rural communities, or the nation as a whole). Includes domestic violence rates, suicide rates, violent crime rates, substance abuse rates
Annual contribution to the community by minerals and energy sector
Other income to nonrenewable resource dependent counties from resource sector (royalties, contribution in dollars)
Disease rates (decreases or increases) due to resource development activity in resource-dependent communities
Subsistence activities of indigenous peoples: level of participation and level of harvest (local effects)
Indicators published graphically by High Country News, January 4, 2010 based on an unattributed data source related to wind power development serve as an example of potential indicator focus areas for that renewable energy resource:
Wind resources by class
Sage grouse core areas and wind
Potential high voltage transmission lines in the West
ESA listing and wind
Sage grouse core areas and oil and gas
ESA listing and oil and gas Updating the Sustainable Rangelands Criteria Framework The Montreal Process and the Sustainable Forest Roundtable along with state forest management cooperators have adopted a criterion addressing carbon storage: Maintenance of forest’s contribution to global carbon cycles. A potential additional criterion and undertaking a reconfiguration along the lines of the sustainable forest model could create a reconfiguration of the criteria for SRR.
Social Economic and Social Benefits Legal/Institutional/Economic Framework Economic Productive Capacity Soil and Water Environmental Carbon Storage Ecosystems Health Diverse Plant and Animal Population and Habitats

Final Draft for review, 6-16-10
15
Appendix 1.
Six Steps to Taking Indicators from Words to Reportable Measures
1. Verify/reconcile/refine indicator language.
What does the indicator measure?
What does the indicator mean? 2. Identify data sets and responsible parties that support the indicators.
What data set(s) support the indicator?
Who holds/manages the data? 3. Develop/modify a data screening tool.
What are the key data characteristics necessary to building indicators?
How much information about the data is needed for operationalizing the indicators? 4. Implement the data screening tool.
What is the most effective means to acquire and document information about the data sets?
5. Review the data sets with indicators, identify data gaps, and develop strategies to
improve the data.
What are the similarities, differences, and gaps for the data set(s) supporting the indicator(s)?
What can be done to fill information gaps, including improvements to existing programs in data collection, data analysis, and information management?
6. Select a data repository, acquire the data, and develop displays of the indicators.
How can the data best be represented visually?
At what scale will the data be presented (e.g., regional, state-by-state, watershed)?
What entity has the capability to serve as the data repository and display the indicators graphically?
Final Draft for review, 6-16-10
16
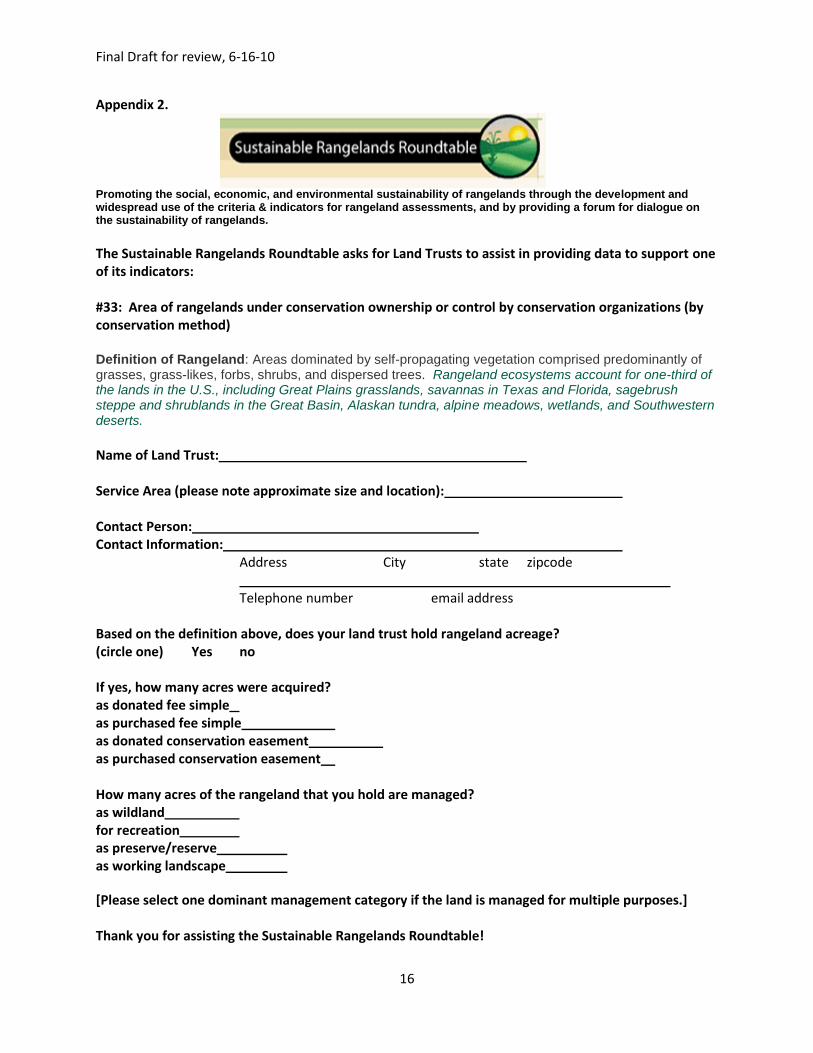
Appendix 2.
Promoting the social, economic, and environmental sustainability of rangelands through the development and widespread use of the criteria & indicators for rangeland assessments, and by providing a forum for dialogue on the sustainability of rangelands. The Sustainable Rangelands Roundtable asks for Land Trusts to assist in providing data to support one of its indicators: #33: Area of rangelands under conservation ownership or control by conservation organizations (by conservation method) Definition of Rangeland: Areas dominated by self-propagating vegetation comprised predominantly of grasses, grass-likes, forbs, shrubs, and dispersed trees. Rangeland ecosystems account for one-third of the lands in the U.S., including Great Plains grasslands, savannas in Texas and Florida, sagebrush steppe and shrublands in the Great Basin, Alaskan tundra, alpine meadows, wetlands, and Southwestern deserts.
Name of Land Trust: Service Area (please note approximate size and location): Contact Person: Contact Information: Address City state zipcode Telephone number email address Based on the definition above, does your land trust hold rangeland acreage? (circle one) Yes no If yes, how many acres were acquired? as donated fee simple as purchased fee simple as donated conservation easement as purchased conservation easement How many acres of the rangeland that you hold are managed? as wildland for recreation as preserve/reserve as working landscape
[Please select one dominant management category if the land is managed for multiple purposes.] Thank you for assisting the Sustainable Rangelands Roundtable!


![Compact Wideband Circularly Polarized SRR Loaded Slot ... · antenna based on SRR is designed in [10A dipole antenna ]. loaded with SRR [11] achieves wideband CP performance, but](https://static.fdocuments.in/doc/165x107/60ac0988b451332f6e3953f4/compact-wideband-circularly-polarized-srr-loaded-slot-antenna-based-on-srr-is.jpg)


![i:J rl]-- srr](https://static.fdocuments.in/doc/165x107/617d56aad7fe5851241b0b1a/ij-rl-srr.jpg)
