
Sri Lanka: Improving the Rural and Urban Investment Climate · PDF fileIMPROVING THE RURAL AND...
115
-
Upload
duongkhuong -
Category
Documents
-
view
219 -
download
2
Transcript of Sri Lanka: Improving the Rural and Urban Investment Climate · PDF fileIMPROVING THE RURAL AND...


SRI LANKA:IMPROVING THE RURAL AND URBAN
INVESTMENT CLIMATE
An Investment Climate Assessment
Based on an Urban and Rural Enterprise Survey
Carried Out by the Asian Development Bank and
The World Bank with Support from Sri Lanka’s
Department of Census and Statistics and
ACNielsen Lanka (Pvt.) Ltd.
January, 2005
ii
2004 The International Bank for Reconstruction and Development/The World Bank1818 H StreetWashington DC 20433Telephone: 202-473-1000Internet: www.worldbank.orgE-Mail: [email protected]
Published by
This volume is a product of the staff of the Asian Development Bank and the International Bank forReconstruction and Development/The World Bank. The findings, interpretations, and conclusions expressed inthis paper do not necessarily reflect the views of the Board of Directors of the Asian Development Bank andthe Executive Directors of The World Bank or the governments they represent.
The Asian Development Bank and The World Bank do not guarantee the accuracy of the data included in thiswork. The boundaries, colors, denominations, and other information shown on any map in this work do not implyany judgement on the part of the Asian Development Bank and The World Bank concerning the legal status ofany territory or the endorsement or acceptance of such boundaries.
Rights and PermissionsThe material in this publication is copyrighted. Copying and/or transmitting portions or all of this work withoutpermission may be a violation of applicable law. The Asian Development Bank and the International Bank forReconstruction and Development/The World Bank encourage dissemination of this work and will normally grantpermission to reproduce portions of the work.
For permission to photocopy or reprint any part of this work, please send a request with complete informationto the Copyright Clearance Center, Inc., 222 Rosewood Drive, Danvers, MA 01923, USATelephone 978-750-8400, Fax 978-750-4470, www.copyright.com
All other queries on rights and licenses, including subsidiary rights, should be addressed to the Office of thePublisher,The World Bank, 1818 H Street NW, Washington DC 20433, USA,Fax: 202-522-2422, E-mail: [email protected]
ISBN : 955-8908-12-6
Publication Designed byAri Investments Limited19, St. Joseph RoadNugegodaSri Lanka
The World Bank Colombo Office73/5, Galle RoadColombo 03Sri LankaInternet: www.worldbank.org/lk
Asian Development Bank6, ADB Avenue, Mandaluyong City0401 Metro Manila, PhilippinesP.O. Box 789, 0980 Manila, PhilippinesInternet: www.adb.org

TABLE OF CONTENTSAcronyms and Abbreviations iv
Acknowledgments v
Executive Summary - English E I- Sinhala S I- Tamil T I
I. Investment Climate Matters 11.1 What is the Investment Climate and Why Does it Matter? 11.2 Overview of the Economy: Achievements and Challenges 2
II. The Different Profiles of Urban and Rural Enterprises 82.1 Great Diversity in the Enterprise Landscape 82.2 Greater Stability and Longevity among Urban Enterprises 102.3 More Assets and Higher Productivity in Urban Enterprises 112.4 Registration among Rural Firms Surprisingly High 112.5 Weak Links between Rural and Urban Firms 132.6 Strong Links with Agriculture 13
III. The Investment Climate and Its Impact on Enterprise Performance 153.1 Sri Lanka’s Investment Climate: Strong on Governance,
Weak on Infrastructure and Finance 153.2 Good Governance: Sri Lanka’s Success Story 163.3 Infrastructure: The Weakest Part of the Investment Climate 193.4 Access to Finance Costly and Limited 233.5 Growing Regional Differences across the Country 273.6 How the Investment Climate Affects Firms' Performance 29
IV. International Competitiveness: Challenges and Opportunities 324.1 Unlocking the Potential of Foreign Direct Investment 324.2 Restoring Stability 344.3 Easing Difficult Labor Market Conditions 354.4 Increasing the Efficiency of Ports and Customs to Facilitate Trade 384.5 Performance and Challenges of Key Export Sectors 40
V. Conclusions and Policy Recommendations 485.1 A Policy Strategy Recognizing the Sharp Rural-Urban Differences 485.2 Policy Recommendations 49
AppendixesAppendix 1: Urban Manufacturing Survey: Sampling Methodology 55Appendix 2: Urban Services Survey (Tourism and Information Technology):
Sampling Methodology 59Appendix 3: Rural Survey: Instrument and Sampling Methodology 61Appendix 4: Urban Manufacturing Survey: Technical Appendix on
Investment Climate and Firm Performance 69Appendix 5: Rural Survey: Technical Appendix on Investment Climate,
Firm Performance and Start Up 80Appendix 6: Rural Summary Tables 92
References 99
iii

iv
ACRONYMS ANDABBREVIATIONS
ASYCUDA - Automated System for Customs DataBOI - Board of InvestmentCEB - Ceylon Electricity BoardEPZ - Export Processing ZoneERA - Electricity Reform ActEU - European UnionFDI - Foreign Direct Investment FMRA - Fiscal Management (Responsibility) ActFTA - Free Trade AgreementGDP - Gross Domestic ProductGN - Grama NiladhariGNI - Gross National IncomeGoSL - Government of Sri LankaIC - Investment ClimateICA - Investment Climate AssessmentICT - Information and Communication TechnologyIT - Information TechnologyITU - International Telecommunications UnionLECO - Lanka Electricity CompanyLG - Local GovernmentMFA - Multi- Fibre ArrangementMFI - Microfinance InstitutionsNGO - Non Government Organization NWSDB - National Water Supply Development BoardOECD - Organization for Economic Cooperation and
DevelopmentPS - Pradeshiya SabhaPUCSL - Public Utilities Commission of Sri LankaRDA - Road Development AuthorityR&D - Research and DevelopmentSAGT - South Asia Gateway Terminals Ltd.SLPA - Sri Lanka Port AuthoritySLR - Sri Lankan RupeeTEWA - Termination of Employment of Workers ActTFP - Total Factor ProductivityUBS - Unemployment Benefit SystemUI - Unemployment InsuranceUSA - United States of AmericaUK - United KIngdomWB - World BankWDI - World Development Indicators

v
ACKNOWLEDGEMENTSTHE AUTHORS GRATEFULLY ACKNOWLEDGE the support received and the collaborationwith Sri Lanka's Department of Census and Statistics and ACNielsen Lanka (Pvt.) Ltd. This reportwas prepared by a joint Asian Development Bank (ADB) - World Bank team led by Abuzar Asra,Rana Hasan and Ernesto Pernia from the ADB and Esperanza Lasagabaster, Mona Sur and IsmailRadwan from the World Bank. Other staff contributing to the report include Gemma Estrada,Dalisay Maligalig and Georgina Nepomuceno from the ADB, and Terrence Abeysekera, KareemAziz, Uwe Deichmann, Klaus Deininger, Naresha Duraiswamy, Marjorie Espiritu, Sriyani Hulugalle,Giuseppe Iarossi, Songqin Jin, Radha Singla, Giovanni Tanzillo and Dina Umali-Deininger from theWorld Bank.
Financial support from the Bank Netherlands Partnership Program for the Rural Investment ClimateSurvey is gratefully acknowledged. The team thanks Mr. Selvin Ireneuss and staff from the Secretaryfor Immediate Humanitarian and Rehabilitation Need (SIHRN) for their support and assistance infacilitating the rural survey in the North and East. Thanks are also extended to the various DivisionalSecretary and Grama Niladhari officers for their support.

vi

EXECUTIVE SUMMARYOver the past 25 years Sri Lanka has seen steady economic growth accompanied by a profound transformation of itstrade and industrial structure. Led by the garment sector, manufacturing exports took off in the late1970s, growing by 32 percent a year between 1978-95. Spurring this remarkable transformation werethe opening of trade and liberalization of some sectors in the late 1970s. Also contributing, thanksto an early commitment to human development, was the country’s skilled and literate labor force, afeature distinguishing Sri Lanka from other lower-middle-income countries.
While this progress is heartening, Sri Lanka has failed to keep pace with East Asian countries in economic growthand poverty reduction. In the 1960s Sri Lanka had a per capita income comparable to those of theRepublic of Korea, Malaysia, and Thailand. Today its per capita income is less than half of Thailand’sand an even smaller share of Malaysia’s and Korea’s. Not surprisingly, Sri Lanka has made limitedgains in poverty reduction. The share of the population in poverty remains comparatively high, atabout 22.7 percent. Of most concern is the skewed distribution of growth. Economic activity hasbeen strongly concentrated in Western Province while growth in rural areas has lagged far behind.As a result, poverty in Sri Lanka today is primarily a rural phenomenon.
Sri Lanka’s slower growth and poverty reduction can be attributed, in part, to its civil conflict of 1983-2001, but ahost of other institutional, macroeconomic, and microeconomic factors have also held the country back. Thisinvestment climate assessment is aimed at understanding which factors have made it difficult forfirms to do business in Sri Lanka and how these obstacles have affected their productivity.
What are the most severe obstacles in Sri Lanka’s investment climate? To help answer that question,the assessment uses micro-level data from a survey of the urban and rural investment climatesconducted in 2004. The urban survey covered 449 formal establishments in manufacturing (textiles,garments, food and beverages, rubber products, and industrial equipment) and 94 firms in thetourism and information technology sectors. The rural survey covered 1,327 nonfarm enterprises and555 households not participating in rural nonfarm activities.1 Sri Lanka’s rural enterprises are largelybased outside the home. Most are engaged in manufacturing or trading, with a far smaller shareinvolved in services. These enterprises are small, employing an average of 2.4 workers, includingfamily members.
This investment climate assessment is the first to include an analysis of entrepreneurship in ruralareas, allowing a more comprehensive look at the business environment. Fostering the growth of therural nonfarm sector is critical to reducing poverty in Sri Lanka, still largely a rural society. Some 85percent of the population lives in rural areas and rural nonfarm enterprises contribute significantlyto GDP. The survey findings suggest that the total value added by all rural nonfarm enterprises in2003 was SL Rs 185 billion-equivalent to 12 percent of GDP or 78 percent of agricultural GDP in2003.
Strong on Governance, Weak on Infrastructure and FinanceSri Lanka stands out among developing countries for its good governance, and firms benefit fromthe low levels of red tape and corruption. But despite differences between the urban and rural
E I

investment climates, urban manufacturing and rural enterprises alike suffer from poor-qualityinfrastructure (especially energy and transport) and costly and limited access to finance (see figures 1and 2).
Success in GovernanceIn sharp contrast with neighboringcountries, Sri Lanka has made bigstrides in reducing red tape, and ithas improved the governanceframework to the point where it nolonger poses a significant obstacle todoing business. Procedures forregistering a new firm aresimple-and, unusually, morethan half of rural enterprisesare registered. The oneexception to the success storyin governance is the continuingneed to achieve peace andpolitical stability.
Weaknesses inInfrastructureElectricity, cited as a top constraintby Sri Lankan enterprises,represents an entry barrier and asignificant operational cost for bothrural and urban firms. Access toelectricity is heavilyconcentrated in urban areassuch as Western Province,leaving rural areas such as UvaProvince grossly underserved.Less than 70 percent of ruralenterprises use electricity fromthe national grid.
Where electricity is available, the costis high and supply unreliable,exposing firms to frequent outagesand raising their production costs.Unreliable supply, leads nearly 75 percent of urban manufacturing firms in Sri Lanka to own agenerator, a significantly higher proportion than competitor countries such as China (27 percent). Forthese Sri Lankan firms, generators cost the equivalent of 12 percent of their fixed assets on average-absorbing resources that could otherwise be invested productively in their core business. Not only isowning a generator costly, operating it is also expensive. It can cost 3 to 4 times as much to generateelectricity with a generator. Lack of reliable electricity reduces the productivity of urban
SRI LANKA: IMPROVING THE RURAL AND URBAN INVESTMENT CLIMATE
E II
0
10
20
30
40
50 Urban
Rural
Electricity Policyuncertainty
Macroinstability
Finance(cost)
Laborregulations
N/A10 th5thUrban rank
15 th2nd
3 rd2nd1st
Rural rank
5 th4th
Per
cent
age
of fi
rms
citin
gco
nstr
aint
as
maj
or o
r se
vere
Source: Asian Development Bank and World Bank, Sri Lanka Investment Climate Survey, 2004.
FIGURE 1
Top Five Urban Constraints and Their Rural Ratings
Source: Asian Development Bank and World Bank, Sri Lanka Investment Climate Survey, 2004.
FIGURE 2
Top Five Rural Constraints and Their Urban Ratings
Per
cent
age
of fi
rms
citin
gco
nstr
aint
as
maj
or o
r se
vere
10
20
30
40
50
Transport Finance(cost)
Finance(access)
Demand Electricity
Rural
Urban
12 thth9 thUrban rank 1stN/A
3rd2nd1stRural rank 5 th4 th4

manufacturing firms by almost half, while among rural firms the productivity of those withoutconnections to the grid is 25 percent lower than those with connections. Moreover, lack ofelectrification lessens the probability that rural households will set up a new enterprise.
Transport is the biggest constraint for rural firms. It also poses an important obstacle to urbanmanufacturing firms and the expansion of tourism. Nearly a third of rural enterprises cited transportas a major or severe obstacle to starting or operating a business. While Sri Lanka has a dense roadnetwork by regional standards, it performs poorly in road quality relative to its Asian competitors. Asmuch as 90 percent of the country’s paved road network is in poor condition because of lack ofmaintenance.
As with electricity, transport conditions vary markedly across regions, with the inhabitants ofWestern Province enjoying the greatest mobility. For rural firms the poor quality of roads and lackof transport compound marketing problems and raise transport costs, reducing productivity. Abouta quarter of urban firms also suffer transport problems, resulting in losses equivalent to 7 percent ofsales.
The telecommunications sector, an early reformer, performs much better than electricity andtransport. Even so, waiting times for new lines remain substantially longer than those in China andMalaysia.
Costly and Limited Access to FinanceThe cost of finance hampers urban and rural firms alike, with almost a third of urban firms and ruralbusinesses citing it as a major constraint. Rural entrepreneurs are also constrained by limited accessto finance.
Small urban manufacturing firms pay significantly higher average interest rates (18 percent) than largeones (12 percent). They also pay higher rates than rural enterprises (14.5 percent), which benefit fromsubsidies from some state financial institutions, especially Samurdhi banks and microfinanceinstitutions. (These subsidies, however, threaten the viability of these institutions.) With supportfrom international donors, commercial banks have also started to enter the market for small andmedium-size enterprise finance, though their lending remains concentrated in Colombo. Because ofthese distortions, interest rates in rural areas vary widely. Moreover, high and persistent budgetdeficits add to the cost of finance as government crowds out the private sector to meet its borrowingrequirements.
Rural enterprises avail themselves of external finance but have extremely limited access to formal finance. Theyobtain most of their financing for new investments from internal sources (43 percent) and family andfriends (35 percent). Public financial institutions, despite a widespread presence in rural areas,account for a far smaller share of rural investment finance, while private commercial banks providea minimal share (2 percent), mostly to larger enterprises. In the urban manufacturing sector, smallfirms have less access to bank finance than large ones, forcing them to rely more on internalfinancing, leasing, and informal and family sources. For firms with inadequate external finance, theconsequence is limited opportunities for growth.
Collateral plays a vital role in the availability of finance. Results from the urban manufacturing survey showthat greater productivity does not translate into easier access to bank loans. Apparently unable todiscriminate on the basis of performance, banks instead rely heavily on the value of collateral whenconsidering a loan application. Collateral in the form of land is especially important for rural
EXECUTIVE SUMMARY
E III

enterprises. For many rural entrepreneurs, however, high levels of public landownership, unclearownership records, and widespread restrictions on the use and transfer of land make it difficult touse land as collateral, limiting access to external finance.
The Investment Climate and the External EconomySri Lanka has benefited greatly from opening its economy in the late 1970s, as evidenced by its powerful export growth.Yet it has failed to attract significant foreign direct investment. Maintaining its export growth andattracting greater foreign direct investment depend most importantly on achieving political stabilityOther factors in the country’s investment climate also affect its ability to compete internationally.
Critical Factors in International CompetitivenessSri Lankan firms have gained from international integration, as results from the Investment Climate Surveyconfirm. Exporting firms enjoy faster sales and investment growth-and the longer they have beenexporting, the higher their productivity, offering support for the "learning by exporting" hypothesis.For Sri Lankan manufacturers the two most important sources of the technological innovationcritical to this growth and productivity are acquiring new machinery and hiring key personnel-bothclosely tied to Sri Lanka’s openness. The acquisition of new machinery has been facilitated by theopen trade regime. And firms with foreign personnel-even firms with no foreign direct investment-perform better.
Despite generous fiscal incentives, flows of foreign direct investment to Sri Lanka trail behind those to other fast-growing Asian economies. In China, Malaysia, and Thailand annual investment inflows have reached orsurpassed 3 percent of GDP, while in Sri Lanka inflows averaged 1.3 percent of GDP in 1990-2002.When looking for a new facility, global corporations consider a broad set of factors that will affectproductivity and growth opportunities. Sri Lanka fares well on many of these indicators, such as askilled labor force and low levels of red tape and corruption compared with other developingcountries. Moreover, its ports and customs are more efficient than those of competitors such asChina and India, though there is scope for greater improvement. Sri Lanka performs poorly in manyother aspects of the investment climate, however, particularly political stability, economic certainty,quality of infrastructure, and predictability of labor regulations. While the Board of Investment seeksto facilitate each stage of the investment process, survey findings suggest that it has been unable toisolate firms from most problems in the investment climate. Manufacturing firms benefiting from itsregime are no more productive than others.
Political stability is a critical factor in the business environment. Sri Lanka remains among the world’s mostunstable countries, though it has made great strides since reaching a cease-fire in 2001. Although thenortheast is likely to gain most from the eventual peace settlement, the overall economy will benefitfrom greater ability to attract foreign direct investment and lower insurance costs for enterprises.
The civil war fought between 1983 and 2001 has not been the only source of instability; in the past four years SriLanka has had three different governments. The frequent changes in government have disruptedpolicymaking and slowed reform. Not surprisingly, economic and regulatory policy uncertainty ranksas the second most important constraint for urban manufacturing firms, with more than a third ofthese firms (though less than 5 percent of rural firms) citing it as a major or severe obstacle to doingbusiness (see figure 1). Nearly a third of urban manufacturing firms regard macroeconomicinstability as a major or severe constraint. Such perceptions also hold among foreign investors: whenpolitical uncertainties resurfaced in late 2003, foreign investors considering Sri Lanka as a locationput their plans on hold.
SRI LANKA: IMPROVING THE RURAL AND URBAN INVESTMENT CLIMATE
E IV

Also an important constraint are Sri Lanka’s labor regulations, ranked among the top five obstacles in theinvestment climate by urban manufacturing firms. Rigid, inflexible, and arbitrary, these regulationsoffer no certainty to investors and discourage increased employment. Payments mandated forredundancy in Sri Lanka are many times those legislated in other Asian countries. Perhaps mostrestrictive is the Termination of Employment of Workers Act of 1971, which makes it very difficultfor firms to fire or lay off workers. Firms can try to avoid restrictive labor regulations by hiringtemporary workers, but this too has costs: survey results show that the larger the share of temporaryworkers in a firm’s employment, the lower its productivity.
Performance and Challenges of Key Export SectorsThe economic prospects of Sri Lanka, as a small, open economy, depend on maintaining robust export growth. Oneof its biggest economic success stories is the development of the garment sector, which accounts formore than half the country’s exports. This concentration of exports, however, means that thephasing out of the Multifibre Agreement poses new challenges. This situation highlights the need fora better investment climate to maintain the competitiveness of the garment sector and support thediversification of exports.
Recent developments will help the garment industry weather the change in the international environment. Sri Lanka’sdependence on quotas has been declining since the mid-1990s, and large manufacturers have enteredthe niche market of branded and high-value clothing. Nevertheless, competition in the sector willintensify in the next few years, and the industry will have to prepare itself to meet this challenge.Lacking a strong material base, the country imports around 85-90 percent of its fabrics, whichinevitably increases turnaround time. Meanwhile, the average turnaround in the sector is rapidlydeclining, especially in key competitors such as China. The high concentration of export markets forthe garment sector also poses a risk.
How competitive are Sri Lankan garment firms today? A comparison with Chinese garment firms, based onInvestment Climate Survey data, shows that Sri Lankan firms have lower value added per worker.This difference can be attributed in part to higher capital investment by Chinese firms. Otherinvestment climate indicators also seem to favor Chinese firms, including access to more reliableenergy, lower inventories, lower subcontracting of sales to clients, and greater investment in formaltraining.
Sri Lanka’s tourism industry stands to benefit greatly from a sustained peace and could become an important newsource of foreign exchange and rural and urban employment. After facing bright prospects in the 1970s,tourism collapsed with the onset of the civil conflict. While the sector struggled to survive in SriLanka, it expanded rapidly in neighboring destinations. Today tourism accounts for less than 5percent of Sri Lanka’s export revenue, while it contributes nearly 10 percent in Thailand and 25percent in Mauritius.
The sector rebounded after the cease-fire, and the country offers a range of attractions catering to alarge tourism market. Yet it continues to face important constraints on its ability to compete withother destinations in the region. Many of these constraints are shared with urban manufacturingfirms, including macroeconomic instability, economic policy uncertainty, and the poor quality ofinfrastructure. Tapping tourism’s potential will require substantially upgrading basic infrastructure, tointegrate rural areas and spread the benefits to a larger number of provinces. Tourism so far has beenconcentrated in the South Coast while the potential of other provinces-such as North Central, Uva,and Sabaragamuwa-has been neglected.
EXECUTIVE SUMMARY
E V

Though still in a nascent stage, the information technology industry in Sri Lanka is growing rapidly. Most of itsrevenue still comes from the domestic market, but firms continue to expand their services to foreignmarkets, indicating that the industry has the potential to compete internationally. Survey resultssuggest that 60 percent of information technology firms are exporters and about 30 percent receiveforeign investment.
Before the industry can fully exploit the opportunities in the international market, however, it mustfirst overcome obstacles to business development. Some of these cut across sectors, such asmacroeconomic instability. Sri Lankan software companies also identified skills, education, andtelecommunications as among their most important constraints-unsurprising, given the sector’s heavyreliance on skilled labor and telecommunications. The government has already recognized theimportance of training and plans a comprehensive program to promote training in informationtechnology skills throughout the country. In telecommunications, further reforms and privatizationare needed to promote expansion and competitiveness and provide a stronger development platformfor the software industry.
The Investment Climate for Rural FirmsFor rural entrepreneurs a big constraint is limited access to regional markets (see figure 2). These entrepreneurscite marketing problems, particularly lack of demand, as a major obstacle. The problems stem froma range of factors. Rural entrepreneurs have few contacts or links with larger firms or buyers thatcould increase their exposure to bigger and more diverse markets. Most are unable to realizeeconomies of scale and face high marketing costs. The goods they produce are often of low qualityand have limited appeal in larger markets. Poor transport and telecommunications restrict their accessto information.
Moreover, the voices of rural entrepreneurs have not been heard. Evidence suggests that rural enterprises arenot yet effectively integrated into the policymaking process. Less than 10 percent of enterprises withmore than three workers believe that they can influence the content of existing or proposed lawsrelating to their business. The government could do more to strengthen mechanisms ensuring greatervoice for rural entrepreneurs.
The Investment Climate in Disadvantaged RegionsTwo regions of Sri Lanka are particularly disadvantaged: the northeast, which has suffereddisproportionately from the conflict, and the south, which suffers disproportionately from poverty.
The Northeast: An Investment Climate Constrained by Conflict In the Northeast Province, the site of most of the fighting during the conflict, businesses appear to have been establishedas part of household coping strategies and have been unable to grow in the difficult circumstances. Enterprises in theregion are typically smaller and much more likely to engage in household-based production thanenterprises in other areas. Production enterprises account for 60 percent of firms in the northeast,compared with 36 percent elsewhere. This structure suggests that entrepreneurs were unwilling toinvest in alternative premises for their business that might be destroyed in the fighting or that mighthave to be evacuated.
The insecurity has imposed a high cost. As many as 20 percent of firms in the northeast haveincurred losses as a result of crime and violence in the past year, compared with just 1-2 percent inthe rest of the country. In addition, much of the local infrastructure was destroyed during the
SRI LANKA: IMPROVING THE RURAL AND URBAN INVESTMENT CLIMATE
E VI

conflict. Not surprisingly, a larger share of rural firms in the northeast than in the rest of the countryconsider public infrastructure to be a constraint.
The South: Poverty and Poor Service DeliveryExcluding the northeast, where poverty data are not yet available, the southern provinces of Uva andSabaragamuwa have the country’s highest poverty rates. In Uva Province one symptom of poverty isthe small manufacturing base in rural areas: half its rural enterprises are trading firms, which requirefewer assets than production firms. Given the lower incomes in Uva, it is unsurprising thathouseholds resort to small services and trading businesses to smooth their incomes during the slackagricultural periods. Uva also stands out for its greater problems in access to services. Only 62percent of its enterprises use electricity, compared with an average of 69 percent in the rest of thecountry. Its rural firms also are physically isolated, limiting their access to markets.
RecommendationsAchieving a permanent peace is undoubtedly the most important step Sri Lanka can take toward improving itsinvestment climate. The survey results highlight other areas warranting urgent consideration. Policiespaying greater attention to the differences between the urban and rural investment climates could domuch to increase rural employment and incomes and reduce the tremendous disparities betweenregions. Among the five most important issues in the investment climate, however, some arecommon to both urban and rural firms.
Improving Access to and the Quality of Energy and Transport (Urban and RuralFirms)Sri Lanka is already undertaking several important energy reforms, including restructuring the CeylonElectricity Board under the Electricity Reform Act of 2002 and establishing the Public UtilitiesCommission of Sri Lanka. Continuing to implement the regulatory framework is also a priority forthe energy sector. In the medium term essential reforms include introducing competition andcommercial relationships within the industry to drive improvements in performance. They alsoinclude establishing transparent and efficient subsidy mechanisms to help expand access to electricityin rural areas.
In the road sector the main policy priorities are driven by lack of access to good-quality roads, a keyimpediment to existing businesses and a severe barrier to starting or participating in rural nonfarmenterprises. Priority actions include providing adequate funding for maintaining and rehabilitatingroads, selecting a core network of roads to be maintained, developing an overall pricing policy forthe sector, and strengthening the capacity of agencies responsible for formulating and implementingsector policies.
Reducing the Cost of Finance and Improving Access to It (Urban and Rural Firms)Reducing the cost of finance in Sri Lanka will require stabilizing the macroeconomic situation, reducing the deficit,and reforming the two state-owned commercial banks, the Bank of Ceylon and the People’s Bank. Other key policypriorities in the finance sector include enhancing debt recovery mechanisms, expanding andupgrading the capacity of the Credit Information Bureau, improving the regulatory framework formicrofinance institutions, and reforming the contractual savings system.
EXECUTIVE SUMMARY
E VII

Improving Labor Market Flexibility (Urban Firms)In 2003 the government moved to reform labor regulations. While the details of the proposedreforms remain under discussion, they include introducing a formula for employee severancepayments, imposing strict limits on the duration of labor tribunal cases, and establishing anunemployment benefit system. To encourage foreign direct investment, foster efficient reallocationof labor, and promote employment in the formal sector, Sri Lanka also needs to transform itsdiscretionary and costly severance payment into modern, affordable, and equitable income supportfor the unemployed. This support need not take the form of unemployment insurance, however,since current conditions may not favor the effective operation of such a system.
Improving Access to Major Markets (Rural Firms)Beyond enhancing the coverage and quality of rural infrastructure, several other initiatives would also help improveaccess to markets for rural firms. Business organizations and local chambers of commerce couldstrengthen marketing channels for rural enterprises by holding product fairs to expose localproducers to buying habits and consumer behavior in different markets, helping to develop businessdirectories, and sharing information on prices, quality standards, and ways to obtain technical andfinancial services for greater value addition. In addition, supporting group marketing (for example,through associations and cooperatives) and business clusters would help rural firms take advantageof scale economies.
Improving Policy Certainty and Macroeconomic Stability (Urban Firms)As the survey revealed, policy uncertainty and macroeconomic instability have a tremendously adverse effect on urbanenterprises. A policy framework geared to improving policy certainty and macroeconomic stabilitywould include reducing the deficit and public debt, strengthening revenue collection through bettertax administration, reforming the civil service and reducing the wage bill, and decreasing the lossesof state-owned enterprises.
SRI LANKA: IMPROVING THE RURAL AND URBAN INVESTMENT CLIMATE
E VIII
Notes
1. For the purposes of the survey, rural nonfarm enterprises were defined as any income-generating activity(trade, production, or services) not related to primary production (crops, livestock, or fisheries)undertaken within the household or in any nonhousing unit. Any value addition to primary production(processing) was considered to be a rural nonfarm activity.

INVESTMENT CLIMATEMATTERS
1.1 What is the Investment Climate and Why Does it Matter?There is growing recognition around the world of the importance of a sound investment climate forgenerating economic growth and poverty reduction. Few now accept the simplistic view that greaterinvestment alone will lead to higher growth. Instead, the prevailing view emphasizes building aproductive environment in which private businesses can flourish. Although the term investment climateis used broadly, here it is taken to mean the policy, regulatory, institutional, and governanceenvironment that supports (or fails to support) entrepreneurship and efficient markets.
Despite the greater awareness of the importance of the investment climate, until recently little workhad been done to systematically gather objective measures of the investment climate or to link thesemeasures directly to the performance of firms. In Asia such work is being undertaken by the WorldBank and the Asian Development Bank, together with Asian governments and other developmentpartners, through a series of investment climate assessments, each based on a representative nationalsurvey of enterprises.1 The assessments measure how conducive a country’s investment climate is tocreating economic growth and benchmark the country against its neighbors and competitors. Thisassessment of Sri Lanka is based on an Investment Climate Survey conducted in 2004 (box 1.1).
Why Undertake an Investment Climate Assessment in Sri Lanka? In Sri Lanka, despite an open trade and foreign investment regime and recent steps toward peace,considerable barriers to investment remain. Indeed, Sri Lanka attracts significantly lower levels ofdomestic and foreign investment than countries with similar incomes. The host of institutional,macroeconomic, and micro-economic factors that hamper investment inhibit the country’s potentialfor growth and poverty reduction.
Boosting investment and its productivity requires a concerted effort by the government to improvethe investment climate. The government has initiated reforms in the financial, labor, and land sectorsto address some of the barriers. To build on these initial efforts, a better understanding is needed ofthe microeconomic constraints facing firms and the effects of these constraints on productivity. Byquantifying the costs associated with barriers to investment, this study can help policymakers identifythe areas most in need of reform and monitor improvements in the investment climate over time.
Why Undertake an Assessment of the Rural Investment Climate?The vast majority of investment climate assessments around the world have focused on factorsinfluencing entrepreneurial initiative and performance in the urban formal sector, most often inmanufacturing. This assessment of Sri Lanka is among the first to take a more comprehensive lookat the business environment by extending beyond major urban centers to analyze entrepreneurshipin rural areas as well.
CHAPTER ONE
1

Enterprises in the urban formal sector can generally be easily identified through a company register.By contrast, identifying rural enterprises, many of which operate informally, can be difficult, time-consuming, and costly. Yet understanding the rural investment climate can be essential in efforts toengender pro-poor growth. In Sri Lanka the rural nonfarm sector is critical to growth and povertyreduction. Still a rural society, the country has 85 percent of its population in rural areas, but only 32percent of its labor force in agriculture.2 A recent World Bank study of Sri Lanka (2002a) revealedthat a large share of rural households and rural poor depend on the rural nonfarm sector foremployment and income.
The findings of this investment climate assessment confirm that rural households with nonfarmenterprises are significantly better off than those relying solely on agricultural income. The results alsoconfirm that the investment climate has important effects on the performance of rural nonfarmenterprises-and thus on overall employment growth, poverty reduction, and development in rural areas.
1.2 Overview of the Economy: Achievements and ChallengesDespite a civil conflict extending over the past two decades, Sri Lanka has achieved a socioeconomicperformance quite remarkable in the developing world. Yet challenges remain. Sri Lanka has fallenshort of its growth potential for a host of reasons, the most important being the prolonged civilconflict. Structural rigidities in the economy also continue to constrain its growth. Sharpeningregional disparities in growth and poverty reduction are another cause for concern.
Social and Economic Progress in the Midst of Civil WarSri Lanka began liberalizing its economy in the late 1970s, much earlier than other South Asiancountries. By the 1980s, thanks to privatization, trade liberalization, and financial sector reform, thecountry could provide a more favorable investment climate for foreign investors. Continuing itsreforms over the past decade, Sri Lanka privatized many public entities, including its plantations,national airline, and telecommunications corporation. These policy changes, together with thecountry’s strong human resource base, have fostered healthy export performance, especially in teaand garments. The services sector has also grown steadily, benefiting from greater banking activity,the liberalization of telecommunications services, and expanding tourism and regional containertraffic. Today Sri Lanka ranks among the most open economies in South Asia, with exports andimports amounting to 78 percent of GDP and a foreign investment regime that is among the mostliberal in the developing world (Central Bank of Sri Lanka, Annual Report 2003).
SRI LANKA: IMPROVING THE RURAL AND URBAN INVESTMENT CLIMATE
2
BOX 1.1
The Investment Climate Survey in Sri Lanka: Coverage and Methodology
What are the most severe obstacles in Sri Lanka’s investment climate? To help answer that question, the Asian Development Bank andthe World Bank-together with Sri Lanka’s Department of Census and Statistics and A. C. Nielsen-conducted a survey of the urban andrural investment climates in 2004. The urban survey covered 449 formal establishments in five key manufacturing sectors (textiles,garments, food and beverages, rubber products, and industrial equipment) and 94 firms in tourism and information technology, allsectors important to the external economy. The sample covers both Western Province and districts outside it.
The rural survey had four parts: an enterprise survey, a survey of households not engaged in nonfarm activities, a community survey,and a price module. Designed to be as comparable as possible to the urban survey, the rural enterprise survey covered 1,327 nonfarmenterprises operated within a household or as a stand-alone establishment. An additional 555 randomly selected households notparticipating in rural nonfarm activities were surveyed to capture factors influencing the decisions of households on whether to engagein such activities. Households and enterprises were selected from 147 rural communities (grama niladharis) spread across all provinces.For the purposes of the survey, rural nonfarm enterprises were defined as any income-generating activity (trade, production, orservices) not related to primary production (crops, livestock, or fisheries) undertaken within the household or in any nonhousing unit.Any value addition to primary production (processing) was considered to be a rural nonfarm activity.
For more detail on the methodologies used to define the sample design of the urban and rural surveys, see appendixes 1-3.

Investments in human developmenthave produced remarkableoutcomes in health and education,where indicators have reached levelsclose to those of industrialcountries (table 1.1). Free anduniversal health and educationservices, a focus on gender equality,and extensive social welfareprograms have been core featuresof the country’s social policies forseveral decades. Sri Lanka hasalready achieved many of theMillennium Development Goals.
By contrast with its impressive human development record, Sri Lanka’s economic growth and povertyreduction have been less noteworthy, especially when compared with achievements in East Asia. Inthe 1960s Sri Lanka had a per capita income comparable to those in the Republic of Korea, Malaysia,and Thailand (figure 1.1). Today its per capita income is less than a tenth of Korea’s, less than afourth of Malaysia’s, and less than half of Thailand’s. Not surprisingly, Sri Lanka has also madesmaller gains in poverty reduction. The share of the population in poverty (poverty headcount)remains comparatively high, at about 23 percent-a rate similar to Indonesia’s 27 percent but higherthan Malaysia’s 15 percent and Thailand’s 13 percent.3
The slow pace of growth and poverty reduction in the past two decades can be attributed in part tothe civil conflict, estimated to have cost the country 2-3 percentage points of GDP growth a year(Central Bank of Sri Lanka, Annual Report 1998). A host of other factors have also held Sri Lankaback. One such factor has been a reluctance to continue progressive social and economic policies inthe past decade-policies that might have helped reorient the role of the state toward improving
opportunities for privatesector-led growth andproviding better public servicesto the population. The policyshift stems in part from lack ofstrong political leadership andthe accommodation ofminority interests by successivegovernments. Also slowingreform have been a lack ofconsensus on vital developmentissues among the major politicalparties and frequent changes ofleadership, with Sri Lankaholding three general electionsin the past four years.
INVESTMENT CLIMATE MATTERS
3
Source: World Bank, World Development Indicators database.
FIGURE 1.1
Missed Opportunities for Economic Growth in Sri Lanka
0
2000
4000
6000
8000
10000
12000
1962
1967
1972
1977
1982
1987
1992
1997
2002
GN
I per
cap
ita (
U.S
. dol
lars
)
Korea, Rep. of
Sri Lanka
Thailand
Malaysia
TABLE 1.1
Selected Human Development Indicators, Sri Lanka, 2002
Life expectancy (years) 74
Maternal mortality ratio (per 100,000 live births) 23
Child mortality rate (per 1,000) 16
Net enrollment at first grade (percent) 106
Literacy rate (percent) 92
Net primary completion rate (percentage of age group) 95
Source: World Bank, World Development Indicators database.

A Decline in Agriculture, a Rise in IndustryThe reform efforts of the late 1970s transformed the structure of the Sri Lankan economy. Althoughthe services sector continues to dominate the economy, accounting for more than 50 percent ofGDP, in the early 1990s industry overtook agriculture to become the second largest sector (figure1.2). It now contributes about 27 percent of GDP, compared with agriculture’s 20 percent. Duringthe 1990s, boosted by liberalization, industry grew by 6.8 percent a year and services by 5.7 percent-compared with only 1.9 percent for agriculture, still heavily constrained by interventionistgovernment policies. Nevertheless, agriculture continues to employ 32 percent of the labor force,while industry provides employment for only 24 percent.4
With the liberalization of the economyand the establishment of exportprocessing zones, manufacturing beganto cater to the international market,strengthening its competitiveness,especially in apparel. The gradualrelaxation of tariffs-from a prohibitiveand distortionary system in the 1970s toa three-band system with a maximumtariff of 25 percent-also fosteredgreater competitiveness in industrywhile agriculture, continuouslyprotected, lagged behind. To helpcounter initial obstacles faced byindustrial exporters, the governmentprovided an extensive package ofincentives-duty rebates, concessionaryexport financing, cash grants forexporters, and tax holidays-starting inthe 1970s and 1980s. (These incentivesremain in place, though some weremeant to be temporary measures tostimulate production.) Manufacturingexports took off, growing by 32 percenta year (in U.S. dollars) between 1978 and1995. As a result, the industrial exportshare increased markedly-from 14percent in 1977 to 72 percent in 1992and 78 percent in 2000 (figure 1.3).Reflecting this rapid growth inmanufacturing and exports, privateinvestment rose from the low levels ofthe 1960s and early 1970s (table 1.2).
Domestic Policy Challenges While international trade has beensubstantially liberalized, domestic
SRI LANKA: IMPROVING THE RURAL AND URBAN INVESTMENT CLIMATE
4
0
10
20
30
40
50
60
1971 1981 1990 1995 2000 2003
Source: Central Bank of Sri Lanka, Annual Report, various years.
FIGURE 1.2
Industry Overtakes Agriculture in Sri Lanka
Services
Industry
Agriculture
Sha
re o
f val
ue a
dded
in G
DP
(pe
rcen
t)
0
10
20
30
40
50
60
70
80
90
1972 1977 1982 1987 1992 1997 2002
Industrial exports as percentage of total
Exports as percentage of GDP
Source: Central Bank of Sri Lanka, Annual Report 2003.
FIGURE 1.3
Industrial Exports Lead the Way for Sri Lanka
Per
cent

structural rigidities continue to constrain economic growth. Factor markets in labor, finance, and, toa lesser extent, land are neither sufficiently well developed nor flexible enough for Sri Lanka to beinternationally competitive. Besides reforming its factor markets, Sri Lanka also needs to limit itsfiscal deficit and maintain macroeconomic stability-severe challenges made all the more difficult bythe size of the civil service and the public sector’s continuing intervention in the economy.
Labor regulations have been designed to protect the few who are employed in the formal sector-apolicy that has restricted labor mobility, limited productivity improvements, increasedunemployment, and hindered investment. Indeed, Sri Lanka’s labor policies offset the benefits of awell-educated labor force. Despite having eight years of schooling on average, workers in Sri Lankaearn wages no higher than those in neighboring countries, where workers have much less schooling.Unemployment, especially among educated youth, has risen as a result.
Sri Lanka’s financial sector, benefiting from liberalization, has grown and become more dynamic overthe past two decades. Nevertheless, banks continue to dominate the landscape, intermediating nearly55 percent of assets. State participation in banking has declined significantly since 1980, when the
two state-owned banks controlled 74 percent ofassets. Public financial institutions remain themost important players, however, with the twostate-owned banks still holding 46 percent ofbanking assets today. Financial intermediation isinefficient, as evidenced by large intermediationspreads and a narrow range of financialinstruments.
Slow and insufficient adjustment of the publicsector, together with the civil conflict, has led topersistent budget deficits, averaging 10 percentof GDP since the 1980s and resulting in highlevels of public indebtedness. At the end of2003 public debt reached 105.9 percent of GDP.In the past the government managed to financehigh deficits and maintain growth by relying onsignificant concessional foreign borrowing and
INVESTMENT CLIMATE MATTERS
5
Functional classification of spending, 2003
Interest 29%
Other 6% Civil Service 7%
Defense 14%
Education 9%
Health 7%
Welfare and Housing 12%Energy 6%
Transport 6%
Agriculture andFisheries 4%
Note: Defense includes public order.Source: Sri Lanka, Ministry of Finance data.
FIGURE 1.4
Interest Payments a Heavy Burden in Sri Lanka
TABLE 1.2
Investment and Savings as a Share of GDP, Sri Lanka, Selected Years, 1960-2003 (percent)
Indicator 1960 1975 1980 1985 1990 1995 2000 2003
Investment 15 16 34 24 22 26 28 22
Private 10 10 25 19 18 22 25 17
Public 5 6 9 5 4 4 3 5
Gross domestic savings 12 8 11 12 14 15 17 16
Gross national savings 11 7 14 14 17 19 21 21
Source: Central Bank of Sri Lanka, Annual Report, various years.

by engaging in financial repression-that is, by borrowing at below-market rates, especially through thecontractual savings system. Government borrowing continues to crowd out the private sector andkeeps interest rates high. Without a strong adjustment, fiscal policy will not be sustainable.
Despite the high fiscal deficits, Sri Lanka’s budget does little to promote good public services andeconomic growth. An oversized public sector and burdensome interest payments on domestic debt-payments that consume almost a third of the budget-make it difficult to reallocate spending (figure1.4). Sri Lanka has the largest bureaucracy per capita in Asia, with one million employed in the civilservice and semigovernment institutions (Central Bank of Sri Lanka, Annual Report 2003). Inaddition, defense constitutes the second largest spending category in the budget. Decisively endingthe civil conflict is therefore the most important step toward both reducing the fiscal deficit andgreatly improving the investment climate.
The high deficits have squeezed critical spending on social services and infrastructure. There aresigns that the quality of social services is suffering, which is bound to undercut Sri Lanka’s greatprogress in human development over the past few decades (World Bank 2002b). Capital spending hasbeen drastically cut back. Public investment in infrastructure fell from around 7 percent of GDP in1990 to half that level by 2000, contributing to a sharp deterioration in physical infrastructure andundermining Sri Lanka’s competitiveness. Although road density is relatively high by regionalstandards, the condition of the road network has markedly declined. Similarly, while access toelectricity expanded significantly in the past two decades, Sri Lanka has experienced chronic powershortages since the mid-1990s as a result of droughts and a failure of supply to keep up with demand.The effect of this situation on the investment climate shows up clearly in the survey results (seechapter 3).
Growing Regional DisparitiesGrowth and poverty reduction have been heavily skewed toward Western Province, with rural areaslagging behind (figure 1.5). In the 1990s economic activity became even more concentrated aroundWestern Province, whose share of GDP rose from 40 percent in 1990 to nearly 50 percent by theend of the decade. Meanwhile the combined share of Uva, North Central, and the former Easternand Northern Provinces fellfrom 22 percent to 15 percent,with the former NorthernProvince recording the worstperformance because of thecivil conflict.5 These regionaleconomic differences havetranslated into growing regionaldisparities in the incidence andseverity of poverty. While theincidence of poverty hasdeclined substantially inWestern Province, dropping toaround 11 percent by 2002, itremains above 20 percent in therest of the country and as highas 37 percent in Uva (figure1.6).
SRI LANKA: IMPROVING THE RURAL AND URBAN INVESTMENT CLIMATE
6
North
Cen
tral
Saba
raga
muw
a
Cent
ral
Uva
East
ernC
ontr
ibut
ion
to G
DP
by
prov
ince
(per
cent
), 2
002
0
10
20
30
40
50
Wes
tern
Sout
hern
North
Wes
tern
North
ern
Source: Central Bank of Sri Lanka, Annual Report, 2003.
FIGURE 1.5
Sri Lanka's Growth Concentrated in Western Province

One reason for the sharpening disparities is the concentration of export processing zones in WesternProvince. Another is the sluggish growth in agriculture, which has contributed to slower economicgrowth and poverty reduction in other provinces. The meager growth in agriculture compared withmanufacturing and services reflects in part the sector’s low productivity, which stagnated in the 1990s.It also stems from the failure of economic liberalization to reach agriculture, which remains highly
protected. Public interventionsin agricultural commodity andfactor markets haveunintentionally createdobstacles and disincentives thathave hindered productivitygrowth and discourageddiversification, bindingagricultural households to low-value activities such as paddyproduction. The findings of theinvestment climate assessmentalso point to obstacleshampering the growth andproductivity of ruralenterprises and to opportunitiesfor reducing rural poverty.
INVESTMENT CLIMATE MATTERS
7
Pov
erty
rat
e by
pro
vinc
e (
perc
ent)
, 200
2
11
2125
27 28
3437
0
10
20
30
40
Wester
n
North C
entra
l
Centra
l
North W
ester
n
Southe
rn
Sabara
gamuw
aUva
Source: World Bank staff estimates.
FIGURE 1.6
Poverty Still High Outside Sri Lanka's Western Province
Notes
1. The World Bank is conducting similar studies in other regions.2. Data are from the 2001 Census and 2003 Labor Force Survey (fourth quarter), conducted by the Sri Lanka
Department of Census and Statistics.3. These estimates are based on comparable national poverty lines. Based on internationally comparable
poverty lines, Sri Lanka also has higher poverty than Thailand and Korea. See World Bank (2003b; 2004b,table 1).
4. Data are from the 2003 Labor Force Survey (fourth quarter), conducted by the Sri Lanka Department ofCensus and Statistics.
5. Although Northern and Eastern Provinces were provisionally merged in 1987, data continue to becollected at the district level, making it possible to present data separately for the districts in the formerNorthern Province and those in the former Eastern Province. The report presents disaggregated datawhere warranted by differences between the two areas, using the former provincial names in figures andtables showing such data. This should not be taken to imply any judgment on the legal status of districtsor provinces in Sri Lanka or the endorsement or acceptance of such boundaries.

THE DIFFERENTPROFILES OF URBAN ANDRURAL ENTERPRISES
The urban and rural enterprises surveyed in Sri Lanka have sharply different profiles, and thedifferences are accentuated by the coverage of the urban manufacturing survey, limited to formalfirms.1 Urban enterprises tend to be older and much larger than their rural counterparts. Large-scalemanufacturing is concentrated around Colombo-though geographic distribution differs markedlyacross sectors-and is oriented toward exporting. Rural enterprises are likely to be a soleproprietorship headed by a male, based outside the home, and established using household savings.Their managers have education levels suggesting great potential for improving productivity andintroducing new technologies in Sri Lanka’s ruralareas. Rural enterprises in North EasternProvince have very different characteristics thanthose elsewhere in the country, largely because ofthe conflict.
2.1 Great Diversity in the EnterpriseLandscapeWhat makes up the diverse landscape ofenterprises in Sri Lanka? A large part of itconsists of an estimated 16,405 manufacturingenterprises operating in urban areas, and another620,000 enterprises in rural areas. Ruralenterprises employ some 1.5 million workers,about 20 percent of the country’s labor force.Contrary to popular opinion, the majority (59percent) of rural businesses are stand-aloneenterprises-that is, have a place of business otherthan the home. Because the survey excludedinformal firms operating in urban areas, allcomparisons of urban and rural firms refer toformal firms in urban manufacturing and bothformal and informal enterprises in rural areas.
What Firms Do-and WhereIn urban areas the five most importantmanufacturing activities-accounting for nearly 50percent of all urban manufacturing enterprises-
CHAPTER TWO
8
TABLE 2.1
A Snapshot of Urban Enterprises in Key ManufacturingSectors, Sri Lanka(percent, except where otherwise indicated)
Indicator Value
Share of firms with export orientationa
Garments 94
Rubber products 75
Food and beverages 62
Industrial equipment 41
Textiles 35
Share of firms with foreign direct investment
Garments 23
Rubber products 31
Food and beverages 9
Industrial equipment 27
Textiles 16
Share of firms in Western Province 56
Median number of workers 105
Male managers as a share of total 88
Share of managers with university degree 45
Average age (years) 30
Annual value added per worker (Sri Lankan rupees) 411,257
a. Firms exporting more than 10 percent of sales.
Source: Asian Development Bank and World Bank, Sri Lanka Investment ClimateSurvey, 2004.

are ready-made garments, textiles, industrialequipment, food and beverages, and rubber.Urban manufacturing activity is largely exportoriented, especially in garments (where 93.5percent of the firms surveyed export more than10 percent of sales), rubber (75.4 percent), andfood and beverages (62.2 percent; table 2.1)).Manufacturing is heavily concentrated in theColombo metropolitan area, though geographicdistribution varies across sectors. While garmentand industrial equipment firms are limitedlargely to the Colombo area, nearly three-quarters of food and beverage firms operateoutside Colombo, probably to be closer tosupplies. Textile enterprises are divided almostequally between Colombo and other urbancenters.
Most rural nonfarm enterprises are involved inproduction (41 percent) or trading (38 percent),with a far smaller share in services (21 percent;table 2.2). Around 10 percent are engaged in themanufacture and sale of processed agriculturalgoods. Nonagricultural production focusesmainly on manufacturing such goods asgarments, nonmetallic mineral products,furniture, and wood products. Most rural trading establishments are engaged in selling processed (65percent) and unprocessed agricultural products (57 percent). As would be expected, there is muchvariation among service-related enterprises, with the largest share engaged in repair services (24percent), followed by personal services (17 percent) and hotels (14 percent).
Rural nonfarm enterprises are scattered throughout the country. Western Province has the greatestconcentration, with more than 20 percent, followed by North Eastern and Southern Provinces
(figure 2.1). The large share of nonfarmenterprises in North Eastern Provincerelative to its share of the rural populationmay reflect the conflict in the region. Manyhouseholds appear to have forgoneagricultural activities and started smallbusinesses operating in their home as aresponse to the uncertainty and thepotential for loss.
Firms’ Workers and Their Skills The split between urban and ruralenterprises is not simply one of location butalso one of size: on average, urbanenterprises are significantly larger than their
THE DIFFERENT PROFILES OF URBAN AND RURAL ENTERPRISES
9
TABLE 2.2
A Snapshot of Rural Enterprises in Sri Lanka(percent, except where otherwise indicated)
Indicator Value
Number of enterprises 620,000
Number of workers 1,500,000
Share of firms producing for domestic market 99
Sole proprietorships as a share of total 98
Share of firms headed by a male 75
Stand-alone businesses as a share of total 59
Firms by sector
Production 41
Trade 38
Services 21
Share of firms in Western Province 20
Average number of workers 2.4
Family members as a share of workforce 50
Share of managers with university degree 2
Average age (years) 9
Share of firms registered 53
Annual value added per worker (Sri Lankan rupees) 93,763
Source: Asian Development Bank and World Bank, Sri Lanka Investment ClimateSurvey, 2004.
FIGURE 2.1
Sri Lanka's Rural Enterprises are Scattered Across Provinces
0
5
10
15
20
25
30
Wes
tern
North
Eas
tern
Sout
hern
North
Wes
tern
Saba
raga
muw
a
Cent
ral
North
Cen
tral
Uva
Per
cent
Nonfarm enterprises
Rural population
Source: Asian Development Bank and World Bank, Sri Lanka Investment Climate Survey, 2004; Sri Lanka Department of Census and Statistics data.

rural counterparts. The median number of workers employed by urban manufacturing enterprises isroughly 105, including 15 temporary workers. By contrast, rural enterprises employ 2.4 workers onaverage, including family members. Family members account for almost half the workforce in ruralnonfarm enterprises, with the largest share in trading enterprises (60 percent) and the smallest inproduction (42 percent). Production enterprises also tend to be larger, with 3 workers on average. Thelargest rural enterprise in the survey has 181 workers. Only 6 percent of rural enterprises have morethan 5 workers.2
In urban manufacturing about 45 percent of senior managers have a university degree, and more thanhalf of these also have a professional qualification. Less than 6 percent had failed to completesecondary school. In rural firms almost half the managers have completed 10 or more years ofeducation and nearly all are literate, indicating great potential to improve productivity and introducenew technologies in the country’s rural areas. Only 1 percent had no schooling at all. In Bangladesh,by contrast, a similar survey of the rural nonfarm sector found that 34 percent of owners or majoritypartners had no formal education.
Although women represent half theunskilled labor force in urbanmanufacturing, they account foronly 12 percent of seniormanagement. Their participationdiffers markedly across sectors andis highest in the textile sector. In therural nonfarm sector, by contrast,women run almost a quarter of allenterprises.
In urban manufacturing, export-oriented firms are the mostdynamic in terms of employmentgrowth. Rural enterprises appear toexperience little flux inemployment, with more than 90percent making no change in thenumber of employees during the previous year. The smallest rural firms (with less than fiveemployees) are the most stable, while larger firms tend to be growing or shrinking in response tomarket demand or seasonal fluctuations.
2.2 Greater Stability and Longevity among Urban EnterprisesUrban manufacturing enterprises tend to be older and more stable than rural enterprises (figure 2.2).The average age of urban manufacturing firms is 30 years, while for rural enterprises it is slightlymore than 9 years. Among urban enterprises, those in the garment sector are the youngest (16 yearsold on average), while those in the rubber and food and beverage sectors are the oldest (45 and 35years old).
In rural areas trading enterprises tend to be younger than others-as would be expected, since theyrequire less start-up capital. More than 85 percent of rural enterprises have always operated in thesame location. Of the few that have relocated, the vast majority have stayed in the same gramaniladhari (community).
SRI LANKA: IMPROVING THE RURAL AND URBAN INVESTMENT CLIMATE
10
FIGURE 2.2
Urban Firms Generally Older Than Rural Ones in Sri Lanka
Source: Asian Development Bank and World Bank, Sri Lanka Investment Climate Survey, 2004.
0
10
20
30
40
50
60
70
80
90
Less than 2years
2-5 years 5-10 years More than 10years
Urban
Rural
Firm
s by
age
(P
erce
nt)

2.3 More Assets and Higher Productivity in Urban EnterprisesSri Lanka’s urban firms are generallymore capital intensive and moreproductive than their ruralcounterparts. Annual value addedper worker in urban manufacturingis almost eight times that in ruralmanufacturing (figure 2.3). Thelower labor costs for ruralenterprises do not fully compensatefor the difference in productivity.Productivity tends to be particularlylow-and duration short-lived-among rural nonfarm enterprisesstarted as part of a householdsurvival strategy to supplementagricultural income or tide a familythrough the lean season.
In the urban sector the industrial equipment and rubber products industries appear to be the mostproductive (table 2.3). The more labor-intensive textile and garment industries trail far behind.Indeed, rural service enterprises have value added per worker close to that of the urban textile sector,which appears to be in decline.
The productivity of rural firmsvaries markedly across regions andsectors. Rural enterprises inWestern and Central Provinces arealmost 3.5 times as productive assimilar enterprises in NorthEastern Province. Among all ruralenterprises, service firms have thehighest productivity.
Despite urban-rural differences inproductivity, rural nonfarmenterprises contribute significantlyto GDP. The survey findingssuggest that the total value addedby all rural nonfarm enterprises in2003 was SL Rs 185 billion-equivalent to 12 percent of GDPor 78 percent of agricultural GDPin 2002.
2.4 Registration among Rural Firms Surprisingly HighWhile rural enterprises are commonly perceived as operating in the informal sector and thus avoidingregistration and taxation, the survey findings indicate that a surprising 53 percent of those in Sri
THE DIFFERENT PROFILES OF URBAN AND RURAL ENTERPRISES
11
FIGURE 2.3
Productivity Far Higher in Urban Manufacturing Firms in Sri Lanka
Source: Asian Development Bank and World Bank, Sri Lanka Investment Climate Survey, 2004.
Tho
usan
ds o
f Sri
Lank
an R
upee
s
0
50
100
150
200
250
300
350
400
450
Annual valueAdded per worker
Fixed assetsPer worker
Annual laborCosts per worker
Urban
Rural
TABLE 2.3
Productivity, Capital Intensity, and Labor Costs in Urban and Rural Firms,Sri Lanka(Sri Lankan Rupees)
Sector Annual valueadded per worker
Fixed assetsper worker
Annual laborcosts per worker
Urban enterprises 411,257 400,487 94,919
Industrial equipment 913,158 379,496 97,657
Rubber products 649,114 688,993 96,745
Food and beverages 495,024 509,764 90,836
Garments 275,940 232,974 97,898
Textiles 177,337 368,217 96,068
Rural enterprises 93,763 198,460 33,333
Production 54,779 203,862 27,000
Services 162,447 195,832 36,000
Trade 97,725 194,099 30,000
Source: Asian Development Bank and World Bank, Sri Lanka Investment Climate Survey, 2004.

Lanka are registered. The rural enterprises most likely to be registered are larger and older, pay taxes,and operate as a stand-alone establishment. Trade and service enterprises are more likely thanproduction enterprises to be registered, perhaps because these types of enterprise tend to operate asstand-alone businesses and are therefore far more visible.
Among rural enterprises that have registered, the majority did so with the pradeshiya sabha, thoughalmost half are registered with the divisional secretary (there is much overlap between these twogroups).3 Most firms that have not registered explained that they had not done so because it was notrequired, and less than 2 percent because the process was too costly or time consuming or to avoidhigh taxes. As box 2.1 shows, the cost of registering a business in Sri Lanka has been declining.
SRI LANKA: IMPROVING THE RURAL AND URBAN INVESTMENT CLIMATE
12
BOX 2.1
The Ease of Entry
Starting a business in Sri Lanka involves relatively little red tape. Nearly 74 percent of urban manufacturing firms reported that obtaininga business license or operating permit was not a problem, compared with 37 percent in India, 41 percent in China, and 51 percent inthe Philippines. Less than 8 percent of urban manufacturing firms, and 4 percent of rural nonfarm enterprises, cited the procedure asa major or severe obstacle.
The administrative burden for start-ups in Sri Lanka has only become lighter in recent years. In 2002 entrepreneurs wishing to registera limited liability company had to undertake 8 procedures taking at least 73 days and costing $127, equivalent to 15 percent of percapita gross national income (GNI). Recently, the process was simplified reducing the number of procedures to 8, the average time to50 days, and the cost to just under 11 percent of GNI. Even so, Sri Lanka still trails behind more dynamic East Asian economies in thetime it takes to open a business (table 1). Further efficiency gains are likely, however, with the government planning to automate thecompany registry.
In rural areas registration appears to be a relatively manageable process for most enterprises (table 2), with some 94 percent reportingthat it was not a problem. Yet a significant share (47 percent) continues to operate informally. Three-quarters of these enterprisesreported that they had not registered because it was not required. Almost all rural businesses are sole proprietorships, whose ownersare simply required to register the name of their business under the Business Name Ordinance of 1918. Since responsibility forbusiness registration passed to the provincial councils in 1998, each province has established slightly different registration procedures,and registration fees range from a low of SL Rs 250 in North Western Province to SL Rs 500 in Western Province.
Once a business is registered, the owners may still have to obtain a business license, required to operate in such areas as hotels,banking, bakeries, pharmacies, meat outlets, and motor vehicles. The licensing body varies. For example, the Central Bank grantsbanking licenses, while the Ceylon Tourist Board issues licenses to operate hotels.
Trade licenses must be renewed annually. The license fees, set each year by the responsible institution (under Pradeshiya Sabha Act15 of 1987), range from SL Rs 50 to SL Rs 1,000.
TABLE 1
Administrative Burden of Starting a Business, Selected Countries (2004)
Country Number ofprocedures
Duration(days)
Cost(percentageof GNI per
capita)
Minimumcapital
(percentageof GNI per
capita)
Chile 10 28 11.6 0
China 12 46 14.3 3,855.9
India 10 88 49.8 430.4
Malaysia 8 31 27.1 0
Philippines 11 59 24.4 9.5
Sri Lanka 8 58 18.3 0
Thailand 9 42 7.3 0
Vietnam 11 63 29.9 0
Source: World Bank, Doing Business Indicators, 2004.
TABLE 2
Administrative Burden of Registeringa Rural Enterprise, Sri Lanka (2004)
Time spent on the registration process(days) 3.62
Time spent on obtaining or renewingpermits or licenses (days) 2.20
Number of government agencies visitedfor registration 1.26
Number of government agencies visitedfor licensing 1.02
Official fees paid for registering orrenewing registration (Sri Lankan Rupees)
640.29
Official fees paid for obtaining or renewinglicense or permit (Sri Lankan Rupees)
972.94
Source: Asian Development Bank and World Bank, SriLanka Investment Climate Survey, 2004

2.5 Weak Links between Rural and Urban FirmsLinks between rural nonfarm enterprises and urban firms in Sri Lanka are relatively weak. Evidencefrom the survey of rural enterprises shows that few sell their products to multinationals, parentcompanies, or larger urban firms (table 2.4). The vast majority reported selling their goods andservices directly to consumers or traders in their own district. The data may understate the linksbetween rural and urbanfirms, however, since ruralenterprises could sell theirproducts to intermediariesthat then resell them tofirms in other parts of thecountry.
Larger rural nonfarmenterprises (those with morethan five workers)-particularly largerproduction and tradingenterprises-are more likelyto have links with largerfirms and to sell in marketsoutside their province.
One way for small ruralfirms to tap into widermarkets is throughsubcontracting (Lanjouwand Lanjouw 2001). In SriLanka it is primarily largerrural firms (with more thanfive workers) that takeadvantage of sucharrangements.
2.6 Strong Links with AgricultureAgriculture is intricately linked with both the urban manufacturing and the rural nonfarm sector inSri Lanka. Agricultural products serve as inputs to key urban manufacturing sectors. The food,beverage, and tobacco industries, for example, accounted for almost 33 percent of total value addedin 2000-the single largest share of industrial value added. The processing of tea and coconuts, bigexport earners for Sri Lanka, has long been an important industry. The rubber industry has also beenprominent, though its value has declined sharply with the drop in world rubber prices.
The strong production links run backward as well as forward: agriculture not only supplies inputs,but also demands equipment and chemicals produced by industry. Agriculture, urban manufacturing,and rural nonfarm activities are also related through labor and capital markets and through strongconsumption links. Sales in all three rural nonfarm sectors peak during April (the festival season)following the main (maha) harvest and hit their lows in the middle of the slack (yala) season, when
THE DIFFERENT PROFILES OF URBAN AND RURAL ENTERPRISES
13
TABLE 2.4
Rural Firms’ Links with Buyers and Suppliers by Sector, Sri Lanka(percent)
Indicator Production Services Trade
Share of firms selling their output
To multinationals 1 0 1
To parent company or affiliatedsubsidiaries
2 0 0
To large domestic firms 0 1 0
Share of firms selling their output
Outside their grama niladhari 58 79 53
Outside their district 11 11 7
Outside their province 8 8 3
Share of firms selling undersubcontracting arrangements
8 9 8
Share of firms purchasing inputs undersubcontracting arrangements
10 N/A 15
N/A: Not available.
Source: Asian Development Bank and World Bank, Sri Lanka Investment Climate Survey, 2004.

demand for agricultural labor is low and rural household incomes decline, reducing the demand forgoods and services (figure 2.4).4
SRI LANKA: IMPROVING THE RURAL AND URBAN INVESTMENT CLIMATE
14
Source: Asian Development Bank and World Bank, Sri Lanka Investment Climate Survey, 2004
FIGURE 2.4
Strong Links between Agriculture and Rural Nonfarm Enterprises in Sri Lanka
Volume of sales of nonfarm enterprises anddemand for male labor in agriculture
1.01.21.41.61.82.02.22.42.62.83.0
Jan
Feb
Mar Apr
May Jun
Jul
Aug
Sep
Oct
Nov
Dec
Sal
es a
nd d
eman
d ra
nge
from
low
(1)
to h
igh
(3) Agriculture
Production
Services
Trade
Notes
1. In accordance with the sampling techniques for the Investment Climate Survey, urban firms are formalfirms located in urban areas, while rural firms are formal and informal firms located in rural areas. Thedesignations urban and rural are as defined by the Sri Lanka Department of Census and Statistics.
2. As would be expected, the majority of managers of urban manufacturing businesses (70 percent) andrural enterprises (77 percent) are Sinhalese. In urban manufacturing 7 percent of managers are Tamils, 11percent are Sri Lankan Moors, and the rest are from various ethnic groups, including Malay and Burgher.In rural firms 10 percent of managers are Sri Lankan Tamils, and 13 percent Indian Tamils.
3. The divisional secretary is the local administrative division below the district level. The grama niladhari isthe administrative division below the divisional secretary.
4. The maha season, the main growing season under rain-fed conditions for paddy (rice) and most otherannual crops, stretches from October through March. The yala season, the secondary growing season forpaddy, extends from April through September.

THE INVESTMENTCLIMATE AND ITS IMPACT
ON ENTERPRISEPERFORMANCE
3.1 Sri Lanka's Investment Climate: Strong on Governance, Weak onInfrastructure, and Finance
Entrepreneurs make business decisions depending on how they perceive the climate for investment.Examining firms' perceptions of the major business obstacles they face thus provides a solid basisfor understanding the investment climate in Sri Lanka. To aid in this exercise, urban and ruralenterprises were asked to rate the extent to which a range of factors in the investment climate affecttheir performance. Complementing the information on firms' perceptions are data on a wide rangeof objective measures making it possible to assess the burden that the perceived constraints imposeon firms' performance.
Significant differencesemerge among SriLankan enterprises intheir perceptions ofwhat favors and whathampers investmentand growth-dependingon the firms' size,activities, capabilities,and degree offormality. Firmsoperating in urban andrural areas often facevery differentchallenges (figure 3.1).Urban entrepreneursare more likely toperceive economicpolicy uncertainty,macroeconomicinstability, and laborregulations asimportant problems,
CHAPTER THREE
15
0 5 10 15 20 25 30 35 40 45
Electricity
Economic and Regulatory Policy Uncertainty
Macroeconomic Instability
Cost of Finance
Labor Regulations
Anticompetitive or informal practices
Skills and Education of Workers
Transport
Tax Rates
Corruption
Access to Finance
Telecommunication
Customs and Trade Regulations
Crime, theft, and disorder
Tax Administration
Access to land
Legal system or conflict resolution
Business Licensing and Operating Permits
Lack of market information
Low demand for goods and services
Percentage of firms citing constraint as major or severe
Urban
Rural
Source: Asian Development Bank and World Bank, Sri Lanka Investment Climate Survey, 2004.
FIGURE 3.1
Sri Lanka's Urban Manufacturing and Rural Enterprises FaceDifferent Constraints in the Investment Climate

while their rural counterparts generally find marketing issues to be more troublesome. Urban andrural firms alike, however, suffer from poor-quality infrastructure (especially electricity and transport)and costly and limited access to finance.
The clear success story in Sri Lanka is governance: few firms, urban or rural, perceive poorgovernance as a constraint to doing business. Sri Lankan policymakers have made big strides inreducing red tape, and they have improved the governance framework to the point where it no longerposes a significant obstacle to doing business. The one exception to this success story, of course, isthe continuing need to achieve peace and political stability.
3.2 Good Governance: Sri Lanka's Success StoryIn rankings of 199 countries on six recently developed composite indexes of governance, Sri Lankaoutperforms other countries in South Asia and countries with similar income levels on all countsexcept political stability (figure 3.2). On that measure Sri Lanka ranks in the 20th percentile, clearlybelow regional and income group averages. Although this ranking represents an improvement fromits ranking in the 7th percentile in 1998, political instability continues to impede investment andgrowth. Results from the Investment Climate Survey support these findings. They also highlight theconcerns of urban firms about policy uncertainty and point to possible problems relating to the costsof contract enforcement and the need to ensure that rural entrepreneurs have greater voice.
Policy Uncertainty and Macroeconomic Instability Still in Need of AttentionEntrepreneurs base their investment decisions on their expectations about policies and regulationsand how they are likely to be enforced, so greater certainty about these issues tends to mean greaterinvestment. In Sri Lanka, however, policy uncertainty as well as macroeconomic instability remainsserious concerns for urban firms. Economic and regulatory policy uncertainty ranks as the secondmost important constraint for urban firms (after electricity), cited by more than a third of them(though less than 5 percent of rural firms) as a major or severe obstacle. Macroeconomic instabilitywas cited as a major or severe constraint by 30 percent of urban firms.
Bureaucratic Obstacles toDoing Business Now at aMinimumIn many countries bureaucratic redtape can slow the creation andgrowth of formal sector businessesor drive them into the informaleconomy. Bureaucratic proceduresrequired to do business - such asregistering a new business orobtaining a business license - areoften seen as rent seekingopportunities by corrupt publicservants. As a result, suchprocedures can quickly mushroom,stifling even the mostentrepreneurial individuals. Initial
SRI LANKA: IMPROVING THE RURAL AND URBAN INVESTMENT CLIMATE
16
FIGURE 3.2
How Governance in Sri Lanka Measures UpIndex, 2002
Source: World Bank, 2004d.
Voice and accountability
Political stability
Governmenteffectiveness
Regulatory quality
Rule of law
Control ofcorruption
Sri Lanka
S.Asia Regional Average
Lower Middle Income
0
20
40
60
80
100

surveys of the business climate in South Asian countries, including Bhutan, India, Nepal, andPakistan, all point to heavy regulation and government unpredictability as a key constraint to privatesector performance. Sri Lankan businesses, however, do not appear to suffer from these problems.
Through a mix of culture, circumstance, and prudent policy, Sri Lanka has managed to reduce publicsector obstructionism to a minimum. As early as 1995 businesses pointed to progress in the country'sgovernance environment for the private sector, noting that "the degree of bureaucracy inherent inbusiness-government interaction in Sri Lanka has declined" (World Bank 1995b). In the interveningdecade Sri Lanka has made even more progress. Today it is not only easy to start a business (seechapter 2); it is also relatively easy to run a business once started. Less than 8 percent of all firmscited licensing and operating permits as a constraint to doing business. Less than 15 percentcomplained of being constrained by tax administration, crime, customs regulations, or corruption.
Contract Enforcement Still Too CostlyAssurances that contracts will be honored, disputes handled fairly and efficiently by the legal system,and rulings of the legal system enforced are important for attracting investment. Perceptions of thelegal system in Sri Lanka are fairly positive: more than half of rural nonfarm enterprises and urban
manufacturing firms reported thatthe legal system was not a majorconstraint. Enforcement ofcontracts still poses an obstacle tomany businesses, however. Whilethe number of procedures and thecosts involved in resolving acontract dispute in Sri Lanka arecomparable to those in OECDcountries, the process takes morethan twice as long (table 3.1).
Moreover, confidence in the ruleof law varies among
entrepreneurs. While slightly more than half of all rural entrepreneurs agreed that the legal systemwould uphold a contract in a business dispute, smaller enterprises and those in North EasternProvince were significantly more pessimistic (box 3.1).
Recognizing the need to strengthen the legal system, the government has initiated reforms of thelegal and regulatory framework to support private sector development. Comprehensive training isprovided for the judiciary and the legal community to enhance their knowledge of modern conceptsof commercial law. With the support of the Chamber of Commerce, a commercial mediation centerhas been set up to facilitate lower-cost dispute resolution in thebusiness community. In addition,modern, computerized systems willbe introduced in a group of courtscountrywide, to minimize delays inthe legal process and reduceassociated corruption and costs.
THE INVESTMENT CLIMATE AND ITS IMPACT ON ENTERPRISE PERFORMANCE
17
TABLE 3.1
Complexity of Contract Enforcement, Sri Lanka and Comparators
Indicator Sri Lanka South Asianaverage
OECDaverage
Number of procedures 17 21 18
Duration (days) 440 358 213
Cost (percentage of GNI per capita) 7.6 92.6 7.1
Procedural complexity indexa 59 55 49
a. The procedural complexity index ranges from 0 to 100, with higher values indicating greater complexity inenforcing a contract. The index is calculated by averaging subindexes for the other three indicators in the table.
Source: World Bank, Doing Business database (2004 indicators).
BOX 3.1
Rural Enterprises More Pessimistic about Formal Dispute Resolution
Few rural entrepreneurs in Sri Lanka rely on the courts to settle disputes. Of therural enterprises that reported having had a payment dispute (16 percent), lessthan 1 percent used a magistrate or district court to settle the dispute, while 20percent relied on the police. The vast majority turned to friends or family tomediate the dispute. Since court cases involve long delays that invariablyincrease the cost of dispute resolution, rural entrepreneurs prefer to avoid legalredress.

Corruption a Relatively Small ProblemMeasures of perceived corruption from Transparency International show that Sri Lanka has a muchsmaller problem of corruption than its South Asian neighbors, in keeping with its lower regulatoryburden (figure 3.3). Sri Lanka also outperforms Asian countries with higher per capita GDP, such asThailand. Investment Climate Surveys confirm these results. Among urban firms in Sri Lanka, morethan half reported that corruption was no problem, compared with 24 percent in China and 21percent in India. Among rural enterprises in Sri Lanka, 54 percent reported that corruption was nota problem.
While not significant,corruption nevertheless existsin Sri Lanka. Around 11 percentof rural enterprises that dealtwith government agencies forregistration, and 8 percent thatdealt with agencies forlicensing, reported makingunofficial payments. Thesepayments were equivalent to 5-6 percent of the officiallicensing or registration fee.Rural entrepreneurs alsoreported that laws andregulations are occasionallymisinterpreted or manipulatedby officials as a result of a lackof knowledge among officials or because of ethnic, social, or income biases.
A Need for Greater Voice among RuralEntrepreneursGovernments that want to promote an enterprise cultureneed to listen to the voices of entrepreneurs. In SriLanka the government could make a special effort tolisten to those in rural areas, who are less visible and lessvocal than their urban counterparts. Less than 10 percentof rural enterprises with more than three workers believethat they can influence the content of existing orproposed laws and regulations relating to their business,and only 2 percent that they can influence officials in thedrafting of laws and regulations. Less than half reportedknowing how and where to redress business problems,and only 19 percent have used this knowledge to do so.These results indicate that rural enterprises are not yeteffectively integrated into the policymaking process.They also suggest that government could do more tostrengthen mechanisms ensuring greater voice for ruralentrepreneurs.
SRI LANKA: IMPROVING THE RURAL AND URBAN INVESTMENT CLIMATE
18
Source: Transparency International.
FIGURE 3.3
Sri Lanka Fares Well in Comparison of CorruptionCorruption Perceptions Index, 2003
0 2 4 6 8Low
Finland
Chile
Malaysia
Mauritius
Sri Lanka
China
Thailand
India
Pakistan
Philippines
Vietnam
Bangladesh
High
Source: 1998 Household Survey
Northern
NorthCentral
EasternNorth
Western
Central
Uva
Southern
Western
Sabara -gamuwa
FIGURE 3.4
Accesses to Electricity Uneven in Sri Lanka(Percentage of households with electricity connection, 1998)

3.3 Infrastructure: The Weakest Part of the Investment ClimateElectricity supply is viewed by many urban and rural entrepreneurs as the most serious impedimentto investment and growth-because of poor access, high cost, and unreliability. Transport also posesan important obstacle, particularly for rural enterprises. Water supply though ranked lower as aconstraint, nevertheless featured in complaints by both urban and rural enterprises.Telecommunications appears to pose the fewest problems.
Electricity the Most Serious Obstacle to Doing Business
More than 40 percent of urban manufacturing firms and nearly 25 percent of rural enterprises citedelectricity as a major problem. Access to electricity is heavily concentrated in urbanized areas such asWestern Province, where coverage exceeds 80 percent, leaving rural areas such as Uva Provincegrossly underserved, with coverage of less than 40 percent (figure 3.4). Less than 70 percent of ruralenterprises use electricity from the national grid.
Where electricity is available, the cost is highand supply unreliable, exposing firms tofrequent outages and raising theirproduction costs. To cope with outages,nearly 75 percent of urban manufacturingfirms own a generator (figure 3.5). Forthese firms a generator costs the equivalentof 12 percent of their fixed assets onaverage-absorbing resources that couldotherwise be invested productively in theircore business. Small firms rely less ongenerators, probably because they representa higher relative cost for these firms.
Why does electricity supply represent such an important bottleneck to growth in Sri Lanka? Thecurrent structure of the power industry has not been conducive to improvements in supplystandards. The industry comprises the main vertically integrated, state-owned power company, theCeylon Electricity Board (CEB), and the smaller, Colombo-based distribution company, the Lanka
Electricity Company (LECO).Although low-cost hydro sourcesproduce more than 70 percent ofSri Lanka's electricity, repeateddroughts and rapidly growingdemand met by expensiveemergency power generation haveled to some of the highestcommercial power tariffs in theregion (figure 3.6). Sri Lankanbusinesses pay more for electricitythan their competitors in East Asiaand significantly more than U.S.businesses.
THE INVESTMENT CLIMATE AND ITS IMPACT ON ENTERPRISE PERFORMANCE
19
FIGURE 3.5
Sri Lanka's Urban Manufacturers Rely Heavily on Generators
Source: Investment Climate Survey, World Bank(India 2001, Malaysia 2002, the Philippines 2003, Sri Lanka 2004)
0 20 40 60 80
Malaysia
Philippines
India
Sri Lanka
FIGURE 3.6
Sri Lankan Businesses Pay a High Price for Electricity
Source: International Energy Association and World Energy Council
0
0.01
0.02
0.03
0.04
0.05
0.06
0.07
0.08
0.09
0.1
Indonesia India Thailand Sri Lanka PakistanUnitedStates
Electricity Tariffs (US$ per Kwh), 2002

Despite charging high prices to industries and businesses to cross-subsidize residential customers, theCEB was still able to recover only about 78 percent of its costs in fiscal 2002, leaving a huge shortfallto be covered by taxpayers. Selling electricity below the cost of supply provides a strong disincentivefor the CEB to expand access to the grid or offer off-grid services for villages. Moreover, delays inimplementing the plan for expanding least-cost generation capacity, and reliance on ad hoc purchasesof emergency power, have resulted in the rapidly growing demand outstripping supply. Indeed, SriLanka has far less generating capacity percapita than most of its regional competitors(figure 3.7). This situation can be attributedin part to environmental concerns andinterest groups working against powerprojects in certain locations. In response tothe supply shortages, the governmentinstituted eight-hour rolling blackoutsacross the country in 2001-02, driving manybusinesses to purchase their own generators.
With electricity demand continuing to growrapidly, at more than 8 percent a year, stepsneed to be taken to establish large-scalepower generation plants for base load, toaddress both capacity shortages and thehigh cost of electricity.
Road Network in Need of Upgrading to Facilitate Business GrowthTo be effective, entrepreneurs need a quick and easy way to get their goods to market. In Sri Lanka,however, transport problems appear to be a bottleneck for both urban and rural businesses. In ruralareas more than 46 percent of respondents claimed that transport is an obstacle to doing business.Among those identifying transport as a business constraint, road quality was considered the biggestproblem (cited by 36 percent),followed by access to roads (33percent) and lack of availabletransport (32 percent). Notsurprisingly, rural entrepreneursin the former NorthernProvince have the worstperceptions of road quality,closely followed by those inUva Province, where access toroads is also a key obstacle(figure 3.8).
Among urban manufacturingenterprises, 20 percentindicated that transport was amajor or severe constraint.These urban entrepreneurscomplained strongly about
SRI LANKA: IMPROVING THE RURAL AND URBAN INVESTMENT CLIMATE
20
FIGURE 3.7
Sri Lanka Lags in ElectricityGenerating Capacity (kW/per capita)
Source: U.S. Energy Information Agency
0.7
0
0.1
0.2
0.3
0.4
0.5
0.6
Bangla
desh
Sri Lan
ka
Indon
esia
India
Pakist
an
Philipp
ines
China
Thail
and
Malays
ia
Source: Asian Development Bank and World Bank, Sri Lanka Investment Climate Survey, 2004.
FIGURE 3.8
Roads a Big Constraint to Sri Lankan BusinessesPercentage of firms citing road access and quality as a major or severe constraint by province
Road Access Road Quality

traffic congestion and absenteeism due to the unavailability of transport, blaming such constraintsfor low productivity.
That access to roads should represent a limiting factor for business development seems surprising atfirst glance: cross-country comparisons of road density show that Sri Lanka has a large road networkrelative to both its population and its land area. The problem is that Sri Lanka's roads are in terriblecondition. The country lacks sufficient resources to sustain such a dense network, and spending onmaintenance and rehabilitation covers only a small fraction of needs.
The poor quality of the road network imposes big costs on businesses and individuals. AlthoughBentota lies only 65 kilometers down the coast from Colombo, covering that distance can often takethree hours or more. Slow travel speeds are a big factor in the waste of agricultural produce, 40percent of which spoils before it reaches market. Road safety is also a big concern. Sri Lanka has thehighest road accident fatality rate in Asia, and it is estimated that as many people have died in roadtraffic accidents since 1983 as perished in the country's civil war.
Expanding access to roads and improving their quality would support commerce in all sectors,including tourism, garments, agribusiness, and agricultural trade and exports. These measures wouldalso support the country's decentralization initiative and the development of economic activitiesoutside Western Province (Kumarage 1998).
Access to Water a Constraint Especially in the NortheastAccess to safe and adequate water remains a problem for many Sri Lankans, particularly in rural areas.Only 70 percent of the rural population has access to an improved water source, compared with 98percent of the urban population. While enterprises did not identify water as a major constraint todoing business, nearly a third of firms in both rural and urban areas nevertheless had complaintsabout their water supply. Problems appear to be particularly acute in North Eastern Province, wheremore than half of all enterprises reported difficulties with their water supply.
Complaints about water problems are most common among those without their own supply. Mostfirms do have their own supply, however: 70 percent of urban firms and nearly 60 percent of ruralenterprises have their own well or share one, while only 27 percent of urban firms and 21 percent ofrural enterprises reported using water from the National Water Supply Development Board or theirpradeshiya sabha (local government). In rural areas almost 40 percent of those without a wellreported problems, compared with only 12 percent of those with a well. A similar story emerged inurban areas, where 65 percent of businesses using the national water supply reported experiencingsome shortages.
In urban areas greater private participation in the water sector is being encouraged to ensure universalaccess to piped water supply. That should reduce the problems experienced by businesses. In ruralareas responsibility for providing water supply and sanitation has been passed to the pradeshiyasabhas. However, lack of autonomy in human resources and financial decisions, and the centralgovernment's continued involvement in "devolved" responsibilities, have until recently underminedthe local governments' performance in many areas, including water supply. Moreover, competitionfor water among domestic, agricultural, industrial, and commercial users is increasing, particularly inthe dry zones. Failure to address this issue by improving irrigation efficiency is likely to result ingrowing problems.
THE INVESTMENT CLIMATE AND ITS IMPACT ON ENTERPRISE PERFORMANCE
21

In Telecommunications, Privatization a Big Spur
In stark contrast with roads andelectricity, telecommunicationsappears to pose no seriousobstacles to Sri Lankanentrepreneurs. Only 15 percentof urban manufacturing firmsand 8 percent of ruralenterprises cited it as a major orsevere constraint. Urban andrural enterprises in the south(Uva, Sabaragamuwa, andSouthern Provinces) were morelikely than firms elsewhere toreport problems withtelecommunications.Interestingly, relatively few ruralenterprises in North EasternProvince identifiedtelecommunications as a problem, despite low connection rates. The reason may be thattelecommunications is less important for their businesses-since rural enterprises in this area aresignificantly less likely to engage in trading or services-and thus not perceived as a problem.
Consistent with the survey results on telecommunications, Sri Lanka fares well in a comparison withcompetitor countries: its combined fixed and mobile teledensity (telephones per 100 people) exceedsthat of countries in South Asia and even fast-growing Vietnam (figure 3.9). The main reason is thatSri Lanka began reforming the sector well before its neighbors. The reforms started in 1980 with theseparation of posts and telecommunications service provision, with successive reforms leading togreater private participation, competition, and investment. Since privatization in 1996 teledensity in
the fixed line sector hasmore than tripled,while in the mobilesector, always subjectto private competition,it has increased fromless than 0.1 to morethan 5 (figure 3.10).
Telecommunicationsremains one of thefastest-growing sectorsin Sri Lanka.Nevertheless, someproblems remain.While Sri Lankaoutperforms other
South Asian countries and Vietnam in teledensity, its service standards compare poorly with those inother East Asian countries, pointing to great scope for improvement. The average wait for phone
SRI LANKA: IMPROVING THE RURAL AND URBAN INVESTMENT CLIMATE
22
FIGURE 3.9
Teledensity Relatively High in Sri LankaTelephones per 100 people, 2002
Source: International Telecommunication Union data.
19
3843
4 55
4
19
23
0
10
20
30
40
50
60
70
India Viet Nam Sri Lanka
16
17
ChinaPhilippines
11
Thailand Malaysia Chile
Cellular
Fixed line
5 521
FIGURE 3.10
Privatization Spurs Big Growth in Teledensity in Sri LankaTelephones per 100 people
Source: International Telecommunication Union data.
0
1
2
3
4
5
6
1984 1986 1988 199419921990 1996 1998
Preprivatization Postprivatization
1982 2000 2002
0.24 0.40
0.54
0 0 0 0 0 0 0
1.2
2.25
0.880.78
1.6
3.48
2.08
0.83
5
Cellular
Fixed line
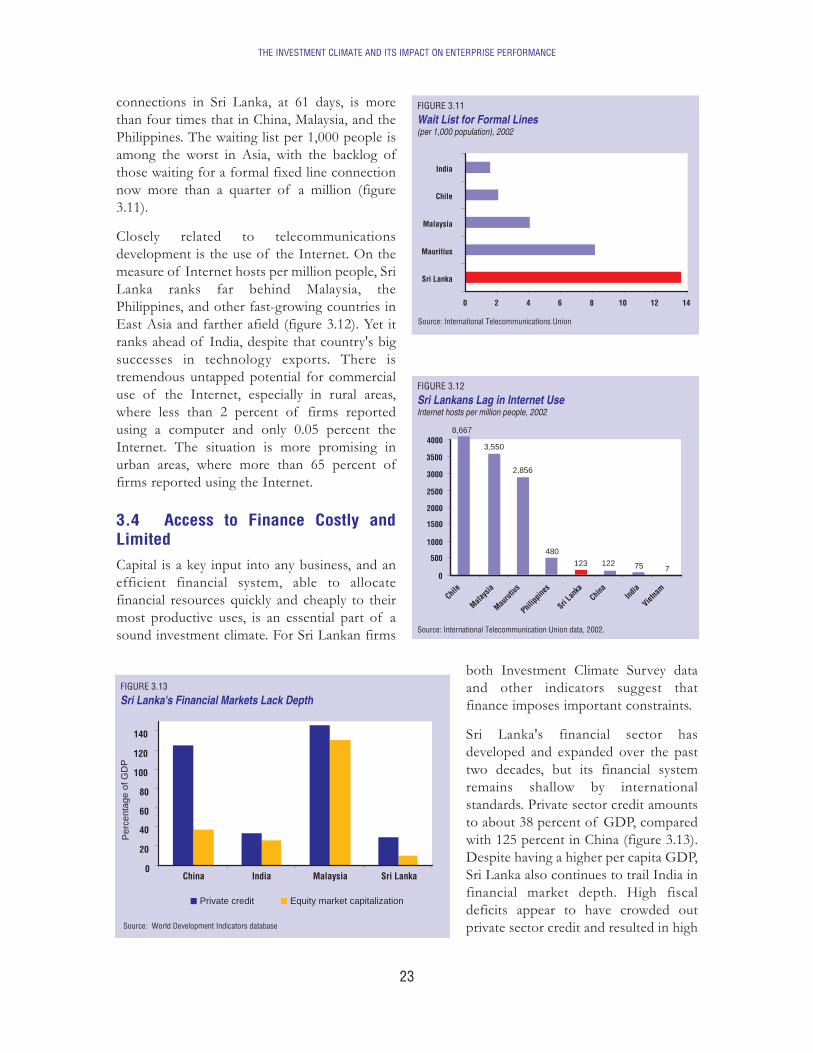
connections in Sri Lanka, at 61 days, is morethan four times that in China, Malaysia, and thePhilippines. The waiting list per 1,000 people isamong the worst in Asia, with the backlog ofthose waiting for a formal fixed line connectionnow more than a quarter of a million (figure3.11).
Closely related to telecommunicationsdevelopment is the use of the Internet. On themeasure of Internet hosts per million people, SriLanka ranks far behind Malaysia, thePhilippines, and other fast-growing countries inEast Asia and farther afield (figure 3.12). Yet itranks ahead of India, despite that country's bigsuccesses in technology exports. There istremendous untapped potential for commercialuse of the Internet, especially in rural areas,where less than 2 percent of firms reportedusing a computer and only 0.05 percent theInternet. The situation is more promising inurban areas, where more than 65 percent offirms reported using the Internet.
3.4 Access to Finance Costly andLimitedCapital is a key input into any business, and anefficient financial system, able to allocatefinancial resources quickly and cheaply to theirmost productive uses, is an essential part of asound investment climate. For Sri Lankan firms
both Investment Climate Survey dataand other indicators suggest thatfinance imposes important constraints.
Sri Lanka's financial sector hasdeveloped and expanded over the pasttwo decades, but its financial systemremains shallow by internationalstandards. Private sector credit amountsto about 38 percent of GDP, comparedwith 125 percent in China (figure 3.13).Despite having a higher per capita GDP,Sri Lanka also continues to trail India infinancial market depth. High fiscaldeficits appear to have crowded outprivate sector credit and resulted in high
THE INVESTMENT CLIMATE AND ITS IMPACT ON ENTERPRISE PERFORMANCE
23
FIGURE 3.11
Wait List for Formal Lines(per 1,000 population), 2002
Source: International Telecommunications Union
0 2 4 6 8 10 12 14
Sri Lanka
Mauritius
Malaysia
Chile
India
FIGURE 3.12
Sri Lankans Lag in Internet UseInternet hosts per million people, 2002
Source: International Telecommunication Union data, 2002.
Chile
4000
500
1000
1500
2000
2500
3000
0
Malays
ia
Maurut
ius
Philipp
ines
Sri Lan
kaChin
aInd
ia
Vietna
m
3500
8,667
775122123
480
2,856
3,550
FIGURE 3.13
Sri Lanka's Financial Markets Lack Depth
Source: World Development Indicators database
Private credit Equity market capitalization
0
20
40
60
80
100
120
140
China India Malaysia Sri Lanka
Per
cent
age
of G
DP

interest rates, though real rates have declined in recent years (figure 3.14). Capitalization of equitymarkets in Sri Lanka is modest at 15 percent of GDP, compared with about 40 percent in China and30 percent in India.
The commercial banking sector is still dominated by the two state banks, the Bank of Ceylon and thePeople’s Bank, accounting for around 45 percent of assets, although this represents an importantdecline compared to the early 1980s. The significant level of non-performing loans and inefficienciesof state banks contributes to high intermediation costs. This in turn results in high cost of fundingfor the banking sector as a whole as the more efficient private banks are able to operate with similarlending rates while enjoying high profits. As discussed below, our survey confirms that the cost offinance is a key obstacle for both urban and rural firms. Besides the commercial banks, there are anumber of development banks including in the rural areas. There has also been a rapid growth ofsmaller and semi-formal financial institutions that cater the underserved and rural population, interalia cooperatives rural banks, thrift and credit cooperative societies, Samurdhi Banks (sponsored bythe state), national micro-finance institutions.
Cost of Finance a Key Obstacle for Both Urban and Rural Firms
Urban manufacturing firmsidentified the cost of finance as thefourth biggest constraint toexpanding or operating theirbusiness. In the rural sector justover half of enterprises citedfinance as a constraint. Within thisgroup 60 percent identified highinterest rates on loans, and nearly 50percent tedious loan procedures, asa major or severe constraint.
In the urban sector small firms haveto pay more than large firms foraccess to finance. While small firmspaid an average 18 percent intereston loans (roughly 12 percent in realterms) in 2003, the average for allurban manufacturing firms was 14 percent. Developing new lending techniques for small enterprisesmight help reduce some of the costs of lending to them and thus lower the interest rates they pay.In addition, expanding the Credit Information Bureau to incorporate positive information andsmaller firms could go a long way toward reducing information asymmetries and thus lowering therisk premia applied to small borrowers.
Rural enterprises enjoy lower average interest rates (14.5 percent) than small firms in the urbanmanufacturing sector, due to subsidies from some state financial institutions and microfinanceinstitutions. (These subsidies, however, also put the sustainability of some of these institutions atrisk.) Because of such distortions in the rural sector, interest rates are widely dispersed, withnongovernmental organizations (NGOs) charging an average of 6 percent and moneylenders a highof 21 percent.
SRI LANKA: IMPROVING THE RURAL AND URBAN INVESTMENT CLIMATE
24
FIGURE 3.14
Sri Lanka's High Fiscal Deficits Mean High Real Interest Rates
Source: World Bank, World Development Indicators database.
Real interest rate (percent)
-10
-5
0
5
10
15
1990 1992 1994 1996 1998 2000 2002

Firm Size an Important Determinant of Financing SourcesFor urban manufacturing firms retained earnings and equity represent the most important source ofworking capital (44 percent), followed by bank lending (23 percent) and trade finance (9 percent;figure 3.15). Bank lending becomes more restricted for new investment (dropping to 15 percent). Asis expected, use of bank lending also declines markedly with enterprise size. Interestingly, small firmsreveal greater demand for leasing services, which could reflect greater constraints on their access tolong-term finance from banks.
Access to Formal Finance Far More Constrained for Rural FirmsFor rural firms private commercial banks play a very limited role: less than 12 percent apply to theseinstitutions for loans, while 41 percent apply to state commercial banks and Samurdhi banks. Thesmaller an enterprise, the less likely it is to obtain finance from private commercial banks. Tradefinance appears to be an important source ofworking capital, with nearly 31 percent of ruralenterprises purchasing goods on credit.Moneylenders provide a relatively small share offinance, with rural enterprises using suchfinancing primarily for liquidity management.While financing from moneylenders can beapproved quickly, it is expensive. Better financialplanning and access to other financing sourcesfor liquidity management would reduce theoverall financing costs for rural enterprises.
Access to formal finance is especially restrictedfor investment purposes (figure 3.16). Internalresources (cash in hand) provide the biggestshare of investment finance for rural enterprises(43 percent), while family and friends are the
THE INVESTMENT CLIMATE AND ITS IMPACT ON ENTERPRISE PERFORMANCE
25
FIGURE 3.15
Retained Earnings and Equity the Main Source of Finance for Urban Manufacturing Firms in Sri Lanka
Note: Small enterprises have fewer than 50 workers, medium-size enterprises 50-100, and large enterprises more than 100. Source: Asian Development Bank and World Bank, Sri Lanka Investment Climate Survey, 2004.
0
10
20
30
40
50
60
Reta
ined
Earn
ings
& e
quity
Bank
loan
s
Leas
ing
Trad
e fin
ance
Info
rmal
& fa
mily
sou
rces
Othe
r
SmallMedium sizeLarge
Sources of working capital by firms size (%)
0
10
20
30
40
50
60
Reta
ined
Earn
ings
& e
quity
Bank
loan
s
Leas
ing
Trad
e fin
ance
Info
rmal
& fa
mily
sou
rces
Othe
r
SmallMedium sizeLarge
Sources of new investments by firms size (%)
Source: Asian Development Bank and World Bank,Sri Lanka Investment Climate Survey, 2004.
FIGURE 3.16
Sri Lanka's Rural Enterprises Finance Most Investmentfrom Internal Resources
State banks 6%
Samurdhi 6%
Moneylenders 3%
Internalresources
43%
Private banks 2%Rural banks 3%
Sanasa 2%
Family andfriends35%

main external source (35 percent). Public financial institutions and NGOs, despite a widespreadpresence in rural areas, provide a very modest share.
Collateral Often Critical to the Availability of FinanceWhen needing to offer collateral, urban manufacturing firms turned primarily to land and buildings,followed by machinery. Land is even more important as collateral for rural enterprises. Almost aquarter of loans to rural enterprises required collateral, and land was offered in 75 percent of thesetransactions. When land was provided as collateral, it represented 60 percent of the loan amount.
When loan applications from rural enterprises were rejected (the outcome in only 5 percent of cases),lack of collateral was by far the most important reason. Thus access to land and land administrationpolicy can affect the use of formal finance (box 3.2). Indeed, the probability of a firm applying fora loan from a public or private commercial bank is associated with the amount of land the firm holdsunder formal title.
SRI LANKA: IMPROVING THE RURAL AND URBAN INVESTMENT CLIMATE
26
BOX 3.2
Many obstacles to Using Land as Collateral in Sri Lanka
Evidence from around the world shows that secure property rights, particularly secure title to land, promote investment in agricultureand rural enterprises. Secure title allows the use of land as collateral, improving access to credit and permitting greater investment incredit-constrained situations. In Sri Lanka lack of secure title is only one of the difficulties rural entrepreneurs face in using their landas collateral. A big problem is that the state owns most of the land. Even land that has been transferred to private farmers remainssubject to restrictions on such uses as sale, leasing, mortgaging, and inheritance-and thus on its use as collateral. Data collected fromrural households by the Investment Climate Survey indicate that 23 percent of those that own land have no title deed to their land (seetable). Among households with a written deed to all the land they own, nearly half reported being unable to sell any of that land.
Beyond the restrictions on the use of land, a poorly functioning land administration system has also hampered land markets, leading toland transactions that often involve significant cash and opportunity costs for the parties (see figure). Most private land records take theform of deed registrations that record transactions and serve as evidence for proving title to land. The deed registrations do a poor jobof identifying the owner of a piece of land, however, and that, combined with pervasive co-ownership of land, increases transactioncosts in the land and credit markets. Every time a parcel of land is sold, transferred, or used as collateral, an extensive search must beconducted of all past deeds associated with the land parcel-going back as far as 30 years-to confirm ownership rights. The records,often held by private surveyors, may not be easily accessible. Moreover, the deeds may not match the actual boundaries, so disputesare common. Poor landholders may be unable to afford dispute resolution, and disputes that do go to courts usually take more than 10years to settle.
The problems are not limited to rural areas. In urban areas too unclear landownership records restrict the use of land as collateral, andalso lead to the underutilization of land and to illegal and irregular settlements.
The government of Sri Lanka recently initiated a shift to a land title registration system offering prospects for greater efficiency in landmarkets if properly implemented. In the meantime, however, the unclear landownership records and other problems continue to hamperthe ability of landowners to freely transfer their land to its most productive use.
Source: World Bank, Doing Business database (2004 indicators).
0102030405060708090
Thail
and
China
Vietna
mInd
iaChil
e
Sri Lan
ka
Philipp
ines
0246810121416
Time (Days)
Procedures(Number)
Cost as % ofpropertyvalue
Ease of registering property inSri Lanka and comparator countries
Proportion of rural households that own any land(includes residential plots)
Type of Land Titled Untitled
Land exclusively owned by household 58 13
Land owned by extended family andoperated Under plot or operator rotation
2.7 1.7
Land Development Ordinance land 17 4.6
Communal & other land 2 10
Any type of land 77 23
Note: Includes residential plots.
Source: Asian Development Bank and World Bank, Sri Lanka Investment ClimateSurvey, 2004.

3.5 Growing Regional Differences across the Country
Sharp regional differences exist across Sri Lanka, and evidence shows that these differences arewidening. Western Province, with by far the best investment climate, has captured a growing share ofnational income. At the other end of the spectrum are the northeast, which has suffereddisproportionately from the conflict, and the south, which suffers disproportionately from poverty.If not addressed rapidly and effectively, the growing regional differences are likely to have serioussocial and economic consequences.
The West and the RestWestern Province has the best access to infrastructureand services, and it outperforms the national average onalmost all social and economic indicators (table 3.2). Ithas twice the road density of any other province, 79percent of its enterprises are connected to the electricitygrid (compared to 60 percent in the North EasternProvince), and it is home to the capital city, Colombo,which is also a major port and the largest domesticmarket. Plotting an accessibility index, which indicatespotential market integration, shows that regionaleconomic differences in Sri Lanka can be characterizedas "the west and the rest" (figure 3.17). All this isreflected in a poverty rate in Western Province (11percent) that is half the national average.
Moreover, the differences between the west and the restare only growing. As better economic conditions andopportunities attract more and more businesses toWestern Province, a cycle develops that tends to furtherconcentrate wealth and development in that province.Indeed, Western Province increased its share of GDPfrom 40 percent in 1990 to more than 47 percent in2001. The corollary, of course, is that the GDP share ofalmost every other province is slipping, sharpeningregional differences.
The Northeast: An Investment Climate Constrained by ConflictSri Lanka's civil conflict did tremendous damage to the country as a whole, but with most of thefighting isolated in North Eastern Province, that area suffered the most. The investment climateproved inhospitable to all but the most dedicated entrepreneurs. Once the A9 and A6 highways wereclosed, North Eastern Province was effectively cut off from the rest of the country.
The profile of rural businesses in North Eastern Province reflects the conditions of conflict. Thesebusinesses are almost twice as likely as those elsewhere to be household-based production enterprises:such enterprises account for 60 percent of rural firms in North Eastern Province, compared with only36 percent in the rest of the country. This preference for household-based enterprises suggests thatentrepreneurs were unwilling to invest in alternative premises for their businesses that might bedestroyed in the fighting or that might have to be evacuated. Rural enterprises in North Eastern
THE INVESTMENT CLIMATE AND ITS IMPACT ON ENTERPRISE PERFORMANCE
27
FIGURE 3.17
Potential Market Integration Is Greatest inSri Lanka's Western Province
AccessibilityIndex
Note: The accessibility index is calculated for every point as the sum of the population totals of surrounding cities and towns, inversely weighted by the road network travel time to each town. The index is a measure of potential market integration reflecting the quality and density of local transportation infrastructure. The analysis includes 185 cities and towns, shown in red.
Source: Asian Development Bank and World Bank, Sri Lanka Investment Climate Survey, 2004.

Province also tend to be much smaller than their counterparts elsewhere-with only 12 percent havingmore than two employees-indicating that most were established as part of household coping strategiesand have been unable to grow in the difficult circumstances.
Infrastructure services in North Eastern Province are dilapidated, as the rural enterprise survey resultsindicate: 75 percent of firms in the province cited public infrastructure as a constraint, compared with60 percent in the rest of the country. Businesses in North Eastern Province also complained more aboutpostal services, access to water, access to transport, and roadblocks. Surprisingly, only 17 percent offirms in the province considered finance to be an issue, compared with 60 percent in the rest of thecountry. In stark contrast with firms elsewhere, however, those in North Eastern Province thatcomplained about finance are constrained by lack of availability of loan sources, not the cost of finance.
Because of the region's isolation, enterprises in North Eastern Province deal far less with government,but the wartime situation has imposed a tremendous security burden on them. Some 50 percent of thegrama niladharis surveyed in the former Northern Province and 20 percent in the former EasternProvince reported civil unrest or war occurring in their community within the previous five years. Some20 percent of firms in North Eastern Province incurred losses as a result of crime and violence in theprevious year, compared with just 1-2 percent in the rest of the country. Almost half the firms in theprovince are forced to make security payments, and 40 percent to make protection payments to remainin business, compared with only 1 percent in the rest of the country. Small firms bear adisproportionate burden of the cost, though they pay smaller absolute amounts. The median securityand protection payments amounted to 10 percent of sales for the smallest enterprises but only 5percent for enterprises with more than two employees. A conclusion to the peace process and someyears of stability could reverse many of these adverse effects on the investment climate.
The South: Poverty and Poor Service DeliveryDistricts in the south-including Badulla and Monaragala in Uva Province, Ratnapura and Kegalle inSabaragamuwa Province, and Hambantota in Southern Province-have the highest poverty rates in Sri
SRI LANKA: IMPROVING THE RURAL AND URBAN INVESTMENT CLIMATE
28
TABLE 3.2Access to Infrastructure and Incidence of Poverty by Province, Sri Lanka(percent, except where otherwise indicated)
Indicator Western Central Southern NorthWestern
NorthCentral
Uva Sabara-gamuwa
NorthEastern
All provinces
Share of enterprises usingelectricity
79 80 68 61 62 62 76 60 69
Share of enterprises with aland line or mobile phone
24 7 18 15 8 23 15 10 15
Average distance tonearest market (km)
5 5 13 6 7 11 18 5 8
Share of enterprises in acommunity with a bank
70 47 62 70 75 78 70 68 67
Distance to nearest bank ifnot in community (km)
3 3 2 2 8 5 4 - 3
Average distance tonearest city (kilometers)
5 10 3 6 8 15 4 9 7
Poverty rate, 2002 11 25 28 27 21 37 34 - 23
- Not available.
Source: For infrastructure indicators, Asian Development Bank and World Bank, Sri Lanka Investment Climate Survey, 2004; for poverty incidence, World Bank staff estimates.

Lanka (excluding North Eastern Province, where poverty data are not yet available). In addition, inmany of these districts poor connectivity and infrastructure pose a serious challenge for enterprises.
Enterprises in Uva Province, with its hilly terrain, low rainfall, long dry spells, and poor internal roadnetwork, face particularly formidable challenges. The province's road density (1 kilometer per squarekilometer of land) is less than half that in the rest of the south, and connectivity to the power gridis the lowest in Sri Lanka outside North Eastern Province. Uva Province also stands out for its smallmanufacturing base in rural areas: half its rural enterprises are engaged in trading and another thirdin services, activities requiring fewer fixed assets than production. Given the lower incomes in Uva,it is unsurprising that households turn to small service and trading businesses to smooth theirincomes during the slack agricultural periods.
The poor service delivery in the south is not a result of outright neglect. Indeed, the government ofSri Lanka has provided significant resources for implementing a large number of developmentprograms in the region's poor districts. Many public expenditure programs have been ineffective,however, and resources have not been put to their best use. Recognizing these challenges, thegovernment, with World Bank support, recently began a community development and livelihoodimprovement project focusing on Uva and Southern Provinces. The project uses a community-drivenapproach to improve the efficiency and cost-effectiveness of service delivery in the poorest districts.If successfully implemented, such initiatives provide encouraging prospects for improving theregion's investment climate and reducing poverty.
3.6 How the Investment Climate Affects Firms' PerformanceBusiness obstacles impose a productivity cost on firms. They also discourage the start-up of newenterprises. An empirical analysis of the effect of different investment climate indicators on firms'performance confirms that the constraints discussed in this chapter affect both their productivity andtheir investment. The analysis also highlights differences between the rural and urban investmentclimates. While rural firms have suffered from poor access to markets, urban manufacturing firmshave benefited from international integration. (For a detailed description of the methodologicalapproaches used for the rural and urban analyses, see appendixes 4 and 5.)
What Affects the Performance of Rural Enterprises?As is to be expected, the characteristics of rural enterprises are significant determinants of productivity.Such characteristics as the experience of managers, the capital intensity of the firm (as measured by itsfixed assets), and the type of firm have clear effects on both labor productivity (value added per worker)and total factor productivity. Trading enterprises have significantly higher labor productivity thanproduction enterprises, but the two groups show no difference in total factor productivity. Similarly,stand-alone enterprises have significantly higher labor productivity than household-based enterprises,but there is no significant difference in total factor productivity. These results are largely consistent,since production enterprises utilize more fixed assets than traders, and stand-alone enterprises morefixed assets than household-based enterprises. Enterprises with more experienced and educatedmanagers tend to have both higher labor productivity and higher total factor productivity.
Not surprisingly, the investment climate also matters. Having access to and using electricity from thegrid is associated with a total factor productivity 25 percent higher than that of firms not connected tothe grid, all other things equal. Having greater access to informal sources of capital and being locatedin communities with more efficient financial sectors (as measured by the time taken to clear a check)are also associated with better performance. Not surprisingly, poor access to roads and limited and
THE INVESTMENT CLIMATE AND ITS IMPACT ON ENTERPRISE PERFORMANCE
29

high-cost transport facilities are associated with both lower labor productivity and lower total factorproductivity.
How firms are affected depends on the nature of their business. For example, while lack of access toelectricity reduces the probability of a production enterprise making a new investment, it has nosignificant impact on investment by trading and service enterprises. Similarly, inadequate marketinformation reduces the probability of new investments by trade and production enterprises, yet has nosignificant effect on investments in the service sector.
The Investment Climate and Rural Enterprise Start-Up
The investment climate not only affects the performance of existing enterprises; it also has a significanteffect on whether rural households set up new enterprises. Households are less likely to establish anenterprise in communities where access to formal sources of finance is limited (as measured by thedistance from a community to a bank) and where registration processes are cumbersome (as measuredby the days taken to register an enterprise). Households with a large pool of labor and with prior familyexperience in operating a nonfarm enterprise (as reflected by whether the parents of the head ofhousehold operated a nonfarm business) are more likely to establish a nonfarm enterprise.
Access to infrastructure plays a big part in determining the start-up of new businesses. Location in acommunity where electricity is perceived as the most important constraint reduces the probability of ahousehold setting up a new enterprise by 18 percent. Access to roads, the quality of roads, and the costof finance are also significant factors. Location in a community with a larger share of paddy land,however, tends to reduce the probability of a household starting up a nonfarm enterprise. This findingis consistent with the hypothesis that heavy regulation designed to protect paddy production impedesthe development of nonfarm businesses.
The Investment Climate and the Performance of Urban Manufacturing Enterprises
Urban manufacturing enterprises perceive infrastructure, finance, and labor as among the mostimportant constraints in the investment climate-and regression analysis of the effects of theseconstraints on firms confirms these perceptions. Analysis also confirms that urban manufacturing firmshave gained from international integration.
Access to electricity and reliability of supply (as measured by whether or not a firm owns or shares agenerator) are associated with higher productivity. The state of transport infrastructure (as measured byvarious indicators) also affects performance. For example, poor transport infrastructure (as reflected inreported breakage, theft, and spoilage during shipment) is associated with both significantly lower salesgrowth and lower employment growth.
In finance the ability to secure a loan appears to be one of the most pressing issues, and whether a firmcan offer acceptable collateral has an important bearing on this. Survey results show that greaterproductivity does not translate into easier access to bank loans. Banks appear to be unable todiscriminate between loan applicants on the basis of performance. Instead, they rely more on the valueof collateral when considering a loan application, consistent with the finance literature on informationasymmetries. Since almost all loan applicants are required to provide collateral in the form of fixedassets, the probability of obtaining a loan is skewed toward large firms and those with foreigninvestment, with clear implications for the ability of other firms to invest and grow..
The probability of a firm identifying labor regulations as a major or severe constraint has a significant
SRI LANKA: IMPROVING THE RURAL AND URBAN INVESTMENT CLIMATE
30

positive association with the presence of unions and excess labor. That suggests that legal restrictionson firing or laying off workers contribute importantly to firms' difficulties with labor regulations. Oneway firms cope with such restrictions is to hire temporary workers-but this has costs: survey resultsshow that the larger the share of temporary workers in a firm's total employment, the lower the firm'sproductivity. So to the extent that firms respond to unionization and restrictions on layoffs by hiringtemporary workers, labor regulations can be said to have an adverse effect on productivity.
International integration has greatly benefited urban manufacturing firms, as survey results confirm. Firmswith foreign ownership or foreign suppliers are more productive than other firms. Similarly, exporting firmsshow significantly faster sales and investment growth-and the longer they have been exporting, the highertheir productivity, offering support for the "learning by exporting" hypothesis. In addition, internationalintegration facilitates the acquisition of technology in Sri Lanka-through the purchase of new machineryand equipment and the hiring of key personnel, considered to be the two most important sources oftechnological innovation by more than half the enterprises in the sample. In these firms imported newcapital goods have a strong positive effect on productivity. Firms with foreign professionals in theirworkforce also perform better, even if the firms do not have foreign direct investment.
THE INVESTMENT CLIMATE AND ITS IMPACT ON ENTERPRISE PERFORMANCE
31
Notes
1. For some constraints, such as land and transport, the urban questionnaire had only one question, while therural survey included multiple questions. To allow comparison, responses to these questions in the ruralsurvey were aggregated across categories. For example, rural transport encompasses responses to questionson access to roads, road quality, availability of transport, and roadblocks.
2. The six indexes measure perceptions about:• Voice and accountability-the extent to which citizens of a country are able to participate in the selection
of governments. This index also includes measures of the independence of the media.• Political stability and absence of violence-the likelihood that the government in power will be
destabilized or overthrown by possibly unconstitutional or violent means, including domestic violenceand terrorism.
• Government effectiveness-the quality of public service provision, the quality of the bureaucracy, thecompetence of civil servants, the independence of the civil service from political pressures, and thecredibility of the government's commitment to policies.
• Regulatory quality-the incidence of market-unfriendly policies such as price controls or inadequate banksupervision, as well as perceptions of the burdens imposed by excessive regulation in such areas asforeign trade and business development.
• Rule of law-the incidence of crime, the effectiveness and predictability of the judiciary, and theenforceability of contracts.
• Control of corruption-the extent of corruption, conventionally defined as the exercise of public powerfor private gain.
3. Among the 25 percent of rural enterprises agreeing that laws and regulations can be misinterpreted ormanipulated by officials, close to a third reported that such outcomes are due primarily to lack of knowledgeamong officials, around 40 percent that the primary reason is ethnic or gender bias, and 30 percent that it isbias based on income status (knowing that the poor may be less informed about regulations and theirenforcement). Enterprises in North Eastern Province agreeing that laws and regulations can bemisinterpreted by officials were significantly more likely to attribute this mainly to lack of knowledge amongofficials (70 percent gave this response in North Eastern Province, compared with 26 percent elsewhere).
4. Those not using electricity from the grid reported that they did not need electricity (39 percent), that electricitywas unavailable (45 percent), or that they used a generator (8 percent) or relied on other sources such as solarpower. Some 90 percent of firms connected to the grid reported experiencing power surges or outages.
5. On average, 13 percent of electricity used by urban manufacturing firms comes from their own generators.

INTERNATIONALCOMPETITIVENESS:CHALLENGES ANDOPPORTUNITIES
Sri Lanka has opened its economy over the past 25 years, transforming its export base from mostlyprimary commodities to mainly manufactured goods and spurring economic growth. As surveyresults confirm, international integration also has benefited Sri Lankan firms. Yet the country'sexport base, heavily concentrated ingarments, is vulnerable to thechanging external economicenvironment. Moreover, exportgrowth has decelerated since themid-1990s. Sustaining rapid exportgrowth and unlocking the potentialof foreign direct investment-bothcritical to the country's economicprospects-depend most importantlyon achieving political stability.Other factors in the country'sinvestment climate also affect itsability to compete internationally.Chief among these are the poorquality of infrastructure and issuesin the labor market.
4.1 Unlocking thePotential of Foreign DirectInvestmentSri Lanka's open trade regime iscomplemented by fairly liberalpolicies on foreign directinvestment. Yet while the country'strade liberalization policies havedone much to expand trade, itsforeign investment policies havebeen less successful. Relative toGDP, flows of foreign direct
CHAPTER FOUR
32
FIGURE 4.1
Foreign Direct Investment Flows to Sri Lanka Remain at a Low Level
Source: World Bank, World Development Indicators database.
Net FDI to Sri Lanka and ComparatorCountries, (as percent of GDP) 2003
0
2
4
6
8
India
Malays
ia
Sri L
anka
Phili
ppine
s
Thail
and
China
Vietn
amCh
ile
BOX 4.1
Key Factors in Foreign Direct Investment Decisions
A. T. Kearney’s FDI Confidence Index for 2003 ranked factors influencingdecisions on foreign direct investment as follows:
• Market size. • Market growth and potential.
• Production and labor costs. • Access to export markets.
• Presence of competitors. • Availability of mergers and acquisitions.
• Financial and economic stability. • Political and social stability.
• Tax regime. • Infrastructure.
• Transparency. • Highly educated workforce.
Produced annually since 1998, the index is based on a survey of chief executiveand financial officers and other top decisionmakers at the world's largest 1,000firms about their assessment of different investment destinations.
Source: A. T. Kearney, Global Business Policy Council.

investment to Sri Lanka trail behind those to other fast-growing Asian economies. In China,Thailand, and Vietnam annual investment inflows have reached or surpassed 3 percent of GDP(figure 4.1). By contrast, in Sri Lanka inflows averaged 1.3 percent of GDP in 1990-2002. Thedifference matters. Foreign direct investment could foster the growth of new industries and exportsas it did in the early development of the garment sector. Moreover, survey results confirm thatforeign-owned firms are more productive than locally owned ones.
Sri Lanka's policies to attract foreign direct investment have included offering generous fiscalincentives and establishing the Board of Investment (BOI) as the institutional center for promotinginvestment and facilitating each stage of the investment process. Domestic firms in certain exportsectors can also benefit from BOI incentives. The BOI regime, however, has failed to isolate firmsfrom some of the most severe constraints in the country's investment climate. Just like other firms,those benefiting from the BOI regime suffer from uncertain labor regulations and severe deficienciesin infrastructure (box 4.2). In addition, survey results show that while being under the BOI umbrellaleads to significantly higher new investment, it has no similar effect on productivity.
Although the foreign direct investment regime has emphasized fiscal incentives, the relatively modestinvestment inflows to Sri Lanka indicate that these are not the biggest factor motivating foreigninvestment. When looking for a new facility, global corporations examine a much broader set offactors that will affect the productivity and growth of their operations (box 4.1) Compared withother developing countries, Sri Lanka fares well on many of these indicators, such as a skilled laborforce. It performs poorly on many others, however, including political stability, economic certainty,quality of infrastructure, and predictability of labor regulations.
INTERNATIONAL COMPETITIVENESS: CHALLENGES AND OPPORTUNITIES
33
BOX 4.2
Sri Lanka's Board of Investment
Part of the package of policies to promote foreign direct investment and export-led growth, the Board of Investment (BOI) wasestablished in 1977 as the main center for facilitating foreign investment. The BOI operates as an autonomous statutory body directlyresponsible to the president of Sri Lanka, and its board of directors includes representatives from both the public and the private sector.
In 2003 the total realized investment in industries under the BOIumbrella amounted to 1.7 percent of GDP with 1,766 units inoperation. These enterprises contributed 2 percent of GDP andprovided 431,050 jobs-about 6 percent of total employment in 2003.More than two-thirds of BOI companies established in the past 25years have had foreign investment. Most of those registered with theBOI are in the garment sector, but since the expansion of fiscalincentives in the early 1990s there has been important growth inother activities, such as footwear, jewelry, ceramics, and plasticproducts.
Charged with providing advice and assistance at each stage of theinvestment process, the BOI arranges support for infrastructureservices (water, power, telecommunications, and waste treatment),assists with site selection and clearance, and facilitates clearance ofimports and exports. Results of the Investment Climate Surveyconfirm that the BOI has been effective in speeding customsclearance: import clearance times for BOI firms in the garmentsector (around two days) are half those for non-BOI firms.Nevertheless, BOI firms face many of the investment climateconstraints afflicting other manufacturing firms, particularly the poorquality of infrastructure services. They experience similar powerproblems (see figure). And just as in the group of non-BOI firms,about a quarter of BOI firms register transport failures. For theseBOI firms losses from transport failures average nearly 7 percent ofsales, a slightly larger share than for other manufacturing firms.
Sri Lanka's BOI Firms Not Isolated fromInfrastructure Problems
Source: Asian Development Bank and World Bank, Investment Climate Surveys(China, 2002; Malaysia, 2002; Sri Lanka, 2004).
0
10
20
30
40
50
60
70
80
90
100
ChinaMalaysia Sri LankaBOI firms
Sri Lankaothers
Percentage of urban manufacturing firms with ownor shared generator

4.2 Restoring StabilitySri Lanka remains among the world's most unstable countries, though it has made great strides sincereaching a cease-fire in 2001 (figure 4.2). The civil war fought between 1983 and 2001 has not beenthe only source of instability, however; in the past four years Sri Lanka has had three differentgovernments.
While achieving a peace settlement will probably create the biggest gains in North Eastern Province,it will also benefit the overall economy through greater ability to attract foreign direct investment andlower insurance costs for enterprises. After rapid growth following the liberalization of the late1970s, foreign investment tapered off during the 1980s as security became a major concern forpotential investors. Large electronic multinationals that had been considering Sri Lanka in the early1980s (such as Sony and Sanyo) transferred their investment plans to countries in East Asia. Theincome forgone because of the loss of foreign direct investment appears to have been the greatesteconomic cost of the conflict. Estimates of the direct and indirect costs of the civil conflict in 1984-96 amount to 168 percent of 1996 GDP, with nearly half due to forgone foreign direct investment(table 4.1). Tourist arrivals also tapered off after the initial boom of the late 1970s (see the sectionon tourism in this chapter).
Beyond achieving a permanent peace, restoring stability will also require improving continuity andreducing uncertainty in economic policy. The frequent changes in government have disrupted
SRI LANKA: IMPROVING THE RURAL AND URBAN INVESTMENT CLIMATE
34
AFGH
ANIS
TAN
NEPA
L PAKI
STAN
INDI
A BANG
LADE
SH
PHIL
IPPI
NES
CHIN
A MAL
AYSI
ATH
AILA
ND MAU
RITI
USCH
ILE
SING
APOR
E
SRI L
ANKA
-3
-2
-1
0
1
2
3
Nor
mal
ized
Pol
itica
l Ins
tabi
lity
and
Vio
lenc
e In
dex HIGH
LOW
3
FIGURE 4.2
Sri Lanka Scores Low on Political Stability
Source: Kaufmann, Kraay, and Mastruzzi, 2003.Note: The blue dots represent estimates for 2002. The thin vertical lines represent standard errors around these estimates for each country in a worldwide sample (186 countries). The indicator presented here reflects the statistical compilation of responses on the quality of governance given by a large number of enterprises, citizens, and expert survey respondents in industrial and developing countries, as reported by institutes, think tanks, nongovernmental organizations, and international organizations. The aggregate indicators in no way reflect the official position of the World Bank, its Executive Directors, or the countries they represent. Relative positions on the indicator are subject to margins of error, and precise country rankings should not be inferred from the data.

policymaking and slowed economic reforms. Not surprisingly, economic and regulatory policyuncertainty ranks as the second most important constraint for urban manufacturing firms. Suchperceptions also hold among foreign investors: when political uncertainties resurfaced in late 2003,foreign investors considering Sri Lanka as a location put their plans on hold.
4.3 Easing Difficult Labor Market ConditionsSri Lanka's labor force is well educated compared with those in other lower-middle-income countries.Yet the demand for technical, managerial, and computer skills still outpaces supply. Of greaterconcern for enterprises, however, are the country's labor regulations. Inflexible and arbitrary, theseregulations create uncertainty about the costs of hiring and firing workers, discouraging investment.
Costly Labor RegulationsIn 2003 the Sri Lankan government took some early steps to increase flexibility in the labor market,though the effects have yet to become apparent. The task may be a large one. The country has 48labor laws (though only 10-15 are observed), most of which date to the closed economy of the 1970s,with little done to update them since. The laws govern only the formal sector, which accounts foraround 1 million of Sri Lanka's 6.5 million workers. Labor regulations are restrictive, hinderingsmooth business operation, especially by leading to high and uncertain costs of retrenchment.
Labor regulations in Sri Lanka also mandate more holidays and leave than in almost any othercountry in the world. National holidays include every full moon and eight other festivals. In addition,formal sector firms are required to allow workers 21 days' leave and around 21 days' sick leave a year.Labor unrest leads to the loss of an additional 2.5 days a year, and absenteeism to another 3.5 days.The survey shows that absenteeism is particularly acute in the textile sector, averaging 5.7 days a year.
Perhaps the most restrictive labor regulation is the Termination of Employment of Workers Act of1971 (TEWA). Under TEWA, in firms with more than 15 staff, employees who have served morethan six months become permanent-and therefore almost impossible to fire or lay off. In many casesfirms seeking permission to lay off workers protected by TEWA have been ordered by the laborcommissioner to pay the workers extremely high compensation.
Of most concern to employers is the discretionary and opaque administrative process for obtainingauthorization to lay off workers. The government may refuse authorization, creating uncertainty
INTERNATIONAL COMPETITIVENESS: CHALLENGES AND OPPORTUNITIES
35
TABLE 4.1
Economic Costs of the Civil Conflict, Sri Lanka, 1984-96 (percentage of 1996 GDP)
Direct costs Indirect costs
Military expenditure by government 41.3 Forgone public investment 8.6
Military expenditure by Liberation Tigers ofTamil Eelam
4.1 Reduced tourist arrivals 17.0
Relief services 3.0 Reduced foreign direct investment 71.2
Lost infrastructure 13.5 Population displacement 5.5
Lost human capital of dead and injured 2.5
Output forgone in former Northern Province 1.3
Total 61.9 Total 106.1
Source: Arunatilake, Jayasuriya, and Kelegama 2001.

about the ability to lay off workers that imposes additional costs on firms. Adding to the uncertaintyis the length of procedures: many cases drag on for years while employers must explain their financialperformance and business plans to justify the layoff (World Bank 2004c). Sri Lanka fares poorly in acomparison with its main competitors in Asia: its labor regulations offer no certainty to investors,and payments mandated for redundancy can be many times those typical in international practice(table 4.2).
Contrary to public opinion, TEWA does not protect the poor, since they work mainly in the informalsector and as casual laborers in agriculture or on plantations. Indeed, TEWA provides benefits onlyto the relatively small, well-educated minority in the formal labor force-benefits paid for by the restof the labor force through lower wages and fewer employment opportunities. Aware of the high costof retrenching workers, firms are reluctant to hire more, preferring instead to rely on overtime andcontract labor. Workers who are hired are paid a salary that takes into account the high costs ofretrenchment. Sri Lanka's workers are paid much less than workers at the same skill level in otherparts of South Asia, despite the country's relatively high per capita GDP.
Analysis of survey results for urban manufacturing firms confirms that labor institutions andregulations may benefit those who already have jobs but do not help create additional employment.With industry and education of the workforce controlled for, unionized firms tend to pay more. Butunionization and the presence of excess labor both have a negative association with growth ofemployment. Survey results show the presence of excess labor, with urban manufacturing firmsreporting being overstaffed by 11 percent on average.
Unionization and the presence of excess labor do not lead directly to lower productivity. But as notedin chapter 3, to the extent that firms respond to unionization and restrictions on layoffs by hiringtemporary workers, labor regulations do have an adverse effect on productivity-since the larger theshare of temporary workers in a firm's total employment, the lower its productivity. Indeed, urbanmanufacturing firms employ a significant share of their workforce through short-term contracts. Thesurvey shows that the median number of temporary workers in urban manufacturing firms was about15, compared with 90 permanent workers. More than half the temporary workers were skilled, andmore than three-quarters were from rural areas.
SRI LANKA: IMPROVING THE RURAL AND URBAN INVESTMENT CLIMATE
36
TABLE 4.2
Regulations on Labor Redundancy, Sri Lanka and Comparator Countries
Country Administrative authorization required Statutory redundancy payment per year of service
Sri Lanka Yes, if firm has more than 15 employees Not fixed; case by casea
India Yes, if firm has more than 100 employees. Notapplicable to managerial and administrativeemployees
15 days
Pakistan Yes, if closing down or retrenching more than 50% ofworkers
20 days
Malaysia No 10-20 days
Thailand No Around 30 days; capped at 180 days
Vietnam No 2 weeks
a. The government introduced a formula in December 2003. (Judged by international standards, the formula imposes generous compensation, particularly for young workers andworkers with short service.)
Source: International Labour Organization 2000.

The high costs of Sri Lanka's labor regulations underline the importance of moving forward withtheir reform-to encourage foreign direct investment, foster the efficient reallocation of labor, andpromote employment in the formal sector.
Insufficient Training and Shortages of Highly Skilled LaborTraining can help alleviate skill shortages, increase labor productivity, and make it easier to adapt orintroduce new technologies. In Sri Lanka the survey shows that urban manufacturing firms invest toolittle in training. Less than 40 percent avail themselves of formal training-that is, beyond on-the-jobtraining (figure 4.3). Although SriLanka outperforms India on thismeasure, it trails far behind suchcompetitors as China.
The survey also shows that the typeof training matters: externaltraining increases a firm'sproductivity, while formal in-housetraining does not. Only 26 percentof Sri Lankan firms benefit fromexternal training. Contrary toexpectations, firms did not cite highlabor turnover as an importantreason for not extending formaltraining to workers.
Large enterprises and those basedin Colombo are much more likelythan others to offer formal, externaltraining. For managers private andpublic institutes are the primarysources of external training, whilefor skilled workers institutes andindustry associations are the mainsources. Firms that use outsidetraining rated private institutes asmore effective than public institutesor industry associations.
Education levels also matter. Firmswhose manager holds a tertiary orprofessional degree tend to be moreproductive. Interestingly, amanager's prior experience inexporting firms also raises productivity. On average, about 35 percent of the staff of urbanmanufacturing firms have 6-13 years of schooling (figure 4.4).
Sri Lanka will need a better supply of educated workers as it seeks to move up the technologicalladder and diversify into new economic sectors. Indeed, the country already suffers from a shortage
INTERNATIONAL COMPETITIVENESS: CHALLENGES AND OPPORTUNITIES
37
FIGURE 4.3
Too Few of Sri Lanka's Urban Manufacturing Firms Offer Formal Training
Source: Asian Development Bank and World Bank, Investment Climate Surveys(India, 2001; China, 2002; Sri Lanka, 2004).
Per
cent
age
of u
rban
man
ufac
turin
gfir
ms
offe
ring
form
al tr
aini
ng
0
10
20
30
40
50
60
70
80
China IndiaSri Lanka
FIGURE 4.4
Sri Lanka's Urban Manufacturing Firms Employ Many withRelatively High Education
Source: Asian Development Bank and World Bank, Sri Lanka Investment Climate Survey, 2004.
0
5
10
15
20
25
30
35
40
Less than6 years
6-9years
10-13years
more than13 years
Em
ploy
ees
by y
ears
of
educ
atio
n (p
erce
nt)

of highly skilled workers, particularly in its nascent software industry (see the section on that industryin this chapter). One important factor in this shortage has been brain drain. A ranking by the WorldEconomic Forum shows that Sri Lanka has among the highest levels of brain drain in a set ofcomparator countries (figure 4.5).
Use of TechnologySri Lankan manufacturing firms consider acquiring imported machinery the most important meansfor upgrading technology, followed by hiring key personnel. Firms tend to invest little in research anddevelopment (R&D)-0.11 percent of sales on average. That decision appears to be a rational onebecause most urban manufacturing businesses are labor intensive and because, as the survey shows,R&D investments have no significant impact on a firm's productivity. Levels of R&D investment areclose to those observed in similar industries in such developing countries as China and India.Technology use in Sri Lanka, as measured by the share of firms using email and computers, is alsoclose to that in China (figure 4.6).
4.4 Increasing the Efficiency of Ports and Customs to Facilitate TradeBroadly speaking, Sri Lanka's ports and customs are more efficient than those of some of itscompetitors. In a World Economic Forum survey of port quality, Sri Lanka's ports outperformedthose of China, India, and the Philippines, though they ranked below those of Malaysia and Thailand(figure 4.7). The relatively high efficiency of Sri Lanka's ports is due in part to reforms thatintroduced competition in the Colombo port in the mid-1990s by allowing the private sector to buildand operate a new terminal, the South Asia Gateway Terminal.
SRI LANKA: IMPROVING THE RURAL AND URBAN INVESTMENT CLIMATE
38
Source: World Economic Forum, 2003
FIGURE 4.5
Sri Lanka Suffers from Substantial Brain Drain-and Shortages of Scientists and Engineers (2003)
3
32
39
59
63
65
66
68
72
65
43
3
86
12
37
62
51
87
0 10 20 30 40 50 60 70 80 90 100
India
Vietnam
Chile
Sri Lanka
Thailand
Malaysia
Mauritius
China
Philippines
Availability of scientists and engineers Brain drain
High Low

The rankings of port quality arebroadly consistent with theresults of Investment ClimateSurveys, which show thatclearing imports through portsand customs takes less time inSri Lanka (4 days on average)than in China (7), India (10),and the Philippines (10),though more time than inMalaysia (3; figure 4.8). Bycontrast, clearing exportsthrough ports and customstakes longer in Sri Lanka thanin China, India, and thePhilippines. This relatively poorperformance is due largely to delays in the food and beverage sector; when this sector is excluded,the average time to clear exports drops to around 2 days, close to the speed achieved in Malaysia.
Even so, there is scope for improving efficiency in ports and customs-and greater gains are importantfor facilitating trade, especially for the garment sector, which depends heavily on imported textiles.Port tariffs remain high, resulting in burdensome shipping costs, and moves per hour could besignificantly increased (Sri Lankan ports average 25 moves per hour, compared with 100 inSingapore). One important measure for increasing competition and efficiency is to restructure the SriLanka Ports Authority along the landlord port model, sharpening the distinction between the
INTERNATIONAL COMPETITIVENESS: CHALLENGES AND OPPORTUNITIES
39
FIGURE 4.6
Technology Use by Sri Lankan Firms Almost as High as for Chinese FirmsPercentage of urban manufacturing firms using technology
Source: Asian Development Bank and World Bank, Investment Climate Surveys (China, 2002; Sri Lanka, 2004).
0
10
20
30
40
50
60
70
80
Email Computers
China Sri Lanka
Source: World Economic Forum, 2003
High Low
7
69
54
36
71
48
34
83
21
0 5 10 15 20 25 30 35 40 45 50 55 60 65 70 75 80 85 90
Malaysia
India
China
Thailand
Vietnam
Sri Lanka
Chile
Philippines
Mauritius
FIGURE 4.7
Sri Lanka Ranks Higher Than Some Competitors on the Quality of Ports

management of ports and theoperation of terminals.1
Another is to improve customsoperations, which remainoutdated despite reforms in the1990s. The government is nowgiving serious consideration toestablishing an independentrevenue administration agencythat would increase efficiency,transparency, andaccountability.2 Moving to suchan agency would enablecustoms to play a stronger rolein facilitating trade. Alsoimportant is to reviseregulations causing delays in theexport of food and beverages.
4.5 Performance and Challenges of Key Export SectorsThe imminent end of the Multifibre Arrangement makes it vital for Sri Lanka to maintain thecompetitiveness of its ready-made garment sector and encourage greater diversification of its exportbase. The development of new manufacturing exports holds promise. So does the services sector,especially tourism, as long as a permanent peace is achieved and other investment climate conditionsimprove. The software development industry, though still at a nascent stage, could bring sizableeconomic gains. All these sectors both offer strengths and face challenges.
Growing Challenges for the Garment SectorThe development of the garment sector is among Sri Lanka's biggest economic success stories. Thetextile sector in Sri Lanka has a long history, though its focus has been primarily domestic. Thegarment sector remained undeveloped until the mid- to late 1970s, when foreign direct investmentplayed a vital part in its emergence andgrowth. The wave of liberalization in SriLanka in the late 1970s coincided withthe search by successful garmentmanufacturers from such countries asthe Republic of Korea for unutilizedquotas that could be used for exports tothe United States and Europe. Sri Lankaoffered not only unused quotas but alsoother advantages, such as low wages anda relatively educated labor force. Thegarment industry took off.
By the late 1980s ready-made garmentshad overtaken tea as the country's mostimportant export, and today they make
SRI LANKA: IMPROVING THE RURAL AND URBAN INVESTMENT CLIMATE
40
FIGURE 4.8
Sri Lanka Fast to Clear Imports, Slower on ExportsAverage number of days to clear goods through ports and customs
Source: Asian Development Bank and World Bank, Investment Climate Surveys(China, 2002; India, 2001; Malaysia, 2002; the Philippines, 2003; Sri Lanka, 2004).
Imports Exports
0
2
4
6
8
10
12
China
India
Malays
ia
Philipp
ines
Sri Lan
ka
FIGURE 4.9
Sri Lankan Garment Exports Take Off
Source: Authors' calculations based on data from Central Bank of Sri Lanka,Annual Report, various years.
0
100000
200000
300000
1990 1995 2000 2003Ann
ual e
xpor
ts (
mill
ions
of
Sri
Lank
an r
upee
s)
Garments TeaOther industrial Other agriculturalOther gem
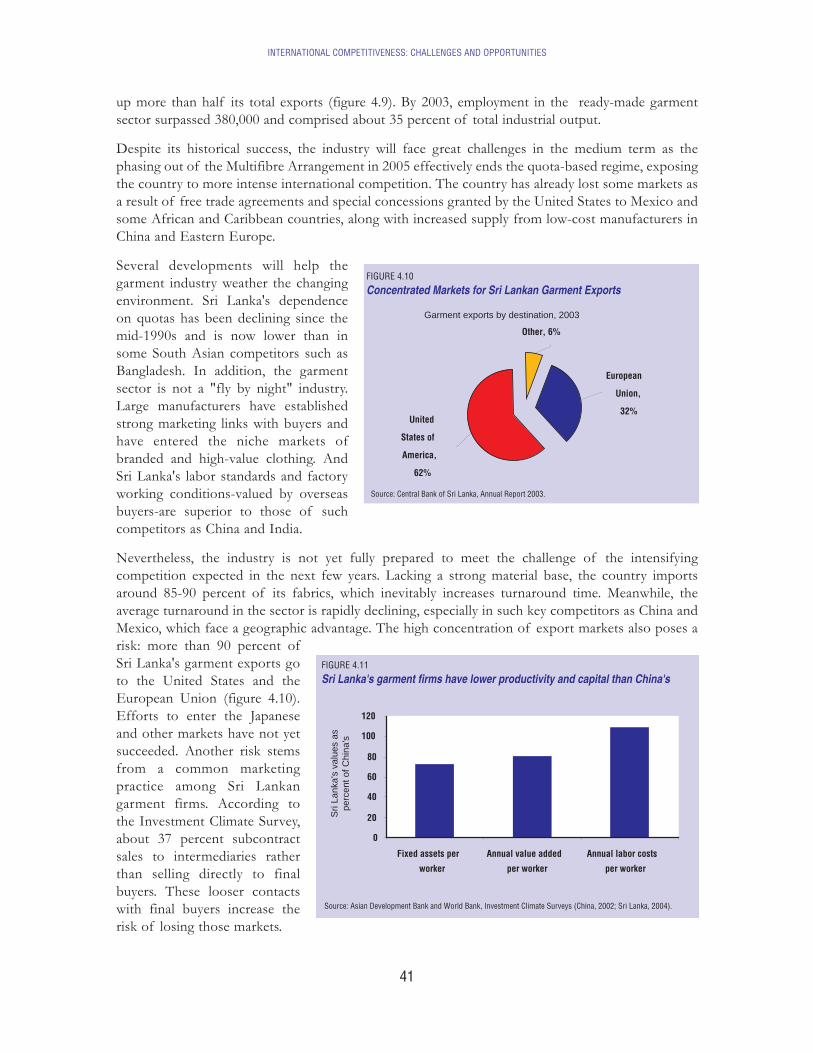
up more than half its total exports (figure 4.9). By 2003, employment in the ready-made garmentsector surpassed 380,000 and comprised about 35 percent of total industrial output.
Despite its historical success, the industry will face great challenges in the medium term as thephasing out of the Multifibre Arrangement in 2005 effectively ends the quota-based regime, exposingthe country to more intense international competition. The country has already lost some markets asa result of free trade agreements and special concessions granted by the United States to Mexico andsome African and Caribbean countries, along with increased supply from low-cost manufacturers inChina and Eastern Europe.
Several developments will help thegarment industry weather the changingenvironment. Sri Lanka's dependenceon quotas has been declining since themid-1990s and is now lower than insome South Asian competitors such asBangladesh. In addition, the garmentsector is not a "fly by night" industry.Large manufacturers have establishedstrong marketing links with buyers andhave entered the niche markets ofbranded and high-value clothing. AndSri Lanka's labor standards and factoryworking conditions-valued by overseasbuyers-are superior to those of suchcompetitors as China and India.
Nevertheless, the industry is not yet fully prepared to meet the challenge of the intensifyingcompetition expected in the next few years. Lacking a strong material base, the country importsaround 85-90 percent of its fabrics, which inevitably increases turnaround time. Meanwhile, theaverage turnaround in the sector is rapidly declining, especially in such key competitors as China andMexico, which face a geographic advantage. The high concentration of export markets also poses arisk: more than 90 percent ofSri Lanka's garment exports goto the United States and theEuropean Union (figure 4.10).Efforts to enter the Japaneseand other markets have not yetsucceeded. Another risk stemsfrom a common marketingpractice among Sri Lankangarment firms. According tothe Investment Climate Survey,about 37 percent subcontractsales to intermediaries ratherthan selling directly to finalbuyers. These looser contactswith final buyers increase therisk of losing those markets.
INTERNATIONAL COMPETITIVENESS: CHALLENGES AND OPPORTUNITIES
41
Garment exports by destination, 2003
Source: Central Bank of Sri Lanka, Annual Report 2003.
FIGURE 4.10
Concentrated Markets for Sri Lankan Garment Exports
United
States of
America,
62%
European
Union,
32%
Other, 6%
FIGURE 4.11
Sri Lanka's garment firms have lower productivity and capital than China's
Source: Asian Development Bank and World Bank, Investment Climate Surveys (China, 2002; Sri Lanka, 2004).
0
20
40
60
80
100
120
Fixed assets per
worker
Annual value added
per worker
Annual labor costs
per worker
Sri
Lank
a's
valu
es a
spe
rcen
t of C
hina
's

How competitive are Sri Lankan garment firms today? A comparison with Chinese garment firmsshows that Sri Lankan firms have lower value added per worker-about 28 percent lower (figure 4.11).Part of the reason is that their Chinese competitors operate with much higher levels of capital.Despite the gap in value added per worker, average wages are similar. When management is excluded,however, workers in China's garment sector receive higher wages than garment workers in Sri Lanka,consistent with their higher value added.
Other investment climate indicators also seem to favor Chinese garment firms (table 4.3). The morecostly and less reliable power supply in Sri Lanka ties up firms' scarce capital in expensive powergenerators. Sri Lankan garment firms hold much higher inventories than their Chinese counterparts,reflecting the greater efficiency of Chinese firms and the need of Sri Lankan firms to import mostof their fabric.3 Sri Lankan firms benefit from a skilled labor force, but Chinese firms invest morein formal training for their workers. Sri Lankan firms face tighter labor regulations, hampering theirability to adapt to changing external circumstances. All this suggests that reducing obstacles in theinvestment climate could help Sri Lankan garment firms compete more effectively in the post-quotaenvironment.
Tourism: A Promising SectorSri Lanka's tourism industry-acasualty of the civil conflict-could become a principalbeneficiary of a sustainedpeace. After facing promisingprospects in the 1970s, withyearly growth in tourist arrivalssurpassing 20 percent, tourismcollapsed with the onset of thecivil conflict (figure 4.12). Thesector contracted by 55 percentin 1983-89 before starting torecover in the early 1990s. By2000 tourist arrivals hadreturned to the level of 1980.
SRI LANKA: IMPROVING THE RURAL AND URBAN INVESTMENT CLIMATE
42
FIGURE 4.12
Growth in Sri Lanka's Tourism Constrained by War
Source: Central Bank of Sri Lanka, Annual Report, various years.
0
50
100
150
200
250
300
350
400
450
500
1970
1972
1974
1976
1978
1980
1982
1984
1986
1988
1990
1992
1994
1996
1998
2000
2002
Tou
rist a
rriv
als
(tho
usan
ds)
Growth in
peacetimes
Growth constrained by war
Growth in
peacetimes
Growth constrained by war
Growth inpeacetimes
Growth constrained by war
TABLE 4.3
Selected Indicators of the Investment Climate for the Garment Sector, Sri Lanka and China(percent, except where otherwise indicated)
Indicator Sri Lanka China
Share of firms owning or sharing a generator 76 27
Median days of inventory (median) 30 10
Share of firms suffering losses due to transport problems 33 41
Losses due to delays in deliveries (percentage of sales)a 7.7 6.7
Share of managers with high school education or more 50 67
Share of firms subcontracting sales to clients 37 22
Average time to clear exports (days) 2.3 6.8
a. Average for firms suffering losses.
Source: Asian Development Bank and World Bank, Investment Climate Surveys (China, 2002; Sri Lanka, 2004).

In that year, however, arrivals fell to about 400,000 after the country was put on a "war footing," andthey dropped by another 16 percent after the attack on the country's international airport in July2001. After a year of peace, arrivals rebounded in 2002. Tourism continued to grow strongly in 2003,with arrivals reaching nearly half a million. The effect on employment has already been significant.Tourism employs nearly 90,000 people directly or indirectly, making it one of the country's largestemployers.
While tourism was struggling tosurvive in Sri Lanka, the sectorexpanded rapidly inneighboring destinations. Todaytourism accounts for less than 5percent of export revenue in SriLanka, while it contributesnearly 10 percent in Thailandand 25 percent in Mauritius(figure 4.13). And while SriLanka drew about half a milliontourist arrivals in 2003, Malaysiahad reached 10 million in 2000and Thailand the same numberin 2001-even though all threecountries had started from a similar base in the 1970s. Moreover, because of the security risk in SriLanka, the country has failed to attract the higher-end tourism market. With budget tourists makingup a greater share of its visitors, Sri Lanka can count on about 25 percent less in earnings per touristthan Mauritius (figure 4.14). The survey confirms that the sector does not yet cater to up-marketvisitors. Among the hotels and other accommodations that are rated (slightly more than half), about46 percent had two or three stars, and about 42 percent four stars or more.
With the prospect of a peace settlement, however, Sri Lanka's tourism sector is showing signs ofrestructuring. It is changing itsfocus and diversifying itsofferings-to include ecotourismand adventure holidays, forexample-to attract more up-market customers. It is alsotargeting new countries (figure4.15). Arrivals from India haveincreased significantly in recentyears following the removal ofvisa restrictions. The sector isalso actively marketing in Chinaand Pakistan.
Yet despite the recovery afterthe cease-fire and the country'srange of attractions, Sri Lankantourism continues to faceimportant constraints on its
INTERNATIONAL COMPETITIVENESS: CHALLENGES AND OPPORTUNITIES
43
FIGURE 4.13
Tourism Contributes Little to Sri Lanka's Export Revenue
Source: World Bank staff estimates.
0
5
10
15
20
25
Sri Lan
kaInd
ia
Philipp
ines
China
Thail
and
Maurit
ius
International tourism receipts asa percentage of total export revenue, 2001
FIGURE 4.14
Sri Lanka Earns Less Per Tourist Than CompetitorsEarnings per tourist (U.S. dollars), 2002
Source: World Tourism Organization data.
0.0
100.0
200.0
300.0
400.0
500.0
600.0
700.0
800.0
900.0
Mauritius MaldivesThailand Sri Lanka

ability to compete with otherdestinations in the region. Many ofthese constraints are shared with urbanmanufacturing firms, includingeconomic policy uncertainty,macroeconomic instability, and the poorquality of infrastructure (table 4.4).4
Economic policy uncertainty representsan important obstacle for both sectors,ranking as the biggest constraint for thehotel industry and the second biggestfor manufacturing. By contrast,corruption and regulatory obstaclesappear to be more importantconstraints for tourism. Indeed, about20 percent of hotels complained ofhaving to make informal payments forfood and beverage licenses. Amongregulatory requirements, the most time consuming appears to be obtaining or renewing such licenses.
Deficiencies in infrastructure pose serious problems for the sector, as survey results confirm. Hotelfirms cited electricity as their sixth biggest constraint-and surpass even manufacturing firms inownership of generators. About 90 percent of hotels own a generator, and the hotel industry derivesas much as 16 percent of its electricity from this source. By contrast, only about half of touroperators own a generator. For these firms a bigger concern is internal transport, especially roads-vital for getting tourists to their destinations. If the country intends to start catering to a moreaffluent tourism market, it will need to develop other modes of transport, such as small airportsoutside Colombo. Transport does not seem to pose obstacles for established hotels, though it wouldfor new hotels starting up in regions without appropriate access.
Neglected during the conflict, tourism offers unique opportunities for growth with the prospect ofa permanent peace settlement. Tapping this potential will require substantially upgrading basicinfrastructure, to integrate rural areas and to spread the benefits more broadly. Tourism so far has
SRI LANKA: IMPROVING THE RURAL AND URBAN INVESTMENT CLIMATE
44
Source: Central Bank of Sri Lanka, Annual Report 2003.
FIGURE 4.15
Sri Lanka's Tourism Market Is Diversifying
52%
5%
36%
7%
Europe Australasia Asia Other
Tourist arrivals by region of origin
TABLE 4.4
Ranking of Major or Severe Investment Climate Constraints by Tourism and Urban Manufacturing Firms, Sri Lanka
Constraint Hotels Tour operators Urban manufacturing firms
Economic policy uncertainty 1 - 2
Tax rates 1 3 9
Macroeconomic instability 3 3 3
Electricity 4 17 1
Corruption 5 1 10
Skills and education of workers 6 5 7
Anticompetitive or informal practices 18 2 6
- Not available.
Source: Asian Development Bank and World Bank, Sri Lanka Investment Climate Survey, 2004.

been concentrated in the South Coast. Yet it could become a new source of growth in areas with highpoverty and unemployment, such as Uva and Sabaragamuwa Provinces, with plantations and gemmines that could attract new tourists, and North Central Province, offering rich archaeological andreligious sites.
Software: A Nascent Export SectorAlthough still in a nascent stage, thesoftware industry in Sri Lanka isgrowing rapidly. According to somereports, around 100 firms are nowoperating in the sector, up from just ahandful in the 1990s, with the recentgrowth reflected in the firms' relativelyyoung age (figure 4.16). These firmsemploy 5,000-6,000 professionals.While most of the industry's revenuestill comes from the domestic market,firms continue to expand their servicesto foreign markets, indicating that theindustry has the potential to competeinternationally. The survey shows that in2003 around 31 percent of revenuecame from exports, up from around 24percent in 2001. Around 60 percent of software firms are exporters, and around 30 percent receiveforeign direct investment. Software exports are estimated to be in the range of US$50-100 million ayear, with a significant share in fairly high value added services.
In the domestic market the three largest sources of revenue have been large domestic firms (26percent), the government (19 percent), and multinationals in the country (17 percent). The heavyreliance on the domestic market shows that the industry is still in its infancy, but it should notnecessarily be seen as a weakness.Growing through the local market willpermit software companies to furtherdevelop their business models, buildingcompetitive advantages and marketniches that will allow them to competeglobally. According to the survey, thekey sources of innovation for softwarefirms are client cooperation (cited by 28percent of firms) and the acquisition ofnew software or equipment (22percent).
Development of the software industryholds clear potential for economicgrowth. Consider the successes Indiahas had in recent years. Its softwareindustry now contributes around 3-4
INTERNATIONAL COMPETITIVENESS: CHALLENGES AND OPPORTUNITIES
45
FIGURE 4.16
Sri Lanka's Software Industry Still Very Young
Source: Asian Development Bank and World Bank, Sri Lanka Investment Climate Survey, 2004.
Firms by age (percent)
0%
20%
40%
60%
80%
100%
< 2years
2-5years
6-10years
> 10years
Manufacturing Software
Source: Asian Development Bank and World Bank, Sri Lanka Investment Climate Survey, 2004.
FIGURE 4.17
Sri Lanka's Software Industry Shares Some Investment Climate Constraints with Other Sectors
0 10 20 30 40 50 60
Cost of financeTransport
Telecommunication
Skills and educationLabor regulations
Tax administration
CorruptionMacro -economic instablity
Economic policy uncertainty
Percentage of software firms citingconstraint as major or severe
---

percent of GDP and directly employs nearly 2 million people. The software industry in Sri Lanka isnot yet in this league. Nevertheless, there are opportunities for it to compete regionally andinternationally, though the industry will need to consider creating competitive advantages over theIndian software industry (labor costs, skill levels, and the like) or compete in market niches not yetexploited by others.
Before the industry can fully exploit the opportunities in the international market, however, it mustfirst overcome obstacles to business development. Software companies in Sri Lanka cited economicpolicy uncertainty and macroeconomic instability as the two biggest impediments to their operation(figure 4.17)-factors that also emerged as serious obstacles to urban manufacturing firms. Besidesthese cross-cutting issues, software companies identified skills and education andtelecommunications as among their most important constraints-unsurprising, given the sector's heavyreliance on skilled labor and telecommunications (figure 4.18). They ranked corruption even higher.
How can Sri Lanka best address theindustry's need for an adequately trainedand educated labor force? Oneapproach is to ensure that the countryhas sufficient educational facilities thatcan provide adequate training andcertification in software skills. Thegovernment, already recognizing theimportance of this issue, plans acomprehensive program to promotetraining in such skills throughout thecountry and at all levels of educationthrough the E-Sri Lanka project. Thisgovernment-led project focuses ondeveloping four broad areas: humanresources, information infrastructure, e-government and e-society, andinformation and communicationstechnology in the private sector.5
To tackle constraints in telecommunications, the government will promote connectivity throughsmart subsidies encouraging private investment in areas where it is unlikely to occur through marketforces alone. While positive, these steps will provide only marginal help for the software industry.Further reforms and privatization are needed in telecommunications to promote the sector'sexpansion and competitiveness and provide a stronger development platform for the softwareindustry.
Although sampled firms cited corruption as one of the most important obstacles to their operation,the survey could not identify the source of this problem. Anecdotal evidence, however, suggests thatit may result from the software industry's heavy reliance on the public sector for revenue. Thegovernment plans to establish a new interface with the private sector (G2B) that will improve theprocess in the public sector for investing in, procuring, and managing information andcommunications technology. In addition, procurement practices for such technology followed in theE-Sri Lanka project may have a positive influence on those used throughout the government.
SRI LANKA: IMPROVING THE RURAL AND URBAN INVESTMENT CLIMATE
46
FIGURE 4.18
Sri Lanka's Software Industry Heavily Reliant on Educated WorkersEmployees by level of education (percent)
Source: Asian Development Bank and World Bank, Sri Lanka Investment Climate Survey, 2004.
0%
10%
20%
30%
40%
50%
60%
70%
80%
90%
Primary Secondary Tertiary
Manufacturing Software

That the government is starting to address some of the obstacles to growth in the software industryis encouraging. These initiatives should be implemented without delay, since they require longgestation periods (for education and training) or heavy capital investments (for infrastructuredevelopment). The government could also focus on initiatives to market the industry internationallyand attract much-needed foreign direct investment to the sector. The industry will also need to takeaction. Developing a niche in the global market, to differentiate itself from larger, more establishedplayers, will become increasingly important. One possible approach is to target medium-sizecompanies, since Sri Lanka's industry operates on a far smaller scale than India's. Another is to buildclear expertise in a specialized segment of the market, such as financial software. There is also astrong need for industry associations to become more active in promoting the business anddiscussing its development issues with policymakers.
INTERNATIONAL COMPETITIVENESS: CHALLENGES AND OPPORTUNITIES
47
Notes
1. Also important is to expand capacity by allowing the private sector to develop new terminals at theColombo South Harbor. The changes would need to be supported by a modern regulatory frameworkpermitting greater private sector involvement and the establishment of a port regulator and competitionauthority. The 1979 Sri Lanka Ports Authority (SLPA) Act mandates that all services in the port beprovided by the SLPA. The South Asia Gateway Terminal was built under article 36, which provides forexceptional circumstances.
2. The new agency would combine the current Inland Revenue, customs, and excise departments, leading togreater synergies in the administration of various taxes. Its independence would improve incentives andflexibility in using human and financial resources. All this, along with professional management protectedfrom political interference, should help overcome the constraints to modernizing customs and taxrevenue collection.
3. Sri Lankan firms in other sectors also carry higher inventories than their Chinese competitors.4. The survey included 71 firms in the tourism sector (41 hotels and 30 tour operators). Results show some
clear differences with urban manufacturing firms. Firms in the tourism sector are younger and smaller-unsurprising, since tourism started to develop only in the 1970s. Their average age is about 21 years,compared with 30 years for urban manufacturing firms, and about 11 percent were established in the pastfive years. Hotels have a median of 47 permanent employees and tour operators 13, compared with 90for urban manufacturing firms. For hotels temporary employees account for about 9 percent of theworkforce, a smaller share than in urban manufacturing despite the greater seasonality in tourism. Thetourism sector, especially tour operators, demands a more educated workforce than manufacturing andinvests more in outside training for employees. Tour operators use computers frequently, especially fortravel itinerary and reservation systems. Sources of finance vary depending on the business. Suppliers'credits account for nearly 20 percent of working capital for the hotel industry-perhaps largely because offood and beverage purchases-but less than 5 percent for tour operators and 9 percent for urbanmanufacturing firms.
5. The human resource program is aimed at addressing the need for a skilled labor force by, among otherthings, establishing centers of excellence that would provide world-class training in software skills,providing funding and incentives to increase research and development activities in universities and theprivate sector, mainstreaming education in information and communications technology from primarythrough tertiary levels, increasing training programs on information and communications technology forworking professionals, and promoting teacher training in computer-based pedagogy for primary andsecondary education.

CONCLUSIONS ANDPOLICY
RECOMMENDATIONSA good governance framework and a skilled labor force distinguish Sri Lanka among developingcountries. In sharp contrast with neighboring countries, Sri Lanka has created a businessenvironment that is relatively free from red tape and corruption. The economy is open, and tradereforms and other liberalization measures have helped transform the export and industrial base. Thegovernment has invested heavily in the health and education of the labor force. Yet despite theseachievements, survey results show that the country fares poorly on many investment climateindicators. A low-intensity civil war, lasting from 1983 to 2001, discouraged international investors.It also restricted regional commerce and diverted scarce resources from productive economic uses.Moreover, there was little investment in infrastructure during the conflict period, undermining firms'productivity and the country's growth potential.
Accelerating economic growth and poverty reduction in today's global business environment will beno easy task. The growth prospects of Sri Lanka, as a small, open economy, depend on maintainingrapid export growth. That challenge is made more difficult by the country's strong exportconcentration in garments, especially with the imminent phasing out of the Multifibre Arrangement.Tackling the most important constraints in the investment climate will be crucial to maintain thecompetitiveness of the garment industry and foster greater diversification of exports.
As the Sri Lankan government develops a strategy for addressing investment climate constraints, itwill be critical to pay greater attention to the differences between the rural and urban investmentclimates. A policy strategyrecognizing the challengesfacing rural entrepreneurscould do much to reduce theregional disparities and ruralpoverty in Sri Lanka.
5.1 A Policy StrategyRecognizing the SharpRural-Urban DifferencesRural and urban enterprises inSri Lanka face dramaticallydifferent constraints. Ruralfirms reported being mostconstrained by transport, thecost of and access to finance,
CHAPTER FIVE
48
0
10
20
30
40
50 Urban
Rural
Electricity Policyuncertainty
Macroinstability
Finance(cost)
Laborregulations
N/A10 th5thUrban rank
15 th2nd
3 rd2nd1st
Rural rank
5 th4th
Per
cent
age
of fi
rms
citin
gco
nstr
aint
as
maj
or o
r se
vere
Source: Asian Development Bank and World Bank, Sri Lanka Investment Climate Survey, 2004.
FIGURE 5.1
Top Five Urban Constraints and Their Rural Ratings

lack of demand for their goods,and electricity (figure 5.1).Urban firms ranked only two ofthese-electricity and the cost offinance-among their top fiveconstraints, citing neithertransport nor access to financeas major constraints (figure5.2). But they also are troubledby issues that barely register asconstraints in rural areas, suchas economic and regulatorypolicy uncertainty,macroeconomic instability, andlabor regulations.
Why is lack of market demandsuch a big challenge for ruralentrepreneurs? There areseveral reasons. Most rural
enterprises are very small, with relatively inexperienced managers, and have few contacts or links withlarger firms that can expose them to bigger and more diverse markets. Firms cater primarily to localdemand in their community, which fluctuates with the agricultural cycle. Many rural nonfarmbusinesses were started as a survival strategy, to supplement modest incomes from agriculture, andtheir products and services tend to be of low quality and limited appeal. All these problems that ruralenterprises confront in finding buyers for their products are exacerbated by their remoteness and thepoor quality of roads, transport, and telecommunications.
As the government develops policies to improve the investment climate for all Sri Lankan firms, it isimportant that it take these marked differences between the rural and urban investment climates intoaccount. Especially critical are new policies aimed at improving rural infrastructure and expandingaccess to markets for rural entrepreneurs. By improving rural employment and incomes, such policieswould go a long way toward reducing the tremendous disparities between regions and thus addressingthe widespread rural poverty in Sri Lanka.
5.2 Policy RecommendationsAchieving a permanent peace is undoubtedly the most important step that Sri Lanka can take towardimproving its investment climate. The survey results outlined above also point to five other policyareas that warrant urgent attention, some of them specific to urban or rural firms and some of themshared:
• Improving access to and the quality of energy and transport (urban and rural firms).• Reducing the cost of finance and improving access to it (urban and rural firms).• Improving labor market flexibility (urban firms).• Improving access to major markets (rural firms).• Improving policy certainty and macroeconomic stability (urban firms).
CONCLUSIONS AND POLICY RECOMMENDATIONS
49
Source: Asian Development Bank and World Bank, Sri Lanka Investment Climate Survey, 2004.
FIGURE 5.2
Top Five Rural Constraints and Their Urban Ratings
Per
cent
age
of fi
rms
citin
gco
nstr
aint
as
maj
or o
r se
vere
10
20
30
40
50
Transport Finance(cost)
Finance(access)
Demand Electricity
Rural
Urban
12 thth9 thUrban rank 1stN/A
3rd2nd1stRural rank 5 th4 th4

Some of the policy recommendations that follow highlight new issues that the government has yetto address effectively. Others focus on issues that are neither new nor surprising, in areas where thegovernment is already directing efforts. Even in these areas, however, results from the InvestmentClimate Survey provide the government with a concrete foundation for its policy direction and allowit to carefully weigh the potential costs and benefits associated with each possible course of action.
Recommendation 1: Improve access to and the quality of energy and transport(urban and rural firms)
As the survey results underline, the quality of infrastructure in Sri Lanka, especially its electricitysupply and road network, is a key constraint to economic growth.
Improving Electricity SupplyThe ability of both rural and urban firms to increase their productivity depends vitally on improvingSri Lanka's electricity supply. Failure to expand least-cost generation capacity has led to a reliance onemergency power purchases, huge financial losses, high tariffs, and frequent blackouts. Thegovernment faces a tremendous challenge in the electricity sector: it needs to expand coverage andimprove the quality and reliability of supply while simultaneously reducing tariffs to efficient cost-of-supply levels to ensure that the country can continue to compete with its neighbors in the region.
The government is already undertaking several important reforms, including restructuring the CeylonElectricity Board under the Electricity Reform Act of 2002 and establishing the Public UtilitiesCommission of Sri Lanka as the sector regulator. The new commission has made good progress inpreparing licenses and regulations for the sector.
As the government moves forward with its energy reforms, it faces the following main policypriorities in the short term:
• Commercializing the sector and strengthening its financial and operationalperformance.
• Enabling the Public Utilities Commission of Sri Lanka to implement sectorregulations, especially the tariff regulations aimed at achieving cost recovery.
• Minimizing delays in implementing a plan for expanding least-cost generationcapacity.
• Preparing a policy to promote the development of small-scale distributed renewableenergy in rural areas.
In the medium term the main policy priorities include these:
• Introducing transparent and efficient subsidy mechanisms to help expand access toelectricity in rural areas.
• Investing in transmission and distribution systems to improve the quality andreliability of power supply.
• Phasing out capital and operation subsidies to reduce the sector's fiscal burden.• Attracting private sector involvement in utility operations to help improve efficiency.• Promoting renewable energy sources such as solar, hydro, biomass, and wind as part
of the national energy strategy.
SRI LANKA: IMPROVING THE RURAL AND URBAN INVESTMENT CLIMATE
50

Improving Roads
Road transport poses the biggest obstacle for entrepreneurs in rural areas, with both poor access toroads and their poor quality continuing to impede regional development. Outside Western Provinceroad density is low and the maintenance backlog so severe that many rural roads are impassable formuch of the year. The situation is worst of all in North Eastern Province.
Lack of access to good-quality roads not only hampers existing businesses; it also makes it extremelydifficult to start or participate in rural nonfarm enterprises. Moreover, the poor quality of the roadnetwork is not just a rural issue: more than 20 percent of urban enterprises consider transport to bea major or severe constraint. Improving the road network would go a long way toward promotingsuch key export sectors as tourism and would also help reintegrate North Eastern Province into theeconomy. The main policy priorities in the road sector include the following:
• Providing adequate funding for maintaining and rehabilitating roads, especially foraddressing the maintenance backlog in the provinces.
• Selecting a core network of roads to be maintained.• Developing an overall pricing policy for the sector.• Strengthening the capacity of agencies responsible for formulating and
implementing policies in the sector.
Recommendation 2: Reduce the cost of finance and improve access to it (urbanand rural firms)Reducing the cost of finance in Sri Lanka will require stabilizing the macroeconomic situation,reducing the deficit, and reforming the two state-owned commercial banks, the Bank of Ceylon andthe People's Bank. The state banks are poorly run, and their large role in the financial sector meansthat they have far-reaching effects. Banks dominate the financial sector in Sri Lanka, and the Bank ofCeylon and the People's Bank together control almost half the banking assets. Both have high levelsof nonperforming loans that have persisted despite repeated capitalizations and managementimprovements. Their inefficiencies lead to high intermediation costs reflected in large spreads. Thatin turn results in high costs of borrowing across the banking sector, since the more efficient privatebanks have chosen to charge similarly high lending rates for the sake of high profits.
Expanding financial services to enterprises, especially small and medium-size enterprises, will requirefurther refining the regulatory and judicial framework. Parate powers of debt recovery (allowingforeclosure on collateral without court intervention) should be granted to all licensed institutions-banks as well as finance, leasing, and factoring companies. The Credit Information Bureau should beexpanded to allow access to factoring companies and other nonbank and nonfinancial providers ofcredit. In addition, the bureau should incorporate information from the registrar of companies andcourt judgments and could develop a credit scoring model to offer its members as a risk managementtool. Financial institutions could use international assistance to develop new financial products bettertailored to small and medium-size enterprises. Assuring secure property rights and improving thefunctioning of the land administration system would also improve access to credit, particularly forrural entrepreneurs.
In rural areas the widespread growth of microfinance institutions and credit cooperatives hasexpanded the availability of financial services, but access to finance, especially long-term finance,remains an important obstacle for rural enterprises. Moreover, performance varies widely among
CONCLUSIONS AND POLICY RECOMMENDATIONS
51

different types of microfinance providers, with the most successful those that apply modernprinciples of microfinance, including market interest rates. Another concern is the supervisoryvacuum in which these institutions operate. One way to improve their safety while avoidingoverregulation would be to sponsor the creation of national associations or an apex institution thatwould monitor operations and possibly provide risk management and liquidity services. Formal statefinancial institutions should apply market interest rates and better credit and recovery practices intheir rural portfolio. Debt forgiveness programs should be avoided, since they distort rural creditmarkets and discourage entry by formal financial institutions.
Reforming the contractual savings system could help develop new sources of long-term finance forthe private sector, particularly for large enterprises and commercial banks. In turn the banks couldexpand long-term finance for small and medium-size enterprises.
The key policy priorities in the finance sector are thus as follows:
• Restructuring state banks.• Enhancing debt recovery mechanisms.• Expanding and upgrading the capacity of the Credit Information Bureau.• Improving the regulatory framework for microfinance institutions.• Reforming the contractual savings system.
Recommendation 3: Improve labor market flexibility (urban firms)Labor regulations rank as the fifth most important obstacle to doing business, cited as a major orsevere constraint by more than a quarter of urban firms. Indeed, Sri Lanka's labor regulations arerestrictive, and firms cope by hiring temporary workers, which reduces productivity. They are alsorigid, which discourages investment and results in higher unemployment, especially among theeducated youth. And they are discretionary, creating great uncertainty about the cost of hiring andfiring workers. These effects put Sri Lanka at a competitive disadvantage in attracting foreign directinvestment, even in comparison with other destinations in South Asia. As the MultifibreArrangement is phased out, restrictive labor regulations will prevent the restructuring of the garmentsector needed to respond to a more competitive market environment.
Reform of labor laws has traditionally met with strong opposition from trade unions. In 2003,however, the government moved to reform labor regulations. While the details of the proposedreforms remain under discussion, they include introducing a formula for employee severancepayments, imposing strict limits on the duration of labor tribunal cases, and establishing anunemployment benefit system.
To encourage foreign direct investment, foster the efficient reallocation of labor, and promoteemployment in the formal sector, Sri Lanka needs to transform its discretionary and costly severancepayment into modern, affordable, and equitable income support for the unemployed. This supportneed not take the form of unemployment insurance, however, since current conditions may not favorthe effective operation of such a system. One way to proceed is to reform the severance systemalone. Alternatively, if the country introduces an unemployment insurance system, it shouldaccompany this step with radical reforms to the costly severance payment system, including endingthe requirement for approval of retrenchment applications by the labor commissioner and otherdiscretionary practices. The unemployment insurance system would need to be adapted to thecountry's circumstances to minimize adverse effects on employment, ensure affordability, and reduce
SRI LANKA: IMPROVING THE RURAL AND URBAN INVESTMENT CLIMATE
52

administrative costs. Administration of the system should be kept simple, with no individualmonitoring of beneficiaries, and its financing limited to employer and employee contributions.
Other initiatives could also help improve the functioning of the labor market. Expanded further, theemployment clearinghouse Jobsnet could provide a useful forum for those wishing to start their ownbusiness and a source of information on training and opportunities for developing new skills.
Recommendation 4: Improve access to major markets (rural firms)While rural entrepreneurs identified lack of market demand as a major constraint, less than 10percent believed that they needed marketing assistance and less than 2 percent used any suchassistance. These results reflect a lack of awareness of its potential benefits. So while improving thecoverage and quality of rural infrastructure must form a big part of any strategy for increasing accessto markets for rural firms, initiatives to extend marketing assistance are also important. There areseveral possible ways to provide such assistance to rural entrepreneurs (Vijverberg 2002; GTZ 2003).Business organizations and local chambers of commerce could strengthen marketing channels byhelping to develop business directories and by holding product fairs to expose local producers tobuying habits and consumer behavior in different markets. They could also share information onprices, quality standards, and ways to obtain technical, financial, and organizational services forgreater value addition. In addition, supporting group marketing (through associations andcooperatives, for example) and business clusters would help rural enterprises take advantage of scaleeconomies, perhaps allowing them to purchase inputs at lower prices, access larger markets, and shareequipment and infrastructure.
Recommendation 5: Improve policy certainty and macroeconomic stability(urban firms)As the survey revealed, policy uncertainty and macroeconomic instability-ranked by urban enterprisesas the second and third most important constraints-have a tremendously adverse effect on firms. Tobe effective, firms must be able to plan for the future. To feel secure about committing toinvestments, they need to be able to count on low inflation and interest rates, a steady exchange rateto support international trade, and some assurance of continuity in business-related policies.
In Sri Lanka, where the political system leads to frequent changes of government, businesses havedifficulty in planning for the future. The past four years have seen three general elections, eachaccompanied by changes in political outlook and appetite for reform. Every election imposes largedirect costs on the economy-elections are not cheap. But the indirect costs dwarf the direct costs-witness the large number of international companies that pulled out of potential investments in SriLanka late in 2003.
A policy framework geared to improving policy certainty and macroeconomic stability would includethe following measures:1
• Reducing the deficit and public debt to the targets set in the Fiscal Management(Responsibility) Act-for the deficit, 5 percent of GDP (from 8 percent), and forpublic debt, 85 percent of GDP (from 101 percent)-by 2006.
• Strengthening revenue collection through better tax administration.• Reforming the civil service and reducing the wage bill.• Reducing the losses of state-owned enterprises.
CONCLUSIONS AND POLICY RECOMMENDATIONS
53

• Committing all parties to reducing public sector interference in the economy,including maintaining the independence of the Central Bank and ensuringindependent economic regulation.
SRI LANKA: IMPROVING THE RURAL AND URBAN INVESTMENT CLIMATE
54
Notes
1. See World Bank (2004a) for a more detailed discussion of structural issues affecting macroeconomicstability.

55
APPENDIX 1
URBAN MANUFACTURING SURVEY: SAMPLING METHODOLOGY
This appendix describes the design and estimation procedure, including the weight assignment for the respondent establishments of the urban manufacturing survey that was conducted in Sri Lanka. Population Coverage Sri Lanka has nine provinces which are further subdivided into 25 districts. Of these 25 districts, some areas are considered urban, which are either administered by municipality center/urban center (MC/UC – 16 MCs and 30 UCs). The rural areas are administered by district secretary local government. The manufacturing survey covered the following sectors: Food and Beverage (ISIC 311, 312, 313), Textile (321), Garments (322), Industrial Equipment (382), and Rubber Products (355). An updated and comprehensive list of all establishments for manufacturing, services or trade did not exist in Sri Lanka at the time of the survey. The closest to this list were the following lists maintained by the Department of Census and Statistics:
• List of manufacturing establishments for the Western Province (3 districts) developed in cooperation with United Nations Industrial Development Organization (UNIDO). A draft list was consolidated from the registers of the Board of Investment, Ministry of Industries, Ministry of Textile and MEIPIP and was further improved by ground checks. DCS is confident that they have captured all the establishments with five or more employees in the Western Province.
• List of manufacturing establishments with 25 or more employees that were used as the sampling frame for the Annual Survey of Manufacturing Industries. This list originated from the 1983 Census of Establishments. The 1993 Census of Establishments was not conducted because of the political situation in the country and was updated annually from the registers mentioned above.
• List of manufacturing establishments with less than 25 employees that were sampled for the Annual Survey of Industries. This list was partial and obsolete since there were no registers that could be used to update it and the births and deaths of establishments under this category are faster than those establishments with 25 or more employees.
For this survey, the lists mentioned above were merged and employed as the sampling frame. General Sampling Design A total of 505 establishments were selected. Those 105 establishments that have 500 or more employees were selected with certainty, while others were selected by using the stratified simple random sample design. In general, the strata were defined by the sector “X” provincial groups. In cases where the stratum sizes in specific sectors were very sparse, sectors were collapsed. Hence, the final stratification was determined by iteratively collapsing small strata until a sufficient strata size was obtained to ensure a 100% replacement in all strata and adequate strata sample sizes.

URBAN MANUFACTURING SURVEY: SAMPLING METHODOLOGY
56
In the absence of any other auxiliary variables in the list frame that could be used in the sample allocation and selection, sample sizes across strata were determined using proportional allocation. That is, if hN is the population size in stratum h and N is the population size, the first iteration sample size hn in stratum h is derived by
400×=NNn h
h
Determination of Weights The final weight for respondent k in stratum h -- whk, is a composite of the base weight, hkw1 , the non-response adjustment, hkw2 , and the factor to compensate for coverage errors, hkw3 , such that: hkhkhkhk wwww 321 ××= (1)
Base Weight The base weight is the inverse of the probability of selection. The base weight for all large establishments (those with 500 or more employees) is 1 since they were all selected. Table A1.1 presents the base weight for all the small and medium establishments by province and manufacturing sector. Table A1.1 Base Weight for Small and Medium Establishments by Province and Manufacturing Sector
(those with less than 500 employees)
Province Province code Manufacturing sector Stratum
weight Sample
size Probability of selection
Baseweight
Western 1 Food and Beverage 111 37 0.333333 3.00 Western 1 Garments 180 60 0.333333 3.00 Western 1 Industrial/Agri/Trans Equipment 88 29 0.329545 3.03 Western 1 Rubber Products 70 23 0.328571 3.04 Western 1 Textile 102 34 0.333333 3.00 Central 2 Food and Beverage 171 57 0.333333 3.00 Central 2 Equipment/Garments/Rubber 10 3 0.3 3.33 Central 2 Textile 21 7 0.333333 3.00 Southern 3 Food and Beverage 74 25 0.337838 2.96 Southern 3 Equipment/Garments/Rubber 19 6 0.315789 3.17 Southern 3 Textile 22 7 0.318182 3.14 Northwest 6 Food and Beverage 30 10 0.333333 3.00 Northwest 6 Equipment/Garments/Rubber 15 5 0.333333 3.00 Northwest 6 Textile 106 35 0.330189 3.03 North Central 7 All Sectors 12 4 0.333333 3.00 Uva 8 Food and Beverage 40 13 0.325 3.08 Uva 8 Textile/Garments/Rubber 8 3 0.375 2.67 Sabaragumawa 9 Food and Beverage 74 25 0.337838 2.96 Sarabagumawa 9 Rubber Products 37 12 0.324324 3.08 Sarabagumawa 9 Textile/Garments 15 5 0.333333 3.00

URBAN MANUFACTURING SURVEY: SAMPLING METHODOLOGY
57
Non-response and Sampling Frame Errors Adjustments The weights estimated at the design stage were then adjusted to account for non-response and frame problems. Establishments who refused to participate in the survey were considered as non-respondents. Frame problems occurred when establishments could not be located, were closed, out of scope (the ISIC classification was not specified correctly), or duplicates. Each of these had a different impact on weight adjustment. Table A1.2 reports the final weights for each strata.
Table A1.2 Adjusted Weights for Large Establishments
Manufacturing sector
Final weight
Garments 1.227375389
Textiles 5.132860041
Food & Beverages 2.470972175
Industrial Equipment 1
Rubber Products 1.562151394
Table A1.3 Adjusted Weights for Small & Medium Establishments
Province Strata Final weight Western 1 3.14893617
Western 2 2.57918552
Western 3 2.625514403
Western 4 2.879979036
Western 5 3.025321403
Central 6 2.442857143
Central 7 5.189620758
Central 8 2.52
Southern 9 2.584126984
Southern 10 2.375
Southern 11 2.257431457
Northwest 12 2.567854909
Northwest 13 5
Northwest 14 2.472734891
North Central 15 3
Uva 16 3.956043956
Uva 17 2.666666667
Sabaragumawa 18 3.633928571
Sarabagumawa 19 3.083333333
Sarabagumawa 20 3.372053872

URBAN MANUFACTURING SURVEY: SAMPLING METHODOLOGY
58
Estimation Estimates for each of the strata described in table A1.1 could be derived separately. For example, the estimator for a total in stratum h is ∑=
khkhkh ywY (5)
where yhk is the observed value from the kth sample in stratum h. The estimator for the variance of this
estimator is ( ) ( )h
hhh n
sfYv
2
1ˆ −= (6)
where fh is the sampling fraction and 2hs is the sample variance in stratum h.
The estimator for the population total would be ∑∑=
h khkhk ywY (7)
and its variance estimator is ( ) ( )h
hhn n
sfNYv
22 1ˆ −= ∑ (8)

59
APPENDIX 2
URBAN SERVICES SURVEY (TOURISM AND INFORMATION TECHNOLOGY): SAMPLING METHODOLOGY
This appendix describes the sampling design for the investment climate survey conducted in three services sub-sectors of Sri Lanka namely: hotel, tourism (i.e., travel agencies) and IT. Population Coverage The target population for the services survey are establishments with their primary operations in hotels, travel agencies, and information technology (IT), particularly software development. Because there are no comprehensive lists of establishments under these sub-sectors, the lists that became the basis for sampling were developed from different sources. The sampling frame for hotel establishments and travel agencies was developed from the lists provided by the Ceylon Tourist Board, commercial telephone directories, associations of hotel and travel agencies, and the municipal business register for Colombo. For IT establishments, the sampling frame was developed from the associations of IT software developers and the municipal business register of Colombo. General Sampling Design The sample size for the service sector survey was fixed at 100 and equally divided among the 3 services sub-sectors at the onset. Due to sampling methodology constraints, the final sample sizes for the sub-sectors were: 41 hotel establishments and 30 each from travel agencies and 33 IT establishments. The strata were defined differently for each sub-sector, depending on the available auxiliary variables in the sampling frame. For the hotel establishments, the employment variable became the determinant of strata since it was available for most establishments. For IT, both employment size and exporting status were used. Only location data was available for travel agencies. For Hotel and IT sub-sectors, large establishments were selected with certainty. The rest of the sample size was then allocated to the remaining strata using proportional allocation. Establishments were then selected from the non-certainty strata using simple random sampling. For the travel agencies simple random sampling was used. The sample allocation and final weights for each sub-sector are shown in tables A2.1 to A2.3 below.
Table A2.1 Sample Allocation and Base Weight for Hotel Establishments
Stratum (employment
size)
Stratum size
Sample size
No. of respondents
Selection probability
Base weight
Non-response adjustments
Frame error adjustments
Final weight
200 and above 7 7 6 1.0000 1.0000 1.1667 1.0000 1.1667 75-199 47 9 9 0.1915 5.2222 1.0000 1.0000 5.2222 30-74 68 10 10 0.1471 6.8000 1.0000 1.0000 6.8000 below 30 116 17 16 0.1466 6.8235 1.0625 0.9091 6.5909 Total 238 43 41

URBAN SERVICES SURVEY (TOURISM AND IT): SAMPLING METHODOLOGY
60
Table A2.2 Sample Allocation and Base Weight for Tourism Establishments
Stratum Stratum
size Sample
size No. of
respondentsSelection
probability Base
weight Non-response adjustments
Frame error adjustments
Final weight
Colombo 393 30 30 0.0763 13.1000 1.0000 0.9434 12.3585 Outside Colombo 37 3 0 0.0811 12.3333 1.0000 12.3333
Total 430 33 30
Table A2.3 Sample Allocation and Base Weight for IT Establishments
Stratum (employment & export status)
Stratum size
Sample size
No. of respondents
Selection probability
Base weight
Non-response adjustments
Frame error
adjustments
Final weight
100 and above 5 5 2 1.0000 1.0000 2.5000 1.0000 2.5000
< 100, exporting 20 8 8 0.4000 2.5000 1.0000 0.7500 1.8750 <100, not exporting 71 20 13 0.2817 3.5500 1.5385 0.8158 4.4555
Total 96 33 23 0.3438

RURAL SURVEY: INSTRUMENT AND SAMPLING METHODOLOGY
61
APPENDIX 3
RURAL SURVEY: INSTRUMENT AND SAMPLING METHODOLOGY
The rural investment climate survey in Sri Lanka is one of the first surveys to systematically collect information on the investment climate in which rural formal and informal businesses operate, and on the impact of the investment climate on firm productivity and the decision of rural households to engage in entrepreneurial activity. This survey is part of a pilot of rural investment climate surveys being undertaken by the World Bank. The Sri Lanka rural investment climate survey was conducted between December, 2003 and May, 2004. A total of 1327 rural non-farm enterprises and 1,063 rural households with and without enterprises were surveyed as part of a nationally representative sample of rural non-farm enterprises. The Survey Instrument The final survey instrument for the Sri Lanka rural investment climate study consisted of four components (i) a household survey, (ii) an enterprise survey, (iii) a community survey and (iv) a price survey. The household survey collected information on household demographics, sources of incomes, and levels of education. This questionnaire was administered to selected non-farm enterprises that were physically located within households (household based) as well as selected households that did not engage in rural non-farm enterprises. For households not engaged in non-farm enterprise activities this module also collected data on factors preventing participation in non-farm enterprises. The enterprise questionnaire was completed for each rural non-farm enterprise selected for the survey. The manager or the most knowledgeable person about the firm was interviewed to complete the questionnaire. At the start of this questionnaire each non-farm enterprise was classified as a production, trade or service enterprise based on the sector from which they derived the highest share of sales. The community questionnaire was used to develop community profiles and identify community level characteristics that are important in determining the rural investment climate. This questionnaire was completed by interviewing various community leaders such as the village head, local government officials, the principal of a school etc. A community questionnaire was completed in each of the selected communities (GN Divisions). The price questionnaire gathered data on certain consumer, input and output prices prevailing in the main local market in each community. Sampling Due to the absence of an existing census of rural non-farm enterprises a sample frame was developed for the purposes of this study by the Sri Lankan Department of Census and Statistics in collaboration with the World Bank and AC Nielsen. As a first step, a decision was made to select a sample of 1500 rural non-farm enterprises and 600 households without non-farm enterprises. This sample size allowed national level estimates of the desired statistics given the budget constraints. A two stage sampling approach was adopted. In the first stage approximately 150 Grama Niladari (G.N.) divisions were randomly selected from among the 25 districts of Sri Lanka with probability proportionate to size using a systematic sampling method where the number of rural

RURAL SURVEY: INSTRUMENT AND SAMPLING METHODOLOGY
62
housing units in each district was used as a measure of size. Rural areas were defined as per the current Department of Census and Statistics definition that classifies all areas that do not fall under Municipal Councils and Urban Councils as rural areas. There are around 14,000 G.N. Divisions in Sri Lanka of which 12,000 are classified as rural. For the selection of secondary sampling units (SSU's) for the two surveys, a census of all buildings within the boundary of the selected G.N. Divisions in the primary sample was undertaken. In all provinces excluding the North and East, the census (listing exercise) was conducted between September, 2003 and November, 2003. The listing in the North and East was completed between October 15, 2003, and March, 2004. A total of 65,579 units (residential and non-residential) were included in the listing exercise in 147 G.N.s (figure A3.1). Three G.N.s in the North and East province under LTTE control had to be dropped from the sample because of the inability to conduct the survey in these areas. A total of 27 GNs were selected in the North and East of which 17 were under government control and around 10 were directly under LTTE control. On completion of the listing operation, units with a non-farm enterprise (household based or stand alone) were separated in to the following two groups. 1) Group A : Enterprises with one or two persons engaged in the economic activity. 2) Group B : Enterprises with three or more persons engaged in the economic activity. For the purposes of the survey rural non-farm enterprise were defined as any income generating activity (trade, production or services) not related to primary production of crops/ livestock/fisheries undertaken either within the household or in any non-housing units. Any value addition (processing) to primary production was considered to be a rural non-farm activity. The total sample frame of rural non-farm enterprises is shown in table A3.1.
After separating the establishments into groups A & B, the establishments in each group were sorted in order by industry type, Production, Services and Trade respectively. The sample enterprises to be surveyed were then selected using a systematic sampling procedure. The number of sample enterprises (secondary sample) selected from each sample G.N. were as follows: (i) 5 establishments from Group A; and (ii) 5 establishments from Group B.
Figure A3.1 Rural Sample Points

RURAL SURVEY: INSTRUMENT AND SAMPLING METHODOLOGY
63
ˆTable A3.1 Rural Non-farm Enterprise Sample Frame
Province District GN
division (code)
GN name Number of
enterprises with up to 2 workers
Number of enterpriseswith more
than 2 workers
Western Colombo 430 Kadugoda North 13 1Western Colombo 450A Walpita 14 1Western Colombo 474 Hewagama 69 23Western Colombo 491A Walpola 82 22Western Colombo 500 Brahmanagama 87 19Western Colombo 509 Kotuvila 70 15Western Colombo 532C Wattegedara 234 234Western Colombo 562 Wewala East 34 19Western Gampaha 119 Kotugoda 1 6 9Western Gampaha 119/1 Kotugoda 2 63 19Western Gampaha 151 Kovinna 66 13Western Gampaha 44A Kaluaggala 14 3Western Gampaha 53 Nawana West 25 9Western Gampaha 53A Paragoda South 9 4Western Gampaha 64A Katana North 82 18Western Gampaha 89B Aluthepola East 38 7Western Gampaha 9 Purana Meerigama 37 9Western Gampaha 91C Dadonna East 22 3Western Gampaha 97B Bomugammana South 33 14Western Gampaha 9A Maveehena 7 4Western Kalutara 626A Kottiyawatta 36 0Western Kalutara 687B Eludila 160 24Western Kalutara 694B BiganaThuduwa 43 9Western Kalutara 708C Potupitiya West 106 18Western Kalutara 745 Munhene 59 9Western Kalutara 787 Walallawita East 53 2Western Kalutara 800E Dodangoda West-Central 58 16Western Kalutara 819H Gamagewatta 57 7Western Kalutara 832B Ridirekagama 34 2Central Kandy 1011 Galagoda 16 1Central Kandy 1061 Giraulla 36 0Central Kandy 218 Deldeniya 52 4Central Kandy 474 Kurungudolla 19 3Central Kandy 535 Uggala Janapadaya 9 0Central Kandy 604 Meegamawatta 34 2Central Kandy 62 Hatnagoda 22 6Central Kandy 712 Malpana 35 12Central Kandy 938 Batumulla 27 2Central Matale E325 Imbuldanda 15 4Central Matale E371 Palle Weragama 21 12

RURAL SURVEY: INSTRUMENT AND SAMPLING METHODOLOGY
64
Province District GN
division (code)
GN name Number of
enterprises with up to 2 workers
Number of enterpriseswith more
than 2 workers
Central Matale E433A Yatigalpotta 17 9Central Matale E443 Kaludewa Paranagama 12 2Central Nuwara-Eliya 315A Ginigathhena 180 61Central Nuwara-Eliya 320C Gawaravilla 51 4Central Nuwara-Eliya 460G Ketubulawa 36 9Central Nuwara-Eliya 475W Ssummerset 32 13Central Nuwara-Eliya 501F Rookwood Estate 14 2Central Nuwara-Eliya 528F Matatilla 15 0Southern Galle 113 Batadoowa 56 15Southern Galle 143A Halloluwagoda 44 4Southern Galle 188 Hammeliya 26 7Southern Galle 228 Malgalla 56 6Southern Galle 24E Pathirajagama 12 18Southern Galle 30B Indipalegoda 62 9Southern Galle 44B Ganegoda 33 42Southern Galle 75H Polhunnawa 93 31Southern Matara 241H Kandilpana 32 7Southern Matara 245A Andaluwa 14 2Southern Matara 318A Godawa 34 10Southern Matara 364 Diyalape 33 10Southern Matara 381B Wekada 36 4Southern Matara 433A Devinuwara West 26 5Southern Hambantota 178 Hungama 152 49Southern Hambantota 319 Dammulla East 52 15Southern Hambantota 34 Molkepopathana 32 8Southern Hambantota 456 Koholana 35 10Southern Hambantota 98 Weliwewa 21 5North Western Kurunegala 1322 Asseduma 23 8North Western Kurunegala 1343 Bamunumulla 16 5North Western Kurunegala 1472 Kovulwewa 35 10North Western Kurunegala 1591 Indivinna 28 19North Western Kurunegala 276 Rasnayakapura 67 12North Western Kurunegala 351 Pallekela 28 4North Western Kurunegala 518 Udawela 167 38North Western Kurunegala 669 Mee/udagama 36 1North Western Kurunegala 804 Dematagahapalessa 14 3North Western Kurunegala 83 Kumbukwewa 4 1North Western Kurunegala 850 Galabadagama 37 6North Western Kurunegala 981 Malddeniya 22 3North Western Puttlam 485A Hanatotupala 21 13North Western Puttlam 512B Maravila South 28 13North Western Puttlam 550A Karavitagara East 36 9

RURAL SURVEY: INSTRUMENT AND SAMPLING METHODOLOGY
65
Province District GN
division (code)
GN name Number of
enterprises with up to 2 workers
Number of enterpriseswith more
than 2 workers
North Western Puttlam 615D Sirambiadiya 44 7North Western Puttlam 629A Kandakuliya 112 33North Western Puttlam 653A Thalgaswewa 16 0North Central Anuradhapura 103 Diviyaudabendawewa 4 2North Central Anuradhapura 162 Galanbindunuwewa 136 88North Central Anuradhapura 324 Bogahawewa 22 16North Central Anuradhapura 420 Musalpitiya 78 21North Central Anuradhapura 44 Puhudivula 21 3North Central Anuradhapura 479 Bulnewa 119 27North Central Anuradhapura 612 Kollankuttigama 26 2North Central Polonnaruwa 198 Laksha Uyana 38 12North Central Polonnaruwa 270 Malvilla 18 7North Central Polonnaruwa 8 Damanayaya 130 29North Central Polonnaruwa 93 New Town 109 13Uva Badulla 12 Ritigahaarawa 6 1Uva Badulla 1N Hobariyawa 29 6Uva Badulla 37A Wethalawa 10 3Uva Badulla 48B Girambe 11 9Uva Badulla 63B Diyathalawa 113 103Uva Badulla 67B Bindunuwewa 27 15Uva Badulla 80H Glen Alpin 6 4Uva Badulla 88H Palagolla 9 2Uva Monaragala 124B Tjossaira 32 26Uva Monaragala 146D Karaville 57 52Uva Monaragala 151D Nugayaya 15 9Uva Monaragala 98B Mudiyala 10 4Sabaragamuwa Kegalle 136C Thoranagoda 33 7Sabaragamuwa Kegalle 155D Pathagama 90 30Sabaragamuwa Kegalle 174A Yakdehiwatta 121 13Sabaragamuwa Kegalle 185A Pallegedara 22 5Sabaragamuwa Kegalle 214C Moraketiya 69 5Sabaragamuwa Kegalle 237 Masimbula 38 1Sabaragamuwa Kegalle 244C Metihakwala 25 1Sabaragamuwa Kegalle 268A Pinnawala 43 10Sabaragamuwa Ratnapura 09A Kotagama 35 2Sabaragamuwa Ratnapura 106 Yatiyantota 214 90Sabaragamuwa Ratnapura 121C Godagampala 36 6Sabaragamuwa Ratnapura 38 Palliporuwa 40 2Sabaragamuwa Ratnapura 53A Kavudugama 51 9Sabaragamuwa Ratnapura 77B Kodapaluwa 98 13Sabaragamuwa Ratnapura 99 Lewangama North 38 2North & East Jaffana J/172 Chulipuram West 41 6

RURAL SURVEY: INSTRUMENT AND SAMPLING METHODOLOGY
66
Province District GN
division (code)
GN name Number of
enterprises with up to 2 workers
Number of enterpriseswith more
than 2 workers
North & East Jaffana J/208 Punnalai Kadduvan North 9 2North & East Jaffana J/259 Kalviyankadu 72 11North & East Jaffana J/294 Navatkuli West 20 1North & East Kilinochchi KN83 5 0North & East Mannar MN/153 Mullikulam 4 1North & East Mannar MN/48 Thalaimannar North 41 4North & East Mannar MN/73 Pesalai North 32 4North & East Vauniya 215B Katharsinnakulam 39 1North & East Vauniya 218 Thandikulam 86 15North & East Vauniya 224A 14 0North & East Mullaitivu M122 4 1North & East Mullaitivu M43 17 2North & East Mullaitivu M46 14 1North & East Batticaloa 107B Kanthipuram 87 4North & East Batticaloa 192 Eravur 500 50North & East Batticaloa 211E Mathuran Keni Kulam 46 0North & East Amparai 144 Mahaoya 70 21North & East Amparai 78D Samanthurai 83 10North & East Amparai AP/19 153 2North & East Amparai P/02 91 4North & East Trincomalee 225I Samawechchathui 16 0North & East Trincomalee 228F Mullipothanai East 28 1North & East Trincomalee 31I Pullmoddai 69 6Total 7357 1918 In instances where adequate numbers were not listed under any of the above groups, the balance sample was also selected from the other group. If an adequate number was not available in both groups, the balance was selected from an adjoining G.N. to keep the sample size unaffected. The effective sample was increased by 6 establishments per province to account for anticipated unit non-response. Households without a non-farm enterprise were also identified using the listing information and a sample of 4 such households were selected using a systematic sampling procedure for the household survey. Sample weights for estimation purposes are computed as follows. (This formula applies separately for the two categories A & B of the Establishment Survey and households without enterprises.) Let, gi = No. of G.N.divisions selected from district ί Gίј = Total no. of housing units in the јth G.N. in district ί. Dί = Total no. of housing units in the ίth district. Nίј = No. of units listed in јth G.N. in ίth district. nίј = No. of units selected from the јth G.N. in the ίth district.

RURAL SURVEY: INSTRUMENT AND SAMPLING METHODOLOGY
67
Dί x Nίј
Gίј x nίј
Then the sample weight for the јth G.N. division in the ίth district Wίј is given by the following formula.
Wίј = gi
1
If the characteristic y measured in the kth unit, in the јth G.N. division in the ίth district is given by Yίјk, the total estimate ŷ at national level is obtained as below. (for categories A & B in the Establishment Survey and for the Household Survey respectively)
ŷ = ∑∑∑===
ij
k
gi
ji
n
11
25
1
Wij x
Sampling weights computed separately for the two categories A & B are given separately and if the total estimates for the two categories are denoted by ŷA & ŷB (Establishment Survey) then the combined national level estimate, ŷnational = ŷA + ŷB . The original weights were adjusted for unit non-response before estimation of sample characteristics. The final sample distribution of rural non-farm enterprises and rural households by province is shown in table A3.2 and table A3.3, respectively. Table A3.4 shows the distribution of the non-farm enterprise sample by industry type.
Y ijk

RURAL SURVEY: INSTRUMENT AND SAMPLING METHODOLOGY
68
Table A3.2 Distributions of Enterprise Sample by Province
Frequency Share of total
Province Stand-alone Household based Total
Western 162 100 262 19.74% Central 131 48 179 13.49% Southern 85 99 184 13.87% North Western 119 47 166 12.51% North Central 62 32 94 7.08% Uva 81 33 114 8.59% Sabaragamuwa 85 58 143 10.78% North & East 108 77 185 13.94% Total 833 494 1,327 100.00%
Table A3.3 Distribution of Household Sample by Province
Frequency Share of total
Province Households
without non-farm enterprises
Household with
enterprises Total
Western 114 105 219 20.60% Central 73 50 123 11.57% Southern 73 99 172 16.18% North Western 69 47 116 10.91% North Central 39 32 71 6.68% Uva 46 38 84 7.90% Sabaragamuwa 57 59 116 10.91% North & East 84 78 162 15.24% Total 555 508 1,063 100.00% Note: The number of households with enterprises and household based enterprises differ between the two samples as some of the businesses had closed down or had re-located to another GN in the time between the listing exercise and the actual survey.
Table A3.4 Distribution of Enterprise Sample by Province and Sector
Province Production Service Trade Total Western 119 56 87 262 Central 63 36 80 179 Southern 94 34 56 184 North Western 72 40 54 166 North Central 36 14 44 94 Uva 23 34 57 114 Sabaragamuwa 60 28 55 143 North & East 80 41 64 185 Total 547 283 497 1327

69
APPENDIX 4
URBAN MANUFACTURING SURVEY: TECHNICAL APPENDIX ON INVESTMENT CLIMATE AND
FIRM PERFORMANCE I. Methodology
The impact of the IC on firm performance is gauged by using regression analysis. Various versions of the following reduced-form regression equation are estimated:
yi = α0 + α1*ICi + α2*Xi + α3*Zi + εi (1) The dependent variable, y, represents a measure of firm performance. IC represents a measure of the investment climate. X denotes a vector of firm-level control variables. Z is a vector of industry controls (industry dummies) and a location control (whether the firm is located in the capital region or not). In this document, firm performance is measured using seven different variables: (i) average annual sales growth; (ii) average annual employment growth; (iii) average investment rate; (iv) whether or not a firm invested above a certain threshold rate in any of the three sample years; (v) labor productivity; and (vi) two measures of TFP. With the exception of (iv) all the firm performance measures are continuous (or nearly so as in the case of (iii)). The regression equation is therefore estimated by OLS in all cases except when (iv) is the dependent variable. In this latter case, estimation is based on the Probit model. Table A4.1 below provides details on how each of these measures was constructed.
Table A4.1 Definitions of Firm Performance Variables
Firm performance measure Definition Sales growth Average annual growth in sales for the past three years (where sales are deflated by
industry-specific producers’ price indexes). Employment growth Average annual growth in total employment (permanent employees + temporary
employees) for the past three years. Investment rate Average investment rate over the last three years. (Investment rate is defined as
investment in plant and machinery divided by the book value of fixed assets.) Any new investment Whether a firm’s net investment in plant and machinery was 5% or more of fixed
capital in any of the three sample years. Labor productivity* Value added divided by total employment TFP-LP* Total factor productivity estimated using the Levinsohn-Petrin1 estimator applied
to a simple Cobb-Douglas value-added production function: lnVit = β0 + βL*ln(Lit) + βK*ln(Kit) + Year00 + Year02 + ωit + ηit. V denotes value added, L denotes total employment, K denotes fixed capital, and Year denotes year dummies. The estimate of ωit captures TFP.
TFP-OLS* Total factor productivity estimated using OLS estimator applied to the following Cobb-Douglas value-added production function: lnVij = β0 + ΣjDj*[βL*ln(Lit) + βK*ln(Kit)] + Year00 + Year02 + εi, where V, L K, and Year are as before, and D denotes industry dummies. The index i represents firms and j denotes four industries (garments and textile; food and beverages; industrial equipment; and rubber products). The estimate of εit captures TFP.
Note: (*) Each of the three productivity measures introduced in the regression equation (1) pertain to the latest of the three sample years, 2002.

URBAN MANUFACTURING SURVEY: TECHNICAL APPENDIX ON INVESTMENT CLIMATE AND FIRM PERFORMANCE
70
The investment climate is captured in a variety of ways. In particular, variables are grouped in terms of their relationship to (i) international integration; (ii) functioning of labor markets; (iii) the state of physical infrastructure; (iv) measures of governance, including administrative and regulatory functioning; and finally (v) finance. Three main econometric problems might bias our results: non response, multicollinearity, and endogeneity. We attempted to correct for all of them. We dealt with non coverage by estimating sampling weights and correcting them for non response and frame problems. All our regressions, except for the Levinsohn-Petrin approach, are weighted hence the estimated values are adjusted for item non response as well. Since a number of investment climate measures are related to one another, including them all in a regression equation would cause difficulties in making robust inference due to multicollinearity issues. Additionally, since not all firms answer every question, including all the investment climate measures together could lead to a large attrition in the sample size. For both reasons, the investment climate measures are included one-by-one. However, as a robustness check we also run a regression where we include together the various investment climate measures which individually show up as having a significant impact on at least one dimension of firm performance. A problem with the type of investment climate analysis carried out here is the potential for endogeneity bias. In particular, establishing the direction of causality from a measure of investment climate to a measure of firm-performance is problematic. To alleviate endogeneity bias, equation (1) is always estimated with controls. These include industry dummies to control for industry-specific effects, a dummy for the Greater Colombo area to control for location-specific factors, and various firm level characteristics. In addition to the age of the firm, the latter include initial sales in the case of sales growth as a measure of firm performance, initial employment in the case of employment growth, initial capital in the case of the investment related firm performance measures2, and establishment size dummies for all the productivity-related measures. When we attempted to measure the impact of perception on firm performance a particular set of controls were used. In this case the respondents’ psychology can play a relevant role in his assessment of the obstacles. Hence the set of controls adopted were the average value of perception in the location of the respondent, the level of education of the respondent himself, and also a dummy variable for interviewer, intended to capture eventual fixed effects due to the style of interview and the personality of the interviewer. II. The Investment Climate Regression Results The results of the IC analysis are consistent with the belief that greater international integration will serve Sri Lanka’s urban manufacturing sector well. In particular, the results suggest that better access to imported inputs, specialized skills embodied in foreign workers, and foreign investment would significantly raise the productivity of Sri Lankan firms and generate new investment. There is some evidence suggesting that labor regulations and institutions may be restricting the ability of firms to adjust their workforce in accordance with changes in product demand. To the extent that firms respond to such regulations and institutions by hiring more workers on a temporary basis, the data indicate that firms may be doing so at the expense of

URBAN MANUFACTURING SURVEY: TECHNICAL APPENDIX ON INVESTMENT CLIMATE AND FIRM PERFORMANCE
71
higher productivity. The IC data also indicate significant payoffs from streamlining regulations and reducing regulatory uncertainty. Key regression results are summarized below. International Integration: It is widely acknowledged that the degree of international integration is closely related to how conducive an investment climate is in fostering growth and productivity improvements. A number of channels operate in this direction. First, greater international integration means that firms will have better access to knowledge – disembodied and embodied. Second, greater integration also means more channels for financing investment. Finally, firms may be able to become more productive by exporting – for example, via “learning-by-exporting” or by reaping economies of scale made possible by the larger international market.3 The data from Sri Lankan firms bears out the benefits that international integration brings. International integration facilitates the acquisition of technology in Sri Lanka through two main channels: machinery and personnel. Over half of the sample entrepreneurs consider new machinery and equipment and hiring key personnel as the two most important sources for technological innovations. Those firms show a strong and positive effect of imported new capital goods on their productivity (table A4.2, row 1). Similarly firms with foreign professionals in their workforce are among the top performers in the country in terms of productivity (table A4.2, row 2).
In line with results from other countries, the IC survey shows that firms that have at least some foreign ownership and those that export are more productive (table A4.2, rows 3-4). Not surprisingly, having foreign ownership is also found to facilitate investments: firms with foreign ownership are more likely to invest in expanding productive capacity and have a higher investment rate (table A4.2, row 3). It is worth noting that while causality is difficult to establish, the positive association between exporting and productivity is consistent with the learning-by-exporting hypothesis. Labor Market Issues: Given the critical importance of labor in production, the functioning of labor markets can have a significant bearing on a country’s investment climate. Labor regulations are noted as a major or severe obstacle to operations and growth of firms by around 25% of the firms. This is confirmed by the fact that a similar number of firms express their desire to cut their labor force if they were free to do so. What aspects of labor regulations affect firms? The presence of unions and a dummy variable indicating excess labor of 10% or more were significantly and positively associated with the probability that a firm listed labor regulations as a severe problem.4 The latter suggests that legal constraints on firing/laying-off workers are a factor contributing to firms’ difficulties with labor regulations. Do these aspects of labor markets affect firm performance? The presence of a union is associated with lower sales growth and lower employment growth (table A4.2, row 5a) while having excess labor is associated with lower sales growth (table A4.2, row 5d). The latter is suggestive of an adverse impact of labor regulations on firm performance.5 Although unionization and excess labor are not found to affect productivity adversely, we do find that the larger the share of temporary workers in total employment, the lower is productivity

URBAN MANUFACTURING SURVEY: TECHNICAL APPENDIX ON INVESTMENT CLIMATE AND FIRM PERFORMANCE
72
(table A4.2, row 6). To the extent that firms respond to unionization and restrictions on layoffs by hiring temporary workers, this finding represents an adverse impact of labor regulations on productivity. The evidence is thus certainly consistent with the notion that Sri Lanka’s labor regulations have created an insider-outsider distinction among workers. Controlling for industry and education of the workforce, unionized firms do tend to pay more. Thus, labor institutions and regulations may benefit those already with jobs, but they do not help employment and they appear to dampen sales growth.6 Governance and Administrative Barriers: While our data suggest that corruption is not a particularly serious issue, this does not mean that there are no governance related issues holding back Sri Lanka’s investment climate. In particular, regulatory uncertainty is an important issue. If we take the difference between the maximum and the average number of days to clear exports as an index of uncertainty, the analysis clearly shows a significant and negative association between uncertainty and productivity. This is also true in the case of imports (table A4.2, row 7). In addition, our data suggest that there are gains to be had from streamlining regulations: Firms which report a higher share of senior management’s time being taken up in dealing with requirements imposed by government regulations are the ones who are less likely to make any significant investment in increasing productive capacity (table A4.2, row 8). Finance: Finance is yet another pressing constraint identified by entrepreneurs in Sri Lanka. Although both access and cost of finance are among the top bottlenecks, the ability to secure a loan seems the most pressing. As a matter of fact internal funds, in the form of retained earnings and equity, remain by and large the principal source of financing for Sri Lankan firms. Unfortunately the survey shows that being more productive is not translated in having easier access to bank loans (table A4.2, row 9c). Hence, while more productive firms need to resort to retained earnings for their investments, less productive firms must rely on their equity to finance new investments (table A4.2, rows 9a and 9g). The survey data suggests that banks appear to be unable to discriminate better performing loan applicants and rely more on the value of collateral when approving a loan application. In fact while only half of the sampled firms had a loan in 2002, almost all of them were required to provide a collateral in the form of fixed assets (land, buildings and machinery). Furthermore the average value of collateral required equals the loan value. Not surprisingly the probability of obtaining a loan is skewed toward large firms. Also financial constraints on firms do seem to be relaxed by FDI. Infrastructure: As noted in the main text of this report, entrepreneurs’ perception of IC bottlenecks start with complaints about electricity and transportation. The regression analysis confirms the negative impact of Sri Lanka’s poor infrastructure on firm performance. Only establishments using a generator (over ¾ of the sample and accounting for 13% of the total energy needs) show a significantly higher level of performance.7 On the contrary perception of unreliable power supply is not significantly related to firms’ productivity (table A4.3). Far from being an indicator of good infrastructure, the insignificance of the perception coefficient is justified by the ability of most establishments to protect against power outages and maintain their level of activity. Hence the insignificance of the negative perception of electricity delivery on productivity should not lead us to conclude that electricity is not a major constraint. Although in fact entrepreneurs can to a certain degree protect themselves against power outages, this

URBAN MANUFACTURING SURVEY: TECHNICAL APPENDIX ON INVESTMENT CLIMATE AND FIRM PERFORMANCE
73
phenomenon has an impact of the cost of production and hence on the international competitiveness of Sri Lankan firms. The second infrastructure related complaint identified by respondents is transport. The perception of poor transport facilities is negatively and significantly associated with productivity since entrepreneurs are unable to protect themselves. Firms in Sri Lanka have to maintain a minimum average of 30 days of raw material inventories and lose around 2% of the value of their sales due to delivery delays. This also puts local firms at a disadvantage if we consider that in a country as big as India firms hold half as many days as inventories. The IC data also show that various indicators for the state of the transportation infrastructure have an impact on firm performance. For example, having a paved road leading to the nearest urban center is significantly associated with higher sales growth. Similarly, a poor transportation infrastructure as reflected in a reporting of breakage, theft, and spoilage during shipment is associated with both significantly lower sales growth as well as lower employment growth.8 Regression Results Using All Key IC Measures Simultaneously: As a check on the robustness of our results, we also run our IC regressions by including simultaneously key IC measures as regressors. Despite the fact that there is a large reduction in sample size – by about a 100 firms –due to missing observations, the results retain the general flavor of those described above fairly well. In particular, as indicated in table A4.4, imported machinery and equipment continues to have a significant impact on productivity and several other measures of firm performance, unionization and excess labor continue to be associated with weak sales growth (and employment growth in the case of unionization), and a higher share of management time spent dealing with regulations are associated with lower probability of investing in new plant and equipment. Additionally, the pattern of estimates on the various educational-status regressors suggest that formal education at even a primary level is productivity enhancing (the omitted category being workers without even primary education) while the benefits of higher education kick in for firms which are expanding productive capacity by investing in new plant and equipment. What is the quantitative importance of these factors? Focusing on the IC variables which impact firm performance significantly in table A4.4, we can ask to what extent an “improvement” in each key IC variable translates into better firm performance. Improvements are represented by a one standard deviation increase (or decrease) in the IC variables. Consider the impact of a one standard deviation increase in the share of new imported capital goods on productivity due to easier access to imported inputs. The estimates of table A4.4 indicate that in the case of the L-P measure of TFP, for instance, productivity would increase by 3% for a firm with average productivity. Similarly, what would be the impact of streamlining regulatory requirements so that managers would have to spend less time on them? The investment probit results of table A4.4 indicate that a one standard deviation reduction in the time spent by a manager working in a firm with average attributes would result in an almost fourteen percentage point increase in the probability of investing in new plant and equipment. Of course, it may not be easy to drive down time spent complying with regulations by one standard deviation: a one standard deviation reduction would amount to almost negligible time spent dealing with regulations. While this may not be feasible at least some reduction should be possible and identifying the more cumbersome regulations would seem to hold promise for improving firm performance.

URBAN MANUFACTURING SURVEY: TECHNICAL APPENDIX ON INVESTMENT CLIMATE AND FIRM PERFORMANCE
74
Notes 1 For details, see, Levinsohn and Petrin (2003). 2 A measure of capacity utilization was also used. Its inclusion appeared to make no difference to the main results; however, it led
to a reduction in number of observations due to some missing values. As a result, this variable is not included as a control in the regressions reported here.
3 Greater international integration also means greater competition. Increased competition can in turn improve overall productivity by forcing domestic producers to choose between enhancing efficiency or losing market share.
4 The results of this regression are available upon demand. 5 Of course, association does not imply causation. This is especially relevant in interpreting the results of the excess labor
regression since even in the absence of any regulatory barriers to firing, an unforeseen reduction in sales (induced by a demand shock, for example) would typically lead to some “labor hoarding” by the firm. In other words, a firm may anticipate its sales to rebound in the future and so keep its workers on its employment rolls given that the search costs associated with hiring of workers are unlikely to be trivial. The firm would have excess labor, but it would be due to labor hoarding and not regulatory barriers to firing workers. While we cannot disentangle the relative strengths of the labor hoarding versus regulatory barrier channel in explaining our results, data from the services sector IC study are illuminating. In the questionnaire used there, firms were asked to list the various reasons for excess labor, if any, including labor regulations regarding hiring and firing, pressure from labor unions, and labor hoarding. Of the five hotels which report having excess labor (13% of the total sample), four report labor laws as a reason while three report labor hoarding as a reason. Clearly, both forces are in operation and the message we take is that at least a part of the negative association we find between sales growth and excess labor is likely to be driven by labor regulations.
6 Anecdotal evidence gathered during the pilot test of the IC survey shows that for some firms, it may not be so much the restriction on firing workers that is the key problem but instead the uncertainty associated with the costs of retrenchment. One respondent, for example, stressed that the lack of clarity in the computation of severance pay that workers were legally entitled to was a problem. In particular, since the respondent’s garment business is subject to uncertainty after the MFA system is phased out, the respondent has been interested in exploring other industries/activities. Not being able to work out exit costs therefore presents special difficulties for the firm.
7 Results are available upon demand. 8 Results are available upon demand.

URBA
N M
ANUF
ACTU
RING
SUR
VEY:
TEC
HNIC
AL A
PPEN
DIX
ON IN
VEST
MEN
T CL
IMAT
E AN
D FI
RM P
ERFO
RMAN
CE
75
T
able
A4.
2 In
vest
men
t Clim
ate
Reg
ress
ions
by
Maj
or T
opic
(1
) (2
) (3
) (4
) (5
) (6
) (7
)
Sale
s gro
wth
Em
ploy
men
t gr
owth
In
vest
men
t rat
e In
vest
men
t PR
OB
IT
Labo
r pro
duct
ivity
TF
P-LP
TF
P-O
LS
Inte
rnat
iona
l Int
egra
tion:
(1) I
mpo
rted
new
M&
E (a
vg.sh
are)
0.
147
0.06
2 0.
052
1.04
7 0.
963
0.65
3 0.
555
(3
.01)
***
(1.8
0)*
(2.2
6)**
(3
.85)
***
(4.4
3)**
* (3
.18)
***
(2.7
2)**
* O
bser
vatio
ns
301
305
299
299
310
310
310
R-s
quar
ed
0.08
0.
11
0.10
0.19
0.
19
0.08
(2
) For
eign
wor
kers
(dum
my)
-0
.037
-0
.010
0.
031
-0.0
10
0.60
3 0.
597
0.51
3
(0.6
1)
(0.2
7)
(0.9
8)
(0.0
3)
(2.0
0)**
(2
.05)
**
(1.7
0)*
Obs
erva
tions
29
8 30
3 29
6 29
6 30
7 30
7 30
7 R
-squ
ared
0.
06
0.10
0.
10
0.
19
0.20
0.
08
(3) F
DI (
dum
my)
0.
074
-0.0
02
0.03
9 0.
418
0.74
1 0.
566
0.41
1
(1.5
0)
(0.0
6)
(1.9
6)*
(1.8
1)*
(3.5
3)**
* (2
.82)
***
(2.0
4)**
O
bser
vatio
ns
302
306
300
300
311
311
311
R-s
quar
ed
0.06
0.
10
0.09
0.18
0.
19
0.07
(4
) Exp
orte
r (du
mm
y ba
sed
on in
form
atio
n on
whe
n fir
m st
arte
d ex
porti
ng)
0.08
2 -0
.004
0.
004
0.15
6 0.
541
0.46
3 0.
371
(2
.47)
**
(0.1
5)
(0.2
6)
(0.8
2)
(2.7
8)**
* (2
.65)
***
(2.1
5)**
O
bser
vatio
ns
302
306
300
300
311
311
311
R-s
quar
ed
0.07
0.
10
0.08
0.17
0.
19
0.07
La
bor M
arke
t Iss
ues:
(5a)
Uni
on (d
umm
y)
-0.0
92
-0.0
43
0.04
2 -0
.052
-0
.064
-0
.048
-0
.108
(2.4
0)**
(1
.88)
* (2
.03)
**
(0.2
1)
(0.3
0)
(0.2
3)
(0.5
2)
(5b)
Stri
ke (d
umm
y)
0.00
0 0.
002
-0.0
15
-0.1
47
0.32
0 0.
244
0.22
6
(0.0
0)
(0.0
5)
(0.6
0)
(0.5
1)
(1.0
9)
(0.8
7)
(0.8
3)
(5c)
Abs
ente
eism
(dum
my)
-0
.026
0.
026
0.00
0 -0
.281
-0
.253
-0
.206
-0
.119
(0.8
5)
(0.8
7)
(0.0
1)
(1.5
3)
(1.4
3)
(1.2
2)
(0.7
1)
(5d)
Exc
ess l
abor
(dum
my)
-0
.120
-0
.031
-0
.010
-0
.349
-0
.012
-0
.080
-0
.118
(2.2
6)**
(0
.77)
(0
.36)
(1
.02)
(0
.03)
(0
.25)
(0
.35)
O
bser
vatio
ns
302
306
300
300
311
311
311
R-s
quar
ed
0.08
0.
11
0.10
0.16
0.
17
0.06
(6
) Sha
re o
f tem
pora
ry w
orke
rs
-0.0
17
0.05
6 -0
.005
-0
.336
-1
.262
-1
.137
-1
.033
(0.2
2)
(1.1
4)
(0.0
9)
(0.5
8)
(2.4
1)**
(2
.41)
**
(2.2
2)**
O
bser
vatio
ns
302
306
300
300
311
311
311
R-s
quar
ed
0.05
0.
10
0.08
0.16
0.
18
0.07
G
over
nanc
e an
d A
dmin
istr
ativ
e B
arri
er:
(7
) Unc
erta
inty
at c
usto
ms:
Impo
rters
-0
.000
0.
001
-0.0
01
0.00
7 -0
.007
-0
.006
-0
.007
(0.5
0)
(1.4
1)
(2.0
8)**
(1
.06)
(3
.13)
***
(3.1
6)**
* (3
.06)
***
Obs
erva
tions
16
7 16
8 16
8 16
8 17
0 17
0 17
0 R
-squ
ared
0.
10
0.15
0.
07
0.
18
0.14
0.
12
(8) P
erce
nt ti
me
with
gov
t. ad
min
istra
tors
0.
177
-0.2
78
-0.1
05
-6.1
59
-2.1
06
-1.4
96
-1.9
86
(0
.41)
(1
.16)
(0
.64)
(2
.66)
***
(1.2
0)
(0.9
0)
(1.1
6)
Obs
erva
tions
30
1 30
5 29
9 29
9 31
0 31
0 31
0 R
-squ
ared
0.
05
0.10
0.
08
0.
15
0.17
0.
06

URBA
N M
ANUF
ACTU
RING
SUR
VEY:
TEC
HNIC
AL A
PPEN
DIX
ON IN
VEST
MEN
T CL
IMAT
E AN
D FI
RM P
ERFO
RMAN
CE
76
(1
) (2
) (3
) (4
) (5
) (6
) (7
)
Sale
s gro
wth
Em
ploy
men
t gr
owth
In
vest
men
t rat
e In
vest
men
t PR
OB
IT
Labo
r pro
duct
ivity
TF
P-LP
TF
P-O
LS
Fin
ance
:
(9a)
Ret
. ear
ning
s (du
mm
y)
0.02
7 -0
.014
-0
.037
-0
.011
0.
531
0.48
3 0.
540
(0
.57)
(0
.33)
(1
.57)
(0
.04)
(2
.24)
**
(2.2
8)**
(2
.55)
**
(9b)
Tra
de c
redi
t (du
mm
y)
-0.1
43
-0.0
54
-0.0
55
-0.3
94
-0.7
33
-0.6
16
-0.5
10
(2
.28)
**
(1.1
0)
(1.6
0)
(0.8
7)
(1.6
3)
(1.3
9)
(1.2
0)
(9c)
Ban
k lo
ans (
dum
my)
0.
053
0.09
7 0.
031
0.44
3 0.
065
-0.1
83
-0.2
27
(1
.25)
(2
.56)
**
(1.2
8)
(1.7
6)*
(0.2
4)
(0.7
6)
(0.9
6)
(9d)
Lea
sing
(dum
my)
0.
030
0.11
1 0.
002
0.31
2 0.
352
0.33
8 0.
218
(0
.45)
(1
.15)
(0
.05)
(0
.84)
(1
.27)
(1
.37)
(0
.93)
(9
e) S
tate
fund
s (du
mm
y)
0.01
8 0.
003
0.02
9 -0
.583
0.
136
0.19
2 0.
231
(0
.29)
(0
.05)
(0
.67)
(1
.24)
(0
.52)
(0
.76)
(0
.76)
(9
f) C
redi
t car
d (d
umm
y)
-0.1
58
-0.0
69
0.31
8 -1
.050
0.
171
0.03
0 0.
146
(1
.07)
(1
.01)
(1
.31)
(1
.21)
(0
.32)
(0
.05)
(0
.22)
(9
g) E
quity
(dum
my)
0.
035
-0.0
27
-0.0
73
0.07
5 -0
.805
-0
.936
-0
.901
(0.5
2)
(0.3
1)
(1.8
4)*
(0.1
4)
(2.8
4)**
* (3
.53)
***
(3.2
7)**
* (9
h) F
amily
(dum
my)
0.
120
-0.0
04
-0.0
45
0.39
0 0.
136
0.39
5 0.
327
(0
.52)
(0
.06)
(0
.41)
(0
.55)
(0
.26)
(0
.87)
(0
.74)
(9
i) In
form
al s.
(dum
my)
-0
.236
-0
.053
0.
090
-1
.277
-1
.023
-0
.834
(1.5
6)
(0.7
5)
(1.0
0)
(1
.19)
(1
.02)
(0
.88)
O
bser
vatio
ns
199
201
196
193
202
202
202
R-s
quar
ed
0.11
0.
14
0.22
0.20
0.
20
0.15
Abs
olut
e va
lue
of t
stat
istic
s in
pare
nthe
ses
*
sign
ifica
nt a
t 10%
; **
sign
ifica
nt a
t 5%
; ***
sign
ifica
nt a
t 1%
N
ote:
Ea
ch c
ell r
epre
sent
s a se
para
te re
gres
sion
, usi
ng fi
rm a
nd in
dust
ry c
ontro
ls w
hich
are
not
show
n he
re. T
he a
dditi
onal
con
trol v
aria
bles
und
er e
ach
perf
orm
ance
indi
cato
r are
: sal
es
grow
th -
initi
al sa
les;
em
ploy
men
t gro
wth
- in
itial
em
ploy
men
t; in
vest
men
t rat
e/pr
obit
- ini
tial f
ixed
cap
ital;
labo
r pro
duct
ivity
and
TFP
- fir
m si
ze d
umm
y va
riabl
es.

URBA
N M
ANUF
ACTU
RING
SUR
VEY:
TEC
HNIC
AL A
PPEN
DIX
ON IN
VEST
MEN
T CL
IMAT
E AN
D FI
RM P
ERFO
RMAN
CE
77
Tab
le A
4.3
Perc
eptio
n on
IC V
aria
bles
(dum
my
1= m
ajor
or
seve
re p
robl
em)
(1)
(2)
(3)
(4)
(5)
(6)
(7)
Sa
les g
row
th
Empl
oym
ent
grow
th
Inve
stm
ent r
ate
Inve
stm
ent
PRO
BIT
La
bor p
rodu
ctiv
ity
TFP-
LP
TFP-
OLS
Tele
com
2.
321
0.34
3 3.
170
68.7
24
11.1
35
14.0
47
7.84
0
(2.1
9)**
(0
.61)
(7
.19)
***
(16.
63)*
**
(1.2
1)
(1.9
8)**
(1
.12)
El
ectri
city
-1
.747
0.
034
-2.7
60
-60.
533
1.58
9 -1
.782
1.
644
(1
.86)
* (0
.08)
(8
.10)
***
(.)
(0.1
8)
(0.2
8)
(0.2
5)
Tran
spor
t -0
.049
0.
254
-0.0
00
1.99
1 -4
.691
-5
.777
-6
.072
(0.1
0)
(0.9
4)
(0.0
0)
(0.2
9)
(1.1
2)
(1.7
6)*
(1.9
3)*
Tax
rate
s 2.
220
0.76
8 1.
641
36.5
16
7.03
3 8.
963
4.89
9
(3.2
0)**
* (2
.32)
**
(6.6
7)**
* (.)
(1
.32)
(2
.15)
**
(1.1
9)
Tax
adm
inis
tratio
n 1.
249
0.06
8 2.
466
49.8
75
-4.7
05
-2.3
83
-8.8
36
(0
.89)
(0
.09)
(4
.58)
***
(.)
(0.3
8)
(0.2
5)
(0.9
4)
Labo
r reg
ulat
ions
0.
916
-0.9
25
0.78
8 -3
1.03
8 13
.864
13
.424
10
.295
(1.2
0)
(2.1
5)**
(2
.09)
**
(.)
(2.8
6)**
* (3
.26)
***
(2.5
3)**
Sk
ills
0.76
1 1.
378
1.62
0 73
.295
-8
.552
-4
.666
-5
.652
(0.9
1)
(3.0
9)**
* (4
.53)
***
(15.
60)*
**
(1.1
5)
(0.7
9)
(1.0
0)
Acc
ess t
o fin
ance
-2
.514
-0
.975
-1
.683
-4
3.30
3 -1
2.43
5 -1
3.45
0 -8
.770
(2.9
1)**
* (2
.29)
**
(5.5
1)**
* (.)
(2
.26)
**
(2.8
9)**
* (1
.91)
* C
ost o
f fin
ance
-0
.280
-0
.815
-0
.711
-6
.722
8.
120
5.78
7 7.
776
(0
.62)
(3
.90)
***
(4.3
6)**
* (2
.62)
***
(2.3
3)**
(2
.18)
**
(2.9
0)**
* Po
licy
unce
rtain
ty
1.70
8 0.
528
1.72
2 44
.310
3.
064
6.22
5 4.
530
(1
.27)
(1
.28)
(3
.31)
***
(.)
(0.5
5)
(1.3
0)
(0.9
8)
Mac
ro in
stab
ility
-0
.776
0.
458
0.18
0 15
.603
-2
.512
-1
.600
-2
.306
(1.2
3)
(1.6
5)*
(0.7
7)
(.)
(0.6
5)
(0.4
9)
(0.7
3)
Cor
rupt
ion
-2.6
75
0.19
2 -2
.954
-5
7.99
1 -2
.911
-3
.004
4.
023
(1
.86)
* (0
.26)
(5
.54)
***
(8.2
1)**
* (0
.23)
(0
.31)
(0
.42)
A
nti c
ompe
titiv
e pr
actic
es
-0.6
90
-1.3
21
0.43
0 14
.027
-5
.194
-6
.363
-7
.017
(0.9
0)
(3.6
9)**
* (1
.42)
(3
.11)
***
(1.2
5)
(1.6
1)
(1.8
4)*
Obs
erva
tions
29
5 29
9 29
3 27
0 30
2 30
2 30
2 R
-squ
ared
0.
32
0.51
0.
40
0.
43
0.44
0.
35
Not
e: C
ontro
ls in
clud
ed b
ut n
ot sh
own
are:
(a) a
vera
ge p
erce
ptio
n in
loca
tion
of fi
rm, (
b) e
duca
tion
leve
l of r
espo
nden
t, (c
) int
ervi
ewer
dum
my,
and
(d) s
ize.
The
add
ition
al c
ontro
l va
riabl
es u
nder
eac
h pe
rfor
man
ce in
dica
tor a
re: s
ales
gro
wth
- in
itial
sale
s; e
mpl
oym
ent g
row
th -
initi
al e
mpl
oym
ent;
inve
stm
ent r
ate/
prob
it - i
nitia
l fix
ed c
apita
l; la
bor p
rodu
ctiv
ity a
nd
TFP
- firm
size
dum
my
varia
bles
.

URBA
N M
ANUF
ACTU
RING
SUR
VEY:
TEC
HNIC
AL A
PPEN
DIX
ON IN
VEST
MEN
T CL
IMAT
E AN
D FI
RM P
ERFO
RMAN
CE
78
Tab
le A
4.4
Key
Non
-per
cept
ion
Bas
ed IC
Mea
sure
s (in
clud
ed si
mul
tane
ousl
y)
(1)
(2)
(3)
(4)
(5)
(6)
(7)
Sa
les g
row
th
Empl
oym
ent
grow
th
Inve
stm
ent r
ate
Inve
stm
ent
PRO
BIT
La
bor p
rodu
ctiv
ity
TFP-
LP
TFP-
OLS
Impo
rted
new
M&
E (a
vg.sh
are)
0.
111
0.04
0 0.
056
1.43
8 1.
014
0.64
5 0.
502
(1
.97)
**
(0.6
6)
(1.6
3)
(3.7
6)**
* (3
.85)
***
(2.6
0)**
(1
.99)
**
Fore
ign
wor
kers
(dum
my)
-0
.016
-0
.006
0.
012
-0.2
46
0.06
0 0.
006
-0.0
57
(0
.23)
(0
.15)
(0
.34)
(0
.60)
(0
.18)
(0
.02)
(0
.16)
FD
I (du
mm
y)
0.05
6 -0
.001
0.
014
0.08
5 0.
195
0.09
6 0.
068
(1
.06)
(0
.04)
(0
.61)
(0
.27)
(0
.78)
(0
.41)
(0
.28)
Ex
porte
r (du
mm
y ba
sed
on
info
rmat
ion
on w
hen
firm
star
ted
expo
rting
) 0.
048
0.02
2 -0
.015
-0
.103
0.
292
0.29
5 0.
226
(1
.05)
(0
.61)
(0
.72)
(0
.38)
(1
.45)
(1
.52)
(1
.18)
U
nion
(dum
my)
-0
.085
-0
.078
0.
010
-0.0
54
-0.0
34
-0.0
56
-0.1
18
(1
.66)
* (2
.71)
***
(0.4
6)
(0.1
9)
(0.1
6)
(0.2
6)
(0.5
1)
Exce
ss la
bor (
dum
my)
-0
.152
-0
.082
0.
026
0.03
1 -0
.376
-0
.464
-0
.489
(1.8
7)*
(1.5
1)
(0.8
0)
(0.0
8)
(0.8
0)
(1.1
9)
(1.1
9)
Shar
e of
tem
pora
ry w
orke
rs
0.13
0 0.
146
0.02
7 -0
.210
-1
.087
-0
.858
-0
.590
(0.8
4)
(1.5
4)
(0.2
6)
(0.2
4)
(1.4
6)
(1.2
5)
(0.8
4)
Elem
enta
ry: 6
-9 y
rs. (
shar
e of
w
orke
rs)
0.00
1 -0
.000
0.
001
0.00
5 0.
009
0.01
2 0.
011
(1
.81)
* (0
.64)
(1
.12)
(0
.96)
(2
.21)
**
(2.8
0)**
* (2
.73)
***
Mid
dle
scho
ol:1
0-13
yrs
. (sh
are
of
wor
kers
) 0.
002
0.00
0 0.
000
0.00
6 0.
012
0.01
5 0.
013
(2
.06)
**
(0.5
2)
(1.1
6)
(1.1
7)
(3.2
5)**
* (3
.89)
***
(3.5
2)**
* U
nive
rsity
: mor
e th
an 1
3 ye
ars
(sha
re o
f wor
kers
) 0.
001
-0.0
01
0.00
4 0.
028
0.01
3 0.
011
0.01
0
(0
.57)
(0
.59)
(4
.19)
***
(2.3
8)**
(0
.94)
(0
.97)
(0
.90)
Pe
rcen
t tim
e w
ith g
ovt.
adm
inis
trato
rs
-0.2
35
-0.5
38
-0.2
80
-9.0
06
-0.2
95
-0.3
35
-1.3
51
(0
.57)
(1
.34)
(1
.57)
(3
.13)
***
(0.1
6)
(0.1
8)
(0.6
8)
Ret
. ear
ning
s (du
mm
y)
-0.0
20
-0.0
57
-0.0
46
-0.4
61
0.18
9 0.
162
0.28
6
(0.3
3)
(1.3
2)
(1.5
3)
(1.5
9)
(1.0
1)
(0.8
9)
(1.4
7)
Trad
e cr
edit
(dum
my)
-0
.069
-0
.034
-0
.037
-0
.225
-0
.335
-0
.254
-0
.194
(1.0
9)
(0.5
7)
(1.0
6)
(0.4
6)
(0.8
4)
(0.6
6)
(0.5
0)
Ban
k lo
ans (
dum
my)
0.
021
0.09
0 0.
039
0.46
1 -0
.221
-0
.431
-0
.435
(0.4
8)
(1.9
4)*
(1.1
8)
(1.7
3)*
(0.8
9)
(1.8
8)*
(1.8
9)*
Equi
ty (d
umm
y)
-0.0
50
-0.0
34
-0.0
15
0.26
5 -0
.878
-1
.050
-1
.030
(0.8
0)
(0.4
8)
(0.6
3)
(0.5
4)
(2.4
4)**
(3
.05)
***
(2.9
0)**
* Fi
rm’s
age
(log
) -0
.016
-0
.019
-0
.018
-0
.187
-0
.006
0.
030
0.02
2
(0.6
8)
(1.3
7)
(1.6
7)*
(1.4
0)
(0.0
6)
(0.3
2)
(0.2
2)
Initi
al re
al sa
les (
log)
-0
.039
(2.9
3)**
*
G
arm
ents
-0
.087
-0
.074
0.
057
0.74
3 -1
.115
-0
.814
-0
.442
(1.0
3)
(1.1
7)
(1.6
4)
(1.9
0)*
(2.9
0)**
* (2
.19)
**
(1.1
8)
Text
ile
-0.0
59
-0.0
51
0.02
1 0.
392
-0.9
67
-0.8
18
0.03
9
(0.6
6)
(0.5
9)
(0.5
1)
(1.0
4)
(2.4
9)**
(2
.07)
**
(0.1
0)

URBA
N M
ANUF
ACTU
RING
SUR
VEY:
TEC
HNIC
AL A
PPEN
DIX
ON IN
VEST
MEN
T CL
IMAT
E AN
D FI
RM P
ERFO
RMAN
CE
79
(1
) (2
) (3
) (4
) (5
) (6
) (7
)
Sale
s gro
wth
Em
ploy
men
t gr
owth
In
vest
men
t rat
e In
vest
men
t PR
OB
IT
Labo
r pro
duct
ivity
TF
P-LP
TF
P-O
LS
Food
& B
ever
ages
-0
.064
-0
.009
0.
027
0.52
7 -0
.036
0.
031
0.45
0
(0.8
6)
(0.1
6)
(1.0
0)
(1.4
4)
(0.0
8)
(0.0
8)
(1.0
8)
Indu
stria
l equ
ip.
-0.0
78
-0.0
11
-0
.084
(0
.89)
(0
.15)
(0.1
7)
G
reat
er C
olom
bo
-0.0
64
0.01
0 -0
.000
0.
176
0.32
6 0.
255
0.19
0
(1.0
2)
(0.3
8)
(0.0
2)
(0.5
1)
(1.2
9)
(1.0
5)
(0.7
8)
Initi
al w
orkf
orce
(log
)
-0.0
22
(1
.24)
Rub
ber p
rodu
cts
-0.0
05
-0
.336
-0
.274
0.
029
(0
.19)
(0.8
1)
(0.6
3)
(0.0
7)
Size
= M
ediu
m
-0.3
95
-0.1
92
-0.3
15
(1
.62)
(0
.78)
(1
.22)
Si
ze =
Lar
ge
-0.7
73
-0.1
26
-0.4
92
(2
.78)
***
(0.4
3)
(1.6
5)*
Initi
al fi
xed
capi
tal (
log)
-0
.034
-0
.224
(3
.85)
***
(3.0
2)**
*
Obs
erva
tions
19
3 19
5 19
0 19
0 19
7 19
7 19
7 R
-squ
ared
0.
18
0.17
0.
24
0.
37
0.36
0.
27
Abs
olut
e va
lue
of t
stat
istic
s in
pare
nthe
ses
*
sign
ifica
nt a
t 10%
; **
sign
ifica
nt a
t 5%
; ***
sign
ifica
nt a
t 1%

80
APPENDIX 5
RURAL SURVEY: TECHNICAL APPENDIX ON INVESTMENT CLIMATE, FIRM PERFORMANCE, AND START-UP How does the investment climate affect enterprise start-up?
To analyze this question the effect of the prevailing investment climate on the probability of rural households establishing a non-farm enterprise is estimated. From a policy point of view, it is important to identify the key barriers to enterprise start-up so as to reduce or ease these constraints and thereby facilitate the growth of the rural non-farm economy. The rural IC survey collected data on both households that had just established new non-farm enterprises as well as on those that did not operate any non-farm enterprises, enabling an analysis of the IC on enterprise start-up.
To identify obstacles to the startup of a rural non-farm enterprise and examine the magnitude of the impact of each of the constraints, a probit model is specified:
Z = α0 + α1 (H)+ α2 (C)+ α3 (IC) + α4 (D) + ε (1) In this model, the left hand side variable, Z, is a dummy variable that equals 1 for a household that has recently started a new non-farm enterprise and 0 for a household that does not operate any non-farm enterprises.i H is a vector of household characteristics that could potentially affect a household’s economic decision. This vector includes the household head’s age, maximum education attained by any household members, household size, land endowment, wealth and household access to informal borrowing, and a dummy variable representing whether or not the household head’s parents operated a non-farm enterprise. C is a vector of community characteristics, including distance to a bank, the time taken from the community to the main market, the share of paddy land in total cultivated land and a dummy variable for agriculture as the main source of income in the community. IC is a vector of community level investment climate indicators.
Rural enterprises were asked to rank the various business constraints they faced and identify the most important overall constraint. To construct an indicator of the IC in a rural community the perceptions of individual entrepreneurs in a community were aggregated and the constraint that was most frequently identified as being the most serious obstacle facing businesses in that community was identified as the most important overall constraint for the community. In this manner a series of dummy variables were created at the community level for the various investment climate constraints. If more than one constraint was identified as the most important overall problem by equal shares of entrepreneurs, both constraints were assigned a value of 1, the others are assigned to 0. The investment climate constraints in the vector IC include electricity, road access, road quality, cost of financing, bureaucracy of financing, market information access, market demand, availability of transportation facility, telecommunication service and water supply. This set of variables virtually exhausts the list of the most important overall constraints reported by the enterprises. Finally, a vector of provincial dummy variables D is included to control for regional differences. The estimation sample includes all households that did not operate a non-farm enterprise and households with enterprises that were less than 2 years old. The results of this regression are show in table A5.1. Column 2 includes a larger set of IC indicators as compared to Column 1.

RURAL SURVEY: TECHNICAL APPENDIX ON INVESTMENT CLIMATE, FIRM PERFORMANCE AND START-UP
81
Does the availability of public goods and a better investment climate result in more investment by existing enterprises?
While it is interesting to investigate the effect of the rural investment climate on the startup of new enterprises, it is equally important to analyze the impact of the current rural investment climate in Sri Lanka on the investments and performance of existing enterprises. This is also relevant to the prevailing debate as to whether the government should do more to encourage startups or pay more attention to fostering the growth of existing non-farm enterprises or do something to help both startups and existing enterprises.
To examine the impact of the rural investment climate on new investments the probability that existing enterprises make a new investment as well as the effect of the IC on the magnitude of investments is analyzed. A probit model is used to analyze the effect of the IC on the probability of making any new investment and a tobit model is used to analyze the effect on the magnitude of investments. The probit model is very similar to the probit model for the startup analysis (equation 1). The only difference is that now Z stands for the investment decision, 1 for the enterprises who made any new investments in 2003, and 0 for the others. H is now a vector of enterprise characteristics that includes size, industry type, and age of the enterprises, and a set of variables reflecting the characteristics of the top managers (including maximum education level, gender, years of experience and ethnicity). IC and D stand for the same set of variables that are used in the startup analysis. The only difference is that since the sample is now restricted to enterprises that are at least one year old, the individual rankings of the enterprises are included in the regressions without aggregating to the community level. A separate set of regressions is also run where the IC variables are aggregated to the community level to try to control for the endogeneity of individual perceptions. The only difference in the tobit specification is that the dependent variable Z is a continuous variable representing the value of new investments actually made in 2003. These results are summarized in table A5.2. Does a better investment climate affect firm performance?
To examine how different elements of the investment climate affect performance in terms of partial labor productivity (sales per worker or value added per worker) and total factor productivity (TFP), a reduced form equation is specified as follows:
Y = β0 + β1 (E) + β2 (C) + β3 (IC) + β4 (D) + η (2) Y represents value added per worker or TFP (all in log terms). E is a vector of enterprise characteristics including age, type, log of the number of employees. C is a vector of community characteristics that are likely to affect the efficiency of non-farm enterprises operations. IC is the same vector of IC constraints as in the previous regressions. And finally D is the vector of provincial dummy variables. Ordinary Least Squares (OLS), correcting for clustering, is used to estimate equation (2). TFP is estimated using a production function approach. In the relevant literature, both total output (total sales adjusted for inventory changes over two periods) ii and value added are used as measures of enterprise’s production in the production function equation. A typical Cobb-Douglass production function (when value added is used) can be expressed as: iii
lnY = γ0 + γ1 (lnL)+ γ2 (lnK)+ γ3 (E) + γ4 (D) + µ (3) Where lnY is value added in 2003 (in log term). lnL is the total number of workers in 2003, lnK is the value of all the fixed assets, both are measured in log term; E is enterprise characteristics include age and type, and vector D include all the provincial dummy variables. Total factor productivity is calculated as the difference between the real total value added (or real total output) and the predicted value added (or predicted total output) based on the estimated parameters of

RURAL SURVEY: TECHNICAL APPENDIX ON INVESTMENT CLIMATE, FIRM PERFORMANCE AND START-UP
82
equation (3). Tables A5.3 and A5.4 display the regression results. Table A5.5 shows estimates of the Cobb-Douglas production function.
Rural Investment Climate Regression Results The Rural Investment Climate and Rural Enterprise Performance
Entrepreneurs are most likely to invest in their businesses if they see favorable prospects for future growth and higher profits. Whether or not they make investments depends on a host of factors including their access to capital, their perceptions of consumer demand for the goods and services they produce, and whether they can conveniently hire workers with the skills they need. They also include perceptions of how government policies and regulations affect their bottom line and if the infrastructure that they have access to will support their needs.
Analysis of data from the rural survey indicate that many firm characteristics in terms of their size and composition and the skills of the management are important determinants of whether they make new investments. But in addition to these traits, the prevailing investment climate has a pronounced impact on the decision of entrepreneurs to make investments and influences the size of the investments that they make. Compared to the enterprises who just started in 2002, older enterprises (those in the age groups 2-5 years, 5-10 years and more than 10 years) are less likely to invest and tend to invest a smaller amounts (table A5.2)1. For example, an enterprise between five to ten years age is 17 percent less likely to make a new investment compared to an enterprise that is less than two years old. Compared to enterprises that have one or two workers, those with more than five workers are 11 percent more likely to make a new investment although the amount of investment is not significantly different. As expected, household-based enterprises are significantly less likely to make new investments and they also tend to invest significantly less than stand-alone enterprises. Among all the characteristics of the top manager, years of experience is the only variable that matters in terms of whether or not they make a new investment; an enterprise whose top manager has more relevant experience is more likely to invest and make a larger investment.
Among the variables included in the analysis to measure different dimensions of the investment climate, electricity, transport, road quality, water supply and marketing all comes out as important determinations of the whether or not firms invest. Enterprises that perceived electricity as being the most important overall constraint were 10 percent less likely to have made a new investment in the previous 12 months and the size of their investments were significantly smaller. Similarly, the perception of poor road quality and a lack of market information being the most important overall constraint reduced the probability of rural enterprises making a new investment by 11 percent and 17 percent, respectively. Although only a small proportion of businesses reported water as being the most important overall constraint, firms that perceived major problems with water supply were significantly less likely (12 percent) to make a new investment. High interest rates or high transactions costs on loans also reduced the amount invested.
Consistent with the effect of perceived road access and quality constraints on new investments, an enterprise located in a community where the most common road surface was mud is 7 percent less likely to invest compared to an enterprise located in a community with gravel and asphalt roads. Although the type of roads is only marginally significant, the size of the investments made by enterprises in communities with mud roads is significantly less than those made by enterprises in communities with gravel or asphalt roads. Other significant predictors of whether or not firms make new investments include the time it takes to reach the closest commercial center and the amount of capital available to the enterprise from informal sources. Entrepreneurs that can borrow more money from informal sources tends to invest a larger amount.
RURAL SURVEY: TECHNICAL APPENDIX ON INVESTMENT CLIMATE, FIRM PERFORMANCE AND START-UP
83
As the perceptions of individual entrepreneurs may be endogenous, it is possible that the results of the analysis of the investment climate perceptions on investments may be biased. In order to see whether the same conclusions hold if endogeneity issues are controlled, data on the perceived business obstacles are aggregated to the community level and the analysis is repeated with the community level perceptions of the overall business environment. Interestingly the results are very consistent with those obtained using the perceptions of individual entrepreneurs. The two most noticeable differences are: (1) the perceived telecommunication, loan procedure and low market demand problems that were not significant in the analysis with the enterprise level perceptions become significant when community level perceptions are introduced; and (2) the coefficients of the perceived constraints are all much bigger than the earlier results. For example, the coefficient for the electricity (road access) changes from -0.102 to -0.499 (-0.114 to -0.669). This is not surprising given the fact that now the perceived problem is the problem at the community level as opposed to the perception of individual entrepreneurs. To interpret the coefficients of the aggregated perceived constraints, -0.499 implies that an enterprise is 50 percent less likely to invest if it is located in a community where electricity is perceived as the most important problem by the majority of entrepreneurs as compared to if it were located in a community where electricity is not perceived as the most important overall constraint.
An analysis disaggregated by sector reveals that firms are affected in different ways depending on the nature of their business activities. For example while electricity was negatively and significantly correlated with the probability of a production related enterprise making a new investment, it did not have a significant impact on trading and service related enterprises. Rural production enterprises that rated electricity as the number one problem they face were 9 percent less likely to make a new investment as compared to production enterprises who felt that other problems overshadowed poor electricity supply. Production related enterprises that identified poor market demand or lack of market information as major problems were 11 percent and 14 percent less likely to make new investments, respectively. Interestingly, the only IC constraint that comes up significant for trading establishments is lack of market information. Traders who rate lack of market information as the most important problem were 14 percent less likely to make a new investment compared to traders for whom other problems loomed larger.
What affects a rural enterprise overall performance in Sri Lanka? Our analysis once again yields some very interesting insights. First, as to be expected, the individual characteristics of rural enterprises such as the experience of managers, the capital intensity of the firms (as measured by its fixed asserts) and the type of firm are significant determinants of productivity as measured by labor productivity (value added per worker) as well as TFP. Not surprisingly, the investment climate also matters.
Trading enterprises have significantly higher labor productivity than the production enterprises, but there is no difference in TFP across industry types. Similarly, labor productivity is significantly higher for stand-alone enterprises than household-based enterprises, but TFP is not significantly different. To a large extent, these results are consistent because standalone enterprises also employ more fixed assets than household-based enterprises and likewise, production enterprises utilize more fixed assets than traders. However, enterprises with more informal borrowing capacity and with more experienced and educated managers tend to have both higher labor productivity and TFP.
Having access to and using electricity from the grid is associated with a TFP that is 25 percent higher than that of firms not connected to the grid, ceterius paribus. Owning a fixed line or mobile phone, cheaper public transportation costs to the nearest commercial center, the efficiency of the financial sector (as measured by the time taken to clear a check) and access to finance (proxied by the amount that can be borrowed from informal sources) are all significantly

RURAL SURVEY: TECHNICAL APPENDIX ON INVESTMENT CLIMATE, FIRM PERFORMANCE AND START-UP
84
associated with a higher TFP. Owning a fixed line or mobile phone is associated with a 33 percent higher TFP. Enterprises that have access to more efficient financial services had a TFP that was 6 percent higher than firms that had to deal with inefficient financial institutions.
In addition to the objective indicators of the prevailing IC, the rural productivity analysis included variables on the perception of entrepreneurs regarding the most important investment climate obstacles faced by them. Although the variables representing perceptions of firms on the most important obstacles are subjective indicators, they provide a relative ranking of the problems faced by different firms and capture other dimensions of access to infrastructure, markets and governance (for example the quality of infrastructure services) that are not reflected in the more objective measures included in the analysis. Perceived problems with electricity, road access, transportation facilities, financing cost and loan procedures, marketing information and low market demand all significantly reduce an enterprise’s total factor productivity and labor productivity. It is interesting to note that the magnitude of the impact of the perceived overall constraints on labor productivity and total factor productivity is very similar.
The perception that electricity was the most important overall constraint was associated with a 35 percent lower TFP. Similarly poor road quality reduced the level of TFP by 44 percent. When the cost of financing and market demand are perceived as the most important overall constraints they reduce the level of TFP by 43 percent to 53 percent, respectively. Finally, bureaucratic loan procedures and lack of market information also tend to reduce the level of labor productivity and TFP quite considerably however the former is only barely significant at the 10 percent level.
Not only does the IC affect the performance of existing enterprises in terms of the investments they make and productivity, but the prevailing climate has a significant impact on whether rural households set-up new enterprises. An analysis of enterprise start-up reveals that enterprises are less likely to be established in communities where access to formal finance sources is limited (as measured by the distance from a community to a bank) and where registration processes are cumbersome (days taken to register an enterprise). On the other hand, households with a large pool of labor and where the family has had prior experience with operating a non-farm enterprise before (as reflected by whether the parents of the household head operated a non-farm business) are more likely to engage in a non-farm enterprise.
Being located in a community where electricity is perceived as the most important overall constraint reduces the probability of a household setting up a new enterprise by 18 percent.
Similarly, perceptions of low market demand reduces the probability of a non-enterprise household starting up a new enterprise by around 10 percent. Road access, road quality and cost of financing also played a very significant role in determining startup. The probability of a household starting up a business in a community where the cost of financing is viewed as the most important constraint is 6 percent lower than in a community where the cost of financing is not identified as the most important problem. The results also indicate that being located in a community with a larger share of paddy land tends to reduce the probability of individual households starting up a non-farm enterprise. This finding is consistent with the hypothesis that heavy regulation designed to protect paddy production is detrimental to the development of non-farm business opportunities.
Notes 1 Since our focus is to analyze expansion of existing enterprises, we exclude any enterprises that started a business operation in 2003. Therefore, enterprises started in 2002 will be the youngest group of the entire sample.

RURAL SURVEY: TECHNICAL APPENDIX ON INVESTMENT CLIMATE, FIRM PERFORMANCE AND START-UP
85
Table A5.1 Determinants of Starting Up a Non-farm Establishment (1) (2)
Minimum distance to any formal bank -0.013*** (2.59)
-0.012** (2.36)
Maximum amount that can be borrowed from informal sources (log) 0.007 (1.35)
0.008 (1.58)
Head’s age -0.051 (1.27)
-0.055 (1.41)
Maximum level of education attained by any household member 0.000 (0.13)
0.001 (0.24)
Number of household members with age between 14 and 65 0.027*** (3.57)
0.026*** (3.55)
Time taken by the main means of transportation to the main market now (minutes)
-0.000 (0.44)
-0.000 (0.43)
Days taken to complete a registration process in your community -0.001** (2.01)
-0.001** (2.07)
Parents operated non-farm business in the main part of their life 0.071** (2.29)
0.069** (2.31)
Household wealth (sum of durable and household values 12 months ago, in log term)
0.016* (1.75)
0.016* (1.77)
Per capita total cultivated land owned by household -0.039 (1.31)
-0.039 (1.37)
Share of paddy land of total cultivated land -0.073* (1.79)
-0.074* (1.90)
Agriculture as the main income source in the community -0.009 (0.38)
-0.001 (0.03)
Electricity as most important overall constraint -0.173*** (6.93)
-0.183*** (7.09)
Road access as most important overall constraint -0.059*** (2.74)
-0.067*** (3.24)
Road quality as most important overall constraint -0.057* (1.85)
-0.063** (2.33)
High interest or transaction cost of loan as most important overall constraint -0.058** (2.46)
-0.063*** (2.94)
Loan procedures as most important overall constraint -0.025 (0.57)
-0.035 (0.89)
Lack of market info as most important overall constraint 0.030 (0.47)
-0.002 (0.03)
Low market demand as most important overall constraint -0.092*** (4.47)
-0.096*** (4.73)
Telecommunication as most important overall constraint -0.053* (1.70)
Water supply as most important overall constraint -0.037 (1.30)
Transportation facility as most important overall constraint -0.021 (0.47)
Central Province -0.065** (2.31)
-0.066** (2.50)
Southern province 0.031 (0.82)
0.035 (0.97)
North West -0.015 (0.45)
-0.020 (0.65)
North Central 0.029 (0.49)
0.019 (0.34)
UVA -0.042 (1.08)
-0.044 (1.27)
Sabaragamuwa 0.022 (0.52)
0.017 (0.42)
North & East Province -0.005 (0.13)
-0.013 (0.34)
Observations 517 517 Pseudo R-squared 0.25 0.25 Log likelihood -158.77 -157.01 Robust z statistics in parentheses
* significant at 10%; ** significant at 5%; *** significant at 1%

RURAL SURVEY: TECHNICAL APPENDIX ON INVESTMENT CLIMATE, FIRM PERFORMANCE AND START-UP
86
Table A5.2 Determinants of New Investment Overall constraints based on perception of
individual enterprises Overall constraints aggregated to the
community level dprobit tobit dprobit tobit Any investment made in year 2000 0.287***
(4.29) 0.276***
(4.00)
Amount of investment made in year 2000 (log)
0.696*** (6.05)
0.652*** (5.75)
Age of establishment 2-5 years -0.148*** (2.65)
-5.124*** (3.67)
-0.146** (2.51)
-5.193*** (3.72)
Age of establishment 5-10 years -0.174*** (3.38)
-7.162*** (4.54)
-0.166*** (2.94)
-7.050*** (4.50)
Age of establishment more than 10 years -0.175*** (3.59)
-6.731*** (4.25)
-0.170*** (3.21)
-6.701*** (4.31)
Establishment with 3-5 employees -0.030 (0.82)
-4.185*** (3.19)
-0.028 (0.78)
-3.951*** (3.07)
Establishment with more than 5 employees 0.109** (1.99)
-1.264 (0.77)
0.075* (1.70)
-2.045 (1.26)
Service establishment 0.064 (1.18)
2.158* (1.83)
0.042 (0.80)
1.592 (1.37)
Trade establishment -0.027 (0.72)
-1.082 (0.95)
-0.048 (1.30)
-1.543 (1.40)
Household based enterprises -0.068* (1.67)
-2.367** (2.21)
-0.070* (1.80)
-2.319** (2.21)
Time taken by the main means of transportation to the main market now (minutes)
-0.000* (1.67)
-0.010 (1.24)
-0.000** (2.22)
-0.012 (1.56)
Mud surface of internal road -0.068 (1.54)
-3.480** (2.33)
-0.047 (0.95)
-2.378 (1.46)
Maximum amount of informal loan can be borrowed (log)
0.006 (1.31)
0.472*** (2.82)
0.005 (1.06)
0.437*** (2.65)
Education of top manager if there is one 0.003 (0.53)
0.176 (1.21)
0.001 (0.23)
0.111 (0.78)
Years of experience of top manager 0.003 (1.57)
0.108** (2.09)
0.002 (1.10)
0.093* (1.86)
Male top manager 0.023 (0.50)
0.570 (0.49)
0.028 (0.61)
0.720 (0.64)
Sinhalese top manager 0.028 (0.57)
1.937 (1.26)
0.024 (0.52)
2.187 (1.43)
Electricity as most important overall constraint
-0.102* (1.88)
-2.902** (2.07)
-0.499*** (3.15)
-16.957*** (4.46)
Telecommunication as most important overall constraint
-0.073 (0.98)
-1.348 (0.58)
-0.649** (2.55)
-21.816*** (3.12)
Water supply as most important overall constraint
-0.119** (2.02)
-3.911* (1.83)
-0.354** (2.37)
-9.926** (1.99)
Road access as most important overall constraint
-0.114 (1.55)
-3.861** (1.98)
-0.669*** (3.45)
-22.544*** (4.30)
Road quality as most important overall constraint
-0.112* (1.73)
-4.970** (2.07)
-0.295 (1.11)
-13.550** (2.40)
Transportation facility as most important overall constraint
-0.053 (0.51)
0.903 (0.34)
-0.894*** (3.43)
-21.283** (2.52)
High interest or transaction cost of loan as most important overall constraint
-0.082 (1.27)
-3.103* (1.81)
-0.617*** (3.20)
-21.568*** (4.25)
Loan procedures as most important overall constraint
-0.108 (1.55)
-3.322 (1.40)
-0.383* (1.93)
-12.999* (1.88)
Lack of market info as most important overall constraint
-0.174*** (2.96)
-6.808** (2.06)
-0.798*** (2.75)
-17.914*** (2.67)
Low market demand as most important overall constraint
-0.077 (1.43)
-2.340 (1.32)
-0.319* (1.92)
-11.624** (2.52)
Central Province 0.143** (1.96)
0.670 (0.37)
0.175** (2.15)
1.208 (0.67)
Southern Province 0.035 (0.56)
1.332 (0.84)
0.143** (2.18)
3.546** (2.10)
North West 0.282*** (2.88)
7.151*** (4.52)
0.378*** (3.51)
9.408*** (5.56)
North Central 0.255*** (2.84)
6.350*** (3.67)
0.348*** (3.60)
8.449*** (4.63)
UVA 0.010 (0.12)
-7.834** (2.39)
0.098 (1.08)
-5.321 (1.61)

RURAL SURVEY: TECHNICAL APPENDIX ON INVESTMENT CLIMATE, FIRM PERFORMANCE AND START-UP
87
Table A5.2 Determinants of New Investment (cont.) Overall constraints based on perception of
individual enterprises Overall constraints aggregated to the
community level dprobit tobit dprobit tobit Sabaragamuwa 0.131*
(1.75) 2.753 (1.59)
0.169** (2.10)
3.713** (2.05)
North & East Province 0.081 (0.83)
4.562** (2.28)
0.138 (1.33)
5.385** (2.46)
Constant -7.867** (2.29)
3.699 (0.84)
Observations 1134 1134 1134 1134 Pseudo R-squared 0.16 0.06 0.18 0.06 Log likelihood -516.39 -1600.70 -501.75 -1588.32 Absolute value of z statistics in parentheses * significant at 10%; ** significant at 5%; *** significant at 1%

RURAL SURVEY: TECHNICAL APPENDIX ON INVESTMENT CLIMATE, FIRM PERFORMANCE AND START-UP
88
Table A5.3 Determinants of Labor Productivity and Total Factor Productivity
Value-added/worker
Total Factor Productivitya
Total Factor Productivityb
Service Establishment 0.135 -0.154 -0.153 (1.06) (1.21) (1.22) Trade Establishment 0.323*** -0.020 -0.024 (2.83) (0.17) (0.21) Age of establishment 2-5 years old -0.014 -0.017 -0.017 (0.11) (0.13) (0.14) Age of establishment 5-10 years old 0.099 -0.172 -0.171 (0.74) (1.25) (1.24) Age of establishment >10 years 0.230* -0.190 -0.181 (1.82) (1.48) (1.41) Stand-alone establishment 0.500*** -0.154 -0.151 (4.22) (1.30) (1.27) Total fixed assets (log) 0.165*** (3.81) Number of Workers (log) -0.199** -0.198** (2.49) (2.44) Time taken for clearance of a check in this area in the survey month (days)
-0.060** -0.061** -0.064**
(2.24) (2.31) (2.32) Cost of bus fee to commercial center in the survey month
-0.011* -0.010 -0.011*
(1.81) (1.61) (1.72) Mud surface of internal road -0.096 -0.091 -0.100 (0.64) (0.62) (0.69) Owned fixed line or cell phone 0.264** 0.328** 0.336*** (2.02) (2.50) (2.63) Use electricity from national grid during the past 12 months
0.275** 0.253** 0.248**
(2.60) (2.55) (2.52) Electricity line is connected in less than a week 0.324 0.351 0.353 (1.49) (1.58) (1.62) Maximum amount that can be borrowed from informal sources
0.043** 0.042** 0.044***
(2.50) (2.45) (2.62) Education of top manager if there is one 0.042** 0.044** 0.041** (2.23) (2.37) (2.16) Years of exprience of top manager 0.009 0.010 0.010 (1.47) (1.60) (1.61) Gender of top manager 0.124 0.152 0.145 (1.05) (1.28) (1.22) Sinhalese top manager -0.221 -0.230 -0.225 (1.48) (1.50) (1.45) Electricity as most important overall constraint -0.328** -0.359** -0.351** (2.10) (2.24) (2.17) Telecommunication as most important overall constraint
0.101 0.060 0.082
(0.38) (0.23) (0.32) Water supply as most important overall constraint -0.225 -0.265 -0.258 (0.99) (1.18) (1.15) Road access as most important overall constraint -0.456** -0.472** -0.442** (2.39) (2.51) (2.37) Road quality as most important overall constraint -0.210 -0.230 -0.210 (0.78) (0.85) (0.76) Transportation facility as most important overall constraint
-0.633** -0.677** -0.636**
(2.29) (2.39) (2.25) High interest cost of loan as most important overall constraint
-0.551*** -0.592*** -0.556***
(3.35) (3.51) (3.32) Loan procedures as most important overall constraint -0.371 -0.384 -0.337 (1.59) (1.61) (1.37) Lack of market info as most important overall constraint
-0.384** -0.381** -0.433**
(2.14) (2.07) (2.25) Low market demand as most important overall constraint
-0.531*** -0.554*** -0.528***

RURAL SURVEY: TECHNICAL APPENDIX ON INVESTMENT CLIMATE, FIRM PERFORMANCE AND START-UP
89
Table A5.3 Determinants of Labor Productivity and Total Factor Productivity (cont.)
Value-
added/worker Total Factor Productivitya
Total Factor Productivityb
(3.61) (3.63) (3.50) Central Province -0.380** 0.022 0.034 (2.11) (0.12) (0.18) Southern Province -0.069 -0.014 -0.009 (0.37) (0.08) (0.05) North Western Province -0.260 0.105 0.106 (1.45) (0.59) (0.59) North Central Province -0.472*** 0.075 0.082 (2.64) (0.43) (0.47) Uva Province 0.274 -0.052 -0.044 (1.39) (0.27) (0.23) Sabaragamuwa Province -0.399** -0.085 -0.083 (1.98) (0.43) (0.42) North and East Province -0.548** -0.039 -0.006 (2.40) (0.16) (0.02) Constant 7.895*** -0.112 -0.108 (19.83) (0.37) (0.37) Observations 1194 1194 1194 R-squared 0.33 0.13 0.13
a TFP is calculated from value added production function with constant technology coefficient across production, service and trade b TFP is calculated from value added production function with different technology coefficients for production, service and trade (Industry dummies were interacted with technology coefficients.) Robust t statistics in parentheses * significant at 10%; ** significant at 5%; *** significant at 1%

RURAL SURVEY: TECHNICAL APPENDIX ON INVESTMENT CLIMATE, FIRM PERFORMANCE AND START-UP
90
Table A5.4 Determinants of Total Factor Productivity by Industry Type
TFP is calculated from a value-added production function with industry type interacted with
technology coefficients
TFP is calculated from a value-added production function which is estimated
separately for each industry type Production Service Trade Production Service Trade Age of establishment 2-5 years old 0.162
(0.91) 0.043 (0.14)
-0.182 (0.92)
0.050 (0.28)
-0.007 (0.02)
-0.032 (0.16)
Age of establishment 5-10 years old -0.204 (0.99)
0.231 (0.68)
-0.191 (0.91)
-0.174 (0.84)
0.058 (0.17)
-0.093 (0.44)
Age of establishment > 10 years -0.039 (0.20)
-0.083 (0.22)
-0.342* (1.69)
-0.069 (0.35)
-0.055 (0.15)
-0.375* (1.85)
Stand alone establishment 0.003 (0.02)
-0.212 (0.79)
-0.251 (1.33)
-0.174 (0.99)
0.038 (0.14)
-0.134 (0.71)
Number of workers (log) -0.162* (1.66)
0.015 (0.09)
-0.419*** (2.61)
-0.132 (1.34)
0.027 (0.16)
-0.374*
* (2.34)
Time taken for clearance of a check in this area in the survey month (days)
-0.041 (1.12)
-0.070 (1.45)
-0.048 (1.14)
-0.040 (1.11)
-0.070 (1.46)
-0.046 (1.10)
Cost of bus fee to commercial center in the survey month -0.028*** (2.72)
0.003 (0.37)
0.003 (0.42)
-0.028*** (2.73)
0.003 (0.34)
0.004 (0.43)
Mud surface of internal road 0.044 (0.20)
-0.257 (0.85)
-0.324 (1.52)
0.043 (0.19)
-0.253 (0.83)
-0.320 (1.51)
Owned fixed line or cell phone 0.374* (1.75)
-0.344 (1.41)
1.050*** (4.93)
0.383* (1.79)
-0.338 (1.39)
1.039***
(4.86) Electricity line is connected in less than a week 0.434
(1.37) 0.165 (0.37)
0.178 (0.83)
0.431 (1.37)
0.168 (0.37)
0.179 (0.83)
Maximum amount of credits that can borrowed from informal sources
0.069*** (3.31)
-0.006 (0.10)
0.043* (1.75)
0.069*** (3.31)
-0.006 (0.10)
0.042* (1.70)
Education of top manager if there is one 0.012 (0.64)
0.071** (1.99)
0.042 (1.49)
0.013 (0.67)
0.071** (2.00)
0.041 (1.48)
Years of experience of top manager 0.010 (1.21)
-0.003 (0.30)
0.015* (1.69)
0.010 (1.21)
-0.004 (0.32)
0.015* (1.68)
Gender of top manager 0.315* (1.78)
-0.382 (1.00)
0.041 (0.21)
0.315* (1.78)
-0.381 (1.00)
0.032 (0.16)
Sinhalese top manager 0.011 (0.05)
-0.087 (0.25)
-0.576*** (2.79)
0.007 (0.03)
-0.083 (0.24)
-0.581*
** (2.82)
Electricity as most important overall constraint -0.460** (2.14)
-0.411 (1.63)
-0.255 (0.90)
-0.458** (2.13)
-0.402 (1.59)
-0.267 (0.93)
Telecommunication as most important overall constraint 0.601** (2.05)
-0.433 (1.03)
0.397 (1.08)
0.606** (2.07)
-0.422 (1.00)
0.383 (1.04)
Water supply as most important overall constraint -0.070 (0.24)
-0.398 (1.35)
-0.714 (1.59)
-0.067 (0.22)
-0.387 (1.31)
-0.729 (1.62)
Road access as most important overall constraint -0.271 (1.03)
-1.159*** (3.25)
-0.266 (0.83)
-0.273 (1.04)
-1.166*** (3.27)
-0.270 (0.84)
Road quality as most important overall constraint -0.066 (0.20)
0.133 (0.18)
-0.172 (0.43)
-0.064 (0.19)
0.136 (0.18)
-0.176 (0.44)
Transportation facility as most important overall constraint
-0.938** (2.44)
0.325 (0.32)
0.374 (1.01)
-0.933** (2.43)
0.333 (0.33)
0.352 (0.95)
High interest cost of loan as most important overall constraint
-0.384 (1.30)
-0.214 (0.63)
-0.582* (1.87)
-0.385 (1.30)
-0.209 (0.61)
-0.592* (1.90)
Loan procedures as most important overall constraint -0.274 (0.57)
-1.043 (1.59)
0.007 (0.02)
-0.276 (0.57)
-1.035 (1.58)
-0.003 (0.01)
Lack of market info as most important overall constraint -0.561** (2.06)
-1.199** (2.44)
0.307 (0.60)
-0.558** (2.06)
-1.189** (2.42)
0.348 (0.67)
Low market demand as most important overall constraint -0.391 (1.57)
-0.876*** (2.70)
-0.276 (0.95)
-0.394 (1.58)
-0.877*** (2.71)
-0.290 (0.99)
Central Province 0.715** (2.40)
-0.126 (0.37)
-0.325 (1.24)
0.383 (1.29)
-0.183 (0.54)
-0.106 (0.40)
Southern Province 0.115 (0.42)
-0.585 (1.46)
0.139 (0.54)
0.030 (0.11)
-0.154 (0.38)
-0.034 (0.13)
North West 0.246 (1.07)
-0.275 (0.85)
0.251 (0.82)
0.235 (1.02)
0.166 (0.51)
-0.065 (0.21)
North Central 0.284 (1.07)
-0.566* (1.71)
0.036 (0.11)
0.091 (0.34)
-0.225 (0.68)
-0.002 (0.01)
UVA -0.214 (0.74)
0.028 (0.06)
0.196 (0.74)
0.096 (0.33)
0.181 (0.36)
0.002 (0.01)
Sabaragamuwa 0.419 (1.36)
-0.162 (0.52)
-0.272 (0.98)
0.147 (0.48)
-0.057 (0.18)
-0.146 (0.53)
North & East Province 0.585* (1.88)
-0.457 (1.07)
-0.254 (0.73)
0.600* (1.92)
-0.332 (0.78)
-0.537 (1.54)
Constant -0.619 (1.52)
0.794 (1.14)
0.295 (0.62)
-0.490 (1.20)
0.431 (0.62)
0.228 (0.48)
Observations 511 246 437 511 246 437 R-squared 0.23 0.16 0.24 0.22 0.14 0.22 Robust t statistics in parentheses * significant at 10%; ** significant at 5%; *** significant at 1%

RURAL SURVEY: TECHNICAL APPENDIX ON INVESTMENT CLIMATE, FIRM PERFORMANCE AND START-UP
91
Table A5.5 Estimation of Cobb-Douglas Production Functions
Entire sample specification 1
Entire sample specification 2
Production
only
Service only
Trade only
Number of workers (log) 0.822*** (8.33)
0.863*** (7.34)
0.525*** (2.88)
0.711*** (3.72)
Total fixed assets (log) 0.198*** (4.21)
0.234*** (5.10)
0.238*** (3.71)
0.174*** (3.18)
Interaction of number of workers (log) and production enterprises
0.889*** (7.56)
Interaction of number of workers (log) and service enterprises
0.523*** (3.03)
Interaction of number of workers (log) and trade enterprises
0.762*** (3.94)
Interaction of total fixed assets (log) and production enterprises
0.241*** (5.09)
Interaction of total fixed assets (log) and service enterprises
0.251*** (3.80)
Interaction of total fixed assets (log) and trade enterprises
0.161*** (2.67)
Service Establishment 0.242* (1.80)
0.334 0.000 0.000 0.000
Trade establishment 0.312** (2.49)
1.328* (1.79)
0.000 0.000 0.000
Age of establishment 2-5 years old -0.009 (0.06)
-0.008 (0.05)
0.106 (0.45)
0.046 (0.14)
-0.165 (0.69)
Age of establishment 5-10 years old 0.283* (1.79)
0.300* (1.87)
0.272 (0.92)
0.477* (1.70)
0.197 (0.76)
Age of establishment > 10 years 0.428*** (3.37)
0.435*** (3.44)
0.467** (2.45)
0.410 (1.22)
0.468** (2.20)
Stand alone establishment 0.673*** (5.11)
0.649*** (4.99)
0.833*** (5.47)
0.394 (1.45)
0.528** (2.40)
Central Province -0.435*** (2.66)
-0.443*** (2.68)
-0.115 (0.40)
-0.374 (1.19)
-0.662*** (2.94)
Southern Province -0.039 (0.16)
-0.048 (0.20)
0.035 (0.10)
-0.485 (1.39)
0.131 (0.45)
North West -0.382** (2.15)
-0.376** (2.12)
-0.368* (1.69)
-0.817** (2.46)
-0.057 (0.19)
North Central -0.563*** (3.41)
-0.554*** (3.32)
-0.363 (1.49)
-0.892** (2.17)
-0.524 (1.56)
UVA 0.290 (0.99)
0.271 (0.91)
-0.037 (0.16)
0.131 (0.24)
0.462 (1.31)
Sabaragamuwa -0.334* (1.82)
-0.334* (1.84)
-0.061 (0.21)
-0.439 (1.33)
-0.457* (1.85)
North & East Province -0.537* (1.92)
-0.530* (1.80)
-0.547 (1.46)
-0.668** (2.01)
-0.237 (0.62)
Constant 7.745*** (14.88)
7.208*** (13.03)
7.147*** (12.83)
8.030*** (9.82)
8.487*** (12.79)
Observations 1194 1194 511 246 437 R-squared 0.39 0.39 0.51 0.27 0.29 Robust t statistics in parentheses * significant at 10%; ** significant at 5%; *** significant at 1%

92
APPENDIX 6
RURAL SUMMARY TABLES
Table A6.1 Basic Enterprise Characteristics
By industry type By number of workers
General Information Nation Production Service Trade 1-2 empl. 3-5 empl. > 5 empl.
Number of workers (including family members) 2.4 3.1 2.1 1.9 1.5 3.3 12.4
Enterprises with 3 or more workers (%) 0.2 0.2 0.2 0.1
Average age of the enterprises (years) 9.0 9.7 9.6 7.9 8.8 9.8 9.5
How enterprise was started (%)
Established by owner 88.5 90.7 82.8 89.5 89.5 87.2 75.6
Bought 2.4 1.4 3.6 2.9 2.6 1.8 1.7
Inherited 6.1 7.0 5.7 5.4 5.9 7.3 5.8
Other 2.9 1.0 7.9 2.2 2.0 3.8 16.9
% of enterprises that were previously operating in a different location 15.0 14.8 24.9 9.6 14.4 14.8 25.5
Start up capital
% of startup capital from agricultural savings 22.3 20.3 20.7 25.5 23.4 18.9 14.6
% of startup capital from non-agricultural savings 42.4 47.7 42.6 36.6 42.2 44.0 41.5
% of startup capital from remittance 1.5 1.0 1.2 2.3 1.2 2.9 2.5
% of startup capital from asset liquidations 2.3 2.2 1.3 3.0 2.2 2.8 3.2
% of startup capital from bank loans 8.6 7.2 7.8 10.6 8.5 9.3 7.8
% of startup capital from private money lender 13.7 14.6 10.7 14.4 14.4 12.1 6.1
% of startup capital from family/friends 2.6 2.8 2.7 2.2 2.8 1.7 1.2
% of startup capital from other informal sources 0.6 0.7 0.3 0.8 0.5 0.8 2.0
% of startup capital from other sources 5.9 3.5 12.7 4.5 4.7 7.6 20.7
Owner's managerial ability and technical skills
Years of prior experience of the owner 5.0 5.6 5.6 4.1 4.7 6.4 7.1
Ownership type
% sole proprietorship in 2003 95.5 96.6 89.4 97.7 97.1 92.1 76.3
% partnership in 2003 1.7 2.0 2.0 1.1 1.2 3.6 4.4
% private company limited liability in 2003 0.4 0.8 0.2 0.1 0.1 0.4 6.9
% public company limited liability in 2003 0.1 0.1 0.5 0.0 0.0 0.5 1.2
% listed company in 2003 0.1 0.1 0.6 0.0 0.1 0.1 0.5
% cooperatives in 2003 0.9 0.1 2.0 1.1 0.7 1.6 2.0
% corporation and government bodies in 2003 1.1 0.1 5.0 0.0 0.8 1.0 7.3
% others ownership in 2003 0.2 0.1 0.4 0.0 0.0 0.6 1.3
Other characteristics
% registered 52.7 30.4 70.1 67.1 49.3 59.5 80.3
% stand-alone enterprises 59.0 30.7 83.2 76.0 57.9 59.4 72.9
% headquarter located in Colombo 2.0 0.7 6.2 1.2 1.4 3.3 9.3
% previously owned by government/state 1.5 0.3 6.6 0.0 1.0 1.9 9.5

RURAL SUMMARY TABLE
93
Table A6.2 Use of Utilities and Demand for Business Services
By industry type By number of workers
Utility use Nation Production Service Trade 1-2 empl. 3-5 empl. > 5 empl.
Enterprises using electricity from national grid during past 12 months (%) 68.9 64.5 76.9 69.2 67 76.1 79.7
% using electricity from solar source during past 12 months 2 0.8 0.4 4.1 1.4 6.9 0.9
% using electricity from biomass during past 12 months 0.3 0.2 0 0.6 0.4 0 0
% using electricity from generator during past 12 months 7.5 6.9 2.5 10.5 7.9 5.7 4.5
% using electricity from other sources during past 12 months 6.3 7.6 7.1 4.3 6.6 5 1.8
% with no access to electricity source during past 12 months 44.9 46.7 50.5 40.3 46.5 34.4 39.9
%. that do not use electricity during past 12 months 38.9 37.7 39.5 40.2 37.3 48 52.9
Use water from own well (%) 58.2 69.6 47 52.2 59.5 53 51.8
% of water usage from own well 97.1 96.1 97.3 98.5 97.3 96.9 93.6
Use water from National Water Supply (%) 16.4 14.6 23.7 14.3 15.3 20.2 25.1
% of water usage from NWS 86.2 73.4 92.3 94.5 84 91.7 95
Use water from Pradeshiya Saba (%) 5.3 3.3 7.9 5.9 4.7 7.6 7
% of water usage from PS 92.8 80.6 97.7 96.5 93.8 92 83.7
Use water from individual suppliers (%) 3.8 2.4 5.2 4.4 4.1 2.8 1.8
% of water usage from individual supplies 93.3 84.4 92.4 99.3 96.4 69.5 85.3
Use water from other sources (%) 12.1 12 13 11.6 12.1 10.8 15.7
% of water usage from other sources 96 95.5 91.3 99.7 96.7 95.2 88.1
% that experienced water shortages 23.5 24.2 28.3 20 22.9 25.7 26.6
Own a phone or cell phone during last year (%) 15.4 11.5 20.2 17 12.2 24.9 43.7
Use fax to communicate with clients during last year (%) 1.2 1.8 1.5 0.4 0.7 1 12
Use computer as part of the work during last year (%) 1.6 0.9 4.7 0.6 1.1 1 12.8
Use internet regularly (%) 0.7 0.8 1.4 0.1 0.2 0 8.2
Use email regularly (%) 0.7 0.7 1.5 0.4 0.3 0 7.7
Members of any business association (%) 8.2 6.7 10 8.8 6.7 13.8 16.9
Demand for Business Services Engineering service needed (%) 1.2 1.7 1.8 0.2 0.4 2.4 10.6
Management consultants service needed (%) 3.1 1.8 6.5 2.6 2.3 4 14.8
Marketing services needed (%) 8 12.7 3 5.7 8.4 5 9.7
Accounting service needed (%) 4.5 2.9 7.9 4.3 2.1 9.2 33.1
Legal services needed (%) 2.5 1.6 5.6 1.7 1.4 5.7 11.9
Insurance services needed (%) 7.7 4.1 9.9 10.2 5.8 11.1 29.2
Information technologies services needed (%) 2.5 3.7 3.8 0.3 1.5 4 15.2
Tech. Support from buyers/suppliers needed (%) 2.9 2.6 4 2.4 2.1 4.8 10.4

RURAL SUMMARY TABLE
94
Table A6.3 Finance
By industry type By number of workers
Nation Production Service Trade 1-2 empl. 3-5 empl. > 5 empl.
Enterprises that have wanted to apply for a formal loan (%) 51.7 57.8 41.8 50.7 51.4 53.4 51.8
Enterprises that have applied for a loan (%) 29.8 32.7 22.6 30.7 28.5 34.3 35.4
Enterprise that wanted a loan but did not apply for a loan because (%)
Easier to use funds from friends, family & other 31.1 19.3 31.7 46.6 30.2 34.5 37.5
Interest rate would be too high 38.5 48.9 30.2 28.8 39.1 36.1 34.1
Duration would be too short 0.8 0.4 3.4 0.0 0.7 1.8 0.0
Insufficient collateral 11.9 12.1 3.7 15.9 9.8 27.9 4.7
High cost of application 3.6 0.4 7.1 6.0 3.4 0.7 15.9
No access to bank 10.9 15.2 4.5 8.6 10.8 11.0 12.7
Bureaucracy 7.8 10.1 14.8 0.8 8.5 2.0 11.6
Sources of finance for existing loans (%)
Private commercial bank 10.9 7.7 13.7 13.6 9.4 12.2 31.5
Government commercial bank 26.5 24.7 21.8 30.2 23.1 37.6 39.7
Rural bank 7.6 6.1 10.3 8.4 7.6 9.1 2.1
Samurdhi 19.9 26.8 7.1 16.6 22.7 12.3 1.3
Sanasa 8.4 8.6 4.2 9.8 10.0 3.1 3.4
Rural Development Bank 10.3 8.9 18.1 9.2 11.8 5.2 4.8
Friends/neighbors 5.7 6.6 5.8 4.6 5.8 5.6 3.7
Money lender 1.5 1.1 5.5 0.5 1.2 3.4 0.0
Other 9.2 9.5 13.6 7.2 8.4 11.5 13.5
Total 100.0 100.0 100.0 100.0 100.0 100.0 100.0
Sources of finance for new investments (%)
Private commercial bank 2.5 1.1 6.4 2.4 2.8 0.9 2.0
Government commercial bank 8.0 7.0 6.8 9.7 7.1 12.8 10.1
Rural bank 1.1 1.2 0.5 1.3 1.2 0.6 1.1
Samurdhi 6.6 8.7 1.6 6.5 7.9 2.0 0.0
Sanasa 2.5 2.3 1.9 2.9 2.9 0.7 0.0
Rural Development Bank 3.0 3.7 3.5 1.9 2.7 5.5 1.1
Friends/neighbors 42.3 46.2 30.5 43.0 47.0 22.7 21.6
Money lender 4.5 3.7 10.6 2.7 4.5 2.6 8.4
Cash-in-hand 36.4 32.3 45.2 37.3 32.1 56.9 50.3
Other 12.3 13.6 13.9 10.2 12.0 11.6 18.3
Proportion of enterprises that prepare financial statements (%) 11.7 9.5 17.0 11.1 7.3 21.2 45.4

RURAL SUMMARY TABLE
95
Table A6.4 Dealings with Government Agencies, Governance Issues and Legal Environment
By industry type By number of workers Nation Production Service Trade 1-2 empl. 3-5 empl. > 5 empl.
% of enterprise that reported dealing with government agencies 52.9 30.2 59.4 73.8 50.9 56.3 70.6
% of enterprises that reported dealing with government agencies for:
Registration 34.2 18.2 45.6 45.2 31.4 40.3 55.9
Obtaining/renewing licenses/permits 29.5 9.5 17.1 58.1 29.9 28.5 27.0
Applying for a construction permit 0.2 0.0 0.3 0.2 0.0 0.7 1.0
Applying for an electricity connection for industrial use 3.0 3.5 1.9 3.1 3.4 0.9 2.4
Tax related issues 2.0 1.5 0.5 3.3 1.4 2.4 8.7
Labor related issues 0.8 1.2 0.2 0.6 0.2 0.4 10.0
Fire and building safety issues 0.1 0.0 0.0 0.2 0.0 0.0 1.6
Sanitation/epidemiology issues 3.3 2.6 3.8 3.7 3.1 2.8 6.3
Environmental regulation 1.2 2.0 0.8 0.5 0.6 1.8 6.6
Median number of days spent in inspections and meetings with government officials 2.0 3.0 1.0 2.0 2.0 1.0 2.0
% of enterprises dealing with government agencies reporting making unofficial payments 14.2 21.6 13.8 11.1 14.7 13.0 12.0
% of enterprises that report laws/regulations that affect their growth and operation are unpredictable or highly unpredictable 30.2 32.5 29.0 28.3 31.9 22.9 26.0
% of enterprises that agree/strongly agree that laws/regulations can be misinterpreted/manipulated by officials 23.8 23.7 24.6 23.6 19.3 38.9 45.9
Most important reasons why officials misinterpret/manipulated laws/regulations
Officials lack knowledge about the rules/regulations 31.5 24.0 44.6 31.8 27.4 39.1 38.1
Officials are partial with regards to ethnicity 19.4 21.8 13.8 20.0 18.5 23.4 16.0
Officials are partial with regards to gender 19.4 20.1 13.9 21.9 23.4 8.5 19.7
Officials are partial with regards to income status 29.8 34.1 27.8 26.2 30.7 29.1 26.2
% of enterprises with more than 3 workers that think that enterprises can influence the content of laws and regulations 8.3 9.4 6.6 6.9 6.1 13.5
% of enterprises that agree that a contract will protect them from being cheated 60.2 56.4 63.3 62.6 57.4 70.1 73.5
% of enterprises that agree that the legal system will uphold a contract in a business dispute 51.4 44.4 52.8 58.2 48.2 61.6 69.0

RURAL SUMMARY TABLE
96
Table A6.5 Share of Firms Assessing Constraints to Operation as Major or Severe by Industry Type
and Size (percent)
By industry type By number of workers
Nation Production Service Trade 1-2 empl. 3-5 empl. > 5 empl.
Cost of Finance 29.5 30 25 31 30 32 21
Loan Procedure 26.8 27 24 28 26 32 23
Market Demand 27.4 25 21 33 27 32 16
Electricity 24.5 27 28 20 24 29 28
Road Quality 16.8 21 12 15 16 18 21
Road Access 15.1 18 8 16 15 19 12
Availability of Transportation 14.8 16 7 18 15 13 9
Market information 11.6 15 6 11 12 11 6
Water 11.9 13 14 10 11 16 10
Telecommunication 8 5 9 11 8 7 13
Access to Formal Finance 6.2 5 7 7 6 10 2
Economic Policy Uncertainty 3.7 4 3 3 3 6 7
Road Block 3.3 2 5 4 3 6 8
High Tax Rate 2.9 3 3 3 2 5 11
Skillful Labor Supply 4.4 3 2 2 2 4 4
License Cost 2.6 3 4 2 2 3 5
Registration Cost 2.5 2 4 2 2 3 5
Registration procedure 2 2 2 2 2 3 3
Electricity Telecom Water Road access
Road quality
Financing cost
Loan procedures
Market information
Market demand
Figure A6.1 Percent of Enterprises Reporting Major or Severe Constraints

RURAL SUMMARY TABLE
97
Table A6.6 Share of Firms Assessing Constraints to Operation as Most Important Overall
Constraint by Industry Type and Size (percent)
By industry type By number of employees
Nation Production Service Trade 1-2 empl. 3-5 empl. > 5 empl.
Electricity 25.4 31.1 26.7 18.6 25.5 23.6 30.2
Telecom 4.8 2.5 5.1 7.1 4.8 4.0 8.4
Water Supply 7.3 8.0 10.2 4.9 7.3 7.9 5.7
Road Access 8.5 8.7 5.3 10.0 8.6 8.9 4.3
Road Quality 5.2 6.2 3.2 5.2 5.5 3.5 4.5
Availability of Tranpsort 3.5 6.0 0.3 2.7 4.0 1.6 0.2
Cost of Financing 12.0 8.4 14.6 14.5 12.3 12.7 5.4
Bureaucracy of Financing 4.7 3.5 3.5 6.7 4.5 5.5 5.3
Lack of Market Information 5.7 7.9 2.7 5.0 6.3 3.4 2.2
Low Market Demand 10.7 5.8 10.9 15.9 10.4 12.7 10.5
High Tax Rates 0.5 0.6 0.3 0.5 0.1 1.7 3.8
Lack of Skilled Labor Supply 1.4 2.0 1.2 0.8 1.3 1.5 2.0

RURAL SUMMARY TABLE
98
Table A6.7 Household and Community Characteristics
All Households without
enterprises Households with
enterprises
Per capita income (Rupees) 30060*** 23654 35685
Total income (Rupees) 120894*** 89113 148798
Wage income (Rupees) 39772*** 50187 30628
Agriculture Income (Rupees) 19422 19015 19779
Non-farm enterprise Income (Rupees) 45840*** 0 86087
Remittances (Rupees) 4434* 5708 3316
Pension and other transfer incomes (Rupees) 11426** 14202 8988
Share of wage income 0.38*** 0.56 0.22
Share of Agricultural income 0.17*** 0.22 0.12
Share of non-farm employment income 0.30*** 0.00 0.57
Share of remittance in total income 0.03*** 0.05 0.02
Share of pension and other income in total income 0.12*** 0.17 0.07
Total wealth 519800*** 439010 590733
Parents operated non-farm business (% of households) 0.25** 0.20 0.30
Per capita arable land (hectares) 0.18 0.19 0.17
Landless household (%) 0.36 0.38 0.35
Household size 4.35*** 4.13 4.53
No. people between 14 and 65 3.22*** 3.04 3.37
Household head's age 48.57 49.00 48.18
Household head's education (years) 7.45*** 7.03 7.82
Maximum education of any members (years) 10.44*** 9.97 10.86
Informal borrowing capacity (Rupees) 15398 15126 15636
Time taken to get to the commercial center 39.18 41.14 37.47
% of communities with unpaved internal road 0.21 0.20 0.22
% of communities with unpaved external road 0.12 0.12 0.13
Minimum distance to any formal bank 1.88 2.07 1.72
Time to obtain registration (days) 19.97 20.60 19.41 Agriculture as main income source in the community (% of communities) 0.47 0.47 0.46
Share of paddy to total arable land in the community (%) 0.36 0.36 0.37 * Column 2 and 3 are statistically different at 10% level ** Column 2 and 3 are statistically different at 5% level *** Column 2 and 3 are statistically different at 1% level

REFERENCES
99
REFERENCES Arunatilake, Nisha, Sisira Jayasuriya, and Saman Kelegama. 2001. “The Economic Cost of the War in Sri
Lanka.” World Development 29 (9): 1483-1500. Asian Development Bank. 2003. SME Database Development Plan. Manila. Central Bank of Sri Lanka, 1998. Economic Progress of Independent Sri Lanka, 1948-1998. Colombo. 1998. Various years. Annual Report. Colombo. GTZ (German Agency for Technical Cooperation). 2003. Guide to Rural Economic and Enterprise
Development. Eschborn. Gupta, Sanjeev, Benedict J. Clements, Rina Bhattacharya, and Shamit Chakravarti. 2002. “Fiscal
Consequences of Armed Conflict and Terrorism in Low- and Middle-Income Countries.” IMF Working Paper 02/142. International Monetary Fund, Washington, D.C.
Heltberg, Rasmus. 2003. “Labor Markets to Support Growth and Poverty Alleviation in Sri Lanka.” World Bank, Washington, D.C.
Heltberg and Vodopivec. 2004. “Sri Lanka: Unemployment, Job Security, and Labor Market Reform.” World Bank Social Protection Unit Working Paper” Washington, D.C.
International Finance Corporation. 2003. Sri Lanka: SME Mapping and Donor Map. Washington, D.C. International Labour Organization. 2000. Termination of Employment Digest. Geneva. JobsNet. 2004. [http://www.jobsnet.lk]. Kaufmann, Daniel, Aart Kraay, and Massimo Mastruzzi. 2003. “Governance Matters III: Governance
Indicators for 1996-2002.” Policy Research Working Paper 3106. World Bank, World Bank Institute, Global Governance Department; and Development Research Group, Washington, D.C.
Kumarage, Amal. 1998. “Formulation of Policy Framework for Poverty Alleviation: Transport.” Lanjouw, Jean O., and Peter Lanjouw. 2001. “The Rural Nonfarm Sector: Issues and Evidence from
Developing Countries.” Agricultural Economics 26 (1): 1-23. Levinsohn, J., and A. Petrin. 2003. “Estimating Production Functions Using Inputs to Control for
Unobservables.” Review of Economic Studies 70 (2): 317-42. Sri Lanka, Board of Investment. 2001. Annual Report. Colombo. ———. 2003a. Industrial Factor Costs: A Guide to Investment Tariffs and Costs in Sri Lanka. Colombo. ———. 2003b. The IT Industry. Colombo. ———. 2003c. Textile and Apparel Sector: An Overview. Colombo. ———. 2004. [http://www.boi.lk]. Sri Lanka, Department of Census and Statistics 2004. Sectoral and Provincial Poverty Lines. Colombo. UNCTAD (United Nations Conference on Trade and Development). 2003. Investment Policy Review: Sri
Lanka. Geneva. Draft. Vijverberg, W. 2002. “Measuring Investment Climate in Rural Areas.” World Bank, Agriculture and Rural
Development Department, Unpublished draft report. Washington, D.C. World Bank. 1988. “Sri Lanka: A Break with the Past—The 1987-90 Program of Economic Reforms and
Adjustment.” Report 7220-CE. Washington, D.C. ———. 1990. “Sri Lanka: Sustaining the Adjustment Process.” Report 8951-CE, Washington, D.C. ———. 1992. “Sri Lanka: Strengthened Adjustment for Growth and Poverty Reduction.” Report 10079-
CE. Washington, D.C. ———. 1995a. “Sri Lanka: Non-Plantation Crop Sector Policy Alternatives.” Working Paper 1-7. South
Asia Region, Agriculture and Natural Resources Division, Washington, D.C. ———. 1995b. “Sri Lanka Private Sector Assessment.” South Asia Region, Country Department I, Private
Sector Development and Finance; and International Finance Corporation, Corporate Planning Department and Asia Regional Department, Washington, D.C.
———. 1999. “Sri Lanka: A Fresh Look at Unemployment.” Report 19609-CE. South Asia Region, Poverty Reduction and Economic Management Unit, Washington, D.C.

REFERENCES
100
———. 2000. “Sri Lanka: Recapturing Missed Opportunities.” Report 20430-CE. South Asia Region, Poverty Reduction and Economic Management Unit, Washington, D.C.
———. 2001. “South Asia: Strategy and Action Plan for Rural Development.” South Asia Region, Rural Development Sector Unit, Washington, D.C.
———. 2002a. “Sri Lanka: Agricultural Policy Note.”, Washington, D.C. ———. 2002b. “Sri Lanka Poverty Assessment.” Report 22535-CE. South Asia Region, Poverty
Reduction and Economic Management Unit, Washington, D.C. ———. 2003a. “Sri Lanka: Development Policy Review.” Washington, D.C. ———. 2003b. “Sri Lanka: Fiscal and External Sustainability Issues—Selected Issues and Statistical
Appendix.” Public Expenditure Concept Note. South Asia Region, Poverty Reduction and Economic Management Unit, Washington, D.C.
———. 2003c. “Sri Lanka: A Medium-Term Program of Public Expenditure Review Work”, Washington, D.C.
———. 2003d. “Sri Lanka: Promoting Agricultural and Non-Farming Sector Growth.” Report 25387-CE. South Asia Region, Rural Development Unit, Washington, D.C.
———. 2003e. “Trade Policies in South Asia: An Overview.” South Asia Region, Poverty Reduction and Economic Management Unit, Washington, D.C.
———. 2004a. “Sri Lanka and Its Relations with the World Bank: Briefing for the Incoming Government”, Washington, D.C.
———. 2004b. World Development Report 2004: Making Services Work for Poor People. New York: Oxford University Press.
———. 2004c. World Development Report 2005: Improving the Investment Climate for Growth and Poverty Reduction. Washington, D.C. Draft.
———. 2004d. “Governce Matters III.” Governce Indicators for 1996-2002, Washington, D.C. World Economic Forum. 2003. The Global Competitiveness Report 2003-2004. Geneva WTO (World Trade Organization). 1996. Trade Policy Review: Sri Lanka—1995. Geneva.


