SRI LANKA: A HANDBOOK · Title: SRI LANKA: A HANDBOOK Subject: SRI LANKA: A HANDBOOK Keywords

© UNICEF/UN0321664/
Impact on the incomes of Sri Lankan householdsMay 2020
Sri Lanka and the COVID-19 crisis

Purpose
This is a summary of the fourth paper of a series
of UNICEF Sri Lanka Policy Briefs that aim to
provide evidence to support the Government of
Sri Lanka in its social protection response to the
economic crisis created by the COVID-19
pandemic.
This fourth brief examines the potential impacts
that the COVID-19 crisis will have on household
welfare in Sri Lanka, analysing simulated impacts
on household income using both ‘pessimistic’ and
‘optimistic’ scenarios.
It employed expert consultations and historical
evidence to determine a range of possible futures
of several parameters.
For more information, please contact:

Scenarios for the impact of COVID-19 crisis on Sri
Lanka households’ income
• In this analysis, we present scenarios on the COVID-19 economic effect on the household income. We do not predict future socioeconomic change compared to the structure of the economy as captured by the HIES in 2016;
• Proposed COVID-19 scenarios are used to capture the reduction of income compared to a baseline, under a pessimistic and an optimistic scenario (“what‐ if” scenarios);
• We combine assumptions on the impact of COVID-19 regarding income changes by economic sectors. The range of possible futures of these parameters is determined based on expert consultations and historical evidence;
• This analysis is the first step to estimate the potential impacts in “bad” scenarios and to explore possible policy options to minimize the risk that such bad scenarios occur.

Households at the top of the wealth distribution are characterized by the presence of workers in the services sector, hugely affected by the COVID-19 crisis. On the contrary, less wealthy households are composed of workers in the primary and secondary sectors.
Distribution of household income by industry by decile
(Data Source: HIES 2016)

• Depending on the scenario, monthly household income will decrease by 21 – 31 per cent
• Household income among male headed households is likely to decrease more than female headed households because of the COVID crisis
-23
-16
-21
-33
-27
-31
-35%-30%-25%-20%-15%-10%-5%0%
Male head
Female head
Total
Pessimistic Optimistic
Impact on household income under different scenarios
(Data Source: Own elaboration based on HIES 2016)
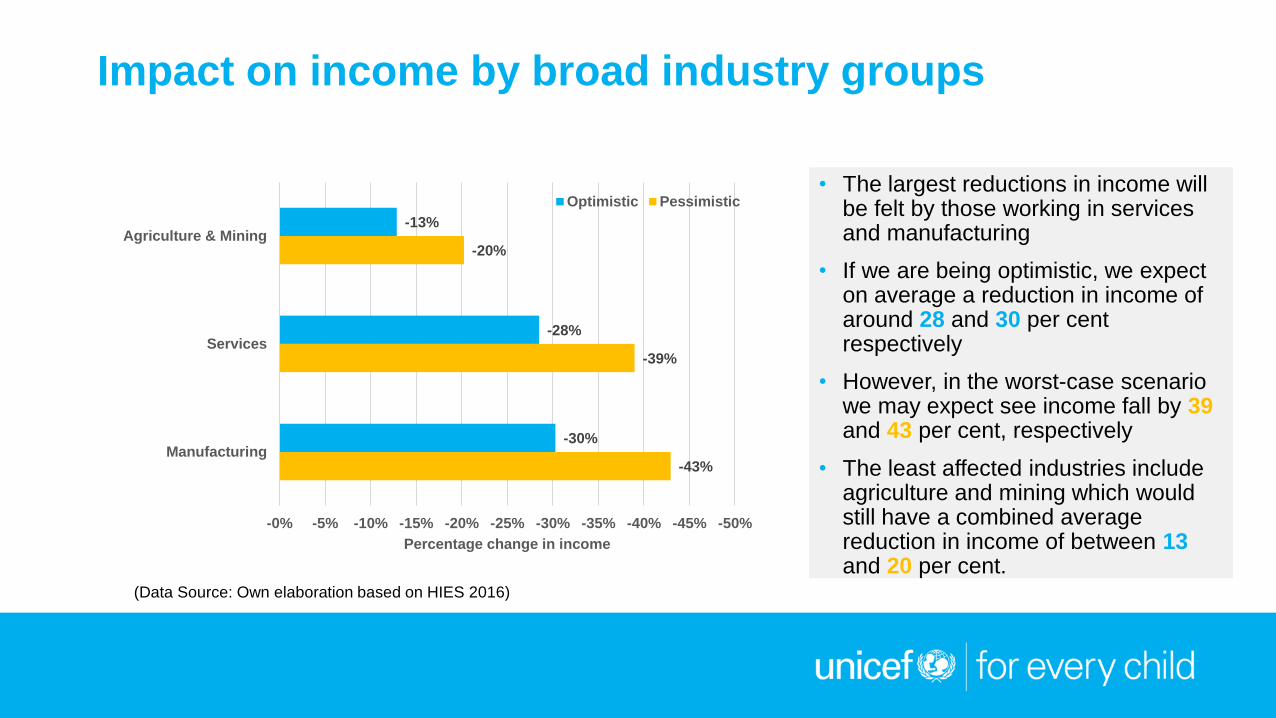
Impact on income by broad industry groups
• The largest reductions in income will be felt by those working in services and manufacturing
• If we are being optimistic, we expect on average a reduction in income of around 28 and 30 per cent respectively
• However, in the worst-case scenario we may expect see income fall by 39and 43 per cent, respectively
• The least affected industries include agriculture and mining which would still have a combined average reduction in income of between 13and 20 per cent.
-43%
-39%
-20%
-30%
-28%
-13%
-0% -5% -10% -15% -20% -25% -30% -35% -40% -45% -50%
Manufacturing
Services
Agriculture & Mining
Percentage change in income
Optimistic Pessimistic
(Data Source: Own elaboration based on HIES 2016)

Impact on income by Occupation
• Most occupations will see some significant reductions in income ranging from 6 per cent up to 56 per cent
• The group of individuals that would be most severely affected by COVID-19 are managers who could see their incomes reduce anywhere between 45 and 56 per cent
-0% -10% -20% -30% -40% -50% -60%
Managers
Plant and machine operators, andassemblers
Craft and relate
Service and sale
Subsistence agricultural activity
Clerical support wokers
Technicians and associate professionals
Elementary occupations
Professionals
Skilled agricultural, forestry and fisheryworkers
Armed forces occupations
Optimistic Pessimistic
(Data Source: Own elaboration based on HIES 2016)

Impact on income by province
Op
tim
isti
c S
cen
ari
o
Pes
sim
isti
c S
cen
ari
o
Western
Central
Southern
Northern
EasternNorth-Western
North-Central
Uva
Sabaragamuwa
© GeoNames, MicrosoftPowered by Bing
-26 -15Income
reduction (%)
Western
Central
Southern
Northern
EasternNorth-Western
North-Central
Uva
Sabaragamuwa
© GeoNames, MicrosoftPowered by Bing
-38 -23Income
reduction (%)
• The Western and
neighbouring provinces
will be the most
impacted by the crisis
• Under the Optimist
Scenario, household
income is likely to shrink
by 26 per cent
• Under the Pessimistic
Scenario household
income will reduce by 38
per cent
(Data Source: Own elaboration based on HIES 2016)

• Households in urban sectors will see the highest decrease in household income of around 37per cent
• This is likely due to the fact that whilst most of the population reside in rural areas, most services-related and a great deal of manufacturing work is based in urban areas
-26%
-21%
-13%
-37%
-30%
-23%
Urban Rural Estate
Optimistic Pessimistic
Impact on income by area of residence
(Data Source: Own elaboration based on HIES 2016)

-40%
-30%
-20%
-10%
0%
Pe
rce
nta
ge
ch
an
ge
in
in
co
me
Five-year age groups
Optimistic Pessimistic
Impact on income by age groups
While the health crisis hits especially the elderly population, the economic impact is more substantial for the young generation
(Data Source: Own elaboration based on HIES 2016)

-25%
-20%
-12%
-9%
-17%-22%
-12%
-19%
-35%
-30%
-25%
-16%
-27%
-33%
-22%
-29%
Couple household, withchildren
Couple household, with nochildren
Single parent/caregiver (<60years)
One-person household, 60+years
One-person household, 18-59years
Three generation household
Skipped generation
Other household types
Optimistic Pessimistic
• Households that would experience the
largest shrinkage in income are three
generation households and households
consisting of couples with children
• The former see a reduction of income of
around 22 and 33 per cent, whilst the
latter could lose between 25 and 35 per
cent
• We should not be surprised that skipped
generation and one person households
with a household head over the 60 years
appear to be affected the least since a
significant proportion of these households
will mostly have economically inactive
members.
Impact on income by household type
(Data Source: Own elaboration based on HIES 2016)