SRBC Report: Water Use Associated with Natural Gas Development
78
Water Use Associated with Natural Gas Shale Development: An Assessment of Activities Managed by the Susquehanna River Basin Commission July 2008 through December 2013 Publication No. 299 April 2016 Authors James L. Richenderfer, Ph.D., P.G., Senior Science Advisor to the Commission Bret Wagner, Database Developer Matthew K. Shank, Aquatic Biologist John Balay, P.H., Manager, Planning and Operations Dawn Hintz, Environmental Scientist/Database Analyst Jeremy Hoffman, Supervisor, Compliance Paula B. Ballaron, P.G., Manager, Policy Implementation and Outreach Steven McFeaters, Environmental Scientist Jeffrey Zimmerman, Jr., GIS Developer Susquehanna River Basin Commission
-
Upload
marcellus-drilling-news -
Category
News & Politics
-
view
176 -
download
2
Transcript of SRBC Report: Water Use Associated with Natural Gas Development

Water Use Associated with Natural Gas Shale Development:
An Assessment of Activities Managed by the Susquehanna
River Basin Commission
July 2008 through December 2013
Publication No. 299 April 2016
Authors
James L. Richenderfer, Ph.D., P.G., Senior Science Advisor to the Commission
Bret Wagner, Database Developer
Matthew K. Shank, Aquatic Biologist
John Balay, P.H., Manager, Planning and Operations
Dawn Hintz, Environmental Scientist/Database Analyst
Jeremy Hoffman, Supervisor, Compliance
Paula B. Ballaron, P.G., Manager, Policy Implementation and Outreach
Steven McFeaters, Environmental Scientist
Jeffrey Zimmerman, Jr., GIS Developer
Susquehanna River Basin Commission

James M. Tierney, New York Commissioner
Kenneth P. Lynch, New York. Alternate
Peter Freehafer, New York Alternate
John Quigley, Pennsylvania Commissioner
Kelly Jean Heffner, Pennsylvania Alternate
Ben Grumbles, Maryland Commissioner
Saeid Kasraei, Maryland Alternate
Virginia Kearney, Maryland Alternate
Brig. General William H. Graham, U.S. Commissioner
Colonel Edward P. Chamberlayne, U.S. Alternate
David J. Leach, U.S. Alternate
Amy M. Guise, U.S. Alternate
Andrew D. Dehoff, P.E., Executive Director
The Susquehanna River Basin Commission was created as an independent agency by a federal-interstate
compact* among the states of Maryland and New York, the Commonwealth of Pennsylvania, and the
federal government. In creating the Commission, the Congress and state legislatures formally recognized
the water resources of the Susquehanna River Basin as a regional asset vested with local, state, and
national interests for which all the parties share responsibility. As the single federal-interstate water
resources agency with Basinwide authority, the Commission's goal is to coordinate the planning,
conservation, management, utilization, development, and control of Basin water resources among the
public and private sectors.
*Statutory Citations: Federal - Pub. L. 91-575, 84 Stat. 1509 (December 1970); Maryland - Natural Resources Sec. 8-301
(Michie 1974); New York - ECL Sec. 21-1301 (McKinney 1973); and Pennsylvania - 32 P.S. 820.1 (Supp. 1976).
This report is available on our web site (www.srbc.net) by selecting Public Information/Technical Reports. For a
CD or hard copy, contact the Susquehanna River Basin Commission, 4423 N. Front Street, Harrisburg, Pa. 17110-
1788, Phone: (717) 238-0423, Fax: (717) 238-2436, E-mail: [email protected].
i
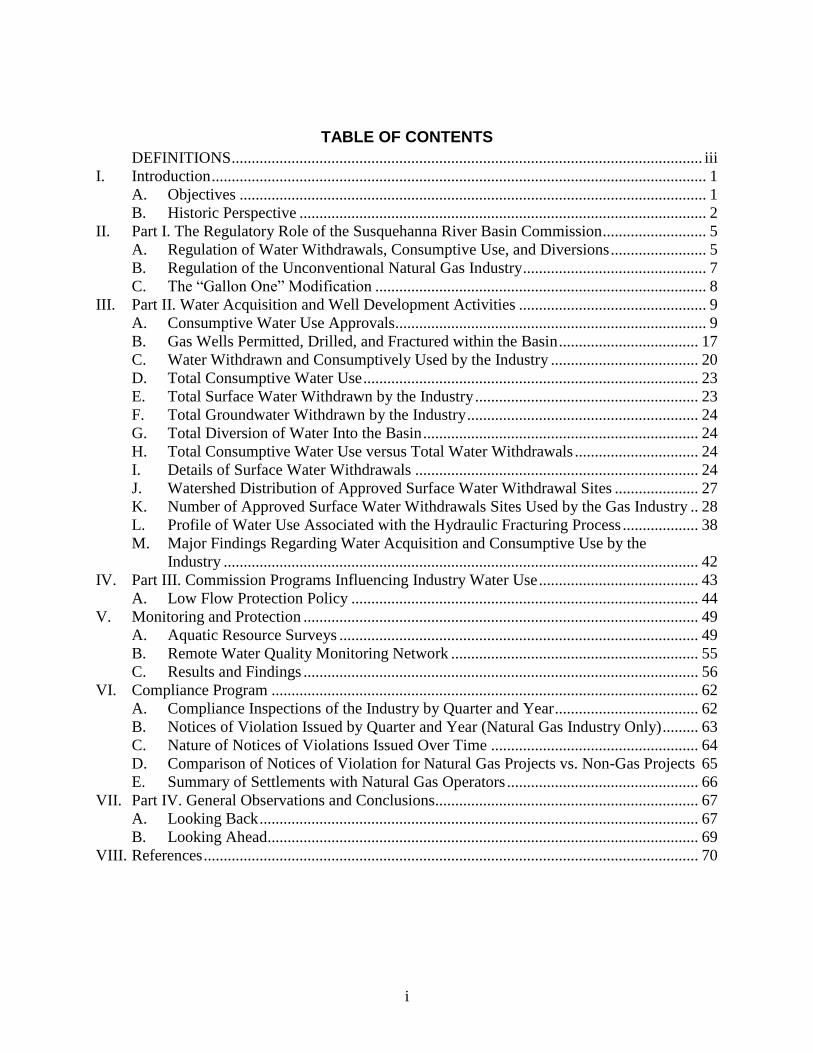
TABLE OF CONTENTS
DEFINITIONS ...................................................................................................................... iii
I. Introduction ............................................................................................................................ 1
A. Objectives ..................................................................................................................... 1
B. Historic Perspective ...................................................................................................... 2
II. Part I. The Regulatory Role of the Susquehanna River Basin Commission .......................... 5
A. Regulation of Water Withdrawals, Consumptive Use, and Diversions ........................ 5
B. Regulation of the Unconventional Natural Gas Industry .............................................. 7
C. The “Gallon One” Modification ................................................................................... 8
III. Part II. Water Acquisition and Well Development Activities ............................................... 9
A. Consumptive Water Use Approvals.............................................................................. 9
B. Gas Wells Permitted, Drilled, and Fractured within the Basin ................................... 17
C. Water Withdrawn and Consumptively Used by the Industry ..................................... 20
D. Total Consumptive Water Use .................................................................................... 23
E. Total Surface Water Withdrawn by the Industry ........................................................ 23
F. Total Groundwater Withdrawn by the Industry .......................................................... 24
G. Total Diversion of Water Into the Basin ..................................................................... 24
H. Total Consumptive Water Use versus Total Water Withdrawals ............................... 24
I. Details of Surface Water Withdrawals ....................................................................... 24
J. Watershed Distribution of Approved Surface Water Withdrawal Sites ..................... 27
K. Number of Approved Surface Water Withdrawals Sites Used by the Gas Industry .. 28
L. Profile of Water Use Associated with the Hydraulic Fracturing Process ................... 38
M. Major Findings Regarding Water Acquisition and Consumptive Use by the
Industry ....................................................................................................................... 42
IV. Part III. Commission Programs Influencing Industry Water Use ........................................ 43
A. Low Flow Protection Policy ....................................................................................... 44
V. Monitoring and Protection ................................................................................................... 49
A. Aquatic Resource Surveys .......................................................................................... 49
B. Remote Water Quality Monitoring Network .............................................................. 55 C. Results and Findings ................................................................................................... 56
VI. Compliance Program ........................................................................................................... 62 A. Compliance Inspections of the Industry by Quarter and Year .................................... 62 B. Notices of Violation Issued by Quarter and Year (Natural Gas Industry Only) ......... 63 C. Nature of Notices of Violations Issued Over Time .................................................... 64 D. Comparison of Notices of Violation for Natural Gas Projects vs. Non-Gas Projects 65
E. Summary of Settlements with Natural Gas Operators ................................................ 66
VII. Part IV. General Observations and Conclusions .................................................................. 67 A. Looking Back .............................................................................................................. 67 B. Looking Ahead............................................................................................................ 69
VIII. References ............................................................................................................................ 70

ii
TABLES
Table 1. Summary of Approval-By-Rule Issued to the Natural Gas Industry ......................... 11 Table 2. Summary of Unconventional Gas Wells Permitted-Drilled-Fractured by County
within the Susquehanna River Basin between 2005 and 2013 (PADEP, 2012) ........ 19 Table 3. Quarterly Summary of Consumptive Water Use, Water Withdrawals, and Water
Diversions by the Unconventional Gas Industry within the Susquehanna River Basin
from the Third Quarter 2008 through the Fourth Quarter 2013 ............................... 22 Table 4. Summary of Water Withdrawal Approvals within the Susquehanna River Basin for
Use by Unconventional Natural Gas Industry ........................................................... 26 Table 5. Top 20 Watersheds Used as Water Sources by the Unconventional Natural Gas
Industry (2008-2013) ................................................................................................. 30 Table 6A. Frequency Analysis of Approved Daily Maximum Limits for Surface Water
Withdrawals ............................................................................................................... 34 Table 6B. Frequency Analyses of Drainage Area Classes of Surface Water Withdrawal
Approvals ................................................................................................................... 36 Table 6C. Frequency Analyses of Ratios between Approved Daily Maximum Limits of Surface
Water Withdrawals and 10-Year Low Baseflows at Point of Withdrawal ................ 38 Table 7. Summary of Average Water Injected per Well Fracturing Event and Proportions of
Fresh and Flowback Waters Used in Those Events................................................... 40
Table 8. Aquatic Resource Class Criteria and Distribution within the Susquehanna River
Basin .......................................................................................................................... 44
Table 9. De minimis Withdrawal Thresholds by Aquatic Resource Class .............................. 47 Table 10. Passby Flow/Conservation Release Schedule ........................................................... 47 Table 11. Water Chemistry Parameters ..................................................................................... 56
FIGURES
Figure 1. Extent of Natural Gas Shales (Berg et al., 1980) ......................................................... 4 Figure 2. Natural Gas Related Water Withdrawals and ABR Approvals in the Susquehanna
River Basin, 2008-2009 ............................................................................................. 12 Figure 3. Natural Gas Related Water Withdrawals and ABR Approvals in the Susquehanna
River Basin, 2008-2010 ............................................................................................. 13 Figure 4. Natural Gas Related Water Withdrawals and ABR Approvals in the Susquehanna
River Basin, 2008-2011 ............................................................................................. 14 Figure 5. Natural Gas Related Water Withdrawals and ABR Approvals in the Susquehanna
River Basin, 2008-2012 ............................................................................................. 15
Figure 6. Natural Gas Related Water Withdrawals and ABR Approvals in the Susquehanna
River Basin, 2008-2013 ............................................................................................. 16
Figure 7. Wells Permitted, Drilled, and Fractured from 2005-2013 (PADEP, 2012) ............... 20 Figure 8A. Basin Locations of Top 20 Watersheds Used by the Gas Industry ........................... 31 Figure 8B. Total Water Withdrawals, Number of Approved Surface Water Withdrawals, and
Number of Withdrawals Actively Used During the Study Period ............................ 32
iii
Figure 9. Graphic Summary of Frequency Analyses Performed on Daily Maximum
Withdrawals, Drainage Areas, and Ratios of Daily Maximum Withdrawals to 10-
Year Low Baseflows .................................................................................................. 35 Figure 10. Aquatic Resource Class Designations for Basin Streams .......................................... 46
Figure 11. Approved Water Withdrawals and Passby Flow Conditions for Natural Gas
Extraction ................................................................................................................... 48 Figure 12. Aquatic Resource Survey (ARS) Locations through 2013 in the Susquehanna River
Basin .......................................................................................................................... 51 Figure 13. Number of Aquatic Resource Surveys (ARS) by Year (a) and Subbasin (b) ............ 52
Figure 14. Number of Aquatic Resource Surveys (ARS) by County ......................................... 52 Figure 15. Locations of Withdrawal Research Sites, by Stream Type, in the Susquehanna River
Basin .......................................................................................................................... 54 Figure 16. RWQMN Stations Shown with Level III Ecoregions ............................................... 57
Figure 17. Specific Conductance by Ecoregion and Year .......................................................... 60 Figure 18. IBI Scores Related to Gas Well Density from 2011-2013 ........................................ 61
Figure 19. Number of Natural Gas Inspections Conducted Per Quarter, 2011-2013 ................. 63 Figure 20. Nature of NOVs Issued to Natural Gas Industry, 2009-2013 .................................... 65
Figure 21. Number of Natural Gas Versus Non Gas NOVs Issued Per Year, 2009-2013 .......... 66
DEFINITIONS
Report Period – Also referred to as the “report period” or “period,” the term covers the span of
time from July 1, 2008 through December 31, 2013.
Basin – The term Basin is used throughout the report to identify the Susquehanna River Basin.
Commission – A name used to represent the Susquehanna River Basin Commission.
Consumptive Water Use – A term used by the Commission to identify water that has been
withdrawn from either groundwater or surface water sources, or from public water supplies, and
is used in such a way that it is not returned to the Basin undiminished in quantity. Water that is
evaporated, transpired, incorporated into products, or injected underground is removed from the
hydrologic cycle of the Basin and unavailable for future use within the Basin and is therefore
considered to be consumptively used. The Commission assumes that 100 percent of all water
obtained by the gas industry is consumptively used and therefore removed from the hydrologic
cycle of the Basin.
Docket – The Commission approves individual projects in the form of an official document.
This document is referred to as a docket. Each docket contains the name of the project sponsor,
a description of the project features, the location of the project, approved withdrawal or
consumptive use limits, general Commission conditions, and project-specific conditions.
Flowback – A term used by the Commission to represent the return flow of water and formation
fluids recovered from the wellbore of a hydrocarbon development well (including
unconventional gas wells) following the release of pressures induced as part of the hydraulic
iv
fracture stimulation of a target geologic formation. These fluids are considered flowback until
the well is placed into production.
Industry – The word industry will be used throughout this document to represent the
unconventional natural gas industry.
Production Fluids – A term used by the Commission to represent the return flow of water or
formation fluids recovered at the wellhead after the well is placed into production. This term is
synonymous with produced water.
Unconventional Natural Gas Development – Used by the Commission to represent the drilling,
casing, cementing, stimulation, and completion of wells undertaken for the purpose of extracting
gaseous hydrocarbons from low permeability geologic formations utilizing enhanced drilling,
stimulation, or recovery techniques.
Water Source – The original location or position within a watershed of a surface water or
groundwater withdrawal.
Water Withdrawal – A term used to represent a volume or quantity of surface water or
groundwater that has been physically removed from its original location or position within a
watershed for use by the industry. In simplistic terms, water withdrawals can be considered in
this document to be the beginning of the journey and consumptive use to be the end of the
journey for water acquired and used by the industry.

1
I. Introduction
A. Objectives
With the early stages of the unconventional natural gas industry activities now having
been completed, the Susquehanna River Basin Commission (Commission) considered it
important to review and assess those activities from a water management perspective. The
primary objectives of this report are to summarize the following: 1) the regulatory responses
taken by the Commission to address this new, and previously unfamiliar, energy sector activity;
2) the water use characteristics of the industry operating within the Susquehanna River Basin
(Basin); 3) the various water quality monitoring activities conducted by the Commission in
response to industry activity; and 4) the efforts undertaken by the Commission to track the
industry’s compliance with its regulations.
The detailed information presented in this report includes:
The role of the Commission in regulating water acquisition and consumptive
water use by the gas industry.
A detailed summary of the number of wells permitted, drilled, and fractured
within the Basin during the assessment period of July 2008 through December
2013.
The amounts of water acquired and consumptively used by the industry during
the assessment period of July 2008 through December 2013.
The sources of surface water and groundwater developed by the industry to
meet its water needs.
The aquatic resource surveys conducted by the Commission as part of the
project review process.
The remote water quality monitoring network established by the Commission to
detect and document potential negative impacts on water quality associated with
natural gas industry activities.
The auditing program established by the Commission to document the level of
compliance of the natural gas industry with applicable Commission regulations.
The information contained in this report is presented in four parts. Part I details the
regulatory role of the Susquehanna River Basin Commission. Part II presents a discussion of the
number of unconventional gas wells permitted, drilled, and hydraulically fractured within the
Basin during the report period; the amounts and locations of water withdrawals and water
consumption by the unconventional natural gas industry operating within the Basin during the
report period; and the limitations of the water withdrawal approvals issued to the industry by the
Commission. Part III of the document discusses the operational changes made at the
Commission in response to the industry’s water-related activities conducted within the Basin.
Part IV of the document contains a summary of the observations made and conclusions drawn
regarding water use by the industry during the report period; the ability of the Commission to

2
adequately address the sustainability of the water resources of the Basin; and the water-related
changes expected to occur at the Commission and within the Basin as the industry matures.
B. Historic Perspective
According to Carter et al. (2011), the first commercial gas well in Pennsylvania was
drilled in Oil Creek Township, Crawford County, in 1872. The earliest shale gas wells located
within the Basin were reportedly drilled in 1881-1882 at a location west of Tunkhannock,
Wyoming County. At least one of these wells was drilled to a depth of 2,089 feet (Ashley and
Robinson, 1922).
The use of hydraulic fracturing techniques to enhance oil and gas production began in
1949 when Halliburton Oil Well Cementing Company received the first patent and exclusive
license (Petroleum Transfer Technology Council, 2011). Although not part of the actual well
drilling process, this technique is used to increase the productivity of individual wells by
physically fracturing the bedrock in which the oil or natural gas is held and thereby facilitating
the movement of the oil or gas from the bedrock into the perforated casing of the well. The first
recorded use of hydraulic fracturing to stimulate deep gas wells in Pennsylvania occurred in
1953 in Elk County, Pennsylvania, on property owned by the Commonwealth of Pennsylvania
(Fettke, 1954). According to Lytle (1964) and Carter et al. (2011), by 1963, more than 70
percent of deep gas wells in Pennsylvania were stimulated using hydraulic fracturing technology.
The first horizontal oil well in Pennsylvania was drilled in 1944 and located in Venango
County. However, the applicability of horizontal well drilling technology to commercial gas
wells nationwide did not occur until the early 1980s (U.S. Energy Information Administration
(EIA), 1993)). It is unclear when the first horizontal gas well was drilled within Pennsylvania
using directional drilling technology. However, in 2003, Range Resources Corporation drilled
the Renz No. 1 gas well in Mount Pleasant Township, Washington County, Pennsylvania. The
well was subsequently deepened and hydraulically fractured in 2004. It is commonly held that
this Renz No. 1 well marked the beginning of the modern Marcellus Shale gas industry in
Pennsylvania (Carter et al., 2011). The marriage of horizontal well drilling technology with
hydraulic fracturing techniques defines the unconventional natural gas industry as it currently
exists within the Basin.
The unconventional natural gas industry first received permits to drill wells within the
Basin from the Pennsylvania Department of Environmental Protection (PADEP) in the first half
of 2005 (PADEP, 2012). Initial wells included both exploratory vertical wells and relatively
short horizontal wells. Both types of wells were primarily used by the industry to hold land
leases and prove that natural gas contained within specific geologic formations could be
physically and economically withdrawn.
It has been many years since a land use or natural resource development activity
occurring within the Basin has created more public scrutiny and a greater infusion of external
monetary investment than has the development of the unconventional natural gas industry.
Within a few short years, the industry that had been operating within the Basin for many decades
using conventional techniques and experiencing a slow but steady rise in production sprang to

3
life in a substantial way in 2008 (PADEP, 2012). Large multi-national energy companies and
smaller, more regional exploration companies realized considerable success using the proven
process of hydraulic fracturing performed in horizontal wells drilled into gas-containing shale
formations. These same formations underlie approximately 85 percent of the Basin (Berg et al.,
1980). Unlike the conventional gas industry that uses very little water for drilling and
development purposes, the unconventional gas industry uses hydraulic fracturing technology that
requires significant quantities of water. While many of the environmental issues surrounding the
unconventional gas industry fall to the state regulatory agencies responsible for addressing those
issues, the regulation of water acquisition and consumption by the unconventional gas industry
occurring within the Basin falls under the purview of the Susquehanna River Basin Commission
(SRBC, 2015).
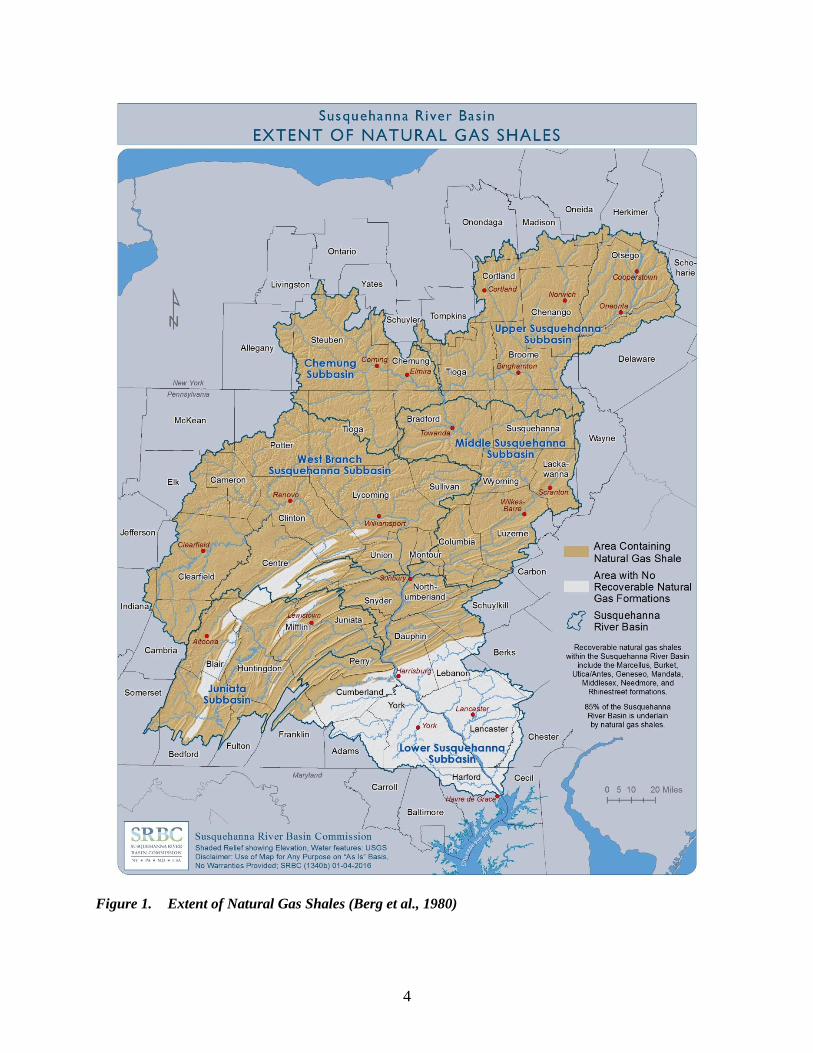
Although there are several natural gas-containing geologic formations in the
Susquehanna River Basin, the Marcellus Shale formation has been the formation most targeted
by the industry within the Basin during the study period. For this reason, the name Marcellus
Shale has been synonymous in the public’s eye with all unconventional natural gas development
occurring within the Basin and throughout the Mid-Atlantic region regardless of the specific
geologic formation actually being targeted. Figure 1 identifies the portion of the Basin underlain
by geologic formations known to contain recoverable amounts of natural gas, including the
Marcellus Shale.
4
Figure 1. Extent of Natural Gas Shales (Berg et al., 1980)

5
II. Part I. The Regulatory Role of the Susquehanna River Basin Commission
A. Regulation of Water Withdrawals, Consumptive Use, and Diversions
The Commission, created in 1971, is a result of the enactment of the Susquehanna River
Basin Compact (Compact) by the states of New York, Pennsylvania, and Maryland, and the
United States, and is vested with broad statutory authority to manage the water resources of the
Basin, including the authority to allocate the waters of the Basin.1 Its member jurisdictions have
delegated certain of their sovereign authorities to the Commission to act and jointly exercise that
authority on behalf of the entire Basin.
The Commission has exercised its authority to develop a regulatory program that:
manages the resource impacts of projects using the waters of the Basin;
avoids conflicts between users; and
provides standards to promote the equal and uniform treatment of all water
users without regard to political boundaries.2
Although the Commission does not regulate water quality, it fills a critical role in
monitoring water quality conditions in a consistent, watershed-based manner, across
jurisdictional and political boundaries.
Fundamentally, the Commission’s regulatory program requires approval of all large
water withdrawals and water uses proposed in the Basin. Thresholds in regulation specify
review of any project proposing to do any of the following:
withdraw 100,000 gallons per day (gpd) or more, based on a 30-day average,
from either groundwater or surface waters; or
consumptively use of 20,000 gpd or more, also based on a 30-day average.
By definition, diversions of water out of the Basin are considered to be a consumptive use
and are subject to a similar 20,000 gpd threshold. Diversions into the Basin, regardless of
quantity, are likewise subject to review and approval.3
Commission review and approval is also required for any project that meets any of the
following:
located on the boundary between member states;
will have a significant effect on the Commission’s comprehensive plan; or
could have an adverse effect individually or cumulatively on the water
resources in a member state, or an interstate effect on water resources.4
1 Susquehanna River Basin Compact, P.L. 91-575; 84 Stat. 1509 et seq. (1970)
2 18 CFR Parts 806-808
3 18 CFR §806.4(a)
4 18 CFR §806.4(a)5-7

6
Commission approval is provided to individual projects in the form of an official
document. This document is referred to as a docket. Each docket contains the name of the
project sponsor, a description of the project features, the location of the project, approved
withdrawal or consumptive use limits, general Commission conditions, and project-specific
conditions.
For water withdrawal applications, the Commission may limit, condition, or deny an
application to avoid significant adverse impacts, including cumulative adverse impacts, to the
water resources of the Basin. To that end, limitations can be imposed on the quantity, rate, or
timing of the approved withdrawals. Adverse impacts intended to be avoided include:
excessive lowering of water levels;
rendering competing water supplies unreliable;
causing permanent loss of aquifer storage capacity;
degradation of water quality that may be injurious to any existing or potential water
use;
adversely affecting fish, wildlife, or other living resources or their habitat; and
substantially impacting the low flow regime of perennial streams.
In taking action on applications for groundwater and surface water withdrawals, the
Commission relies on its guidelines and policies to make determinations on passby flow values
to be included as conditions to approvals, as needed and appropriate. The passby guidelines
were first adopted in 2003 and then revised in December 2012. The 2012 revision was based
upon a Basinwide study conducted in partnership with The Nature Conservancy (TNC) to update
the scientific framework used to protect aquatic resources, competing users, instream flow uses
located downstream from the point of withdrawal, and to prevent water quality degradation.5
Water use characteristics of the unconventional natural gas industry were also important
considerations in the development of the policy.
For each application seeking an approval that will impact a surface water feature, the
Commission may undertake a site-specific Aquatic Resource Survey (ARS) to establish baseline
conditions and determine appropriate limitations. The Commission may also use other site-
specific data collected by another resource agency or by the project sponsor if those data are
relevant and were collected at the project site within the past five years. The Commission then
evaluates these various data to formulate conditions in the approved docket related to (1) limits
on the quantity, timing, or rate of withdrawal; (2) limitations on the level of drawdown in a
stream, well, pond, lake, or reservoir; and (3) streamflow protection measures.
Projects involving the consumptive use of water are required to mitigate the loss of water
to the Basin, particularly during low flow conditions. Essentially, mitigation is required on a
gallon-for-gallon basis by employing one of several options defined in Commission regulation.
All water sources for a regulated consumptive use project are subject to review and approval,
regardless of the quantity of water withdrawn. For example, a withdrawal of 40,000 gpd may
not in itself trigger the regulatory threshold of 100,000 gpd, but it constitutes the source for a
5 Guidelines for Using and Determining Passby Flows and Conservation Releases for Surface-Water and Ground-
Water Withdrawal Approvals, Policy No. 2003-01 (November 8, 2002); Low Flow Protection Policy, Policy No.
2012-01(December 2012; Ecosystem Flow Recommendations for the Susquehanna River Basin (The Nature
Conservancy, 2010))
7
consumptive use that exceeds its regulatory threshold of 20,000 gpd and, therefore, requires
approval.
A comprehensive revision of Commission regulations occurred in December 2006.
Consumptive use regulations adopted in the December 2006 revision included a new Approval-
By-Rule (ABR) provision that streamlined the approval process for any project using public
water systems as their exclusive water source for consumptive use. The 2006 revision also
provided the Commission with sufficient management options to address the variety of water-
related projects occurring in the Basin, including with some subsequent enhancements covering
the industry.
B. Regulation of the Unconventional Natural Gas Industry
In December 2007, Commission staff began investigating water use for Marcellus Shale
well development after it received information from the PADEP regarding drilling permits it had
issued in the northern tier counties of Pennsylvania. Once the PADEP permits were reviewed by
the Commission, it was evident that the exploratory work being carried out by the industry did
not meet the Commission’s water withdrawal or consumptive use thresholds. Although the
drilling and hydraulic fracturing of an unconventional well uses more water than is required for
conventional gas wells, estimates of the amount of water required were both variable and
uncertain due to factors such as final well depth and construction, the specifics of the hydraulic
fracturing process, and the characteristics of the local shale formation.
Given the broad interest in the expansion of the natural gas industry in 2008, the
Commission recognized the potential for the industry to create adverse impacts to the water
resources of the Basin, regardless of whether individual projects met or fell below regulatory
thresholds. The Commission knew that gas-containing shales presented an optimal opportunity
for the development of this resource. Based on the geographic extent of the Marcellus formation
and extrapolated water use data from the Barnett, Haynesville, and Fayetteville Shale formations
located in other states, Commission staff estimated a potential cumulative consumptive water use
of up to 30 million gallons per day at full build-out, or slightly less than 11 billion gallons per
year.
While estimated consumptive water use for the gas industry was still significantly less
than public water supply and electrical generation estimates at the time (~325 million gallons per
day (mgd) and ~148 mgd, respectively), the Commission’s concerns with natural gas activity
were focused on the quantity, location, and timing of withdrawals. Most of the natural gas
development is focused in very rural, headwater areas in the Appalachian Region. With the
exception of the bottled water industry that tends to locate in pristine watersheds for the high
quality water, the vast majority of projects regulated by the Commission have historically been
located alongside the mainstem of the river, major tributaries, or in the valleys along streams
with sufficient flow characteristics. Quantities of water that could otherwise be considered
inconsequential on a major tributary could represent an important component of the water flow
regime in headwater areas.

8
Additionally, the nature of the water withdrawal and use by the industry is fundamentally
different than other users. The industry takes water from multiple, decentralized locations,
typically on an inconsistent basis, and uses it at dozens of locations based on its continuously
shifting operational needs. Although large quantities of water are critical to industry operations,
the locations of where the water is used are independent of and distant from water sources
capable of sustaining its demands. The prominent consumptive use, injection into the well
borehole for hydraulic fracturing, may only last a few days but may occur 10 to 12 times over the
life of a drilling pad as additional new wells are developed or existing wells are rehabilitated.
As a result of the overlay of headwater streams with the industry’s drilling and fracturing
activities, coupled with the unusual nature of water withdrawal and use by the industry, the
Commission began issuing natural gas well approvals in June 2008 as dockets covering
consumptive use for hydraulic fracturing. Separate dockets approving the supporting water
withdrawals for transport to the drilling pads were also issued for each water source (e.g., stream,
river, etc.). These dockets contained important requirements, including:
standard metering, monitoring, and reporting requirements;
conditions for protecting aquatic life during low stream flows;
the requirement to submit well completion reports;
signage to be posted that identified approved withdrawal sites and drilling pads;
and
a limited four-year term of approval.
Using the Commission’s existing ABR process, the first approvals were issued in July
2008 to the unconventional natural gas industry. These approvals covered the bulk water sales
from public water systems for consumptive use, and thus did not require the need for a full
review of an actual stream withdrawal. Using this administrative process streamlined application
review for gas companies exclusively using public water supplies since the withdrawal of water
at those public facilities would have previously been approved by either the Commission or its
member jurisdiction.
C. The “Gallon One” Modification
In August 2008, the Commission elected to modify its regulatory approach for the
industry when it lowered the existing regulatory thresholds for the industry. The modified
regulatory approach would commence the Commission’s review and approval authority
beginning at the first gallon for consumptive use and for withdrawals, rather than the traditional
regulatory thresholds noted earlier. The “Gallon One” modification resolved any potential
industry confusion about who needed to apply and minimized possible inadvertent violations.
The Commission believes this modification was appropriate to protect the Basin’s water
resources and simultaneously allow for the utilization of water by this new industry.
As the Commission increased its understanding of the unique water use characteristics of
the industry, it further modified its approach in 2009 by implementing new regulations
specifically designed for the industry. Those new regulations included the following:
9
A new ABR process specifically applicable to the industry was approved and a
transition strategy developed to ‘convert’ existing consumptive use approvals to
ABRs.
Consumptive use docket approvals would be issued as ABRs on a drilling pad
basis, regardless of the number of wells developed on the pad, and included
appropriate monitoring, reporting, and consumptive use mitigation requirements.
Unlike other ABRs that required exclusive use of water from public water
systems, these required only the exclusive use of Commission–approved water
sources and included a provision authorizing certain source approvals (public
water supplies and wastewater sources) under the ABR process.
A new provision for listing Commission-approved sources by company (rather
than by ABR) to streamline monitoring and reporting.
The industry was authorized to utilize any of its approved water sources at any
ABR site so as to provide operational flexibility and minimize the need for
redundant sources.
The industry was encouraged to share water source approvals between companies
by providing for a simple registration process to facilitate that sharing and limit
multiple stream withdrawal sites.
Incentives were provided for the use of lesser quality waters, including effluent
discharge and mine drainage, for hydraulic fracturing in lieu of fresh water
sources.
New policies encouraged the reuse or recycling of flowback and production fluids
for hydraulic fracturing.
Additional minor modifications relevant to the industry were made to the Commission’s
regulations in 2010 and 2011. Moving forward, the Commission will continue to take a dynamic
approach in the development of policies and regulations for the industry to make certain that the
right set of management controls are in place to allow this activity to occur while avoiding any
negative ecosystem impacts. The Commission is committed to continue to make adjustments
and refinements in its regulatory program to respond to changes in the programs of member
jurisdictions, the evolving water use practices and demand of the industry, and improved
understanding of ecosystem impacts.
III. Part II. Water Acquisition and Well Development Activities
A. Consumptive Water Use Approvals
In the second quarter of 2008, the Commission adopted an administrative process to
approve the consumptive use of water for unconventional natural gas and other hydrocarbon
development. The process, mentioned in the preceding section and referred to as the approval-
by-rule (ABR process), has specific requirements. To qualify for the ABR process, the industry
can only use the water for specific purposes and only when involving specific geologic
formations. Those specific purposes include gas well drilling, hydraulic fracturing, dust control,
and site reclamation. The specific gas-containing shale formations for which the ABR process
10
can be used include the Marcellus, Utica, and several other gas-containing low permeability
shale formations present within the Basin. Proof of PADEP well permit acquisition, public
notice requirements, metering requirements, site location maps, method of consumptive use
mitigation, and recording and reporting requirements are integral parts of the ABR process. All
construction-related activities associated with well pad development, including access roads,
sediment pits, and erosion and sedimentation controls, are regulated by the PADEP and not by
the Commission.
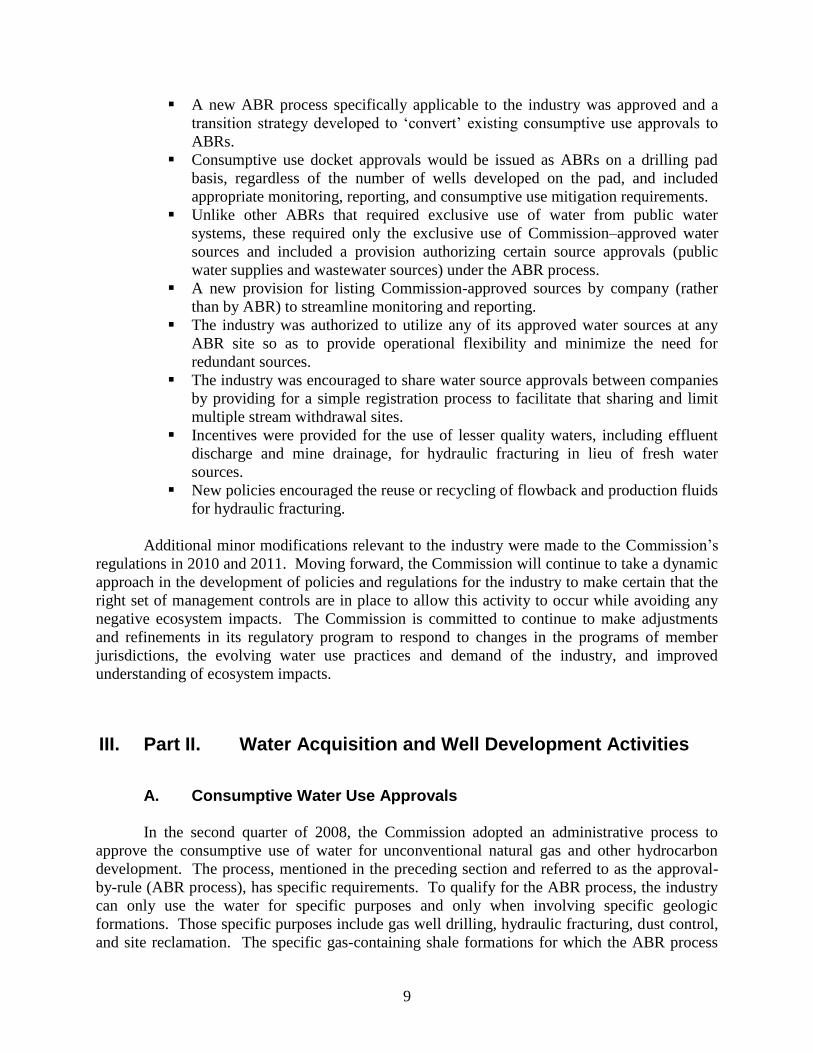
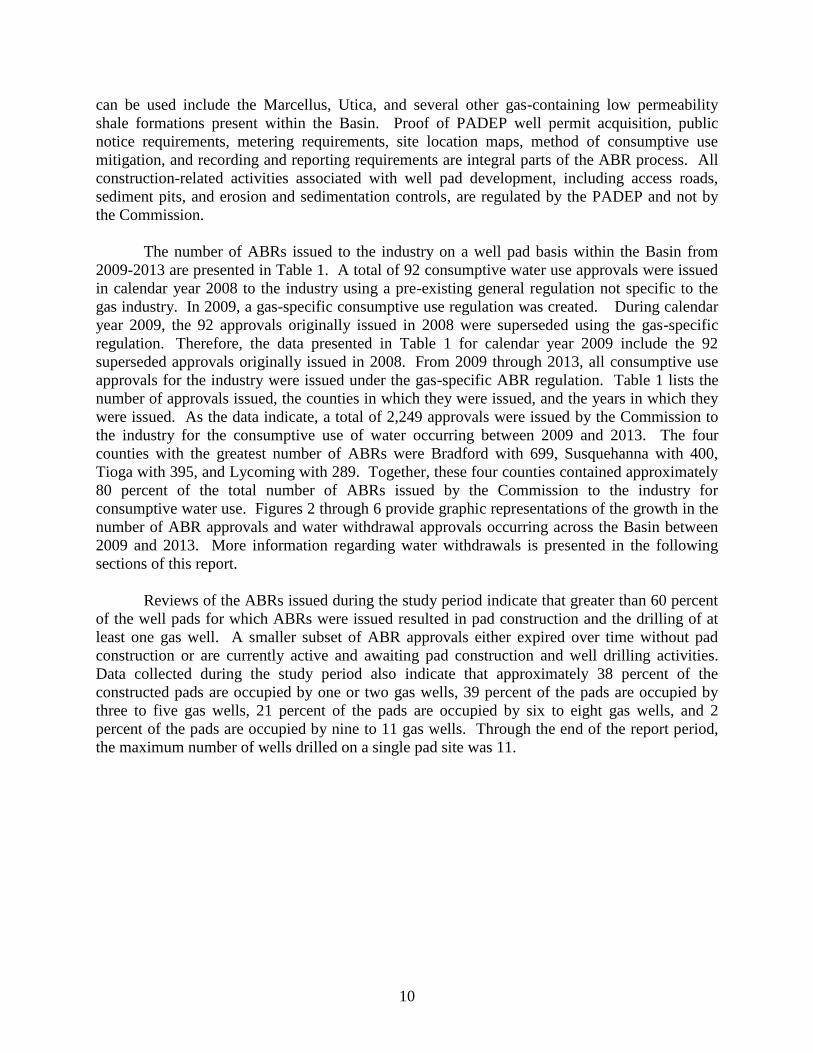
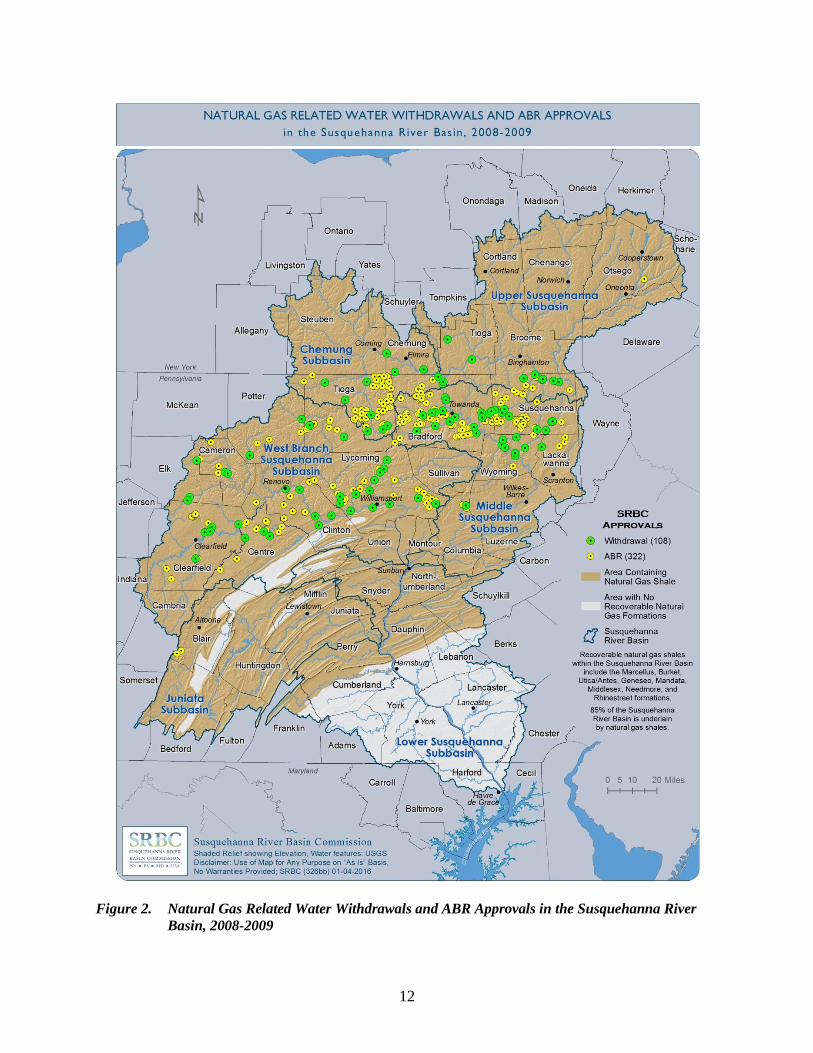
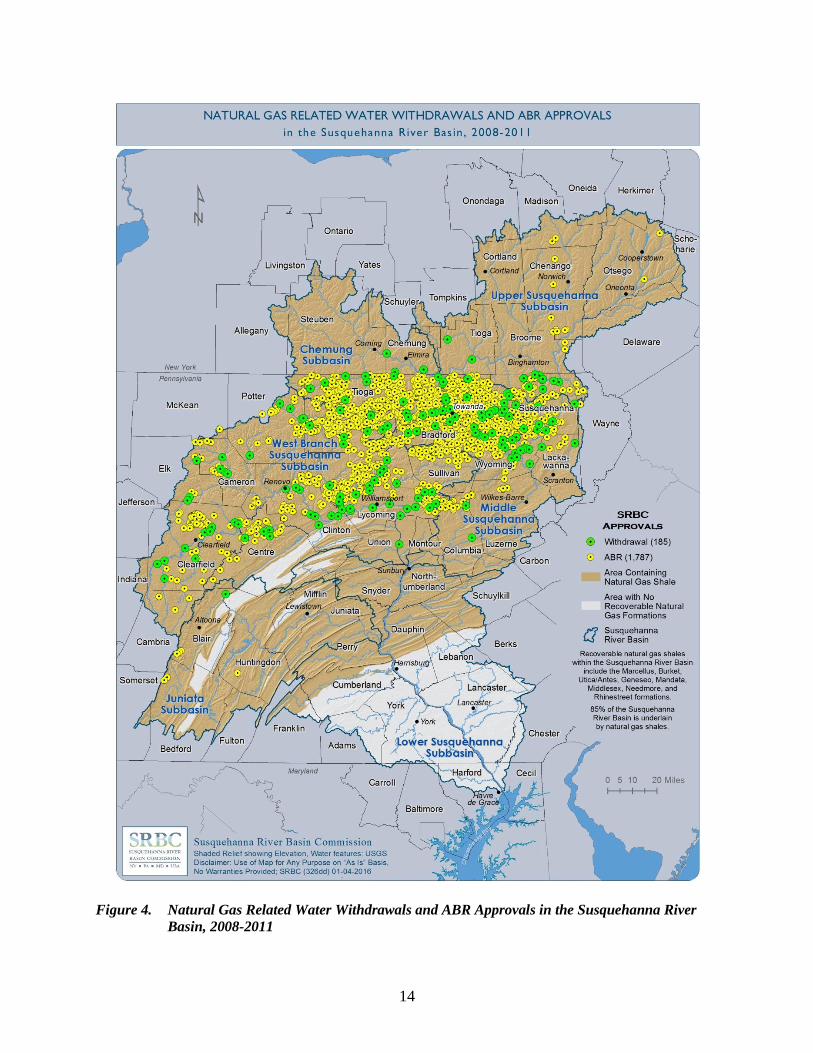
The number of ABRs issued to the industry on a well pad basis within the Basin from
2009-2013 are presented in Table 1. A total of 92 consumptive water use approvals were issued
in calendar year 2008 to the industry using a pre-existing general regulation not specific to the
gas industry. In 2009, a gas-specific consumptive use regulation was created. During calendar
year 2009, the 92 approvals originally issued in 2008 were superseded using the gas-specific
regulation. Therefore, the data presented in Table 1 for calendar year 2009 include the 92
superseded approvals originally issued in 2008. From 2009 through 2013, all consumptive use
approvals for the industry were issued under the gas-specific ABR regulation. Table 1 lists the
number of approvals issued, the counties in which they were issued, and the years in which they
were issued. As the data indicate, a total of 2,249 approvals were issued by the Commission to
the industry for the consumptive use of water occurring between 2009 and 2013. The four
counties with the greatest number of ABRs were Bradford with 699, Susquehanna with 400,
Tioga with 395, and Lycoming with 289. Together, these four counties contained approximately
80 percent of the total number of ABRs issued by the Commission to the industry for
consumptive water use. Figures 2 through 6 provide graphic representations of the growth in the
number of ABR approvals and water withdrawal approvals occurring across the Basin between
2009 and 2013. More information regarding water withdrawals is presented in the following
sections of this report.
Reviews of the ABRs issued during the study period indicate that greater than 60 percent
of the well pads for which ABRs were issued resulted in pad construction and the drilling of at
least one gas well. A smaller subset of ABR approvals either expired over time without pad
construction or are currently active and awaiting pad construction and well drilling activities.
Data collected during the study period also indicate that approximately 38 percent of the
constructed pads are occupied by one or two gas wells, 39 percent of the pads are occupied by
three to five gas wells, 21 percent of the pads are occupied by six to eight gas wells, and 2
percent of the pads are occupied by nine to 11 gas wells. Through the end of the report period,
the maximum number of wells drilled on a single pad site was 11.

11
Table 1. Summary of Approval-By-Rule Issued to the Natural Gas Industry
ABRs Issued by Year County
County 2009 2010 2011 2012 2013 Totals
Bedford 0 1 1 0 2 4
Blair 2 2 0 0 0 4
Bradford 79 346 145 93 36 699
Cambria 0 0 3 1 0 4
Cameron 4 6 5 0 0 15
Centre 16 26 3 0 0 45
Clearfield 18 37 31 5 1 92
Clinton 12 16 12 3 3 46
Columbia 2 10 10 0 0 22
Elk 0 3 1 0 0 4
Huntingdon 0 1 0 0 0 1
Lackawanna 3 3 0 0 0 6
Luzerne 0 7 0 0 0 7
Lycoming 37 101 66 51 34 289
McKean 0 1 0 0 0 1
Potter 4 11 13 0 0 28
Sullivan 0 41 20 17 4 82
Susquehanna 69 93 77 90 71 400
Tioga (PA) 70 234 61 24 6 395
Wayne 1 7 0 0 0 8
Wyoming 4 34 24 9 12 83
Broome (NY) 0 3 0 0 0 3
Chenango (NY) 0 7 0 0 0 7
Madison (NY) 0 2 0 0 0 2
Otsego (NY) 1 1 0 0 0 2
Annual Totals 322 993 472 293 169 2249
12
Figure 2. Natural Gas Related Water Withdrawals and ABR Approvals in the Susquehanna River
Basin, 2008-2009

13
Figure 3. Natural Gas Related Water Withdrawals and ABR Approvals in the Susquehanna River
Basin, 2008-2010
14
Figure 4. Natural Gas Related Water Withdrawals and ABR Approvals in the Susquehanna River
Basin, 2008-2011

15
Figure 5. Natural Gas Related Water Withdrawals and ABR Approvals in the Susquehanna River
Basin, 2008-2012

16
Figure 6. Natural Gas Related Water Withdrawals and ABR Approvals in the Susquehanna River
Basin, 2008-2013

17
B. Gas Wells Permitted, Drilled, and Fractured within the Basin
The next 12 sections in this report will provide detailed information on the topics listed
below based upon actual data available from PADEP’s oil and gas reports (PADEP, 2012) and
from information collected by the Commission as part of its reporting requirements for the
industry. These topics include:
the number of wells drilled;
the number of wells hydraulically fractured;
the amounts of water used by the industry to hydraulically fracture wells;
the watersheds from where the water was withdrawn;
the amount of flowback realized following the well fracturing process; and
the amount of flowback reused in subsequent fracturing efforts.
During the report period, the Commonwealth of Pennsylvania was the only Basin
member jurisdiction approving the use of unconventional horizontal hydraulic fracturing
technology by the industry. Within the Commonwealth of Pennsylvania’s portion of the Basin,
unconventional well drilling and hydraulic fracturing began in 2005. PADEP regulations require
the industry to obtain permits before drilling conventional or unconventional natural gas wells
and to file well completion reports within 30 days after the permitted wells are drilled and
hydraulically fractured (25 Pa. Code Chapter § 78.122(b)).
Commission regulations require the industry to obtain prior approval from the
Commission for all consumptive water uses related to drilling and fracturing of unconventional
natural gas wells on each pad site and for all water withdrawals used to support those activities.
In addition, the industry is required to file a post-hydraulic fracture report to the Commission for
each unconventional gas well so stimulated. These reports include well identification
information, the date of the hydraulic fracturing event, the pressure release date, and the
quantities and general types of fluids injected and recovered. The types of fluids include fresh
water, flowback fluids, and production fluids.
During the period from July 2008 through May 2012, the gas industry was required to
submit post-hydraulic fracture reports to the Commission within 30 days after each well was
hydraulically fractured. During this period, some members of the industry used stimulation
practices that, following fluid injection, held the formation under pressure for days, weeks, or
even months before releasing pressure. This “shut-in” condition prevented flowback from
occurring and thus from being included in the reports. Consequently, beginning in June 2012,
the Commission required the gas industry to report flowback occurring within the first 30 days
following the date on which the release of pressure was made in each well fractured (also
referred to as the initial fluids recovery period). This change resulted in the collection of more
meaningful data on the quantities, rates, and timing of flowback from the fractured gas wells.
The well permits issued to the industry by PADEP, the well completion reports filed by
the industry with PADEP, and the post-hydraulic fracturing reports submitted by the industry to
the Commission were used to compile the information presented in tabular form in Table 2 and

18
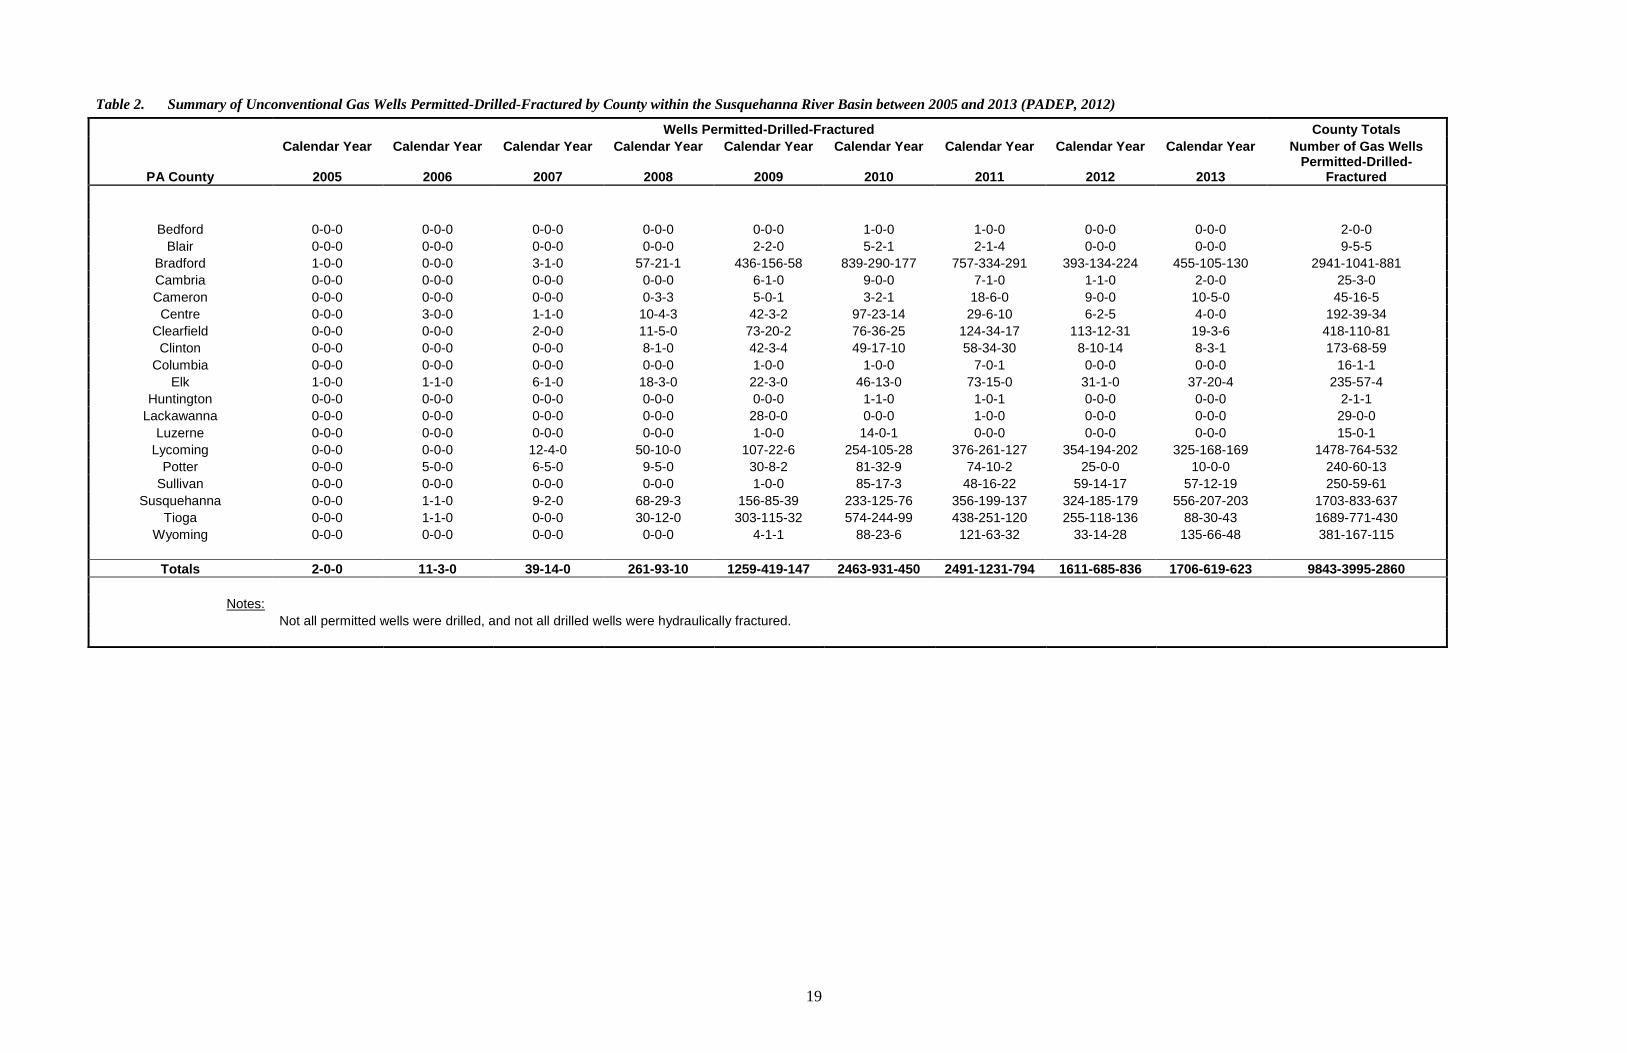
in graphic form in Figure 7. Table 2 provides a breakdown of wells permitted, wells drilled, and
wells hydraulically fractured within the Basin by county and by calendar year. The data span the
period from the first quarter of 2005 through the fourth quarter of 2013. The information
summarized in Table 2 pertains only to unconventional natural gas wells located within the
Pennsylvania portion of the Basin. No conventional wells located within the Basin nor
conventional or unconventional gas wells located outside the Basin were included in the
summary.
As indicated in Table 2, no unconventional gas wells were reportedly drilled within the
Basin in 2005, with only 3 wells reportedly drilled in 2006 and 14 reportedly drilled in 2007. It
was not until 2008 that more substantial numbers of gas wells were permitted and drilled in the
Basin, and it was not until 2009 that significant numbers of those wells were hydraulically
fractured. As of December 31, 2013, there were a total of 9,843 wells permitted within the
Basin. The total number of wells drilled and fractured within the Basin by December 31, 2013,
were 3,995 and 2,860, respectively. These numbers suggest that, as of that date, approximately
one out of every three wells permitted by PADEP were subsequently drilled, and approximately
70 percent of the wells drilled were subsequently hydraulically fractured. It is anticipated that a
greater percentage of the drilled wells will be fractured as more gathering and transmission
pipelines are constructed.
19
Table 2. Summary of Unconventional Gas Wells Permitted-Drilled-Fractured by County within the Susquehanna River Basin between 2005 and 2013 (PADEP, 2012)
Wells Permitted-Drilled-Fractured County Totals
Calendar Year Calendar Year Calendar Year Calendar Year Calendar Year Calendar Year Calendar Year Calendar Year Calendar Year Number of Gas Wells
PA County 2005 2006 2007 2008 2009 2010 2011 2012 2013 Permitted-Drilled-
Fractured
Bedford 0-0-0 0-0-0 0-0-0 0-0-0 0-0-0 1-0-0 1-0-0 0-0-0 0-0-0 2-0-0
Blair 0-0-0 0-0-0 0-0-0 0-0-0 2-2-0 5-2-1 2-1-4 0-0-0 0-0-0 9-5-5
Bradford 1-0-0 0-0-0 3-1-0 57-21-1 436-156-58 839-290-177 757-334-291 393-134-224 455-105-130 2941-1041-881
Cambria 0-0-0 0-0-0 0-0-0 0-0-0 6-1-0 9-0-0 7-1-0 1-1-0 2-0-0 25-3-0
Cameron 0-0-0 0-0-0 0-0-0 0-3-3 5-0-1 3-2-1 18-6-0 9-0-0 10-5-0 45-16-5
Centre 0-0-0 3-0-0 1-1-0 10-4-3 42-3-2 97-23-14 29-6-10 6-2-5 4-0-0 192-39-34
Clearfield 0-0-0 0-0-0 2-0-0 11-5-0 73-20-2 76-36-25 124-34-17 113-12-31 19-3-6 418-110-81
Clinton 0-0-0 0-0-0 0-0-0 8-1-0 42-3-4 49-17-10 58-34-30 8-10-14 8-3-1 173-68-59
Columbia 0-0-0 0-0-0 0-0-0 0-0-0 1-0-0 1-0-0 7-0-1 0-0-0 0-0-0 16-1-1
Elk 1-0-0 1-1-0 6-1-0 18-3-0 22-3-0 46-13-0 73-15-0 31-1-0 37-20-4 235-57-4
Huntington 0-0-0 0-0-0 0-0-0 0-0-0 0-0-0 1-1-0 1-0-1 0-0-0 0-0-0 2-1-1
Lackawanna 0-0-0 0-0-0 0-0-0 0-0-0 28-0-0 0-0-0 1-0-0 0-0-0 0-0-0 29-0-0
Luzerne 0-0-0 0-0-0 0-0-0 0-0-0 1-0-0 14-0-1 0-0-0 0-0-0 0-0-0 15-0-1
Lycoming 0-0-0 0-0-0 12-4-0 50-10-0 107-22-6 254-105-28 376-261-127 354-194-202 325-168-169 1478-764-532
Potter 0-0-0 5-0-0 6-5-0 9-5-0 30-8-2 81-32-9 74-10-2 25-0-0 10-0-0 240-60-13
Sullivan 0-0-0 0-0-0 0-0-0 0-0-0 1-0-0 85-17-3 48-16-22 59-14-17 57-12-19 250-59-61
Susquehanna 0-0-0 1-1-0 9-2-0 68-29-3 156-85-39 233-125-76 356-199-137 324-185-179 556-207-203 1703-833-637
Tioga 0-0-0 1-1-0 0-0-0 30-12-0 303-115-32 574-244-99 438-251-120 255-118-136 88-30-43 1689-771-430
Wyoming 0-0-0 0-0-0 0-0-0 0-0-0 4-1-1 88-23-6 121-63-32 33-14-28 135-66-48 381-167-115
Totals 2-0-0 11-3-0 39-14-0 261-93-10 1259-419-147 2463-931-450 2491-1231-794 1611-685-836 1706-619-623 9843-3995-2860
Notes: Not all permitted wells were drilled, and not all drilled wells were hydraulically fractured.

20
Figure 7. Wells Permitted, Drilled, and Fractured from 2005-2013 (PADEP, 2012)
C. Water Withdrawn and Consumptively Used by the Industry
Water consumptively used by the industry originates from surface water sources or
groundwater sources, or a combination of the two. Surface water sources include water
withdrawn from streams, creeks, rivers, lakes, ponds, and perennial springs. Groundwater
sources include water withdrawn from individual water wells and from water well-fields. Water
withdrawn from public water systems can be comprised of a combination of both surface water
and groundwater sources. One hundred percent of all waters withdrawn from the Basin by the
industry, regardless of source, are considered by the Commission to be consumptively used and
therefore removed from the hydrologic cycle of the Basin.
Table 3 contains a summary of the amounts of water consumptively used by the industry,
the amounts of surface water and groundwater withdrawn from approved locations, the amounts
of water diverted into the Basin, and the amounts of water obtained from other Commission
approved sources, primarily public water systems. As previously noted, it is easier to understand
consumptive use versus water withdrawals if one simply considers water withdrawals as the
beginning of the water journey and consumptive use to be the end of the journey (i.e., water
injected into a well during fracturing efforts). Table 3 provides a breakdown of water
consumptively used and water withdrawn within the Basin by the industry by quarter and by
calendar year. The data span the study period from the third quarter of 2008 through the fourth
quarter of 2013.
The values presented in Table 3 for the average daily consumptive use (CU) rate by
quarter (in gallons per day) were calculated by dividing the total quantity of consumptive water
use (in gallons) reported by the industry for a given quarter by the number of days in that quarter.

21
Likewise, the average daily docketed sources (in gallons per day) for each quarter were
calculated by dividing the total quarterly quantities of water withdrawals (both surface water and
groundwater) reported by the industry for a given quarter by the number of days in that quarter.
The same procedure was followed for the calculation of the average daily non-docketed sources.
Therefore, these average daily values represent calculated averages and not daily averages
directly reported by the industry. Figure 7 provides a graphic representation of these calculated
average daily consumptive water use rates for each quarter and year of the report period.
Insufficient data were collected to adequately define the consumptive use and withdrawal
of water by the industry prior to the Commission’s involvement and its imposition of standard
metering, monitoring, and reporting requirements which occurred in the third quarter of 2008.
Anecdotal information provided by the industry suggests only limited water use prior to 2008.
Given the relatively low number of wells (approximately 50) permitted by PADEP, and even
fewer wells drilled and subsequently stimulated using high-volume hydraulic fracturing prior to
mid-2008, the amount of unreported water collectively used by the industry prior to mid-2008 is
believed to be very small compared to the amount of water use reported subsequent to mid-2008.
As indicated in Table 3, from the third quarter of 2008 through the third quarter of 2009,
approximately 60 to 90 percent of water consumptively used by the industry originated at public
water systems. These public systems relied heavily upon both surface water and groundwater
sources to meet their overall water demands. Beginning in the fourth quarter of 2009 and
extending through the fourth quarter of 2012, the primary sources of water for the industry
transitioned from public systems to individual surface water withdrawals approved (and
docketed) by the Commission and developed and controlled by individual gas companies or by
private third-party water purveyors. By the first quarter of calendar year 2013, the percent of
water taken from public water systems and consumptively used by the gas industry had dropped
below 5 percent of the total water used. It remained below 10 percent throughout the remainder
of 2013.

22
Table 3. Quarterly Summary of Consumptive Water Use, Water Withdrawals, and Water Diversions by the Unconventional Gas Industry within the Susquehanna River Basin from the Third Quarter 2008 through the Fourth Quarter
2013
Quarter/Year
Total
Quarterly Consumptive
Use (Gallons)
1
Average Daily
CU Rate by Quarter
(GPD2)
Docketed Quarterly
Groundwater Withdrawals
(Gallons)
Docketed Quarterly
Surface Water Withdrawals
(Gallons)
Docketed Quarterly
Diversions Into Basin (Gallons)
Average Daily
Docketed Sources (GPD)
Non-Docketed Approved
Surface Water Withdrawals
(Gallons)3
Average Daily Non-
Docketed Sources (GPD)
Subtotals of Docketed and Non-Docketed Water Sources
(Gallons)4
Q3-2008 21,043,635 228,735 0 2,029,900 0 22,064 19,013,735 206,671 21,043,635
Q4-2008 34,546,442 375,505 0 14,255,620 0 154,952 20,290,822 220,552 34,546,442
Q1-2009 38,260,212 425,113 0 3,935,900 0 43,732 34,324,312 381,381 38,260,212
Q2-2009 75,542,837 830,141 0 36,223,528 0 398,061 39,319,309 432,080 75,542,837
Q3-2009 142,020,554 1,543,702 0 54,171,241 0 588,818 87,849,313 954,884 142,020,554
Q4-2009 221,861,054 2,411,533 0 190,925,721 0 2,075,280 30,935,333 336,254 221,861,054
Q1-2010 300,098,336 3,334,426 0 231,732,471 0 2,574,805 68,365,865 759,621 300,098,336
Q2-2010 542,943,345 5,966,410 0 460,382,624 0 5,059,150 10,855,767 119,294 471,238,391
Q3-2010 745,188,983 8,099,880 8,866,785 598,641,071 0 6,603,346 294,225,471 3,198,103 901,733,327
Q4-2010 715,797,806 7,780,411 35,691,923 705,122,887 11,193,000 8,173,998 158,407,047 1,721,816 910,414,857
Q1-2011 751,501,919 8,350,021 73,173,854 505,136,522 1,335,359 6,440,508 128,152,499 1,423,917 707,798,234
Q2-2011 905,546,785 9,951,064 81,615,842 578,166,205 31,123 7,250,694 140,780,551 1,547,039 800,593,721
Q3-2011 1,121,682,212 12,192,198 58,632,120 664,570,345 126,492 7,862,271 91,632,400 996,004 814,961,357
Q4-2011 1,035,380,050 11,254,131 123,067,345 825,308,288 13,437,118 10,454,486 245,472,039 2,668,174 1,207,284,790
Q1-2012 1,061,866,165 11,668,859 137,968,611 829,322,145 4,605,842 10,680,182 89,826,896 987,109 1,061,723,494
Q2-2012 1,114,629,592 12,248,677 120,093,248 696,941,787 4,754,339 9,030,652 49,052,219 539,035 870,841,593
Q3-2012 756,195,963 8,219,521 72,265,632 294,854,850 0 3,990,440 192,615,034 2,093,642 559,735,516
Q4-2012 714,641,714 7,767,845 58,865,915 501,383,163 0 6,089,664 96,307,517 1,046,821 656,556,595
Q1-2013 963,623,981 10,706,933 28,880,831 628,752,006 0 7,307,032 40,826,946 453,633 698,459,783
Q2-2013 833,906,784 9,163,811 34,887,036 699,203,581 0 8,066,930 43,107,368 473,707 777,197,985
Q3-2013 535,652,001 5,822,304 70,424,438 519,564,775 0 6,412,926 51,920,107 564,349 641,909,320
Q4-2013 779,765,012 8,475,707 93,969,232 725,010,113 2,582,878 8,930,024 38,822,099 421,979 860,384,322
Long-Term Totals (Gallons) 13,411,695,382 998,402,812 9,765,634,743 38,066,151 1,972,102,649 12,774,206,355
Long-Term Daily Averages (GPD)
6,673,497
5,373,183 979,367
1 Consumptive water use from all docketed withdrawal sources, plus other sources approved pursuant to 806.22(f). 2 Abbreviations: GPD, Gallons per Day. Daily average values for each quarter were calculated by dividing quarterly totals by the number of days in each quarter. 3 The vast majority of the non-docketed approved water sources are comprised of public water systems (PWSs); however, these sources also include impaired waters such as abandoned mine discharges (AMD), industrial and municipal wastewaters, pad stormwaters, tophole waters, etc. The gray
shaded numbers in Columns 8 and 9 were calculated by the Commission from PADEP data. The unshaded numbers in Columns 8 and 9 were reported by the gas industry directly to the Commission. 4 In any given quarter, there will be differences between the Total Consumptive Water Use (Column 2) and the combination of Docketed Water Withdrawals and Diversions (Columns. 4, 5, and 6) plus Non-Docketed Approved Water Sources (Column 8) due to the plus/minus 5 percent accuracy of
flow meters, and due to the dynamic changes in the amounts of water moving into or out of storage impoundments and storage tanks located on specific pads or in centralized locations.
23
D. Total Consumptive Water Use
The total amount of water consumptively used by the industry from July 2008 through
December 2013 was 13.4 billion gallons. The highest average daily consumptive water use and
highest average water withdrawal rate by the industry calculated by the Commission on a
quarterly basis for the report period were 12.2 mgd and 10.7 mgd, respectively, and occurred
during the first two quarters of 2012. As the data in Table 2 indicate, calendar year 2012 had the
greatest annual number of wells fractured at 836, following closely behind by calendar year 2011
with 794 wells fractured. During calendar year 2013, the total number of wells hydraulically
fractured dropped to 623.
While it is important to note that the total amount of water consumptively used by the
industry during the report period was significant at 13.4 billion gallons, the average daily usage
rate of approximately 6.7 mgd during that same period was comparable to other concurrent water
users within the Basin. For example, manufacturing-related activities consumptively used an
average of 8.6 mgd of water while entertainment and recreational water users (amusement parks,
golf courses, and ski areas) consumed on average approximately 6.2 mgd. Electric power
generators, including nuclear power plants, consumed an average of 86.2 mgd and constituted
the single largest consumptive user of water within the Basin.
E. Total Surface Water Withdrawn by the Industry
A total of 9.76 billion gallons of surface water were withdrawn from waterways within
the Basin and consumptively used by the industry during the report period. An additional 1.97
billion gallons of water were withdrawn within the same time period from other approved
sources by the industry, primarily from public water systems. Together, these two major sources
of water comprised approximately 88 percent of the total amount of water withdrawn and
consumptively used by the industry.
Approximately 70 percent of the approved surface water withdrawals for the industry
were conditioned with site-specific low flow thresholds below which the water withdrawal
activities must cease. These restrictions are defined within Commission dockets as low flow
protection or passby conditions. Every low flow threshold is unique to each project location and
is based on technical evaluations and recommendations by staff at the Commission. The primary
purpose of each low flow threshold is to afford adequate protection to other downstream water
users and to instream aquatic ecosystems during periods of low streamflow at the points of
withdrawal.
Estimates were made by the Commission of the quarterly amounts of water obtained by
the industry from approved public systems prior to the advent of direct reporting in 2010. The
amounts of water originating from approved but non-docketed public water systems for the third
quarter of 2008 through the first quarter of 2010 were estimated by subtracting docketed
withdrawal amounts from docketed consumptive use amounts for each quarter during that period
of time. While these quarterly numbers should be considered estimated quantities, it is believed

24
that they are reasonably accurate given subsequent comparisons with reported public system
usage following the second quarter of 2010.
F. Total Groundwater Withdrawn by the Industry
A total of 998 million gallons, or 7.5 percent of the water consumptively used by the
industry during the five-year period, originated solely from groundwater sources. The majority
of this groundwater (774 million gallons) originated at docketed public water systems or from
third-party water purveyors docketed by the Commission. The balance (224 million gallons)
originated at administratively-approved public water systems. Approximately 177 million
gallons of water, or 18 percent of the total 998 million gallons of groundwater used by the
industry, originated from groundwater sources docketed by the Commission and under the direct
control or ownership of the gas industry.
G. Total Diversion of Water Into the Basin
The diversion of water into the Susquehanna River Basin from the Ohio River Basin for
unconventional natural gas development during the study period was approximately 38 million
gallons. This quantity constitutes approximately 0.3 percent of the total amount of water
consumptively used by the industry. A portion of this diverted water was comprised of flowback
and possibly some produced waters generated on well pads located within the Ohio River Basin
and transported to well pads located within the Susquehanna River Basin for use in subsequent
well fracturing events. As part of the Commission’s into-Basin diversion approval process, all
flowback and produced waters regardless of origin must remain isolated from all fresh waters of
the Basin and be used solely for down-hole fracturing activities at approved drilling pad sites.
H. Total Consumptive Water Use versus Total Water Withdrawals
During the report period, the total reported consumptive water use (13.4 billion gallons)
exceeds the combined total reported withdrawals and diversions (12.77 billion gallons) by
approximately 637 million gallons, or 4.8 percent of the total consumptive use. This difference is
likely attributable to the capture and use of top-hole water and precipitation falling on pad sites
that was correctly included by the industry in consumptive use reports, and to a lesser degree, the
limits of the accuracy of the meters, as well as human error during monitoring and reporting.
However, it is impossible to entirely discount that some water was withdrawn from unapproved
sources, although Commission staff routinely review for non-compliance and resolved several
violations involving use of unapproved sources during the report period. Overall, regardless of
the discrepancy, a value of 5 percent or less offers confidence that accurate and comprehensive
water use tracking is occurring.
I. Details of Surface Water Withdrawals
The magnitude of the quarterly surface water withdrawal data contained in Table 3
reflects the importance of surface water sources to the industry. Approximately 93 percent of the

25
water consumptively used by the industry since 2008 is believed to have originated at surface
water withdrawal sites. With a few exceptions, surface water and groundwater approvals issued
by the Commission for the industry are valid for a period of four years and subject to additional
review prior to renewal. Factors such as foreseeable water demand, availability of alternative
water sources, competing water uses within the watershed, stream classification, stream water
quality, and other similar factors are considered during the review process.
The Commission also created incentives for the industry to use lesser quality waters in its
operations. Lesser quality waters include those waters affected by some form of pollution, such
as abandoned mine drainage (AMD), municipal and industrial wastewaters, and other impaired
waters. The incentive is in the form of discounted application fees associated with water
withdrawals from these sources and/or relaxed passby flow restrictions consistent with SRBC
Resolution Number 2012-01, Use and Reuse of Lesser Quality Water.
Table 4 presents a summary of the number of surface water and groundwater withdrawal
approvals issued by the Commission during the study period to the industry and to third-party
water purveyors serving the industry. Note that the first withdrawal approvals issued in calendar
year 2008 expired or were renewed four years later in calendar year 2012. Likewise, the
withdrawal approvals originally issued in 2009 expired or were renewed in calendar 2013. Also
included in Table 4 are the cumulative number of approved withdrawal locations available for
use and the number of withdrawal projects that were actually used (water actively withdrawn)
during those years.
During the report period, there were a total of 222 surface water withdrawals approved by
the Commission for use in natural gas development. These approvals were issued directly to the
industry or to third parties serving the industry. Twenty-eight of those approvals were rescinded
for various administrative reasons, 35 of the approvals expired and were subsequently renewed,
and 58 approvals expired and were not renewed. Eight groundwater withdrawals were approved
during that same time period, with none rescinded or expired by the end of December 2013
(Table 4).

26
Table 4. Summary of Water Withdrawal Approvals within the Susquehanna River Basin for Use by Unconventional Natural Gas Industry
Summary of Water Withdrawal Approvals for Unconventional Gas Industry Use (Includes All Approvals Located within the Susquehanna River Basin Issued to the Gas Industry and to Third-Party Water Purveyors)
Calendar Calendar Calendar Calendar Calendar Calendar
Year Year Year Year Year Year
Statistics 2008 2009 2010 2011 2012 2013 Totals
Surface Water (SW)Withdrawals:
New SW Approvals Issued during Calendar Year 51 57 35 42 28 9 222
Expiring SW Approvals Renewed during Calendar Year 0 0 0 0 15 20 35
Expiring Approvals Not Renewed during Calendar Year 0 0 0 0 31 27 58
SW Approvals Actively Withdrawing Water during Calendar Year 3 19 39 57 52 46 -----
Groundwater (GW) Withdrawals:
New GW Approvals Issued during Calendar Year 0 0 2 2 4 0 8
Expiring GW Approvals Renewed during Calendar Year 0 0 0 0 0 0 0
Expiring GW Approvals Not Renewed during Calendar Year 0 0 0 0 0 0 0
GW Approvals Actively Withdrawing Water during Calendar Year 0 0 2 3 3 4 -----
Descriptive Notes:
1. According to Commission regulations, if projects are not constructed within three years following initial approval, the projects are ruled to have expired on that third
year.
2. As demonstrated in the last line of each section above, not all projects issued approvals were ultimately constructed and actively used to withdraw water.
3. There were an additional 10 surface water diversion approvals issued by the Commission in 2011 and one in 2013. All of the diversions originated from within the
Ohio River Basin. Only 2 of the 11 diversions approved from the Ohio River Basin were actively used as of Dec. 31, 2013.

27
It is important to note in Table 4 that the number of surface water and groundwater
withdrawals available for use during any given calendar year were considerably greater than the
number of withdrawal sites actually used to support natural gas development activities. Of the
available surface water withdrawals, 37 were from lesser quality waters, including three
discharges from treatment plants and 34 mine drainage waters associated with past coal mining
activities. Thirteen of the lesser quality sites were actively used by the industry during the report
period, with a total of approximately 865 million gallons of impaired water withdrawn.
Data collected during the study period highlight the fact that the industry functions
differently than other more traditional water users within the Basin. Unlike “brick-and-mortar”
facilities such as power plants, public water systems, and manufacturing facilities where the
locations of water use remain stationary over time, the gas industry’s water needs migrate
considerable distances over relatively short periods of time. In addition, the industry
intentionally builds in redundancy of water sources. This redundancy serves to decrease water
trucking distances between various stationary water withdrawal points (sources) and active pad
sites where the water is needed, to increase the availability of water regardless of the specific
wells being fractured or the inactivation of certain water withdrawal locations due to prevailing
low flow conditions, and to increase the overall flexibility of the water supply network upon
which the companies rely. Efforts by the industry to minimize water truck travel distances and
to optimize its water acquisition strategy at any given point in time initially resulted in the
increased occurrence of approved water withdrawal sites that were not subsequently used, or
perhaps used less frequently than originally envisioned by the individual companies and the
Commission.
J. Watershed Distribution of Approved Surface Water Withdrawal Sites
A total of 222 surface water withdrawal sites were approved by the Commission during
the report period, although some of these approvals were expired or were withdrawn before the
end of the period. These approved sites were located within 61 individual watersheds. For the
purposes of this report, an individual watershed is one in which a surface water feature (such as a
run or creek) has been named by the United States Geological Survey (USGS) and appears as a
named water feature on a USGS 7.5-minute topographic map. As a point of clarification, only
water withdrawals pulling directly from the mainstem or West Branch of the Susquehanna River
were attributed to the river. Water withdrawals from named watersheds flowing into the river
were attributed to those named watersheds and not counted as withdrawals from the river itself.
Likewise, withdrawals from more headwater settings were attributed to those named upper
watersheds and not to the larger watersheds into which they flow.
Forty-four of the 61 individual watersheds were occupied by only one or two approved
surface water withdrawal sites. Six watersheds were occupied by three to five approved surface
water withdrawal sites. These six watersheds included Cowanesque River with five approved
sites, and Chemung River, Moshannon Creek, and Towanda Creek each with four approved
sites. Martins Creek and Little Muncy Creek (a tributary to Muncy Creek) each had three
approved withdrawal sites.

28
Five watersheds were occupied by six to 10 approved surface water withdrawal sites.
These five watersheds included Meshoppen Creek, Muncy Creek (including the Little Muncy
Creek tributary with 3 sites), and Tioga River each with six approved sites, and Lycoming Creek
and Sugar Creek each with nine approved sites.
Four watersheds were occupied by 11 to 20 approved surface water withdrawal sites.
These four watersheds included Sinnemahoning Creek with 11 approved sites, Pine Creek and
Tunkhannock Creek each with 13 approved sites, and Wyalusing Creek with 15 approved sites.
The mainstem Susquehanna River and the West Branch Susquehanna River both had 25
approved sites. No watersheds were occupied by more than 25 approved surface water
withdrawal sites.
K. Number of Approved Surface Water Withdrawals Sites Used by the Gas Industry
Thirty-nine of the 61 Basin watersheds with surface water approvals had sites that were
actually used by the industry as sources of water during the report period. Twenty-two of the 61
watersheds were occupied by approved surface water withdrawal sites that were never used.
Twenty-seven of the 61 watersheds had only one or two actively used water withdrawal sites.
Eight of the 61 watersheds had between three and five actively used water withdrawal sites.
These included the Chemung River and Muncy Creek each with three actively used withdrawal
sites. Cowanesque River and Tioga River each had four actively used withdrawal sites.
Lycoming Creek, Meshoppen Creek, Sugar Creek, and Tunkhannock Creek each had five
actively used withdrawal sites.
Three of the 61 watersheds had between six and 10 actively used surface water
withdrawal sites. Pine Creek had six actively used water withdrawal sites. Wyalusing Creek had
eight actively used withdrawal sites, and West Branch Susquehanna River had nine actively used
withdrawal sites.
Only one of the 61 watersheds had more than 10 water withdrawal sites actively used by
the industry. The mainstem Susquehanna River had 18 actively used sites.
Although withdrawals were approved from 11 watersheds located within the Ohio River
Basin, the vast majority (more than 99.9 percent) of the 38 million gallons of water diverted into
the Susquehanna Basin originated at one location, the Blue Valley Mine Drainage Treatment
Plant. Only a very small amount (60,060 gallons) originated at the Franco Freshwater
Impoundment located on Sandy Lick Creek. The other nine approved diversion sites were never
used to supply water to the gas industry operating within the Susquehanna River Basin.
As previously noted, there were a total of 222 surface water withdrawal locations
approved for the industry by the Commission during the study period. Of that total, 108 (or 48
percent of the total) were used by the industry during that period. The remaining 114 approved
locations were never actively used. Many approvals were rescinded by the Commission or
expired after a period of three years due to lack of use.

29
A total of 154 of the 222 original withdrawals were located within 20 individual
watersheds. Eighty-five of the 108 actively used withdrawal sites were also located within the
same 20 watersheds. Table 5 presents a summary of those 20 watersheds most heavily used by
the industry as sources of water during the report period. These 20 watersheds accounted for
over 97 percent of the 9.7 billion gallons of surface water withdrawn by the industry during that
period. The balance of approximately 3 percent (282 million gallons) was withdrawn from
within 19 other watersheds occupied by the remaining 23 actively used withdrawal sites. The
locations of the top 20 watersheds are presented in Figure 8A. Water withdrawals from the top
five watersheds (mainstem Susquehanna River, West Branch Susquehanna River, Wyalusing
Creek, Tunkhannock Creek, and Pine Creek) constitute approximately two-thirds of the total
surface water withdrawn by the industry during the report period (Figure 8B). The mainstem and
West Branch of the Susquehanna River together account for approximately 42 percent of the
total surface water withdrawn by the industry.

30
Table 5. Top 20 Watersheds Used as Water Sources by the Unconventional Natural Gas Industry (2008-2013)
Watershed Name
Drainage Area of Watershed
1
(Sq. Mi.)
Number of Well Pads Approved
within Watershed
2
Surface Water Withdrawals Approved by Watershed
Approved Surface Water
Withdrawals Actively
Used
Total Surface Water
Withdrawn (2008-2013) (Gallons)
Indiv. Watershed Withdrawal as %
of Total Withdrawal (%)
Cumulative
Withdrawals as % of Total Withdrawal
(%)
Susquehanna River, Mainstem (Above Sunbury, PA) 11,310 1,579 25 18 3,500,204,977 35.8 35.8
Wyalusing Creek 220 138 15 8 844,954,917 8.7 44.5
Tunkhannock Creek 414 144 13 5 789,601,068 8.1 52.6
Pine Creek 981 209 13 6 650,455,708 6.7 59.2
Susquehanna River, West Branch 6,979 782 25 9 577,659,886 5.9 65.2
Sugar Creek 189 162 9 5 421,738,464 4.3 69.5
Lycoming Creek 272 98 9 5 347,044,012 3.6 73.0
Arnot #5 Mine Drainage N/A N/A 1 1 315,905,794 3.2 76.3
Bowman Creek 120 6 2 2 284,751,336 2.9 79.2
Meshoppen Creek 114 150 6 5 254,818,962 2.6 81.8
Chemung River 2,595 321 4 3 249,858,906 2.6 84.3
Towanda Creek 277 127 4 1 234,107,068 2.4 86.7
Fishing Creek (Benton, PA) 385 24 1 1 169,763,763 1.7 88.5
Tioga River (PA) 457 209 6 4 167,648,794 1.7 90.2
Fall Brook 9 10 2 2 148,069,936 1.5 91.7
Martins Creek 52 28 3 1 130,346,068 1.3 93.1
Muncy Creek 204 58 6 3 127,613,820 1.3 94.4
Moshannon Creek 274 17 4 1 101,327,382 1.0 95.4
Fellows Creek 6 4 1 1 83,869,006 0.9 96.3
Cowanesque River 300 35 5 4 83,854,780 0.9 97.1
Subtotals for Top 20 Watersheds Listed Above See Note 1 Below See Note 1 Below 154 85 9,483,594,647 97.1 -----
Totals for Entire Basin See Note 1 Below See Note 1 Below 222 108 9,765,634,743 ----- -----
Difference See Note 1 Below See Note 1 Below 68 23 282,040,096 ----- 2.9
Notes:
1. Some of the top 20 watersheds are contained within other top 20 watersheds. Therefore, the calculation of totals and subtotals at the bottom of Columns 2 and 3 are not appropriate.
2. Not all approved pad sites have been constructed.
3. A total of 222 surface water withdrawals were approved for gas industry use between 2008 and 2013.
4. A total of 108 surface water withdrawals, or 49 percent of the total, were actively used during that same time period.
5. The remaining 114 approved surface water withdrawals were never actively used.
6. Eighty-five of the total 108 surface water approvals actively used are represented in the top 20 watersheds listed above.
7. The balance of 23 approved surface water withdrawals actively used experienced substantially smaller withdrawal amounts than the 20 listed above.
8. To qualify as "actively used," a site need only have water withdrawn one day during the entire 2008-2013 time period.

31
Figure 8A. Basin Locations of Top 20 Watersheds Used by the Gas Industry
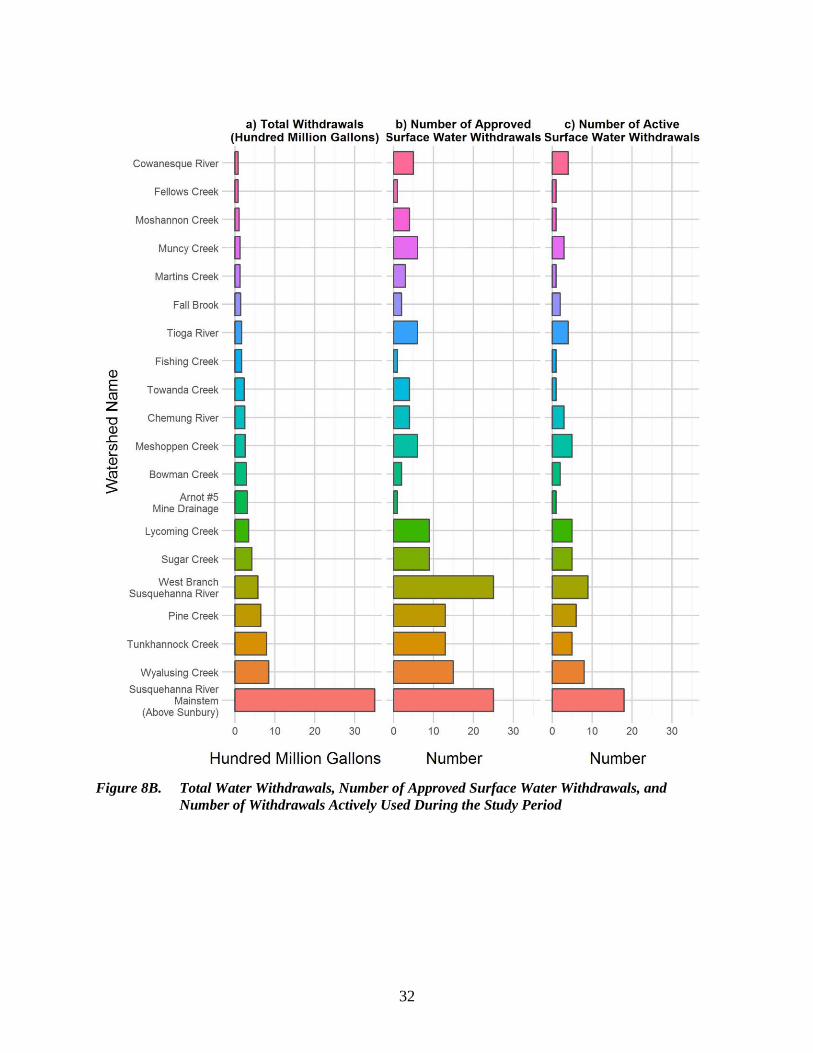
32
Figure 8B. Total Water Withdrawals, Number of Approved Surface Water Withdrawals, and
Number of Withdrawals Actively Used During the Study Period

33
Frequency analyses were performed on surface water withdrawal approvals issued to the
industry by the Commission during the report period to characterize the number of projects
falling within any given category considering a range characteristics. The analyses addressed the
range in approved maximum daily withdrawals, the range in drainage areas, and the range in
ratios between the approved maximum daily withdrawals and the 10-year baseflow occurring at
the points of withdrawals. The 10-year baseflow statistic (BF10YR) was chosen for the purpose
of conducting a simple analysis since it represents the low flow condition in a surface water
feature (stream, river, etc.) that is dominated by groundwater inflow during periods of low
precipitation input (droughts) and is expected to occur on average once every 10 years. The 10-
year baseflow statistic for each surface water withdrawal location included in the analyses was
calculated using StreamStats, a water resources web application developed by the USGS (USGS,
2012). For a more detailed study focused on water availability and use throughout the
Susquehanna River Basin, the Commission has a report and interactive web map available on its
website.
Of the 222 surface water withdrawals approved by the Commission, 212 had discernable
drainage areas needed for the frequency analysis. The ten excluded projects involved surface
water withdrawals from quarry pits or ponds that had no clearly defined drainage areas needed
for the analyses. Of the 212 surface water withdrawals analyzed, 203 had baseflow statistics
needed for the ratio analysis.
Table 6A contains a summary of the frequency analysis performed on the maximum daily
withdrawals approved by the Commission for the 212 surface water withdrawals mentioned
above with discernable drainage areas. The approved maximum daily withdrawals for the 212
projects were divided into 13 convenient (round number) classes for the analyses. The number
of approved projects falling into each class are listed in Table 6A as well as the percent of the
total number of projects each class represented. As the results in Table 6A indicate, two-thirds
of the approved surface water withdrawals fell within two class intervals. Thirty-three percent of
the surface water withdrawals were approved at daily rates between 0.1 and 0.5 mgd and another
34.5 percent of the surface water withdrawals were approved at daily rates between 0.9 mgd and
2.0 mgd. The remaining one-third of the approved surface water withdrawals fell into other class
intervals; most notably, the 0.0 to 0.1 mgd interval with 12.7 percent and the 0.5 to 0.9 mgd
interval with 15.1 percent. There were no surface water locations with approved maximum daily
withdrawals in excess of 3.0 mgd. The results of the maximum daily withdrawal analyses are
graphically represented in Figure 9a.
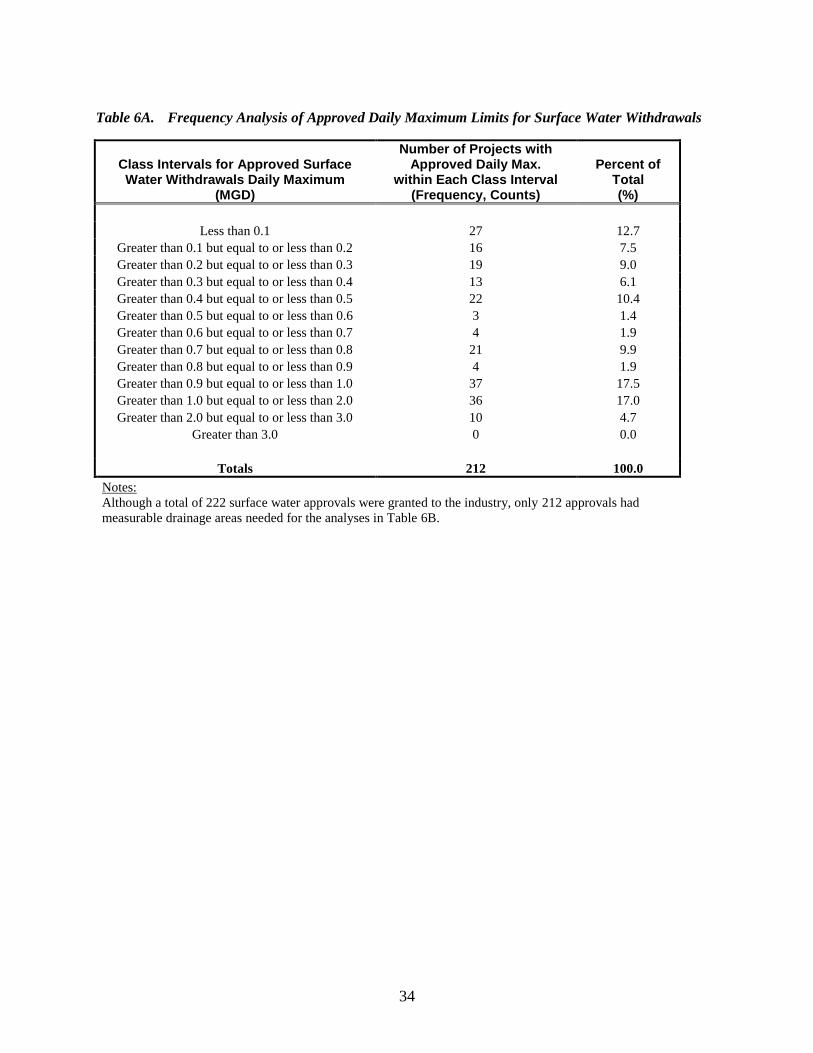
34
Table 6A. Frequency Analysis of Approved Daily Maximum Limits for Surface Water Withdrawals
Class Intervals for Approved Surface Water Withdrawals Daily Maximum
(MGD)
Number of Projects with Approved Daily Max.
within Each Class Interval (Frequency, Counts)
Percent of Total (%)
Less than 0.1 27 12.7
Greater than 0.1 but equal to or less than 0.2 16 7.5
Greater than 0.2 but equal to or less than 0.3 19 9.0
Greater than 0.3 but equal to or less than 0.4 13 6.1
Greater than 0.4 but equal to or less than 0.5 22 10.4
Greater than 0.5 but equal to or less than 0.6 3 1.4
Greater than 0.6 but equal to or less than 0.7 4 1.9
Greater than 0.7 but equal to or less than 0.8 21 9.9
Greater than 0.8 but equal to or less than 0.9 4 1.9
Greater than 0.9 but equal to or less than 1.0 37 17.5
Greater than 1.0 but equal to or less than 2.0 36 17.0
Greater than 2.0 but equal to or less than 3.0 10 4.7
Greater than 3.0 0 0.0
Totals 212 100.0
Notes:
Although a total of 222 surface water approvals were granted to the industry, only 212 approvals had
measurable drainage areas needed for the analyses in Table 6B.

35
Figure 9. Graphic Summary of Frequency Analyses Performed on Daily Maximum Withdrawals,
Drainage Areas, and Ratios of Daily Maximum Withdrawals to 10-Year Low Baseflows
Table 6B presents a summary of the frequency analysis performed on the drainage areas
of the 212 surface water projects approved by the Commission and associated with measurable
drainage areas. The drainage areas for the 212 projects were divided into 11 drainage area
classes for the frequency analyses. The number of approved projects falling into each class are
listed in Table 6B as well as the percent of the total number of projects each class represented.
Approximately 45 percent of the surface water withdrawals were located within drainage areas
measuring less than 100 square miles in size. Thirty-three percent of the surface water
withdrawals were located in drainage areas greater than 100 and less than 1,000 square miles in
size, and 20 percent of the surface water withdrawals were located in drainage areas between
2,000 and 10,000 square miles in size. The results of the drainage area analyses are also
graphically represented in Figure 9b.

36
Table 6B. Frequency Analyses of Drainage Area Classes of Surface Water Withdrawal Approvals
Class Intervals of Drainage Areas for Approved Surface Water Withdrawals
(Square Miles)
Number of Projects with Drainage Areas Falling within
Each Class Interval (Frequency, Counts)
Percent of Total
(%)
Equal to or less than 10 23 10.8
Greater than 10 but equal to or less than 50 48 22.6
Greater than 50 but equal to or less than 100 24 11.3
Greater than 100 but equal to or less than 200 36 17.0
Greater than 200 but equal to or less than 500 23 10.8
Greater than 500 but equal to or less than 1,000 11 5.2
Greater than 1,000 but equal to or less than 2,000 3 1.4
Greater than 2,000 but equal to or less than 5,000 22 10.4
Greater than 5,000 but equal to or less than 10,000 21 9.9
Greater than 10,000 but equal to or less than 15,000 1 0.5
Greater than 15,000 0 0.0
Totals 212 100.0
Notes:
1. Although a total of 222 surface water approvals were granted to the industry, only 212 approvals had measurable drainage
areas needed for the above analyses.
2. Projects excluded from the above analyses include water features (quarry pits, ponds, etc.) with no clearly defined drainage
areas or those with suspected groundwater components.
The relatively large number of surface water withdrawal projects (154 out of 212) located
in watersheds with drainage areas of 500 square miles or less is believed to be the result of
several factors. First, primarily for geological reasons, the industry is most concentrated and
therefore most active in the Appalachian Plateaus Province, including the Pittsburgh Low
Plateau Section, the Appalachian Mountain Section, the Allegheny Front Section, the Deep
Valleys Section, and the Glaciated Low and High Plateau Sections of the Basin in north-central
Pennsylvania (Sevon, 2000). The geomorphic characteristics of those areas produce relatively
steep and more mountainous terrain resulting in localized watersheds (headwaters) of smaller
sizes when compared to other physiographic provinces within the Basin. The relatively steep
terrain creates a preference by the industry for siting well pads on the tops of hills and
mountains. In addition, the industry tries to minimize the travel distances between well pads and
water sources. For this reason, the industry’s efforts to minimize travel distances results in its
seeking water sources in nearby, smaller watersheds with limited sustainable water resources.
Table 6C contains a summary of the frequency analysis performed on the ratios of
approved maximum daily withdrawals (mgd) divided by the 10-year low baseflow statistic (mgd)
for the 203 surface water withdrawals approved by the Commission with available streamflow
statistics. The 10-year low baseflow statistic was used to represent a one-in-ten year drought
condition during which streamflows would be largely reliant upon groundwater inflow. A lower
ratio (% value) indicates that the maximum daily withdrawal at an approved location comprises a
smaller percent of the concurrent 10-year low flow condition at that location. In general, the

37
lower the ratio (% value), the greater the protection afforded to the instream ecosystem relative
to a given withdrawal. As an example, a ratio of 0.1 would indicate that the maximum daily
withdrawal rate would be 10 percent of the 10-year low baseflow value for that withdrawal.
The ratios (expressed as a percent) of maximum daily withdrawals to 10-year baseflows
for the 203 projects were broken down into eight classes for the frequency analysis. The
numbers of approved withdrawals falling into each class are listed in Table 6C as well as the
percent of the total number of projects each class represented.
In general, 65.5 percent of the 203 surface water approvals included in the analysis had
ratios equal to or less than 1.0 percent. This means that even if those projects were actively
withdrawing water at their approved maximum daily rate during a 1-in-10 year drought baseflow
condition, the withdrawn amount of water would not exceed one percent of the concurrent water
flowing in that source stream or river. Another 29.6 percent of the 203 surface water approvals
had ratios between 1.0 percent and 10.0 percent, indicating that the withdrawn amounts of water
for those projects would not exceed 1.0 to 10.0 percent, respectively, of the concurrent water
flowing in those streams or rivers during a one-in-10 year drought baseflow condition. In
general, the results of the ratio analysis confirmed the protective nature of the Commission’s
surface water withdrawal approvals for the industry. The results of the ratio analyses of
maximum daily withdrawals to the 10-year baseflows are also graphically represented in Figure
9c.
The vast majority of the surface water withdrawals with maximum daily withdrawal
limits comprising 5 percent or more of the 10-year low baseflow value were those that also had
low flow protection limits (i.e., passby flow restrictions) imposed by the Commission as a
condition in the approval. These low flow protections would require the withdrawal be
suspended before the 10-year baseflow value would be reached at each point of withdrawal. Of
the 25 approved surface water withdrawals with maximum daily limits exceeding 5 percent of
the 10-year baseflow value, 20 of them had low flow protection conditions that would require the
suspension of all withdrawal activities at flow conditions considerably above the 10-year
baseflow values for those locations. The other five projects were either rescinded or involved
withdrawals from lesser quality water, specifically mine drainage.

38
Table 6C. Frequency Analyses of Ratios between Approved Daily Maximum Limits of Surface Water
Withdrawals and 10-Year Low Baseflows at Point of Withdrawal
Class Intervals of Ratios Between Approved Surface Water Daily Max and 10-Year Low
Baseflow at Point of Withdrawal (Daily Max mgd as % of 10-Yr Base Flow mgd)
Number of Projects with % Values Falling within Each
Class Interval (Frequency, Counts)
Percent of Total (%)
Less than or equal to 0.1 79 38.9
Greater than 0.1 but equal to or less than 0.5 26 12.8
Greater than 0.5 but equal to or less than 1.0 28 13.8
Greater than 1.0 but equal to or less than 2.0 13 6.4
Greater than 2.0 but equal to or less than 5.0 32 15.8
Greater than 5.0 but equal to or less than 10 15 7.4
Greater than 10 but equal to or less than 100 8 3.9
Greater than 100 2 1.0
Totals 203 100.0
Notes:
1. Of the total 222 surface water approvals granted, only 203 approvals had baseflow statistics needed for the
above ratio analyses.
2. The vast majority of surface water withdrawal approvals with Max mgd greater than 10% of baseflow mgd had
passby restrictions included as part of their approval conditions. The few exceptions to this statement included
withdrawals from lesser quality waters, such as mine drainage waters, where larger withdrawals and use were
considered to be environmentally beneficial to the downstream ecosystems.
L. Profile of Water Use Associated with the Hydraulic Fracturing Process
A profile of the water used during the report period to hydraulically fracture gas wells in
the Basin was developed from several Commission data sources. The industry is required to file
post-hydraulic fracturing reports following the completion of a hydraulic fracturing event for
every stimulated well within the Basin. In addition, the industry is required to report to the
Commission on a quarterly basis the quantities of all water withdrawn from every approved
withdrawal location and more recently (since 2010) all water purchased from all public water
systems.
As the data in Table 2 indicate, a total of 2,860 gas wells were reported as hydraulically
fractured within the Basin between July 2008 and December 2013. Each fracturing event was
captured in a post-hydraulic fracturing report. The information contained in those reports
enabled the Commission to calculate important statistics regarding the water use profile for the
industry.
Approximately 96 percent of the water withdrawn by the industry is consumptively used
in the hydraulic fracturing process. The balance of the water is consumptively used for other
activities at the drilling pads such as well drilling, preparation of drilling muds and grout, dust
control, maintenance operations, and site reclamation.

39
Data in Table 7 indicate that the long-term average water consumption for well fracturing
events between July 2008 and December 2013 was 4.3 million gallons of water. Of the 4.3
million gallons of water used during an average fracturing event, 3.6 million gallons (or 84
percent) was comprised of fresh water and 0.7 million gallons (16 percent) was comprised of
reused flowback fluids.
Table 7 presents a summary of the average water injected per well fracturing event and
the average proportions of fresh water and flowback waters used in those events on a quarterly
basis beginning in the third quarter of 2008 and extending through the fourth quarter of 2013. As
the data indicate, the average amount of water used per fracturing event was relatively low in the
second half of 2008 and the first quarter of 2009, ranging from 1.6 to 2.1 million gallons per
event. These relatively low amounts of water used per event during this early period are
believed to be primarily due to smaller exploration companies performing limited fractures on
vertical wells and “toe fractures” on shorter laterals in horizontal wells to hold leases. The
shorter laterals were also used by the exploration companies to test the productivity of the target
formations and prove the resource.
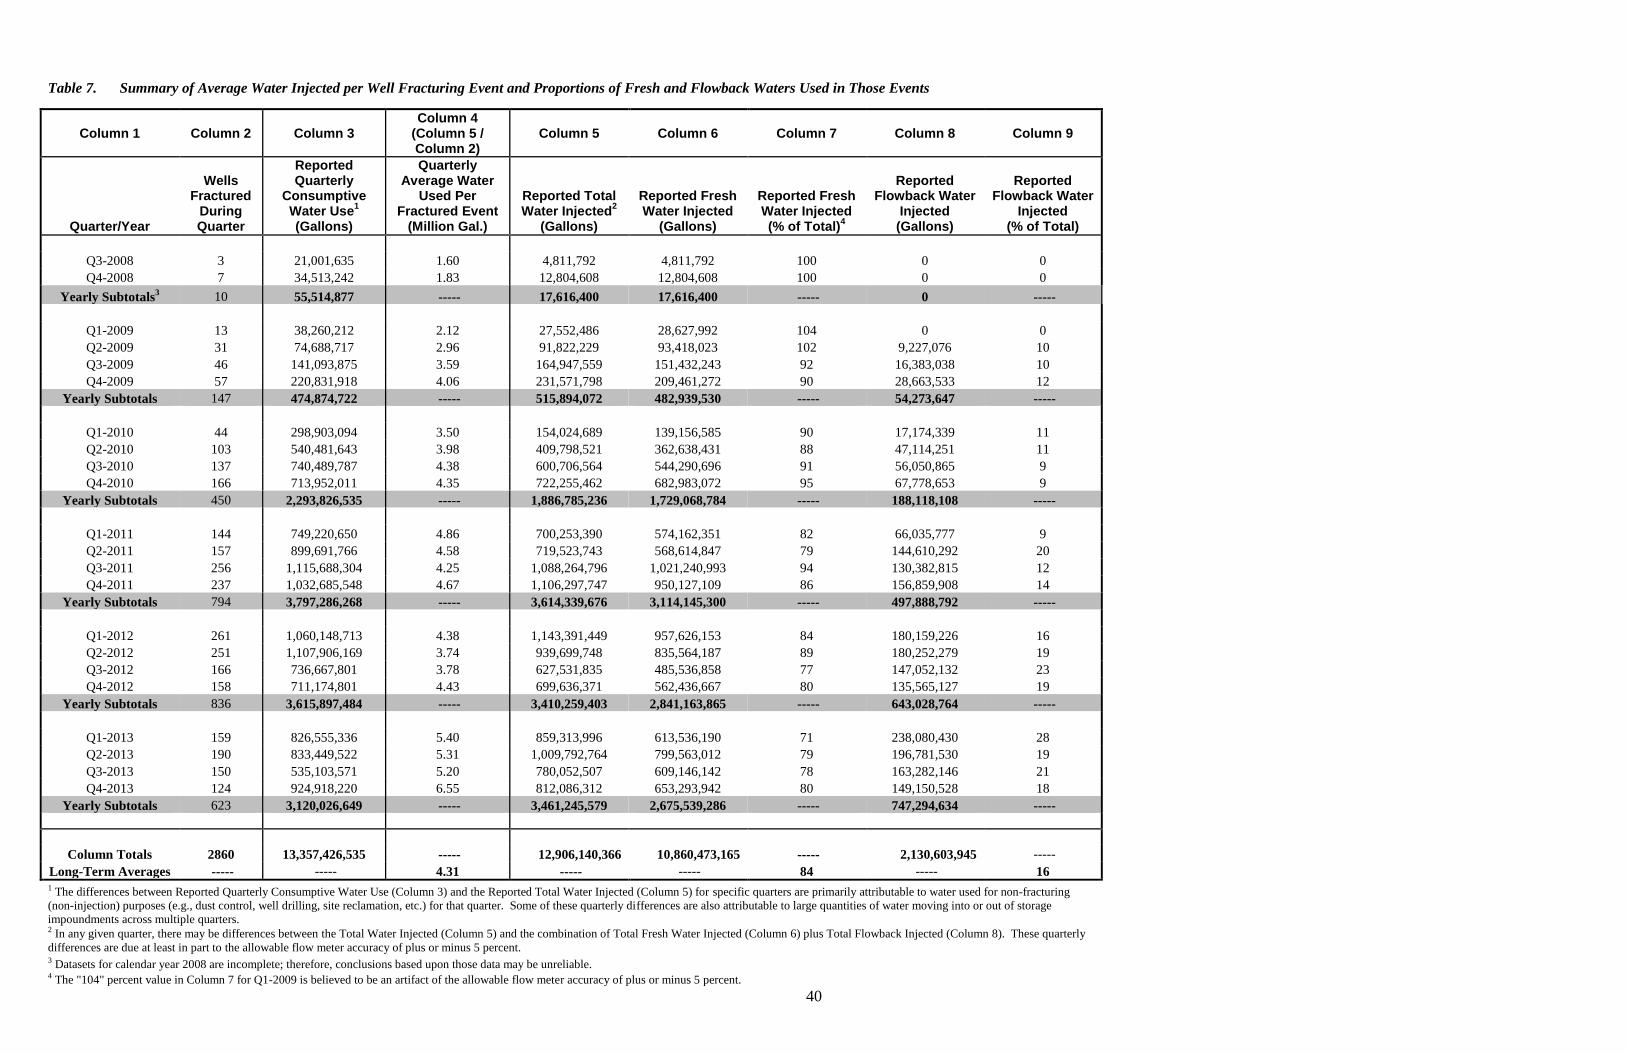
40
Table 7. Summary of Average Water Injected per Well Fracturing Event and Proportions of Fresh and Flowback Waters Used in Those Events
Column 1 Column 2 Column 3 Column 4
(Column 5 / Column 2)
Column 5 Column 6 Column 7 Column 8 Column 9
Quarter/Year
Wells Fractured
During Quarter
Reported Quarterly
Consumptive Water Use
1
(Gallons)
Quarterly Average Water
Used Per Fractured Event
(Million Gal.)
Reported Total Water Injected
2
(Gallons)
Reported Fresh Water Injected
(Gallons)
Reported Fresh Water Injected (% of Total)
4
Reported Flowback Water
Injected (Gallons)
Reported Flowback Water
Injected (% of Total)
Q3-2008 3 21,001,635 1.60 4,811,792 4,811,792 100 0 0
Q4-2008 7 34,513,242 1.83 12,804,608 12,804,608 100 0 0
Yearly Subtotals3 10 55,514,877 ----- 17,616,400 17,616,400 ----- 0 -----
Q1-2009 13 38,260,212 2.12 27,552,486 28,627,992 104 0 0
Q2-2009 31 74,688,717 2.96 91,822,229 93,418,023 102 9,227,076 10
Q3-2009 46 141,093,875 3.59 164,947,559 151,432,243 92 16,383,038 10
Q4-2009 57 220,831,918 4.06 231,571,798 209,461,272 90 28,663,533 12
Yearly Subtotals 147 474,874,722 ----- 515,894,072 482,939,530 ----- 54,273,647 -----
Q1-2010 44 298,903,094 3.50 154,024,689 139,156,585 90 17,174,339 11
Q2-2010 103 540,481,643 3.98 409,798,521 362,638,431 88 47,114,251 11
Q3-2010 137 740,489,787 4.38 600,706,564 544,290,696 91 56,050,865 9
Q4-2010 166 713,952,011 4.35 722,255,462 682,983,072 95 67,778,653 9
Yearly Subtotals 450 2,293,826,535 ----- 1,886,785,236 1,729,068,784 ----- 188,118,108 -----
Q1-2011 144 749,220,650 4.86 700,253,390 574,162,351 82 66,035,777 9
Q2-2011 157 899,691,766 4.58 719,523,743 568,614,847 79 144,610,292 20
Q3-2011 256 1,115,688,304 4.25 1,088,264,796 1,021,240,993 94 130,382,815 12
Q4-2011 237 1,032,685,548 4.67 1,106,297,747 950,127,109 86 156,859,908 14
Yearly Subtotals 794 3,797,286,268 ----- 3,614,339,676 3,114,145,300 ----- 497,888,792 -----
Q1-2012 261 1,060,148,713 4.38 1,143,391,449 957,626,153 84 180,159,226 16
Q2-2012 251 1,107,906,169 3.74 939,699,748 835,564,187 89 180,252,279 19
Q3-2012 166 736,667,801 3.78 627,531,835 485,536,858 77 147,052,132 23
Q4-2012 158 711,174,801 4.43 699,636,371 562,436,667 80 135,565,127 19
Yearly Subtotals 836 3,615,897,484 ----- 3,410,259,403 2,841,163,865 ----- 643,028,764 -----
Q1-2013 159 826,555,336 5.40 859,313,996 613,536,190 71 238,080,430 28
Q2-2013 190 833,449,522 5.31 1,009,792,764 799,563,012 79 196,781,530 19
Q3-2013 150 535,103,571 5.20 780,052,507 609,146,142 78 163,282,146 21
Q4-2013 124 924,918,220 6.55 812,086,312 653,293,942 80 149,150,528 18
Yearly Subtotals 623 3,120,026,649 ----- 3,461,245,579 2,675,539,286 ----- 747,294,634 -----
Column Totals 2860 13,357,426,535 ----- 12,906,140,366 10,860,473,165 ----- 2,130,603,945 -----
Long-Term Averages ----- ----- 4.31 ----- ----- 84 ----- 16 1 The differences between Reported Quarterly Consumptive Water Use (Column 3) and the Reported Total Water Injected (Column 5) for specific quarters are primarily attributable to water used for non-fracturing
(non-injection) purposes (e.g., dust control, well drilling, site reclamation, etc.) for that quarter. Some of these quarterly differences are also attributable to large quantities of water moving into or out of storage
impoundments across multiple quarters. 2 In any given quarter, there may be differences between the Total Water Injected (Column 5) and the combination of Total Fresh Water Injected (Column 6) plus Total Flowback Injected (Column 8). These quarterly
differences are due at least in part to the allowable flow meter accuracy of plus or minus 5 percent. 3 Datasets for calendar year 2008 are incomplete; therefore, conclusions based upon those data may be unreliable.
4 The "104" percent value in Column 7 for Q1-2009 is believed to be an artifact of the allowable flow meter accuracy of plus or minus 5 percent.

41
The industry initially held that greater amounts of water used during fracturing efforts
compromised the effectiveness of the fracture. Over time, this position proved to not be the case
and the industry realized that greater amounts of water actually improved the effectiveness of the
fracturing efforts. As the industry transitioned from the exploratory phase to the production
phase, gas companies started drilling longer laterals to achieve better gas recovery from the shale
formations. This led to an increase in the amounts of water used per fracturing event.
From the third quarter of 2010 through the fourth quarter of 2012, the average amount of
water used per event held relatively steady at 4.3 to 4.8 million gallons per event. During 2013,
the industry started lengthening the laterals and the average amount of water used per fracturing
event increased from approximately 5.1 to 6.5 million gallons per fracturing event.
The difference between the total reported quarterly consumptive use (13.357 billion
gallons) and the reported total water injected into gas wells for fracturing purposes (12.888
billion gallons) for the period 2008 through 2013 is primarily attributable to activities not
directly related to hydraulic fracturing. These activities that consumptively used approximately
0.5 billion gallons of water included other activities at the drilling pad such as well drilling,
preparation of drilling muds and grout, dust control, maintenance operations, and site
reclamation.
During the second quarter of 2009, the industry began reusing flowback in subsequent
fracturing events in a more concerted manner (see Column 8 in Table 7). It should be noted that
the amount of flowback waters used in fracturing events increased on an annual basis from 2009
through 2013. This increased reuse of flowback waters reflects the value of these fluids in
subsequent fracturing events and represents an offset or reduction in the amounts of fresh water
needed for subsequent fracturing events. The reuse also resulted in a reduction in the amount of
waste fluids requiring disposal or treatment.
Data taken directly from the post-hydraulic fracturing reports received by the
Commission between 2008 and 2013 indicate that the average amount of flowback recovered
from the wellbore of stimulated wells within the first 30 days following the release of pressures
induced as part of the hydraulic fracturing effort ranged from a low of approximately 5 percent to
a high of approximately 12 percent, with a long-term average of approximately 10 percent.
Therefore, given the average of 4.3 million gallons of water used per fracturing event, the
amount of flowback from each stimulated well ranged from approximately 0.2 million gallons (5
percent) to 0.5 million gallons (12 percent).
Using the long-term average flowback recovery rate of 10 percent per fracturing event for
2,860 wells fractured indicated that approximately 1.2 billion gallons of flowback fluids were
recovered from wells during the report period. This flowback water was either: (1) reused for
subsequent fracturing events without treatment on the pad from which it originated or another
nearby pad; (2) was treated on the originating pad and reused for additional fracturing on the
originating pad or another nearby pad; (3) was transported to an off-site facility for treatment and
then trucked back to the originating pad or another pad for reuse in a subsequent fracturing
event; or (4) transported off-site for treatment and/or final disposal with no reuse.
42
The Commission relies upon its member jurisdictions to regulate the transport, treatment,
storage, and ultimate disposal of all flowback fluids and production fluids associated with
unconventional natural gas development to include well drilling and fracturing activities.
Information from PADEP data indicated that approximately 99 percent of flowback fluids were
reused by the gas industry. The remainder (approximately 1 percent) was transported to deep
injection wells, landfills, or treated and discharged into surface waters. Information taken from
PADEP files also indicated that approximately 86 percent of all produced fluids from wells
located within the Basin were reused by the industry, with only 14 percent of produced fluids
destined for final disposal including deep injection wells (PADEP, 2012).
M. Major Findings Regarding Water Acquisition and Consumptive Use by the Industry
Great care has been exercised by the Commission in managing the locations, number, and
size of the water withdrawals by the industry to minimize potential impacts on aquatic
ecosystems and downstream water users within the Basin. The Commission holds as one of its
highest priorities the sustainability of the valuable water resources of the Basin.
Technical information collected by the Commission on the industry operating within the
Basin during the 2008-2013 report period served as the basis upon which several highlights and
findings have been drawn regarding the industry’s water use characteristics. These findings
include the following:
1. The industry drilled its first unconventional gas well within the Basin in 2006.
However, rapid expansion of its well drilling activities did not begin until the second
half of 2008.
2. The largest number of wells were drilled in 2010 and 2011 (931 and 1,231 wells,
respectively). Wells drilled in 2012 and 2013 were 685 and 619, respectively.
3. Well fracturing and water acquisition activities within the Basin began expanding
more rapidly in 2010. The largest number of wells were hydraulically fractured in
2012 (836 wells). There were 794 wells fractured in 2011 and 623 fractured in 2013.
4. The second quarter of 2012 experienced the greatest quarterly water use with a
calculated average daily rate of 12.25 million gallons per day.
5. The number of wells fractured and the amounts of water used within the Basin
decreased after the second quarter of 2012, but remained relatively steady for the
remainder of the study period at 120 to 160 wells fractured per quarter and
approximately 500 million to 900 million gallons of water used per quarter.
6. A total of 61 different watersheds located within the Basin contained one or more
surface water withdrawal approvals for use by the industry during the study period.
These watersheds ranged in size from several square miles to more than 2,000 square

43
miles. Of those 61 watersheds, 39 watersheds (or 64 percent) were actually used as
source waters by the industry.
7. The six watersheds from which approximately 70 percent of the total water
withdrawn by or for the industry included the mainstem Susquehanna River above
Sunbury, West Branch of the Susquehanna River, Wyalusing Creek, Tunkhannock
Creek, Pine Creek, and Sugar Creek.
8. The long-term average amount of water injected per well hydraulic fracturing event
was 4.3 million gallons. During 2013, the industry started lengthening the laterals
and the average amount of water used per fracturing event increased to approximately
5.1 to 6.5 million gallons per fracturing event.
9. The average amount of flowback realized from each stimulated well ranged from
approximately 0.2 to 0.5 million gallons, or approximately five to 12 percent of the
total amount injected.
10. The amount of flowback waters used by the gas industry in subsequent fracturing
events increased on an annual basis from 2009 through 2013. During calendar years
2012 and 2013, flowback comprised 19 and 22 percent, respectively, of the water
used to fracture wells.
It is important to note that every docket approval issued by the Commission for water
withdrawal by the industry was based upon site-specific information submitted by project
sponsors or collected by Commission staff. Only water sources approved by the Commission
can be used by the industry for hydraulic fracturing in the Basin. Approvals granted by the
Commission for all surface water and groundwater withdrawals contain site-specific limitations
including instantaneous withdrawal limits and daily limits. Approximately 70 percent of the
approved surface water withdrawals also contained low flow protection conditions which
required the company to suspend withdrawals when instream flows dropped below a pre-
determined level during drier conditions.
IV. Part III. Commission Programs Influencing Industry Water Use
Part III of the report contains a discussion of other Commission programs that exerted
influence over the unique water needs of the industry. This section includes discussion on the
Commission’s low flow protection policy to better protect the aquatic habitat and hydrologic
characteristics of the water sources used by the industry, aquatic resource surveys that served as
the technical basis upon which appropriate levels of protection were incorporated into the
approvals issued to the industry, the remote water quality monitoring network developed and
maintained by the Commission to track changes over time in water quality parameters reflective
of the industry’s activities within the northern portion of the Basin, and the expansion of the
compliance program to ensure that the industry maintains compliance with the regulations of the
Commission.
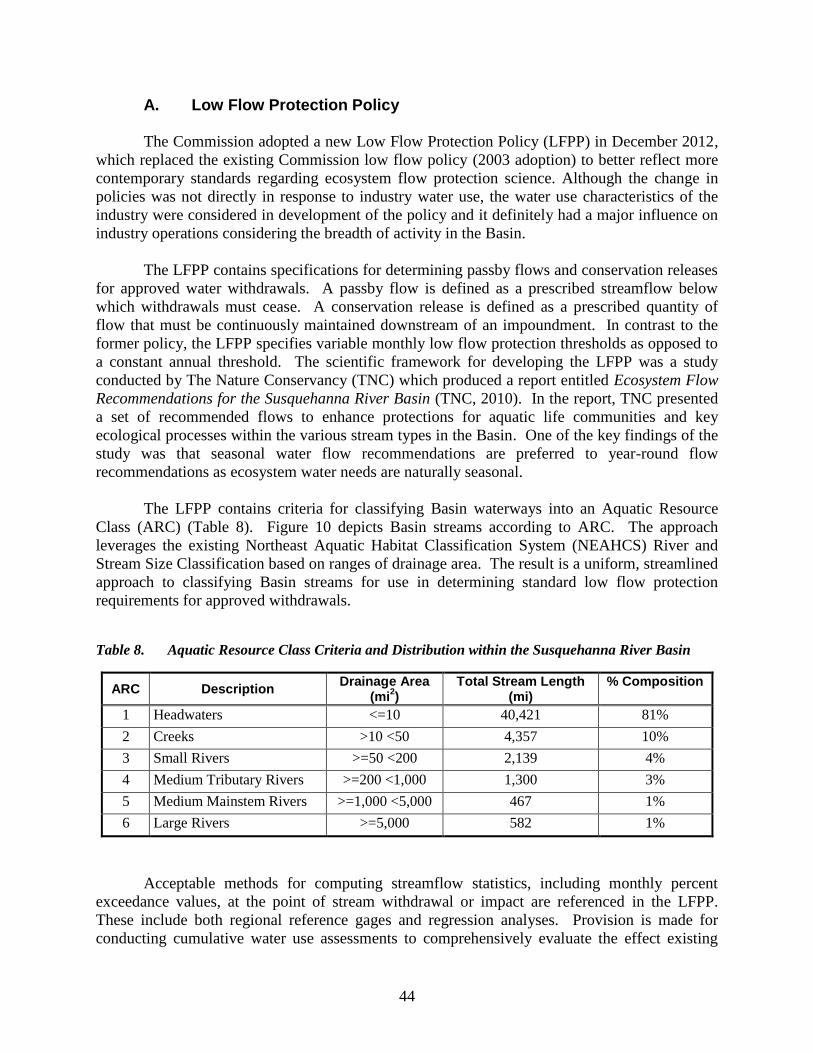
44
A. Low Flow Protection Policy
The Commission adopted a new Low Flow Protection Policy (LFPP) in December 2012,
which replaced the existing Commission low flow policy (2003 adoption) to better reflect more
contemporary standards regarding ecosystem flow protection science. Although the change in
policies was not directly in response to industry water use, the water use characteristics of the
industry were considered in development of the policy and it definitely had a major influence on
industry operations considering the breadth of activity in the Basin.
The LFPP contains specifications for determining passby flows and conservation releases
for approved water withdrawals. A passby flow is defined as a prescribed streamflow below
which withdrawals must cease. A conservation release is defined as a prescribed quantity of
flow that must be continuously maintained downstream of an impoundment. In contrast to the
former policy, the LFPP specifies variable monthly low flow protection thresholds as opposed to
a constant annual threshold. The scientific framework for developing the LFPP was a study
conducted by The Nature Conservancy (TNC) which produced a report entitled Ecosystem Flow
Recommendations for the Susquehanna River Basin (TNC, 2010). In the report, TNC presented
a set of recommended flows to enhance protections for aquatic life communities and key
ecological processes within the various stream types in the Basin. One of the key findings of the
study was that seasonal water flow recommendations are preferred to year-round flow
recommendations as ecosystem water needs are naturally seasonal.
The LFPP contains criteria for classifying Basin waterways into an Aquatic Resource
Class (ARC) (Table 8). Figure 10 depicts Basin streams according to ARC. The approach
leverages the existing Northeast Aquatic Habitat Classification System (NEAHCS) River and
Stream Size Classification based on ranges of drainage area. The result is a uniform, streamlined
approach to classifying Basin streams for use in determining standard low flow protection
requirements for approved withdrawals.
Table 8. Aquatic Resource Class Criteria and Distribution within the Susquehanna River Basin
ARC Description Drainage Area
(mi2)
Total Stream Length (mi)
% Composition
1 Headwaters <=10 40,421 81%
2 Creeks >10 <50 4,357 10%
3 Small Rivers >=50 <200 2,139 4%
4 Medium Tributary Rivers >=200 <1,000 1,300 3%
5 Medium Mainstem Rivers >=1,000 <5,000 467 1%
6 Large Rivers >=5,000 582 1%
Acceptable methods for computing streamflow statistics, including monthly percent
exceedance values, at the point of stream withdrawal or impact are referenced in the LFPP.
These include both regional reference gages and regression analyses. Provision is made for
conducting cumulative water use assessments to comprehensively evaluate the effect existing

45
upstream water use has on water availability at, and downstream of, a proposed withdrawal site.
Similarly, an evaluation of the effects of a proposed withdrawal on existing downstream water
uses is also described. A proposed withdrawal, evaluated both individually and cumulatively on
a monthly basis, considered by the Commission to be too low in magnitude to have any
appreciable effect on instream flows is not subject to low flow protection requirements. These
are referred to as de minimis withdrawals and are determined based on the cumulative
withdrawal relative to the 95th
percent exceedance (P95) flow for each month. The LFPP
outlines de minimis withdrawal thresholds by ARC (Table 9).

46
Figure 10. Aquatic Resource Class Designations for Basin Streams

47
Table 9. De minimis Withdrawal Thresholds by Aquatic Resource Class
ARC 1 ARC 2 ARC 3 ARC 4 ARC 5 ARC 6
None 5% monthly
P95
5% monthly
P95
5% monthly
P95
10% monthly
P95
10% monthly
P95
The LFPP cites two primary methods for determining passby flow and conservation
release thresholds. These include the percent exceedance value method and Pennsylvania-
Maryland Instream Flow Study (PA-MD IFS) method. The former is broadly applicable to all
stream types in the Basin and derived from the TNC ecosystem flow recommendations for the
low flow component of the annual hydrograph. The standard passby flow/conservation release
thresholds applicable when employing this method are outlined in Table 10. The latter is
applicable to coldwater trout streams with drainage areas less than 100 square miles in the PA-
MD IFS area and leverages flow/habitat loss relationships assessed based on Instream Flow
Incremental Methodology (IFIM) modeling. Flexibility is afforded for determination of low
flow protection requirements for withdrawals from exceptional quality and impaired waters.
Generally, more stringent thresholds may be established for exceptional quality waters (e.g.,
native trout streams) and less stringent thresholds may be established for impaired waters (e.g.,
mine discharges). This acts to incentivize development of water sources from lesser quality
waters.
Table 10. Passby Flow/Conservation Release Schedule
ARC 1 ARC 2 ARC 3 ARC 4 ARC 5 ARC 6
monthly P70 monthly P75 monthly P80 monthly P85 monthly P90 monthly P95
In order to preserve natural flow variability and meet seasonal flow protection objectives,
the Commission may also limit a proposed withdrawal rate. This condition may be imposed
when the proposed withdrawal has the potential to affect seasonal flow variability or lead to
overall unacceptable change to the stream’s characteristics. In establishing such conditions, the
Commission considers TNC’s ecosystem flow recommendations and other related environmental
flow science. The LFPP also outlines a suite of special cases and conditions which can influence
the determination of appropriate low flow protection requirements including seasonal versus
monthly thresholds, project specific instream flow studies, water conservation measures, drought
emergencies, and adaptive management considerations.
From the time of adoption of the LFPP to the end of the study period in December 2013,
the Commission approved 83 water withdrawals. Of those, 29 are associated with
unconventional natural gas extraction, and 22 of those have been conditioned with passby flow
or conservation release requirements. Figure 11 depicts the location of these approved water
withdrawals, by type.

48
Figure 11. Approved Water Withdrawals and Passby Flow Conditions for Natural Gas Extraction

49
V. Monitoring and Protection
A. Aquatic Resource Surveys
In 2008, when the Commission first began receiving applications for surface water
withdrawals for natural gas development, the decision was made to enhance the Commission’s
existing program for collecting physical, chemical, and biological data from streams where
withdrawals were proposed and watersheds where pads were permitted. This data collection
process, referred to as an Aquatic Resource Survey (ARS), is performed where a stream meets
specific criteria (as described below). Understanding the aquatic resources and supporting
habitat present in streams is an essential component of the Commission’s mission, and is built
into its technical review of proposed water withdrawals. Site-specific data collected during an
ARS allow Commission staff to assess the current baseline stream condition at a proposed water
withdrawal location. These data are used in conjunction with information about water
availability, stream hydrology, and existing water uses in the Commission’s evaluation of
potential impacts to the stream. Additionally, ARS information may serve to identify potential
impacts attributable to other influences such as land uses, wastewater discharges, and riparian
cover.
The Commission screens all proposed water withdrawal sites for environmental concerns
and conducts an ARS within a targeted stream when one or more of the following criteria are
met:
Recent or comprehensive stream assessment data are not available;
A state agency has designated the stream as exceptional quality;
Wild trout populations and/or rare, threatened, or endangered species are likely to be
present;
The stream is in a headwater setting.
The physical habitat of each ARS site is evaluated using a slightly modified version of
the habitat assessment procedure outlined by Barbour and others (1999). Twelve habitat
parameters (e.g., instream cover, riparian vegetative width) are field-evaluated at each site and
used to calculate a site-specific habitat assessment score. The dominant substrate and weather
conditions are noted, along with a discharge measurement using standard USGS procedures
(Buchanan and Somers, 1969).
During the outset of the ARS program, the only chemical measurements recorded at a site
were standard field chemistry parameters which include water temperature, pH, dissolved
oxygen, and specific conductance. In 2011, this suite of parameters was expanded to include
many of the potential water quality constituents associated with the industry. This expansion
was important because ARSs are often conducted in areas of gas development activity.

50
In 2013, water samples collected during the surveys were analyzed by a laboratory for the
following parameters:
acidity
alkalinity
aluminum
barium
bromide
calcium
carbon dioxide
chloride
iron
lithium
magnesium
manganese
nitrate/nitrite
total kjeldahl nitrogen
total nitrogen
total phosphorus
potassium
sodium
strontium
sulfate
total dissolved solids
total organic carbon
The biological component of an ARS includes fish and macroinvertebrate assemblage
data. These data have been collected using standardized methods throughout the duration of the
ARS program. Field personnel use three-pass electrofishing to collect fishes from a length of
stream that is dependent on wetted width. All fishes are identified to species and enumerated in
the field or laboratory. Benthic macroinvertebrates are collected using a D-frame net with 500-
micron mesh in six representative riffle/run areas within the stream reach. Two hundred
organisms from this composite sample are randomly extracted in the laboratory and identified to
genus or the lowest possible taxonomic level (PADEP, 2009). Fish and macroinvertebrate
assemblage data provide insight into the health of the aquatic ecosystem on a site-specific scale.
Between 2008 and the end of 2013, the Commission conducted a total of 152 ARSs at
approximately 80 percent of the proposed surface water withdrawal sites located on wadeable
streams (Figure 12). The majority of the ARSs have been associated with water withdrawal
applications for natural gas development; however, surveys have also been conducted for
proposed withdrawals for golf course irrigation and water bottling facilities. The majority of
ARSs (131) were conducted in response to a water withdrawal application for a new project.
However, water withdrawals specific to the natural gas industry are approved for a term of four
years. If the project sponsor wishes to continue operating beyond that term or to modify their
withdrawal operation (e.g., increase the maximum daily withdrawal quantity or pumping rate),
the project will be subject to another technical review and may involve another ARS. In
response to projects requesting renewals or modifications, an additional 21 ARSs were
performed through 2013 (Figure 12).

51
Figure 12. Aquatic Resource Survey (ARS) Locations through 2013 in the Susquehanna River
Basin
The largest number of ARSs were conducted during the earlier years of natural gas
development in the Basin due to the lack of existing data. The number of ARSs conducted
annually has decreased from 38 in 2008 to 11 in 2013 as a result of increased overall data
collection activities by both the Commission and its member agencies (Figure 13a). Most ARSs

52
have been conducted in areas with the highest amount of drilling activity (i.e., northern tier of
Pennsylvania), which comprises large portions of the West Branch and Middle subbasins
(Figures 12 and 13b). Counties along the northern tier of Pennsylvania have experienced the
most withdrawal requests and associated drilling activity within the Basin and subsequently have
also had the largest number of ARSs performed (Figures 12 and 14).
Figure 13. Number of Aquatic Resource Surveys (ARS) by Year (a) and Subbasin (b) (Labels of actual
values placed atop each bar.)
Figure 14. Number of Aquatic Resource Surveys (ARS) by County (Labels of actual values placed
atop each bar.)

53
After careful review and analysis of all the data collected as part of an ARS, Commission
staff recommends appropriate protective measures, as needed, to avoid or minimize significant
impacts to the waterway. For example, if sensitive or rare species such as wild trout are
documented during an ARS, Commission staff will consider that factor in its determination of
the passby flow recommendation to ensure protection of the aquatic community during periods
of low flow. Another protective measure might involve a safeguard to avoid potential adverse
impacts during a critical life cycle stage of a sensitive or rare species. If a sensitive species such
as the Eastern Hellbender (Cryptobranchus alleganiensis alleganiensis) were found during an
ARS, Commission staff would recommend a seasonal restriction on initial construction of the
intake structure to protect the species during the egg incubation period.
In addition to the systematic data collection conducted as part of the ARS program,
Commission staff performed targeted research intended to assess whether or not surface water
withdrawals for industry use were impacting aquatic communities within the Basin. In spring
2012, Commission scientists collected data upstream and downstream of 12 water withdrawal
sites and three reference sites in headwater, cold water, and large warm water streams (Figure
15). Watershed size of the study sites ranged from 1.7 to 199.6 square miles and average daily
water withdrawals ranged from 0.01 to 0.38 million gallons. The largest withdrawals relative to
stream size were from headwater streams, where on average 6.8 percent of average daily flow
(ADF) was withdrawn daily. Fish and macroinvertebrate assemblage similarity at study sites
depended largely on the stream sampled, rather than position upstream or downstream of
withdrawals. Regression techniques were used to determine if landscape related variables or
withdrawal metrics better described variation in fish and macroinvertebrate metrics shown to be
sensitive to flow alteration. The site-specific variables were responsible for the majority of
observed variation in fish metrics. Macroinvertebrate models performed poorly, indicating that
the stream sampled or variables not included in the analyses were responsible for the majority of
variation. Overall, evidence suggests impacts of natural gas withdrawals within the Basin at the
present state of flow alteration are limited. Potential reasons include protective measures such as
passby flow restrictions, limits to maximum instantaneous and daily withdrawals, the relatively
recent initiation of the withdrawals (with only one to three years of operation), and inconsistency
or sporadic use of the withdrawals over time. This Commission-funded research resulted in a
detailed internal report (Shank, 2013) and a peer-reviewed publication (Shank and Stauffer,
2015).
The results of this withdrawal research do not unequivocally indicate that withdrawals are
not impacting fish and macroinvertebrate assemblages at sites included in this study. However,
evidence suggests that withdrawals as conducted through 2012 are generally not impacting fish
and macroinvertebrate assemblages to a greater magnitude than do watershed size and land use
practices. To further examine the relationship between withdrawals and aquatic life
communities, Commission staff is committed to compiling larger datasets for withdrawal sites
that have been operating for a longer duration of time in each of the major stream types in this
analysis. In addition, a broader gradient of withdrawal size should be examined within each
stream type. Specifically, the largest withdrawals relative to stream size observed in this study
were from headwater streams, which averaged 6.8 percent of ADF. Further research should be
focused on withdrawals in small watersheds due to their sensitivity to changing conditions, and
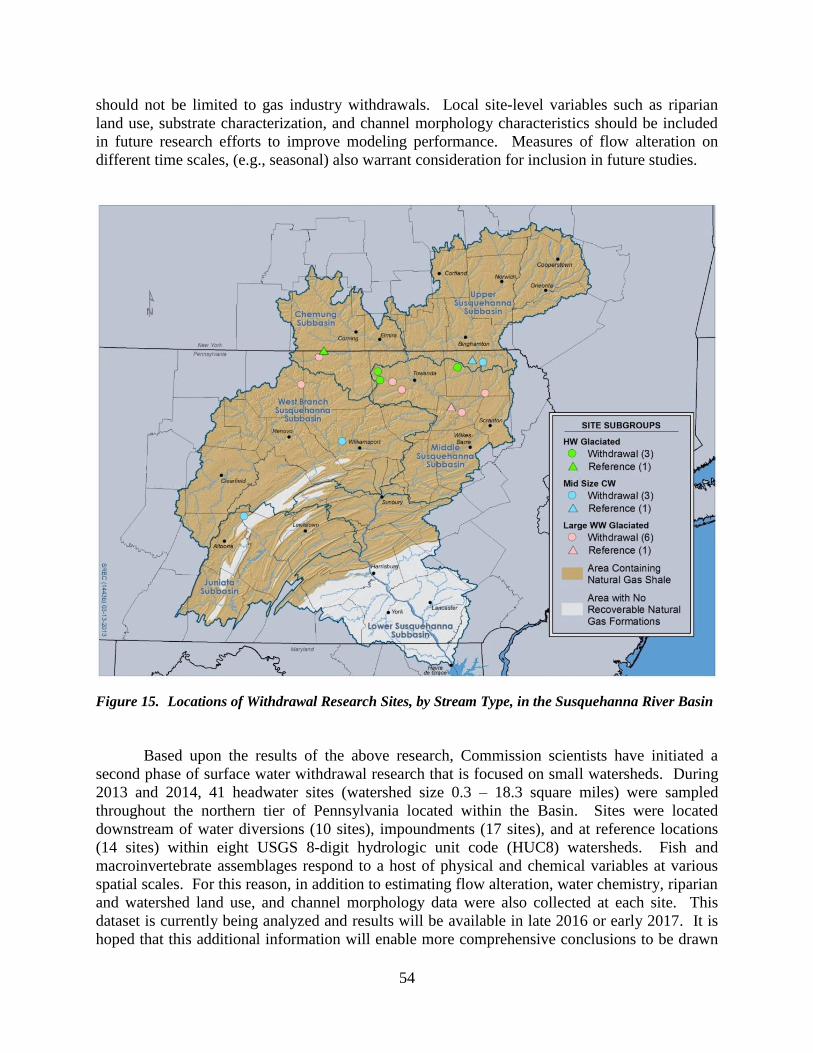
54
should not be limited to gas industry withdrawals. Local site-level variables such as riparian
land use, substrate characterization, and channel morphology characteristics should be included
in future research efforts to improve modeling performance. Measures of flow alteration on
different time scales, (e.g., seasonal) also warrant consideration for inclusion in future studies.
Figure 15. Locations of Withdrawal Research Sites, by Stream Type, in the Susquehanna River Basin
Based upon the results of the above research, Commission scientists have initiated a
second phase of surface water withdrawal research that is focused on small watersheds. During
2013 and 2014, 41 headwater sites (watershed size 0.3 – 18.3 square miles) were sampled
throughout the northern tier of Pennsylvania located within the Basin. Sites were located
downstream of water diversions (10 sites), impoundments (17 sites), and at reference locations
(14 sites) within eight USGS 8-digit hydrologic unit code (HUC8) watersheds. Fish and
macroinvertebrate assemblages respond to a host of physical and chemical variables at various
spatial scales. For this reason, in addition to estimating flow alteration, water chemistry, riparian
and watershed land use, and channel morphology data were also collected at each site. This
dataset is currently being analyzed and results will be available in late 2016 or early 2017. It is
hoped that this additional information will enable more comprehensive conclusions to be drawn

55
regarding the possible impacts on aquatic ecosystems attributable to the water withdrawals
associated with natural gas development within the Basin.
B. Remote Water Quality Monitoring Network
In January 2010, the Commission initiated the establishment of the Remote Water
Quality Monitoring Network (RWQMN), a real-time, continuous water quality monitoring
network, for the purpose of monitoring headwater streams for potential impacts associated with
unconventional natural gas development. Funding provided by East Resources Inc. and
Chesapeake Energy Corporation, along with the Pennsylvania Department of Conservation and
Natural Resources and the New York State Energy Research and Development Authority,
enabled the Commission to build an expansive network of monitors.
As of December 2015, there are 58 continuous water quality monitoring stations located
throughout the Basin. These stations are located primarily in northern Pennsylvania and
southern New York. Specific conductance, pH, turbidity, dissolved oxygen, and temperature are
continuously monitored at all stations using a measuring device that can be deployed in the
stream itself, referred to as a data sonde. Additional laboratory analyses (metals, nutrients,
radioactive particles/isotopes) are performed on a quarterly basis for stream samples collected in
the field, referred to as supplemental samples. The continuously monitored parameters are
recorded every five minutes and transmitted to a public website on a two- to four-hour interval as
provisional data. Commission staff conducts quality assurance and quality control inspections of
the provisional data on a routine basis.
When initiating the network, several factors were considered in selecting the watersheds
to be monitored:
watershed drainage size; 30-60 square miles was considered optimal for the
monitoring equipment;
natural gas pad density and other natural gas-related infrastructure;
non-impaired or minimally impaired watersheds;
presence of wastewater dischargers and drinking water intakes;
stream channel morphology; the data sonde must be in moving water at all times;
local interest and property owner cooperation.
Each monitoring station is outfitted with a data sonde, data collection platform, and
power source. The data sonde is placed in protective housing and placed in flowing water at
each monitoring station. The data platform stores the data collected by the data sonde and
transmits it to the Commission’s website at scheduled intervals. The data platform is battery-
powered and is recharged via solar power at the majority of the sites. Routine maintenance is
performed on the data sonde every six to eight weeks to ensure data quality and minimize the
chances for equipment malfunction.
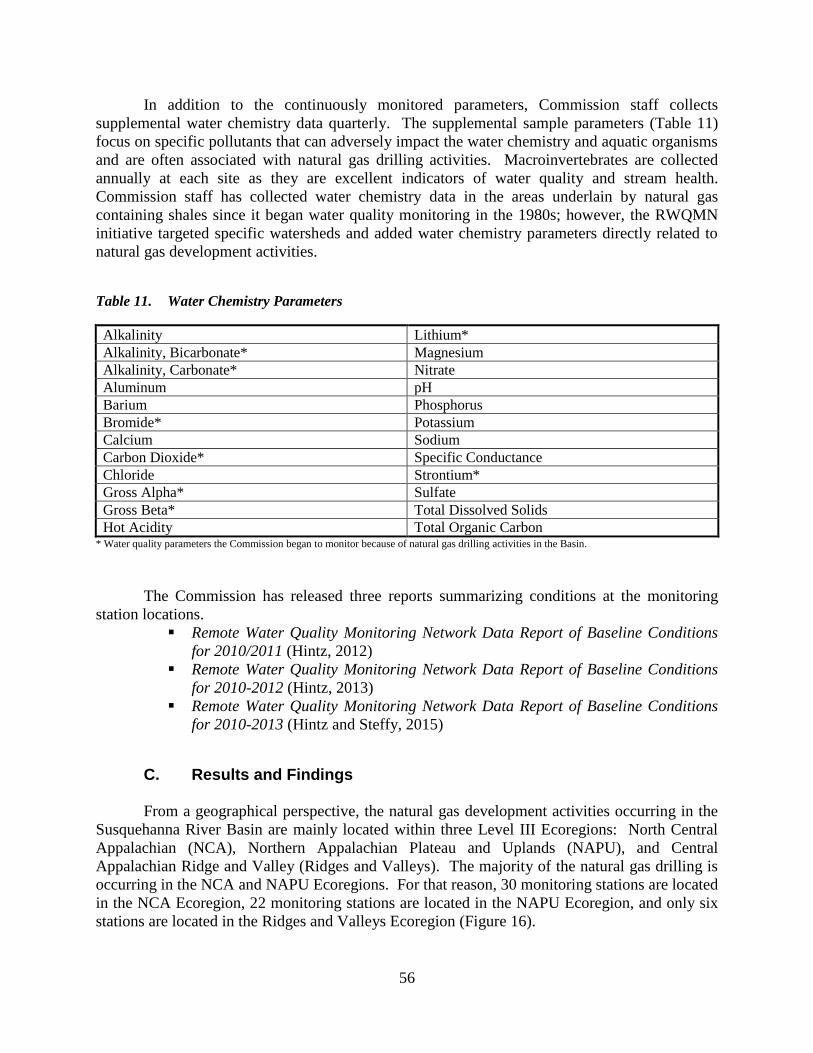
56
In addition to the continuously monitored parameters, Commission staff collects
supplemental water chemistry data quarterly. The supplemental sample parameters (Table 11)
focus on specific pollutants that can adversely impact the water chemistry and aquatic organisms
and are often associated with natural gas drilling activities. Macroinvertebrates are collected
annually at each site as they are excellent indicators of water quality and stream health.
Commission staff has collected water chemistry data in the areas underlain by natural gas
containing shales since it began water quality monitoring in the 1980s; however, the RWQMN
initiative targeted specific watersheds and added water chemistry parameters directly related to
natural gas development activities.
Table 11. Water Chemistry Parameters
Alkalinity Lithium*
Alkalinity, Bicarbonate* Magnesium
Alkalinity, Carbonate* Nitrate
Aluminum pH
Barium Phosphorus
Bromide* Potassium
Calcium Sodium
Carbon Dioxide* Specific Conductance
Chloride Strontium*
Gross Alpha* Sulfate
Gross Beta* Total Dissolved Solids
Hot Acidity Total Organic Carbon * Water quality parameters the Commission began to monitor because of natural gas drilling activities in the Basin.
The Commission has released three reports summarizing conditions at the monitoring
station locations.
Remote Water Quality Monitoring Network Data Report of Baseline Conditions
for 2010/2011 (Hintz, 2012)
Remote Water Quality Monitoring Network Data Report of Baseline Conditions
for 2010-2012 (Hintz, 2013)
Remote Water Quality Monitoring Network Data Report of Baseline Conditions
for 2010-2013 (Hintz and Steffy, 2015)
C. Results and Findings
From a geographical perspective, the natural gas development activities occurring in the
Susquehanna River Basin are mainly located within three Level III Ecoregions: North Central
Appalachian (NCA), Northern Appalachian Plateau and Uplands (NAPU), and Central
Appalachian Ridge and Valley (Ridges and Valleys). The majority of the natural gas drilling is
occurring in the NCA and NAPU Ecoregions. For that reason, 30 monitoring stations are located
in the NCA Ecoregion, 22 monitoring stations are located in the NAPU Ecoregion, and only six
stations are located in the Ridges and Valleys Ecoregion (Figure 16).
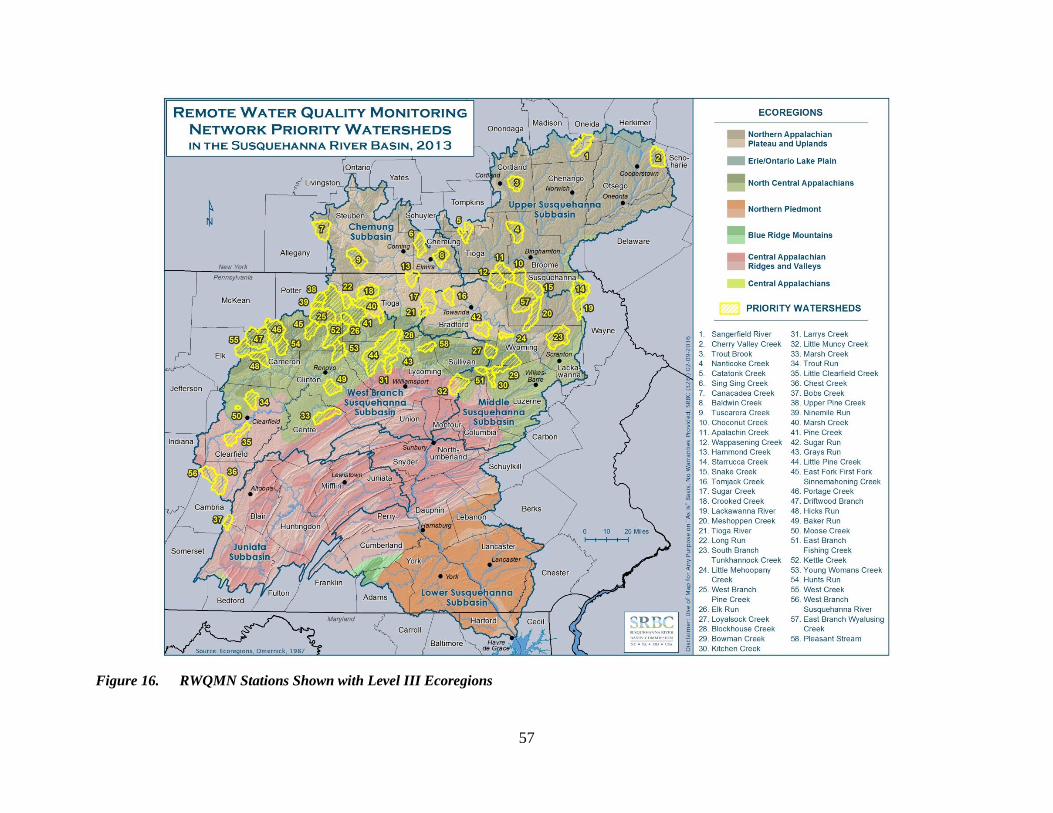
57
Figure 16. RWQMN Stations Shown with Level III Ecoregions
58
The NCA Ecoregion is predominantly forested; 25 of the 30 monitored watersheds in this
ecoregion are over 80 percent forested. This forested land use plays an important role in the
water chemistry observed at the monitoring stations. The continuous data show mean dissolved
oxygen concentrations range from 10.3 to 11.8 mg/l with 20 stations having a mean dissolved
oxygen concentration of over 11 mg/l. Overall, the water temperatures remain cool in these
streams with mean temperatures ranging from 8.4°C to 12.1°C. The large forested tracts provide
canopy cover which helps to maintain cooler water temperatures which in turn sustains higher
dissolved oxygen levels. The range of median pH values show slightly acidic to neutral systems
(5.9 to 7.5). Specific conductance values range from 26 to 164 µS/cm in the NCA streams. Of
the 30 monitoring stations, only four stations average specific conductance concentrations over
100 µS/cm. These low specific conductance concentrations indicate minimal influences to the
water chemistry by human activities. The mean and median ranges of the water chemistry
parameters have been consistent over the four years of continuous monitoring.
The NAPU Ecoregion is also predominantly forested, but the RWQMN watersheds are
less forested when compared to the watersheds in the NCA Ecoregion, and several of the
watersheds are comprised of over 50 percent agricultural lands. The continuous data show mean
dissolved oxygen concentrations range from 8.8 to 11.7 mg/l with only two stations having mean
concentrations of less than 10 mg/l. Mean water temperatures range from 7.9°C to 16.1°C with
the highest temperatures located in watersheds with the least amount of forested lands. Median
pH values, range of 7.0 to 8.1, indicate neutral to marginally basic systems.
Specific conductance shows the greatest range of all of the parameters (86 to 452 µS/cm)
between the monitoring stations in this ecoregion. The NAPU can be divided into two sub-
ecoregions: six monitoring stations are located in the Northeastern Uplands and the remaining
stations are located in the Glaciated Low Plateau. The mean specific conductance range in the
Northeastern Uplands is 94 to 152 µS/cm and 86 to 452 µS/cm in the Glaciated Plateau sub-
ecoregion. Glacial till geology underlays the majority of the NAPU ecoregion and can influence
specific conductance.
The six monitoring stations located in the Ridges and Valleys Ecoregion have varying
watershed characteristics and water chemistry parameters exhibit these differences. For
example, continuous data show specific conductance concentrations range from 76 to 634
µS/cm. Bobs Creek, with a mean concentration of 76 µS/cm, is 92 percent forested and has no
impaired stream miles; while the West Branch Susquehanna River, with a mean concentration of
634 µS/cm, is 73 percent forested and has 37 stream miles (63 percent of its total stream miles)
impaired, predominantly by abandoned mine drainage. The remaining four stations have
concentrations scattered throughout the observed range. The water temperature ranges from
9.7°C to 14.5°C, which may be linked to forested land use and tree canopy cover. Dissolved
oxygen concentrations do not vary significantly between the six monitoring locations (10.6 to
11.2 mg/l) nor do the pH values. The pH ranged from 7.2 to 7.8 indicating slightly basic
systems.
It is neither financially nor technically feasible to monitor for every individual chemical
used in the hydraulic fracturing process conducted by the industry; however, specific
conductance is a very good surrogate indicator for any fracturing fluids entering a given water

59
body. Fracturing flowback waters have very high specific conductance levels. Consequently,
any significant surface spill or leak of these fluids should be detectible by the data sondes. For
these reasons, the following paragraphs detail specific statistical analyses associated with
specific conductance.
A two-way ANOVA, which is a simple statistical test used to analyze any significant
difference among and between a group of variables, was performed to determine if there was a
significant difference (α=0.05) in specific conductance levels by ecoregion over time (Figure
17). There is no significant difference in specific conductance from the analyses for 2010
through 2013 (p=0.44). The Tukey Method groupings in Figure 20 indicate the relationship
between ecoregion and years. Within the NCA ecoregion, each of the years was more closely
related to each other than any year in the NAPU or Ridges and Valleys ecoregions. While there
was no significant difference (p=0.44) between the years in each of the NAPU and Ridges and
Valleys ecoregions, the groupings indicate that years 2010 and 2011 in the NAPU ecoregion and
years 2012 and 2013 in the Ridges and Valleys ecoregion were more closely related compared to
the other years in the ecoregions.
The West Branch Susquehanna River station data (Ridges and Valleys ecoregion) were
removed from the dataset when determining the significant difference between ecoregions and
ecoregion and year. This station is severely impacted by AMD and has the highest mean
conductance concentration of all the stations. The West Branch Susquehanna River station was
not installed until the end of 2012 while the other five stations in the ecoregion were installed in
2010. When the data were included, a significant difference was seen by year within the Ridges
and Valleys ecoregion. 2013 was significantly different from 2012, 2011, and 2010; however,
this was a product of the high conductance concentrations being added from the West Branch
Susquehanna River rather than conductance values changing at stations.

60
Figure 17. Specific Conductance by Ecoregion and Year
Impacts of natural gas development, including drilling, hydraulic fracturing, and related
infrastructure activities, on stream biota are a significant concern to the Commission and to the
general public. Macroinvertebrate samples were collected at the monitoring stations annually
and the taxa were identified and scored through a number of individual metrics which were
combined to calculate the Index of Biotic Integrity (IBI) score (PADEP, 2013). This IBI score,
based on a scale of 0-100, is a representation of the quality of the aquatic macroinvertebrate
assemblage based on six separate metrics which describe different aspects of the community,
including richness, diversity, and pollution tolerance. Watershed size, geology, and season are
all factored into the Pennsylvania IBI score and a higher IBI score indicates a healthier
macroinvertebrate community. Within the RWQMN coverage area, the natural gas well density
gradient ranges from zero wells per square mile to 3.7 wells per square mile.
Box plots were used to analyze for any potential relationship between IBI scores and
natural gas well density. Box plots show the median value and quartile ranges of the data in each
box. The lower and upper edges of the box represent the lower and upper quartiles, respectively,
and the line inside the box represents the median value. Twenty-five percent of the data are less
than the lower quartile and 25 percent of the data are greater than the upper quartile. The lines
(whiskers) extending from the box represent the maximum and minimum values excluding
outliers.
C C C C AB AB A A B B AB AB

61
There was no strong relationship observed between natural gas well density and
Pennsylvania IBI scores for 2011, 2012, or 2013 (Figure 18), with the spacing between the
different parts of the boxes showing a high degree of dispersion regardless of what well density
gradient is considered. Well density was not a good predictor of macroinvertebrate IBI scores.
In watersheds with no natural gas well drilling occurring upstream of the monitoring points, IBI
scores ranged from 29 to 100, which represents the lowest and highest IBI scores observed
throughout the entire three years of sampling. As a result of the low sample size (n=2) in the
greater than 2.5 wells per square mile group, even a small change at either of the two sites can
cause a large shift in the box plot. Therefore, those results should be considered with that
limitation in mind. More than 30 percent of all macroinvertebrate samples collected for the
RWQMN project through 2013 were in watersheds where no natural gas wells have been drilled.
Box plots constructed with existing data show no significant difference between IBI scores at
sites with zero gas wells per square mile and those that have some degree of gas well
development, even up to 3.7 wells per square mile.
Figure 18. IBI Scores Related to Gas Well Density from 2011-2013
As data continue to be collected, future data analyses will remain focused on water
quality trend analysis, biological integrity, and parameter correlation with weather conditions. In
addition to the Commission’s ongoing data analyses, there have been numerous universities,
government agencies, and non-profit groups engaged in using these same data for their own
assessments of natural gas drilling impacts, climate change initiatives, and road salt impacts.
n = 18, 22, 23 n = 15, 17, 17 n =7 n = 4 n = 4, 5, 5 n =2
62
The sharing of these important monitoring datasets remains one of the primary goals of the
Commission.
The relevance and importance of a continuous, real-time water quality monitoring
network is not limited to the impacts of natural gas development. The RWQMN allows the
Commission and other agencies and environmental groups to gain a better understanding of
water quality conditions in headwater streams and monitor impacts from any activities occurring
within those watersheds. Continuous monitoring has the benefit of early detection of impacts to
water chemistry that cannot be accomplished with traditional infrequent sampling.
VI. Compliance Program
The primary objective of the Commission’s Compliance Program is to ensure that all
projects subject to Commission regulation are complying with all applicable regulations,
approvals, orders, and other requirements of the Commission. As a result of the rapid growth of
the industry within the Basin, the Commission expanded the total number of compliance staff;
opened a Compliance Office in Sayre, Pennsylvania, located in the heart of the shale gas region;
and implemented several new technology-based tools to more effectively and efficiently monitor
the water use activities of the natural gas industry through field inspections of gas-related water
withdrawals and well pad construction occurring in the northern tier of Pennsylvania.
A. Compliance Inspections of the Industry by Quarter and Year
In response to the increasing level of industry activities occurring within the Basin, the
Commission increased the number of Compliance Program staff in 2009. The primary emphasis
of the Compliance Program is to conduct site inspections to ensure gas operators obtained
necessary approvals and maintained compliance with relevant Commission regulations and with
the specific conditions contained in each approved project.
As the number of natural gas-related inspections continued to grow through 2009 and
into 2010, more demands were placed on the staff assigned to the Compliance Program. In
2010, the Commission’s Information Technology (IT) Department, in concert with the
Compliance Program, developed better communication systems and mobile computer-based
tools to assist field inspectors with categorizing, tracking, and archiving inspection results and
reports. These tools were introduced in late 2010 and dramatically increased the efficiency and
effectiveness of the Compliance Program.
Figure 19 illustrates the number of compliance site inspections conducted by
Commission staff on the natural gas industry by quarter and by year beginning with the second
quarter of 2011.

63
Figure 19. Number of Natural Gas Inspections Conducted Per Quarter, 2011-2013
B. Notices of Violation Issued by Quarter and Year (Natural Gas Industry Only)
The Compliance Program has issued a total of 150 Notices of Violation (NOVs) from
2009 through 2013 to both approved and unapproved gas industry projects located within the
Basin. A NOV is an official letter written by the Commission to a project sponsor with
notification given that, based upon information available to the Commission, the project may
have violated a Commission regulation, order, directive, or condition of an approval.
As noted earlier in this document, all unconventional natural gas development projects
located within the Basin that withdraw water (either surface water or groundwater) or
consumptively use water are required to first request the appropriate Commission review and
obtain written approval before initiating any project activities. Once approval is granted, the
industry is required to record and report all daily water withdrawals and daily consumptive water
uses (beginning at the first gallon) to the Commission. The majority of these reports are
submitted on a quarterly basis and are reviewed by staff for compliance with Commission
regulations and project-specific approval conditions. Any noted non-compliance action can
64
result in the issuance of a NOV. The Compliance Program can also issue NOVs outside of the
quarterly reporting sequence for violations discovered through periodic data review and random
site inspections.
As previously noted, the level of activity associated with the industry was relatively
modest within the Basin prior to mid-2008. During the early stages of expansion, the
Commission made efforts to ensure that an appropriate and effective regulatory structure was put
into place to adequately monitor water-related activities associated with the growing industry.
This build-out of Commission capabilities took place between 2008 and 2009. Consequently,
there were no NOVs issued to the industry in calendar year 2008. However, the Commission did
enter into several settlement agreements to resolve violations. The majority of those settlement
agreements were entered into as a result of natural gas operators proactively contacting
Commission staff and informing them of violations at various project locations. At that time, the
Commission was issuing Cease and Desist Orders to projects that violated Commission
regulations and/or policies. In order to obtain all necessary Commission approvals to facilitate
additional development on the sites in violation, project sponsors were required to resolve all
past violations and sign settlement agreements, which were used as a tool to regain compliance.
It is important to note that because no NOVs were issued to the industry in 2008, the
number of NOVs issued in calendar year 2009 may have included some violations that occurred
during calendar year 2008. It is also important to note that in 2013, the Commission altered the
manner in which it accounts for and invoices natural gas operators for consumptive water use
mitigation. Historically, the Commission required operators to account for the consumptive use
of water at the pad sites. In 2013, however, the Commission implemented a procedure that
considered water to be effectively consumed once it was taken from the source from which it
originated. This change was primarily made to assist the Commission in accounting and
quarterly tracking (or accounting) practices for consumptive water use mitigation.
Consequently, the manner in which projects reported daily water withdrawals and daily
consumptive use were slightly altered, which may have impacted to some degree the number of
subsequent NOVs issued in 2013.
C. Nature of Notices of Violations Issued Over Time
Reports of water withdrawals and consumptive water uses are generated by each project
sponsor and electronically submitted on a quarterly basis to the Commission in an online format
referred to as the Monitoring Data Website (MDW). Approximately 70 percent of all NOVs
issued to the natural gas industry are administrative in nature. These violations consist primarily
of late submission of the quarterly reports or late payment of relevant consumptive water use
fees.
The remaining 30 percent of the NOVs issued to the gas industry involve more
significant violations such as operating without Commission approval or exceeding approved
limits or thresholds. These violations are most often identified during field inspections or during
record audits. From 2009 through 2013, the Commission experienced a relatively steady
increase in the number of NOVs issued. This trend is believed to be attributable in part to the
number of new natural gas companies entering the Basin that were initially unfamiliar with

65
Commission requirements and regulations. This trend is also believed to be due in part to the
increased effectiveness of the Compliance Program’s ability to detect violations.
As noted above, in 2013 the Commission altered the manner in which natural gas
operators report quarterly monitoring data to the Commission. This change appeared to have
resulted in some confusion within the natural gas industry as the number of NOVs issued in 2013
increased from the previous year. Staff expects the number of administrative NOVs to decrease
over time assuming current reporting requirements remain unchanged. Figure 20 illustrates the
nature of the NOVs issued per quarter and year.
Figure 20. Nature of NOVs Issued to Natural Gas Industry, 2009-2013
D. Comparison of Notices of Violation for Natural Gas Projects vs. Non-Gas Projects
A total of 525 NOVs have been issued from 2009 through 2013 by the Commission to
project sponsors operating within the Basin. This number includes both natural gas-related
projects and non-gas related projects. Of that total, 150 were issued to natural gas operators.
Generally speaking, the industry has been compliant with Commission regulations and often
times proactively informs Commission staff of potential violations. The industry is accustomed

66
to being regulated; however, some of the subcontractors and third-party water purveyors
operating in support of the natural gas industry have presented enforcement challenges to the
Commission. Figure 21 presents a comparison of the number of NOVs issued per year to natural
gas projects versus non-natural gas projects. The number of NOVs issued annually to the natural
gas industry comprised approximately 30 percent of the total NOVs issued by the Commission.
Figure 21. Number of Natural Gas Versus Non Gas NOVs Issued Per Year, 2009-2013
E. Summary of Settlements with Natural Gas Operators
In an effort to expedite the resolution of non-compliance issues and more effectively
utilize Commission resources and funding, the Commissioners have generally directed staff to
attempt to resolve all violations through settlement agreements before resorting to the assessment
of civil penalties to projects that were unwilling to enter into a settlement agreement. A total of
32 settlement agreements were entered into by and between the Commission and various project
sponsors between 2008 and 2013. Of that total, 21 settlement agreements were between the
Commission and natural gas operators, for amounts totaling around $2.3 million.

67
Of the 21 settlement agreements, 12 addressed projects that were undertaken prior to
receiving Commission approval, and nine involved failure to comply with Commission
regulations or conditions imposed as part of approvals listed. Some examples of the latter
include failure to post required signage, use of water from unapproved sources, failure to install
meters, and failure to submit post-hydrofracture reports.
The nature of the violations has changed over time. Initially, most violations involved
failure to receive prior approval from the Commission before initiating gas development
activities. More recently, the violations involved failure to comply with conditions imposed as
part of the approvals issued to the project sponsors.
In general, compliance efforts associated with the industry have proven to be very
effective. Nonetheless, occasional violations still occur and appropriate enforcement actions are
taken by the Commission. Ensuring compliance requires constant vigilance. The Commission’s
Compliance Program will continue to refine and adapt strategies to quickly identify and address
those violations.
VII. Part IV. General Observations and Conclusions
A. Looking Back
One of the primary objectives of the Commission since its inception has been the
management of the finite water resources of the Basin in a sustainable manner as demands grow
over time, whether from new water uses entering the Basin or changes in existing uses. When
the unconventional natural gas industry arrived in the Basin, the Commission was responsible for
developing relevant and fair regulations to accommodate the new water user while addressing
the need to maintain sustainable water resources throughout the Basin. As such, the Commission
focused on ensuring that all water used by the industry would come from approved sources.
The primary competition for water resources associated with the industry has occurred
not between the industry and other human water needs, but between the industry and the natural
aquatic ecosystems existing within the Basin–especially the small, lower-yielding watersheds in
which the industry has been active. The industry’s presence in these headwater settings raised
concerns related to the delicate balance between water use and availability. The Commission
undertook incremental policy and regulatory adaptations to successfully address the potential for
conflict between the industry and the local aquatic ecosystems for the protection of sensitive
habitats and the Basin’s finite water resources.
The policy and regulatory adaptations used by the Commission were based upon the best
available science. These strategies included new regulatory controls, including the “Gallon One”
modification, as well as employing and/or adapting existing procedures for performing
environmental screenings and on-site aquatic resource surveys to characterize and evaluate
proposed water withdrawal sites, applying limitations on instantaneous and daily water

68
withdrawal rates, and reviewing for potential cumulative impacts related to multiple withdrawals
in a watershed. The Commission’s updated low flow protection policy was especially useful in
maintaining adequate instream flows to avoid exacerbating naturally occurring low flow
conditions.
The relative speed with which the Commission developed, revised, and expanded its
regulatory program was a distinct strength. This agility enabled the Commission to keep pace
with the industry’s dynamic water demands.
Commission interest in avoiding the impacts of excessive withdrawals during low flow
periods resulted in many sources being approved as interruptible. In response to the interruptible
nature of these withdrawals, the industry continues to develop a dynamic water storage and
distribution system, allowing water to be obtained when stream conditions allow and stored for
later use.
The monitoring and reporting requirements imposed by the Commission for all approved
water withdrawals and consumptive water uses enabled an accurate and useful accounting of the
industry’s water use characteristics during the assessment period. The Commission’s
Compliance Program, responsible for tracking and documenting the industry’s adherence to
Commission regulations, was supported by the Commission’s very effective and efficient IT
Program. The IT support greatly increased the effectiveness and efficiency of the Compliance
Program’s monitoring and inspection activities through automation, enabling staff to keep track
of an enormous amount of compliance data.
Water quality monitoring and assessment work performed by the Commission also
started to establish baseline conditions and identify potential impacts on the water resources of
the Basin posed by the industry’s activities. These field-oriented activities employing
sophisticated instrumentation and other methods for assessing the chemical and biological health
of streams in the region provided the Commission and the general public with data collected at
many locations within the portion of the Basin in which the industry has been most active.
Especially for the smaller watersheds and streams in the region, very little data had been
collected in any regular manner prior to 2008.
Overall, the considerable amount of data collected and analyzed by the Commission
during the report period support the following conclusions:
Generally, the quantity of the Basin’s water resources are sufficient in magnitude to
accommodate the water demands of the industry concurrently with other water users
currently operating within the Basin.
Concerns related to the impacts of water sources are focused on the timing and location
of the withdrawals and are adequately addressed by the low flow protection measures and
other protective operating conditions.
69
To date, the Commission’s monitoring programs have not detected discernible impacts on
the quality of the Basin’s water resources as a result of natural gas development, but
continued vigilance is warranted.
B. Looking Ahead
The Commission will use the observations made and conclusions drawn from the report
to inform and direct its future efforts. Some future challenges and opportunities that will be
addressed by the Commission include the following:
Through future regulatory practices, encourage a more robust and sophisticated industry-
wide water delivery systems anchored in larger, more sustainable and uninterruptible
water features of the Basin.
Enhance water quality monitoring and assessment methods to assist our member
jurisdictions with ensuring preservation of the quality of the Basin’s water resources.
Expand the use of technology to enable Commission staff to work more effectively and
transparently and to be more responsive to inquiries from the general public and the
regulated community.
Facilitate greater use of lesser quality waters within the Basin to reduce the reliance on
higher quality streams and rivers.
Continue to encourage the incorporation of produced fluids into the industry’s water
delivery system to decrease the need for future disposal of these fluids and to reduce the
reliance on fresh water resources for future hydraulic fracturing activities.
Overall, this report provided the framework for the Commission to review and reflect
upon its role in managing industry activities during the start of natural gas development in the
Basin, and as a result, it will better insure continued sustainable management of the water
resources of the Basin into the future.
The information contained in this report may be periodically revised and updated as new
information is received and processed by the Commission.

70
VIII. References
Ashley, George and J. French Robinson. 1922. Oil and Gas Fields of Pennsylvania,
Pennsylvania Geological Survey, 4th Series, Mineral Resource Report 1, p. 41.
Barbour, M.T., J. Gerritsen, B.D. Snyder, and J.B. Stribling. 1999. Rapid Bioassessment
Protocols for Use in Streams and Wadeable Rivers: Periphyton, Benthic
Macroinvertebrates, and Fish, Second Edition. EPA 841-B-99-002. U.S. Environmental
Protection Agency, Office of Water, Washington, D.C.
Berg, T.M., W.E. Edmunds, A.R. Geyer and others, compilers. 1980. Geologic Map of
Pennsylvania (2nd ed.): Pennsylvania Geological Survey, 4th ser., Map 1, 3 sheets, scale
1:250,000.
Buchanan, T.J. and W.P. Somers. 1969. Discharge Measurements at Gaging Stations. USGS
Techniques of Water-Resources Investigations, Book 3, Chapter A8.
Carter, Kristin M., John A. Harper, Katherine W. Schmid, and Jaime Kostelnik. 2011.
Unconventional natural gas resources in Pennsylvania: The backstory of the modern
Marcellus shale play, Environmental Geosciences, v. 18, no. 4, pp. 217-257.
Energy Information Administration. 1993. Drilling Sideways – A Review of Horizontal Well
Technology and Its Domestic Application, DOE/EIA-TR-0565, Distribution Category
UC-950, p. 7.
Hintz, D. 2013. Remote Water Quality Monitoring Network, Data Report of Baseline
Conditions for 2010 – 2012. Susquehanna River Basin Commission (Publication No.
292), Harrisburg, Pennsylvania.
Hintz, D. 2012. Remote Water Quality Monitoring Network, Data Report of Baseline
Conditions for 2010/2011. Susquehanna River Basin Commission (Publication No. 280),
Harrisburg, Pennsylvania.
Hintz, D. and L.Y. Steffy. 2015. Remote Water Quality Monitoring Network Data Report of
Baseline Conditions for 2010-2013. Susquehanna River Basin Commission (Publication
No. 297), Harrisburg, Pennsylvania.
Pennsylvania Department of Environmental Protection (PADEP). 2013. A Benthic
Macroinvertebrate Index off Biotic Integrity for Wadeable Freestone Riffle--Run Streams
in Pennsylvania. Pennsylvania Department of Environmental Protection. Division of
Water Quality Standards.
PADEP. 2012. Oil and Gas Reports, SPUD data report. Available Online from:
http://www.portal.state.pa.us/portal/server.pt/community/oil_and_gas_reports/20297. and
http://www.portal.state.pa.us/portal/server.pt/ community/marcellus_shale/20296.
71
PADEP. 2012. 2012 Pennsylvania Integrated Water Quality Monitoring and Assessment
Report. http://www.portal.state.a.us/portal/server.pt/community/water_quality_standards
/10556/integrated_water_quality_report_-_2012/1127203.
PADEP. 2011. 25 Pa. Code Chapter 78 Oil & Gas Wells, 2011, Subchapter E, § 78.122(b).
PADEP. March 2009. Bureau of Water Standards and Facility Regulation Instream
Comprehensive Evaluation Surveys. http://files.dep.state.pa.us/Water/Drinking%20Water
%20and%20Facility%20Regulation/WaterQualityPortalFiles/Methodology/ice_2009am.
pdf.
Petroleum Transfer Technology Council. 2011. History of Hydraulic Fracturing, Petroleum
Transfer Technology Council Network News, v. 17, no. 1, p. 5.
Sevon, William. 2000. Bureau of Topographic and Geologic Survey, Department of
Conservation and Natural Resources, Commonwealth of Pennsylvania, Map 13.
Shank, M.K. 2013. A study of potential impacts of natural gas industry water withdrawals on
fish and macroinvertebrate communities in the Susquehanna River basin. SRBC Internal
Report.
Shank, M.K. and J.R. Stauffer. 2014. Land use and surface water withdrawal effects on fish and
macroinvertebrate assemblages in the Susquehanna River basin, USA. Journal of
Freshwater Ecology 30:2, 229-248.
Susquehanna River Basin Commission. 2015. Regulation of Projects, Title 18 Code of Federal
Regulations Parts 801, 806, 807, and 808.
Susquehanna River Basin Commission. 2012. Low Flow Protection Policy, Policy No. 2012-01,
Related to Withdrawal Approvals, adopted December 14, 2012. Available from:
http://www.srbc.net/policies/lowflowpolicy.htm.
Susquehanna River Basin Commission. 2012. Resolution 2012-01, Use and Reuse of Lesser
Quality Water.
The Nature Conservancy (TNC). 2010. Ecosystem Flow Recommendations for the
Susquehanna River Basin. Harrisburg, Pennsylvania.
U.S. Geological Survey. 2012. The StreamStats Program for Pennsylvania, Online at
http://water.usgs.gov/osw/streamstats/pennsylvania.html.
Woods, A.J., J.M. Omernik, and D.D. Brown. 1999. Level III and IV Ecoregions of Delaware,
Maryland, Pennsylvania, Virginia, and West Virginia. United States Environmental
Protection Agency. National Health and Environmental Effects Research Laboratory,
Corvallis, Oregon. ftp://ftp.epa.gov/wed/ecoregions/reg3/reg3_eco_desc.doc.

72
Woods, A.J., J.M. Omernik, D.D. Brown, and C.W. Kiilsgaard. 1996. Level III and IV
ecoregions of Pennsylvania and the Blue Ridge Mountains, the Ridge and Valley, and
Central Appalachians of Virginia, West Virginia, and Maryland: EPA/600/R-96/077,
U.S. Environmental Protection Agency, National Health and Environmental Effects
Research Laboratory, Corvallis, Oregon. 50 pp.