Sr. No Name Page - Tech-Chronicletechchronicle.in/wp-content/uploads/2016/03/MECHANICAL...Sr. No...
203
Transcript of Sr. No Name Page - Tech-Chronicletechchronicle.in/wp-content/uploads/2016/03/MECHANICAL...Sr. No...


Sr. No Name Page
1 Aditya R. Pandhare & Ritesh D. Banpurkar 1
2 Ankush M. Hatwar & Abhijit Misal 5
3 Dushant G. Waghamare & Ritesh D. Banpurkar 9
4 Vipin Mankar, Prof. Swapnil Thanekar & Prof. Neeraj Wayzode 14
5 Prof. Sachin Naik & Prof. Dr. A.R. Bapat 18
6 Prof. Swapnil Thanekar, Mr. Shailendra Ukirde & Prof. Vipin Mankar 23
7 Swapnil A.Mahajan 27
8 Rahul Mathankar, Asif Sheikh, Shubham Girde & Swapnil Thanekar 37
9 Pawan R. Giri, Ravindra R Gandhe & Ajay A. Mahawadiwar 41
10 Piyush A.Dalke & Prof.AbhijeetA.Raut 44
11 S. B. Bakal& P.J.Nikam 53
12 S. B. Bakal, G. P. Sharma & P. J. Nikam 58
13 Syed Irfan Ali, Deepak Kapgate, Sunita Parihar & Syed Akbar Ali 63
14 Harshal S. Jumade, Prashant P. Bansod & Ajay A. Mahawadiwar 67
15 Mr. Lokesh G. Dandekar, Prof.Ritesh Banpurkar & Prof. Ajay Mahawadiwar 71
16 Nikhil Ekotkhane, Prashant Bansod & Ajay Mahawadiwar 75
17 Ritesh V. Bhawarkar, Prof.Abhijit Misal & Prof.Ajay Mahawadiwar 77
18 Vinod B. Hiwase & Prof. Ritesh Banapurkar 80
19 Yogesh A. Mangaonkar, Prof.Ravindra Gandhe & Prof.Ajay Mahawadiwar 83
20 Chhaya Ladhi & Prof.Ajay Mahawadiwar 85
21 Pravin Meshram, Subham Shende & Mr.Vishwjeet Ambade 88
22 Mr.Vishwjeet Ambade, Deepak Bhure& Mr.Vishwjeet Ambade 91
23 A.B.Lanjewar, N.S.Wakchaure, P.R.Tete & S.S.Joshi 94
24 Piyush A.Dalke & Prof.AbhijeetA.Raut 98
25 Prasanna Gaikwad, Aditya Nakat, Vansh Devhare & Jayesh Nandankar 106
26 Mr.Akshay Shende, Mr.Nitin Gokhe, Mr.Avinash Ramteke & Prof. Harshwardhan
Mahawadiwar 111
27 Mr. Ajay Rathod, Mr.Arun Chavan, Mr.Dhiraj Bramhane & prof. Harshwardhan
Mahawadiwar 114
28 Mrs.Anjali Kadam & Dr.G.K.Awari 117
29 Nikhil H. Patil & Sharad S. Chaudhari 121
30 Vinay L. Jiwtode, Rahul K. Bhoyar & Sandeep M. Pimpalgaokar 127
31 Salman Khan 132
32 Aswad A Sagdeo & Prof V.P. Kshrisagar 134
33 Suhas V. Kale, Prof. S.G.Ghugal & Prof A.B.Ganorkar 137
34 Sumit yadav, Sumit Roy & Sumit Yadav 141
35 Rahul Singh, Anoop Chauhan, Aditya Dhawale & AkshayBalkhande 145
36 Shubham Thakre, Shubham Sarde, Shrikant Kothari, Nitin Mirge &
Mr.Vishwjeet.V.Ambade 150
37 A.S Puttewar, Krishna Yadav, Ketan Warjurkar, Latikesh Khedkar, Ashwin Gajbhiye &
Bhimrao Devtale 155
38 Sachin Khobragade, Mohankhangar & Akshay Dhanorkar 159
39 Anil H. Ingle & Krunali R. Charpe 163
40 Gaurav Puri, Lankesh Jadhav & Milind Palandurkar 169
41 Prof.S.V.Borkar, Mr.KunalI Mahajan, Mr.Sanket V Bure & Mr.PrashantN Khadatkar 174
42 Shubhangi Gondane, Dr.P. N. Belkhode & Manisha Joshi 178
43 MrsArtiMathur, DrA.B.Singh & Dr A subbarao 185
44 Aditi Pandey 191

ISSN NO: 2454-1958 Special Issue Tech-Ed 2016 (International Conference) Page 1
Review on Analysis of Steam Turbine Blade
Aditya R. Pandhare
M.Tech M.E.D., Department of Mechanical
Engineering
Abha Gaikwad-Patil College of Engineering
Nagpur, India [email protected]
Ritesh D. Banpurkar
Asst. Prof., Department of Mechanical Engineering
Abha Gaikwad-Patil College of Engineering
Nagpur, India
Abstract— Steam turbine blades are one of the most critical
components in power plants Blade is a major component of the
turbine, which receives the impulse directly from the steam jet
and converts this force into the driving force. Statistics has shown
that LP blades are usually more predisposed to failure compared
to blades in HP or IP turbines. The present research work
analyses the effects of thermal and structural load on a steam
turbine blade under the operating conditions. Stresses due to
thermal and dynamic loads of low Pressure Steam Turbine blade
of 210 MW power stations analyzed in two stages. In first stage a
three dimensional model of turbine blade was prepared in CREO 2.0.
This model will import in ANSYS-14.5 for Finite Element
Analysis. Maximum stress and stress distribution is compute
using Finite Element Analysis (FEA) at the corresponding section.
Keywords— Low pressure Blade, Steam Turbine, Stress
Distribution, and Finite Element Analysis by ANSYS software.
I. INTRODUCTION
Steam turbines are major prime movers in thermal power
stations. The main parts of simple impulse steam turbine are rotor, blades and nozzles. Turbine blade is exposed to various
loads such as thermal, inertia, and bending and may fail due to
different factors like Stress-Corrosion Cracking, High-Cycle
Fatigue, Corrosion-Fatigue Cracking, Temperature Creep
Rupture, Low-Cycle Fatigue, corrosion, etc.
The software offers a comprehensive range of stress analysis
and other capabilities in an integrated package for such large-
scale, complex problems. An integrated infrastructure, ANSYS Parametric Design Language customization
capabilities and nonlinear simulation with contact plasticity
work together to provide powerful simulation capabilities for
this type of application. Key dimensions of the blade root were
modified using ANSYS Parametric Design Language (APDL)
capabilities, with ANSYS Mechanical software analyzing the
various combinations of parameters.
Ever since the evolution of FEA, there has been a continuous and growing need for a powerful design analysis tool in the
power generation industry. In general, turbines represent a
class of challenging mechanical prime movers where steady
and transient stresses (mechanical and thermal), turbine blade
vibrations, and the start/stop cycling of the machines present
interesting design challenges to produce a highly reliable
machine with long design lives. Particular interest is the
analysis of turbine blades, as these rotating components, if the
separated from their attachment to the rotor, have the potential
for causing a tremendous amount of consequential damage,
both in the form of human life and property damage.
A. Problem definition
All mordern steam power plants use impluse-reaction turbines
as their blading efficiency is higher than that of impluse
turbines. Last stage of steam turbine impluse-reaction blade
are very much directly affect efficiency of plant.With the information that an understanding of the forces and stresses
acting on the turbine blades is vital importance, in this work
we will compute such a force acting on a last stage Low
Pressure (LP) blade of a large steam turbine rotating at 3000
rpm in order to estimate the material stresses at the blade root.
One such LP steam turbine blade is show in Figure 1. We
studied structural and thermal analysis of blade using FEA for
this work and by use of the operational data have performed
by using FEA (ANSYS) and This study work involved the
analyze bldde and check FEA data of std. blade with various
material
B. Objective
The main objectives of the study were
1) To study effect of stress distribution on steam turbine blade
2) Structural and thermal analysis of steam turbine blade
ISSN NO: 2454-1958 Special Issue Tech-Ed 2016 (International Conference) Page 2
3) Calculating stresses through advanced computer modelling
techniques and simulation
4) To study effect of pressure and get the response of the blade
II. RESEARCH METHODOLOGY
The following methodology used for carrying out Finite
Element Analysis of 210 MW low-pressure blade of Steam
turbine.
1) Formulation of the problem – the success of any experiment
is dependent on a full understanding of the nature of the
problem.
2) Validation of FEM method for finding maximum stress.
3) Modeling of the steam turbine blade will done using CAD
software CREO 2.0.
4) Stress distribution on turbine blade and root.
5) Software ANSYS 14.5 using for Finite Element Modeling.
Validation of fem method for finding stress A.
Steps of validation of fem method for finding Stress:
1) Prepare a three dimensional model in CREO 2.0.
2) Import the CREO2.0 model in ANSYS software.
3) Mesh the ANSYS model.
4) Apply boundary conditions and find out stress distribution
in the component.
5) Validate that maximum stress in component with operating
condition.
III. LITERATURE REVIEW
Many investigators have suggested various methods to explain
the effect of stress and loading on turbine blade, roter and analysis the various parameters:
John. V, T. Ramakrishna was investigated on design and
analysis of Gas turbine blade, CATIA is used for design of
solid model and ANSYS software for analysis for F.E. model
generated, by applying boundary condition, this paper also
includes specific post processing and life assessment of blade.
How the program makes effective use of the ANSYS pre-
processor to mesh complex geometries of turbine blade and apply boundary conditions. The principal aim of this paper is
to get the natural frequencies and mode shape of the turbine
blade. In this paper we have analyzed previous designs and
generals of turbine blade to do further optimization, Finite
element results for free standing blades give a complete
picture of structural characteristics, which can utilized for the
improvement in the design and optimization of the operating
conditions.
Subramanyam Pavuluri, Dr. A. Siva Kumar was investigated
on design of high pressure steam turbine blade addresses the
issue of steam turbine efficiency. A specific focus on airfoil
profile for high-pressure turbine blade, and it evaluates the
effectiveness of certain Chromium and Nickel in resisting
creep and fracture in turbine blades. The efficiency of the
steam turbine is a key factor in both the environmental and
economic impact of any coal-fired power station. Based on the
research presented modifications to high-pressure steam turbine blades can made to increase turbine efficiency of the
turbine. The results and conclusions are presented for a
concerning the durability problems experienced with steam
turbine blades. The maximum operational Von Mises Stresses
are within the yield strength of the material but the
deformation is comparatively better for material CA-6 NM
(Chromium Nickel). Modified solutions for Steam turbine
blade values to machines to maximize their reduce life cycle
costs, efficiency, and improve reliability
Sanjay Kumar was investgated on creep life of turbine blade.
Inertia load is the constant load that will cause creep failure.
Creep is a rate dependent material nonlinearity in which
material continues to deform in nonlinear fashion even under
constant load. This phenomenon is predominant in
components, which exposed to high temperatures. By studying
the creep phenomenon and predicting the creep life of the
component, we can estimate its design life. The main objective
is to predict the creep life of the simple impulse steam turbine
blade, and to give the FEM approach for creep analysis. The analysis of turbine blade for different loads, which shows that
the maximum stresses, induced in each case. These stresses
are within yield limit of the material and will not undergo
plastic deformation during operationresult is found that, creep
life decreases as the stress value increases. Hence, by
decreasing the stress value in the component we can increase
its creep life. This was be achieved by modifying the blade
design.
Avinash V. Sarlashkar, MARK L. Redding investigated on the
architecture and capabilities of Blade Pro. An ANSYS based
turbine blade analysis system with extensive automation for
solid model and F.E. model generation, boundary condition
application, file handling and job submission tasks for a
variety of complex analyses; the program also includes turbo
machinery specific post-processing and life assessment
modules. Blade Pro is a cutting-edge example for vertical
applications built on the core ANSYS engine using ANSYS
APDL. Examples of how the program makes effective use of
the ANSYS preprocessor to mesh complex geometries of turbine blade and apply boundary conditions are presented
using specific examples. A real world application is used to
demonstrate the pre-processing capabilities, static and
dynamic stress analyses results, generation of Campbell and

ISSN NO: 2454-1958 Special Issue Tech-Ed 2016 (International Conference) Page 3
Interference diagrams and life assessment. The principal
advantage of Blade Pro is its ability to generate accurate
results in a short amount of time, thus reducing the design
cycle time. The good correlation achieved is a testament to the accuracy of the ANSYS solvers and validity of the modeling
techniques adopted in Blade Pro.
DR.SHANTHARAJA.M, DR. Kumar. K., was work on the
large variety of turbo-machinery blade root geometries used in
industry prompted the question if an optimum geometry could
be found. An optimum blade root was defined, as a root with
practical geometry which, when loaded returns the minimum
fillet stress concentration factor. The present paper outlines the design modification for fillet stresses and a special attention
made on SCF of the blade root (T-root) which fails and to
guarantee for safe and reliable operation under all possible
service conditions. Finite Element Analysis is used to
determine the fillet stresses and Peterson’s Stress
Concentration Factor chart is effectively utilized to modify the
blade root. The root modified due to the difficulty in
manufacturing the butting surface of the tang that grips the
blade to the disk crowns.
Avinash V. Sarlashkar, MARK L. Redding investigated on the
architecture and capabilities of Blade Pro. An ANSYS based
turbine blade analysis system with extensive automation for
solid model and F.E. model generation, boundary condition
application, file handling and job submission tasks for a
variety of complex analyses; the program also includes turbo
machinery specific post-processing and life assessment
modules. Blade Pro is a cutting-edge example for vertical
applications built on the core ANSYS engine using ANSYS
APDL. Examples of how the program makes effective use of the ANSYS preprocessor to mesh complex geometries of
turbine blade and apply boundary conditions are presented
using specific examples. A real world application is used to
demonstrate the pre-processing capabilities, static and
dynamic stress analyses results, generation of Campbell and
Interference diagrams and life assessment. The principal
advantage of Blade Pro is its ability to generate accurate
results in a short amount of time, thus reducing the design
cycle time. The good correlation achieved is a testament to the
accuracy of the ANSYS solvers and validity of the modeling
techniques adopted in Blade Pro.
DR.SHANTHARAJA.M, DR. Kumar. K., was work on the
large variety of turbo-machinery blade root geometries used in
industry prompted the question if an optimum geometry could
be found. An optimum blade root was defined, as a root with
practical geometry which, when loaded returns the minimum
fillet stress concentration factor. The present paper outlines the
design modification for fillet stresses and a special attention
made on SCF of the blade root (T-root) which fails and to guarantee for safe and reliable operation under all possible
service conditions. Finite Element Analysis is used to
determine the fillet stresses and Peterson’s Stress
Concentration Factor chart is effectively utilized to modify the
blade root. The root modified due to the difficulty in
manufacturing the butting surface of the tang that grips the
blade to the disk crowns
having small contact area. Verify the same using Finite
Element Analysis for two cases with and without the tang in
the blade. Firstly, to study the fillet stresses with tang and then
Petersons chart is used to reduce the peak stresses with the
modification to the butting area and reducing the fillet radius.
To conduct the sensitivity analysis for the fillet stresses in
blade and disk using FEA.
In the work, the first stage rotor blade off the gas turbine has
analyzed using ANSYS 9.0 for the mechanical and radial
elongations resulting from the tangential, axial and centrifugal
forces. The gas forces namely tangential, axial were
determined by constructing velocity triangles at inlet and exist
of rotor blades. The material of the blade was specified as
N155. This material is an iron based super alloy and structural
and thermal properties at gas room and room temperatures the
turbine blade along with the groove blade is modeled with the 3D-Solid Brick element. The geometric model of the blade
profile is generated with splines and extruded to get a solid
model in CATIA. The first stage rotor blade of a two-stage gas
turbine has been analyzed for structural, thermal and modal
analysis using ANSYS 9.0 Finite Element Analysis software.
The gas turbine rotor blade model meshed in HYPERMESH
7.0, meshing software. The thermal boundary condition is
such as convection and operating temperatures on the rotor
blade obtained by theoretical modeling. Analytical approach
used to estimate the tangential, radial and centrifugal forces.
In this work the failure of a second stage blade in a gas turbine
was investigated by metallurgical and mechanical
examinations of the failed blade. The blade was made of a
nickel-base alloy Inconel 738LC. The turbine engine has been
in service for about 73,500 hrs. Before blade has failure. Due
to the blade failure, the turbine engine was damaged severely.
The investigation started with a thorough visual inspection of
the turbine and the blades surfaces, followed by the
fractography of the fracture surfaces, micro structural
investigations, chemical analysis and hardness measurement. The observation showed that a serious pitting occurred on the
blade surfaces and there were evidences of fatigue marks in
the fracture surface. The micro structural changes were not
critical changes due to blade operation at high temperature. It
found that the crack initiated by the hot corrosion from the
leading edge and propagated by fatigue and finally, because of
the reduction in cross-section area, fracture was completed.
An analytical calculation parallel to the finite element method
utilized to determine the static stresses due to huge centrifugal
force. The dynamic characteristics of the turbine blade
evaluated by the finite element mode and harmonic analysis. Finally according to the log sheet records and by using a
Campbell diagram there was a good agreement between the
failure signs and FEM results which showed the broken blade

ISSN NO: 2454-1958 Special Issue Tech-Ed 2016 (International Conference) Page 4
has been resonated by the third vibration mode occasionally
before the failure occurred
. Conclusion
From above literature, review it is indicated that
1) There are many researches done on turbine blade in high-
pressure stage or rotor section and work also done in steam
and gas based power plant. But I found that are very few
researches done work on last stage tangent-twisted blade of
LP stage of turbine so we want to do research on this section.
We like to use FEA for analysis.
2) Turbine blade tupe,flow of steam through impluse or
rection blade,geomeatry of blade,helix angle,force on the
blade,material properties of the blade,speed of the turbine and
etc. are various parameter important for the turbine blade
condition.
3) They affect the blade life and efficiency of the plant in
terms of mechanical properties and working codition.
4) The complex Design of blade will done in CREO 2.0
parametric software with coordinate point of tip and root
section of blade
5) To perform analysis with appropriate set of parameters is
done in ANSYS14.5 software (FEA).
Acknowledgment
The authors would like to thank the anonymous reviewers
for their comments which were very helpful in improving the
quality and presentation of this paper.
References
[1] John. V, T. Ramakrishna,‟‟The Design And Analysis Of Gas Turbine
Blade”, International Journal of Advanced Engineering Research and Studies,
VOL,2., ISSUE I,OCT.-DEC.,2012 , page no . 53-55
[2] Subramanyam PAVULURI, DR. A. Siva KUMAR,„‟ Experimental
Investigation On Design Of High Pressure Steam Turbine Blade‟‟,
International Journal of Innovative Research in Science, Engineering and
Technology,VOL. 2, ISSUE 5, MAY 2013, ISSN: 2319-8753
[3] S. M. Sanjay Kumar, ―Creep Life Prediction of Steam Turbine Blade
Using Finite Element Method.” International Journal of Advanced Engineering Research and Studies, VOL. I, NO.2, PP. 95-98
[4] Avinash V. Sarlashkar ,MARK L. Redding,“ An Ansys-Based Turbine
Blade Analysis System‟‟ Impact Technologies, LLC, ROCHESTER, NY 14623, U.S.A
[5] DR.SHANTHARAJA.M, DR. Kumar. K .‟‟Design Modification For
Fillet Stresses In Steam Turbine Blade‟‟, IJAE International Journal of
Advanced Engineering Research and Technology, VOL III,ISSUE I 2012
[6] G.NARENDRANATH, S.SURESH,‟‟THERMAL Analysis Of A Gas
Turbine Rotor Blade By Using Ansys‟‟, International Journal of Engineering
Research and Applications, VOL. 2, ISSUE 5, SEPTEMBER- OCTOBER
2012, PP.2021-2027, ISSN: 2248-9622
[7] Patil A.A.,SHIRSAT U.M,.‟‟Study Of Failure Analysis Of Gas Turbine
Blade‟‟, IOSR Journal of Engineering, ISSN: 2250-3021, ISBN: 2878-8719, PP 37-43

ISSN NO: 2454-1958 Special Issue Tech-Ed 2016 (International Conference) Page 5
Design of Single Fork of Folding Bicycle
Ankush M. Hatwar
Mechanical engineering department Abha Gaikwad Patil College of engineering, Nagpur
Maharashtra, India
Abhijit Misal
Mechanical engineering department Abha Gaikwad Patil College of engineering, Nagpur
Maharashtra, India
Abstract—In today’s life the bicycle can play the very important
role for daily transportation purpose in human life. The reason
behind increase in the importance is because of increased
pollution due to automobiles and cost of fuel which is
continuously increasing now a day. Also the transport has been
one of the most important issues to be deal with in the present
day situation as commuting from place to place within the city
has become a tedious and an expensive task. It is very difficult to
reach the nearest public transport facility and in many cases the
destination will be very far from the main roads where the public
transport might not be able to commute or it might be very
expensive. To overcome a common problem faced by the society,
an idea is conceptualized to design a single fork foldable bicycle.
The aim of our paper is to design and analysis of single fork of
foldable bicycle which fold in compact form which facilitating
easy transport and easily park. We already have seen many
foldable bicycles in the global market but the main idea of this
paper is to provide only one side fork to a foldable bicycle which
is light & safe, easy to handle, easy to fold and easy to maintain.
Unlike the conventional cycles, this bicycle will occupy very less space and also is very easy to be carried around.
Keywords—conventional, conventional bicycles, fork, foldable bicycle, transport
I. INTRODUCTION
The Currently available bicycles are made up of heavy
materials which make them difficult to carry. The prices of the
bicycles are also not affordable to the common man. Many of
them are not foldable in a configurable geometrical order,
because of which their transportation becomes very difficult. It
also leads to a lot of difficulty, when it is to be stored for
future use. To propose a compact foldable bicycle this is weightless and overcomes all the limitations in the currently
available bicycles. The proposed bicycle is designed in such a
way that it is foldable by providing fasteners at the joints. The
design structure imparts stable bicycle geometry.
Transport has been one of the major issues in developing cities
such as Bangalore since commuting from one place to another
has become tedious and expensive. With the petrol and diesel
prices increasing day by day, almost all the modes of transport are becoming expensive. It is difficult to reach the nearest
public transport facility and in many cases the destination will
be far from the main roads where the public transport might
not be able to reach due to the small roads, to avoid which
most people use vehicles of their own, which in turn leads to
issues with parking, traffic, etc. But not all can opt for having
own vehicles as it is expensive. With such issues in health,
transport, space for parking, etc. one solution that comes to mind is bicycle. Bicycles are being promoted in the corporate
and educational sectors. But how convenient is it to use a
conventional bicycle? In many cases there is no special facility
provided for locking the bicycles and even if one is present, it
is probable to theft, which is one of the fears that obstruct use
of bicycle. Conventional bicycles occupy sufficient space and
hence providing one at work place or at home are quite
difficult. They are probable to be exposed to the weather
outside and do require frequent maintenance. With all such
issues in the conventional bicycles, the next possible solution
is the usage of foldable bicycle. With foldable bicycles, there is no issue since the bicycle can be folded and carried around
to the work place or even it can be used to reach the nearest
public transport facility and then folded and carried along.
Since the bicycle is being folded, it occupies very less space
and doesn’t require any special parking space. They are not
exposed to the weather since they can be carried inside
buildings with ease and hence prone to less maintenance. The
usage of foldable bicycle helps combine the different modes of
transport as mentioned above, which helps in cutting down
some cost involved in travelling.
II. COMPONENT OF FOLDING BICYCLE
A. Folding Body Frame
It is a main supporting part of the bicycle. On which wheels
and other components are fitted. The modern and most
common frame design for an upright bicycle is based on the safety bicycle, and consists of two triangles, a main triangle
and a paired rear triangle. This is known as the diamond frame.
Frames are required to be strong, stiff and light, which they do
by combining different materials and shapes. At the time of
folding the folding bicycle the main frame or folding body of

ISSN NO: 2454-1958 Special Issue Tech-Ed 2016 (International Conference) Page 6
the folding bicycle is folded in such manner that the horizontal
axis of the front wheel and the horizontal axis of the back
wheel are come in a same axis As the folding of the main
frame or folding body of the folding bicycle is completed. The
front wheel holder and back wheel holder are fixed with each
other with the help of Velcro.
B. Compact joint
It is a joint which provides on the frame so that front and rear
portion can be overlap.
C. Handle
It is the front portion of bicycle which uses to control the
direction of bicycle. Bicycle handlebar or often bicycle handlebars refer to the steering mechanism for bicycles; the
equivalent of a steering wheel. Besides steering, handlebars
also often support a portion of the rider's weight, depending on
their riding position, and provide a convenient mounting place
for brake levers, shift levers, cycle computers, bells, etc.
Handlebars are attached to a bike's stem which in turn attaches
to the fork.
D. Transmission mechanism
It is the mechanism which transmits the power from pedal to
rear wheel. A bicycle chain is a roller chain that transfers
power from the pedals to the drive-wheel of a bicycle, thus
propelling it. Most bicycle chains are made from plain carbon
or alloy steel, but some are nickel-plated to prevent rust, or
simply for aesthetic. Before the safety bicycle, bicycles did not
have chains and the pedals were typically attached directly to
the drive-wheel, thus limiting top speed by the diameter of the
wheel and resulting in designs with front wheels as large as
possible. Various linkage mechanisms were invented to raise
the effective gear ratio, but with limited success. Using chain drive allowed the mechanical advantage between the drive and
driven sprockets to determine the maximum speed.
E. Adjustable Seat
It is the setting arrangement in the bicycle. The Saddle, Undo the lever, push the saddle right down, and re-clamp the lever.
During this action, it is because of this that the rear frame
remains folded, in turn retaining the front wheel in its folded
position. So if you do not push the saddle fully down, it is
possible for the folded package to come apart when you pick
the bike up. Folding pedal, it is best to fold this with the left
hand crank as high as possible i.e. with the cranks turned so
that the right hand pedal touches the front wheel also, the
ridged side of the nylon latch plate on the pedal should face
upwards. This is the arrangement used in the bicycle which is
use for the carrying the bags or any kind of things on carriage we have to fixed it first on the carriage.
Fig 1: Component of folding bicycle
III. MATERIAL SELECTION FOR FRAME
The selection of suitable material for the frame was most
important to make the frame study, yet light. After long
sessions of discussion it was finalized to use the standard
material used in conventional bicycles i.e. Mild steel.
Mild steel is easily available in the required diameter and length and is also not expensive. One main advantage of using
mild steel is that it is easy to fabricate with it as welding of
mild steel is by arc welding process which is cheap compared
to other welding methods. Use of other materials like alloys of
aluminum was not selected as the availability is less and also
the fabrication cost is high.
Mild steel tubes of 1”, 1.5”, and 0.5” are easily available in the
market and are the ones used for conventional bicycle
manufacturing. The hinge found in the market is also made of
mild steel which eases the process of joining the frame to the
hinges.
The following are the chemical composition and mechanical properties of mild steel.
Chemical composition Carbon 0.16-0.18% Silicon 0.40% max Manganese 0.70-0.90% Sulphur 0.040% Max
Phosphours 0.040% Max
IV. TESTING FOR BENDING AND COMPRESSION
LOADS
A. BENDING TEST:
The tube used to fabricate the bicycle was subjected to
bending test. A tube of outer diameter 1 inch, 16 gauge and
length 10 inches was used as the test specimen. The specimen
was mounted on the UTM with necessary arrangements to
perform bending test. The specimen was supported by two v-
blocks and then the bending test was done. It was observed that the tube does not show much deflection till a load of 4 KN, but
the since the tube is hollow first the outer surface of the tube
was bent then the whole tube started bending. The bending test

ISSN NO: 2454-1958 Special Issue Tech-Ed 2016 (International Conference) Page 7
was carried out till a deflection of 8.5 mm was observed. The
variation of the deflection with respect to the load is as shown
in the graph below.
Fig 2: Graph of Deflection v/s Load for bending test
B. COMPRESSION TEST:
The mild steel tube was cut and welded to the angle as in the
frame design and tested on the UTM till fracture. The mild
steel tube of outer diameter 1 inch and 16 gauges was used to
build the specimen as per the required dimensions.
Compressive load was applied on the specimen. It is observed that there is very less deflection up to a load of 4 KN and then
the joint shows plastic deformation at 5KN and then fractures
at a load of 6.5 KN. The result of the test is plotted as a graph
of deflection versus load and is as shown in the below figure.
Fig 3: Graph of Deflection v/s Load for compression test
V. DESIGN OF SINGLE FORK
Fork is the portion of bicycle that holds the front wheel allows
the rider to steer and balance the bicycle. Forks have several
key dimensions which include: offset length, width, steerer
tube length, and steerer tube diameter.
We use the simple design of fork for our bicycle; we selected
the size 25 mm diameters of tube and 300 mm length as shown
in the figure. A normal mild steel fork was to be converted into
a member that can lock after the bicycle was unfolded. This
was a challenging task. Once the required data was gathered
regarding the dimensions of the fork and frame, the fork was
modeled using 3D tools. We analyze the mechanical properties on the single side fork
by FEA using various materials and investigate optimum and
effective material based on results obtained by proposed
analysis.
Fig 4: Single fork design
Fig 5: Design of various components
VI. 3D MODELLING OF SINGLE FORK
For modeling and analysis of our proposed folding bicycle we
use the softwares Pro-E and Ansys.
A. Pro/ENGINEER
It is basically the 3D modeling tool software in which
modeling and drawing and drafting is taking place also it gives
the tutorial-based introduction to creating parts, assemblies and
drawings in Pro/ENGINEER. If you follow the complete series
of procedures, you will learn how Pro/ENGINEER passes 3D
design information to and from every design
B. ANSYS
ANSYS is a Workbench application that can be use to perform
a variety of engineering simulations, including stress, thermal,
vibration, thermo-electric, and magneto static simulations. A
typical simulation consists of setting up the model and the
loads applied to it, solving for the model's response to the
loads, examining the details of the response with a variety of tools.
Analysis is used to evaluate the fatigue failure of the proposed
bicycle design. The failure locations and the cycles to failure
are determined by analysis. The foldable bicycle frame is

ISSN NO: 2454-1958 Special Issue Tech-Ed 2016 (International Conference) Page 8
modeled and simulated in the CAD/CAE environment. The
developed 3D cad model of foldable bicycle frame is show in
fig. The tetrahedral element type has been used in this study for
the bicycle analysis.
Fig 6: 3D modeling of frame with single fork
CONCLUSION
From the proposed concept we can conclude that single fork
used in folding bicycle can be effectively employed in new
upcoming bicycle for optimum design, flexibility in
maintenance, good aesthetics and best design for improved
structure of folding bicycle.
REFERENCES
[1] Shishir. S, Manjunath. P, Pavanasudan. R, Ravi Sathyajith, Abhijith
Gowda A. R. “Study Of Design And Fabrication Of Foldable Bicycle Hinge Mechanism” International Journal of Informative & Futuristic
Research /June 2015/ISSN: 2347-1697
[2] Arunachalam M, Arun Prakash R. and Rjesh Rao, “foldable bicycle evaluation ofexisting design and novel design proposal” ARPNA
Journal of Engineering and Applied sciencevol. 9, NO.5 May 2014
[3] A.K. Singh, A.S. Bobade, A.K. Ghodmare, B.C. Bisen, H.H. Walmik, P.C. Padole “Concept of User Friendly Modified Folding Bicycle”
European Journal of Applied Engineering and Scientific Research, 2014, 3 (1):16-20
[4] M.A. Maleque1, a, M S Hossain2, b and S. Dyuti3, c “Material
Properties and Design Aspects of Folding Bicycle Frame” Advanced Materials Research
[5] Herder, “foldable bicycle frame”,United State patent,
Australia,3\2000,6032971
[6] P.A Rodgers, G. Green and A. Mc Gown.2013. Using concept sketches to tack design progress.CIRP Annals Manufacturing technology.58:543-
565.5
[7] Shih-Wen Hasio, Jyh-Rong chou, “A creativity-based design process for
innovative bicycle design”, International Journal Of Industrial Ergonomic 34 (2004) 421-443
[8] Derek Covill, Steven Begga, Eddy Eltona. “Parametric finite element
analysi of bicycle frame geometries” 2014 conference of the International Sports Engineering Association

ISSN NO: 2454-1958 Special Issue Tech-Ed 2016 (International Conference) Page 9
Review of disc brake squeal analysis
Dushant G. Waghamare
M.Tech M.E.D., Department of Mechanical
Engineering Abha Gaikwad-Patil College of Engineering
Nagpur, India
Ritesh D. Banpurkar
Asst. Prof., Department of Mechanical Engineering
Abha Gaikwad-Patil College of Engineering Nagpur, India
Abstract— It has been observed that brake squeal noise is
faced as a major issue by automotive manufactures for many
years due to consistent customer complaints, high warranty costs
and accidents caused by misbalancing due to crash braking. An
automobile survey has revealed that the brake noise is being one
of the most critical vehicle quality measurements. From early of
the last century and till date disc brake squeal is being a complex
problem in the automobiles. Many researchers have investigated
the problem by means of experimental, analytical and
computational methods. This paper provides review of
investigations carried out in context with disc brake squeal
analysis. It also includes review on characteristic of brake squeal.
A reviews of the analytical, experimental and numerical methods used for the investigation of brake squeal is given.
Keywords— Disc Brake Squeal, Brake squeal noise, Brake squeal
analysis, automotive, analytical, experimental.
I. INTRODUCTION
Brake squeal is the unusual sound which occurs in
the frequency range between 1 and 12 kHz, has been one of
the most difficult concerns associated with vehicle brake
systems. In most cases, this type of noise has little or no effect on the performance of brake system. However, most
customers perceive this noise as a problem and demand that
their dealers fix it. Thus automotive industry is thus looking
for new ways to solve this problem.
In general, brake noise has been divided into three categories,
in relation to the frequency of noise occurrence. The three
categories presented are low frequency noise, low-frequency squeal and high-frequency squeal. Low-frequency disc brake
noise typically occurs in the frequency range between 100 and
1 kHz. Typical noises that reside in this category are grunt,
groan, grind and moan. This type of noise is caused by friction
material excitation at the rotor and lining interface. The energy
is transmitted as a vibratory response through the brake corner
and couples with other chassis components. The failure mode
for this category of squeal can be associated with frictional
excitation coupled with a phenomenon referred to as modal
locking of brake corner components. Modal locking is the
coupling of two or more modes of various structures
producing optimum conditions for brake squeal. High-
frequency brake squeal is defined as a noise which is produced
by friction induced excitation imparted by coupled resonances (closed spaced modes) of the rotor itself as well as other brake
components. It is typically classified as squeal noise occurring
at frequency range 3-12 kHz. Since it is a range of frequency
which affects a region of high sensitivity in the human ear,
high-frequency brake squeal is considered the most annoying
type of noise.
Brake squeal is a concern in the automotive industry that
has challenged many researchers and engineers for years. Considerable analytical, numerical and experimental efforts
have been spent on this subject, and much physical insight has
been gained on how disc brakes may generate squeal, although
all the mechanisms have not been completely understood. No
precise definition of brake squeal has gained complete
acceptance, but it is generally agreed that squeal is a sustained,
high frequency greater than 1 kHz vibration of brake system
components during a braking action resulting in noise audible
to vehicle occupants or passers-by. There exists no general
means for completely eliminating brake squeal. Brakes that
squeal do not, in general, squeal during every braking action. Rather, the occurrence of squeal is intermittent or perhaps
even random. Many different factors on both the micro- and
macroscopic levels appear to affect squeal, and some of these
factors (especially on the microscopic level) are not well
understood. As different brake squeal experiments produce
widely different and even conflicting results. Generally, a
central difficulty in modeling brake squeal is one of scales.
Effects on very small scales in length and time (i.e.,
microscopic contact phenomena and high-frequency
vibrations) interact in important ways with effects on large
scales (such as wear over the life of the brake and dynamics of
large vehicle substructures). A number of theories have been formulated to explain the mechanisms of brake squeal, and

ISSN NO: 2454-1958 Special Issue Tech-Ed 2016 (International Conference) Page 10
numerous studies have tried with varied success to apply them
to the dynamics of disc brakes.
II. CHARACTERISTICS AND MECHANISM OF DISC BRAKE
SQUEAL
A. Brake noise squeal mechanisms
The Disc brake squeal occurs when a system experiences vibrations with very large mechanical amplitude. There are
two theories that attempt to explain why this phenomenon
occurs. The first theory states that brake squeal is a result of a
stick–slip mechanism. Second theory is mode coupling theory.
It states that high levels of vibration result from geometric
instabilities of the brake system assembly. Both theories,
however, attribute the brake system vibration and the
accompanying audible noise to variable friction forces at the
pad–rotor interface. According to the first hypothesis, the
stick–slip theory, a variable friction coefficient with respect to
sliding velocity between pads and rotor, provides the energy
source for the brake squeal. Several studies based on this theory were conducted when disc brakes were first used on
automobiles. Squeal noise was found to be more likely when
the decreasing relationship between the friction coefficient and
the sliding velocity become pronounced. An increase in the
negative slope did not always increase the occurrence of
squeal, however, the need for an alternative or accompanying
theory was revealed. In the case of geometric instability, the
second theory, the variable friction forces are caused by
variable normal forces. Even if the coefficient of friction is
constant, variable friction forces are still possible.
Investigations based on this hypothesis began with Spurr and were advanced by Earles and Soar. In this case, two system
modes that are geometrically matched move closer in
frequency as the friction coefficient increases. These two
modes eventually couple at the same frequency and become
unstable
B. Characteristics of brake squeal
One of the biggest contributors to a brake squeal is the
friction material, since Squeal excitation occurs at the friction
interface, and it normally takes approximately 12 months to
finalize a friction material selection. This certainly makes it
very difficult to predict a priori the propensity of a brake
system to squeal. Also, often in the design of a brake system,
priority is given to requirements such as braking performance,
cost and ease of manufacture. The common practice for the
different components of a brake system to be manufactured by different suppliers further complicates matters. The large
number of vehicles produced means that even a low squeal
propensity found during initial testing of a brake system can
become a major concern once a vehicle is in production due to
a much larger population size. Modifications towards the end
of development phase will have two potential risks: [1]
leading to production delays and increased costs to both the
brake and vehicle manufacturers and [2] leading to products
not fully validated with potential field warranty concern. The
most significant complication in brake research is the fugitive
nature of brake squeal; that is, brake squeal can sometimes be
non-repeatable. There are many potential squeal frequencies
(unstable modes) for a brake system. Each individual
component has its own natural modes. The modal frequencies
and modal shapes of the rotor, caliper, anchor and pad will
change once these parts are installed. During a brake
application, these parts are dynamically coupled together resulting in a series of coupled vibration modes, which are
different from the component free vibration modes. The
addition of the friction coupling forces at the friction interface
results in the stiffness matrix for the system containing un-
symmetric off-diagonal coupling terms. From the stability
point of view, this coupling is considered to be the root cause
of the brake squeal. A brake system may not always squeal
given the „„same‟‟ conditions. Alternatively, small variations
in operating temperature, brake pressure, rotor velocity or
coefficient of friction may result in differing squeal
propensities or frequencies. Figs.1and 2 show the percentage
occurrence of brake squeal obtained at PBR Automotive Pty Ltdusing a Rubore drag type noise dynamometer and an AK
noise matrix for various brake pressures and the temperatures
respectively. It can be seen from Fig.1that there is no simple
relationship between the percentage occurrence and frequency
of the brake squeal and the brake pad pressure. Similarly, the
influence of temperature on both the occurrence and frequency
of the brake squeal is quite complex (Fig. 2). Due to the
above-mentioned difficulties in designing a noise free brake
system, efforts to eliminate brake squeal have largely been
empirical, with problematic brake systems treated in a case by
case manner. The success of these empirical fixes depends on the mechanism that is responsible for causing the squeal
problem. The most fundamental method of eliminating brake
squeal is to reduce the coefficient of friction of the pad
material. However, this obviously reduces braking
performance and is not a preferable method to employ. The
use of viscoelastic material (damping material) on the back of
back plate can be effective when there is significant pad
bending vibration. Changing the coupling between the pad and
rotor by modifying the shape of the brake pad has also been
found effective. Other geometrical modifications that have
been successful include modifying caliper stiffness, the caliper
mounting bracket, pad attachment method and rotor geometry.
Fig.1 Variation of occurrence of brake squeal with frequency
and brake pad pressure
ISSN NO: 2454-1958 Special Issue Tech-Ed 2016 (International Conference) Page 11
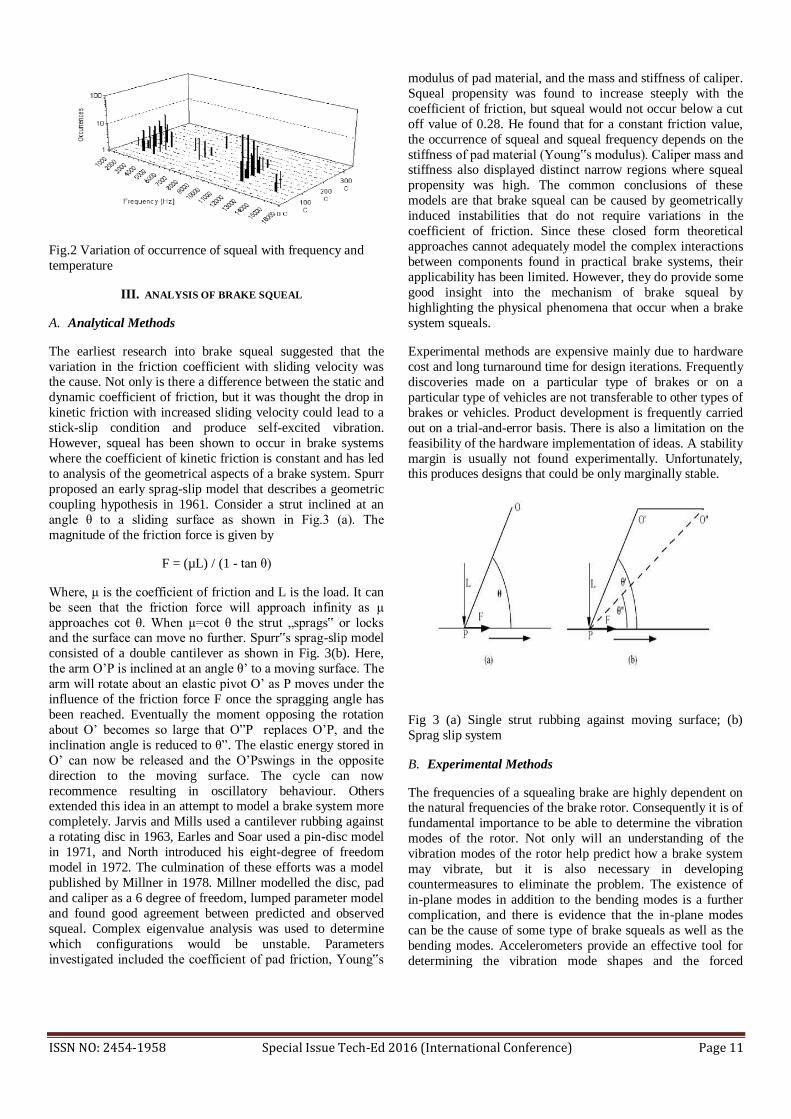
Fig.2 Variation of occurrence of squeal with frequency and
temperature
III. ANALYSIS OF BRAKE SQUEAL
A. Analytical Methods
The earliest research into brake squeal suggested that the
variation in the friction coefficient with sliding velocity was the cause. Not only is there a difference between the static and
dynamic coefficient of friction, but it was thought the drop in
kinetic friction with increased sliding velocity could lead to a
stick-slip condition and produce self-excited vibration.
However, squeal has been shown to occur in brake systems
where the coefficient of kinetic friction is constant and has led
to analysis of the geometrical aspects of a brake system. Spurr
proposed an early sprag-slip model that describes a geometric
coupling hypothesis in 1961. Consider a strut inclined at an
angle θ to a sliding surface as shown in Fig.3 (a). The
magnitude of the friction force is given by
F = (µL) / (1 - tan θ)
Where, μ is the coefficient of friction and L is the load. It can
be seen that the friction force will approach infinity as μ
approaches cot θ. When μ=cot θ the strut „sprags‟ or locks and the surface can move no further. Spurr‟s sprag-slip model
consisted of a double cantilever as shown in Fig. 3(b). Here,
the arm O’P is inclined at an angle θ’ to a moving surface. The
arm will rotate about an elastic pivot O’ as P moves under the
influence of the friction force F once the spragging angle has
been reached. Eventually the moment opposing the rotation
about O’ becomes so large that O”P replaces O’P, and the
inclination angle is reduced to θ”. The elastic energy stored in
O’ can now be released and the O’Pswings in the opposite
direction to the moving surface. The cycle can now
recommence resulting in oscillatory behaviour. Others extended this idea in an attempt to model a brake system more
completely. Jarvis and Mills used a cantilever rubbing against
a rotating disc in 1963, Earles and Soar used a pin-disc model
in 1971, and North introduced his eight-degree of freedom
model in 1972. The culmination of these efforts was a model
published by Millner in 1978. Millner modelled the disc, pad
and caliper as a 6 degree of freedom, lumped parameter model
and found good agreement between predicted and observed
squeal. Complex eigenvalue analysis was used to determine
which configurations would be unstable. Parameters
investigated included the coefficient of pad friction, Young‟s
modulus of pad material, and the mass and stiffness of caliper.
Squeal propensity was found to increase steeply with the
coefficient of friction, but squeal would not occur below a cut
off value of 0.28. He found that for a constant friction value,
the occurrence of squeal and squeal frequency depends on the
stiffness of pad material (Young‟s modulus). Caliper mass and stiffness also displayed distinct narrow regions where squeal
propensity was high. The common conclusions of these
models are that brake squeal can be caused by geometrically
induced instabilities that do not require variations in the
coefficient of friction. Since these closed form theoretical
approaches cannot adequately model the complex interactions
between components found in practical brake systems, their
applicability has been limited. However, they do provide some
good insight into the mechanism of brake squeal by
highlighting the physical phenomena that occur when a brake
system squeals.
Experimental methods are expensive mainly due to hardware
cost and long turnaround time for design iterations. Frequently
discoveries made on a particular type of brakes or on a
particular type of vehicles are not transferable to other types of
brakes or vehicles. Product development is frequently carried
out on a trial-and-error basis. There is also a limitation on the
feasibility of the hardware implementation of ideas. A stability
margin is usually not found experimentally. Unfortunately, this produces designs that could be only marginally stable.
Fig 3 (a) Single strut rubbing against moving surface; (b)
Sprag slip system
B. Experimental Methods
The frequencies of a squealing brake are highly dependent on the natural frequencies of the brake rotor. Consequently it is of
fundamental importance to be able to determine the vibration
modes of the rotor. Not only will an understanding of the
vibration modes of the rotor help predict how a brake system
may vibrate, but it is also necessary in developing
countermeasures to eliminate the problem. The existence of
in-plane modes in addition to the bending modes is a further
complication, and there is evidence that the in-plane modes
can be the cause of some type of brake squeals as well as the
bending modes. Accelerometers provide an effective tool for
determining the vibration mode shapes and the forced
ISSN NO: 2454-1958 Special Issue Tech-Ed 2016 (International Conference) Page 12
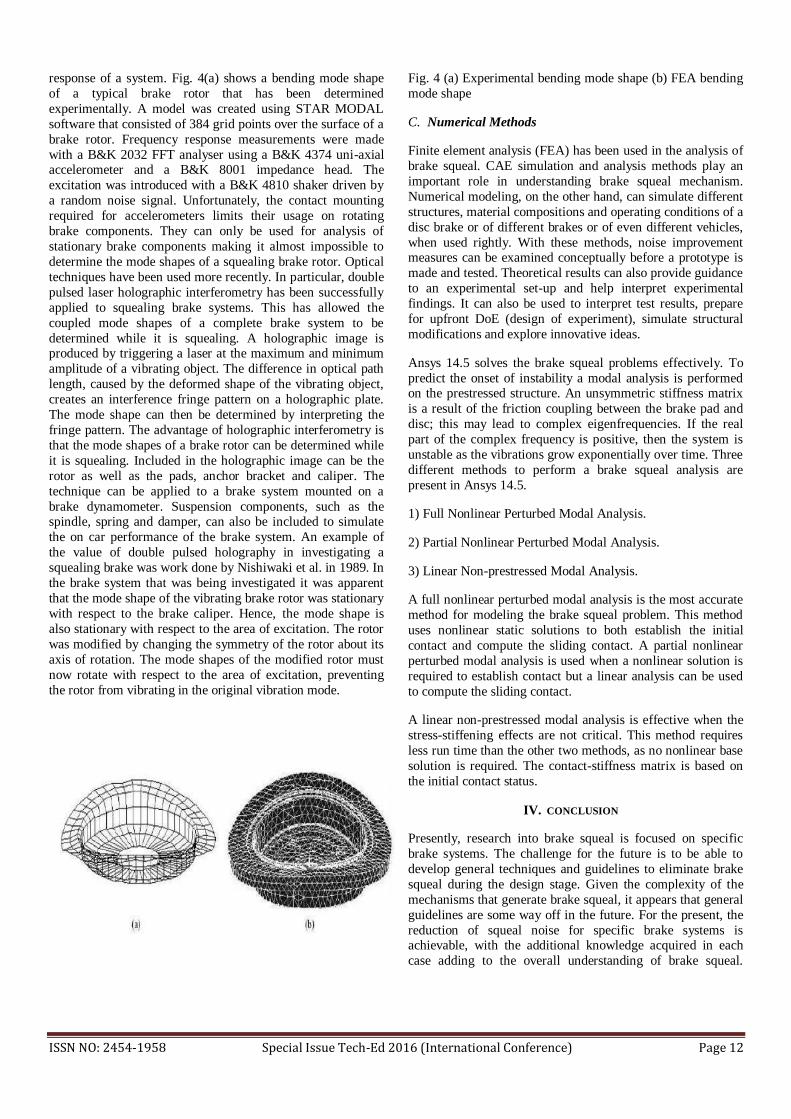
response of a system. Fig. 4(a) shows a bending mode shape
of a typical brake rotor that has been determined
experimentally. A model was created using STAR MODAL
software that consisted of 384 grid points over the surface of a
brake rotor. Frequency response measurements were made
with a B&K 2032 FFT analyser using a B&K 4374 uni-axial accelerometer and a B&K 8001 impedance head. The
excitation was introduced with a B&K 4810 shaker driven by
a random noise signal. Unfortunately, the contact mounting
required for accelerometers limits their usage on rotating
brake components. They can only be used for analysis of
stationary brake components making it almost impossible to
determine the mode shapes of a squealing brake rotor. Optical
techniques have been used more recently. In particular, double
pulsed laser holographic interferometry has been successfully
applied to squealing brake systems. This has allowed the
coupled mode shapes of a complete brake system to be
determined while it is squealing. A holographic image is produced by triggering a laser at the maximum and minimum
amplitude of a vibrating object. The difference in optical path
length, caused by the deformed shape of the vibrating object,
creates an interference fringe pattern on a holographic plate.
The mode shape can then be determined by interpreting the
fringe pattern. The advantage of holographic interferometry is
that the mode shapes of a brake rotor can be determined while
it is squealing. Included in the holographic image can be the
rotor as well as the pads, anchor bracket and caliper. The
technique can be applied to a brake system mounted on a
brake dynamometer. Suspension components, such as the spindle, spring and damper, can also be included to simulate
the on car performance of the brake system. An example of
the value of double pulsed holography in investigating a
squealing brake was work done by Nishiwaki et al. in 1989. In
the brake system that was being investigated it was apparent
that the mode shape of the vibrating brake rotor was stationary
with respect to the brake caliper. Hence, the mode shape is
also stationary with respect to the area of excitation. The rotor
was modified by changing the symmetry of the rotor about its
axis of rotation. The mode shapes of the modified rotor must
now rotate with respect to the area of excitation, preventing
the rotor from vibrating in the original vibration mode.
Fig. 4 (a) Experimental bending mode shape (b) FEA bending
mode shape
C. Numerical Methods
Finite element analysis (FEA) has been used in the analysis of
brake squeal. CAE simulation and analysis methods play an
important role in understanding brake squeal mechanism.
Numerical modeling, on the other hand, can simulate different
structures, material compositions and operating conditions of a
disc brake or of different brakes or of even different vehicles,
when used rightly. With these methods, noise improvement measures can be examined conceptually before a prototype is
made and tested. Theoretical results can also provide guidance
to an experimental set-up and help interpret experimental
findings. It can also be used to interpret test results, prepare
for upfront DoE (design of experiment), simulate structural
modifications and explore innovative ideas.
Ansys 14.5 solves the brake squeal problems effectively. To
predict the onset of instability a modal analysis is performed on the prestressed structure. An unsymmetric stiffness matrix
is a result of the friction coupling between the brake pad and
disc; this may lead to complex eigenfrequencies. If the real
part of the complex frequency is positive, then the system is
unstable as the vibrations grow exponentially over time. Three
different methods to perform a brake squeal analysis are
present in Ansys 14.5.
1) Full Nonlinear Perturbed Modal Analysis.
2) Partial Nonlinear Perturbed Modal Analysis.
3) Linear Non-prestressed Modal Analysis.
A full nonlinear perturbed modal analysis is the most accurate
method for modeling the brake squeal problem. This method
uses nonlinear static solutions to both establish the initial
contact and compute the sliding contact. A partial nonlinear
perturbed modal analysis is used when a nonlinear solution is
required to establish contact but a linear analysis can be used
to compute the sliding contact.
A linear non-prestressed modal analysis is effective when the
stress-stiffening effects are not critical. This method requires
less run time than the other two methods, as no nonlinear base
solution is required. The contact-stiffness matrix is based on
the initial contact status.
IV. CONCLUSION
Presently, research into brake squeal is focused on specific
brake systems. The challenge for the future is to be able to
develop general techniques and guidelines to eliminate brake
squeal during the design stage. Given the complexity of the
mechanisms that generate brake squeal, it appears that general
guidelines are some way off in the future. For the present, the
reduction of squeal noise for specific brake systems is achievable, with the additional knowledge acquired in each
case adding to the overall understanding of brake squeal.

ISSN NO: 2454-1958 Special Issue Tech-Ed 2016 (International Conference) Page 13
Theoretical analysis of brake systems is difficult given the
complexity of the mechanisms and the lack of an adequate
model for the friction interface that causes brake squeal.
However, this should not limit the development of simplified
models as valuable insight can be gained. Understanding
obtained by studying simplified models can assist in the interpretation of experimental results and the development of
improved computational tools
Acknowledgment
The authors would like to thank the anonymous reviewers for their comments which were very helpful in improving the
quality and presentation of this paper.
References
[1] Ma´rio Tricheˆs Ju´ nior, Samir N.Y. Gerges , Roberto Jordan. “Analysis
of brake squeal noise using the finite element method: A parametric study”.
Applied Acoustics 69 (2008) 147–162.
[2] N.M. Kinkaid, O.M. O‟Reilly, P. Papadopoulos. “Review Automotive disc brake squeal”. Journal of Sound and Vibration 267 (2003) 105–166.
[3] Ouyang, H., Nack, W, Yuan, Y. and Chen, F. (2005) “Numerical analysis
of automotive disc brake squeal: a review”, Int. J. Vehicle Noise and Vibration, Vol. 1, Nos. 3/4, pp.207–231.
[4] Antti Papinniemi, Joseph C.S. Lai, Jiye Zhao, Lyndon Loader. “Brake squeal: a literature review”. Applied Acoustics 63 (2002) 391–400.
[5] Utz von Wagner, Daniel Hochlenert, Peter Hagedorn, “Minimal models
for disk brake squeal” Journal of Sound and Vibration 302 (2007) 527–539.
[6] P. Liu, H. Zheng, C. Cai, Y.Y. Wang, C. Lu, K.H. Ang, G.R. Liu.
“Analysis of disc brake squeal using the complex eigenvalue method” Applied Acoustics 68 (2007) 603–615.
[7] H. Hetzler, K.Willner. “On the influence of contact tribology on brake
squeal” Tribology International 46 (2012) 23

ISSN NO: 2454-1958 Special Issue Tech-Ed 2016 (International Conference) Page 14
Boiler Performance Optimization
Vipin Mankar
Department of Mechanical Engineering
Nagpur, India Email: [email protected]
Prof. Swapnil Thanekar
Department of Mechanical Engineering,
Tulsiramji Gaikwad-Patil College of Engineering and Technology, Nagpur,
India
Email: [email protected]
Prof. Neeraj Wayzode
Department of Mechanical Engineering,
Tulsiramji Gaikwad-Patil College of Engineering and Technology, Nagpur,
India
Email: [email protected]
Abstract- Survival market is not only based on the quality of the
product but also the cost of the product. Today we are in era of
competition where performance of products, its production time
and production cost are considered as integral parts of quality.
Any enterprise ignoring to optimize cost will eventually be
perished by others who strive to achieve cost reduction by
maintaining or enhancing the quality of the product. So, we begin
this paper by quoting the definition of the energy efficiency in
context to the above discussion. Energy efficiency is "using less
energy to provide the same service". Here we have chosen the
most common utility i.e. Boiler and discussed about various
parameters that impact boiler efficiency and possible energy
conservation measures. The main purpose served by boilers is to
convey heat for process applications. Boilers are therefore
essentially operated to generate the required quantity and quality
of steam with least possible fuel consumption and thus at minimum cost.
INTRODUCTION
Performance of the boilers, like efficiency and evaporation
ratio reduces with time, due to various reasons which include
poor combustion, heat transfer fouling, deterioration of fuel
quality, water quality, poor operation and maintenance, high flue gas temperature, excess air supply to boilers etc. The
boiler efficiency test helps to indentify the existing
performance level of the boiler and identify the necessary
corrective actions to bring the boiler performance to the
optimized leading to conservation of energy. The British
Standard BS845: 1987 describes the methods and conditions
for the boiler testing. In India we are utilizing IS 8753: Indian
Standard for Boiler Efficiency Testing. The boiler
performance are tested based on
i. The Direct Method: This is also known as input-output
method due to the fact that it need only the useful output
(steam) and the heat input (i.e. fuel) for evaluating the
efficiency.
ii. The Indirect Method: The indirect method is also called as
heat loss method. The efficiency is arrived at by
subtracting the heat loss fractions from 100. The standard
does not include the blowdown loss in the efficiency
determination process.
PARAMETERS AFFECTING THE BOILER PERFORMANCE:
1. Loss due to dry flue gas (Sensible heat): It represents
the % heat carried out by the flue gases. The stack
temperature should be as low as possible. However, it
should not be so low that water vapor in the exhaust
condenses on the stack walls. This is important in
fuels containing significant sulphur as low
temperature can lead to sulphur dew point corrosion.
Stack temperatures greater than 200°C indicates
potential for recovery of waste heat. It also indicates the scaling of heat transfer/recovery equipment and
hence the urgency of taking an early shut down for
water / flue side cleaning. Controlling excess air to
an optimum level always results in reduction in flue
gas losses; for every 1% reduction in excess air
there is approximately 0.6% rise in efficiency.
THEORETICAL COMBUSTION DATA – COMMON BOILER FUELS
Fuel kg of air req./kg of fuel CO 2% in flue gas achieved in
practice

ISSN NO: 2454-1958 Special Issue Tech-Ed 2016 (International Conference) Page 15
Solid Fuels
Bagasse
Coal (bituminous)
Lignite
Paddy Husk
Wood
3.3
10.7
8.5
4.5
5.7
10-12
10-13
9 -13
14-15
11.13
Liquid Fuels
Furnace Oil
LSHS
13.8
14.1
9-14
TYPICAL VALUES OF EXCESS AIR LEVELS FOR DIFFERENT
FUELS
Fuel Type of Furnace or Burners Excess
Air(% by
wt)
Pulverized
coal
Completely water-cooled furnace for
slag-tap or dry-ash removal
15-20
Partially water-cooled furnace for dry-ash removal
15-40
Coal Spreader stoker 30-60
Water-cooler vibrating-grate stokers 30-60
Chain-grate and traveling-grate stokers 15-50
Underfeed stoker 20-50
Fuel oil Oil burners, register type 15-20
Multi-fuel burners and flat-flame 20-30
Natural gas High pressure burner 5-7
Wood Dutch over (10-23% through grates)
and Hofft type
20-25
Bagasse All furnaces 25-35
Black
liquor
Recovery furnaces for draft and soda-
pulping processes
30-40
BEE Chapter 2, Book 02
2. Heat loss due to evaporation of water formed due toH2
in fuel (%): The combustion of hydrogen causes a heat
loss because the product of combustion is water. This
water is converted to steam and this carries away heat in
the form of its latent heat. This loss thus varies as per the % H2 is the fuel.
3. Heat loss due to moisture present in fuel:
Moisture entering the boiler with the fuel leaves as a
superheated vapour. This moisture loss is made up of the
sensible heat to bring the moisture to boiling point, the
latent heat of evaporation of the moisture, and the
superheat required to bring this steam to the temperature
of the exhaust gas 4. Heat loss due to moisture present in air:
Vapour in the form of humidity in the incoming air,
is superheated as it passes through the boiler. Since
this heat passes up the stack, it must be included as a
boiler loss.
To relate this loss to the mass of coal burnt, the
moisture content of the combustion air and the
amount of air supplied per unit mass of coal burnt
must be known.
5. Heat loss due to incomplete combustion:
Products formed by incomplete combustion could be
mixed with oxygen and burned again with a further release of energy. Such products include CO, H2, and
various hydrocarbons and are generally found in the
flue gas of the boilers. CO is the only gas whose
concentration can be determined conveniently in a
boiler plant test.
6. Heat loss due to radiation and convection:
The other heat losses from a boiler consist of the loss
of heat by radiation and convection from the boiler
casting into the surrounding boiler house. Normally
surface loss and other unaccounted losses is assumed
based on the type and size of the boiler as given below:
For industrial fire tube / packaged boiler =
1.5 to 2.5%
For industrial water tube boiler = 2 to 3%
For power station boiler = 0.4 to 1%
7. Heat loss due to unburnt carbon in fly ash and
bottom ash:
Small amounts of carbon will be left in the ash and
this constitutes a loss of potential heat in the fuel. To
assess these heat losses, samples of ash must be analyzed for carbon content. The quantity of ash
produced per unit of fuel must also be known.
Case Study: Onsite Observation for Multifuel
travelling grate boiler
Particular Onsite Observed Data
Ambient air Temperature (oC) 31
Gross calorific value (GCV) adjusted based on moisture present in as on
received coal sample (kCal/kg)
4489
Gross calorific value (GCV) as on
received ash sample (kCal/kg)
1055
Average Steam Pressure (kg/cm2) 15.5
Average Steam Temperature (oC) 60.5
Steam Temperature (oC) 520

ISSN NO: 2454-1958 Special Issue Tech-Ed 2016 (International Conference) Page 16
Steam extraction no 1
7 TPH (P = 5 kg/cm2)
Steam extraction no 2
9.4 TPH (P = 21
kg/cm2)
Percentage of boiler loading (%) 91.11
Feed water Temperature (oC) – inlet
to economizer
85
Feed water Temperature (oC) – outlet
from economizer
213
Power generation (kW) 400
Air flow rate at FD fan– inlet to air
preheater (m3/sec)
35
BOILER SURFACE Temperature
(oC)
Boiler front side near coal
feeder
Boiler bagasse side
Below travelling grate
(bagasse side)
Boiler rare side, below travelling gate
Boiler road side
Below travelling
gate road side
142.6
37.6 and 39.9
92.5
97.5
38.1 and 41.2
89.2
CO2 in exhaust gas (%) 7.5
O2 in exhaust gas (%) 9.5
Air Temperature (oC)– inlet to air
preheater
26
Air Temperature (oC)– outlet fromair
preheater
103.5
Furnace Temperature (oC) 677.3
Flue gasTemperature (oC) – inlet of
economizer
383.3
Flue gas Temperature (oC) – outlet
of economizer
167.6
Flue gas Temperature (oC) – outlet
of air preheater
131
Flue gas Temperature (oC)– ESP
outlet i.e. supply to chimney via ID
fan
109.8
Feed water tank Temperature (oC) 64.6
Deaerator tank Temperature (oC) 81.9
Feed water line Temperature (oC) 70.6
Water Temperature (oC) - Inlet of economizer
84.7
Water Temperature (oC) – outlet of eco
213.3
Outlet of pre-super heater header
Temperature (oC)
328
Outlet of super heater header
Temperature (oC)
388
De super heater 1 Temperature (oC) 210
De super heater 2 Temperature (oC) 208
De-super heater 3 Temperature (oC) 253.5
Average Wind Velocity (m/s) 3
Fuel Analysis (%)
Moisture 39.89
Ash 11.89
Carbon 41.80
Hydrogen 1.38
Nitrogen 1.15
Oxygen 3.89
Results and Recommendations for Efficiency
Improvement:
Input/ Output Parameter kCal / kg of fuel %
Heat Input in fuel 4489 100
Various Heat losses in boiler
1. Dry flue gas loss 6.43%
2. Loss due to hydrogen in fuel 1.74%
3. Loss due to moisture in fuel 5.57%
4. Loss due to moisture in air 0.24%
5. Partial combustion of C to
CO 0.00%
6. Surface heat losses and blow
down loss 5.00%
7. Loss due to Unburnt in fly
ash and
2.81 %
8. Loss due to Unburnt in
bottom ash
Total Losses = 21.78 %
Boiler efficiency = 100 – (1+2+3+4+5+6+7+8) = 78.2%
RECOMMENDATION:
AREAS OF IMPROVEMENT
Combustion of coal: -
Efficient combustion of fuel requires availability of oxygen at
reactive condition of fuel. Spreader stoker is suitable for 30%
Oversize, 30% Size, 40% undersize.
It is essential that at operating firing rate of around 4 tons per
hour, 1.3 tons per hour should fall on last 30% length, 1.3 tons
per hour in the middle zone and rest in last 30% or in

ISSN NO: 2454-1958 Special Issue Tech-Ed 2016 (International Conference) Page 17
suspension. Such distribution can be verified only in cold
condition.
Effect of the above on Air to fuel ratio: -
Air follows least resistance path. Zone where coal bed height
is less, air tends to flow more in that zone. Therefore unless
height of coal bed is uniform, air flow cannot be adjusted.
At present to maintain the desired unburnt Carbon, air to fuel
ratio is 11.66 kg/kg. Theoretical requirement of air is 5.16
Kg/Kg. Thus, about 126% excess air is being used.
Normally 50% excess air is recommended, provided
distribution of coal is uniform on grate.
Reduction of air can result into savings of
Savings potential:
Increase in efficiency- reduction in heat losses by stack
= (126%- 50%) x 5.16 kg/kg x0.24kcal/kg-oC x (130-
30)oC/4489 kcal/kg
= 2.01%
Fuel savings
= 2.01% x (2.16 x 1000) kg/hr x 24hrs/day x 300 days per year
=313 tonnes of coal
Savings in INR
= 313 tones X INR 3700/ton
= 11.58 lakh per year
Energy Conservation/ Monitoring Parameters for Boilers:
Remove soot deposits when flue gas temperature
raises 40°C above the normal. A coating of 3mm
thick soot on the heat transfer surface can cause an
increase in fuel consumption of as much as 2.5%.
Recover heat from steam condense. For every 6°C
rise in boiler feed water temperature through
condense return, there is 1% saving in fuel.
Improve boiler efficiency. Boilers should be
monitored for flue gas losses, radiation losses,
incomplete combustion, blow down losses, excess air
etc. Proper control can decrease the consumption upto 20%.
Use only treated water in boilers. A scale formation
of 1mm thickness on the waterside would increase
fuel consumption by 5-8%.
Stop steam leakage. Steam leakage from a 3 mm-
diameter hole on a pipeline carrying steam at 7kg/cm2
would waste 32 kl of fuel oil per year.
Maintain steam pipe insulation. It has been estimated
that a bare steam pipe, 150 mm in diameter and 100m
in length, carrying saturated steam at 8kg/cm2 would
waste 25 kl of furnace oil in a year.
CONCLUSION:
The reduction of heat losses due to dry flue gases, moisture
present in fuel and air, incomplete combustion force the major impact on the performance of boiler. In the case study to
improve the efficiency of the boiler the requirements for air
combustion of coal is recommended. Also some energy
conservation methods also discussed.
REFERENCES: International Journal for Scientific Research and Development,
vol. 1, Issue 3, 2013
Power plant engineering by A. K. Raja, Amit P. Srivastava,
Manish Dwivedi, 2006
Energy performance assessment of boiler”, Bureau of Energy
Efficiency, PP 1-22.
Energy Hand Book, Second Edition, Von Norstand Reinhold
Company- Robert L. Loftness
Pawan Kumar, Training manual on energy efficiency for small and
medium enterprises, Asian Productivity Organization, 2010.
Heat Rate Improvement Reference Manual, EPRI Palo Alto, CA:
1998. TR-109546
Mircea, Malvina Baica, Application of the methodology to
estimate the energyecologic efficiency of fluidized bed boilers.
Elsevier Science Ltd 2000.
ISSN NO: 2454-1958 Special Issue Tech-Ed 2016 (International Conference) Page 18
DESIGN OF AN ALTERNATIVE
ARRANGEMENT FOR STACKING OF
BARE WELDING RODS
Prof. Sachin Naik,
1, Asst. Prof., Mechanical Department, Cummins
College of Engineering for women, Nagpur.
Prof. Dr. A.R. Bapat
2, Dean, Mechanical Department, Tulsiramji
Gaikwad- Patil college of Engg,
Pradeep Sargaonkar
3, HOD, Mechanical Department, Cummins College
of Engineering for women, Nagpur.
Abstract: Automation in production is need of
today’s industry. Automation enhances the production,
increases accuracy, improves quality and reduces the
chances of accidents. Keeping this in mind we have
taken problem from ‘Weld Well Industries Pvt. Ltd’,
the manufacturers of welding rods. In industry, the wire
rods are being cut by the cutting machine and are
collected in a pot. Then the cut rods are collected in a
rack manually. The company needs a system which will
enable them to stack the rods directly in the rack
without any human intervention. This paper focuses on
the basic steps involved in the welding rod manufacting and the design of new system for stacking of rods.
Keywords: Stacking of rods, welding electrode process, automation for collection of bare electrodes
1.0 INTRODUCTION
In fabrication of various equipments and
constructions works generally we need welding
electrodes made up of Mild steel & its alloys. M.S.
Welding Electrode is the most widely used core wire.
Welding electrodes consists of steel core
wire and flux Besides mild steel, nickel, Nickel-
copper, Nickel irons are also used in MIG & TIG
welding.
Weldwell Electrodes Pvt. Ltd was
established in the year 1985, the company got
reputation in the field of electrode making from last
30 years, and hence are one of the trustworthy
manufacturers and suppliers of a gigantic compilation
of Welding Electrodes & Mig Wire. Main product of
the company consists of Mild Steel Electrodes, Low
Hydrogen Electrodes and Creep Resistant Electrode
that are manufactured as per the preset IS, AWS,
LRS, DNV, BV, IRS, ABS, BIS and DIN standards.
To improve the product Quality Company
frequently does third party inspection, R & D on the
existing and for new components. Company has
marked its presence in business, and proved
themselves as an example for their peers. In these
years, they have gained immense trust from their
customers and consumers.
3.0 STEPS INVOLVED IN ELECTRODE
MANUFACTURING
3.1 Step I: Wire Drawing

ISSN NO: 2454-1958 Special Issue Tech-Ed 2016 (International Conference) Page 19
A 5 mm diameter wire is drawn through the
rollers by two step reduction process. In Each step
0.5mm dia. is reduced.
Figure 3.1: Wire Drawing Process
Figure 3.2: Dry Drawing Lubricant used by Weld
well company
3.2 Step II: Wire Cutting
The wire drawn from the Step-I is
then cut into the required lengths by cutting machine
as is collected in the container as shown.
Figure 3.3: Cut wire collected in container
3.3 Step III: Flux Coat Preparation
Figure 3.4: Powder formed for flux coat preparation
3.4 Step IV: Flux Coating
When a flux-coated electrode is heated up,
part of the flux burns and forms a gaseous shield
which keeps the oxygen away from the weld. This
prevents the formation of a poor weld which occurs
when iron burns in oxygen. Another part of the flux
melts and mixes with the weld pool, the impurities of
which float and are easily removed when the weld
joint cools down.
Flux coating on the electrodes ensures a
weld with good mechanical properties, chemical
composition and weld metal cleanliness
Figure 3.5: Flux coating by extrusion
3.5 Step V: Flux Drying (De-moisturizing)
Electrodes must be kept dry. Moisture
destroys the desirable characteristics of the coating

ISSN NO: 2454-1958 Special Issue Tech-Ed 2016 (International Conference) Page 20
and may cause excessive spattering and lead to
porosity and cracks in the formation of the welded
area. Electrodes exposed to damp air for more than
two or three hours should be dried by heating in a
suitable oven for two hours at 500°F (260°C).
Figure 3.6: Flux de-moisturizing in oven
3.6 Step VI: Finishing [1]
The flux at end of the welding rod is removed by
brush and other end is chamfered by means of
grinder. It is done so that one end must be properly
gripped to the welding holder and proper arc
formation at other end. Both these process are done at
a time.
Figure 3.7: Finishing of electrodes
3.7 Step VII: Quality Checking & inspection
Weight of electrodes is measured and
checked. Also core wire diameter, length and flux
coating thickness, moisture is inspected. [1]
Figure 3.8: Inspection of electrode
4.0 SPRING DESIGN
Let Dm/d = c (Spring Index)
The spring will be subjected to direct shear
load and a torque T.
The resultant shear stress on the section will be
τmax = T/Zp + F/A…….(1)
For Round Wire
Zp = π/16 x d3
A = π/4 x d2
T = F.Dm/ 2
τmax = 8FDm/πd3 + 4F/πd2
= 8FDm/πd3 [1+ 0.5d/Dm]
= 8FDm/πd3 [1+ 0.5/c]
= K1 8FDm/πd3
The quantity [ 1+ 0.5/c] is called shear stress
multiplication factor and is denoted by K1.
The deflection of the helical spring having n,
effective turns is given by
δ = 8FDm3n/ Gd4
The equation for the spring stiffness (Ks) is given by,
Ks = F/δ
= Gd / 8c3n

ISSN NO: 2454-1958 Special Issue Tech-Ed 2016 (International Conference) Page 21
As per our design consideration, we need the
spring which will get compressed by 5mm under the
action of 50 N Force.
It means the spring should have a stiffness
of Ks= 10N/mm.
i.e Fmax = 50N
Ks = 10N/mm
Free Length =40mm
Material Cr- Vanadium Steel (Cr-V Steel)
From Table VIII-9
Sys = 770MPa,
G = 85 GPa
Di =Dm-d+d(c-1)
=10 (assumed)
d = 10/(c-1)
No. of effective turns,
n = Gd/ 8c3Ks
= 85x 103 x 10
80 c3(c-1)
= 10625/ c3(c-1)
Total no. of turns
n1 = n+1.75
Minimum free length
= n1 X d + δmax
40 = [10625/ c3(c-1) +1.75] 10/(c-1) +
50/10
After solving this equation we get
C = 4.5 (Spring index)
d =2.85mm
= 3mm (Wire Diameter)
Dm = 12.5mm (Mean Diameter)
Ball Bearing of size 6205 (i.e. Dia =25mm bore) is
used for the wheels of the trolley
5.0 ALTERNATIVE ARRANGEMENT FOR
COLLECTION OF BARE RODS
Figure 5.1: Conceptual model of system
Figure 5.2: Electrode exit arrangement
Figure 5.3: Spring stopper having weight sensor

ISSN NO: 2454-1958 Special Issue Tech-Ed 2016 (International Conference) Page 22
Figure 5.4: Drafting of the trolley prepared
6.0 CONCLUSION
After the cutting of wire, the bare rods are
collected in container which is further stacked in a
trolley manually. Two operators were engaged for the
collection and stacking of wire rods in the trolley.
The time needed for collection and stacking
of 100 bare rods was around 4.5 to 5 mins with
existing system.
The proposed system eliminates the one of
the operators. Also the time required for the
collection of 100 bare rods is reduced to around 2.5
to 3 mins. Hence adopted by the company for the
future work.
7.0 REFERENCE
1. Company website for details:
http://www.weldwellelectrodes.com
2. Yrd. Doç. Dr. Oguzhan Yılmaz, “Electrode Materials
and electrode selection”, Department of Mechanical
Engineering, University of Gaziantep, Welding
Technology, pp 1-30.
3. Harald Strolimeier and Gottlieb Pernkopf, Kapfenberg,,
“Apparatus for Stacking and packing cylindrical or rod-
shaped work pieces-patent.” United States Patent
Office, 2012.
4. Bob Romig, “Stacking Lumber for Drying.”, The OHIO
State University US. School Natural Resources, 2021
Coffey Road, Columbus, Ohio 43210.
5. Vincent m. Altamuro, “Materials Handling Systems”,
Columbus McKinnon Corp
6. Nimmo Jr., Philip E. (Wayne, NJ) , Townsend, Richard
A. (Rockaway, NJ), “Ribbon package and process for
production thereof US 3735862 A”, Sun Chemical
Corporation (New York, NY).
7. Haley, “Magnetic material feed control US 2962150
A”, United States Patent Office
8. Hoar, “Counting and packaging apparatus US 2632588
A”, United States Patent Office
9. Roland W. Wagner, William K. Switzer, “Apparatus
for and method of accumulating and thereafter
releasing, en masse, a pre-determined number of
individual, elongated, cylindrical articles”, United
States Patent Office
10. Design Data Book by B.D. Shiwalkar.

ISSN NO: 2454-1958 Special Issue Tech-Ed 2016 (International Conference) Page 23
Experimental Investigation of Solar Air Heater
Prof. Swapnil Thanekar
Department of Mechanical Engineering,
Tulsiramji Gaikwad-Patil College of Engineering and Technology, Nagpur,
India
Email: [email protected]
Mr. Shailendra Ukirde
KSB Pumps, Pune, India
Email: shailendra.ukirde@ksbtech,com
Prof. Vipin Mankar
Department of Mechanical Engineering,
Tulsiramji Gaikwad-Patil College of Engineering and Technology, Nagpur,
India
Email: [email protected]
Abstract: In the current scenario the whole world is
looking for solar energy because of its abundant availability, The
solar energy has found good response in heating applications and
thus air heater is most commonly used solar application. It is
advantageous and its main features are its cost-effectiveness. In
this paper we are focused on how to improve the performance of
glass covered solar air heater with help of experimental
investigation of interrelationship of various parameters to
understand its behavior and further opportunities to optimize
and predict its performance under variable environmental as
well as working conditions. Our main motive is to improve the
Air outlet temperature, which is the function of inlet air, plate
and glass temperature. To optimize productivity we are
segregating the performance efficiency of air heater in 3 factors
as follows, to proper utilize the solar flux and to raise the air
outlet temperature.
The efficiencies are categorized as follows:
1) Efficiency when solar radiations are absorbed by air as well
as oil and there is no fall in oil temperature.
2) Efficiency when heat to the air is supplied by solar radiation
as well as oil.
3) Efficiency when air is being heated only due to the heat
released by oil. This term will not exist because the
calculated efficiency in this case will always come as infinity
since S=0 W/m2.
INTRODUCTION
Burned engine oil is filled in the inner bed as shown in the
figure 1. In this case the incident solar radiations are utilized
for raising the temperature of air as well as the temperature of
oil. Hence the useful heat gain will be the addition of heat
gained by air as well as heat gained by oil. Useful heat gain is
calculated by both the cases, viz. by theoretical and
experimental approach, and on the basis of it their efficiencies
are calculated and compared.
Figure No.1
Ub=ki/δb=0.05/0.075=0.67W/m2K
Us= (L1+L2) L3 ki/L1L2δs=0.163W/m2K
Experimental approach
Velocity measured with Anemometer of air through duct of
diameter 6cm = 6.5m/s
Density of air at average intake air temperature
430C=1.08kg/m3
Mass flow rate m’= ρ A v
= 0.0198 kg/s
Measure mV with the help of pyranometer
Convert it into incident solar flux (W/m2)
S = mV*1000/13.27
Useful heat gain for air quair= mairCpair(Toair-Tiair)
Useful heat gain for oil quoil = moil Cpoil (Tfinal-Tinitial)/3600 Useful heat gain for oil quoil = moil Cpoil (Tfinal-Tinitial)/3600
Net Total useful heat gain qu = quair + quoil
Solar air heater efficiency = qu/S*A
Thus efficiency of solar air heater is calculated for the day and
Graph of solar air heater efficiency vs. time is plotted.
Analysis:

ISSN NO: 2454-1958 Special Issue Tech-Ed 2016 (International Conference) Page 24
S dA = hfp(Tp-Tf)dA + ho(Tp-To)dA + dA(Tp4-Tg
4)
(1/p+1/g-1)
dA(Tp4-Tg
4) = hr(Tp-Tg)dA
(1/p+1/g-1) S dA = hfp(Tp-Tf)dA + ho(Tp-To)dA + hr(Tp-Tg)dA
For Fluid m’CpfdTf = hfp(Tp-Tf)dA + hfg(Tg-Tf)dA
For Glass
hr(Tp-Tg)dA = hw(Tg-Ta)dA + hfg(Tg-Tf)dA
For Oil
ho(Tp-To) A = Cpoovo(dTo/dt) + Ub(To-Ta) A
m’CpfdTf = hfp(Tp-Tf) dA + hfg(Tg-Tf) dA
m’CpfdTf / dA= hfp(Tp-Tf) + hfg(Tg-Tf)
= hfp Tp- hfp Tf + hfg Tg- hfg Tf
m’CpfdTf / dA= hfp Tp + hfg Tg-Tf(hfp + hfg)
put (hfp Tp + hfg Tg) = a (hfp + hfg) = b
m’CpfdTf / dA = a-Tf*b
1 dTf = dA
a-Tf*b m’Cpf
A = - 1 ln 1- (Tfo-Tfi) b
m’Cpf b a-Tfi b
(Tfo-Tfi) = a-Tfib 1 - exp - b A
b m’Cpf
Substituting (hfp Tp + hfg Tg) = a
(hfp + hfg) = b for simplicity let us assume hfp = hfg
now a=hfp(Tp+Tg)
and b=2 hfp
Tfo-Tfi = (Tg+Tp-2Tfi)/2 * (1-exp{-2hfpA /m’Cpf})
Tfo = Tfi + ((Tg+Tp-2Tfi)/2 * (1-exp{-2hfpA /m’Cpf})) -----------
----------------------------(a)
If Tfi , Tg , Tp are known at any instant then Tfo can be
calculated for that particular instant.
Sample calculation
Time: 9 a .m.
Plate temperature Tp = 80oC
Glass Temperature Tg = 76oC
Air inlet temperatureTfi = 49oC
Air outlet temperature Tfo = 58oC
Mean film temperature = (Tp+Tg)/2 = 351 K
Properties at 351 K
ρ = 0.995 Kg/m3 , Cp = 1010J/KgK , = 20.80 *10-6 Ns/m2 , k = 0.03 W/mK
Equivalent diameter = 4*0.9*0.08/2(0.9+0.08) =0.1469m
Average velocity = 0.0198/(0.995*0.9*0.08) =0.2763 m/s
Re = 0.995 *0.2763* 0.1469/(20.80*10-6)
Re = 1941.61
Nu = 0.0158 * ( 1941.61 )0.8
Nu = 6.74
hfp = 6.74 * 0.03/0.1469 =1.378W/m2K
substituting this value in equation(a)
we get Tfo = 54.00C
% error =(58-54)/58 =0.0689 =6.89%
Inlet air
temperat
ure(oC) Tfi
Plate
Temperat
ure (oC) Tp
Glass
Tempera
tu-re (oC)Tg
Measure
d Outlet
Air Tempera
tu-
re(oC)
Outlet Air
Temperature By
Tfo = Tfi + ((Tg+Tp-2Tfi)/2 *
(1-exp{-2hfpA
/m’Cpf}))
% Error
49 80.0 65.0 58.0 54.0 7%
51 100.0 85.0 63.8 59.8 6%
50 105.0 88.0 63.8 59.8 6%
52 95.0 78.0 63.3 59.3 6%
52 104.0 87.0 65.2 61.2 6%
53 103.0 86.0 65.8 61.8 6%
52 94.0 77.0 63.1 59.1 6%
54 90.0 73.0 63.8 59.8 6%
52 72.0 55.0 58.4 54.4 7%
45 54.0 37.0 49.1 45.1 8%
45 49.0 32.0 48.0 44.0 8%
44 46.0 29.0 46.6 42.6 9%
TABLE NO. 1
This table shows that the outlet air temperatures obtained by
the derived formula are nearly equal to the measured outlet air
temperatures.
Conclusion:
ZONE I ZONE
II

ISSN NO: 2454-1958 Special Issue Tech-Ed 2016 (International Conference) Page 25
Graph No.1 Solar Flux Vs Time
Let us divide the performance efficiency of this air heater in
following 3 zones
efficiency when solar radiation are absorbed by air as well as
oil and there is no fall in oil temperature.
efficiency when heat to the air is supplied by solar radiation as well as oil.
Efficiency when air is being heated only due to the heat
released by oil. This term will not exist because the calculated
efficiency in this case will always come as infinity since S=0
W/m2
Graph No.2 % Efficiency Vs Time
Mathematical Modeling for glass covered oil based flow
over absorber plate solar air heater
1) Incident Solar Flux Vs Plate Temperature
GRAPH NO. 3 INCIDENT SOLAR FLUX VS OIL TEMPERATURE
Solar
Flux
(w/m2)
Plate
Temperatur
e oC
Plate temperature measured
by y = -3E-06x2 + 0.0792x
+ 47.01 8 R2 = 0.9998
%
Error
666.9 98.08 99.84 -2%
896.8 115.18 118.04 -2%
957.0 119.67 122.82 -3%
859.1 112.38 115.06 -2%
979.7 121.35 124.61 -3%
911.8 116.30 119.24 -3%
663.1 97.80 99.54 -2%
557.6 89.95 91.18 -1%
346.6 74.25 74.47 0%
52.8 52.39 51.20 2%
Table No. 2
The governing equation for the relation between incident solar
flux and plate temperature for oil based glass covered solar air
heater is found out to be exponential. The relation is y = -3E-
06x2 + 0.0792x + 47.018 with regression value R2 =0.9998.
Here in this equation y= Plate temperature in oC and x= Incident Solar flux in W/m2. This equation is quite
satisfactory over a large span of incident solar flux ,because
the maximum % error in the plate temperature found by using
this equation could be not more than 3% and It is obtained
only in single case.
2) Incident Solar Flux Vs Oil Temperature
GRAPH NO. 4 SOLAR FLUX VS. OIL TEMPRATURE
Incident
Solar
Flux(W/m2)
Oil
temperature
(oC)
oil temperature (oC)
y = 60.073e0.0003x
R2 = 0.9047
%Error
666.9 70 73.38 -5%
896.8 73 78.62 -8%
957.0 75 80.05 -7%
859.1 76 77.73 -2%
979.7 79 80.60 -2%
911.8 79 78.97 0%
663.1 74 73.30 1%
557.6 70 71.01 -1%
346.6 65 66.66 -3%
52.8 61 61.03 0%
TABLE NO. 3
The governing equation for the relation between incident
solar flux and oil temperature for oil based glass covered
solar air heater is found out to be exponential. The
relation is y = 60.073e0.0003x with regression value R2 =0.9047. Here in this equation y= oil temperature in oC and x= Incident Solar flux in W/m2. This equation is
quite satisfactory over a large span of incident solar flux
,because the maximum % error in the plate temperature
found by using this equation could be not more than 8%
and It is obtained only in single case.
Solar Flux Vs air outlet Temperature
Zone II

ISSN NO: 2454-1958 Special Issue Tech-Ed 2016 (International Conference) Page 26
Graph No. 4 Solar Flux Vs Air Outlet Temperature
Solar
Flux
(W/m2)
Measured Air
Outlet
Temperature(oC)
Air Outlet Temperature
by y =
32.586x0.0985
R2 = 0.9032
% Error
666.9 58.0 61.830 -7%
896.8 65.3 63.660 2%
957.0 62.8 64.070 -2%
859.1 63.3 63.392 0%
979.7 64.1 64.217 0%
911.8 64.5 63.765 1%
663.1 63.3 61.796 2%
557.6 63.0 60.750 4%
346.6 57.2 57.971 -1%
52.8 48.3 48.158 0%
Table No. 4
The governing equation for the relation between incident solar flux and air outlet temperature for oil based glass covered
solar air heater is found out to be power. The relation is y =
32.586x0.0985 with regression value R2 =0.9032. Here in this
equation y= air outlet temperature in oC and x= Incident Solar
flux in W/m2. This equation is quite satisfactory over a large
span of incident solar flux, because the maximum % error in
the plate temperature found by using this equation could be
not more than 7% and It is obtained only in single case.
Glass Covered Solar Air Heater with Flow over Absorber
Plate
(Without Oil Bed)
Equation (a) for finding out air outlet temperatures which is the function of inlet air, plate and glass temperature can be
used for finding out outlet air temperature for the same solar ir
heater. Here we will use the relation derived in chapter 7for
finding out plate temperature and glass temperature.
Time Solar
Flux
(W/m2)
Inlet
air
temper
ature(o
C)
Plate
Temperatu
re(oC) by
y=48.738
e0.001x
Glass
Tempe
rature
(oC)
Outlet air
temperature
by Tfo = Tfi
+ ((Tg+Tp-
2Tfi)/2 * (1-
exp{-2hfpA
/m’Cpf}))
Useful Heat
Gain (W)
%
Efficie
-ncy
9 715.9 49 99.719 82.7 57.9 178.2121 14.6%
10 896.8 50 119.488 102.5 63.7 273.1654 17.8%
11 957.0 50 126.913 109.9 64.5 288.78 17.6%
12 859.1 52 115.070 98.1 63.5 230.3451 15.7%
1 979.7 52 129.815 112.8 66.7 292.5868 17.5%
2 911.8 53 121.303 104.3 65.7 252.4339 16.2%
3 663.1 52 94.595 77.6 59.2 143.9202 12.7%
4 557.6 54 85.124 68.1 58.8 95.4978 10.0%
5 346.6 52 68.931 51.9 53.8 35.58799 6.0%
6 52.8 44 51.378 34.4 44.6 10.99121 12.2%
Table No. 5
Graph No.5 Comparison of Efficiencies for Solar Air
Heater With And Without Inclusion Of Oil.
CONCLUSION
Solar air heaters are significantly saves the household
emission; reducing the amount of air pollution and greenhouse
gases that created from the use of fossil fuels. The cost of
installing a solar air heater can be rather expensive, however
there are many local utility companies or state agencies
offering rebates for solar systems. To make the solar air heaters more effective we enhance the efficiency of the solar
air heater by dividing ino the following ways.
1 Efficiency when solar radiation are absorbed by air as
well as oil and there is no fall in oil temperature.
2 Efficiency when heat to the air is supplied by solar
radiation as well as oil.
3 Efficiency when air is being heated only due to the
heat released by oil. This term will not exist because
the calculated efficiency in this case will always
come as infinity since S=0 W/m2
REFRENCES:
Bhushan B, Singh, A review on methodology of artificial
roughness used in duct of solar air heaters. Energy 2010;35:202–1
Yeh HM, Ho CD. Solar air heaters with external recycle. Applied
Thermal
Engineering 2009;29:1694–701.
Singh D, Bansal NK. Analysis of a glass solar air heater. Energy
Conversion
And Management 1983;23(4):231–6
Hasan A. Phase change material energy storage system employing
palmitic acid. Solar Energy 1994;52:143–54.
Mohamad AA. High efficiency solar air heater. Solar Energy
1997;60(2):71–6.
Naphon P, Kongtragool B. Theoretical study on heat transfer
characteristics and performance of the flat-plate solar air heaters.
International Communication of Heat Mass Transfer
2003;30:1125–36
Naphon P. On the performance and entropy generation of the
double-pass solar air heater with longitudinal fins. Renewable
Energy 2005;30:1345–57.
Zone II
ISSN NO: 2454-1958 Special Issue Tech-Ed 2016 (International Conference) Page 27
Parametric Optimization of GMAW Welding
Process
Swapnil A.Mahajan
Department of Mechanical Engineering Bhonsla College of Engineering and Research
Akola, India
Abstract— The study aimed at the investigation of the effect of preheating, shielding gas flow rate and heat input on the hardness of weldment. In this study, 304 stainless steel was bonded by MIG welding with Argon as a shielding gas and hardness properties of the welded samples at different points from the weld center line was investigated. For that purpose welding was done with different level of preheat, shielding gas flow rate and heat input. Welding samples were characterized by means of hardness test on optical Brinell hardness tester. Hardness test revealed that for all welding parameters hardness in HAZ and weld metal was higher than parent metal.
With application of design of experiment (DOE) mathematical relationship between the welding process input parameters and output variable like hardness of welded joint in order to determine the welding input parameters that lead to desired weld hardness. Preheat, shielding gas flow rate, and heat input are selected as input parameter and hardness as output parameter. By application of response surface methodology and Tanguchi method of DOE, relationship between these parameters and Hardness was developed.
The experiment result show that the heat input has greatest effect. Gas flow rate has second largest effect on hardness and preheat has very little effect on hardness of weldment.
Keywords— MIG, SS 304, Preheat Gas flow rate, Heat input;
Hardness.
I. Introduction
The GMAW welding process is easily found in any
industry whose products require metal joining in a large scale. It establishes an electric arc between a continuous filler metal
electrode and the weld pool, with shielding from an externally
supplied gas, which may be an inert gas, an active gas or a
mixture. The heat of the arc melts the surface of the base metal
and the end of the electrode. The electrode molten metal is
transferred through the arc to the work where it becomes the
deposited weld metal (weld bead).
The quality of the welded material can be evaluated by many characteristics, such as bead geometric parameters (penetration, width and height), hardness, residual stresses and deposition efficiency (ratio of weight of metal deposited to the weight of electrode consumed). These characteristics are controlled by a number of welding parameters, and, therefore, to attain good quality, is important to set up the proper welding process parameters. Out of these properties hardness is important property because hardness determines the impact strength, toughness and crack susceptibility of welded joint.
Unfortunately, an underlying mechanism connecting welding parameters and quality characteristics is usually not known. Traditionally, it has been necessary to determine the weld input parameters for every new welded product to obtain a welded joint with the required specifications. To do so, requires a time-consuming trial and error development effort, with weld input parameters chosen by the skill of the engineer or machine operator. Then welds are examined to determine whether they meet the specification or not. Finally the weld parameters can be chosen to produce a welded joint that closely meets the joint requirements. Also, what is not achieved or often considered is an optimized welding parameters combination, since welds can often be produced with very different parameters. In other words, there is often a more ideal welding parameters combination, which can be used if it can only determined.
In order to overcome this problem, various optimization methods can be applied to define the desired output variables through developing mathematical models to specify the relationship between the input parameters and output variables. In the last two decades, design of experiment (DoE) techniques has been used to carry out such optimization.
The Taguchi method is a systematic application of design and analysis of experiments for the purpose of designing and improving product quality. In recent years, the Taguchi method has become a powerful tool for improving productivity during research and development so that high quality products can be produced quickly and at low cost.
One of the most widely used methods to solve this
problem is the response surface methodology (RSM), in which
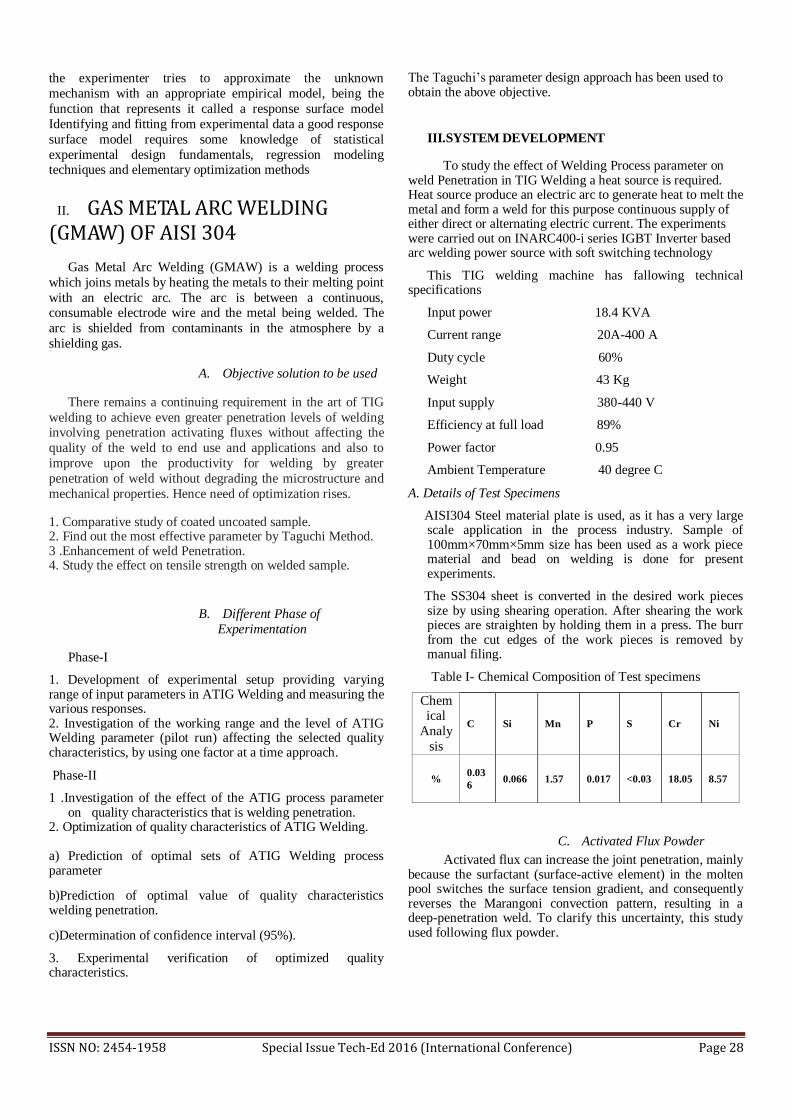
ISSN NO: 2454-1958 Special Issue Tech-Ed 2016 (International Conference) Page 28
the experimenter tries to approximate the unknown
mechanism with an appropriate empirical model, being the
function that represents it called a response surface model
Identifying and fitting from experimental data a good response
surface model requires some knowledge of statistical
experimental design fundamentals, regression modeling techniques and elementary optimization methods
II. GAS METAL ARC WELDING (GMAW) OF AISI 304
Gas Metal Arc Welding (GMAW) is a welding process
which joins metals by heating the metals to their melting point
with an electric arc. The arc is between a continuous, consumable electrode wire and the metal being welded. The
arc is shielded from contaminants in the atmosphere by a
shielding gas.
A. Objective solution to be used
There remains a continuing requirement in the art of TIG
welding to achieve even greater penetration levels of welding involving penetration activating fluxes without affecting the
quality of the weld to end use and applications and also to
improve upon the productivity for welding by greater
penetration of weld without degrading the microstructure and
mechanical properties. Hence need of optimization rises.
1. Comparative study of coated uncoated sample. 2. Find out the most effective parameter by Taguchi Method. 3 .Enhancement of weld Penetration. 4. Study the effect on tensile strength on welded sample.
B. Different Phase of
Experimentation
Phase-I
1. Development of experimental setup providing varying range of input parameters in ATIG Welding and measuring the various responses. 2. Investigation of the working range and the level of ATIG Welding parameter (pilot run) affecting the selected quality characteristics, by using one factor at a time approach.
Phase-II
1 .Investigation of the effect of the ATIG process parameter on quality characteristics that is welding penetration.
2. Optimization of quality characteristics of ATIG Welding. a) Prediction of optimal sets of ATIG Welding process parameter
b)Prediction of optimal value of quality characteristics welding penetration.
c)Determination of confidence interval (95%).
3. Experimental verification of optimized quality characteristics.
The Taguchi‟s parameter design approach has been used to obtain the above objective.
III.SYSTEM DEVELOPMENT
To study the effect of Welding Process parameter on weld Penetration in TIG Welding a heat source is required. Heat source produce an electric arc to generate heat to melt the metal and form a weld for this purpose continuous supply of either direct or alternating electric current. The experiments were carried out on INARC400-i series IGBT Inverter based arc welding power source with soft switching technology
This TIG welding machine has fallowing technical specifications
Input power 18.4 KVA
Current range 20A-400 A
Duty cycle 60%
Weight 43 Kg
Input supply 380-440 V
Efficiency at full load 89%
Power factor 0.95
Ambient Temperature 40 degree C
A. Details of Test Specimens
AISI304 Steel material plate is used, as it has a very large scale application in the process industry. Sample of 100mm×70mm×5mm size has been used as a work piece material and bead on welding is done for present experiments.
The SS304 sheet is converted in the desired work pieces size by using shearing operation. After shearing the work pieces are straighten by holding them in a press. The burr from the cut edges of the work pieces is removed by manual filing.
Table I- Chemical Composition of Test specimens
Chemical
Analy
sis
C Si Mn P S Cr Ni
% 0.03
6 0.066 1.57 0.017 <0.03 18.05 8.57
C. Activated Flux Powder
Activated flux can increase the joint penetration, mainly because the surfactant (surface-active element) in the molten pool switches the surface tension gradient, and consequently reverses the Marangoni convection pattern, resulting in a deep-penetration weld. To clarify this uncertainty, this study used following flux powder.

ISSN NO: 2454-1958 Special Issue Tech-Ed 2016 (International Conference) Page 29
Table II- Activated Flux Powder Used
Sr. No 1 2 3
4
5
Activated
Flux
Powder
Cr2o
3
Tio2
Al2o3
Cao
Sio2
c. Preparation of Specimens
The SS304 sheet is converted in to the desired
100mm×70mm×5mm size by using shearing operation. After
shearing the work pieces are straighten by holding them in a
press. The burr from the cut edges of the work pieces is
removed by manual filing the plate surface was ground using
400 grit (silicon carbide) flexible abrasive paper to remove
impurities, and then cleaned with acetone .The Thirty number
of SS304 plate of are prepared. The various flux powders were
mixed with acetone to make a paint-like consistency. A brush
was used to apply the mixture on the joint surface to be welded. The mean coating density of flux powder was 4.3
mg/cm2.The four set of plates are made from thirty plates.
Table III- Chemical Composition of Test specimens
Sr.No
1 2 3 4 5 6
Sample TiO2
Coated
Cr2O3
Coated
Al2O3
Coated
Uncoated
CaO
Coated
SiO2
Coated
D. Effect of current on weld
penetration
Welding current is the most influential parameter because it affects bead shape, controls the rate at which electrode is melted and therefore also controls the deposition rate, heat affected zone, the depth of penetration, and the amount of base metal melted. For studying the effect of current on weld penetration with following parameter constant.
Gas flow rate 10 LPM, Welding speed 1.6 mm/s and torch angle 60 degree. Following result are observed for various current.
Table IV: Effect of Welding Current on Weld Penetration
Sr.N
o Welding current A
Weld penetration
in mm
1 150 2.5
2 200 3.1
3 250 4.1
4 300 5.0
FIG-I Graph Effect of Welding Current on Weld Penetration
E. Effect of gas flow rate on
weld penetration
In the second case Shielding gases are used in GTAW in order to prevent atmospheric contamination of the weld metal. This contamination can produce porosity, weld cracking, scaling and even change in the chemical composition of melted material. Besides shielding
Gas also has a large influence on the stability of the electric arc. Gases with low ionization potential facilitate the ignition of the electric arc and those with low thermal conductivity tend to increase the arc stability. Argon is the most used GTAW shielding gas. It has low ionization potential and is heavier than air, providing an excellent shielding of the molten weld pool.
To study the effect of gas flow rate on weld penetration with following parameter constant Current 200 A, Welding speed 1.6 mm/s and torch angle 60 degree. Following result are observed for various Gas flow rate.
Table V: Effect of Welding Current on Weld Penetration
Sr.N
o
Gas flow
rate(LPM)
Weld penetration
in mm
1 5 3
2 10 3.5
3 15 5.0
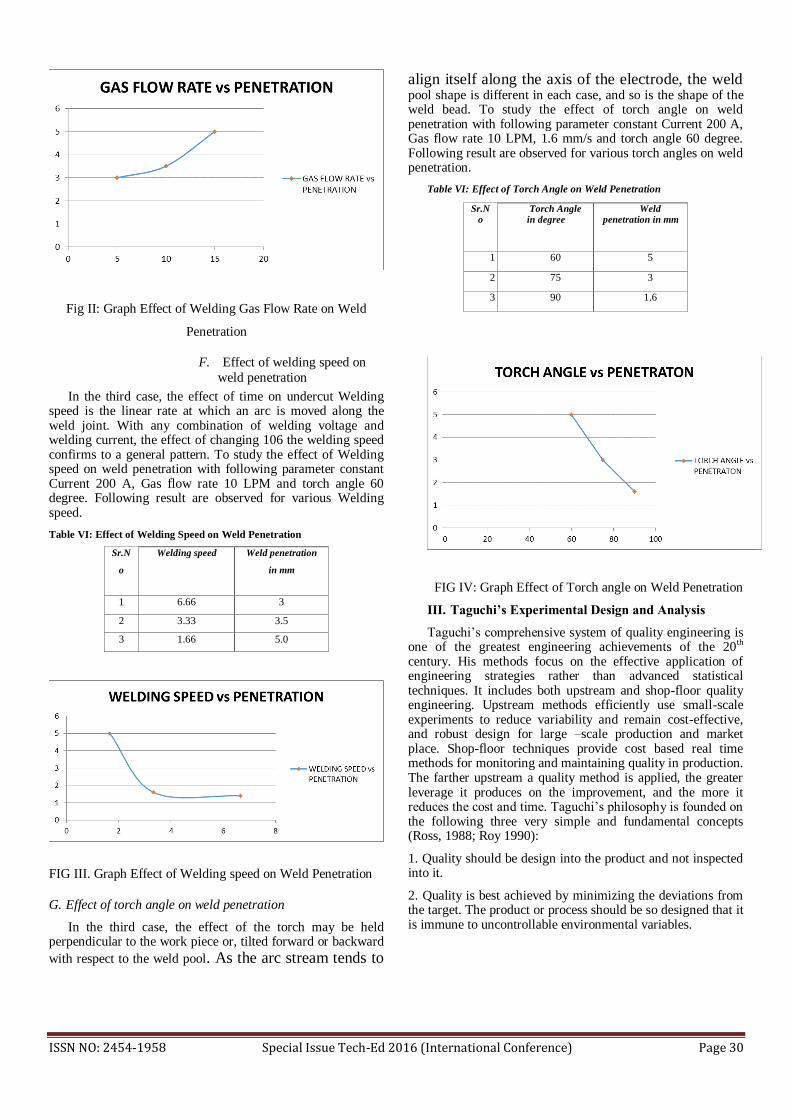
ISSN NO: 2454-1958 Special Issue Tech-Ed 2016 (International Conference) Page 30
Fig II: Graph Effect of Welding Gas Flow Rate on Weld
Penetration
F. Effect of welding speed on
weld penetration
In the third case, the effect of time on undercut Welding speed is the linear rate at which an arc is moved along the weld joint. With any combination of welding voltage and welding current, the effect of changing 106 the welding speed confirms to a general pattern. To study the effect of Welding speed on weld penetration with following parameter constant Current 200 A, Gas flow rate 10 LPM and torch angle 60 degree. Following result are observed for various Welding speed.
Table VI: Effect of Welding Speed on Weld Penetration
Sr.N
o
Welding speed Weld penetration
in mm
1 6.66 3
2 3.33 3.5
3 1.66 5.0
FIG III. Graph Effect of Welding speed on Weld Penetration
G. Effect of torch angle on weld penetration
In the third case, the effect of the torch may be held perpendicular to the work piece or, tilted forward or backward
with respect to the weld pool. As the arc stream tends to
align itself along the axis of the electrode, the weld pool shape is different in each case, and so is the shape of the weld bead. To study the effect of torch angle on weld penetration with following parameter constant Current 200 A, Gas flow rate 10 LPM, 1.6 mm/s and torch angle 60 degree. Following result are observed for various torch angles on weld penetration.
Table VI: Effect of Torch Angle on Weld Penetration
Sr.No
Torch Angle in degree
Weld penetration in mm
1 60 5
2 75 3
3 90 1.6
FIG IV: Graph Effect of Torch angle on Weld Penetration
III. Taguchi’s Experimental Design and Analysis
Taguchi‟s comprehensive system of quality engineering is one of the greatest engineering achievements of the 20th century. His methods focus on the effective application of engineering strategies rather than advanced statistical techniques. It includes both upstream and shop-floor quality engineering. Upstream methods efficiently use small-scale experiments to reduce variability and remain cost-effective, and robust design for large –scale production and market place. Shop-floor techniques provide cost based real time methods for monitoring and maintaining quality in production. The farther upstream a quality method is applied, the greater leverage it produces on the improvement, and the more it reduces the cost and time. Taguchi‟s philosophy is founded on the following three very simple and fundamental concepts (Ross, 1988; Roy 1990):
1. Quality should be design into the product and not inspected into it.
2. Quality is best achieved by minimizing the deviations from the target. The product or process should be so designed that it is immune to uncontrollable environmental variables.

ISSN NO: 2454-1958 Special Issue Tech-Ed 2016 (International Conference) Page 31
3. The cost of quality should be measured as a function of deviation from the standard and the losses should be measured system-wide.
Taguchi proposes an “off-line” strategy for quality improvement as an alternative to an attempt to inspect quality into a product on the production line. He observed that poor quality cannot be improved by the process of inspection, screening and salvaging. No amount of inspection can put quality back into the product. Taguchi‟s recommends a three stage process: system design, parameter design and tolerance design. In the present work Taguchi‟s parameter design approach is used to study the effect of process parameters on the depth of penetration of the Metal Inert Gas Welding process.
A. Loss function
The Taguchi loss function recognizes the customer‟s desire to have products that are more consistent, part to part, and a producer‟s desire to make a low-cost product. The loss to society is composed of the costs incurred in the production process as well as the costs encountered during use by the customer (repair, lost business, etc.). To minimize the loss to society is the strategy that will encourage uniform products and reduce cost at the point of production and at the point of consumption.
The heart of Taguchi method is his definition of the nebulous and elusive term „quality‟ as the characteristic that avoid loss to the society from the time the product is shipped (Braker, 1986). Loss is measured in terms of monetary units and is related to quantifiable product characteristic.
Taguchi defines quality loss via his „loss function‟. He unites the financial loss with the function specification through a quadratic relationship that comes from a Taylor series expansion. The quadratic function takes the form of a parabola. Taguchi defines the loss function as a quality proportional to the deviation from the nominal quality characteristic (Roy, 1990). He has found the following quadratic form to a useful workable function (Roy, 1990):
L(y) = k(y-m) ² (1)
Where,
L = Loss in monetary units
M = value at which the characteristics should be set
Y = actual value of the characteristic
K =constant depending on the magnitude of the characteristics and the monitory unit involved
The characteristics of loss function represented as below:
1. The farther the product‟s characteristic varies from the target value, the greater is the loss. The loss must be zero when the quality characteristic of a product meets its target value.
2. The loss is a continuous function and not a sudden step as in the case of traditional (goal post) approach. This consequence of the continuous loss function illustrates the point that merely makes a product within the specification limits does not necessary mean that product is of good quality.
A. Average loss-function for product population
In a mass production process, the average loss per unit is expressed as (Roy, 1990):
L(y) = (1/n)*{k (y1-m) ² +k (y2-m) ² +……+k (yn-m) ²} (2)
Where,
y1, y2, yn = Actual value of the characteristic for unit 1, 2, 3…….n respectively.
n = Number of units in a given sample
k = Constant depending on the magnitude of the characteristic and the monetary units involved.
m = Target value at which the characteristic should be set.
The eq n can be simplified as,
L(y) =k (MSDNB) (3)
Where,
MSDNB =Mean squared deviation or the average of squares of all deviation from the target or nominal value
NB = “Nominal is Best”
B. Signal to noise ratio
The loss function discussed above is an effective figure of merit for making engineering design decision. However, to establish an appropriate loss-function with its k value to use as a figure of merit is not always cost-effective and easy. Recognizing the dilemma, Taguchi created a transform function for the loss-function which is named as signal-to-noise ratio(S/N ratio) (Barker, 1990).
The S/N ratio, as stated earlier, is a concurrent statistic. A concurrent statistics is able to look at two characteristics of a distribution and roll these characteristics into a single number or figure of merits. The S/N ratio combines both the parameters (the mean level of the quality characteristics and variance around this mean) into a single metric (Barker, 1990).
The S/N ratio consolidate several repetition (at least two data point are required) into one value. The equation for calculating S/N ratios for „smaller is better‟ (LB), „large is better‟ (HB) and „nominal is best‟ (NB) type of characteristics are as follows (Ross, 1998):
1) Larger the Better: (S/N) HB = -10 log (MSDHB) (4)
Where, MSDHB = (1/R) Σ (1/y²j)
2) Smaller the Better: (S/N) LB = -10 log (MSDLB) (5)
Where, MSDLB = (1/R) Σ (y²j)
3) Nominal the Best: (S/N) NB = -10 log (MSDNB) (6)
Where, MSDNB = (1/R) Σ (yj-y0)²
R= Number of repetitions. The mean square deviation (MSD) is a statistical quality that reflects the deviation from the target value. The expressions for MSD are different for different quality characteristics. For the „nominal is best‟ characteristics, the standard definition of MSD is used. For the other two characteristics the definition is slightly modified. For „smaller is better‟, the unstated target value is zero. For

ISSN NO: 2454-1958 Special Issue Tech-Ed 2016 (International Conference) Page 32
„larger is better‟ the inverse of each large value becomes a small value and again, the unstated target value is zero. Thus for all three expression, the smallest magnitude of MSD is being sought.
C. Steps in experimental design and analysis
I) Selection of orthogonal array (OA)
In the selecting an appropriate OA, the pre-requisites are (Roy1990, Ross, 1988):
a) Selection of process parameters and/or interactions to be evaluated
B)Selection of number of levels for the selected parameters
The determination of which parameter to investigate is depend upon the product or process performance characteristics or response of interest (Ross, 1988). Several methods are suggested by Taguchi for determining which parameters to include in an experiment. These are (Ross, 1988):
1. Brainstorming
2. Flow charting
3. Cause effect diagrams
The total Degree of Freedom (DOF) of an experiment is a direct function of total number of trial. If the number of levels of a parameter increases, the DOF of the parameter also increases because the DOF of a parameter is the number of level minus one. Thus, increase the number of levels for a parameter increases the total degree of freedom in the experiment which in turn increases the total number of trials. Thus, two levels for each parameter are recommended to minimize the size of the experiment (Ross, 1988). If curved or higher order polynomial relationship between the parameter under study and the response is expected, at least three level of each parameter should be considered (Barker, 1990).
The standard two levels and three level arrays (Taguchi and Wu, 1979) are:
1. Two level array: L4, L8, L12, L16, and L32.
2. Three level array: L9, L18, and L27.
The number as subscript in the array designation indicates the number of trial in that array. The total degrees of freedom (DOF) available in an OA are equal to the number of trial minus one (Ross, 1988):
fLN = N-1 (7)
Where,
fLN = Total degree of freedom of an OA
LN = OA designation
N = Number of trial
When a particular OA is selected for an experiment, the following inequality must be satisfied (Ross, 1988):
fLN ≥Total degree of freedom required for parameters and interaction
Depending on the number of level of the parameters and total DOF required for the experiment, a suitable OA is selected.
D) Assignment of Parameters and interaction to the OA
The OA‟s have several columns available for assignment of parameters and some columns subsequently can estimate the effect of interaction of these parameters.
Taguchi has provided two tools to aid in the assignment of parameters and interactions to arrays (Ross, 1988; Roy, 1990):
1. Linear graphs
2. Triangular tables
Each OA has a particular set of linear graphs and a triangular table associated with it. The linear graph indicates various columns to which parameters may be assigned and the columns subsequently evaluate the interaction of these parameters. The triangular table contains all the possible interaction between parameters (columns). Using the linear graphs and or the triangular table of the selected OA, the parameters and interactions are assigned to the columns of the OA. The linear graph of L09 OA is given in Table.
E. Selection of outer array
Taguchi separates factors (parameters) into two main group: controllable factors and uncontrollable factor (noise factors). Controllable factors are factors that can easily be controlled. Noise factors, on the other hand, are nuisance variable that are difficult, impossible, or expensive to control (Byrne and Taguchi, 1987). The noise factors are responsible for the performance variation of a process. Taguchi recommends the use of outer array for the noise factor and inner array for controllable factors. If an outer array is used, the noise variation is forced into the experiment. However, experiments against the trial condition of the inner array (The OA used for the controllable factors) may be repeated and in this case the noise variation is unforced into the experiment (Byrne and Taguchi, 1987). The outer array, if used, will have same assignment considerations. However, the outer array should not be complex as the inner array because the outer array is noise only which is controlled only in the experiment (Ross, 1988).
E.Selection of orthogonal array
Taguchi orthogonal design uses a special set of predefined arrays called orthogonal arrays (OAs) to design the plan of experiment. These standard arrays stipulate the way of full information of all the factors that affects the process performance. The corresponding OA is selected from the set of predefined OAs according to the number of factors and their levels that will be used in the experiment. For the present experimental work, three factors with their three levels are used for which the corresponding orthogonal array is L9 which is shown in Table.

ISSN NO: 2454-1958 Special Issue Tech-Ed 2016 (International Conference) Page 33
Table 4.2: L-9 Orthogonal Array
Exp No
Process Parameter
Welding Current
Gas flow rate
Welding Speed
1 1 1 1
2 1 2 2
3 1 3 3
4 2 1 2
5 2 2 3
6 2 3 1
7 3 1 3
8 3 2 1
9 3 3 2
F.. Conduction of experiments
By putting the values of three levels of three parameters in L9 Orthogonal array , the nine set of experiments with different values of parameters are obtained as fallows
Experiment No.1 Current=150Amp.
Gas flow rate=10.0 LPM. Welding speed = 6.66 mm/s.
Experiment No.2 Current=150Amp.
Gas flow rate =12.5 LPM. Welding speed = 3.33 mm/s.
Experiment No.3 Current=150Amp.
Gas flow rate =15.0 LPM. Welding speed = 1.66 mm/s.
Experiment No.4 Current=175Amp.
Gas flow rate=10.0 LPM. Welding speed = 3.33 mm/s.
Experiment No.5 Current=175Amp.
Gas flow rate =12.5 LPM. Welding speed = 1.66 mm/s.
Experiment No.6 Current=175Amp.
Gas flow rate =15.0 LPM. Welding speed = 6.66 mm/s.
Experiment No.7 Current=200Amp.
Gas flow rate=10.0 LPM. Welding speed = 1.66 mm/s.
Experiment No.8 Current=200Amp.
Gas flow rate =12.5 LPM. Welding speed = 6.66 mm/s.
Experiment No.9 Current=200Amp.
Gas flow rate =15.0 LPM. Welding speed = 3.33 mm/s.
Table 4.3: Experimental Results
Sr No
Welding Current(Amp)
Gasflow rate(LPM)
Welding speed(mm/s)
Weld Penetration(mm)
1 150 10 6.66 1.6
2 150 12.5 3.33 2.5
3 150 15 1.66 2.7
4 175 10 3.33 3.0
5 175 12.5 1.66 5.0
6 175 15 6.66 3.0
7 200 10 1.66 2.5
8 200 12.5 6.66 2.5
9 200 15 3.33 2.0
G. Analysis of S/N ratio
In the Taguchi Method the term Signal represents the desirable value (mean) for the output characteristic and the term Noise represents the undesirable value (standard deviation) for the output characteristic. Therefore, the S/N ratio to the mean to S.D.S/N ratio used to measure the quality characteristic deviating from the desired value.
The S/N ratio is defined as n=10log (M.S.D.) Where, M.S.D is the mean square deviation for the output characteristic. To obtain optimal welding performance, higher the better quality characteristic can be taken and S/N ratio is calculated for each experiment.
Table 4.4: Analysis of S/N Ratio
Sr No Welding
Current(A
mp)
Gas flow
rate(LPM
)
Welding
speed{mm/s
)
Weld
Penetration(mm
)
S/N
Ratio
1 150 10.0 6.66 1.6 4.08
2 150 12.5 3.33 2.5 7.95
3 150 15.0 1.66 2.7 8.62
4 175 10.0 3.33 3.0 9.54
5 175 12.5 1.66 5.0 13.97
6 175 15.0 6.66 3.0 9.54
7 200 10.0 1.66 2.5 7.95
8 200 12.5 6.66 2.5 7.95
9 200 15.0 3.33 2.0 6.02
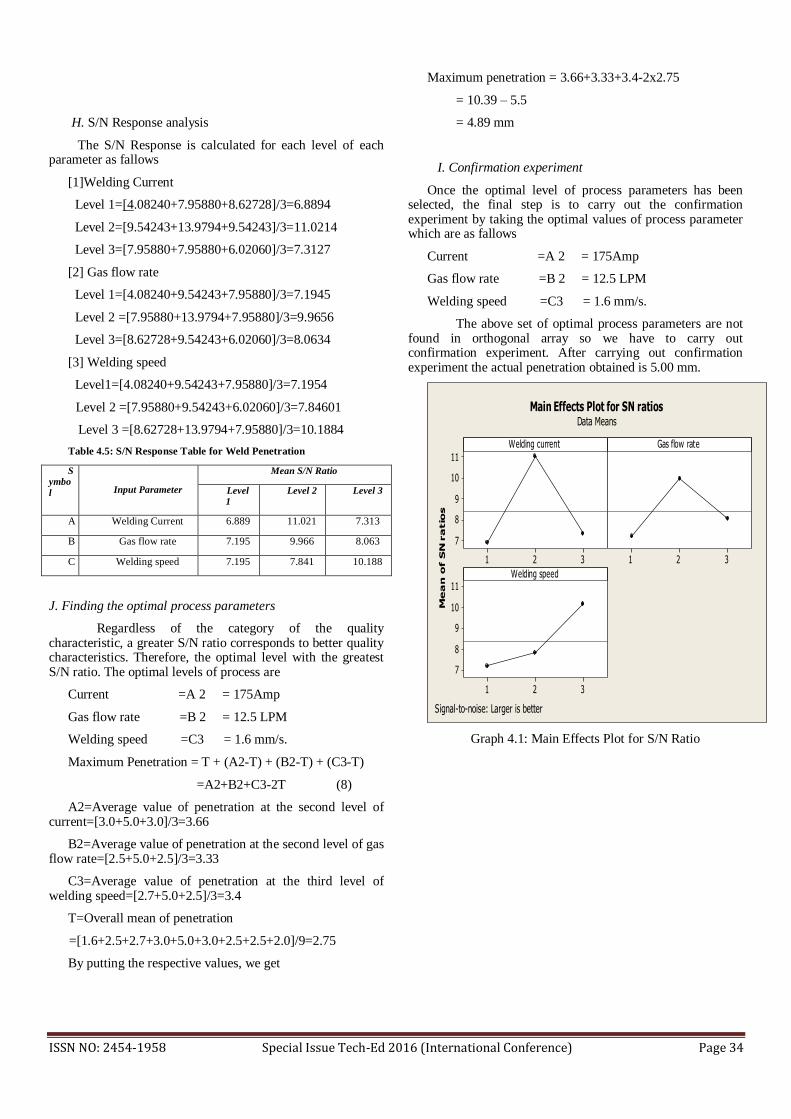
ISSN NO: 2454-1958 Special Issue Tech-Ed 2016 (International Conference) Page 34
H. S/N Response analysis
The S/N Response is calculated for each level of each parameter as fallows
[1]Welding Current
Level 1=[4.08240+7.95880+8.62728]/3=6.8894
Level 2=[9.54243+13.9794+9.54243]/3=11.0214
Level 3=[7.95880+7.95880+6.02060]/3=7.3127
[2] Gas flow rate
Level 1=[4.08240+9.54243+7.95880]/3=7.1945
Level 2 =[7.95880+13.9794+7.95880]/3=9.9656
Level 3=[8.62728+9.54243+6.02060]/3=8.0634
[3] Welding speed
Level1=[4.08240+9.54243+7.95880]/3=7.1954
Level 2 =[7.95880+9.54243+6.02060]/3=7.84601
Level 3 =[8.62728+13.9794+7.95880]/3=10.1884
Table 4.5: S/N Response Table for Weld Penetration
Symbo
l
Input Parameter
Mean S/N Ratio
Level 1
Level 2 Level 3
A Welding Current 6.889 11.021 7.313
B Gas flow rate 7.195 9.966 8.063
C Welding speed 7.195 7.841 10.188
J. Finding the optimal process parameters
Regardless of the category of the quality characteristic, a greater S/N ratio corresponds to better quality characteristics. Therefore, the optimal level with the greatest S/N ratio. The optimal levels of process are
Current =A 2 = 175Amp
Gas flow rate =B 2 = 12.5 LPM
Welding speed =C3 = 1.6 mm/s.
Maximum Penetration = T + (A2-T) + (B2-T) + (C3-T)
=A2+B2+C3-2T (8)
A2=Average value of penetration at the second level of current=[3.0+5.0+3.0]/3=3.66
B2=Average value of penetration at the second level of gas flow rate=[2.5+5.0+2.5]/3=3.33
C3=Average value of penetration at the third level of welding speed=[2.7+5.0+2.5]/3=3.4
T=Overall mean of penetration
=[1.6+2.5+2.7+3.0+5.0+3.0+2.5+2.5+2.0]/9=2.75
By putting the respective values, we get
Maximum penetration = 3.66+3.33+3.4-2x2.75
= 10.39 – 5.5
= 4.89 mm
I. Confirmation experiment
Once the optimal level of process parameters has been selected, the final step is to carry out the confirmation experiment by taking the optimal values of process parameter which are as fallows
Current =A 2 = 175Amp
Gas flow rate =B 2 = 12.5 LPM
Welding speed =C3 = 1.6 mm/s.
The above set of optimal process parameters are not found in orthogonal array so we have to carry out confirmation experiment. After carrying out confirmation experiment the actual penetration obtained is 5.00 mm.
321
11
10
9
8
7
321
321
11
10
9
8
7
Welding currentM
ea
n o
f S
N r
atio
sGas flow rate
Welding speed
Main Effects Plot for SN ratiosData Means
Signal-to-noise: Larger is better
Graph 4.1: Main Effects Plot for S/N Ratio

ISSN NO: 2454-1958 Special Issue Tech-Ed 2016 (International Conference) Page 35
321
11
10
9
8
7
321
321
11
10
9
8
7
Welding current
Me
an
o
f M
ea
ns
Gas flow rate
Welding speed
Main Effects Plot for MeansData Means
Graph 4.2: Main Effect plot for Means
K. Analysis of Variance
Analysis of variance (ANOVA) is the statistical treatment most commonly applied to the results of the experiments to determine the percentage contribution of each parameter against a stated level of confidence. Analysis of Variance (ANOVA) is a statistically based objective decision making tool for detecting any difference in average performance of groups of items tested. The decision rather than pure judgments, take variation in to account. The experimental design and subsequent analysis like ANOVA are intrinsically tied to each other. Analysis of Variance (ANOVA) breaks total variation down into accountable source and total variations is decomposed into its appropriate components.
The P-value approach is widely adopted in practice risks implied by specific value or level of significance. The P- value is probability that the tests statistics will take on a value that is at least extreme as the observed value of the statistic when the null hypothesis Ho is true. Thus, the P- values convey much information about the weight of evidence against the Ho and so a decision maker can draw a conclusion at any specified level of significance. The P- value is therefore the smallest level of significance that would lead to rejection of the null hypothesis Ho. Detail step for ANOVA are given below for weld penetration in (mm). Calculation of correction factor:
1. Correction Factor (C.F.) = (Total) ²/ T.C. (9)
2. Total Sum of Square (SS T) = ∑ y² - C.F. (10)
3. Sum of Squares due to Current (SS cur) = ∑ y cur² - C.F. (11) 4.Sum of Squares due to gas flow rate = ∑ y gas flow tate² - C.F. (12)
5) Sum of Squares due to speed (SS speed) = ∑ y
speed² - C.F. (13)
6) Sum of Squares due to Error (SS E) = SST - (SS cur + SS gas flow rate + SS speed) (14)
In order to statistically analyze the result, ANOVA was performed. Process variables having p-value<0.05 are considered significant terms for the requisite response characteristics. The insignificant parameters were having p value larger than 0.05.
The ANOVA.
Table 4.6 Analysis of Variance for SNRA1, using Adjusted SS for Tests
Source DF
Seq SS Adj SS Adj MS
F P
Welding current 2 3.7422 3.7422 1.8711 60.14 0.016
Gas flow rate 2 1.5622 1.5622 0.7811 25.11 0.038
Welding speed 2 1.8956 1.8956 0.9478 30.46 0.032
Error 2 0.0622 0.0622 0.0311
Total 8 7.2622
S = 0.176383 R-Sq = 99.14% R-Sq (adj) = 96.57%
IV. CONCLUSION
The optimum response for welding penetration by Taguchi Method is given as below
1. According to Taguchi methods, an attempt is made to determine set of values of process variable at their selected levels
2. To have predicted optimum value of welding penetration 4.89 mm but actual value of welding penetration is 5.00 mm at conditions of confidence interval as in table Conclusion according to Taguchi method.
Table 5.1: Predicted Vs Actual Value of Welding Penetration
Response Predicted Value Actual Value
Welding Penetration Set of optimum
value of process parameter are as
follows
Welding Current 175 Amp
Gas flow rate 12.5 LPM
Welding Speed 1.66 mm/sec
4.89 mm
5.0 mm
In addition to welding Penetration one additional test is
performed to analyze what happened to tensile strength. The standard value of tensile strength for 5mm AISI304 Plate is in the range of 540 to 750 N/mm2 and when the Specimen is welded with Cr2O3 Coating and at the level of optimum Parameter in addition to full Weld Penetration the tensile strength found to be 707 N/mm2 which is within Standard range of Tensile strength.
V REFERENCES [1] Uger Esme, “Effect of Pool Geometry on the Quality of TIG
Welded Joints”, PhD Thesis.
ISSN NO: 2454-1958 Special Issue Tech-Ed 2016 (International Conference) Page 36
[2] N.B. Mostafa, M.N. Khajavi, “Optimisation of welding parameters for weld penetration in FCAW”, journal of Achievements in Materials volume 16 issue 1-2, may-june 2006.
[3] ASME International Handbook Committee, Metals Handbook, J.R Davis, Second Edition, 1998.
[4] Reference Book Introduction to Welding [5] Kuang-Hung Tseng∗ and Kuan-Lung Chen, “Comparisons
Between TiO2- and SiO2-Flux Assisted TIG Welding Processes”, Journal of Nanoscience and Nanotechnology Vol. 12,2012,pp.6359–6367
[6] Hsuan-Liang Lin & Tong-Min Wu , “Effects of Activating Flux on Weld Bead Geometry of Inconel 718 Alloy TIG Welds”, Materials and Manufacturing Processes, 2712, 1457-1461,2012
[7] M Tanaka, “Effects of Surface Active Elements on Weld Pool Formation Using TIG Arcs”, Welding International, 1911, 870-876,2005
[8] H Hirata & K Ogawa, “Effect of Aluminium Content on Penetration Shape of Stainless Steel in TIG arc welding. Effect of Chemical Composition on Weldability in Fabrication of
High‐Alloyed Steel” (3rd report), Welding [9] R.-I.Hsieh, Y.-T.Pan, and H.-Y.Liou “The Study of Minor
Elements and Shielding Gas on Penetration in TIG Welding of Type 304 Stainless Steel” ASM International JMEPEG 868-74 1999
[10] A. K. Pandey, m. I. Khan, k. M. Moeed, “Optimization of Resistance Spot Welding Parameters Using Taguchi Method”, International Journal of Engineering Science and Technology,Vol. 5 No.02 February 2013,pp.234-241
[11] Uğur Eşme, “Application of Taguchi Method For The Optimization of Resistance Spot Welding”
[12] S.V.Sapakal¹, M.T.Telsang², “Parametric Optimization of Mig Welding Using Taguchi Design Method”, Ijaers Vol. I Issue IVJuly-Sept., 201228-30
[13] S. P. Tewari ET. al., “Effect of Welding Parameters On The Weldability of Material”, International Journal of Engineering Science and Technology.
[14] R Sudhakarana, V Vel-Muruganb and PS Sivasakthivelc, “Effect of Process Parameters on Depth of Penetration in Gas Tungsten Arc Welded (GTAW) 202 Grade Stainless”
[15] Ugur Esme1, “Optimization of Weld Bead Geometry In Tig Welding Process Using Grey Relation Analysis And Taguchi Method”, Materials and technology, MTAEC9, 43(3)143(2009)
[16] S. P. Gadewar et.al, “Experimental Investigation of Weld Characteristic for a Single Pass TIG Welding with ss304”, International Journal of Engineering Science and Technology. Vol. 2(8), 2010, pp.3676-3686.
[17] Kuang-HungTseng1,Wei-Chuan Wang1,”Study of Silica-Titania Mixed Flux Assisted TIG Welding Process”, Advanced Materials Research Vols. 291-294 2011 pp 949-953
[18] H. Y. Huang, S. W. Shyu2, K. H. Tseng3 and C. P. Chou4,Science and Technology of Welding and Joining,VOL 10 NO 5 573,2005
[19] Chunlin Dong,Y Fegzhu, “Preliminary study on the Mechansim of Arc Welding with the activating flux”, Joining and welding research,vol.1,2004,pp.271-278
[20] G.Taguchi, Y.wu, “Off-line Quality Control”, Central Japan Quality control association, Nagaya, Japan, 1979.
[21] D.C. Montgomery, “Probability and Statistics in Engg and management science”, 3rd edition, Willey Publication, 1990.
ISSN NO: 2454-1958 Special Issue Tech-Ed 2016 (International Conference) Page 37
Performance and Evaluation of Solar
Powered Bicycle: A Review Rahul Mathankar
Student, Tulsiramji Gaikwad- Patil College of
Engineering and Technology, Nagpur,
Asif Sheikh
Student, Tulsiramji Gaikwad- Patil College of
Engineering and Technology, Nagpur,
Shubham Girde3
Students, Tulsiramji Gaikwad- Patil College of
Engineering and Technology, Nagpur
Swapnil Thanekar
HOD (MECH), Tulsiramji Gaikwad- Patil College of
Engineering and Technology, Nagpur
(Email: [email protected])
ABSTRACT: This paper gives the details about the
research papers related to the solar power bicycle
project and includes the methods and considerations
regarding the proper working of the bicycle. The main
components of this project is Solar PV panel, Brushless
motor, Charge controller and battery. This paper will
deals with the main idea of the component and here we
compare the different component of solar bicycle.
Solar energy is one of the renewable energy which can
be a feasible and can be used as alternative fossil fuels.
In this work, a solar powered bicycle is fabricated by
modifying allcomponents of existing geared bicycle.
This paper deals with the design, assembly and
performance evaluation of the bicycle. This paper
highlights the advantages of dual mode of charging and
economic feasibility of the bicycle.
Keywords:Solar PV panel, Brushless motor, Charge controller.
LITERATURE REVIEW
A. M. REDDI SANKAR, T. PUSHPAVENI,
V. BHANU PRAKASH REDDY, present a paper on
“DESIGN AND DEVELOPMENT OF SOLAR
ASSISTED BICYCLE” Process.
The solar assisted bicycle developed is driven
by DC motor fitted in front or rear axle housing &
operated by solar energy. The solar panels mounted
on the carriage will charge the battery & which in
turn drive the hub motor. When the bicycle is idle,
the solar panel will charge the battery. This
arrangement will replace the petrol engine, the gear
box & the fuel tank in case of a two wheeler or a
chain sprocket, chain & gear shifting arrangement of
a conventional bicycle being used by most common
man. As a part of dissertation work, the solar assisted
bicycle is fitted with a dc hub motor on front axle of
a bicycle with power rating of 250W and with a
travelling speed of around 25-30 kmph. It is provided
with a pair of lead acid batteries of 35 Ah each, a
photovoltaic solar panel with capacity of 20 watt, a
voltage regulator of 24v 10 Amp, accelerator and
motor controller of 24v 25Amp. There is also a
provision for charging of the battery with 220-240V,
AC wall outlet supply, in case of poor solar supply
due to cloudy weather.
B. ABDULKADIR BABA HASSAN, present a
paper on „„DESIGN AND FABRICATION OF A
MOTORIZED D.PROTOTYPE TRICYCLE FOR
THE DISABLE PERSONS‟‟:
This project design is embodied on a
motorized tricycle for disabled Persons. The tricycle
was specifically designed to suit wheelchair
occupants of healthy Upper torso with pelvic to foot
restraint. It is also designed to suit a commonly
available Wheel chair. The level of relationship
between the disabled people in the society has highly
being jeopardized; therefore this project was
designed to correct the difficulties in mobility of the
wheelchair users. The main aim of the project design
is to ease mobility for the physically challenged and
also provide adequate comfort they desire. Existing
tricycles for the disables requires the disabled person
to dismount from the wheelchair onto the tricycle.
ISSN NO: 2454-1958 Special Issue Tech-Ed 2016 (International Conference) Page 38
The motorized tricycle in this project is designed to
overcome this problem by allowing the disabled
person to wheel up or down his wheelchair onto or
down the tricycle. This is achieved using a specially
designed platform that allows the wheel chair to be
wheeled up or down. The prototype of this tricycle
has been fabricated. The anthropometrics data that
need to be considered in the design of the platform
and frame of the tricycle have been taken into
consideration at the design stage of the tricycle.
C. N.SASIKUMAR,
DR.P.JAYASUBRAMANIAM, present a paper on
“SOLAR ENERGY SYSTEM IN INDIA”.
Conventional energy sources like coal, oil,
natural gas, etc., are limited in quantity, and if these
continue to be depleted at the present rate, these will
be exhausted in the coming decades. Energy demand
is resulting in the creation of fossil fuel based power
plants leading to substantial greenhouse gas
emissions having an adverse impact on global
warming and climate change Solar energy offers a
clean, climate-friendly, abundant and inexhaustible
generation in tropical countries Solar photovoltaic
(SPV) cells convert solar radiation (sunlight) into
electricity. A solar cell is a semiconducting device
made of Silicon materials, which, when exposed to
sunlight, generates electricity. Solar cells are
connected in series and parallel combinations to form
modules that provide the required power.
D.RAJENDRA BEEDU, presents a paper on
“DESIGN, DEVELOPMENT AND
PERFORMANCE EVALUATION OF SOLAR
POWER ASSISTED BICYCLE’’.
The fast depletion of fossil fuels due to exponential
increase in demand and global warming due to the
emission of CO2 made engineers and scientists to
look for an alternative source of energy which is
renewable, eco-friendly, affordable and available.
Among the renewable sources like wind, tidal ,
geothermal and solar energy, solar power is
promising in nations like India which is in the
tropical region. India spends large amount of foreign
exchange to import crude oil,with the use of solar
power assisted vehicles, the dependency on the
import of crude oil can be reduced and reasonable
amount of foreign exchange can be saved.
E. ARUN MANOHAR GURRAM, P.S.V
RAMANA RAO, RAGHUVEER DONTIKURTI,
presents a paper on “SOLAR G. POWERED
WHEEL CHAIR: MOBILITY FOR PHYSICALLY
CHALLENGED”.
Personal mobility means freedom for the
physically challenged. One of the best inventions in
the medical field that helped both the elderly and the
handicapped is the mobility vehicle. The fact that
they are no longer depending on someone else to
perform daily duties is a big step forward. On the
journey to mobility and freedom, motorized scooters
and wheelchairs are the tools to finish that journey.
With scooters and wheelchairs, there is a small
inconvenience to mobility independence. The
addition of some devices enables persons with
physical disabilities a comfortable travel beyond their
own homes. The present work involves in design and
fabrication of solar powered wheel chair. A
motorized wheelchair, power chair, electric
wheelchair or electric powered wheelchair (EPW) is
propelled by means of an electric motor rather than
manual power.
F. TILAKISWARAN A/L
SAMURGAM, Present a paper on
“DEVELOPMENT OF BATTERY POWERED
TRICYCLE”.
The main purpose of this project is to develop a
battery powered electric motor tricycle which can be
used as a simple transportation and for economy
reasons, to develop a battery powered electric motor
tricycle which can be used as a simple transportation
and for economy reasons. A motorized tricycle is a
three wheeled bicycle with an attached motor used to
assist with pedaling. Generally considered as a
vehicle, tricycles are usually powered by electric
motors or small internal combustion engines and
have function as electric bicycles. Some can be
propelled by the motor alone if the rider chooses not
to pedal; while in others the motor will only run if the
rider pedals. Electric bicycles are generally powered
by rechargeable batteries. These are normally
charged from the utility supply (mains), with perhaps
the option of using the motor to effect regenerative
braking or charging while being pedaled or rolling
downhill. Electric motorized bicycles are either
power-on-demand, where the motor is activated by a
handlebar mounted throttle, or pedelec (from pedal
electric), where the electric motor is regulated by
pedaling.

ISSN NO: 2454-1958 Special Issue Tech-Ed 2016 (International Conference) Page 39
G. YOGESH SUNIL WAMBORIKAR,
ABHAY SINHA, Presents a paper on “SOLAR
POWERED VEHICLE”.
The renewable energy is vital for today‟s world
as in near future the nonrenewable sources that we
are using are going to get exhausted. The solar
vehicle is a step in saving these nonrenewable
sources of energy. The basic principle of solar car is
to use energy that is stored in a battery during and
after charging it from a solar panel. The charged
batteries are used to drive the motor which serves
here as an engine and moves the vehicle in reverse or
forward direction. The electrical tapping rheostat is
provided so as to control the motor speed. This
avoids excess flow of current when the vehicle is
supposed to be stopped suddenly as it is in normal
cars with regards to fuel. This idea, in future, may
help protect our fuels from getting extinguished.
H. CHETAN MAHADIK, SUMIT
MAHINDRAKAR, PROF. JAYASHREE DEKA,
presents a paper on “AN IMPROVED & EFFICIENT
ELECTRIC BICYCLE SYSTEM WITH THE
POWER OF REAL-TIME INFORMATION
SHARING”.
This paper presents the development of an
associate degree "Electric Bicycle System‟ with an
innovative approach. The aim of this paper is to show
that the normal bi-cycle can be upgraded to electric
one by some means– that including the development
of a regenerative braking system and innovative
BLDC motor control. The main components of the
electric bicycle are brushless DC motor, motor
controller, photo-voltaic, dry cell battery and solar
panel. Also throttle and extra features such as horn,
speedometer, and LED signal etc. The power source
for this system is given by dry cell battery. The
output of dry cell battery is 48V. There are multiple
forms of charging source is used such as AC voltage
through an outlet, solar energy and mechanical pedal
charging system. The source of battery charging is
photovoltaic solar panel and it is light weight. The
solar panel output is 12V and 20 watt. Also they use
mechanical pedal charging system, so dynamo is use
for this charging system.
I. T. PUSHPAVENI, V. BHANU PRAKASH
REDDY,presents a paper on “DESIGN AND
DEVELOPMENT OF SOLAR ASSISTED
BICYCLE’’.
As we all know the fuel prices especially the petrol is
rising steadily day by day. Again the pollution due to
vehicles in metro cities & urban areas is increasing
continuously. To overcome these problems, an effort
is being made to search some other alternative
sources of energy for the vehicles. Again, it is also
not affordable to purchase vehicles (mopeds, scooters
or motorcycles) for all the class of society. Keeping
this in mind, a search for some way to cater these
economically poor people as well as to provide a
solution for the environmental pollution was in
progress. The solar assisted bicycle developed is
driven by DC motor fitted in front or rear axle
housing & operated by solar energy. The solar panels
mounted on the carriage will charge the battery &
which in turn drive the hub motor. When the bicycle
is idle, the solar panel will charge the battery. This
arrangement will replace the petrol engine, the gear
box & the fuel tank in case of a two wheeler or a
chain sprocket, chain & gear shifting arrangement of
a conventional bicycle being used by most common
man.
CONCLUSION
It can be concluded from paper that the overall
efficiency of the bike will definitely be improved by
working on the parameters discussed earlier. Also, a
completely new dimension of the bike will be
designed with enhanced features. If the venture
proves to be successful then an enhanced solar bike
can be available at a much cheaper price. The design
of the solar bike can also be improved further in
terms of its appearance in view of the 21st century
people. The bike can prove to be an ideal for
promoting the concept of “GO GREEN AND
CLEAN”.

ISSN NO: 2454-1958 Special Issue Tech-Ed 2016 (International Conference) Page 40
REFRENCES
[1] M. Reddi Sankar, T. Pushpaveni, V. Bhanu Prakash Reddy,
“DESIGN AND DEVELOPMENT OF SOLAR ASSISTED
BICYCLE”,International Journal of Scientific and Research
Publications, (Volume 3, Issue 3), (March 2013) ISSN 2250-3153,
( Page No. 781-786).
www.ijeit.com/vol%202/Issue%206/IJEIT1412201212_79.pdf
[2] Abdulkadir Baba Hassan (Department of Mechanical
Engineering, Federal University of Technology, Minna, Niger
State, Nigeria) “DESIGN AND FABRICATION OF A
MOTORIZED PROTOTYPE TRICYCLE FOR THE DISABLE
PERSONS” IOSR Journal of Engineering , (Vol. 2(5 )), May 2012
(Page No. 1071- 1074).
www.iosrjen.org/Papers/vol2_issue5/Z02510711074.pdf
[3] N.Sasikumar (Ph.D (Part – Time) Research Scholar, Kamban
Arts & Science College, Coimbatore),
Dr.P.Jayasubramaniam(Head & Asst.Prof in Professional
Accounting, Dr.N.G.P. Arts & Science College, Coimbatore),
“SOLAR ENERGY SYSTEM IN INDIA” IOSR Journal of
Business and Management (IOSR-JBM) ISSN: 2278-487X.
Volume 7, Issue 1 (Jan. - Feb. 2013), (Page No. 61-68)
www.iosrjournals.org/papers/Vol-2%20Issue=6/D0262730,pdfJ.
Clerk Maxwell, A Treatise on Electricity and Magnetism, 3rd ed.,
vol. 2. Oxford: Clarendon, 1892, pp.68–73.
[4] Rajendra Beedu, presents a paper on “DESIGN,
DEVELOPMENT AND PERFORMANCE EVALUATION OF
SOLAR POWER ASSISTED BICYCLE’’ International Journal of
Research in Engineering and Technology eISSN: 2319-1163 |
pISSN: 2321-7308 (Vol-4), (Page No. 513-517)
[5] Arun Manohar Gurram, P.S.V Ramana Rao, Raghuveer
Dontikurti “SOLAR POWERED WHEEL CHAIR: MOBILITY
FOR PHYSICALLY CHALLENGED” International Journal of
Current Engineering and Technology Volume 2, No.1 (March
2012) ISSN 2277 – 4106 (Page No. 211-214)
www.inpressco.com/wp-content/uploads/2012/03/Paper11211-
214.pdf
[6] Daniel Dourte, David Sandberg, Tolu Ogundipe, PRESENT a
PAPER ON “ELECTRIC TRICYCLE: APPROPRIATE
MOBILITY”: International Journal of Engineering Science
Invention, ISSN (Online): 2319 – 6734, ISSN (Print): 2319 – 6726
April 2014 Volume-3 (PageNo.29-32)
www.ijesi.org/papers/Vol(3)a/Version-3/E0343029032.pdf
[7] Tilakiswaran A/L Samurgam, Present a
Paper On “DEVELOPMENT OF BATTERY POWERED
TRICYCLE”.International Journal of Research in Engineering and
Science (IJRES) ISSN (Online): 2320-9364, ISSN (Print): 2320-
935 Volume 2 Issue 5 May. 2014 (Page No. 21-28)
www.ijres.org/papers/Volume%202/v2-i5(i)/D0252128.pdf
[8] Yogesh Sunil Wamborikar, Abhay Sinha, Presents a paper on
“SOLAR POWERED VEHICLE”. International Journal of
Renewable Energy Research Volume 2, No.3 Received:
05.06.2012 Accepted:01.07.2012 (Page No.457-462)
www.ijrer.org/index.php/ijrer/article/download/260/pdf
[9]T. Pushpaveni, V. Bhanu Prakash Reddy, presents a paper on
“DESIGN AND DEVELOPMENT OF SOLAR ASSISTED
BICYCLE’’.International Journal of Scientific and Research
Publications, Volume 3, Issue 3, March 2013 ISSN 2250-
3153(Page No.1-6)
ISSN NO: 2454-1958 Special Issue Tech-Ed 2016 (International Conference) Page 41
DESIGN AND FEBRICATION OF MULTI-
PORPOSE AGRICULTURAL MACHINE
Pawan R. Giri
Student MED IInd year Mechanical Engg. Dept.
Abha Gaikwad Patil College of Engg.
Nagpur, India
Ravindra R Gandhe
Assistant Professor Mechanical Engg. Dept.
Abha Gaikwad Patil College of Engg.
Nagpur, India
Ajay A. Mahawadiwar
Head of department Mechanical Engg. Dept.
Abha Gaikwad Patil College of Engg. Nagpur, India
Abstract- The farming sector in India primarily consists of small
scale farmers. These small scale farmers cannot afford equipment
like tractors, paddy processing machine s, thereby restricting
their output .The present work involves designing and
fabricating simple and economical farming equipment to
perform multiple farming operations like crop cutting,
cultivating, towing loads, seed sowing etc. This vehicle was built
keeping in mind the need of small scale farmer.
Initially various concept were explored and calculated .The final
design was selected with these calculations and specifications.
This equipment can be used for cutting crop, cultivator and also
for sowing seed. It is easily operated by unskilled person. It
can reduce labor cost due to the only one person can be handle.
Crop cutter machine does not required high maintenance.
Keywords— Farmer, Crop, Cultivator, Sowing etc
I.INTROSUCTION
Agriculture forms the backbone of our country economy;
about 55% of citizen is depending on agriculture. Thus
developing our country means providing our farmers with
more “Sophisticated” and “Advanced Tool” which would
decreases overall time required for the task and the task will
become more easy and convenient. In agriculture have done
more process
Developed agriculture needs to find new ways to improve efficiency. One approach is to utilize available information
technologies in the form of more intelligent machines to
reduce and target energy inputs in more effective ways than in
the past. Precision farming has shown benefits of this
approach but we can now move towards a new generation of
equipment. The advent of autonomous system architectures
gives us the opportunity to develop a complete new range of
agricultural equipment based on small smart machines that can
do the right thing, in the right place, at the right time in the
right way.
The final design was selected with these calculations and specifications. This equipment can be used for cutting
crop, cultivator and also for sowing seed. It is easily operated
by unskilled person. It can reduce labour cost due to the only
one person can be handle. Machine does not required high
maintenance. On the basis of this large number of farming
equipment are in use at today’s date, which are available at
different shape and size and on different power supply. Since
they are costlier keeping in to consideration the economic
ability of our farmer it is required that is should be simple and
should fulfil the same intention which are achieved by
“DESIGN AND FEBRICATION OF MULTI-PORPOSE AGRICULTURAL MACHINE”.
II.LITERATURE REVIEW
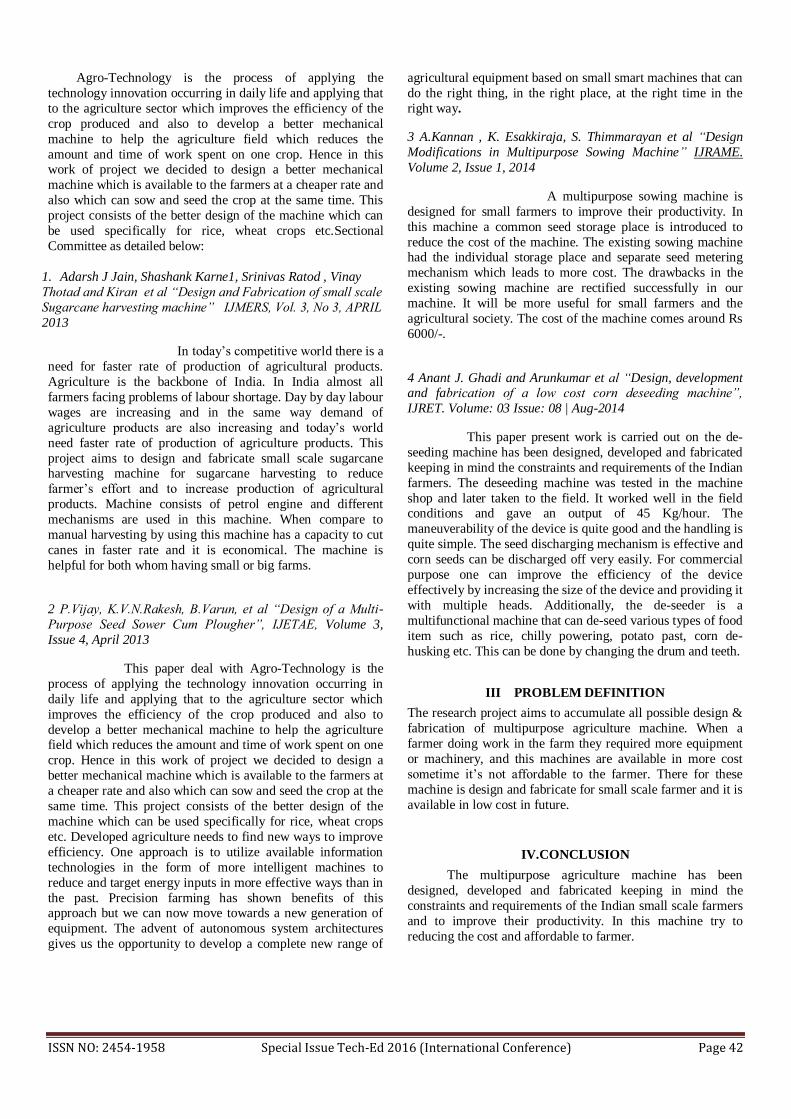
ISSN NO: 2454-1958 Special Issue Tech-Ed 2016 (International Conference) Page 42
Agro-Technology is the process of applying the
technology innovation occurring in daily life and applying that
to the agriculture sector which improves the efficiency of the
crop produced and also to develop a better mechanical
machine to help the agriculture field which reduces the
amount and time of work spent on one crop. Hence in this work of project we decided to design a better mechanical
machine which is available to the farmers at a cheaper rate and
also which can sow and seed the crop at the same time. This
project consists of the better design of the machine which can
be used specifically for rice, wheat crops etc.Sectional
Committee as detailed below:
1. Adarsh J Jain, Shashank Karne1, Srinivas Ratod , Vinay
Thotad and Kiran et al “Design and Fabrication of small scale
Sugarcane harvesting machine” IJMERS, Vol. 3, No 3, APRIL
2013
In today’s competitive world there is a
need for faster rate of production of agricultural products.
Agriculture is the backbone of India. In India almost all
farmers facing problems of labour shortage. Day by day labour
wages are increasing and in the same way demand of
agriculture products are also increasing and today’s world
need faster rate of production of agriculture products. This
project aims to design and fabricate small scale sugarcane harvesting machine for sugarcane harvesting to reduce
farmer’s effort and to increase production of agricultural
products. Machine consists of petrol engine and different
mechanisms are used in this machine. When compare to
manual harvesting by using this machine has a capacity to cut
canes in faster rate and it is economical. The machine is
helpful for both whom having small or big farms.
2 P.Vijay, K.V.N.Rakesh, B.Varun, et al “Design of a Multi-
Purpose Seed Sower Cum Plougher”, IJETAE, Volume 3,
Issue 4, April 2013
This paper deal with Agro-Technology is the
process of applying the technology innovation occurring in
daily life and applying that to the agriculture sector which
improves the efficiency of the crop produced and also to
develop a better mechanical machine to help the agriculture field which reduces the amount and time of work spent on one
crop. Hence in this work of project we decided to design a
better mechanical machine which is available to the farmers at
a cheaper rate and also which can sow and seed the crop at the
same time. This project consists of the better design of the
machine which can be used specifically for rice, wheat crops
etc. Developed agriculture needs to find new ways to improve
efficiency. One approach is to utilize available information
technologies in the form of more intelligent machines to
reduce and target energy inputs in more effective ways than in
the past. Precision farming has shown benefits of this approach but we can now move towards a new generation of
equipment. The advent of autonomous system architectures
gives us the opportunity to develop a complete new range of
agricultural equipment based on small smart machines that can
do the right thing, in the right place, at the right time in the
right way.
3 A.Kannan , K. Esakkiraja, S. Thimmarayan et al “Design
Modifications in Multipurpose Sowing Machine” IJRAME.
Volume 2, Issue 1, 2014
A multipurpose sowing machine is
designed for small farmers to improve their productivity. In
this machine a common seed storage place is introduced to
reduce the cost of the machine. The existing sowing machine had the individual storage place and separate seed metering
mechanism which leads to more cost. The drawbacks in the
existing sowing machine are rectified successfully in our
machine. It will be more useful for small farmers and the
agricultural society. The cost of the machine comes around Rs
6000/-.
4 Anant J. Ghadi and Arunkumar et al “Design, development and fabrication of a low cost corn deseeding machine”,
IJRET. Volume: 03 Issue: 08 | Aug-2014
This paper present work is carried out on the de-
seeding machine has been designed, developed and fabricated
keeping in mind the constraints and requirements of the Indian
farmers. The deseeding machine was tested in the machine
shop and later taken to the field. It worked well in the field conditions and gave an output of 45 Kg/hour. The
maneuverability of the device is quite good and the handling is
quite simple. The seed discharging mechanism is effective and
corn seeds can be discharged off very easily. For commercial
purpose one can improve the efficiency of the device
effectively by increasing the size of the device and providing it
with multiple heads. Additionally, the de-seeder is a
multifunctional machine that can de-seed various types of food
item such as rice, chilly powering, potato past, corn de-
husking etc. This can be done by changing the drum and teeth.
III PROBLEM DEFINITION
The research project aims to accumulate all possible design &
fabrication of multipurpose agriculture machine. When a
farmer doing work in the farm they required more equipment
or machinery, and this machines are available in more cost
sometime it’s not affordable to the farmer. There for these
machine is design and fabricate for small scale farmer and it is
available in low cost in future.
IV.CONCLUSION
The multipurpose agriculture machine has been
designed, developed and fabricated keeping in mind the
constraints and requirements of the Indian small scale farmers
and to improve their productivity. In this machine try to
reducing the cost and affordable to farmer.

ISSN NO: 2454-1958 Special Issue Tech-Ed 2016 (International Conference) Page 43
We are reduce time in farming and also reduce cost
of labour. This machine fuel consumption is covered. The
manoeuvrability of the machine is quite good and the handling
is quite simple the mode of operation is very simple even to
the lay man. It is more efficient than the present existing
machines of this category and range. The maintenance cost of this equipment is very less as there is no delicate part
involved. .
REFERENCES
[1] “Design and Fabrication of Multipurpose Robust Cutting Machine for
Agriculture” (2011-12ject Report) (Retrieved on April 17, 2013).
[2] Adarsh J Jain, Shashank Karne1, Srinivas Ratod , Vinay Thotad and Kiran
et al “Design and Fabrication of small scale Sugarcane harvesting
machine” IJMERS, Vol. 3, No 3, APRIL 2013
[3] P.Vijay, K.V.N.Rakesh, B.Varun, et al “Design of a Multi-Purpose Seed
Sower cum Plougher”, IJETAE, Volume 3, Issue 4, April 2013
[4] A.Kannan, K. Esakkiraja, S. Thimmarayan et al “Design Modifications in
Multipurpose Sowing Machine” IJRAME. Volume 2, Issue 1, 2014
[5] Anant J. Ghadi and Arunkumar et al “Design, development and fabrication
of a low cost corn deseeding machine”, IJRET. Volume: 03 Issue: 08 |
Aug-2014
[6] V.K CHANDEGARA “design and developing of bullock drawn
multi‐purpose implement for Sandy loam soil”, Journal of agricultural
engineering, Vol, 40(4): October December, 2003
[7] R.S. Khurmi & J.K Gupta (2003), “A textbook of machine design”,S.
Chand & company

ISSN NO: 2454-1958 Special Issue Tech-Ed 2016 (International Conference) Page 44
DESIGN AND DEVELOPMENT OF
HYBRID MOPED USING ELCTRICAL
AND PETROL OPERATING
ARRANGEMENT
Piyush A.Dalke1
Mechanical Engineering Department
G.H.Raisoni College of Engineering, Nagpur
Nagpur, India
Prof.AbhijeetA.Raut2
Mechanical Engineering Department
G.H.Raisoni College of Engineering Nagpur
Nagpur, India
ABSTRACT Rapid depletion of fossil fuels has forced the
necessity of an alternate energy vehicle. Electric
vehicles serve as promising technology for the future
world transportation arena Due to minor drawbacks
the electric vehicles cannot match up with the fossil
fuel powered vehicle which made the invention of
hybrid technology. Concentrated efforts are mainly
towards implementing a concept called as hybrid
system by which one system will be charged while the
other system provides propulsive power to the
vehicle. When the s runs on the electric motor it is
almost nonpolluting.
This project is deal with the development of
the as the only petrol vehicle or electrical vehicle is
not as sufficient as hybrid vehicle. This hybrid
technology can compensated the disadvantages of
both type of vehicle. There is various type of base on
the type of charging as it becomes plug-in type or
other.
I. INTRODUCTION
Hybrid electric moped (HEM) have a great potential in lowering emissions and reducing
fuel demand as the ever growing problems of air
pollution and global warming reached its critical
stage. Although various researches are carried out
to reduce emissions and fuel dependencies for four-
wheeled vehicles, not much research is focused on
two wheeled vehicles for example, motorcycles in
Jakarta, Indonesia contributed to more than 20% in
both PM10 and CO and 40% of HC emissions
during 1998. Whereas in Hanoi, Vietnam,
motorcycles contributes to about 54% of CO,HC and Pb and 43% of dust Finally, in Taiwan where
emissions reports indicate that 38% of CO, 3% of
NOx, 64% of NMHC and 30% of PM were emitted
from motorcycles and scooters alone.
Internal combustion engines are relatively less efficient in converting the on-board fuel energy
to propulsion as most of the energy is wasted as
heat. On the other hand, electric motors are
efficient in converting the stored energy in driving
a vehicle, and electric drive vehicles do not
consume power while coasting. Some of the energy
loss in braking is captured and reused by
regenerative braking. With the help of regenerative
braking one fifth of the energy loss can be
regenerated. Typically, petrol engines effectively
use only 15% of its fuel content to move the
vehicle. Whereas an electric drive vehicle has an on-board efficiency of about 80%. But due to
reasons such as cost, inability to reach higher
speeds electric drive vehicles failed to capture
markets. Contrary to this petrol vehicle can cover
longer distances with higher speed but it cannot
cover shorter distance with slow speed (say in
traffic) in an efficient way. Two-wheeled vehicles,
especially motorcycles and scooters contribute to a
major part of air pollution, especially in the Asia
region.
Thus a hybrid approach, which is to utilize an internal combustion engine (ICE) and a battery,
is more feasible as a much higher range could be
achieved compare to pure electric scooters. The
only trade-off is that emissions are not reduced to
zero. Thus two-wheeled hybrid research is as
equally as important
II. CONCEPT OF HYBRID
VEHICLE
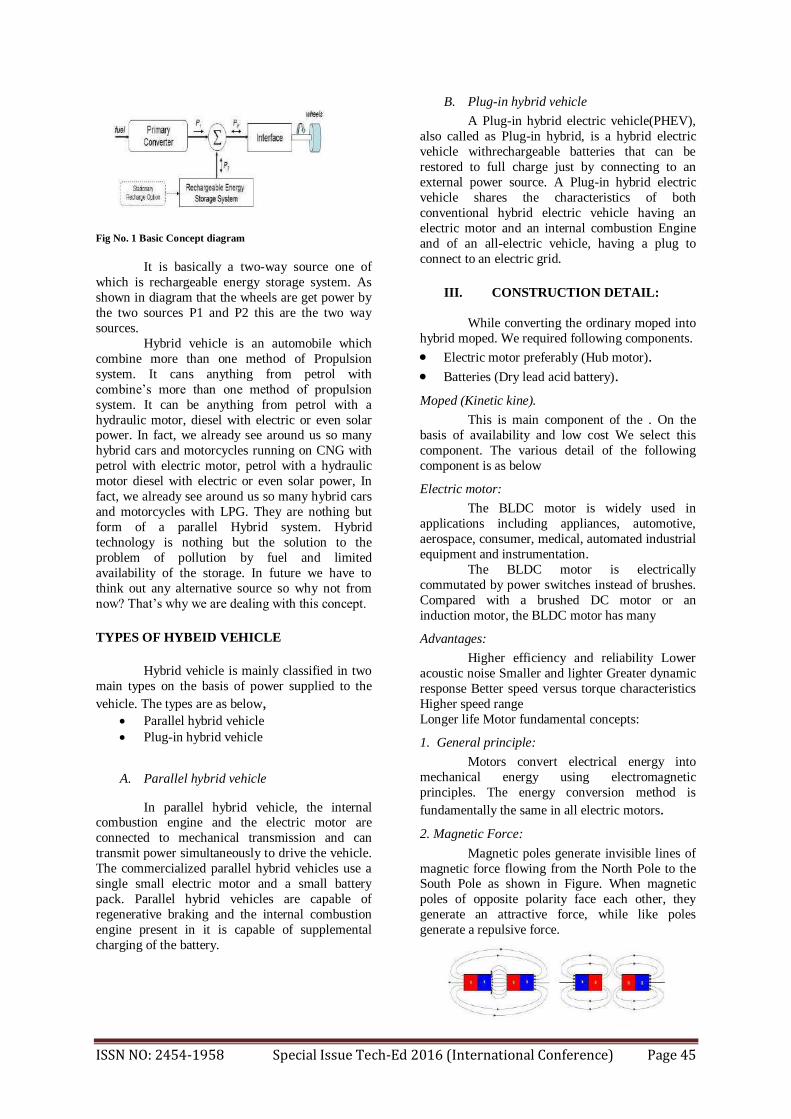
ISSN NO: 2454-1958 Special Issue Tech-Ed 2016 (International Conference) Page 45
Fig No. 1 Basic Concept diagram
It is basically a two-way source one of
which is rechargeable energy storage system. As
shown in diagram that the wheels are get power by
the two sources P1 and P2 this are the two way
sources.
Hybrid vehicle is an automobile which
combine more than one method of Propulsion
system. It cans anything from petrol with
combine’s more than one method of propulsion
system. It can be anything from petrol with a
hydraulic motor, diesel with electric or even solar power. In fact, we already see around us so many
hybrid cars and motorcycles running on CNG with
petrol with electric motor, petrol with a hydraulic
motor diesel with electric or even solar power, In
fact, we already see around us so many hybrid cars
and motorcycles with LPG. They are nothing but
form of a parallel Hybrid system. Hybrid
technology is nothing but the solution to the
problem of pollution by fuel and limited
availability of the storage. In future we have to
think out any alternative source so why not from
now? That’s why we are dealing with this concept.
TYPES OF HYBEID VEHICLE
Hybrid vehicle is mainly classified in two
main types on the basis of power supplied to the
vehicle. The types are as below, Parallel hybrid vehicle
Plug-in hybrid vehicle
A. Parallel hybrid vehicle
In parallel hybrid vehicle, the internal combustion engine and the electric motor are
connected to mechanical transmission and can
transmit power simultaneously to drive the vehicle.
The commercialized parallel hybrid vehicles use a
single small electric motor and a small battery
pack. Parallel hybrid vehicles are capable of
regenerative braking and the internal combustion
engine present in it is capable of supplemental
charging of the battery.
B. Plug-in hybrid vehicle
A Plug-in hybrid electric vehicle(PHEV),
also called as Plug-in hybrid, is a hybrid electric
vehicle withrechargeable batteries that can be
restored to full charge just by connecting to an
external power source. A Plug-in hybrid electric
vehicle shares the characteristics of both
conventional hybrid electric vehicle having an
electric motor and an internal combustion Engine
and of an all-electric vehicle, having a plug to
connect to an electric grid.
III. CONSTRUCTION DETAIL:
While converting the ordinary moped into
hybrid moped. We required following components.
Electric motor preferably (Hub motor).
Batteries (Dry lead acid battery).
Moped (Kinetic kine).
This is main component of the . On the
basis of availability and low cost We select this
component. The various detail of the following
component is as below
Electric motor:
The BLDC motor is widely used in
applications including appliances, automotive,
aerospace, consumer, medical, automated industrial
equipment and instrumentation.
The BLDC motor is electrically
commutated by power switches instead of brushes.
Compared with a brushed DC motor or an
induction motor, the BLDC motor has many
Advantages:
Higher efficiency and reliability Lower
acoustic noise Smaller and lighter Greater dynamic
response Better speed versus torque characteristics
Higher speed range
Longer life Motor fundamental concepts:
1. General principle:
Motors convert electrical energy into
mechanical energy using electromagnetic
principles. The energy conversion method is
fundamentally the same in all electric motors.
2. Magnetic Force:
Magnetic poles generate invisible lines of
magnetic force flowing from the North Pole to the South Pole as shown in Figure. When magnetic
poles of opposite polarity face each other, they
generate an attractive force, while like poles
generate a repulsive force.
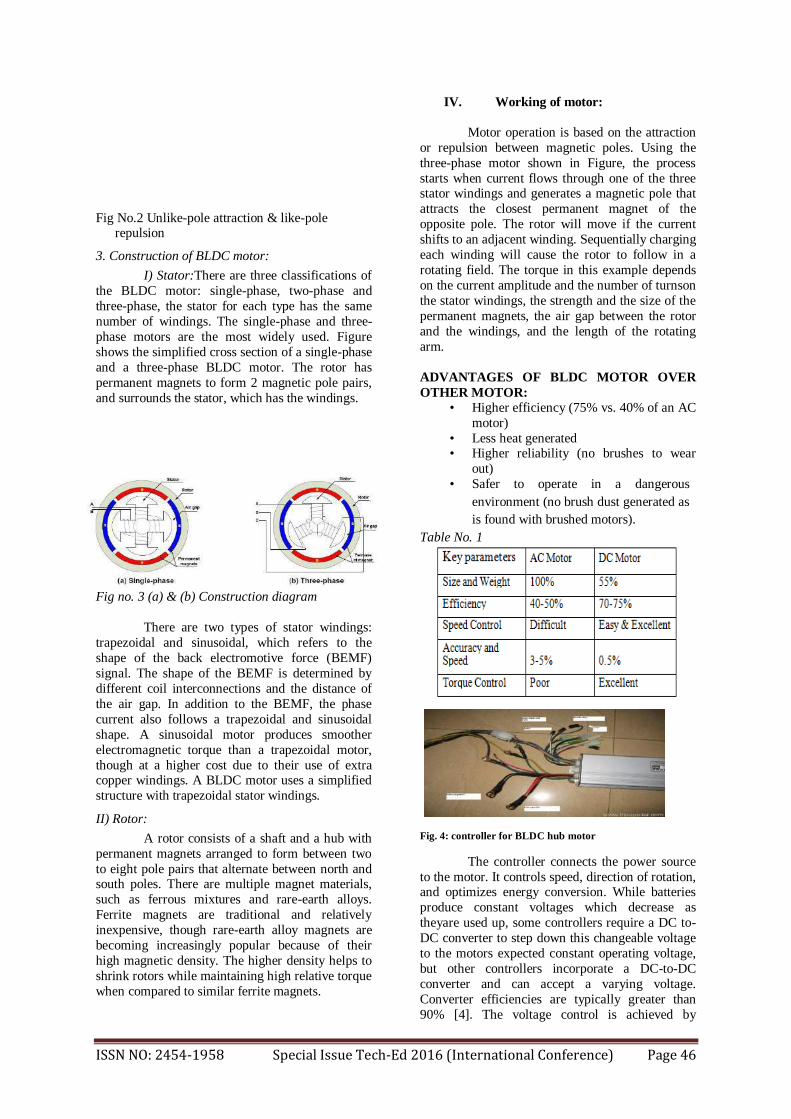
ISSN NO: 2454-1958 Special Issue Tech-Ed 2016 (International Conference) Page 46
Fig No.2 Unlike-pole attraction & like-pole repulsion
3. Construction of BLDC motor:
I) Stator:There are three classifications of
the BLDC motor: single-phase, two-phase and
three-phase, the stator for each type has the same
number of windings. The single-phase and three-
phase motors are the most widely used. Figure
shows the simplified cross section of a single-phase
and a three-phase BLDC motor. The rotor has
permanent magnets to form 2 magnetic pole pairs,
and surrounds the stator, which has the windings.
Fig no. 3 (a) & (b) Construction diagram
There are two types of stator windings:
trapezoidal and sinusoidal, which refers to the
shape of the back electromotive force (BEMF)
signal. The shape of the BEMF is determined by
different coil interconnections and the distance of
the air gap. In addition to the BEMF, the phase
current also follows a trapezoidal and sinusoidal
shape. A sinusoidal motor produces smoother
electromagnetic torque than a trapezoidal motor,
though at a higher cost due to their use of extra copper windings. A BLDC motor uses a simplified
structure with trapezoidal stator windings.
II) Rotor:
A rotor consists of a shaft and a hub with
permanent magnets arranged to form between two
to eight pole pairs that alternate between north and south poles. There are multiple magnet materials,
such as ferrous mixtures and rare-earth alloys.
Ferrite magnets are traditional and relatively
inexpensive, though rare-earth alloy magnets are
becoming increasingly popular because of their
high magnetic density. The higher density helps to
shrink rotors while maintaining high relative torque
when compared to similar ferrite magnets.
IV. Working of motor:
Motor operation is based on the attraction
or repulsion between magnetic poles. Using the
three-phase motor shown in Figure, the process
starts when current flows through one of the three stator windings and generates a magnetic pole that
attracts the closest permanent magnet of the
opposite pole. The rotor will move if the current
shifts to an adjacent winding. Sequentially charging
each winding will cause the rotor to follow in a
rotating field. The torque in this example depends
on the current amplitude and the number of turnson
the stator windings, the strength and the size of the
permanent magnets, the air gap between the rotor
and the windings, and the length of the rotating
arm.
ADVANTAGES OF BLDC MOTOR OVER
OTHER MOTOR:
• Higher efficiency (75% vs. 40% of an AC
motor)
• Less heat generated • Higher reliability (no brushes to wear
out)
• Safer to operate in a dangerous
environment (no brush dust generated as
is found with brushed motors).
Table No. 1
Fig. 4: controller for BLDC hub motor
The controller connects the power source
to the motor. It controls speed, direction of rotation, and optimizes energy conversion. While batteries
produce constant voltages which decrease as
theyare used up, some controllers require a DC to-
DC converter to step down this changeable voltage
to the motors expected constant operating voltage,
but other controllers incorporate a DC-to-DC
converter and can accept a varying voltage.
Converter efficiencies are typically greater than
90% [4]. The voltage control is achieved by
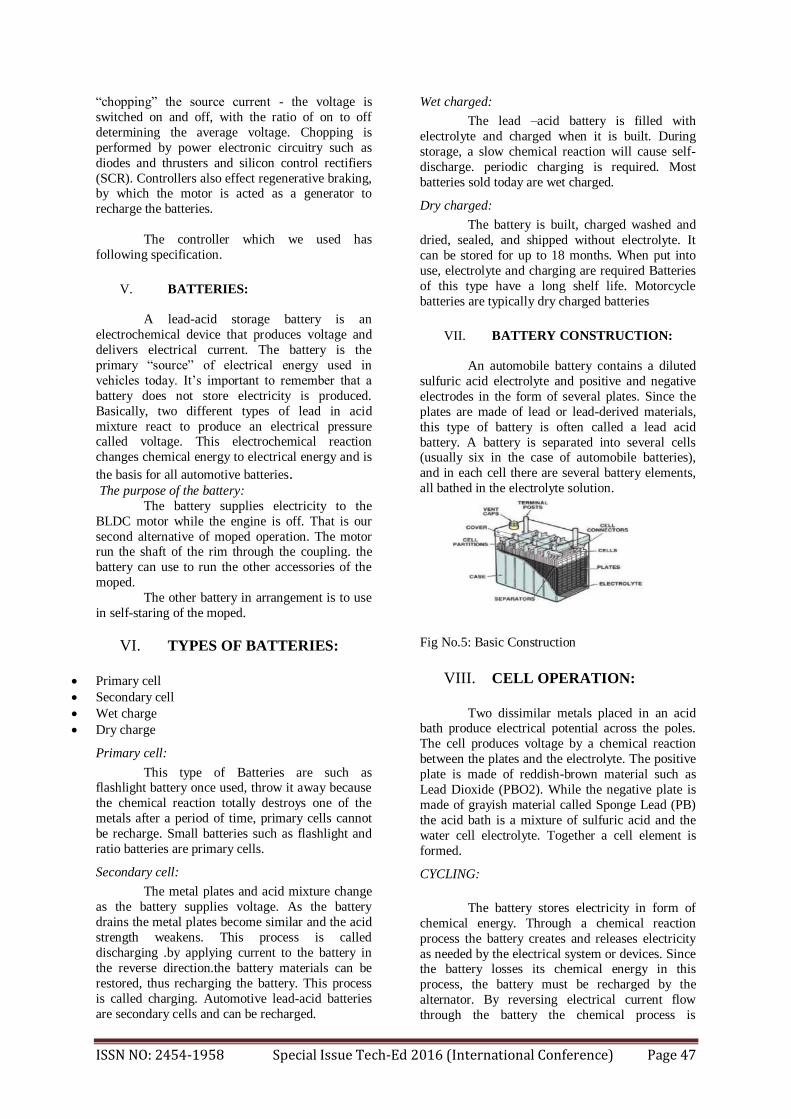
ISSN NO: 2454-1958 Special Issue Tech-Ed 2016 (International Conference) Page 47
“chopping” the source current - the voltage is
switched on and off, with the ratio of on to off
determining the average voltage. Chopping is
performed by power electronic circuitry such as
diodes and thrusters and silicon control rectifiers
(SCR). Controllers also effect regenerative braking, by which the motor is acted as a generator to
recharge the batteries.
The controller which we used has
following specification.
V. BATTERIES:
A lead-acid storage battery is an
electrochemical device that produces voltage and
delivers electrical current. The battery is the
primary “source” of electrical energy used in
vehicles today. It’s important to remember that a
battery does not store electricity is produced.
Basically, two different types of lead in acid
mixture react to produce an electrical pressure called voltage. This electrochemical reaction
changes chemical energy to electrical energy and is
the basis for all automotive batteries. The purpose of the battery:
The battery supplies electricity to the
BLDC motor while the engine is off. That is our
second alternative of moped operation. The motor run the shaft of the rim through the coupling. the
battery can use to run the other accessories of the
moped.
The other battery in arrangement is to use
in self-staring of the moped.
VI. TYPES OF BATTERIES:
Primary cell
Secondary cell
Wet charge
Dry charge
Primary cell:
This type of Batteries are such as flashlight battery once used, throw it away because
the chemical reaction totally destroys one of the
metals after a period of time, primary cells cannot
be recharge. Small batteries such as flashlight and
ratio batteries are primary cells.
Secondary cell:
The metal plates and acid mixture change
as the battery supplies voltage. As the battery
drains the metal plates become similar and the acid
strength weakens. This process is called
discharging .by applying current to the battery in
the reverse direction.the battery materials can be
restored, thus recharging the battery. This process
is called charging. Automotive lead-acid batteries
are secondary cells and can be recharged.
Wet charged:
The lead –acid battery is filled with
electrolyte and charged when it is built. During
storage, a slow chemical reaction will cause self-
discharge. periodic charging is required. Most
batteries sold today are wet charged.
Dry charged:
The battery is built, charged washed and
dried, sealed, and shipped without electrolyte. It
can be stored for up to 18 months. When put into
use, electrolyte and charging are required Batteries
of this type have a long shelf life. Motorcycle
batteries are typically dry charged batteries
VII. BATTERY CONSTRUCTION:
An automobile battery contains a diluted
sulfuric acid electrolyte and positive and negative
electrodes in the form of several plates. Since the
plates are made of lead or lead-derived materials,
this type of battery is often called a lead acid
battery. A battery is separated into several cells (usually six in the case of automobile batteries),
and in each cell there are several battery elements,
all bathed in the electrolyte solution.
Fig No.5: Basic Construction
VIII. CELL OPERATION:
Two dissimilar metals placed in an acid bath produce electrical potential across the poles.
The cell produces voltage by a chemical reaction
between the plates and the electrolyte. The positive
plate is made of reddish-brown material such as
Lead Dioxide (PBO2). While the negative plate is
made of grayish material called Sponge Lead (PB)
the acid bath is a mixture of sulfuric acid and the
water cell electrolyte. Together a cell element is
formed.
CYCLING:
The battery stores electricity in form of
chemical energy. Through a chemical reaction
process the battery creates and releases electricity
as needed by the electrical system or devices. Since the battery losses its chemical energy in this
process, the battery must be recharged by the
alternator. By reversing electrical current flow
through the battery the chemical process is

ISSN NO: 2454-1958 Special Issue Tech-Ed 2016 (International Conference) Page 48
reversed, thus charging the battery. The cycle of
discharging and charging is repeated continuously
and is called “battery”.
BATTERY CELL ELEMENT:
The key to the battery operation is the cell element.
Positive plates and negative plates are each
connected together by separate plate straps. These
groups of positive and negative plates are then
placed alternately, separated by micro-porous
separators. Assembled together, the plates and separators form a battery cell element. Grouping
the plates in this way serves to enlarge the surface
area between the active materials and the
electrolyte, thus allowing a greater amount of
electricity to be supplied. In other words, the
battery capacity is increased because of the
increase in the surface area. More plate surface area
means the battery can deliver more current.
PLATES:
Battery plates are constructed of a lead
alloy containing a percentage of either antimony or
calcium. The plates are designed as thin flat grid,
grids crossing at right angles {shown below} or
grids crossing diagonally at different angles which
reduce internal resistance. The grid provides the necessary framework for active materials to be
pasted on the plate, making either a positive or
negative plate. The active material on a charge
positive plate is a reddish brown Lead Di Oxide
[Pbo2] while the active material on a charge
negative plate is a grayish spongy lead.
Fig no 6:Battery Case
The battery case holds the electrolyte and the individual battery cell elements. It is divided
into six compartment or cells. The plates are raised
up off the bottom of the case with ribs to prevent
them from shorting out if any of the active
materials (lead, etc) should happen to fall from the plates. The case is made of polypropylene, hard
rubber, and plastic base materials. some battery
manufactures use translucent plastic cases which
allow checking electrolyte level without removing
vent caps. These cases often have “upper” and
“lower” electrolyte level markers on the outside of
the case.
VENT CAPS:
Vent caps cover the holes that are used for adding electrolyte. They are also designed to
separate the sulfuric acid mist and the hydrogen gas
that forms when the battery charges. The caps are
designed to the sulfuric acid mist to condense and
drop back into the battery and allow hydrogen gas to escape through the vent holes to the atmosphere.
Vent caps can cover each individual cell as shown
below.
Fig no 7:Vent caps
IX. SEVERAL BATTERY
MATERIAL AND THEIR
ADVANTAGES:
Several variations of the lead-acid battery are used today. Variation to the battery plate
material and electrolyte solution provides different
battery characteristics. Construction is basically the
same; however, the materials used are slightly different.
1. Lead Antimony:(Most commonly used)
Is commonly used in conventional lead acid battery which uses lead antimony cell plates
ADVANTAGES
1. Longer service life than Calcium batteries.
2. Easier to recharge when completely
discharged. 3. Lower cost.
2. Lead Calcium(AC Delco maintenance free batteries). Is a maintenance free lead acid battery
which uses lead calcium cell plates.
ADVANTAGES
1. Larger electrolyte reserve area above the
plates. 2. Higher Cold Cranking Amp ratings
3. Little or No maintenance 4. Recombination (Gel Cell)
Is a completely sealed lead acid battery which uses an electrolyte that in a gel (solid) rather
than a liquid.

ISSN NO: 2454-1958 Special Issue Tech-Ed 2016 (International Conference) Page 49
ADVANTAGES
1. No liquid electrolyte to spill or leak. 2. Can be Deep Cycled several time without
damage.
3. Totally corrosion and maintenance free.
4. Three to four times longer battery life than
regular batteries.
5. More plate surface and closer plate spacing
provides a compact case size.
X. FULL SPCIFICATION
OF KINE:
1. ENGINE, POWER AND TORQUE
Table 2
VARIABLS VALUE
Displacement 71.55cc
Maximum
power 4.2Bhp
Maximum
Torque 5.7Nm
Engine
Displacement
2 Stroke Single
cylinder
Cooling Air cooling
TRMISSION
Table 3
PART TYPE
Gearbox Automatic
3. BRKAES
Table 4
TYPE SIZE
Front Brake Drum 110 mm
Rear Brake Drum 110 mm
4. DIMENSION ,WEIGHT, CAPACITY
Table 5
PART SIZE
Overall Length 1740 mm
Overall Weight 640 mm
Overall Height 1076 mm
Wheel Base 1235 mm
Kerb /wet
Weight 86 kg
Fuel Tank
Capacity 4 liters
Front Tyre 3.00×10 inches
Rear Tyre 3.00×10 inches
Head Light 12v 25w/25w
This data is available from the manual of this product.
XI. DESIGN CRITERIA:
Some part is necessary to design, on the basis of the data available from the manual of the
moped and standard data book the value are taken
and their corresponding value is calculated.
Following part which are necessary to design.
(1) Design Procedure for shaft
Given Data
Torque on the Driving Shaft
=10N-m =10x103 N-mm
Total Load acting on the shaft
= 300 kg x 9.81
=2943 N
Total Length of driving shaft
= 0.125m = 125 mm
Design Procedure for Flange
: ˑ d = 10.66 mm
Method (II)
For Simply Supported Beam
=WL/4= 2943 x 0.125/4 M=91.96 N-mm
M=91. 96N.m = 91.96 x10³N-mm
M=𝜋/32 × 6b × d3
91.96 × 10 3/32 =3.14 x42 x d3
d = 28.14 mm
Coupling

ISSN NO: 2454-1958 Special Issue Tech-Ed 2016 (International Conference) Page 50
Given Data =
N = 5000 rpm motor
T = 10 N-m
Actual Diameter of Engine shaft,
d = 14mm (given) (a) P = 2 x N x T / 60 N-m
P = 5.235 KW
T = π/16 x s xτs x d3
10 x 103 = π /16
x=π
16τs x 143
τs=18.56 N/mm2
Outer diameter of Hub
D = 2d = 2 x 14 mm
= 28mm,30mm
But Actual outer diameter of hub
D = 122mm
So for given data our design is safe.
(b) Hub is hollow shaft for that shear
stress
T = π
16x τs x [
𝐷4−𝑑4
𝐷 ]
10 x 103=
π
16x τs x [
284−144
28 ]
τs =2.47 N/mm2
For actual diameter of engine shaft
d = 14 mm
Outer diameter of hub
d = 122 mm
Ts= 0.23 N/mm2
Form above given data design is safe.
(c)Desing For Flange
Thickness of Flange = 0.5d
Tf= 0.5 x 14 = 7mm
T=3.14 ×𝐷
2 𝜏𝑐 × 𝑡𝑓
10x103 =3.14 ×28
2 𝜏𝑐 × 7
𝜏𝑐 = 1.16 𝑁/𝑚𝑚2
(c) Design for Bolt
Given Data
𝜏𝑏 = 20 𝑁/𝑚𝑚2 No. Of bolts n=4
d1=Normal diameter of bolt .
D1 = Pitch circle diameter
D1= 3d= 3 x 14 = 42 mm
For stress
T= π
4x 𝑑2
1x τbx n x [𝐷1
2 ]
10x103=π
4x 𝑑2
1x 20x 4 x [42
2 ]
𝑑1=2.75mm Outer Diameter of Flange
D2 = 4d = 4 X 14 = 56mm
Thickness of the Protective Circumferential ·׃
Flange tp = 0.25 d
= 0.25 X 14 = 3.5mm = 5 mm
As our bolt actual diameter is 8 mm so our
design is safe.
(3) (1) Design Specification of Coupling
d =Diameter of Shaft = 14mm
D= outside Diameter of flange = 44mm
Thickness of flange = 4 mm
Allowable shear stress for shaft
=18.58 N/mm2
(1) Design specification for Bearing
Bearing No. 202
Bore = 15mm
Outer Diameter = 35mm
Width = 11mm
Bearing 203
Bore = 17mm
Outer Diameter = 40mm
Width = 12 mm
(4) Design Procedure for C- Clamp
Cross Section at X – X
A = b x t 40 x 5 = 200mm2 Consideration (I) = Direct tensile stress at x-x · ׃

ISSN NO: 2454-1958 Special Issue Tech-Ed 2016 (International Conference) Page 51
𝜎0= 𝑃
𝐴 =
2943
200
𝜎0 = 14.71 N/mm2
Behind moment at X-X due to the load P
M = P X e = 2943 X 17.5 M = 51502.5 N-mm
Section Modulus
Z= 𝑡 ×𝑏2
6 =
5 ×402
6
Z= 1333.33mm3
Behind stress at X-X
σb= M = 51502.5
Z 1333.33
σb = 38.62 N/mm2
Maximum tensile stress
= σ0 + σb
= 14.17 + 38.62
= 53.33 N/mm2 Consideration (II)
Bending moment at X-X due to the load P
M= P X e = 2943 X 77.5 M = 228.08 X 10³ N-mm
XII. CAD MODEL:
1) Motor:
2) Bearing:
3) Clamp:
4) Rim:
5) Rim disc:
Coupling:
I) Main Coupling
II) Large Coupling:
Assembly: Explode View
XIII. ADVANTAGE’S:
The range of an Electric bike increased.
The city traffic air and noise pollution is
decreased to a greater extent.
One third of energy is captured by
regenerative braking, which would otherwise go waste.
Decreased the dependency of fossil fuels.
XIV. DISADVANTAGE’S:
The initial cost of the vehicle is marginally
increased, compared to the conventionally
available.
The disposal of battery is to be properly
handed to avoid pollution.
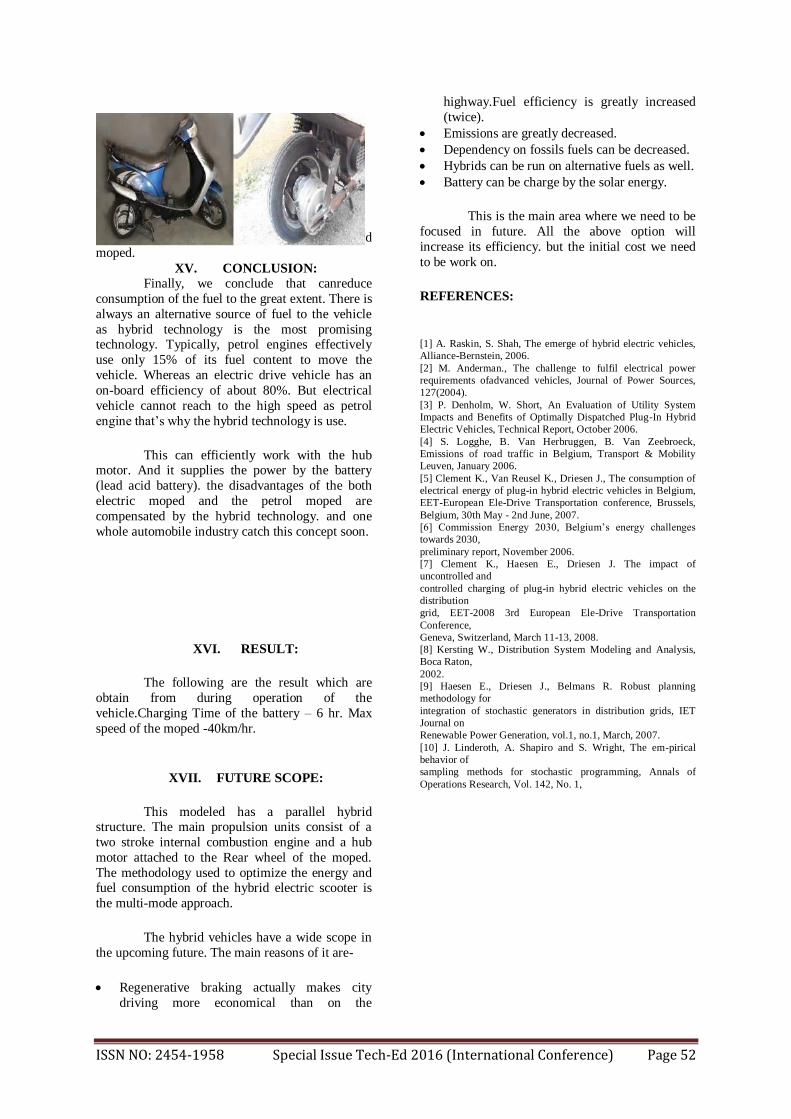
ISSN NO: 2454-1958 Special Issue Tech-Ed 2016 (International Conference) Page 52
Fig no. 8: Actual design and development of hybrid
moped.
XV. CONCLUSION:
Finally, we conclude that canreduce
consumption of the fuel to the great extent. There is
always an alternative source of fuel to the vehicle
as hybrid technology is the most promising technology. Typically, petrol engines effectively
use only 15% of its fuel content to move the
vehicle. Whereas an electric drive vehicle has an
on-board efficiency of about 80%. But electrical
vehicle cannot reach to the high speed as petrol
engine that’s why the hybrid technology is use.
This can efficiently work with the hub motor. And it supplies the power by the battery
(lead acid battery). the disadvantages of the both
electric moped and the petrol moped are
compensated by the hybrid technology. and one
whole automobile industry catch this concept soon.
XVI. RESULT:
The following are the result which are
obtain from during operation of the
vehicle.Charging Time of the battery – 6 hr. Max
speed of the moped -40km/hr.
XVII. FUTURE SCOPE:
This modeled has a parallel hybrid structure. The main propulsion units consist of a
two stroke internal combustion engine and a hub
motor attached to the Rear wheel of the moped.
The methodology used to optimize the energy and fuel consumption of the hybrid electric scooter is
the multi-mode approach.
The hybrid vehicles have a wide scope in
the upcoming future. The main reasons of it are-
Regenerative braking actually makes city
driving more economical than on the
highway.Fuel efficiency is greatly increased
(twice).
Emissions are greatly decreased.
Dependency on fossils fuels can be decreased.
Hybrids can be run on alternative fuels as well.
Battery can be charge by the solar energy.
This is the main area where we need to be
focused in future. All the above option will
increase its efficiency. but the initial cost we need
to be work on.
REFERENCES:
[1] A. Raskin, S. Shah, The emerge of hybrid electric vehicles,
Alliance-Bernstein, 2006.
[2] M. Anderman., The challenge to fulfil electrical power
requirements ofadvanced vehicles, Journal of Power Sources,
127(2004).
[3] P. Denholm, W. Short, An Evaluation of Utility System
Impacts and Benefits of Optimally Dispatched Plug-In Hybrid
Electric Vehicles, Technical Report, October 2006.
[4] S. Logghe, B. Van Herbruggen, B. Van Zeebroeck,
Emissions of road traffic in Belgium, Transport & Mobility
Leuven, January 2006.
[5] Clement K., Van Reusel K., Driesen J., The consumption of
electrical energy of plug-in hybrid electric vehicles in Belgium,
EET-European Ele-Drive Transportation conference, Brussels,
Belgium, 30th May - 2nd June, 2007.
[6] Commission Energy 2030, Belgium’s energy challenges
towards 2030,
preliminary report, November 2006.
[7] Clement K., Haesen E., Driesen J. The impact of
uncontrolled and
controlled charging of plug-in hybrid electric vehicles on the
distribution
grid, EET-2008 3rd European Ele-Drive Transportation
Conference,
Geneva, Switzerland, March 11-13, 2008.
[8] Kersting W., Distribution System Modeling and Analysis,
Boca Raton,
2002.
[9] Haesen E., Driesen J., Belmans R. Robust planning
methodology for
integration of stochastic generators in distribution grids, IET
Journal on
Renewable Power Generation, vol.1, no.1, March, 2007.
[10] J. Linderoth, A. Shapiro and S. Wright, The em-pirical
behavior of
sampling methods for stochastic programming, Annals of
Operations Research, Vol. 142, No. 1,

ISSN NO: 2454-1958 Special Issue Tech-Ed 2016 (International Conference) Page 53
Performance of Bullock Driven Tractors
S. B. Bakal Assistant Professor, department of Agricultural Engineering,
Shri Shivaji Agriculture College, Amravati
P.J.Nikam Associate Professor & Head, department of
Agricultural Engineering, Shri Shivaji Agriculture
College, Amravati
Abstract- Animal power does not get proper attention on the other
hand; these days may be poses maintenance burden on the animal
based farmers. However, on the other hand, one of the serious
problems in Indian agriculture caused by increased cost of
mechanical operations today is the extreme economic conditions
which have been forcing farmers to commit suicides in thousands.
A study was conducted in sandy soil at village Kharmanja
Kutubpur, Post Office – Lashkara, Dist – Haridwar (Uttaranchal),
and in black soil at Gram Khajuria, Dist – Indore, Village - Ugrani
Dist – Bhopal for Kamdhenu and Brahmpuri Bullock Driven
Tractors. Both bullock driven tractors are used for cultivation,
ploughing, and harrowing, sowing and inter-cultivation operations.
The desired depth and width of cutting soil were found for various
attachment of Plough, cultivator, ridger, Seed drill to bullock
driven tractor for black and sandy soil. For both types of the
tractors no difficulties were noticed and no stresses were found on
Bullock during operations. It is Easy to assemble and dissemble.
Any farmer can do it easily. No vibration, no noise, no maintenance
problems occurred. However, the two designs can learn from each
other and there is enough scope for improvements.
To make this technology more viable and popular among the
farmers it is necessary to adopt some improvements. The efficiency
of the BDT can be improved and can be made more acceptances in
the field.
Evaluating the two bullock drawn tractors on the basis of
their cost, working capacity, number of implements, it can be said
that the two types of tractor developed by Rajasthan Mechanical
Works Limited and Bhartiya Cattle Resource Development
Foundation are presently suitable for different conditions, may be
so designed and can become more promising by improving design
and learning from each other.
Keywords – Animal Power, cultivator, Plough, Ridger
INTRODUCTION
According to the 1972 census, (1976) the working animal
population in India was 80 million and the total cropped area
167 million hectares (www.indiastat.com). Thus on an average
one pair of working animals, i.e. bullock was available for
4.16 hectares of land. Management studies have shown that a
pair of bullocks can manage about 3 hectares farm. According
to Roy S.E. (1966) the maximum area of land which can be
cultivated by a pair of bullock, not only depends on the
efficiency of bullocks and the size of holding but also on
factors such as period available for cultivation, nature of soil,
crops grown and timeliness requirement of each operations
and transportation work. It is pertinent to state that there is a direct relation between energy inputs to crop production in
terms of output. The “tractorization” has grown at a rapid
space and about 2.5 lack tractors are being added annually to
the Indian farms to help farmer to supply energy for
conducting various farm operation and transport activities.
The tractors are suited for big size farms but farmers are not
aware with the bad effect of tractorization.
Regular use of tractor makes the soil hard and
compact and also reduces fertility and moisture content of the
soil. Due to the compacted layer of the soil beneath the earth
infiltration and percolation properties of the soil goes on
decreasing and so sufficient soil moisture is not available for the depth of deep rooted crops and there is no rise in water
table. For removing deep rooted weed and preparation of
smooth seed bed multi-paired bullock drawn M.B. plough is
used.
Considering these factors it was decided to undertake
an experiment to evaluate the performance of multi-paired
bullock drawn M.B. plough on the field over tractor drawn
M.B. plough.
MATERIALS AND METHODS
The experiment trials were conducted in light soil at Anwi,
Sawalapur, Dabhadi for multi-paired and Dhaga for tractor
drawn M.B. plough on 2000 m2 area. The trials were
conducted according to RNAM test codes. The parameters like
depth of operation (cm), operating speed (Km/ha), field
efficiency (%), H.P., cost of ploughing (Rs/ha) were evaluated
as per standard procedure mentioned below. The data was
used for comparing the performance of tractor operated M.B.
plough and multi-paired bullock drawn M.B. plough.
Table 1. General specification of tractor and bullocks used
throughout experiment.
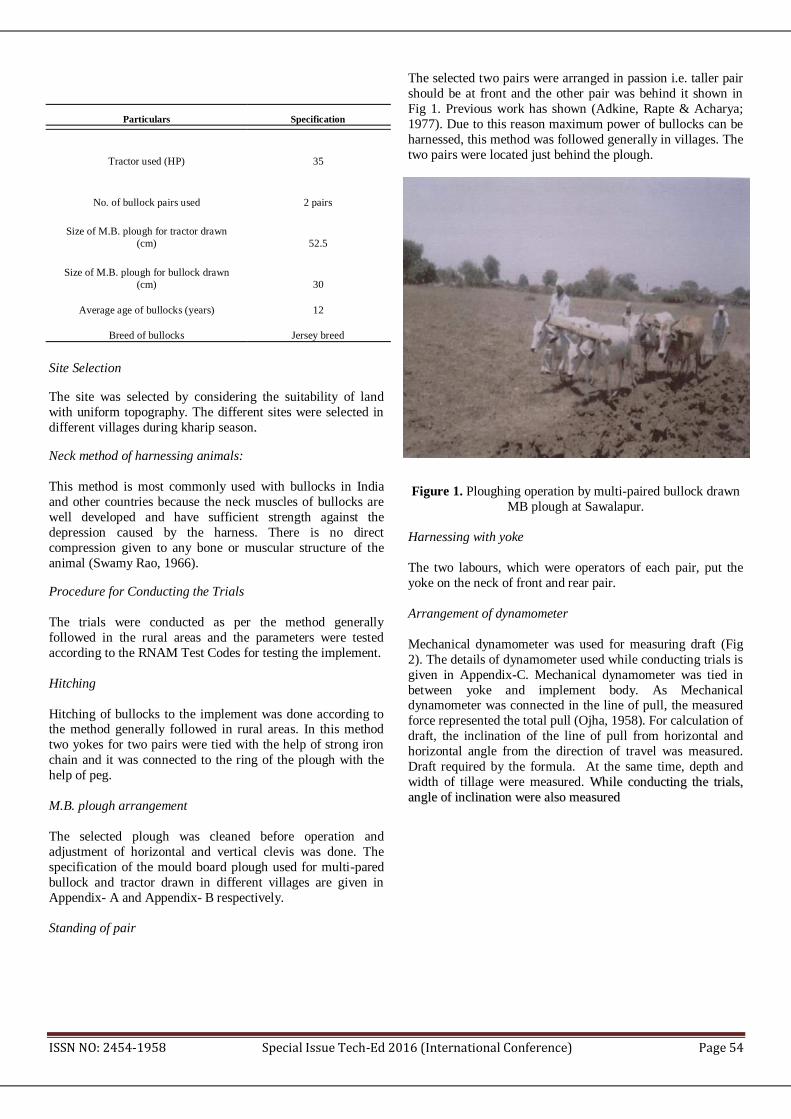
ISSN NO: 2454-1958 Special Issue Tech-Ed 2016 (International Conference) Page 54
Particulars Specification
Tractor used (HP) 35
No. of bullock pairs used 2 pairs
Size of M.B. plough for tractor drawn
(cm) 52.5
Size of M.B. plough for bullock drawn
(cm) 30
Average age of bullocks (years) 12
Breed of bullocks Jersey breed
Site Selection
The site was selected by considering the suitability of land
with uniform topography. The different sites were selected in
different villages during kharip season..
Neck method of harnessing animals:
This method is most commonly used with bullocks in India
and other countries because the neck muscles of bullocks are
well developed and have sufficient strength against the
depression caused by the harness. There is no direct
compression given to any bone or muscular structure of the
animal (Swamy Rao, 1966).
Procedure for Conducting the Trials
The trials were conducted as per the method generally
followed in the rural areas and the parameters were tested
according to the RNAM Test Codes for testing the implement.
Hitching
Hitching of bullocks to the implement was done according to the method generally followed in rural areas. In this method
two yokes for two pairs were tied with the help of strong iron
chain and it was connected to the ring of the plough with the
help of peg.
M.B. plough arrangement
The selected plough was cleaned before operation and
adjustment of horizontal and vertical clevis was done. The
specification of the mould board plough used for multi-pared
bullock and tractor drawn in different villages are given in
Appendix- A and Appendix- B respectively.
Standing of pair
The selected two pairs were arranged in passion i.e. taller pair
should be at front and the other pair was behind it shown in
Fig 1. Previous work has shown (Adkine, Rapte & Acharya;
1977). Due to this reason maximum power of bullocks can be
harnessed, this method was followed generally in villages. The
two pairs were located just behind the plough.
Figure 1. Ploughing operation by multi-paired bullock drawn
MB plough at Sawalapur.
Harnessing with yoke
The two labours, which were operators of each pair, put the
yoke on the neck of front and rear pair.
Arrangement of dynamometer
Mechanical dynamometer was used for measuring draft (Fig
2). The details of dynamometer used while conducting trials is
given in Appendix-C. Mechanical dynamometer was tied in
between yoke and implement body. As Mechanical dynamometer was connected in the line of pull, the measured
force represented the total pull (Ojha, 1958). For calculation of
draft, the inclination of the line of pull from horizontal and
horizontal angle from the direction of travel was measured.
Draft required by the formula. At the same time, depth and
width of tillage were measured. WWhhiillee ccoonndduuccttiinngg tthhee ttrriiaallss,,
aannggllee ooff iinncclliinnaattiioonn wweerree aallssoo mmeeaassuurreedd

ISSN NO: 2454-1958 Special Issue Tech-Ed 2016 (International Conference) Page 55
Figure 2 Dynamometer during ploughing operation of multi-
paired bullock drawn M.B. plough.
Depth of ploughing
While conducting the trials the depths of different locations
were measured by removing the disturb soil from the furrow.
Minimum five readings of depths were noted.
Width of ploughing
The width of ploughing was recorded at the place from where
depth was taken. The top widths and bottom widths were
measured by pushing the crown form on one side of
ploughing.
Pull
It is the total force required to pull an implement.
Dynamometer was used for measuring pull.
Draft
It is the horizontal component of pull, parallel to the line of
motion. It is calculated by following way
Cos P D
Where,
D = Draft in (kgf)
P = Pull in (kgf)
θ = Angle between line of pull and horizontal.
The angle θ in calculated as the mean angle between the rope
of front pair and rope of rear pair with horizontal.
2Cos PDraft 21
Where,
θ1 = Angle between the rope of front pair with
horizontal.
θ2 = Angle between the rope of rear pair with
horizontal.
Unit Draft
It is the draft per unit cross sectional area of the furrow. The cross sectional area of the furrow is computed by assuming the
furrow cross section triangular.
Therefore, Area of Trapezoidal section = ½ (Top width +
Bottom width) × Depth
Traveling speed
The traveling speed was computed with the help of stopwatch.
It is the distance covered by the bullocks and tractor in given
time.
Horse power
75
)(metre/sec Speed (kgf)in Draft hp Metric
Theoretical field capacity
It is the of field coverage of the implement based on 100
percent of time at the rated speed and covering 100 percent of
its rated width.
10000
36 )(metre/sec speed (cm)width capacity field lTheoretica
Effective field capacity or Actual field capacity
It is the actual area covered by the implement based on total
time consumed and its width.
Field efficiency
It is the ratio of effective field capacity and theoretical field
capacity expressed in percentage.
100capacity field lTheoretica
capacity field Effective efficiency Field
Soil Inversion Test
Weed and stubble count method suggested by
(Prasad & Misgara, 1981) was adopted to find out the soil
inversion. Randomly three plots of size 60 X 60 cm were
selected in the field. The no. of weed and stubble present in
each plot were measured before and after ploughing. The soil
inversion was then expressed on percentage basis.
100 testbefore weedsof No.
after test weedof No. - test before weedof No. inversion Soil
Soil Moisture
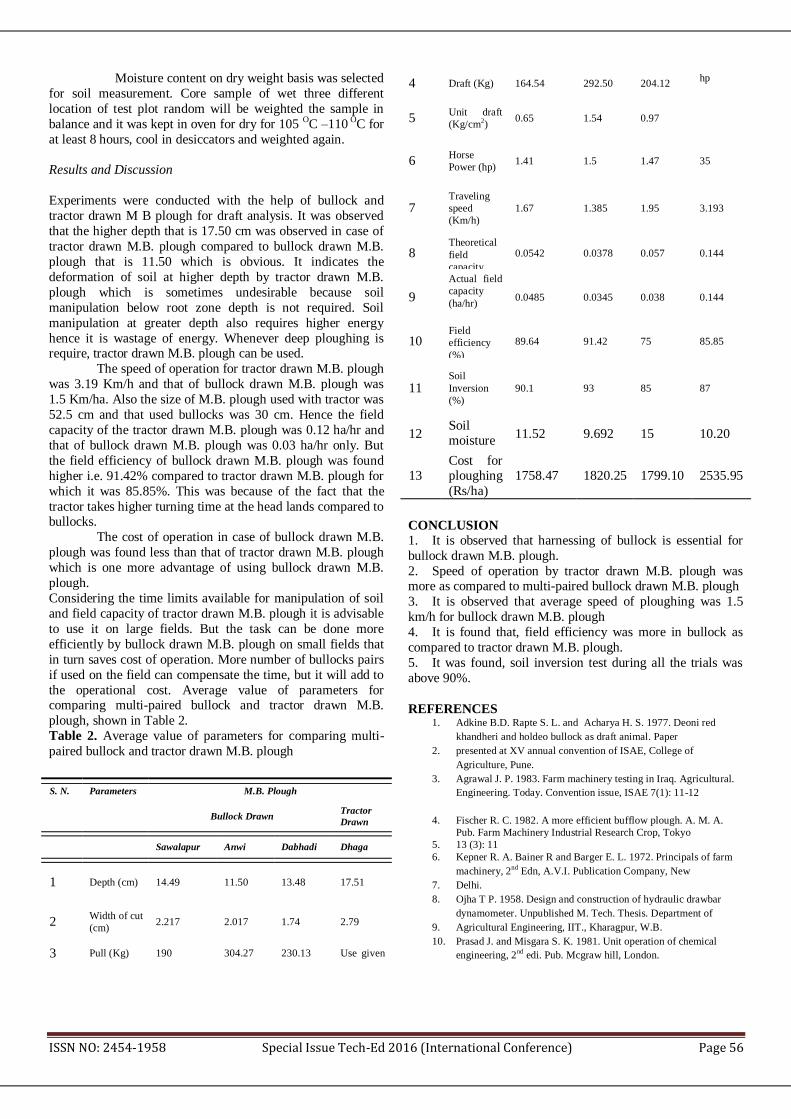
ISSN NO: 2454-1958 Special Issue Tech-Ed 2016 (International Conference) Page 56
Moisture content on dry weight basis was selected
for soil measurement. Core sample of wet three different
location of test plot random will be weighted the sample in
balance and it was kept in oven for dry for 105 OC –110 OC for
at least 8 hours, cool in desiccators and weighted again.
Results and Discussion
Experiments were conducted with the help of bullock and
tractor drawn M B plough for draft analysis. It was observed
that the higher depth that is 17.50 cm was observed in case of
tractor drawn M.B. plough compared to bullock drawn M.B.
plough that is 11.50 which is obvious. It indicates the
deformation of soil at higher depth by tractor drawn M.B.
plough which is sometimes undesirable because soil
manipulation below root zone depth is not required. Soil
manipulation at greater depth also requires higher energy
hence it is wastage of energy. Whenever deep ploughing is require, tractor drawn M.B. plough can be used.
The speed of operation for tractor drawn M.B. plough
was 3.19 Km/h and that of bullock drawn M.B. plough was
1.5 Km/ha. Also the size of M.B. plough used with tractor was
52.5 cm and that used bullocks was 30 cm. Hence the field
capacity of the tractor drawn M.B. plough was 0.12 ha/hr and
that of bullock drawn M.B. plough was 0.03 ha/hr only. But
the field efficiency of bullock drawn M.B. plough was found
higher i.e. 91.42% compared to tractor drawn M.B. plough for
which it was 85.85%. This was because of the fact that the
tractor takes higher turning time at the head lands compared to bullocks.
The cost of operation in case of bullock drawn M.B.
plough was found less than that of tractor drawn M.B. plough
which is one more advantage of using bullock drawn M.B.
plough.
Considering the time limits available for manipulation of soil
and field capacity of tractor drawn M.B. plough it is advisable
to use it on large fields. But the task can be done more
efficiently by bullock drawn M.B. plough on small fields that
in turn saves cost of operation. More number of bullocks pairs
if used on the field can compensate the time, but it will add to
the operational cost. Average value of parameters for comparing multi-paired bullock and tractor drawn M.B.
plough, shown in Table 2.
Table 2. Average value of parameters for comparing multi-
paired bullock and tractor drawn M.B. plough
S. N. Parameters M.B. Plough
Bullock Drawn Tractor
Drawn
Sawalapur Anwi Dabhadi Dhaga
1 Depth (cm) 14.49 11.50 13.48 17.51
2 Width of cut
(cm) 2.217 2.017 1.74 2.79
3 Pull (Kg) 190 304.27 230.13 Use given
4 Draft (Kg) 164.54 292.50 204.12 hp
5 Unit draft
(Kg/cm2)
0.65 1.54 0.97
6 Horse
Power (hp) 1.41 1.5 1.47 35
7 Traveling
speed
(Km/h)
1.67 1.385 1.95 3.193
8 Theoretical
field
capacity
0.0542 0.0378 0.057 0.144
9
Actual field
capacity
(ha/hr)
0.0485 0.0345 0.038 0.144
10 Field
efficiency
(%)
89.64 91.42 75 85.85
11 Soil
Inversion
(%)
90.1 93 85 87
12 Soil moisture
content
(%)
11.52 9.692 15 10.20
13 Cost for ploughing
(Rs/ha)
1758.47 1820.25 1799.10 2535.95
CONCLUSION
1. It is observed that harnessing of bullock is essential for
bullock drawn M.B. plough.
2. Speed of operation by tractor drawn M.B. plough was more as compared to multi-paired bullock drawn M.B. plough
3. It is observed that average speed of ploughing was 1.5
km/h for bullock drawn M.B. plough
4. It is found that, field efficiency was more in bullock as
compared to tractor drawn M.B. plough.
5. It was found, soil inversion test during all the trials was
above 90%.
REFERENCES 1. Adkine B.D. Rapte S. L. and Acharya H. S. 1977. Deoni red
khandheri and holdeo bullock as draft animal. Paper
2. presented at XV annual convention of ISAE, College of
Agriculture, Pune.
3. Agrawal J. P. 1983. Farm machinery testing in Iraq. Agricultural.
Engineering. Today. Convention issue, ISAE 7(1): 11-12
4. Fischer R. C. 1982. A more efficient bufflow plough. A. M. A.
Pub. Farm Machinery Industrial Research Crop, Tokyo
5. 13 (3): 11
6. Kepner R. A. Bainer R and Barger E. L. 1972. Principals of farm
machinery, 2nd
Edn, A.V.I. Publication Company, New
7. Delhi.
8. Ojha T P. 1958. Design and construction of hydraulic drawbar
dynamometer. Unpublished M. Tech. Thesis. Department of
9. Agricultural Engineering, IIT., Kharagpur, W.B.
10. Prasad J. and Misgara S. K. 1981. Unit operation of chemical
engineering, 2nd
edi. Pub. Mcgraw hill, London.

ISSN NO: 2454-1958 Special Issue Tech-Ed 2016 (International Conference) Page 57
11. Sarkar R. I. and Mosharaf H. 1981. Research and development
need for improved utilization of animal draft power in
Bangladesh. A.M. A.Pub.Farm Machinery Industrial Research
Corp. Tokyo, 612 (4): 86
12. Roy S. E. 1966. Source and nature of available power in India.
Agricultural Yearbook published by I.C.A.R. New Delhi.
13. Swamy Rao A A. 1966. Report on bullock harness research
project; Allahabad Agricultural Institute,Allahabad,India.
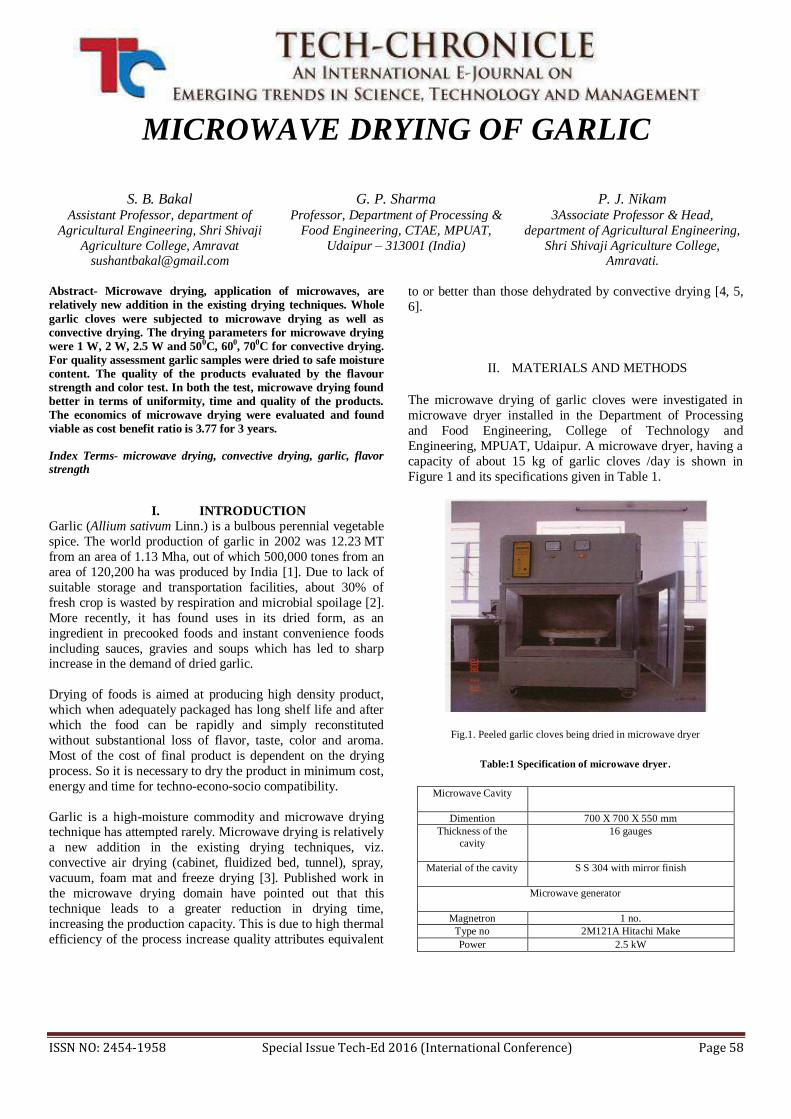
ISSN NO: 2454-1958 Special Issue Tech-Ed 2016 (International Conference) Page 58
MICROWAVE DRYING OF GARLIC
S. B. Bakal Assistant Professor, department of
Agricultural Engineering, Shri Shivaji
Agriculture College, Amravat [email protected]
G. P. Sharma Professor, Department of Processing &
Food Engineering, CTAE, MPUAT,
Udaipur – 313001 (India)
P. J. Nikam 3Associate Professor & Head,
department of Agricultural Engineering,
Shri Shivaji Agriculture College, Amravati.
Abstract- Microwave drying, application of microwaves, are
relatively new addition in the existing drying techniques. Whole
garlic cloves were subjected to microwave drying as well as
convective drying. The drying parameters for microwave drying
were 1 W, 2 W, 2.5 W and 500C, 60
0, 70
0C for convective drying.
For quality assessment garlic samples were dried to safe moisture
content. The quality of the products evaluated by the flavour
strength and color test. In both the test, microwave drying found
better in terms of uniformity, time and quality of the products.
The economics of microwave drying were evaluated and found
viable as cost benefit ratio is 3.77 for 3 years.
Index Terms- microwave drying, convective drying, garlic, flavor strength
I. INTRODUCTION
Garlic (Allium sativum Linn.) is a bulbous perennial vegetable
spice. The world production of garlic in 2002 was 12.23 MT
from an area of 1.13 Mha, out of which 500,000 tones from an
area of 120,200 ha was produced by India [1]. Due to lack of
suitable storage and transportation facilities, about 30% of
fresh crop is wasted by respiration and microbial spoilage [2].
More recently, it has found uses in its dried form, as an
ingredient in precooked foods and instant convenience foods
including sauces, gravies and soups which has led to sharp increase in the demand of dried garlic.
Drying of foods is aimed at producing high density product,
which when adequately packaged has long shelf life and after
which the food can be rapidly and simply reconstituted
without substantional loss of flavor, taste, color and aroma.
Most of the cost of final product is dependent on the drying
process. So it is necessary to dry the product in minimum cost,
energy and time for techno-econo-socio compatibility.
Garlic is a high-moisture commodity and microwave drying technique has attempted rarely. Microwave drying is relatively
a new addition in the existing drying techniques, viz.
convective air drying (cabinet, fluidized bed, tunnel), spray,
vacuum, foam mat and freeze drying [3]. Published work in
the microwave drying domain have pointed out that this
technique leads to a greater reduction in drying time,
increasing the production capacity. This is due to high thermal
efficiency of the process increase quality attributes equivalent
to or better than those dehydrated by convective drying [4, 5,
6].
II. MATERIALS AND METHODS
The microwave drying of garlic cloves were investigated in
microwave dryer installed in the Department of Processing
and Food Engineering, College of Technology and
Engineering, MPUAT, Udaipur. A microwave dryer, having a
capacity of about 15 kg of garlic cloves /day is shown in
Figure 1 and its specifications given in Table 1.
Fig.1. Peeled garlic cloves being dried in microwave dryer
Table:1 Specification of microwave dryer.
Microwave Cavity
Dimention 700 X 700 X 550 mm
Thickness of the
cavity
16 gauges
Material of the cavity S S 304 with mirror finish
Microwave generator
Magnetron 1 no.
Type no 2M121A Hitachi Make
Power 2.5 kW
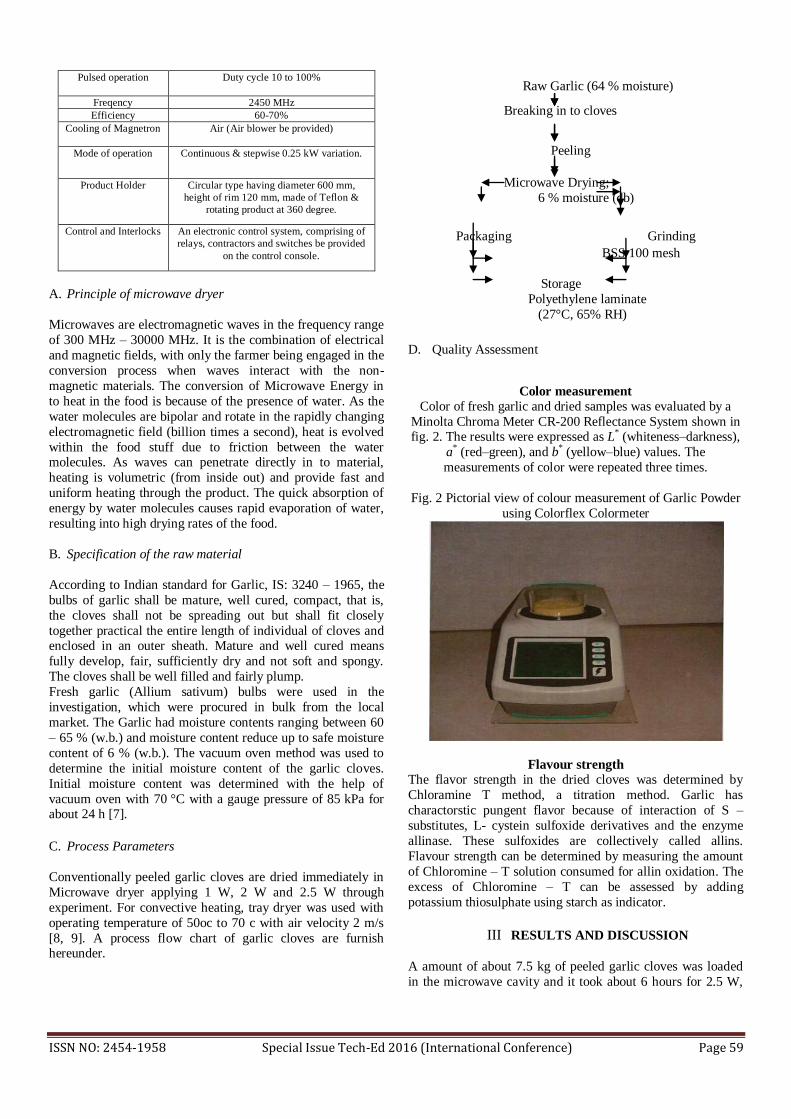
ISSN NO: 2454-1958 Special Issue Tech-Ed 2016 (International Conference) Page 59
Pulsed operation Duty cycle 10 to 100%
Freqency 2450 MHz
Efficiency 60-70%
Cooling of Magnetron Air (Air blower be provided)
Mode of operation Continuous & stepwise 0.25 kW variation.
Product Holder Circular type having diameter 600 mm,
height of rim 120 mm, made of Teflon &
rotating product at 360 degree.
Control and Interlocks An electronic control system, comprising of
relays, contractors and switches be provided
on the control console.
A. Principle of microwave dryer
Microwaves are electromagnetic waves in the frequency range
of 300 MHz – 30000 MHz. It is the combination of electrical
and magnetic fields, with only the farmer being engaged in the
conversion process when waves interact with the non-
magnetic materials. The conversion of Microwave Energy in
to heat in the food is because of the presence of water. As the
water molecules are bipolar and rotate in the rapidly changing
electromagnetic field (billion times a second), heat is evolved
within the food stuff due to friction between the water molecules. As waves can penetrate directly in to material,
heating is volumetric (from inside out) and provide fast and
uniform heating through the product. The quick absorption of
energy by water molecules causes rapid evaporation of water,
resulting into high drying rates of the food.
B. Specification of the raw material
According to Indian standard for Garlic, IS: 3240 – 1965, the
bulbs of garlic shall be mature, well cured, compact, that is,
the cloves shall not be spreading out but shall fit closely
together practical the entire length of individual of cloves and enclosed in an outer sheath. Mature and well cured means
fully develop, fair, sufficiently dry and not soft and spongy.
The cloves shall be well filled and fairly plump.
Fresh garlic (Allium sativum) bulbs were used in the
investigation, which were procured in bulk from the local
market. The Garlic had moisture contents ranging between 60
– 65 % (w.b.) and moisture content reduce up to safe moisture
content of 6 % (w.b.). The vacuum oven method was used to
determine the initial moisture content of the garlic cloves.
Initial moisture content was determined with the help of
vacuum oven with 70 °C with a gauge pressure of 85 kPa for about 24 h [7].
C. Process Parameters
Conventionally peeled garlic cloves are dried immediately in
Microwave dryer applying 1 W, 2 W and 2.5 W through
experiment. For convective heating, tray dryer was used with
operating temperature of 50oc to 70 c with air velocity 2 m/s
[8, 9]. A process flow chart of garlic cloves are furnish hereunder.
Raw Garlic (64 % moisture)
Breaking in to cloves
Peeling
Microwave Drying;
6 % moisture (db)
Packaging Grinding
BSS 100 mesh
Storage
Polyethylene laminate
(27°C, 65% RH)
D. Quality Assessment
Color measurement
Color of fresh garlic and dried samples was evaluated by a
Minolta Chroma Meter CR-200 Reflectance System shown in fig. 2. The results were expressed as L* (whiteness–darkness),
a* (red–green), and b* (yellow–blue) values. The
measurements of color were repeated three times.
Fig. 2 Pictorial view of colour measurement of Garlic Powder
using Colorflex Colormeter
Flavour strength
The flavor strength in the dried cloves was determined by
Chloramine T method, a titration method. Garlic has
charactorstic pungent flavor because of interaction of S –
substitutes, L- cystein sulfoxide derivatives and the enzyme
allinase. These sulfoxides are collectively called allins.
Flavour strength can be determined by measuring the amount
of Chloromine – T solution consumed for allin oxidation. The
excess of Chloromine – T can be assessed by adding
potassium thiosulphate using starch as indicator.
III RESULTS AND DISCUSSION
A amount of about 7.5 kg of peeled garlic cloves was loaded
in the microwave cavity and it took about 6 hours for 2.5 W,
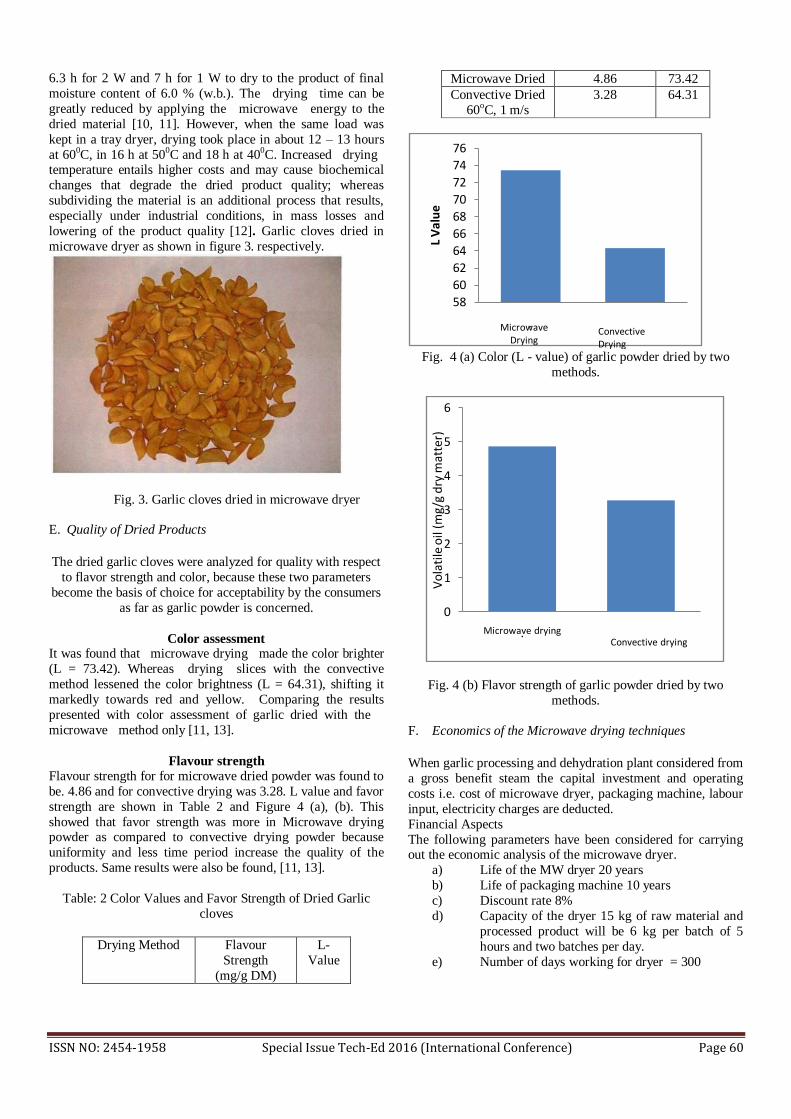
ISSN NO: 2454-1958 Special Issue Tech-Ed 2016 (International Conference) Page 60
6.3 h for 2 W and 7 h for 1 W to dry to the product of final
moisture content of 6.0 % (w.b.). The drying time can be
greatly reduced by applying the microwave energy to the
dried material [10, 11]. However, when the same load was
kept in a tray dryer, drying took place in about 12 – 13 hours
at 600C, in 16 h at 500C and 18 h at 400C. Increased drying temperature entails higher costs and may cause biochemical
changes that degrade the dried product quality; whereas
subdividing the material is an additional process that results,
especially under industrial conditions, in mass losses and
lowering of the product quality [12]. Garlic cloves dried in
microwave dryer as shown in figure 3. respectively.
Fig. 3. Garlic cloves dried in microwave dryer
E. Quality of Dried Products
The dried garlic cloves were analyzed for quality with respect
to flavor strength and color, because these two parameters
become the basis of choice for acceptability by the consumers
as far as garlic powder is concerned.
Color assessment It was found that microwave drying made the color brighter
(L = 73.42). Whereas drying slices with the convective
method lessened the color brightness (L = 64.31), shifting it
markedly towards red and yellow. Comparing the results
presented with color assessment of garlic dried with the
microwave method only [11, 13].
Flavour strength
Flavour strength for for microwave dried powder was found to
be. 4.86 and for convective drying was 3.28. L value and favor
strength are shown in Table 2 and Figure 4 (a), (b). This
showed that favor strength was more in Microwave drying powder as compared to convective drying powder because
uniformity and less time period increase the quality of the
products. Same results were also be found, [11, 13].
Table: 2 Color Values and Favor Strength of Dried Garlic
cloves
Drying Method Flavour
Strength
(mg/g DM)
L-
Value
Microwave Dried 4.86 73.42
Convective Dried
60oC, 1 m/s
3.28 64.31
Fig. 4 (a) Color (L - value) of garlic powder dried by two
methods.
Fig. 4 (b) Flavor strength of garlic powder dried by two
methods.
F. Economics of the Microwave drying techniques
When garlic processing and dehydration plant considered from
a gross benefit steam the capital investment and operating
costs i.e. cost of microwave dryer, packaging machine, labour
input, electricity charges are deducted.
Financial Aspects
The following parameters have been considered for carrying out the economic analysis of the microwave dryer.
a) Life of the MW dryer 20 years
b) Life of packaging machine 10 years
c) Discount rate 8%
d) Capacity of the dryer 15 kg of raw material and
processed product will be 6 kg per batch of 5
hours and two batches per day.
e) Number of days working for dryer = 300
58
60
62
64
66
68
70
72
74
76
.
L V
alu
e
Microwave Drying
Convective Drying
0
1
2
3
4
5
6
.
Vo
lati
le o
il (m
g/g
dry
mat
ter)
Microwave dryingConvective drying
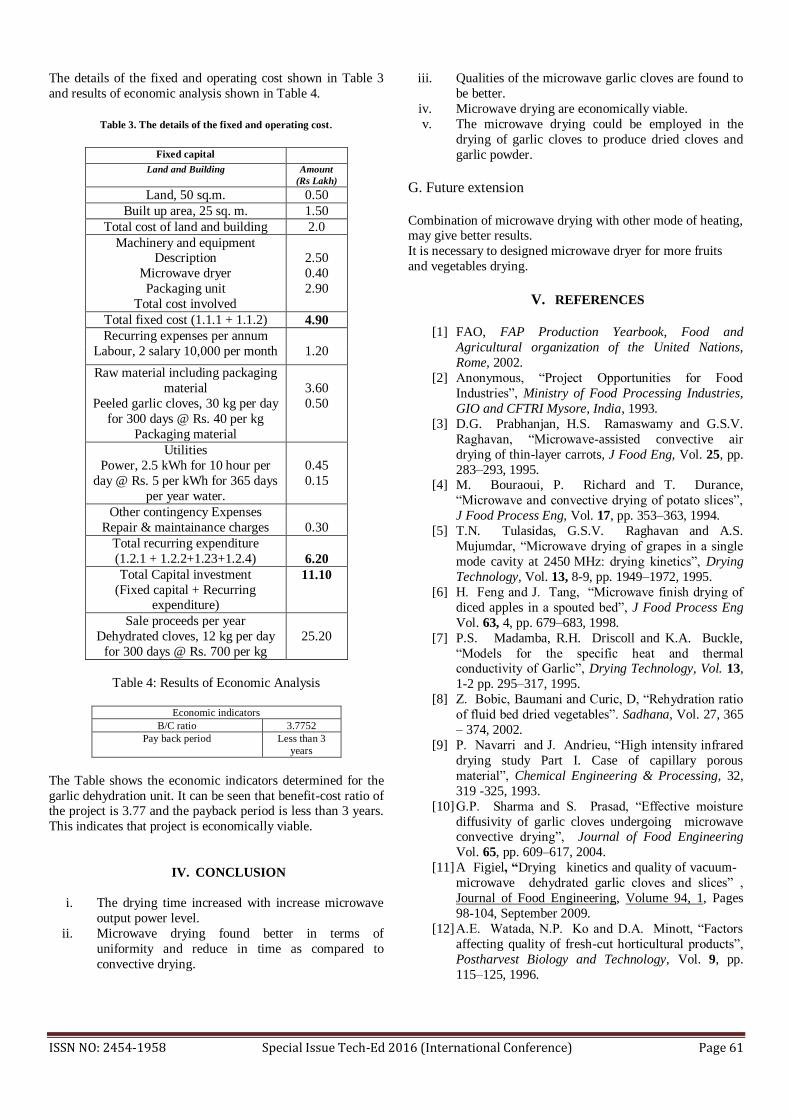
ISSN NO: 2454-1958 Special Issue Tech-Ed 2016 (International Conference) Page 61
The details of the fixed and operating cost shown in Table 3
and results of economic analysis shown in Table 4.
Table 3. The details of the fixed and operating cost.
Fixed capital
Land and Building Amount
(Rs Lakh)
Land, 50 sq.m. 0.50
Built up area, 25 sq. m. 1.50
Total cost of land and building 2.0
Machinery and equipment Description
Microwave dryer
Packaging unit
Total cost involved
2.50
0.40
2.90
Total fixed cost (1.1.1 + 1.1.2) 4.90
Recurring expenses per annum
Labour, 2 salary 10,000 per month
1.20
Raw material including packaging
material
Peeled garlic cloves, 30 kg per day
for 300 days @ Rs. 40 per kg
Packaging material
3.60
0.50
Utilities
Power, 2.5 kWh for 10 hour per
day @ Rs. 5 per kWh for 365 days
per year water.
0.45
0.15
Other contingency Expenses
Repair & maintainance charges
0.30
Total recurring expenditure
(1.2.1 + 1.2.2+1.23+1.2.4)
6.20
Total Capital investment
(Fixed capital + Recurring expenditure)
11.10
Sale proceeds per year
Dehydrated cloves, 12 kg per day
for 300 days @ Rs. 700 per kg
25.20
Table 4: Results of Economic Analysis
Economic indicators
B/C ratio 3.7752
Pay back period Less than 3
years
The Table shows the economic indicators determined for the
garlic dehydration unit. It can be seen that benefit-cost ratio of the project is 3.77 and the payback period is less than 3 years.
This indicates that project is economically viable.
IV. CONCLUSION
i. The drying time increased with increase microwave
output power level.
ii. Microwave drying found better in terms of
uniformity and reduce in time as compared to
convective drying.
iii. Qualities of the microwave garlic cloves are found to
be better.
iv. Microwave drying are economically viable.
v. The microwave drying could be employed in the
drying of garlic cloves to produce dried cloves and
garlic powder.
G. Future extension
Combination of microwave drying with other mode of heating, may give better results.
It is necessary to designed microwave dryer for more fruits
and vegetables drying.
V. REFERENCES
[1] FAO, FAP Production Yearbook, Food and
Agricultural organization of the United Nations,
Rome, 2002.
[2] Anonymous, “Project Opportunities for Food
Industries”, Ministry of Food Processing Industries,
GIO and CFTRI Mysore, India, 1993.
[3] D.G. Prabhanjan, H.S. Ramaswamy and G.S.V.
Raghavan, “Microwave-assisted convective air
drying of thin-layer carrots, J Food Eng, Vol. 25, pp.
283–293, 1995. [4] M. Bouraoui, P. Richard and T. Durance,
“Microwave and convective drying of potato slices”,
J Food Process Eng, Vol. 17, pp. 353–363, 1994.
[5] T.N. Tulasidas, G.S.V. Raghavan and A.S.
Mujumdar, “Microwave drying of grapes in a single
mode cavity at 2450 MHz: drying kinetics”, Drying
Technology, Vol. 13, 8-9, pp. 1949–1972, 1995.
[6] H. Feng and J. Tang, “Microwave finish drying of
diced apples in a spouted bed”, J Food Process Eng
Vol. 63, 4, pp. 679–683, 1998.
[7] P.S. Madamba, R.H. Driscoll and K.A. Buckle,
“Models for the specific heat and thermal conductivity of Garlic”, Drying Technology, Vol. 13,
1-2 pp. 295–317, 1995.
[8] Z. Bobic, Baumani and Curic, D, “Rehydration ratio
of fluid bed dried vegetables”. Sadhana, Vol. 27, 365
– 374, 2002.
[9] P. Navarri and J. Andrieu, “High intensity infrared
drying study Part I. Case of capillary porous
material”, Chemical Engineering & Processing, 32,
319 -325, 1993.
[10] G.P. Sharma and S. Prasad, “Effective moisture
diffusivity of garlic cloves undergoing microwave convective drying”, Journal of Food Engineering
Vol. 65, pp. 609–617, 2004.
[11] A Figiel, “Drying kinetics and quality of vacuum-
microwave dehydrated garlic cloves and slices” ,
Journal of Food Engineering, Volume 94, 1, Pages
98-104, September 2009.
[12] A.E. Watada, N.P. Ko and D.A. Minott, “Factors
affecting quality of fresh-cut horticultural products”,
Postharvest Biology and Technology, Vol. 9, pp.
115–125, 1996.

ISSN NO: 2454-1958 Special Issue Tech-Ed 2016 (International Conference) Page 62
[13] G.P. Sharma and S. Prasad, “Drying of garlic
(Allium sativum) cloves by microwave-hot air
combination”, J Food Engineering, Vol 50, pp. 99–
105, 2001.

ISSN NO: 2454-1958 Special Issue Tech-Ed 2016 (International Conference) Page 63
Fig 1.Nerve fiber taking the signal from skin or muscles to brain
Fig 2.Anatomical Model for recording of EMG Signal.
Diagnosis of Neuromuscular Disorder using EMG
Signal and neural network Syed Irfan Ali
Department of Electronics and Communication Engg.
PIET
Nagpur, India
[email protected] and 9860492850
Sunita Parihar Department of Electronics and Communication Engg.
PIET
Nagpur, India
[email protected] and 9422506546
Deepak Kapgate Department of Electronics and Communication Engg.
PIET
Nagpur, India
[email protected] and 9049996103
Syed Akbar Ali Department of Electronics and Telecomm. Engg.
ACET
Nagpur, India
[email protected] and 8855093867
Abstract—EMG Signal classification has become the area of
interest for the researchers since past years. Electromyography is
a technique which plays an important role in diagnosing
neuromuscular disorders in the field of biomedical engineering.
Multiple methods have been proposed for the classification of
EMG signals. But the scholars are focusing on neural network
due to its classification accuracy and Motor Unit Action Potential
(MUAP) as a feature of classification to the neural network.
This paper explores an approach for processing
the EMG signal and its classification based on Artificial Neural
Network (ANN) whereas Discrete Wavelet Transform (DWT) as
a tool for classification of neuromuscular disorder. In this work a
multilayer feed forward neural network with back propagation
algorithm is used to train the Neural Network. For achieving
maximum efficiency Back Propagation Algorithm (BPA) with
Discrete Wavelet Transform (DWT) is used to classify the
Neurological and Neuromuscular Disorders. This work explores
a comparison between k-Nearest Neighbours (kNN) classifier and
Feed Forward Neural Network (fNN).
Keywords—Electromyography (EMG); Artificial neural
network (ANN);Motor unit Action Potential (MUAP); Amyotrophic
Lateral Sclerosis (ALS); k-Nearest Neighbors (kNN);Discrete
wavelet transform (DWT); feed forward neural network (fNN)
I. INTRODUCTION
Human body generates a set of electrical signals as a function of time. Electromyography evaluates and records electrical variations of skeletal muscles with time. Our interest is to make a tool for diagnosing neuromuscular disorders. The neurons that connect muscles and brain surface i.e. grey matter generates electrical signals to and fro ash shown in figure 1. These neuron fibers actually take the signal from brain to
muscle or skin and from muscle to brain, thereby control the muscle movements.
Multiple types of electrodes are available for recording of EMG signal. Needle Electrode is used to read muscle EMG signal and Surface Electrode is used to read skin EMG signal.
For this research, a 25 mm Needle Type Electrode is suitable under hygienic clinical environment to read potential of motor nerve. This is called as Motor Unit Action Potential or MUAP. These signals are generated by muscles and goes to Central
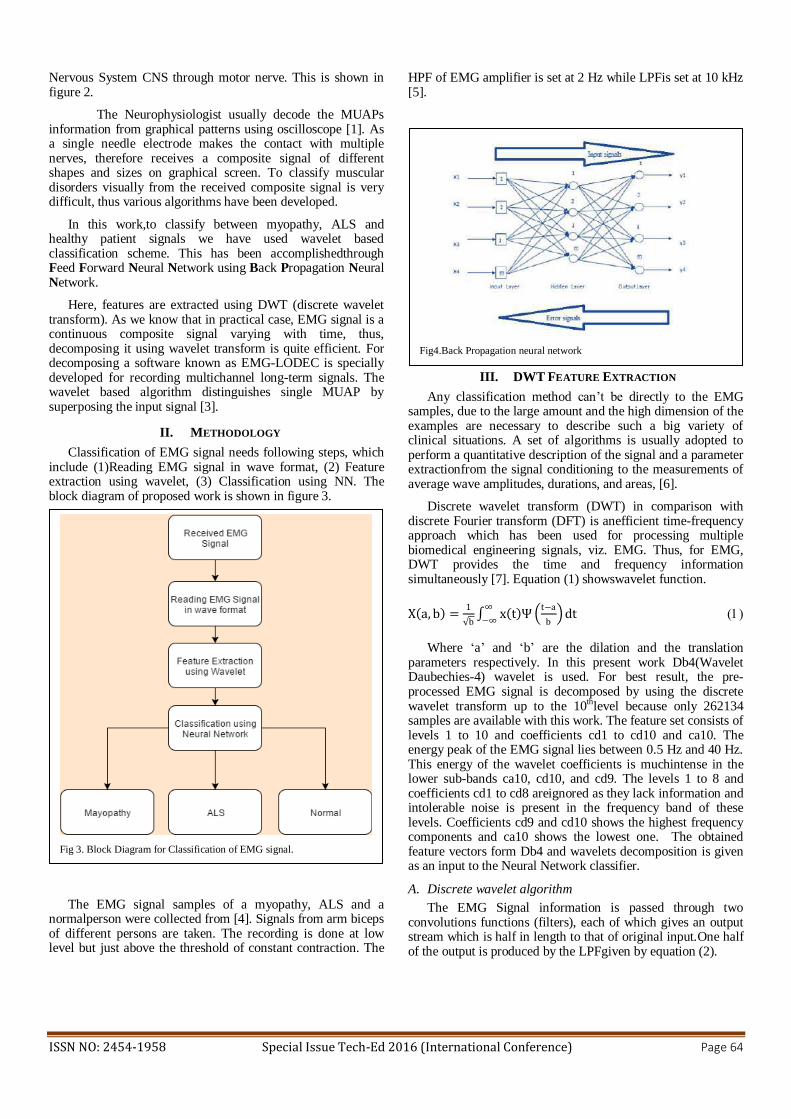
ISSN NO: 2454-1958 Special Issue Tech-Ed 2016 (International Conference) Page 64
Fig 3. Block Diagram for Classification of EMG signal.
Fig4.Back Propagation neural network
Nervous System CNS through motor nerve. This is shown in figure 2.
The Neurophysiologist usually decode the MUAPs information from graphical patterns using oscilloscope [1]. As a single needle electrode makes the contact with multiple nerves, therefore receives a composite signal of different shapes and sizes on graphical screen. To classify muscular disorders visually from the received composite signal is very difficult, thus various algorithms have been developed.
In this work,to classify between myopathy, ALS and healthy patient signals we have used wavelet based classification scheme. This has been accomplishedthrough Feed Forward Neural Network using Back Propagation Neural Network.
Here, features are extracted using DWT (discrete wavelet transform). As we know that in practical case, EMG signal is a continuous composite signal varying with time, thus, decomposing it using wavelet transform is quite efficient. For decomposing a software known as EMG-LODEC is specially developed for recording multichannel long-term signals. The wavelet based algorithm distinguishes single MUAP by superposing the input signal [3].
II. METHODOLOGY
Classification of EMG signal needs following steps, which include (1)Reading EMG signal in wave format, (2) Feature extraction using wavelet, (3) Classification using NN. The block diagram of proposed work is shown in figure 3.
The EMG signal samples of a myopathy, ALS and a normalperson were collected from [4]. Signals from arm biceps of different persons are taken. The recording is done at low level but just above the threshold of constant contraction. The
HPF of EMG amplifier is set at 2 Hz while LPFis set at 10 kHz [5].
III. DWT FEATURE EXTRACTION
Any classification method can‟t be directly to the EMG samples, due to the large amount and the high dimension of the examples are necessary to describe such a big variety of clinical situations. A set of algorithms is usually adopted to perform a quantitative description of the signal and a parameter extractionfrom the signal conditioning to the measurements of average wave amplitudes, durations, and areas, [6].
Discrete wavelet transform (DWT) in comparison with discrete Fourier transform (DFT) is anefficient time-frequency approach which has been used for processing multiple biomedical engineering signals, viz. EMG. Thus, for EMG, DWT provides the time and frequency information simultaneously [7]. Equation (1) showswavelet function.
X a, b =1
b x t Ψ
t−a
b dt
∞
−∞
Where „a‟ and „b‟ are the dilation and the translation parameters respectively. In this present work Db4(Wavelet Daubechies-4) wavelet is used. For best result, the pre-processed EMG signal is decomposed by using the discrete wavelet transform up to the 10thlevel because only 262134 samples are available with this work. The feature set consists of levels 1 to 10 and coefficients cd1 to cd10 and ca10. The energy peak of the EMG signal lies between 0.5 Hz and 40 Hz. This energy of the wavelet coefficients is muchintense in the lower sub-bands ca10, cd10, and cd9. The levels 1 to 8 and coefficients cd1 to cd8 areignored as they lack information and intolerable noise is present in the frequency band of these levels. Coefficients cd9 and cd10 shows the highest frequency components and ca10 shows the lowest one. The obtained feature vectors form Db4 and wavelets decomposition is given as an input to the Neural Network classifier.
A. Discrete wavelet algorithm
The EMG Signal information is passed through two convolutions functions (filters), each of which gives an output stream which is half in length to that of original input.One half of the output is produced by the LPFgiven by equation (2).
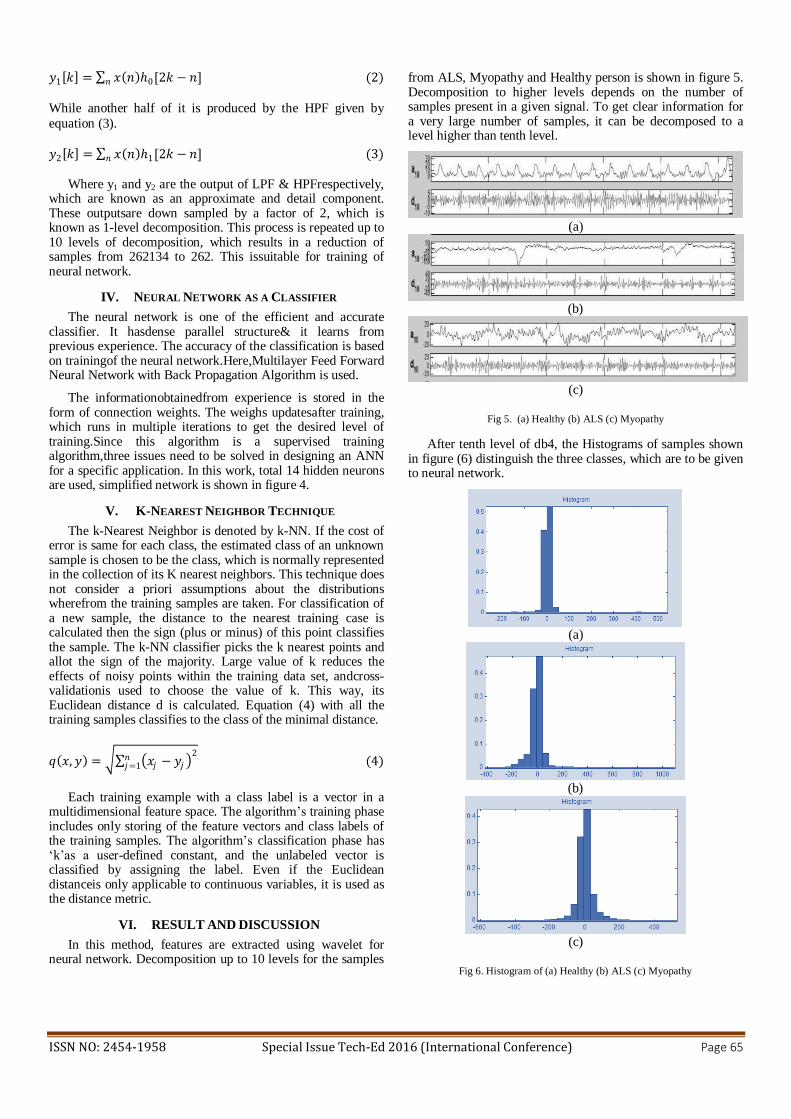
ISSN NO: 2454-1958 Special Issue Tech-Ed 2016 (International Conference) Page 65
𝑦1 𝑘 = 𝑥 𝑛 ℎ0[2𝑘 − 𝑛]𝑛 (2)
While another half of it is produced by the HPF given by
equation (3).
𝑦2 𝑘 = 𝑥 𝑛 ℎ1[2𝑘 − 𝑛]𝑛 (3)
Where y1 and y2 are the output of LPF & HPFrespectively, which are known as an approximate and detail component. These outputsare down sampled by a factor of 2, which is known as 1-level decomposition. This process is repeated up to 10 levels of decomposition, which results in a reduction of samples from 262134 to 262. This issuitable for training of neural network.
IV. NEURAL NETWORK AS A CLASSIFIER
The neural network is one of the efficient and accurate classifier. It hasdense parallel structure& it learns from previous experience. The accuracy of the classification is based on trainingof the neural network.Here,Multilayer Feed Forward Neural Network with Back Propagation Algorithm is used.
The informationobtainedfrom experience is stored in the form of connection weights. The weighs updatesafter training, which runs in multiple iterations to get the desired level of training.Since this algorithm is a supervised training algorithm,three issues need to be solved in designing an ANN for a specific application. In this work, total 14 hidden neurons are used, simplified network is shown in figure 4.
V. K-NEAREST NEIGHBOR TECHNIQUE
The k-Nearest Neighbor is denoted by k-NN. If the cost of error is same for each class, the estimated class of an unknown sample is chosen to be the class, which is normally represented in the collection of its K nearest neighbors. This technique does not consider a priori assumptions about the distributions wherefrom the training samples are taken. For classification of a new sample, the distance to the nearest training case is calculated then the sign (plus or minus) of this point classifies the sample. The k-NN classifier picks the k nearest points and allot the sign of the majority. Large value of k reduces the effects of noisy points within the training data set, andcross-validationis used to choose the value of k. This way, its Euclidean distance d is calculated. Equation (4) with all the training samples classifies to the class of the minimal distance.
𝑞 𝑥, 𝑦 = 𝑥𝑗 − 𝑦𝑗 2𝑛
𝑗=1 (4)
Each training example with a class label is a vector in a multidimensional feature space. The algorithm‟s training phase includes only storing of the feature vectors and class labels of the training samples. The algorithm‟s classification phase has „k‟as a user-defined constant, and the unlabeled vector is classified by assigning the label. Even if the Euclidean distanceis only applicable to continuous variables, it is used as the distance metric.
VI. RESULT AND DISCUSSION
In this method, features are extracted using wavelet for neural network. Decomposition up to 10 levels for the samples
from ALS, Myopathy and Healthy person is shown in figure 5. Decomposition to higher levels depends on the number of samples present in a given signal. To get clear information for a very large number of samples, it can be decomposed to a level higher than tenth level.
(a)
(b)
(c)
Fig 5. (a) Healthy (b) ALS (c) Myopathy
After tenth level of db4, the Histograms of samples shown in figure (6) distinguish the three classes, which are to be given to neural network.
(a)
(b)
(c)
Fig 6. Histogram of (a) Healthy (b) ALS (c) Myopathy

ISSN NO: 2454-1958 Special Issue Tech-Ed 2016 (International Conference) Page 66
VII. CONCLUSION
The results of Decomposition and Histogram is clearly showing the difference between Healthy, ALS & Myopathy. The kNN and fNN classifiers will be used to differentiate between Healthy, ALS and Myopathy.These classifiersare efficient to classify the data with a greater accuracy. This work will be an assistive contribution to doctors for a neuromuscular disorder.
REFERENCES
[1] Samaneh Kouchaki, Reze Boostani, Soona shabani, “A new feature selection method for classification of EMG signals”, The 16th CSI
International Symposium on Artificial Intelligence and Signal Processing (AISP 2012).
[2] G. Eason, B. Noble, and I. N. Sneddon, “On certain integrals of
Lipschitz-Hankel type involving products of Bessel functions,” Phil. Trans. Roy. Soc. London, vol. A247, pp. 529–551, April 1955.
[3] Daniel Zennaro, Peter Wellig, Volker M. Koch, George S. Moschytz, “A
software package for the decomposition of long-term multichannel EMG signals using wavelet coefficients,” IEEE TRANSACTIONS ON
BIOMEDICAL ENGINEERING, VOL. 50, NO. 1, JANUARY 2003.
[4] Nikolic M. Detailed Analysis of Clinical Electromyography Signals
EMG Decomposition, Findings and Firing Pattern Analysis of Patients with Myopathy and Amyotrophic Lateral Sclerosis. PhD Thesis, Faculty
of Health Science, University of Copenhagen, 2001.
[5] M. Sc. MikiNikolic,“Detailed analysis of clinical electromyography signals,” APh.D. dissertation submitted to the university of copenhagen
the faculty of health science August,2001.
[6] Ali Hussein Ali Al-Timemy, Nebras Hussein Ghaeb, Taha Yassin Khalaf , “Wavelet neural network based Emg signal classifier,” The
1stRegional Conference of Eng. Sci. NUCEJ Spatial ISSUE vol.11, No.1, 2008 pp 137-144
[7] Akhila Devi B V, S.Suja Priyadharsini, “Diagnosis of neuromuscular
disorders using softcomputing techniques,” International Journal of Soft Computing and Engineering (IJSCE) ISSN: 2231-2307, Volume-3,
Issue-5, November 2013.
ISSN NO: 2454-1958 Special Issue Tech-Ed 2016 (International Conference) Page 67
DESIGN OF MACHINE ROOMLESS ELEVATOR
Harshal S. Jumade
Student MED IInd year Mechanical Engg. Dept.
Abha Gaikwad Patil College of Engg.
Nagpur, India
Prashant P. Bansod
Assistant Professor Mechanical Engg. Dept.
Abha Gaikwad Patil College of Engg.
Nagpur, India
Ajay A. Mahawadiwar
Head of department Mechanical Engg. Dept.
Abha Gaikwad Patil College of Engg.
Nagpur, India
Abstract- The present invention relates to an installation
structure for mounting an elevator traction machine at a rooftop
floor being capable not only to distribute a concentrated
operating load generated on the elevator traction machine during
elevator operation over the guide rail to the bottom of a pit
through the installation structure members, but also to remove a
conventional machine room separately located at the upper end
of a shaft and to minimize an installation space of the elevator
traction machine without altering an operating height of elevator.
Machine Room Less (MRL) elevator drives offer
advantages over conventional traction drives such as a higher
energy efficiency, low weight and more design freedom and
better utilization of hoist-way space. MRL drives have emerged
as the superior choice in most high rise applications. Currently a
majority of MRL drives are mounted on a guide rail spanning
beam which forces safety and stabilization components to act as
load bearing component and degrades ride quality. The MRL
drives are also difficult and costly to inspect and maintain if
located in such a configuration. Alternate methods of mounting
MRL drives on hoist-way spanning I beams if utilized can
eliminate eccentric hauling leading to better utilization of guide
rails and an improved ride quality. A hoist-way spanning support
configuration also aids in decreasing inspection and maintenance
costs by improving ease of access and increasing safety. Thus a
properly located MRL drive can provide best possible operating
parameters for a high rise application with lower costs of
inspection and maintenance over the elevator lifetime.
Keywords—Machine roomless elevator
I. INTRODUCTION
Elevators are vertical transport systems that are utilized for
efficient transport of passengers and goods between different
efficient transport of passengers and goods between different
floors (landings). An elevator differs from other hoisting mechanisms in that it runs at least partially on guide rails. The
elevator is a mass transit system (conveyor) whose design has
evolved rapidly from that of a simple drum and rope traction
system to traction less and machine room less systems.
Elevator usage has grown exponentially in India but the
adoption of newer technologies such as the MRL drive or
systems is lagging behind because of additional costs of
maintenance and inspection involved as convenience of
machine room diminishes. It becomes imperative to establish
MRL elevators as a superior choice and provide additional
future changes that provide advantage of MRL drive during operation and the convenience of a machine room during
inspection and maintenance. Such an elevator drive will
provide least cost of maintenance and inspection for the
customer over the elevator lifetime. The present invention
relates to a machine-room-less installation structure for
mounting an elevator traction machine at a rooftop. More
particularly, the installation structure for mounting the elevator
traction machine is capable not only to distribute a
concentrated operating load being generated on the elevator
traction machine over the guide rail to the bottom of a pit
through the installation structure members, but also to remove
a conventional machine room being separately located at the

ISSN NO: 2454-1958 Special Issue Tech-Ed 2016 (International Conference) Page 68
upper end of the shaft and installation space of elevator traction
machine without altering the traveling height of the elevator.
This paper is organized as follows. Firstly, literature review
of IS: 14665 is discussed in section II. Problem and drawbacks
of machine room elevators and proposed system is explained in
section III. Finally we conclude in section IV.
II. LITERATURE REVIEW
Indian Standard for Electric Traction Lifts provides
guidelines for outline dimensions of passenger, goods, service
and hospital lifts. This standard was adopted by the Bureau of
Indian Standard. This was done with a view to align the Indian
Standards with the latest developments in the field of Lifts and
also to align the standards with the European Norms on Lifts
and Escalators EN 81. Moreover, these standards are published
with a view to have a uniform code for electric traction lifts all
over the country, where presently different rules are being
followed by different states. This standard is one among the
series of standards finalized by the Lifts and Escalators Sectional Committee as detailed below:
1. IS 14665 (PART 1) - 2000 ELECTRIC TRACTION
LIFTS (GUIDE LINES FOR OUTLINE DIMENSION
OF PASSENGER, GOODS, SERVICE & HOSPITAL
LIFTS)[1]:
This standard specifies outline dimensions of lift cars for
passenger, goods, service and hospital lifts. The
corresponding well sizes, pit depth, headroom, machine-
room details and type of car and landing doors are also
specified.
2. IS 14665 (PART 2 - SEC 1 & 2) - 2000 - CODE OF
PRACTICE FOR INSTALLATION, OPERATION AND
MAINTENANCE[2]:
This standard (Part 2/Sec 1) covers the essential
requirements, design considerations, testing and
precautions to be exercised during installation of
passenger and goods lifts operated by electric power, so
as to ensure safe and satisfactory performance. It also
provides guidance for proper maintenance after
installation.
3. IS 14665 (PART 3-SEC 1 & 2)-2000 SAFETY RULES
(SECTION 1 PASSENGER & GOODS LIFTS,
SECTION 2- SERVICE LIFTS)[3]:
3.1 This standard (Part 3/ Sec 1) applies to the
construction and safety of new passenger and goods
lifts suspended by ropes and employing a guided lift
car.
3.2 This standard does not apply to platform lifts,
amusement devices, skip hoists, conveyors or similar
apparatus used for raising, piling.
4. IS 14665 (PART 4-SEC 1 TO 9) – 2001[4]: Components
Section 1- Lift Buffers
Section 2- Lift Guide Rails and Guide Shoes
Section 3- Lift Car frame, Car, Counterweight and
Suspension
Section 4- Lift Safety Gears and Governors
Section 5- Lift Retiring Cam
Section 6- Lift Doors and Locking Devices and
Contacts Section 7- Lift machines and Brakes
Section 8- Lift Wire Ropes
Section 9- Controller and Operating Devices for Lifts
5. IS 14665 (PART 5) - 1999 ELECTRIC TRACTION
LIFTS - SPECIFICATION (INSPECTION
MANUAL)[5]:
5.1 This standard (Part 5) applies to electric traction
passengers/goods lifts erected at any place and
intended for use by passengers.
5.2 This standard does not apply to:
a) Service lifts(dumbwaiters) b) Hydraulic lifts
c) Escalators
d) Cranes
5.3 This standard is concerned with inspection of lifts
from safety point of view and does not cover
performance requirements and corresponding tests.
Yeti et al. [6] provides comparative design of direct drive
PM synchronous motors in gearless elevator. In today’s world
electrical machines becomes irreplaceable for human beings to
continue daily routines. Due to the features such as high efficiency, high starting torque, and silent working, permanent
magnet synchronous motors (PMSM) are becoming more
common in many applications. One of these applications is
gearless elevator system where PMSM seems to be the best
candidate so far. In this paper, comparative design of PMSM
for gearless elevator has been investigated. Maxwell 2D Finite
element analysis software has been used in this study. With
comparative design, the influence of pole count on the machine
performance is studied.
Kumar et al. [7] discusses about elevator control system
which is one of the important aspects in infrastructure industry. This elevator control system is designed with the help of
hydraulic motor and programmable logic control (PLC) while
internal controlling is done through human machine
interference (HMI). This research is divided into two Parts on
the basis of programming. Firstly the program is developed on
ladder logic and then simulated on software itself but for later
testing and running the application a visualization is created on
Indraworks engineering Software and testing of hardware is
done. In the second level for controlling the internal commands
of the system and for floor recognition HMI is developed on
Rexroth touch screen HMI and internal switch for floor selection is done by HMI. The system consists of three floor
hardware and recognition of floors is done by inductive
proximity sensors and limit switch. Hydraulic motor used for
UP-DOWN movement of the elevator is controlled through 4/3
Directional control valve (DCV).

ISSN NO: 2454-1958 Special Issue Tech-Ed 2016 (International Conference) Page 69
Lee et al. [8] discusses about structure design and
magnetic force analysis of a ropeless elevator model that
employs permanent magnet linear synchronous motors
(PMLSMs) with the structure of a double-sided long-stator. To
obtain the optimal structure, the combination of response surface methodology and 2-D finite element analysis, which
can solve the problem effectively without consuming much
time, is utilized to estimate the design parameters of PMLSM.
The numerical calculations and the experimental results are
reported to validate the applicability of this double-sided long-
stator type PMLSM for a ropeless elevator system.
Dae-Woong et al. [9] presents a new standardized type of
gearless traction machine drive system with a PM motor for
high-speed elevators. Some control functions which are
indispensable for improving the performance of elevator
systems have been addressed. Stringent evaluation, environment and life tests ensure that the presented system is
not only high-performance but long-lasting and more reliable.
Wes et al. [10] discusses the overall importance and
benefits of a complete and efficient preventative maintenance
program. Implementing a strong program will have positive
impacts on safety, early detection, predictive maintenance, life
expectancy, and reducing operating costs. We will look at
existing tools and new technologies; specifically the load
measuring roller and analytical review.
III. PROBLEM DEFINITION
3.1 Problem and drawbacks of machine room elevators
The separate room is required at the top of the shaft
for mounting traction machine and controller as shown in
Fig. 1. It results in increase in construction cost as well as
Elevator cost. Also, due to increase in height, motor power
consumption also increases.
Fig. 1 Machine room elevator
3.2 Proposed system and conceptual design
To overcome the drawbacks of old systems, traction
machine can be installed in shaft itself and control panel can be
mounted near top floor landing door. Comparison between
elevator with machine room and machine roomless elevator is
as shown in Fig. 2.
Fig. 2 Comparison between machine room elevator and
machine roomless elevator
This reduces the cost of construction and increases
efficiency and performance of elevators. Machine Room Less
drives represent current pinnacle of elevator drive technology
and have made other traction drives obsolete. MRL drives offer
best operating parameters including costs, energy efficiency,
and ride quality. Elevation view and Plan view of Machine
Roomless Elevator are shown in Fig 3 and Fig. 4, respectively.
This shows conceptual layout/arrangement.
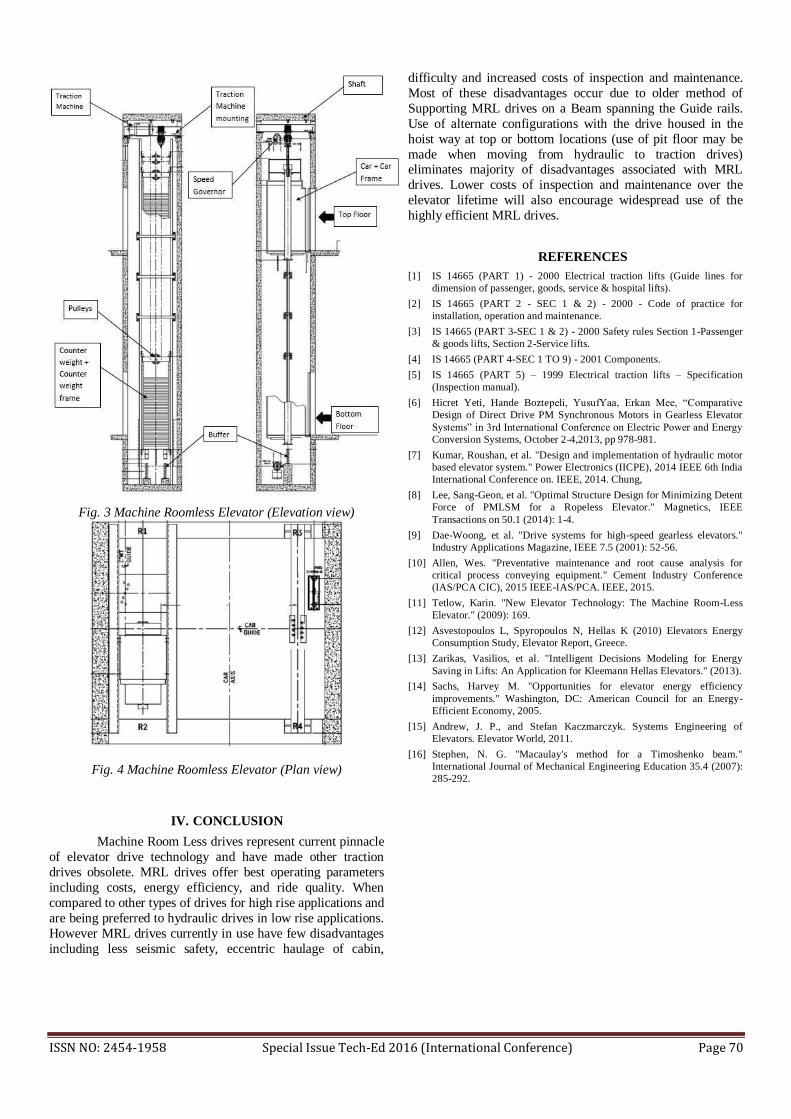
ISSN NO: 2454-1958 Special Issue Tech-Ed 2016 (International Conference) Page 70
Fig. 3 Machine Roomless Elevator (Elevation view)
Fig. 4 Machine Roomless Elevator (Plan view)
IV. CONCLUSION
Machine Room Less drives represent current pinnacle
of elevator drive technology and have made other traction
drives obsolete. MRL drives offer best operating parameters
including costs, energy efficiency, and ride quality. When
compared to other types of drives for high rise applications and
are being preferred to hydraulic drives in low rise applications.
However MRL drives currently in use have few disadvantages
including less seismic safety, eccentric haulage of cabin,
difficulty and increased costs of inspection and maintenance.
Most of these disadvantages occur due to older method of
Supporting MRL drives on a Beam spanning the Guide rails.
Use of alternate configurations with the drive housed in the
hoist way at top or bottom locations (use of pit floor may be
made when moving from hydraulic to traction drives) eliminates majority of disadvantages associated with MRL
drives. Lower costs of inspection and maintenance over the
elevator lifetime will also encourage widespread use of the
highly efficient MRL drives.
REFERENCES
[1] IS 14665 (PART 1) - 2000 Electrical traction lifts (Guide lines for
dimension of passenger, goods, service & hospital lifts).
[2] IS 14665 (PART 2 - SEC 1 & 2) - 2000 - Code of practice for
installation, operation and maintenance.
[3] IS 14665 (PART 3-SEC 1 & 2) - 2000 Safety rules Section 1-Passenger
& goods lifts, Section 2-Service lifts.
[4] IS 14665 (PART 4-SEC 1 TO 9) - 2001 Components.
[5] IS 14665 (PART 5) – 1999 Electrical traction lifts – Specification
(Inspection manual).
[6] Hicret Yeti, Hande Boztepeli, YusufYaa, Erkan Mee, “Comparative
Design of Direct Drive PM Synchronous Motors in Gearless Elevator
Systems” in 3rd International Conference on Electric Power and Energy
Conversion Systems, October 2-4,2013, pp 978-981.
[7] Kumar, Roushan, et al. "Design and implementation of hydraulic motor
based elevator system." Power Electronics (IICPE), 2014 IEEE 6th India
International Conference on. IEEE, 2014. Chung,
[8] Lee, Sang-Geon, et al. "Optimal Structure Design for Minimizing Detent
Force of PMLSM for a Ropeless Elevator." Magnetics, IEEE
Transactions on 50.1 (2014): 1-4.
[9] Dae-Woong, et al. "Drive systems for high-speed gearless elevators."
Industry Applications Magazine, IEEE 7.5 (2001): 52-56.
[10] Allen, Wes. "Preventative maintenance and root cause analysis for
critical process conveying equipment." Cement Industry Conference
(IAS/PCA CIC), 2015 IEEE-IAS/PCA. IEEE, 2015.
[11] Tetlow, Karin. "New Elevator Technology: The Machine Room-Less
Elevator." (2009): 169.
[12] Asvestopoulos L, Spyropoulos N, Hellas K (2010) Elevators Energy
Consumption Study, Elevator Report, Greece.
[13] Zarikas, Vasilios, et al. "Intelligent Decisions Modeling for Energy
Saving in Lifts: An Application for Kleemann Hellas Elevators." (2013).
[14] Sachs, Harvey M. "Opportunities for elevator energy efficiency
improvements." Washington, DC: American Council for an Energy-
Efficient Economy, 2005.
[15] Andrew, J. P., and Stefan Kaczmarczyk. Systems Engineering of
Elevators. Elevator World, 2011.
[16] Stephen, N. G. "Macaulay's method for a Timoshenko beam."
International Journal of Mechanical Engineering Education 35.4 (2007):
285-292.

ISSN NO: 2454-1958 Special Issue Tech-Ed 2016 (International Conference) Page 71
Design and analysis of cutter drum for a cable
laying machine
1 Mr. Lokesh G. Dandekar
M-Tech (MED) IIIrdSem,
AGPCE, Nagpur
2Prof.Ritesh Banpurkar Assistant Professor,
Department of Mechanical
Engineering, AGPCE, Nagpur
3 Prof. Ajay
Mahawadiwar Assistant Professor,
Head of Department
Mechanical Engineering,
AGPCE, Nagpur
Abstract: A cable laying machine for underground
placement of cable incorporating a basic frame and
power unit incorporating a rear warred attractive
component with the front and rear components with
the front and rear components being articulately
interconnected for steering control of the machine
and the rear component including cable laying plough
associated there with the rear component may be
provided with cable reels and guide structures for
guiding the cable the plough. The cable laying
machine has a cutter drum at its front end which digs
up the soil along linear channels rolls down the cable
mounted on the roller behind. The proposed machine
eliminates hazards faced by commuters solving three
purposes simultaneously of digging, Cable laying and
then covering the soil. The simulation model will be
created in CREO-PARAMETRIC 2.0. Here
dynamic mechanism will be made for calculating
velocity, acceleration impact variation with respect
to time. Design calculation in the reverse direction so that how much torque is required to dii up the
soil. After that we design the whole system from
bottom to top. MD SOLID software will be used to
calculate the SFD and BMD Diagrams as well as
deflection in the shaft.in terms of robustness we
analyses the whole parts in the assembly which is
made in Design software. Different analysis will be
made such as structural analysis in ANSYS 16.0.
Keywords: Cable, Soil
conditions,Creo,MDsolid,Ansys
INTRODUCTION:
The cable laying machine is to lay a utility cable
underground and laying the cable at a uniform
depth.it has a Cutter drum mounted on the front
section, Cable drum along with cable on back section. Accumulated soil is removed by the
flapper
BLOCK DIAGRAM OF CABLE LAYING
MACHINE
The machine is run by motor whichperforms 4
functions:-
• digs up the soil (with the help of cutter drum)
• clears the channel (by means of flapper)
ISSN NO: 2454-1958 Special Issue Tech-Ed 2016 (International Conference) Page 72
• lays the cable (through the cable roller drum)
• Refilling the channel.
LITERATURE SURVEY:
1. Analysis of Power Transmission System
for Ginning Machine with Feeding
Mechanism using FEA
Prof. P. S. Nerkar1, Dr. J. F. Agrawal2, Mr. P.D.
Deshpande3 1 Assistant Professor, Department of
Mechanical Engineering, S.V.P.C.E.T, Nagpur,
Maharashtra, India. 2 Principal, Shri Sai College of
Engineering & Technology, Bhadravati,
Maharashtra, India. 3Application Engineer, DCS.
PVT. Limited, Nagpur, Maharashtra, India.
ABSTRACT: In India, it was found that ginning
factories do not operate efficiently with regard to the
labour force employed and the amount of capital
invested. In order to make a more concrete evaluation
of the cotton ginning sector, it is necessary to
determine the structural characteristics of the
factories, costs and profitability, the level of technical
efficiency, and the most important, potential for
improvement in the industry. Irregular feeding of
Seed Cotton to ginning machine decreases the
production rate of seed and fiber. It also affects the
quality of the fiber and seed. To overcome these
difficulties feeding mechanism is developed. The
primary function of feeding mechanism is to feed seed
cotton uniformly to the ginning machine at
controllable rates. Feed rollers, located at the bottom
of the feeder, directly under the hopper, control the
feed rate of seed cotton to the ginning machine. Stress
analysis carried out by using FEA software and the
results are compared with the calculated values. This
paper illustrates how the chain drives are very
important to carry forwards the power. In this Paper
recommendations and suggestions to improve quality
of cotton fiber, suggestions for ginning factories are
highlighted.
2.ANALYSIS OF THERMAL GROWTH
INFLUENCE ON V-BELT TRANSMISSION
ALIGNMENT PRECISION
AndrisPrizevaitis, DmitrijsLitvinovs,
EriksGerins Riga Technical University, Latvia
[email protected], [email protected]
Abstract. V-belt transmission alignment is a
necessary criterion of its reliable and accident-free
work. Most exact and useful is an alignment by laser
equipment. However, during an alignment it is
necessary not only exactly and correctly to align the
drive and led units, but also to take into account the
size of V-belt transmission component thermal
growth. In this article the principle of thermal growth
size determination will be considered, and also the
analysis of thermal growth influence on the V-belt
transmission alignment quality and precision will be
conducted.
Keywords: laser alignment, reduction gearbox, V-belt
transmission, test rig.
3.A DISCRETE ANALYSIS OF METAL-V
BELT DRIVE
A. KARAM and D. PLAY
UniversitéLibanaise
Faculté des sciences II
FANAR-MATEN B.P. 90656
Lebanon Abstract
The metal-V belt drive includes a large number of
parts which interact between them to transmit power
from the input to the output pulleys. A compression
belt composed of a great number of struts is
maintained by a tension flat belt. Power is them
shared into the two belts that moves generally in
opposite directions. Due to the particular geometry of
the elements and to the great number of parts, a
numerical approach achieves the global equilibrium
of the mechanism from the elementary part
equilibrium. Sliding arc on each pulley can be thus
defined both for the compression and tension belts.
Finally, power sharing can be calculated as
differential motion between the belts, is defined. The
first part of the paper will present the different steps
of the quasi-static mechanical analysis and their
numerical implementations. Load distributions, speed
profiles and sliding angle values will be discussed. The
second part of the paper will deal to a systematic use
of the computer software. Speed ratio, transmitted
torque, strut geometry and friction coefficients effect
will be analysed with the output parameter
variations. Finally, the effect pulley deformable
flanges will be discussed.
4.SPEED RATIO PREDICTION AND
PERFORMANCE ANALYSIS OF SINGLE
BALL TRACTION DRIVE FOR CVT
Kunal S. Marathe*, Vishnu D. Wakchaure**
*(Amrutvahini College of Engineering, Department
of Mechanical Engineering, University of Pune,
Sangamner-422605, Maharashtra State, India)
**(Amrutvahini College of Engineering,
Department of Mechanical Engineering, University
of Pune, Sangamner-422605, Maharashtra State, India)
ABSTRACT Drives are basically used to transmit
power and speed from the prime mover to the
machine. The power transmission and speed
reduction between the prime-mover and the driven
machine can be achieved by using conventional drives
like Belt drive, Rope drive, Chain drive, Gears, etc.
with their numerous advantages and disadvantages.
There are many machines and mechanical units that
under varying circumstances make it desirable to be
able to drive at a barely perceptible speed, an
intermediate speed or a high speed. Thus an infinitely
variable (step less) speed variation in which it is
possible to get any desirable speed. Some mechanical,
hydraulic, drives serve as such step less drives.
ISSN NO: 2454-1958 Special Issue Tech-Ed 2016 (International Conference) Page 73
However the torque versus speed characteristics of
these drives do not match torque at low speeds. Hence
the need of a step less or infinitely variable speed
drive came into existence. The drive presented by the
end of this research work is single ball traction drive
for continuously variable transmission systems.
Dissertation includes the brief history of existing
drives, speed prediction methodology and
performance analysis of the drive developed.
Keywords – Analysis, Ball, CVT, IVT, Traction
5. DYNAMICS MODELING FOR
MECHANICAL FAULT DIAGNOSTICS AND
PROGNOSTICS
Colin D. Begg, Terri Merdes, Carl Byington, and
Ken Maynard
The Pennsylvania State University, Applied
Research Laboratory
Condition-Based Maintenance Department University Park, Pennsylvania 16804
ABSTRACT
While tremendous improvements have been made in
the performance of modern engineered systems due to
increased design cycle accuracy and testing
capabilities, traditional time/use maintenance
practices have not changed much. While wear
longevity of many subsystem components has
increased with a beneficial decrease in weight and size
the margins of safety have also decreased because of
greater accuracy in design analysis and improved
testing techniques. In an effort to increase efficiency
in use of high performance and heavy-duty systems,
especially in power generation and transmission
subsystems, Condition-Based Maintenance (CBM)
has emerged as an improvement over more costly
time/use maintenance practices. CBM is being
enabled by the same technological (testing, modeling,
analysis) improvements that have spawned increased
system performance. As part of a combined
experimental-theoretical analysis investigation effort
related to CBM diagnostics and prognostics, an
experimental gearbox failure test bed was
constructed. The primary interest is the\ study of
mechanical fault evolution in damaged rotating
components that involve mechanical power
transmission. As part of that same research effort a
dynamics model of the system is being developed for
response simulations and study of in situ mechanical
dynamic fault models. Simulations of system
vibratory responses will allow physical insights to be
gained in vibratory measurement sensor placement
and specification, dynamic system response to a fault,
and fault detection signal processing algorithms. In
this paper, the dynamics modelling of the gearbox
drive rotor/bearing-foundation system using the
Finite Element method is outlined and it’s relevance
to diagnostics and prognostics is highlighted.
6.ENERGY LOSS AND EFFICIENCY OF
POWER TRANSMISSION BELTS
ABSTRACT: A comprehensive selection of belt
type and construction from industrial and
agricultural applications is extensively tested and
compared for idling loss and power transmission
efficiency. Data is documented for Vee, joined-V, V-
ribbed, and synchronous belt types and for cogged,
plain, and laminated V-belt constructions. The level
of energy savings achieved by the replacement of
plain-base wrapped V-belts with cogged V-belts is
emphasized. Belt efficiency, slip, and temperature
dependence on the basic drive parameters of torque,
sheave diameter, belt tension, and contact angle is
reported
7.THE BENEFITS OF A FINAL APPLIED
DESIGN PROJECT THAT
COMPREHENSIVELY INTEGRATES
COURSE MATERIAL CONTENT &
CONCEPTS
Mathew A. Kuttolamadom Texas A&M University
College Station, TX, 77843 [email protected]
Abstract: The objective of this paper is to
explore the benefits of a final applied engineering
design project, which serves to comprehensively
integrate the content and concepts of a senior-level
course. By integrating course content and concepts
through an applied project, the benefits of a typical
multi-semester capstone design project are translated
to a single course. For this, an upper-level mechanics-
track course that is being offered to seniors in the
Manufacturing and Mechanical Engineering
Technology (MMET) program at Texas A&M
University was chosen. The course, titled “Mechanical
Design Applications-II” involved the application of
the principles of design to mechanical power
transmission elements. The final assigned project was
to complete the design of all the individual elements
constituting the power transmission system that was
intended to deliver power between two machines, and
to put them together (with certain requirements and
constraints). Periodic guidance was offered to the
students on a need-basis for this open-ended project.
On completion, it was observed that this interactive
activity was very well received by the students, and
that it clearly exhibited many short-term and long-
term benefits in the form of concept and content
clarity, problem-based learning, metacognition, and
higher-order thinking
skills.
8.CALCULATION OF THE STARTING
REGIME OF THE POWER TRANSMISSION
SYSTEM WITH A HYDRODYNAMIC
COUPLING AND A DRIVING MOTOR
UDC 621.817.032
BožidarBogdanović, ŽivanSpasić,
JasminaBogdanović-Jovanović Faculty of Mechanical Engineering, A. Medvedeva
14, Niš, Serbia and Montenegro
Abstract. In this paper a graph-analytical procedure
for calculating a starting regime of the power
transmission with a hydrodynamic coupling and a
driving motor is presented. The presented iterative

ISSN NO: 2454-1958 Special Issue Tech-Ed 2016 (International Conference) Page 74
procedure for solving this problem provides for
obtaining the starting power transmission system
regime with accuracy determined in advance. The
number of iterative steps depends on the defined
accuracy.
Key Words: Hydrodynamic Coupling, Electromotor,
Starting Regime
CONCLUSION:
After the completion of literature survey the cable
laying machine is boon to the mankind. The
machine is a first of its kind which digs up the soil,
lays the cable and covers the channels
simultaneously. The implementation of this
machine would certainly reduce the time of cable
laying work and will also assist in greater precision
that manual cable laying work. The cable laying
machine reduces the labour cost associated with the
digging up the soil and covering the channels. It
also reduces the traffic snarls and hazards faces by
the commuters due to cable laying work. Having
seen this machine working satisfactorily on a small
scale, we can conclude that with the aid of high
transmission system, high capacity motors and
cutter teeth of high harden ability; it can be used in
the large small project undertaken by the
government for cable laying work.
REFERENCES:
[1] Prashantkumar S. Patel1 “ Analysis Of Grading
Techniques In Xlpe Cable Insulation By
Fem”,INTERNATIONAL JOURNAL OF RESEARCH IN
ENGINEERING AND TECHNOLOGY Vol. 3, No. 4, Apr-
2014
[2] Vigya et al “Comparisions of cables”,
INTERNATIONAL JOURNAL OF EMERGING
TECHNOLOGY AND ADVANCED ENGINEERING, VOL.02
, NO. 10, OCT 2012.
[3] OHTA Tsutomu et al “Route Design/Cable laying
technologies for optical submarine cable”, NEC TECHNICAL
JOURNAL ,VOL. 05 , NO. 01/2010
[4] Shaun Austine et al, “A Comparative analysis of
submarine cable installation method in northern Puget sound,
Washington ”, JOURNAL OF MARINE ENV. ENGG., Vol
.07,pp. 173-184.
[5] Chetan Samarth , A.K. Mahalle, “Design and
optimization of speed ratio for convetional chain drive used in
Tricycle”, IJITEE , Vol. 01, No. 01, JUNE 2012
.
[6] Victor D. Antonielo, “Underground power cable
consideration: Alternative to overhead ”, 47th
Minnesta power
system conference , Nov 2011.
[7] JunzhouHuo et al,,“Static and dynamic characteristics of
the chaine drive system of a heavy duty apron feeder ”,THE
OPEN MECHANICAL ENGG. JOURNAL , 2013 No.7, pp.
121-128
[8] Gao Kui-Dong et al ,“Drum cutting specific energy
consumption model built by cutting curves analysis ”,
TELKOMNIKA , Vol. 11 , No. 01 , July 2013.
[9] A. Pillay, SAIE and B. S. Rigby, “Investigations into
the effect of inductor size on the performance of f Thyristor
Controlled Series Capacitor”, AFRICON, 7th AFRICON
Conference in Africa, (2004) September 1517.
[10] Rahul urankar“ Study of Drive Mechanisms of Bicycle,
Tricycle or Like Vehicles to Optimize Operating Performance”,
IJERA , Vol. 4 , No. 1 , Jan 2014.
[11] Shaun Austine et al, “A Comparative analysis of
submarine cable installation method in northern Puget sound,
Washington ”, JOURNAL OF MARINE ENV. ENGG., Vol
.07,pp. 173-184.
[12] Victor D. Antonielo, “Underground power cable
consideration: Alternative to overhead ”, 47th
Minnesta power
system conference , Nov 2011
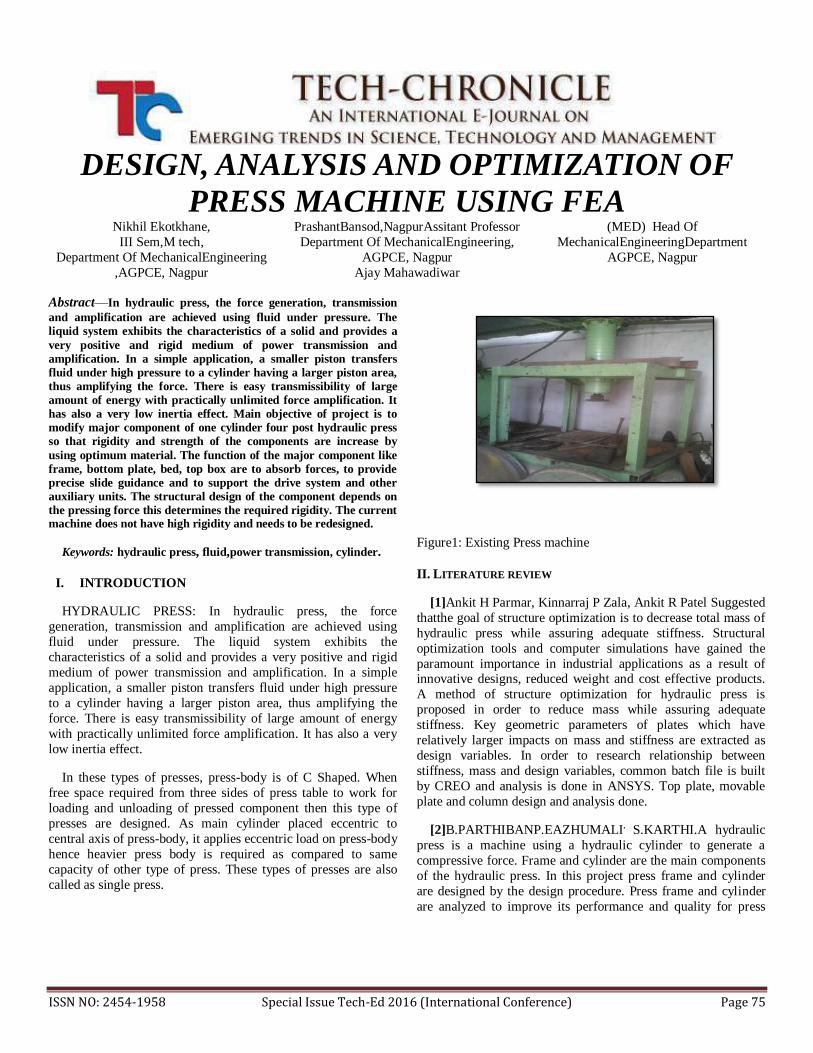
ISSN NO: 2454-1958 Special Issue Tech-Ed 2016 (International Conference) Page 75
DESIGN, ANALYSIS AND OPTIMIZATION OF
PRESS MACHINE USING FEA Nikhil Ekotkhane,
III Sem,M tech,
Department Of MechanicalEngineering
,AGPCE, Nagpur
PrashantBansod,NagpurAssitant Professor
Department Of MechanicalEngineering,
AGPCE, Nagpur
Ajay Mahawadiwar
(MED) Head Of
MechanicalEngineeringDepartment
AGPCE, Nagpur
Abstract—In hydraulic press, the force generation, transmission
and amplification are achieved using fluid under pressure. The
liquid system exhibits the characteristics of a solid and provides a
very positive and rigid medium of power transmission and
amplification. In a simple application, a smaller piston transfers
fluid under high pressure to a cylinder having a larger piston area,
thus amplifying the force. There is easy transmissibility of large
amount of energy with practically unlimited force amplification. It
has also a very low inertia effect. Main objective of project is to
modify major component of one cylinder four post hydraulic press
so that rigidity and strength of the components are increase by
using optimum material. The function of the major component like
frame, bottom plate, bed, top box are to absorb forces, to provide
precise slide guidance and to support the drive system and other
auxiliary units. The structural design of the component depends on
the pressing force this determines the required rigidity. The current machine does not have high rigidity and needs to be redesigned.
Keywords: hydraulic press, fluid,power transmission, cylinder.
I. INTRODUCTION
HYDRAULIC PRESS: In hydraulic press, the force
generation, transmission and amplification are achieved using
fluid under pressure. The liquid system exhibits the
characteristics of a solid and provides a very positive and rigid
medium of power transmission and amplification. In a simple
application, a smaller piston transfers fluid under high pressure
to a cylinder having a larger piston area, thus amplifying the
force. There is easy transmissibility of large amount of energy
with practically unlimited force amplification. It has also a very
low inertia effect.
In these types of presses, press-body is of C Shaped. When
free space required from three sides of press table to work for
loading and unloading of pressed component then this type of
presses are designed. As main cylinder placed eccentric to
central axis of press-body, it applies eccentric load on press-body
hence heavier press body is required as compared to same
capacity of other type of press. These types of presses are also
called as single press.
Figure1: Existing Press machine
II. LITERATURE REVIEW
[1]Ankit H Parmar, Kinnarraj P Zala, Ankit R Patel Suggested
thatthe goal of structure optimization is to decrease total mass of
hydraulic press while assuring adequate stiffness. Structural
optimization tools and computer simulations have gained the
paramount importance in industrial applications as a result of innovative designs, reduced weight and cost effective products.
A method of structure optimization for hydraulic press is
proposed in order to reduce mass while assuring adequate
stiffness. Key geometric parameters of plates which have
relatively larger impacts on mass and stiffness are extracted as
design variables. In order to research relationship between
stiffness, mass and design variables, common batch file is built
by CREO and analysis is done in ANSYS. Top plate, movable
plate and column design and analysis done.
[2]B.PARTHIBANP.EAZHUMALI, S.KARTHI.A hydraulic
press is a machine using a hydraulic cylinder to generate a
compressive force. Frame and cylinder are the main components
of the hydraulic press. In this project press frame and cylinder
are designed by the design procedure. Press frame and cylinder
are analyzed to improve its performance and quality for press
ISSN NO: 2454-1958 Special Issue Tech-Ed 2016 (International Conference) Page 76
working operation. Structural analysis has become an integral
part of the product design. The frame and cylinder are modeled
by using modeling software CATIA. Structural analysis has been
applied on C frame hydraulic press structure and cylinder by
using analyzing software ANSYS. An integrated approach has
been developed to verify the structural performance and stress
strain distributions are plotted by using ANSYS software.
According to the structural values the dimensions of the frame
and cylinder are modified to perform the functions satisfactory.
[3]Muni Prabaharan and V.AmarnathStructural optimization
tools and computer simulations have gained the paramount
importance in industrial applications as a result of innovative
designs, reduced weight and cost effective products. Especially,
in aircraft and automobile industries, topology optimization has
become an integral part of the product design process. In this
project, topology optimization has been applied on various
components of scrap baling press and 5Ton hydraulic press using
ANSYS WORKBENCH software. Suitable loads and constraints are applied on the initial design space of the components. An
integrated approach has also been developed to verify the
structural performance by using ANSYS software. At the end,
shape optimized design model is compared with the actual part
that is being manufactured for the press. It is inferred that
topology optimization results in a better and innovative product
design. In this project, we showed 26.26 percent cost reduction
in scrap baling press. And we fabricated 5ton hydraulic press
with cost reduction of 24.54 percent.
III. IDENTIFIED GAPS IN THE LITERATURE
Main objective of project is to modify major component of
one cylinder four post hydraulic press so that the rigidity and
strength of the components are increased.
IV.PROBLEM FORMULATION
In hydraulic press, the force generation, transmission and
amplification are achieved using fluid under pressure. The liquid
system exhibits the characteristics of a solid and provides a very
positive and rigid medium of power transmission and
amplification. In a simple application, a smaller piston transfers
fluid under high pressure to a cylinder having a larger piston
area, thus amplifying the force. There is easy transmissibility of
large amount of energy with practically unlimited force
amplification. It has also a very low inertia effect. Main objective
of project is to modify major component of one cylinder four
post hydraulic press so that rigidity and strength of the
components are increase by using optimum material. The function of the major component like frame, bottom plate, bed,
top box are to absorb forces, to provide precise slide guidance
and to support the drive system and other auxiliary units. The
structural design of the component depends on the pressing force
this determines the required rigidity. The current machine does
not have high rigidity and needs to be redesigned.
V CONCLUSIONS
By undertaking this project, major component of one cylinder
four post hydraulic press machines will be redesigned and
optimized so that it has sufficient strength and stiffness.
REFERENCES
[1] Ankit H Parmar, Kinnarraj P Zala, Ankit R Patel, “Design and
Modification of Foremost Element of Hydraulic Press Machine”ISSN 2249-9954,Issue 4 volume 3, May-June 2014.
[2] B.Parthiban, P.Eazhumali, S.Karthi, P.Kalimuthu, “Design and
Analysis of c type Hydraulic Press Structure and Cylinder”issn (online): 2321-3051,Vol.2 Issue.3, March 2014,Pgs: 47-56.
[3] Muni Prabaharan and V.Amarnath , “Structural Optimization of
5Ton Hydraulic Press and Scrap Baling Press for Cost Reduction by
Topology”International Journal of Modeling and Optimization, Vol. 1, No. 3, August 2011.
ISSN NO: 2454-1958 Special Issue Tech-Ed 2016 (International Conference) Page 77
Design & CAD simulation of Right Side Dropping
Dumper (For Small Vehicle)
Ritesh V. Bhawarkar[1]
Student M Tech (MED) Department
Of Mechanical Engineering
Abha Gaikwad Patil College of
Engineering
Prof.Abhijit Misal
Student M Tech (MED) Department
Of Mechanical Engineering
Abha Gaikwad Patil College of
Engineering
Prof.Ajay Mahawadiwar[3]
Head Of Department Of Mechanical
Engineering Abha Gaikwad Patil
College of Engineering Mohagaon,
Nagpur, India
Abstract—In this research work an improved way of unloading
material from dumper is design. Conventional Dumper
unloads material only at back side of dumper which may cause
problem of road blockage in limited space area. The right side
dropping dumper overcomes problem of unloading the
material by using hydraulic cylinder. Modern right side
dropping dumper has been conceived by observing difficulty in
unloading the material. Hence suitable arrangement has been
designed for small vehicle (TATA ace). The vehicles can be
unloading material from right side. The concept leads to efficient working.
Keywords—Dumper,dropping side,right side dropping.
I. INTRODUCTION
A dumper is a vehicle designed for carrying bulk material, often on building sites. Dumpers are distinguished from
dump trucks by configuration: a dumper is usually an open
4-wheeled vehicle with the load skip in front of the driver,
while a dump truck has its cab in front of the load. The skip
can tip to dump the load; this is where the name "dumper"
comes from. They are normally diesel powered. A towing
eye is fitted for secondary use as a site tractor. Dumpers
with rubber tracks are used in special circumstances and are
popular in some countries.
Early dumpers had a payload of about a ton and were 2-
wheel drive, driving on the front axle and steered at the back
wheels. The single cylinder diesel engine (sometimes made
by Lister) was started by hand cranking.
The steering wheel turned the back wheels, not front.
Having neither electrics nor hydraulics there was not much to go wrong. The skip was secured by a catch by the driver's
feet. When the catch is released, the skip tips under the
weight of its contents at pivot point below, and after being
emptied is raised by hand.
Modern dumpers have payloads of up to 10000kg and
usually steer by articulating at the middle of the chassis. A
dumper is an integral part of any construction work and
hence its role is important for completion of any
constructional site. One of the problem are cited with
dumper in the time and energy for setting the huge dumper
in the proper direction to dump the material it in carrying
and hence the need of the project work riser which is about
Design & CAD simulation of Right Side Dropping Dumper.
II. LITERATURE REVIEW
1. Design and Development of 3-Way Dropping Dumper,
www.ijetae.com (ISSN 2250-2459, ISO 9001:2008
Certified Journal, Volume 4, Issue 9, September 2014)
A small scale model has developed using light weight
material i.e. plastic and hydraulically operated piston and
cylinder arrangement. This hydraulic arrangement actuates
on motor driven which makes the prototype semi automatic.
The trolley piston gets out and makes the trolley to tilt by
operating various cylinders; the material can be dropped in 3
ways. Limitation- Increased complexity: It requires complex
mechanism for getting desired
2. Development Of Three Axes Lifting Modern Trailer,
Volume I, Issue 5, May 2015 (ISSN: 2394 – 6598)
In this work the trailer is pulled up in three axis. The figure
1 shows ths working principle of hydraulic cylinder used in
this modern trailer. For the trailer action we are using
hydraulic as a source. The 3/2 direction control valve is used
to control the direction of the hydraulic. When the inlet port is open the hydraulic is pumped from the sump using
hydraulic pump. The trailer is now pushed upward in the
―Y‖ axis direction and the outlet port is activated now, then
the trailer was pushdown in Y axis direction. Now the knee
joint of the trailer is removed for trailer action in „Z‟ axis.
Then again the inlet port is open. The trailer is now pushed
upward in the ―Z‖ axis direction and the outlet port is
activated now, then the trailer was pushdown in „Z‟ axis.
Again the knee joint is removed for the trailer action in „X‟
axis. Then again the inlet port is open. The trailer is now
pushed upward in the ―X‖ axis direction and the outlet port is activated now, then the trailer was pushdown in „X‟ axis.
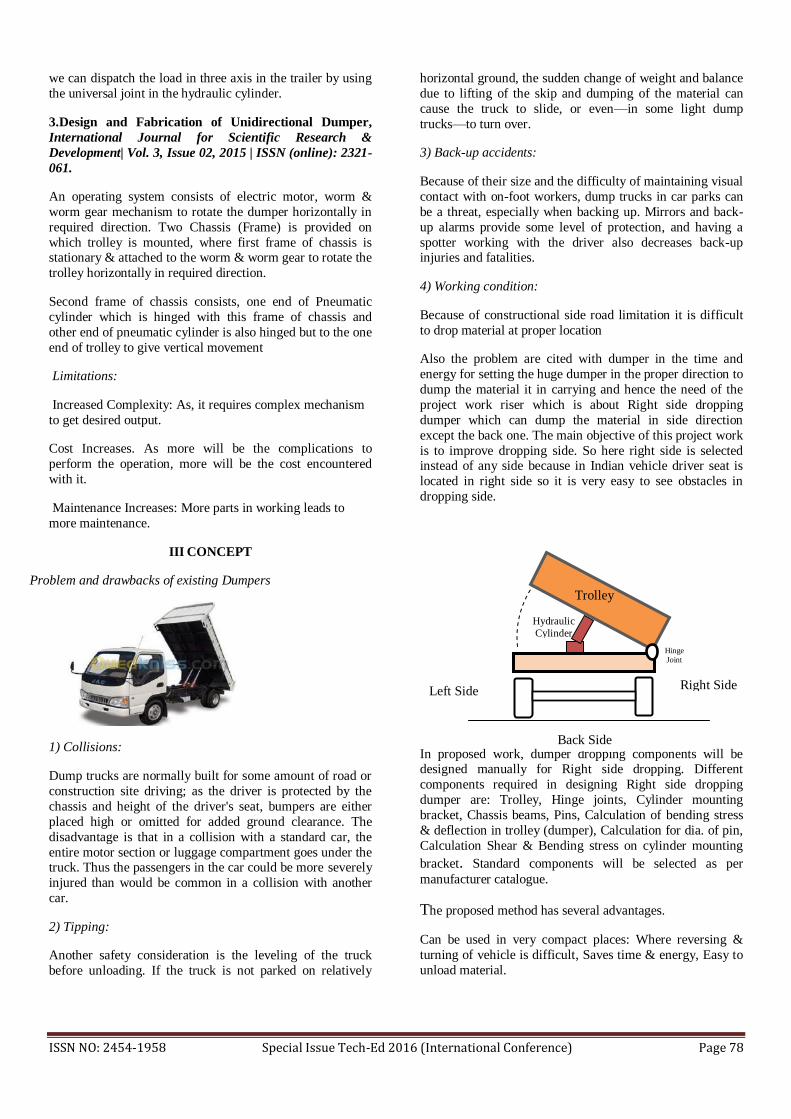
ISSN NO: 2454-1958 Special Issue Tech-Ed 2016 (International Conference) Page 78
we can dispatch the load in three axis in the trailer by using
the universal joint in the hydraulic cylinder.
3.Design and Fabrication of Unidirectional Dumper,
International Journal for Scientific Research &
Development| Vol. 3, Issue 02, 2015 | ISSN (online): 2321-
061.
An operating system consists of electric motor, worm &
worm gear mechanism to rotate the dumper horizontally in
required direction. Two Chassis (Frame) is provided on
which trolley is mounted, where first frame of chassis is stationary & attached to the worm & worm gear to rotate the
trolley horizontally in required direction.
Second frame of chassis consists, one end of Pneumatic
cylinder which is hinged with this frame of chassis and
other end of pneumatic cylinder is also hinged but to the one
end of trolley to give vertical movement
Limitations:
Increased Complexity: As, it requires complex mechanism
to get desired output.
Cost Increases. As more will be the complications to
perform the operation, more will be the cost encountered
with it.
Maintenance Increases: More parts in working leads to
more maintenance.
III CONCEPT
Problem and drawbacks of existing Dumpers
1) Collisions:
Dump trucks are normally built for some amount of road or
construction site driving; as the driver is protected by the
chassis and height of the driver's seat, bumpers are either
placed high or omitted for added ground clearance. The
disadvantage is that in a collision with a standard car, the
entire motor section or luggage compartment goes under the truck. Thus the passengers in the car could be more severely
injured than would be common in a collision with another
car.
2) Tipping:
Another safety consideration is the leveling of the truck
before unloading. If the truck is not parked on relatively
horizontal ground, the sudden change of weight and balance
due to lifting of the skip and dumping of the material can
cause the truck to slide, or even—in some light dump
trucks—to turn over.
3) Back-up accidents:
Because of their size and the difficulty of maintaining visual
contact with on-foot workers, dump trucks in car parks can
be a threat, especially when backing up. Mirrors and back-
up alarms provide some level of protection, and having a
spotter working with the driver also decreases back-up injuries and fatalities.
4) Working condition:
Because of constructional side road limitation it is difficult
to drop material at proper location
Also the problem are cited with dumper in the time and
energy for setting the huge dumper in the proper direction to
dump the material it in carrying and hence the need of the
project work riser which is about Right side dropping
dumper which can dump the material in side direction
except the back one. The main objective of this project work
is to improve dropping side. So here right side is selected instead of any side because in Indian vehicle driver seat is
located in right side so it is very easy to see obstacles in
dropping side.
In proposed work, dumper dropping components will be designed manually for Right side dropping. Different
components required in designing Right side dropping
dumper are: Trolley, Hinge joints, Cylinder mounting
bracket, Chassis beams, Pins, Calculation of bending stress
& deflection in trolley (dumper), Calculation for dia. of pin,
Calculation Shear & Bending stress on cylinder mounting
bracket. Standard components will be selected as per
manufacturer catalogue.
The proposed method has several advantages.
Can be used in very compact places: Where reversing &
turning of vehicle is difficult, Saves time & energy, Easy to
unload material.
Back Side
Right Side
Side Left Side
Side
Trolley
Hinge
Joint
Hydraulic
Cylinder

ISSN NO: 2454-1958 Special Issue Tech-Ed 2016 (International Conference) Page 79
Hydraulic Cylinder
A hydraulic cylinder is placed below the body of truck longitudinally at one end of the truck, and the piston end of
the hydraulic cylinders is connected by the means of a pivot
joint to the chassis of truck. In the forward stroke of the
cylinder, it pushes the truck body upward thus gives
necessary lift for tipping dumping. So, in the forward stroke
of the cylinder, the truck is unloaded. In the return stroke of
the cylinder the body of the truck comes to its original
position.
Hinge Joint
The other bottom end of the body of the truck is connected
by a hinged joint with the chassis.
Mounting Brackets
Cylinder mounting bracket is mounted in crossbeam
provided to chassis beam.
Pins
Pins are provided to joint trolley with chassis so that trolley
can tilt about fix plane.
Advantages
1) Can be efficiently used in very compact places where
turning of vehicle is difficult.
2) Reduction in amount of accidents on constructional site
or plant.
3) Increased moving ability as it does not become tiresome
to perform the job.
4) Reduces extra cost paid on unloading of material by labor
or machines like cranes or any other pick and placer.
5) Saves times and energy.
Applications:
1) At Constructions site.
2) At remote locations where floor space area is less.
IV CONCLUSION
As this concept saves time & energy as well this may leads
to efficient working, which helps constructional work or the
infrastructural work demands of efficient and user friendly
machinery will lead to more and more use of the project
work like Right side dropping dumper.
REFERENCES
[1] Design and Development of 3-Way Dropping Dumper,
www.ijetae.com (ISSN 2250-2459, ISO 9001:2008 Certified Journal, Volume 4, Issue 9, September 2014)
[2] Design and Fabrication of Unidirectional Dumper, International
Journal for Scientific Research & Development| Vol. 3, Issue 02, 2015 | ISSN (online): 2321-061.
[3] Development Of Three Axes Lifting Modern Trailer, Volume I, Issue 5, May 2015 (ISSN: 2394 – 6598)
[4] Linear Static & Impact Analysis Of EH 600 Dumper Body by R
sandya Rani &Kanchan Bag
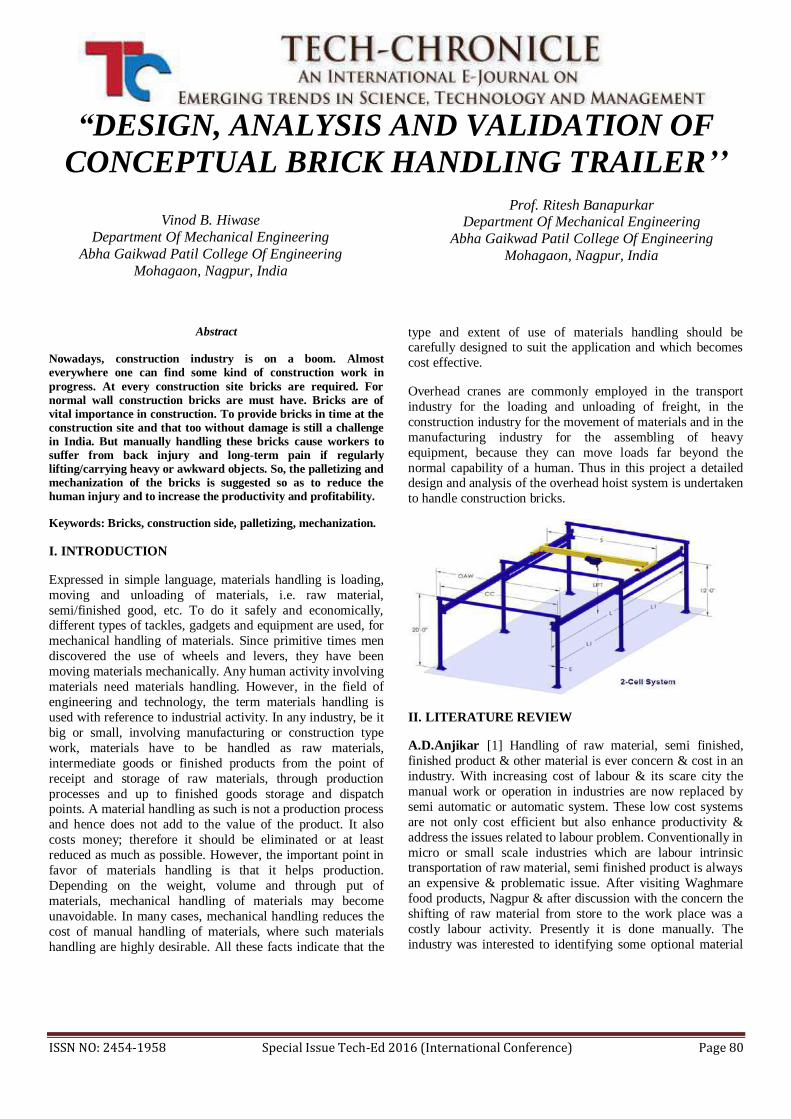
ISSN NO: 2454-1958 Special Issue Tech-Ed 2016 (International Conference) Page 80
“DESIGN, ANALYSIS AND VALIDATION OF
CONCEPTUAL BRICK HANDLING TRAILER’’
Vinod B. Hiwase
Department Of Mechanical Engineering
Abha Gaikwad Patil College Of Engineering
Mohagaon, Nagpur, India
Prof. Ritesh Banapurkar Department Of Mechanical Engineering
Abha Gaikwad Patil College Of Engineering
Mohagaon, Nagpur, India
Abstract
Nowadays, construction industry is on a boom. Almost
everywhere one can find some kind of construction work in
progress. At every construction site bricks are required. For
normal wall construction bricks are must have. Bricks are of
vital importance in construction. To provide bricks in time at the
construction site and that too without damage is still a challenge
in India. But manually handling these bricks cause workers to
suffer from back injury and long-term pain if regularly
lifting/carrying heavy or awkward objects. So, the palletizing and
mechanization of the bricks is suggested so as to reduce the
human injury and to increase the productivity and profitability.
Keywords: Bricks, construction side, palletizing, mechanization.
I. INTRODUCTION
Expressed in simple language, materials handling is loading,
moving and unloading of materials, i.e. raw material,
semi/finished good, etc. To do it safely and economically, different types of tackles, gadgets and equipment are used, for
mechanical handling of materials. Since primitive times men
discovered the use of wheels and levers, they have been
moving materials mechanically. Any human activity involving
materials need materials handling. However, in the field of
engineering and technology, the term materials handling is
used with reference to industrial activity. In any industry, be it
big or small, involving manufacturing or construction type
work, materials have to be handled as raw materials,
intermediate goods or finished products from the point of
receipt and storage of raw materials, through production
processes and up to finished goods storage and dispatch points. A material handling as such is not a production process
and hence does not add to the value of the product. It also
costs money; therefore it should be eliminated or at least
reduced as much as possible. However, the important point in
favor of materials handling is that it helps production.
Depending on the weight, volume and through put of
materials, mechanical handling of materials may become
unavoidable. In many cases, mechanical handling reduces the
cost of manual handling of materials, where such materials
handling are highly desirable. All these facts indicate that the
type and extent of use of materials handling should be carefully designed to suit the application and which becomes
cost effective.
Overhead cranes are commonly employed in the transport
industry for the loading and unloading of freight, in the
construction industry for the movement of materials and in the
manufacturing industry for the assembling of heavy
equipment, because they can move loads far beyond the
normal capability of a human. Thus in this project a detailed design and analysis of the overhead hoist system is undertaken
to handle construction bricks.
II. LITERATURE REVIEW
A.D.Anjikar [1] Handling of raw material, semi finished,
finished product & other material is ever concern & cost in an
industry. With increasing cost of labour & its scare city the
manual work or operation in industries are now replaced by
semi automatic or automatic system. These low cost systems
are not only cost efficient but also enhance productivity &
address the issues related to labour problem. Conventionally in
micro or small scale industries which are labour intrinsic transportation of raw material, semi finished product is always
an expensive & problematic issue. After visiting Waghmare
food products, Nagpur & after discussion with the concern the
shifting of raw material from store to the work place was a
costly labour activity. Presently it is done manually. The
industry was interested to identifying some optional material
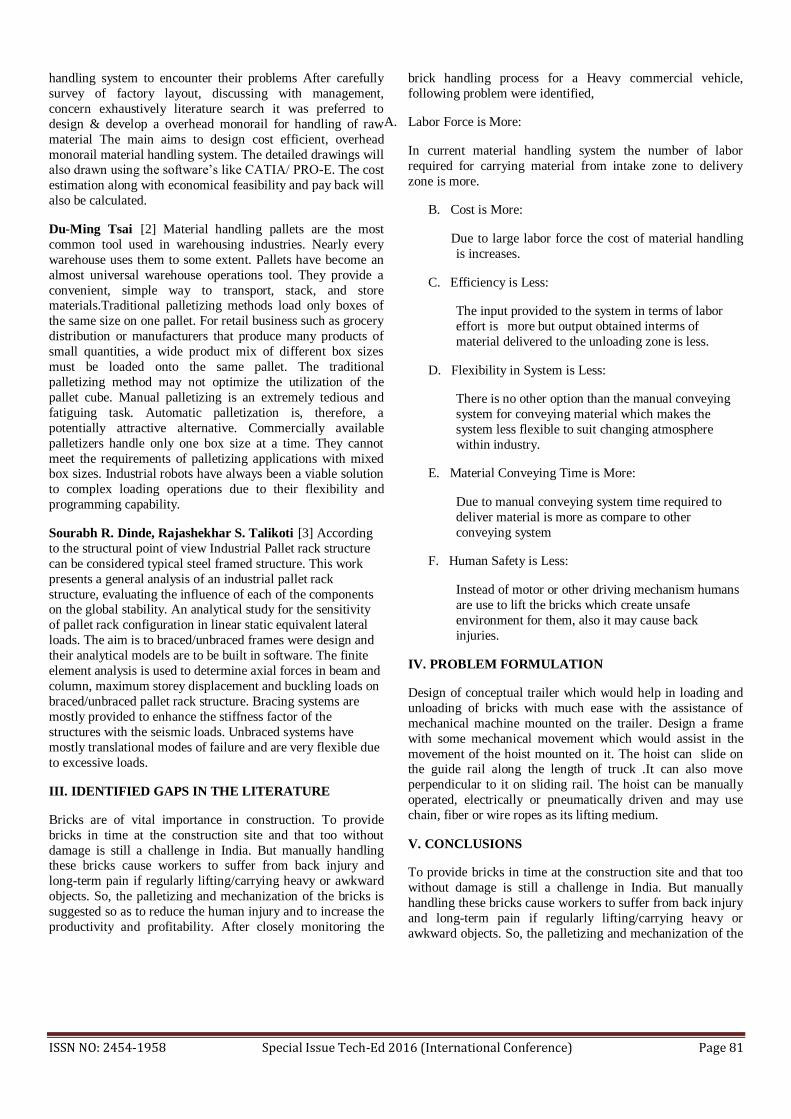
ISSN NO: 2454-1958 Special Issue Tech-Ed 2016 (International Conference) Page 81
handling system to encounter their problems After carefully
survey of factory layout, discussing with management,
concern exhaustively literature search it was preferred to
design & develop a overhead monorail for handling of raw
material The main aims to design cost efficient, overhead
monorail material handling system. The detailed drawings will also drawn using the software’s like CATIA/ PRO-E. The cost
estimation along with economical feasibility and pay back will
also be calculated.
Du-Ming Tsai [2] Material handling pallets are the most
common tool used in warehousing industries. Nearly every
warehouse uses them to some extent. Pallets have become an
almost universal warehouse operations tool. They provide a
convenient, simple way to transport, stack, and store materials.Traditional palletizing methods load only boxes of
the same size on one pallet. For retail business such as grocery
distribution or manufacturers that produce many products of
small quantities, a wide product mix of different box sizes
must be loaded onto the same pallet. The traditional
palletizing method may not optimize the utilization of the
pallet cube. Manual palletizing is an extremely tedious and
fatiguing task. Automatic palletization is, therefore, a
potentially attractive alternative. Commercially available
palletizers handle only one box size at a time. They cannot
meet the requirements of palletizing applications with mixed box sizes. Industrial robots have always been a viable solution
to complex loading operations due to their flexibility and
programming capability.
Sourabh R. Dinde, Rajashekhar S. Talikoti [3] According
to the structural point of view Industrial Pallet rack structure
can be considered typical steel framed structure. This work
presents a general analysis of an industrial pallet rack
structure, evaluating the influence of each of the components on the global stability. An analytical study for the sensitivity
of pallet rack configuration in linear static equivalent lateral
loads. The aim is to braced/unbraced frames were design and
their analytical models are to be built in software. The finite
element analysis is used to determine axial forces in beam and
column, maximum storey displacement and buckling loads on
braced/unbraced pallet rack structure. Bracing systems are
mostly provided to enhance the stiffness factor of the
structures with the seismic loads. Unbraced systems have
mostly translational modes of failure and are very flexible due
to excessive loads.
III. IDENTIFIED GAPS IN THE LITERATURE
Bricks are of vital importance in construction. To provide
bricks in time at the construction site and that too without
damage is still a challenge in India. But manually handling these bricks cause workers to suffer from back injury and
long-term pain if regularly lifting/carrying heavy or awkward
objects. So, the palletizing and mechanization of the bricks is
suggested so as to reduce the human injury and to increase the
productivity and profitability. After closely monitoring the
brick handling process for a Heavy commercial vehicle,
following problem were identified,
A. Labor Force is More:
In current material handling system the number of labor
required for carrying material from intake zone to delivery
zone is more.
B. Cost is More:
Due to large labor force the cost of material handling
is increases.
C. Efficiency is Less:
The input provided to the system in terms of labor
effort is more but output obtained interms of
material delivered to the unloading zone is less.
D. Flexibility in System is Less:
There is no other option than the manual conveying
system for conveying material which makes the
system less flexible to suit changing atmosphere
within industry.
E. Material Conveying Time is More:
Due to manual conveying system time required to
deliver material is more as compare to other
conveying system
F. Human Safety is Less:
Instead of motor or other driving mechanism humans
are use to lift the bricks which create unsafe
environment for them, also it may cause back
injuries.
IV. PROBLEM FORMULATION
Design of conceptual trailer which would help in loading and
unloading of bricks with much ease with the assistance of
mechanical machine mounted on the trailer. Design a frame
with some mechanical movement which would assist in the
movement of the hoist mounted on it. The hoist can slide on the guide rail along the length of truck .It can also move
perpendicular to it on sliding rail. The hoist can be manually
operated, electrically or pneumatically driven and may use
chain, fiber or wire ropes as its lifting medium.
V. CONCLUSIONS
To provide bricks in time at the construction site and that too
without damage is still a challenge in India. But manually
handling these bricks cause workers to suffer from back injury
and long-term pain if regularly lifting/carrying heavy or
awkward objects. So, the palletizing and mechanization of the

ISSN NO: 2454-1958 Special Issue Tech-Ed 2016 (International Conference) Page 82
bricks is suggested so as to reduce the human injury and to
increase the productivity and profitability.
REFERENCES
[1] A.D.Anjikar, “Design, Development of Overhead Monorail for Material
Handling System For food Processing Industry” ISSN : 2249-5762, Vol. 3,
Issue 2, May - Oct 2013 .
[2] Du-Ming Tsai, “Modeling and analysis of three-dimensional robotic
palletizing systems for mixed carton sizes” .
[3] Sourabh R. Dinde, Rajashekhar S. Talikoti, “Structural Behavior Of
Industrial Pallet Rack With Braced And Unbraced Frames”

ISSN NO: 2454-1958 Special Issue Tech-Ed 2016 (International Conference) Page 83
“Design & Fabrication of Self-Guided Chair system
for library book access’’
Yogesh A. Mangaonkar
Department Of Mechanical
Engineering Abha Gaikwad Patil College Of
Engineering, Mohagaon,Nagpur,
India
Prof.Ravindra Gandhe
Department Of Mechanical
Engineering Abha Gaikwad Patil College Of
Engineering
Mohagaon,Nagpur, India
Prof.Ajay Mahawadiwar
Head of Department Of Mechanical Engineering
Abha Gaikwad Patil College Of
Engineering Mohagaon,Nagpur, India
Abstract
A library is a collection of sources of information. It is necessary
to provide comfort to access a book specially while selecting
books from shelf. So in order to access book comfortably from
shelf at height up to 4 ft and more, an innovative idea of auto
guided smart chair system is implemented. Main motive behind
this concept is to allow person to sit on chair which will be auto
guided and same chair can lift to access books from a heighted
shelf. Some ergonomic points are also considered to design chair.
This paper discusses design and fabrication of smart library
chair which will lift at a particular height and rotate at an angle
of 45 degree. The operation of lifting and revolving of chair will
done by pneumatic system and the base platform provided with
wheels will turn and move by a battery operated system. This concept is more beneficial for a handicapped person.
Keywords: Pneumatic system, Library book issue, self-guided, human comfort.
I. INTRODUCTION
A library is a collection of sources of information and similar
resources, made accessible to a defined community for
reference or borrowing. It provides physical or digital access
to material, and may be a physical building or room. There are
lots of issues while taking out books from heighted shelves.
Hereby, to overcome this issue we are implementing a new
system which will be pneumatic based.
There are two main branches of fluid power.
1. Pneumatics
2. Hydraulics
These two branches of fluid power are very different in
behavior and performance, and hence are treated separately.
Often the two branches are used in conjunction with each
other, but unless the basic laws are studied separately, the result could be misleading. The study of pneumatics deals
with system operated with air or other gaseous media. The
term “pneuma” is derived from the ancient Greek and means
breath or wind. The term “pneumatics” was derived from the
word “pneuma”; pneumatics, literally, “pertaining to air”, has
one set of fundamental laws governing the behavior of
gaseous fluids. Pneumatics (Greek: which means "breath") is a
branch of physics applied to technology that makes use of gas
or pressurized air. Pneumatic systems used extensively
in industry are commonly powered by compressed air or
compressed inert gases. A centrally located and electrically powered compressor powers cylinders, air motors, and other
pneumatic devices. A pneumatic system controlled through
manual or automatic solenoid valves is selected when it
provides a lower cost, more flexible, or safer alternative to
electric and actuators. Pneumatic systems are cheaper and
light in weight and air is easily available compared to
hydraulic fluids.
Fig 1. Concept diagram of smart chair system

ISSN NO: 2454-1958 Special Issue Tech-Ed 2016 (International Conference) Page 84
II. LITERATURE REVIEW
Jasmer Singh (1990) carried out research for doctorate degree on the topic “College Libraries in Punjab: A Statistical
Analysis of the Problems” He conducted a survey to find the
problems being faced by college libraries of Punjab and
Chandigarh and also attempted to study the use of libraries.
Mr. S.R. Mujumdar have discussed on pneumatic system
working in which it has been explained, that in automation
technology pneumatic technology is one of advance part in
order to utilize a appropriate technology.
III. IDENTIFIED GAPS IN THE LITERATURE
The aim of the project is to overcome the problems faced
while collecting books from heighted shelves which is a
problem discussed in library analysis literature and use of pneumatic system compared to hydraulic system. Make use of
pneumatic system that is readily available and cheap.
IV. PROBLEM FORMULATION
Many problems observed in library like to select books from big library shelves by manually effort. Problems face out to
when we take out the books from heighted shelves.To prepare
efficient and cost effective system.
V. CONCLUSIONS
We will fabricate such type of smart library chair that can
easily lift a person to provide human comfort level inside the
library while selection of books by the use of pneumatic
system that is readily available and cheap to prepare efficient
and cost effective system.
Lifting at a particular height and rotate at an angle of 45
degree.
Lifting and revolving of chair operation will be done by
pneumatic system and the base platform provided with wheels
will turn and move by battery operated system.
REFERENCES
[1] J. L. Shearer, "Study of Pneumatic Process in the Continuous Control of Motion with Compressed Air," Transactions of the ASME, pp. 233-249, 1956.
[2] Davis, K. Kotowski, S., Sharma, B., Herrmann, D. and Krishnan, A. (2009).
Combating the Effects of Sedentary Work: Postural Variability Reduces
Musculoskeletal Discomfort, in Proceedings of the Human Factors and Ergonomics Society.
[3] Du Jingmin, Fu Xiaoyun, Li Baoren. Experimental Research on High
Precision Real-time Control of Air Temperature[J]. Chinese Hydraulic and Pneumatic, 2002,12: 19-20
ISSN NO: 2454-1958 Special Issue Tech-Ed 2016 (International Conference) Page 85
Desing And Analysis Of Roller Mill Bearing Using
FEA Chhaya Ladhi
department of mechanical engineering ,Nagpur India
Prof.Ajay Mahawadiwar HOD of mechanical engineering department
Abstract: Tapered Cylindrical roller bearing is used in aircraft
Rolling mill, machine tools, steel industries and other application
due to their precision and high load carrying capacity. In this
project tapered roller bearing which is use in rolling mill
industry that will design and calculate the stress strain ,also
design 4-Row tapered roller bearing and compare which is
suitable. The theoretical value of stress and strain on bearing will
compare with software value after applying a particular load,
drafting file will generate in AutoCAD, 3-D model in pro-e and stress analysis in ansys.
Keywords—Stress,strain
1. Introduction
There are five types of rolling-elements that are used in rolling
element bearings: balls, cylindrical rollers, spherical rollers,
tapered rollers, and needle rollers. Most rolling-element
bearings feature cages. The cages reduce friction, wear, and
bind by preventing the elements from rubbing against each
other. Caged roller bearings were invented by John
Harrison in the mid-18th century as part of his work on
chronometers. Typical rolling-element bearings range in size
from 10 mm diameter to a few meters diameter, and have
load-carrying capacity from a few tens of grams to many
thousands of tones. Cylindrical roller bearings with Deep end-cavity rollers are advantageous in applications where load and
speed are major considerations in the operations of the
bearings. An improvement in load distribution and thus load
capacity may be realized, as well as contact stress is also
reduced considerably by using a bearing with Deep end-cavity
rollers. This bearing is basically used in rolling mill where
heavy load is applied on bearing. Deep end-cavity roller is
proposed for rolling mill bearings with a view to reducing the
contact stress distribution for life improvement. Deep end-
cavity rollers are one of the advanced concept used to
eliminate the sharp edge-stresses at the apexes of the roller.
The main objective of this work is to enlighten the engineers to make use of deep cavity rollers to increase load carrying
capacity and improvement of fatigue life.
1.1Rolling Contact Fatigue:
The origin of RCF failure is understood to be stress
concentrations, which initiate and propagate fatigue crack
under cyclic loading. These stress concentrations occur due to
surface or subsurface stress risers or to the geometry and kinematics of the contacting pair. Figure 4 summarizes a list
of these stress risers, which have been the subject of numerous
scientific investigations that have resulted in the improved life
of rolling-element bearings. With the introduction of cleaner
steels and greater precision in the manufacture of bearings,
most of the surface and subsurface stress risers listed in Fig. 4
have been addressed. Nevertheless, the demand to operate
rolling element bearings in harsh tribolgical environments of
lubrication, load, contamination, and temperature push for
higher fatigue limits, and thus call for improved understanding
of the RCF failure modes. Four distinct failure modes have been established in rolling-contact bearings[3]. These
classifications include wear-type failures, plastic flow, contact
fatigue, and bulk failures.
Terminology of Tapered Cylindrical Roller bearing

ISSN NO: 2454-1958 Special Issue Tech-Ed 2016 (International Conference) Page 86
Industrial bearing failure by rolling contact fatigue rolling
element bearings are widely used in industrial machinery to
allow relative motion and shaft load RCF fatigue occurs due to
the result of cyclic stresses developed at bearing contact
surface during operation. Rolling contact fatigue includes tri-
axial stress state, high hydrostatic stress component, non-proportional loading, and during loading cycles changing
planes of maximum shear stress, that leads to sub-surface
cracks. Sliding forces can cause failure to originate at the
subsurface that propagate parallel to the surface and it may
significantly reduce bearing life. Rolling contact fatigue may
divide into two categories [4], i.e. surface and sub-surface
initiated. Further classification of RCF may do by location and
appearance of the fatigue, and factor that leads to crack
initiation which causes bearing failure. These factors may
relate to lubrication, materials, operation and mountings.
Fractography [4] plays a vital role to identify this defects.3.1.
Wear mechanism RCF wear mechanism involves fretting. Fretting wear may be of two types, i.e. contact corrosion and
brine ling. Contact corrosion takes place between the of the
bearing and the shaft. Fretting occurs within the contact area
of the bearing,
2. Objective: Bearing used for roller mill is very important
bearing for that selection of proper bearing much important as
well as maintain the life of bearing To increase the life of bearing by reducing the failure causes of bearing of it also to
decrease the cost of bearing, sometimes cause of failure is
contact fatigue between the rollers, if we improve the design
of tapered roller to avoid the failure then we can improve the
life of bearing which very beneficial to rolling mill industry.
3. FAILURE ANALYSIS OF HCRB
In the present work failure analysis of Hollow Cylindrical
Roller Bearing (HCRB) made from material AISI 52100 is
carried out to understand the type and mode of failure. This
bearing is basically used in earthmoving equipments where
heavy load is applied on bearing. The photograph of this
bearing is shown in Fig. 5 with hollow roller in breakage
condition. The objective of this work is to identify the type of
failure by using material oriented investigations. Also Fig. 6
shows the cross section of hollow roller with its dimensions.
The hollowness of this roller is 42%.
Much work has been devoted to characterizing alterations of
the micro-structure, hardness and residual stress distribution
occurring in rolling bearing components during bearing
operations. The results of this work provide a technological
3.1 Rolling Bearing Life :
Life prediction of a roller or ball bearing is based on the
statistical treatment of full-scale bearing tests conducted under
controlled environments, for example, full-film lubrication
regime, dust-free environment, and so on. Although these
controlled environments are useful indicators of the RCF
performance of rolling-element bearings, the actual life of a
given bearing can significantly vary from the predicted life. It
was reported that only 10% of all bearing replacements in the
field can be attributed to classic RCF failure, whereas the
remaining 90% are made for reasons and conditions not even
closely related to RCF. Although this highlights the improvements achieved in designing and manufacturing
better-quality bearings[9], it also indicates that other factors in
addition to RCF need to be considered to predict the life of a
bearing. Even under the controlled conditions of load,
lubrication, and alignment in a dust-, corrosion-, and moisture-
free environment, there is generally large scatter in the RCF
performance for a given bearing. Bearing manufacturers thus
provide a statistical probability of the life of a bearing on the
basis of experimental results conducted at a given load, speed,
and lubrication regime. Weibull analysis can then be used to
estimate the life expectancy of the bearing. Bearing life is
generally referred to as L10, L50 or L90 and indicate the probability of failure (e.g., L10 indicates that 10% of the
bearings in a given population will fail before a fixed number
of stress cycles are reached). Lundberg and Palmgren
developed a theory that indicates the life of a roller or ball
bearing at a given load (P) can be approximated using the
relationL10=(C/P where L is the fatigue life in a million
revolutions, C is the load that gives an L10 life of 1 million
revolutions, and n is a constant for a bearing type (e.g., n _ 3
for ball bearings and 10/3 for roller bearings). A detailed list
of various values of n for different bearing types can be seen
elsewhere. The use of a specific value of n is critical for a given bearing type, and the product law of probability is in
effect (e.g., as the design changes from single-row to double
row bearings). Hence, the life of a double-row bearing under
similar conditions to that of a single- row bearing of identical
design will be less than that of a single-row bearing.
3.2 Vibration response due to local defecton bearing
element.
The vibration signal generated by the faulty bearing can be
analyzed in time domain or frequency domain. The time
domain vibration analysis is depend on the estimation of
statistical parameters like crest factor, skewness, kurtosis,
probability density curve, etc. Among this kurtosis is the most
effective parameter in a time domain which is calculated using
following expression (1). For the healthy bearing the kurtosis
is closer to 3 and for defective bearing it is more than 3. Another way of defect consideration adopted by the
researchers is addition of extra displacement in total
deflection. Initially a simple dynamic model was proposed by
McFadden and Smith [14-15]. In their theoretical and
experimental studies they have considered single point defect
and multiple point defects on the inner race. The impulses
generated by interaction of defect with inner race has been
generated by delta function while, variations in the load
around the bearing has been computed by Stribeck equation
under radial load. Su and Lin [16] have extended the original
work of McFadden to characterize the vibrations measured
from bearings subject to various loading conditions and with
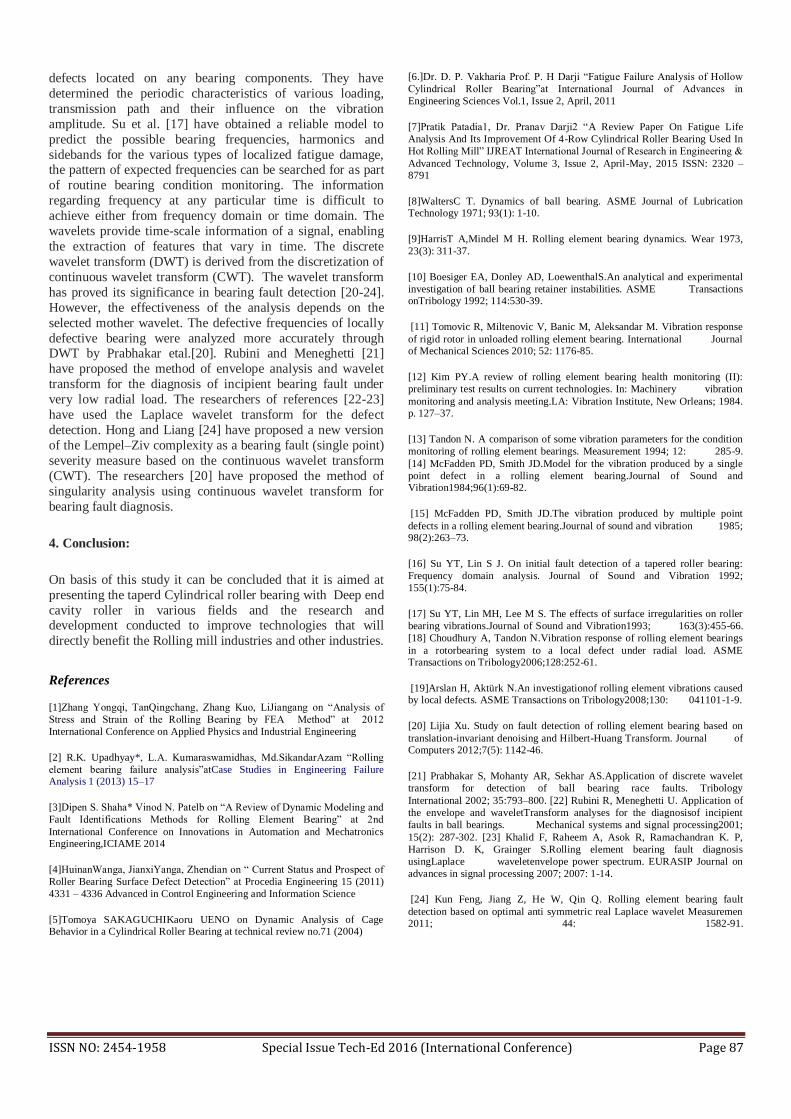
ISSN NO: 2454-1958 Special Issue Tech-Ed 2016 (International Conference) Page 87
defects located on any bearing components. They have
determined the periodic characteristics of various loading,
transmission path and their influence on the vibration
amplitude. Su et al. [17] have obtained a reliable model to
predict the possible bearing frequencies, harmonics and
sidebands for the various types of localized fatigue damage, the pattern of expected frequencies can be searched for as part
of routine bearing condition monitoring. The information
regarding frequency at any particular time is difficult to
achieve either from frequency domain or time domain. The
wavelets provide time-scale information of a signal, enabling
the extraction of features that vary in time. The discrete
wavelet transform (DWT) is derived from the discretization of
continuous wavelet transform (CWT). The wavelet transform
has proved its significance in bearing fault detection [20-24].
However, the effectiveness of the analysis depends on the
selected mother wavelet. The defective frequencies of locally
defective bearing were analyzed more accurately through DWT by Prabhakar etal.[20]. Rubini and Meneghetti [21]
have proposed the method of envelope analysis and wavelet
transform for the diagnosis of incipient bearing fault under
very low radial load. The researchers of references [22-23]
have used the Laplace wavelet transform for the defect
detection. Hong and Liang [24] have proposed a new version
of the Lempel–Ziv complexity as a bearing fault (single point)
severity measure based on the continuous wavelet transform
(CWT). The researchers [20] have proposed the method of
singularity analysis using continuous wavelet transform for
bearing fault diagnosis.
4. Conclusion:
On basis of this study it can be concluded that it is aimed at
presenting the taperd Cylindrical roller bearing with Deep end
cavity roller in various fields and the research and development conducted to improve technologies that will
directly benefit the Rolling mill industries and other industries.
References
[1]Zhang Yongqi, TanQingchang, Zhang Kuo, LiJiangang on “Analysis of
Stress and Strain of the Rolling Bearing by FEA Method” at 2012
International Conference on Applied Physics and Industrial Engineering
[2] R.K. Upadhyay*, L.A. Kumaraswamidhas, Md.SikandarAzam “Rolling
element bearing failure analysis”atCase Studies in Engineering Failure Analysis 1 (2013) 15–17
[3]Dipen S. Shaha* Vinod N. Patelb on “A Review of Dynamic Modeling and
Fault Identifications Methods for Rolling Element Bearing” at 2nd
International Conference on Innovations in Automation and Mechatronics Engineering,ICIAME 2014
[4]HuinanWanga, JianxiYanga, Zhendian on “ Current Status and Prospect of
Roller Bearing Surface Defect Detection” at Procedia Engineering 15 (2011)
4331 – 4336 Advanced in Control Engineering and Information Science
[5]Tomoya SAKAGUCHIKaoru UENO on Dynamic Analysis of Cage Behavior in a Cylindrical Roller Bearing at technical review no.71 (2004)N
[6.]Dr. D. P. Vakharia Prof. P. H Darji “Fatigue Failure Analysis of Hollow
Cylindrical Roller Bearing”at International Journal of Advances in
Engineering Sciences Vol.1, Issue 2, April, 2011
[7]Pratik Patadia1, Dr. Pranav Darji2 “A Review Paper On Fatigue Life
Analysis And Its Improvement Of 4-Row Cylindrical Roller Bearing Used In
Hot Rolling Mill” IJREAT International Journal of Research in Engineering &
Advanced Technology, Volume 3, Issue 2, April-May, 2015 ISSN: 2320 – 8791
[8]WaltersC T. Dynamics of ball bearing. ASME Journal of Lubrication Technology 1971; 93(1): 1-10.
[9]HarrisT A,Mindel M H. Rolling element bearing dynamics. Wear 1973,
23(3): 311-37.
[10] Boesiger EA, Donley AD, LoewenthalS.An analytical and experimental
investigation of ball bearing retainer instabilities. ASME Transactions onTribology 1992; 114:530-39.
[11] Tomovic R, Miltenovic V, Banic M, Aleksandar M. Vibration response
of rigid rotor in unloaded rolling element bearing. International Journal of Mechanical Sciences 2010; 52: 1176-85.
[12] Kim PY.A review of rolling element bearing health monitoring (II):
preliminary test results on current technologies. In: Machinery vibration
monitoring and analysis meeting.LA: Vibration Institute, New Orleans; 1984. p. 127–37.
[13] Tandon N. A comparison of some vibration parameters for the condition
monitoring of rolling element bearings. Measurement 1994; 12: 285-9.
[14] McFadden PD, Smith JD.Model for the vibration produced by a single
point defect in a rolling element bearing.Journal of Sound and Vibration1984;96(1):69-82.
[15] McFadden PD, Smith JD.The vibration produced by multiple point
defects in a rolling element bearing.Journal of sound and vibration 1985; 98(2):263–73.
[16] Su YT, Lin S J. On initial fault detection of a tapered roller bearing:
Frequency domain analysis. Journal of Sound and Vibration 1992;
155(1):75-84.
[17] Su YT, Lin MH, Lee M S. The effects of surface irregularities on roller
bearing vibrations.Journal of Sound and Vibration1993; 163(3):455-66.
[18] Choudhury A, Tandon N.Vibration response of rolling element bearings
in a rotorbearing system to a local defect under radial load. ASME Transactions on Tribology2006;128:252-61.
[19]Arslan H, Aktürk N.An investigationof rolling element vibrations caused by local defects. ASME Transactions on Tribology2008;130: 041101-1-9.
[20] Lijia Xu. Study on fault detection of rolling element bearing based on
translation-invariant denoising and Hilbert-Huang Transform. Journal of Computers 2012;7(5): 1142-46.
[21] Prabhakar S, Mohanty AR, Sekhar AS.Application of discrete wavelet
transform for detection of ball bearing race faults. Tribology
International 2002; 35:793–800. [22] Rubini R, Meneghetti U. Application of
the envelope and waveletTransform analyses for the diagnosisof incipient
faults in ball bearings. Mechanical systems and signal processing2001;
15(2): 287-302. [23] Khalid F, Raheem A, Asok R, Ramachandran K. P,
Harrison D. K, Grainger S.Rolling element bearing fault diagnosis
usingLaplace waveletenvelope power spectrum. EURASIP Journal on
advances in signal processing 2007; 2007: 1-14.
[24] Kun Feng, Jiang Z, He W, Qin Q. Rolling element bearing fault
detection based on optimal anti symmetric real Laplace wavelet Measuremen 2011; 44: 1582-91.

ISSN NO: 2454-1958 Special Issue Tech-Ed 2016 (International Conference) Page 88
Dual Purpose Refrigeration System: A Review Pravin Meshram
1,
Students, Tulsiramji Gaikwad-
Patil College of Engineering, Buttibori
Nagpur,441108(MS)India
Subham Shende2,
Students, Tulsiramji Gaikwad-
Patil College of Engineering, Buttibori
Nagpur,441108(MS)India
Mr.Vishwjeet Ambade 3
Assistant Professor,Tulsiramji
Gaikwad- Patil College of Engineering, Buttibori
Nagpur,441108(MS)India
ABSTRACT:
A refrigerator is a common household appliance that
consists of a thermally insulated compartment and a heat
pump that transfers heat from the inside of the fridge to its
external environment so that the inside of the fridge is cooled
to a temperature below the ambient temperature of the room.
Cooling is a popular food storage technique in developed
countries. Lower temperature in a confined volume lowers the
reproduction rate of bacteria, so the refrigerator reduces the rate of spoilage.
The Multipurpose refrigeration system is making use
of both the temperature below the atmosphere and above the
atmosphere is to be achieved in freezer section and the
temperature above the atmosphere is maintained in hot
section. The temperature will below the atmosphere can be
used as a food preservative, because it prevents the bacteria
which can spoil the food. Also this temperature can be used to
make ice cubes and to cool water for drinking purpose.
Heating chamber is the heart of this project. It is used for
heating purpose which is the need of new era. No extra amount of energy is consumed during the working of heating chamber.
Keywords: Heat Transfer, Heating Chamber, Thermal Insulation.
INTRODUCTION
A refrigerator is a common household appliance that
consists of a thermally Insulated compartment and which
when works, transfer heat from the inside of the
compartment to its external environment. Generally it works
on the vapour compression cycle that uses a circulating
liquid refrigerant which absorbs heat from the space to be
cooled and subsequently rejects that heat elsewhere. All
such systems have four components: - a compressor, a condenser, evaporator and expansion valve.
Circulating refrigerant enters the
compressor in the thermodynamic state known as a
saturated vapour and is compressed to a higher pressure,
resulting in a higher temperature. The hot, compressed
vapour is then in the thermodynamic state as a known
superheated vapour and it is at a temperature and pressure at
which it can be Condensed with typically available cooling
water or cooling air. That hot vapour is routed through a
condenser where it is cooled and condensed into liquid by
flowing through a coil or tubes with cool water or cool air flowing across the coil or tubes. This is where the
circulating refrigerant rejects heat from the system and the
rejected heat is carried away by the air. The condensed
liquid refrigerant, in the thermodynamic state known as a
saturated liquid, is next routed through an expansion valve
where it undergoes an abrupt reduction in pressure. That
pressure reduction results in the adiabatic flash evaporation
of a part of the liquid refrigerant. The auto-refrigeration
effect of the adiabatic flash evaporation lower the
temperature of the liquid and vapour refrigerant mixture to
where it is colder than the temperature of the enclosed space
to be refrigerated. The cold mixture is then routed through the coil or tubes in the evaporator. A fan circulates the warm
air in the enclosed space across the coil or tubes carrying the
cold refrigerant liquid and vapour mixture. That warm air
evaporates the liquid part of the cold refrigerant mixture. At
the same time, the circulating air is cooled and thus lowers
the temperature of the enclosed space to the desired
temperature. The evaporator is where the circulating
refrigerant absorbs and removes heat which is subsequently
rejected in the condenser and transferred elsewhere by the
water or air used in the condenser. To complete the
refrigeration cycle, the refrigerant vapour from the evaporator is again a saturation vapour and is routed back
into the compressor. And cycle is continued.
In the project, the condenser tube is cut in two
sections: one is for cooling purpose while other is for
heating purpose. The waste heat from the compressor is
delivered to the hot box and the hot temperature is
maintained inside the heating chamber. The hot box is made
up of steel box on which copper tubes are wound. Glass wool is used as insulation for this hot box so that the
temperature inside the hot box is more than that of ambient
temperature.

ISSN NO: 2454-1958 Special Issue Tech-Ed 2016 (International Conference) Page 89
LITERATURE REVIEWS
A. MOHD FAIZANRAJA QASIMRAJA SHEIKH, PROF. P. P. MANWATKAR, presented a paper on
“MULTIPURPOSE REFRIGERATION SYSTEM”
The Multipurpose refrigeration system is making
use of both the temperature below the atmosphere and above
the atmosphere is to be achieved in freezer section and the
temperature above the atmosphere is maintained in hot
section. The temperature will below the atmosphere can be
used as a food preservative, because it prevents the bacteria and other type of formation which can spoil the food article.
Also this temperature can be used to make ice cubes and to
cool water for drinking purpose. Heating chamber is the
heart of this project. It is used for heating purpose which is
the need of new era. No extra amount of energy is consumed
during the working of heating chamber. Total cost
estimation of the project is near about Rs. 3300/-. After
doing the analysis, COP of the system is increased, because
of replacement of refrigerant from R-12 to hydrocarbon.
B. S. C. WALAWADE, B.R. BARVE, P. R.
KULKARNI, presented a paper on “DESIGN AND
DEVELOPMENT OF WASTE HEAT RECOVERY
SYSTEM FOR DOMESTIC REFRIGERATOR”
Heat is energy, so energy saving is one of the key
matters from view point of fuel consumption and for the protection of global environment. So it is necessary that a
significant and concrete effort should be made for
conserving energy through waste heat recovery too. The
main objective of this paper is to study “Waste Heat
recovery system for domestic refrigerator”. An attempt has
been made to utilize waste heat from condenser of
refrigerator. This heat can be used for number of domestic
and industrial purposes. In minimum constructional,
maintenance and running cost, this system is much useful
for domestic purpose. It is valuable alternative approach to
improve overall efficiency and reuse the waste heat. The
study has shown that such a system is technically feasible and economically viable.
C. ENG. NASER R. M. AL-AJMI, presented a paper
on “COEFFICIENT OF PERFORMANCE
ENHANCEMENT OF REFRIGERATION CYCLES”
Refrigerator is one of the home appliances
utilizing mechanical vapour compression cycle in its
process. Performance of the systems becomes the main issue
and many researches are still on going to evaluate and
improve the efficiency of any used system. Therefore, this
paper presents an experimental investigation of the
performance of the refrigeration cycles. A small refrigerator
is used as the test rig. The Coefficient of Performance
(COP) is studied by using different condenser designs and
under varying evaporator loads. Three condenser designs are
used in present work. These condensers are regular condenser of domestic refrigerator, condenser with copper
plain tubes (Cond.1) and condenser with copper tubes
welded with stainless steel flat plate (Cond.2). Pressures and
temperatures measurements of each point in the
refrigeration cycle are collected in order to evaluate the
refrigerator performance. The results showed that the
average COP of Cond.1 and Cond.2 are increased up to 20
% and 14% respectively more than regular condenser design under no load. The evaporator load effects on the machine
performance, where the COP of the machine increases with
the increase of the evaporator load.
D. G.G. MOMIN, S.R.DESHMUKH, M.T. DESHMUKH,
P.T.CHAVAN, P.P.CHOUDHARI, presented a paper on
“COP ENHANCEMENT OF DOMESTIC
REFRIGERATOR BY RECOVERING HEAT FROM THE
CONDENSER”
Refrigerator has become an essential commodity
rather than luxury item. The heat absorbed in refrigerated
space and the compressor work added to refrigerant is too
rejected to ambient through a condenser. Our aim is to
recover waste heat from condenser unit of a household
refrigerator to improve the performance of the system. The
heat recovery from the household refrigerator is by thermo siphon. From the experimentation it was found that after
recovering heat from the condenser of the conventional
refrigerator its performance get improved than conventional
refrigerator.
E. P.SANTOSH KUMAR, P.SITARAMA RAJU,
S.SURESH KUMAR, P. V. V. SATYANARAYANA, T.
ARJUN, G. S. D. K SRAVANI, presented a paper on
“REFRIGERANT RECOVERY UNIT”
This project is made with preplanning, that it
provides flexibility in operation. This innovation has made
the more desirable and economical. This project
“REFRIGERANT RECOVERY UNIT SYSTEM” is
designed with the hope that it is very much economical to
recover the refrigerants and useful to small and large
industrial applications.
With the use of refrigerant recovery unit, we can
recover the refrigerant from Any Repair or service
or leakage systems (central AC systems).It is very
costly but we fabricate it as very low cost. It is very useful
to recover the refrigerants in central „AC‟ Plants because in
that they use 50-3000 tons. By the using of refrigerant
recovery unit, we protect
the ozone layer from the choro-fora carbons present in the
refrigerants when they exposed to atmosphere. We can also
protect the atmosphere from global warming temperature.
These systems are used for most of air conditioning and
refrigeration applications such as comfort air conditioning
industrial applications. It is very useful in future to recover
the banned refrigerants. It is very useful in every house.

ISSN NO: 2454-1958 Special Issue Tech-Ed 2016 (International Conference) Page 90
F] Y. A. PATIL, H. M. DANGE, presented a paper on
“IMPROVING THE PERFORMANCE OF HOUSEHOLD
REFRIGERATOR BY RECOVERING HEAT FROM THE
CONDENSER”
Refrigerator has become an essential commodity
rather than luxury item. The heat absorbed in refrigerated
space and the Compressor work added to refrigerant is too
rejected to ambient through a condenser. Our aim is to
recover waste heat from condenser unit of a household
refrigerator to improve the performance of the system. The
heat recovery from the household refrigerator is by thermo
siphon. From the experimentation it was found that after
recovering heat from the condenser of the conventional
refrigerator its performance get improved than conventional refrigerator. The maximum temperature achieved in water
tank with 100 litre of water is 45ºC at the full load
condition. If the water tank contains 50 litres water then it
gets heated to 45 ºC in just 5 to 6 hrs. After that
performance of the system gets decreased. So it needs
regular use of that hot water.
G] N. B. CHAUDHARI, P. N. CHAUDHARI, presented a paper on “HEAT RECOVERY SYSTEM FROM THE
CONDENSER OF A REFRIGERATOR – AN
EXPERIMENTAL ANALYSIS”
The Experimental apparatus of heat recovery
system from the condenser of a refrigerator was designed,
developed and constructed at cosmic refrigeration, Pune to
estimate the waste heat recovery from the condenser of a
refrigerator. In this article, we will presents an experimental setup that will help undergraduate mechanical engineering
students in understanding the basic heat transfer processes
by utilizing real life applications such as using waste heat
from a condenser of a refrigerator to heat water for
residential and commercial use. Heat recovery from
condenser of a refrigerator by thermo-siphon system is
attractive because it eliminates the need of a circulating
pump.
H] TANMAY PATIL, NITESH MEDHANE, YOGESH
MAHAPURE, KALPESH NAGMOTI, PROF. ANIL
DUBE, presented a paper on “A REVIEW ON
RECOVERING WASTE HEAT FROM CONDENSER OF
DOMESTIC REFRIGERATOR”
To review the energy savings associated with
improved utilization of waste heat from a domestic refrigerator. Domestic refrigerators may be operating
continuously to maintain proper food storage condition. The
continuous operation of this equipment accounts more
electrical energy consumption. So it is that a significant and
concrete effort should be made for conserving energy
through waste heat recovery. A significant amount of waste
heat is rejected by the condensers of refrigerator. So an
attempt has been made to utilize waste heat from the
condenser of a refrigerator. Practical uses of waste heat from
the domestic refrigerators are typically to space heating and
water heating in minimum constructional maintenance and
running cost. A cabin was installed on a domestic
refrigerator with condenser coils of refrigerator serving as
heating coils inside the cabin. Known quantity of water was
heated by the condenser coils (due to convection currents)
thereby increasing the overall COP of the refrigerator. Besides, the refrigerator may be used as conventional
refrigerator by keeping the cabin door open in case of
absence of heat sink.
CONCLUSION
The paper undertook a review based study into
coefficient of performance enhancement of a domestic air
cooled refrigerator by recovering heat from condenser in
terms of its background, originality, current status, and
researches. This all work has great significant for
developing new technologies relates to heat recovery from a
domestic refrigerator, in order to get cooling at low energy
cost, no harmful effect to environment and also having low
initial cost. So more attention is required in this area and lot
of work has to be done.
REFERENCES
1] Mohd Faizanraja Qasimraja Sheikh, Prof. P. P. Manwatkar, “MULTIPURPOSE REFRIGERATION SYSTEM”
2] S. C. Walawade, B.R. Barve, P. R. Kulkarni, “DESIGN AND
DEVELOPMENT OF WASTE HEAT RECOVERY SYSTEM FOR
DOMESTIC REFRIGERATOR”, IOSR Journal of Mechanical and Civil
Engineering (IOSR-JMCE) ISSN: 2278-1684, PP: 28-32 www.iosrjournals.org
3] Eng. Naser R. M. Al-Ajmi, “COEFFICIENT OF PERFORMANCE
ENHANCEMENT OF REFRIGERATION CYCLES” ISSN : 2248-9622,
Vol. 5, Issue 3, ( Part -3) March 2015, pp.117-125. FROM THE
CONDENSER”, International Journal of Research in Advent Technology,
Vol.2, No.5, May 2014 E-ISSN: 2321-9637.
4] G .G. Momin, S. R. Deshmukh, M. T. Deshmukh, P. T. Chavan, P. P.
Choudhari, “COP ENHANCEMENT OF DOMESTIC REFRIGERATOR BY RECOVERING HEAT.
5] P. Santosh Kumar, P. Sitarama Raju, S. Suresh Kumar, P. V. V.
Satyanarayana, T. Arjun, G. S. D. K. Sravani “REFRIGERANT
RECOVERY UNIT”, (IJITR) International Journal Of Innovative
Technology And Research Volume No.3, Issue No.2, February – March
2015, 1979 – 1992.
6] Y. A. Patil1, H. M. Dange, “IMPROVING THE PERFORMANCE OF
HOUSEHOLD REFRIGERATOR BY RECOVERING HEAT FROM
THE CONDENSER”, International Journal of Science and Research
(IJSR), India Online ISSN: 2319-7064.
7] N. B. Chaudhari, P. N. Chaudhar, “ HEAT RECOVERY SYSTEM
FROM THE CONDENSER OF A REFRIGERATOR – AN
EXPERIMENTAL ANALYSIS”, ISSN (Print): 2319-3182, Volume -4,
Issu-2, 2015.
8] Tanmay Patil, Nitesh Medhane, Yogesh Mahapure, Kalpesh Nagmoti,
Prof. Anil Dube, “A REVIEW ON RECOVERING WASTE HEAT FROM
CONDENSER OF DOMESTIC REFRIGERATOR”, International Journal
of scientific research and management (IJSRM) ||\ Volume||3||Issue||3||Pages||2409-2414||2015||
Website: www.ijsrm.in ISSN (e): 2321-341

ISSN NO: 2454-1958 Special Issue Tech-Ed 2016 (International Conference) Page 91
Design and Fabrication of Dual Purpose
Refrigeration System Ratnapal Sahare
1,
Students, Tulsiramji Gaikwad-
Patil College of Engineering,
Buttibori Nagpur,441108(MS)India
Deepak Bhure2,
Students, Tulsiramji Gaikwad-
Patil College of Engineering,
Buttibori Nagpur,441108(MS)India
Vinit Nibrad3,
Students, Tulsiramji Gaikwad- Patil College of Engineering,
Buttibori
Nagpur,441108(MS)India
Mr.Vishwjeet Ambade
4
Assistant Professor,Tulsiramji
Gaikwad- Patil College of Engineering, Buttibori
Nagpur,441108(MS)India
(Email: [email protected])
ABSTRACT
In general, vapour compression cycle; the condenser
is used only for condensation process & heat it expelled out to
atmosphere, which is generally lost in atmosphere. This heat
loss can be utilized for heating purpose by designing a
condenser. The Multipurpose refrigeration system is making
use of both temperature below the atmosphere and above the
atmosphere is to be achieved in freezer section and the
temperature above the atmosphere is maintained in hot
section. The temperature will below the atmosphere can be
used as a food preservative.
The hot section uses the temperature above
atmospheric to preserve food article at this temperature is
almost constant and well above atmospheric. It keeps
temperature of food article high and constant. For example the
milk when kept at continuous high temperature prevents the
bacteria formation. Thus preventive its spoilage this section
can also be used to heat various other food article. The heat
used in the hot section is completely based on the heat
withdrawn from chilling and cold section. The optimum
number of turns can be used to heat the hot section
compartment are used. So that working will not affect the working of compressor or whole refrigeration system.
The project describes the development of
“Dual Purpose Refrigeration System”. Normal refrigerator
works on vapor compression cycle, extract the heat from
substance to be cooled in evaporator and liberate that heat to the atmosphere through the
device called as condenser. The refrigerator exerts a lot of heat
through condenser which is totally wastage of heat. For
recovery of that waste heat, design and fabricate a refrigerator
which will utilizes that waste heat and maintain the things hot
for a long time. The main important thing in the model is that
it does not require any kind of additional power supply for its
working operation. As the energy saving plays vital role in
development, the model has lot of importance from that
particular point of view. The developed system will perform operation without disturbing original refrigerator working.
Keywords: Vapour Compression System, Waste Heat,
Condenser.
INTRODUCTION
A refrigerator is a common household appliance
that consists of a thermally Insulated compartment and
which when works, transfer heat from the inside of the
compartment to its external environment. Generally it works
on the vapour compression cycle that uses a circulating
liquid refrigerant which absorbs heat from the space to be cooled and subsequently rejects that heat elsewhere. All
such systems have four components: - a compressor, a
condenser, evaporator and expansion valve.
Circulating refrigerant enters the
compressor in the thermodynamic state known as a
saturated vapour and is compressed to a higher pressure,
resulting in a higher temperature. The hot, compressed
vapour is then in the thermodynamic state as a known superheated vapour and it is at a temperature and pressure at
which it can be Condensed with typically available cooling
water or cooling air. That hot vapour is routed through a
condenser where it is cooled and condensed into liquid by
flowing through a coil or tubes with cool water or cool air
flowing across the coil or tubes. This is where the
circulating refrigerant rejects heat from the system and the
rejected heat is carried away by the air. The condensed
liquid refrigerant, in the thermodynamic state known as a
saturated liquid, is next routed through an expansion valve
where it undergoes an abrupt reduction in pressure. That pressure reduction results in the adiabatic

ISSN NO: 2454-1958 Special Issue Tech-Ed 2016 (International Conference) Page 92
flash evaporation of a part of the liquid refrigerant. The
auto-refrigeration effect of the adiabatic flash evaporation
lower the temperature of the liquid and vapour refrigerant
mixture to where it is colder than the temperature of the
enclosed space to be refrigerated. The cold mixture is then
routed through the coil or tubes in the evaporator. A fan circulates the warm air in the enclosed space across the coil
or tubes carrying the cold refrigerant liquid and vapour
mixture. That warm air evaporates the liquid part of the cold
refrigerant mixture. At the same time, the circulating air is
cooled and thus lowers the temperature of the enclosed
space to the desired temperature. The evaporator is where
the circulating refrigerant absorbs and removes heat which
is subsequently rejected in the condenser and transferred
elsewhere by the water or air used in the condenser. To
complete the refrigeration cycle, the refrigerant vapour from
the evaporator is again a saturation vapour and is routed
back into the compressor. And cycle is continued.
In the project, the condenser tube is cut in two
sections: one is for cooling purpose while other is for
heating purpose. The waste heat from the compressor is
delivered to the hot box and the hot temperature is
maintained inside the heating chamber. The hot box is made
up of steel box on which copper tubes are wound. Glass
wool is used as insulation for this hot box so that the
temperature inside the hot box is more than that of ambient
temperature.
Fig. Vapour Compression Refrigeration System
DESIGN AND FABRICATION
Fig. Design Of Dual Purpose Refrigeration System
In the re-design of condenser, the condenser is cut
into two partitions with the ratio of 2:3 in which 40% length
of condenser tube is used for cooling purpose. While
remaining 60% length is used for heating purpose. For
heating purpose the 60% of copper coil is wound around the
periphery of heating chamber. The copper tube is selected in
such a way that its diameter is more than the diameter of
condenser coil used for cooling purpose. The reason behind
selecting bigger diameter of copper coil in heating chamber than that of condenser coil, as that the high pressure & high
temperature vapour refrigerant should flow slowly through
the copper tube. So that we will get more heating effect due
to more contact in the heating chamber.
Glass wool is used as insulation for the hot box so
that the temperature inside the hot box will be more than
that of ambient temperature. Hydrocarbon R-134a is used as
a refrigerant in place of R-12 which causes depletion of
ozone layer. It is expected to improve the coefficient of
performance of this system so that it will add the value to
the project.
WORKING PRINCIPLE
The compressed vapour comes out from the
compressor at high temperature & high pressure into the
copper tube, which is wound around the heating chamber.
The heated vapour refrigerant flow through the copper tube.
The heat from the vapour is transferred to the copper tube &
hence to the heating chamber which will maintain the hot
temperature of heating chamber to preserve the food.
TESTING AND READINGS
A] Before arrangement of heating chamber
T2 = heat sink
= -8.8 + 273
= 264.2 k
T1 = heat source
= 48.7+273
= 321 k
Cop =___264.2___
321.7-264.2
Cop = 4.594
B] After arrangement of heating chamber

ISSN NO: 2454-1958 Special Issue Tech-Ed 2016 (International Conference) Page 93
T2 = heat sink
= -6.4 + 273
= 266.6 k
T1 = heat source
= 50.1+273
= 323.1 k
Cop = ___266.6 __
323.1-266.6
Cop = 4.718
RESULTS 1) It does not require any kind of additional power supply
for working operation of heat chamber.
2) It performs operation without disturbing original
refrigerator working.
3) It utilizes the waste heat from condenser.
4) It can be used for cooling as well as heating purpose.
5) Its C.O.P. is more than normal refrigerator.
FURTHER SUGGESTED WORK
1) Refrigerator with hot box and water heater tank.
2) C.O.P. enhancement of refrigeration cycle by using
multistage compressor.
REFERENCES 1] Mohd Faizanraja Qasimraja Sheikh, Prof. P.P. Manwatkar
“MULTIPURPOSE REFRIGERATION SYSTEM”.
2] S. C. Walawade, B.R. Barve, P. R. Kulkarni, “DESIGN AND
DEVELOPMENT OF WASTE HEAT RECOVERY SYSTEM FOR
DOMESTIC REFRIGERATOR”, IOSR Journal of Mechanical and Civil
Engineering (IOSR-JMCE) ISSN: 2278-1684, PP: 28-32
www.iosrjournals.org
3] Raut Digambar M, Narwade Kiran H, Karale Vidhur S, Pardeshi
Kiranshing V, Kabudke P.D. , “HEAT UTILIZATION FROM
REFRIGERATOR CONDENSER USING WATER HEATER AND HOT
BOX”, Volume: 2, Issue: 6, 50-55 June 2015 www.allsubjectjournal.com e-
ISSN: 2349-4182 p-ISSN: 2349-5979 Impact Factor: 3.762
4] Eng. Naser R. M. Al-Ajmi, “COEFFICIENT OF PERFORMANCE
ENHANCEMENT OF REFRIGERATION CYCLES” ISSN : 2248-9622,
Vol. 5, Issue 3, ( Part -3) March 2015, pp.117-125.
5] G .G. Momin, S. R. Deshmukh, M. T. Deshmukh, P. T. Chavan, P. P.
Choudhari, “COP ENHANCEMENT OF DOMESTIC REFRIGERATOR
BY RECOVERING HEAT FROM THE CONDENSER”, International
Journal of Research in Advent Technology, Vol.2, No.5, May 2014 E-
ISSN: 2321-9637
6] P. Santosh Kumar, P. Sitarama Raju, S. Suresh Kumar, P. V. V.
Satyanarayana, T. Arjun, G. S. D. K. Sravani “REFRIGERANT
RECOVERY UNIT”, (IJITR) International Journal Of Innovative
Technology And Research Volume No.3, Issue No.2, February – March
2015, 1979 – 1992.
7] R. Sam Sukumar, Dr. A. Gopichand, U. Janardhana, V. Satish Kumar, B.
Veera Chanti, “DESIGN AND FABRICATION OF WATER
REFRIGERATION SYSTEM BY CREATING VACUUM”, International
Journal Of Innovative Research In Science, Engineering And Technology,
Vol. 4, Issue 4, April 2015.
8] Patil Y.A., Dange H.M., “IMPROVING THE PERFORMANCE OF
HOUSEHOLD REFRIGERATOR BY RECOVERING HEAT FROM
THE CONDENSER”, International Journal Of Science And Research
(IJSR), India Online ISSN: 2319-7064 Volume 2 Issue 6 (2013

ISSN NO: 2454-1958 Special Issue Tech-Ed 2016 (International Conference) Page 94
Determination of Optimum Tilt Angle of Solar
Collectors for Solar Cities in Maharashtra, India
A.B.Lanjewar1,
Research Scholar, Department of
Mechanical Engineering,
RCOEM, Nagpur, India
N.S.Wakchaure1,
Research Scholar, Department of
Mechanical Engineering,
RCOEM, Nagpur, India P.R.Tete
1,
S.S.Joshi2
Assistant Professor, Department
of Mechanical Engineering,
RCOEM, Nagpur, India
1. Research Scholar, Department
of Mechanical Engineering,
RCOEM, Nagpur, India
2.
Abstract—To cope with the increasing electricity demand of
the country, ‘Development of Solar Cities’ programme is
designed by the government of India. This programme aims at
reduction in projected demand of conventional energy through
enhancing supply from renewable energy sources like solar
energy. It is proposed to enhance the installation of the solar
collectors in the selected ‘Solar Cities’ in the country. It is well
known that, the efficiency of the solar collector will increase
when it is always facing the sun. To eliminate the expenses
towards sun tracking systems, it is always desirable to install the
collectors at an optimum tilt angle. The optimal tilt angle is the
angle where the solar radiation will arrive perpendicularly upon
the surface such that the annual insolation would be maximized
for the solar collector. This angle is determined considering
several factors like location, application, energy demand pattern,
etc. In the current work, a mathematical model is used to
determine the optimum tilt angle of the solar collectors for the six
Solar Cities of Maharashtra state. In addition, month wise and
season wise optimum tilt angles are also computed for specific
applications in different seasons. The calculations and the
computed angles are reported in this paper.
Keywords—Optimum tilt angles, Solar Cities in Maharashtra
I. INTRODUCTION
The energy requirement in the world is increasing,
particularly since the last few centuries. The main driver for
further increase in the energy demand is techno-economic
growth of the developing countries. The main sources of
energy which fulfill the energy demand are generally fossil
fuels. But the fossil fuel based energy sources are exhaustible
and also causes an environmental pollution. Therefore there is
a need for alternative energy sources which can provide
energy in a sustainable manner and pollution free. One of the
options is to make more regular use of renewable sources of
energy derived from the sun. Solar energy is abundant and inexhaustible. The power from the sun intercepted by the earth
is approximately 1.8 x 10¹¹ MW, which is many thousands of
times greater than present consumption rate on the earth which
could meet all the energy requirement of the world, if utilized
properly. Hence it is one of the most promising
unconventional energy sources. It is environmentally clean
source of energy and hence no potential damage to
environment.
The solar energy utilization includes thermal and
photovoltaic conversion. The varieties of thermal applications
are water or air heating, drying, cooking and power
generation. In photovoltaic, solar energy can be used to convert into electrical energy through photovoltaic effect.
To cope with the increasing electricity demand of the
country, „Development of Solar Cities‟ programme is
designed by the Government of India. This programme aims at
reduction in projected demand of conventional energy through
enhancing supply from renewable energy sources like solar
energy. It is proposed to enhance the installation of the solar
collectors in the selected „Solar Cities‟ in the country.
The amount of solar energy received by earth varies
inversely with the square of the distance between sun and the
earth. As sun- earth distance is not constant because earth keeps revolving around the sun as well as on its own axis, the
amount of radiation received by the earth also varies
throughout day and year. The variation is not much and
accounts for only 5.9% [1]. So in order to collect the
maximum solar radiation, it is important to determine the
correct orientation and slope of the solar collectors. Solar
tracking is one of the systems being used to maximize the
amount of solar radiation falling on solar collectors. But
tracking system is expensive and not easily applicable. To
improve solar collector performance, optimum tilt angle is one
of the alternatives, if solar tracking is not appropriate.
Optimum tilt angle is the angle at which maximum solar radiation intercepted by the collector. There is reduction of an
incident radiation by around 5% if tilt angle of solar collector
is varied by 150 from the optimum tilt angle [2]. So, to receive
the maximum solar radiation on collector, optimum tilt is
necessary. In northern hemisphere, collector orientation is
south facing (γ = 00). In summer months, optimum tilt is less
(usually latitude – 150) and in winter months, it is greater

ISSN NO: 2454-1958 Special Issue Tech-Ed 2016 (International Conference) Page 95
(usually latitude + 150) [3]. But annually, optimum tilt is given
by β = 0.9Φ [4]. For Indian cities, in practice the collector
plate is usually oriented south facing and at a fixed tilt to
receive maximum solar radiation.
II. SOLAR RADIATION TERMINOLOGY
A. Extra-terrestrial Radiation
Extra-terrestrial radiation is the radiation just outside the
earth surface (Isc). Its value is taken as 1367 W/m2 [5]. Extra-
terrestrial flux varies throughout the year due to changes in sun
and earth distance and it is given by,
Isc’ = Isc 1 + 0.0333cos360 n
365 (1)
Where n is the day of the year.
B. Declination Angle (δ)
The angle made by lines joining center of earth to the
center of sun with its projection on equatorial plane of the earth is called as declination angle (δ). It varies between -
23.450 to +23.450 due to inclination of the earth‟s polar axis
and its revolution around the sun. The declination angle is
determined as
δ = 23.45sin 360
365(284 + n) (2)
Monthly average extra-terrestrial solar radiation (Ho)on
the horizontal surface is given by [6]
Ho =24
πIsc 1 + 0.0333cos
360n
365 ωsinΦsinδ + cosΦcosδsinω
(3)
Where, ω is sunshine hour angle and is given by,
ω = cos−1(−tanΦtanδ)(4)
C. Global, Beam and Diffused Radiation
The solar radiation which directly reaches at the earth
surface without change of direction is called as beam or direct radiation. The radiation received at the earth surface from all
parts of the sky‟s hemisphere called as diffused radiation.
Global radiation is the sum of beam and diffused radiation.
Gopinathan[7] have been suggested a correlation to
determine the monthly average daily global radiation on a
horizontal surface (Hg) at a location which is given by,
Hg
Ho= a + b
S
Smax (5)
The constants a, b are related to three parameters i.e.
latitude of the location, elevation and sunshine hours as
follows.
a = −0.309 + 0.539cosΦ− 0.0693EL + 0.290 S
Smax (6)
b = 1.527 − 1.027cosΦ + 0.0926EL− 0.359 S
Smax (7)
Where, EL is the elevation of the given location above
mean sea level in kilometer.
Smax is the monthly average of the maximum possible sun hours per day at a location i.e. day length in hours.
Smax =2
15ω(8)
S is the monthly average of the sunshine hours per day at a
location in hours.
Garg and Garg[8] proposed the equation for predicting
daily diffused radiation (Hd) for the locations in India. Hd
Hg= 0.8677 − 0.7365
S
Smax (9)
Now, monthly average daily beam radiation (Hb) for the locations is given by,
Hb = Hg –Hd (10)
For radiation flux to be maximum, optimum tilt angle of
the collector is given by [9],
βopt = tan−1[{ Hbi tan Φ − δi i=12i=1 }/{ Hbii=12
i=1 }](11)
D. Total Radiation on a Tilted Surface
Liu and Jordan [10] have proposed the relation for total
radiation falling on a tilted surface (Ht) which is given by an
equation as
Ht
Hg= 1 −
Hd
Hg Rb +
Hd
HgRd + Rr (12)
For south facing surface (γ = 00),
Rb=ω ′ sin δ sin Φ−β +cos δ sin ω ′ cos (Φ−β)
ω sin δ sin Φ+cos δ sinω cos Φ(13)
Rd = 1+cos β
2(14)
Rr = ρ(1−cos β)
2(15)
Where, ω‟ and ω are the sunrise or sunset hour angle for
tilted surface and horizontal surface respectively. ρ is the
ground reflectivity.
III. METHODOLOGY
Using equations 1 to 15, the maximum solar radiation
incident on collector and optimum tilt angle are calculated for
different solar cities in Maharashtra, India. With the help of
MS-Excel, graphs were plotted between various entities. The
data of latitude, longitude and elevation above mean sea level for solar cities in Maharashtra is tabulated in table 1.
TABLE 1. LATITUDE, LONGITUDE AND ELEVATION OF SOLAR CITIES
Solar Cities Latitude
(in degrees)
Longitude
(in degrees)
Elevation
(in meters)
Nagpur 21.14 79.08 310
Thane 19.22 72.98 11
Kalyan-Dombivli 19.24 73.13 10
Aurangabad 19.88 75.34 595
Nanded 19.14 77.32 356
Shirdi 19.77 74.48 516
IV. RESULTS AND DISCUSSION
The monthly average daily extra-terrestrial, beam, global
radiations are calculated using equations (1) to (10). It is found
that the radiation decreases in the month of July to August i.e.
in rainy season due to scattering radiations.The variation of extra-terrestrial, beam and global radiation on horizontalsurface

ISSN NO: 2454-1958 Special Issue Tech-Ed 2016 (International Conference) Page 96
for Nagpur is shown in Fig. 1.
Fig. 1. Monthly average daily extra-terrestrial (Ho), beam (Hb) and global radiation (Hg) on horizontal surface
The angle of the collector at which maximum solar
radiation intercepted is calculated using equation (11), which is
optimum tilt angle of the collector. The tilt angle is varied from
0 to 900 for twelve months of the year with variation of solar
radiation.Also, the average optimum tilt angles are calculated
for four seasons of the year. Annual optimum tilt angle is
calculated by averaging the monthly optimum tilt angles over
the year.The monthly, seasonal average and annual optimum
tilt angles for six solar cities in Maharashtra are given in Table
2.
TABLE 2. MONTHLY, SEASONAL AND ANNUAL OPTIMUM TILT ANGLES (IN
DEGREES) FOR SIX SOLAR CITIES IN MAHARASHTRA
City
Month
Nagpur Thane Kalyan-
Dombivli
Aurang
abad Nanded Shirdi
Jan 42.0 40.1 40.1 40.8 40.0 40.7
Feb 34.1 32.2 32.2 32.8 32.1 32.7
Mar 23.5 21.6 21.6 22.3 21.5 22.2
Apr 11.7 9.8 9.8 10.4 9.7 10.3
May 0.0 0.0 0.0 0.0 0.0 0.0
June 0.0 0.0 0.0 0.0 0.0 0.0
July 0.0 0.0 0.0 0.0 0.0 0.0
Aug 7.7 5.8 5.8 6.4 5.7 6.3
Sept 19.0 17.0 17.1 17.7 17.0 17.6
Oct 30.8 28.8 28.9 29.5 28.8 29.4
Nov 40.1 38.2 38.2 38.8 38.8 38.7
Dec 44.2 42.9 42.3 42.9 42.2 42.8
Winter 42.1 40.2 40.2 40.8 40.1 40.7
Spring 23.1 21.2 21.2 21.8 21.1 21.7
Summer 0.0 0.0 0.0 0.0 0.0 0.0
Autumn 19.1 17.2 17.2 17.9 17.1 17.8
Annual 21.1 19.2 19.2 19.9 19.1 19.8
The variation of optimum collector tilt angle for monthly,
seasonally and annually basis for Nagpur city is shown
graphically in Fig. 2.
Fig. 2. Variation of monthly, seasonal and annual optimum tilt angles for Nagpur
For implementation of seasonal optimum tilt angle, the
collector tilt has to be changed four times in a year. The annual
optimum tilt angle is fixed value for any solar collector
throughout the year. The value of total solar radiation with
different collector tilt angle is calculated for Nagpur which is
given in Table 3.
TABLE 3. MONTHLY AVERAGE DAILY GLOBAL SOLAR RADIATION FOR
VARIOUS COLLECTOR TILT ANGLES FOR NAGPUR (IN KWH/M2-DAY)
Month Hg (β=0) Ht (β=βopt)
Ht
(Seasonal βopt)
Ht
(Annual βopt)
Jan 5.093 7.769 7.771 6.771
Feb 6.321 8.057 7.733 7.650
Mar 7.291 7.957 7.955 7.940
Apr 6.955 6.965 6.749 6.802
May 5.301 5.301 5.301 4.770
June 3.938 3.938 3.938 3.409
July 4.127 4.127 4.127 3.635
Aug 5.800 5.752 5.532 5.475
Sept 7.179 7.500 7.500 7.493
Oct 7.070 8.513 8.192 8.269
Nov 5.860 8.503 8.558 7.601
Dec 4.942 7.998 7.922 6.758
The value of Table 3 is graphically shown in Fig. 3 for easy
interpretation on variation in values of solar radiation.
Fig. 3. Monthly average daily global solar radiation on various collector tilt angles for Nagpur
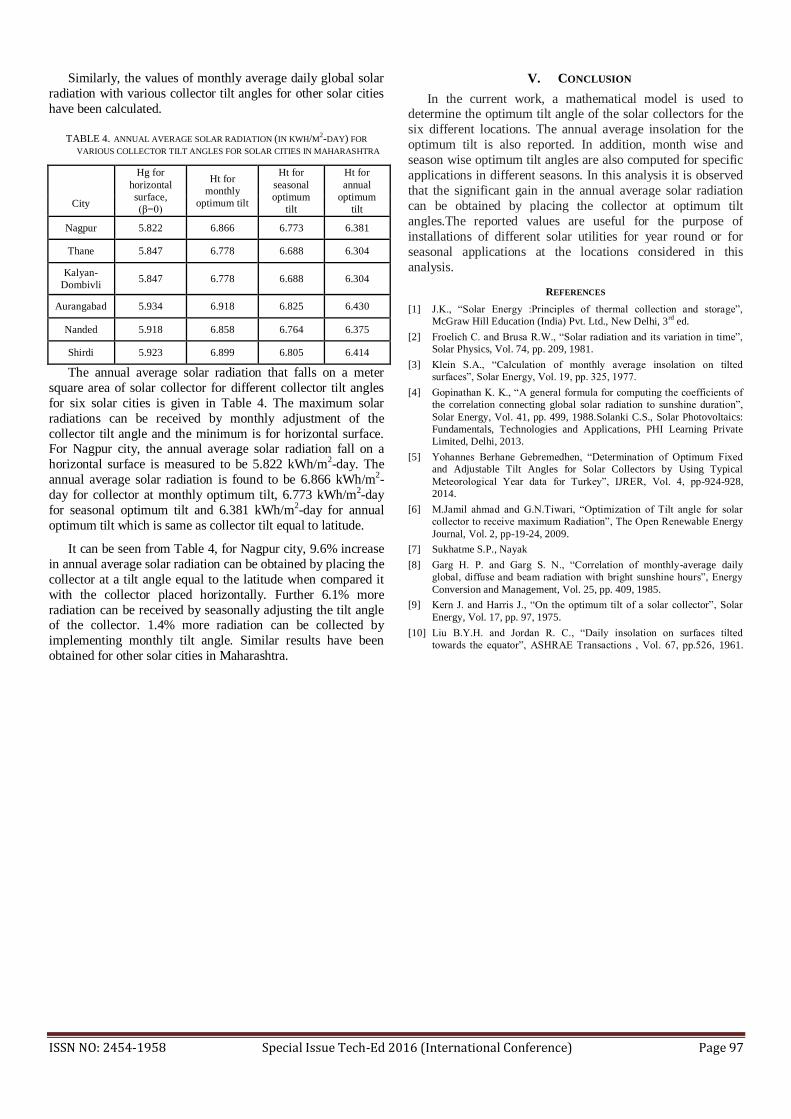
ISSN NO: 2454-1958 Special Issue Tech-Ed 2016 (International Conference) Page 97
Similarly, the values of monthly average daily global solar
radiation with various collector tilt angles for other solar cities
have been calculated.
TABLE 4. ANNUAL AVERAGE SOLAR RADIATION (IN KWH/M2-DAY) FOR
VARIOUS COLLECTOR TILT ANGLES FOR SOLAR CITIES IN MAHARASHTRA
Hg for
horizontal
surface,
(β=0)
Ht for
monthly
optimum tilt
Ht for
seasonal
optimum
tilt
Ht for
annual
optimum
tilt City
Nagpur 5.822 6.866 6.773 6.381
Thane 5.847 6.778 6.688 6.304
Kalyan-
Dombivli 5.847 6.778 6.688 6.304
Aurangabad 5.934 6.918 6.825 6.430
Nanded 5.918 6.858 6.764 6.375
Shirdi 5.923 6.899 6.805 6.414
The annual average solar radiation that falls on a meter
square area of solar collector for different collector tilt angles
for six solar cities is given in Table 4. The maximum solar
radiations can be received by monthly adjustment of the
collector tilt angle and the minimum is for horizontal surface. For Nagpur city, the annual average solar radiation fall on a
horizontal surface is measured to be 5.822 kWh/m2-day. The
annual average solar radiation is found to be 6.866 kWh/m2-
day for collector at monthly optimum tilt, 6.773 kWh/m2-day
for seasonal optimum tilt and 6.381 kWh/m2-day for annual
optimum tilt which is same as collector tilt equal to latitude.
It can be seen from Table 4, for Nagpur city, 9.6% increase
in annual average solar radiation can be obtained by placing the
collector at a tilt angle equal to the latitude when compared it
with the collector placed horizontally. Further 6.1% more
radiation can be received by seasonally adjusting the tilt angle of the collector. 1.4% more radiation can be collected by
implementing monthly tilt angle. Similar results have been
obtained for other solar cities in Maharashtra.
V. CONCLUSION
In the current work, a mathematical model is used to determine the optimum tilt angle of the solar collectors for the
six different locations. The annual average insolation for the
optimum tilt is also reported. In addition, month wise and
season wise optimum tilt angles are also computed for specific
applications in different seasons. In this analysis it is observed
that the significant gain in the annual average solar radiation
can be obtained by placing the collector at optimum tilt
angles.The reported values are useful for the purpose of
installations of different solar utilities for year round or for
seasonal applications at the locations considered in this
analysis.
REFERENCES
[1] J.K., “Solar Energy :Principles of thermal collection and storage”,
McGraw Hill Education (India) Pvt. Ltd., New Delhi, 3rd
ed.
[2] Froelich C. and Brusa R.W., “Solar radiation and its variation in time”,
Solar Physics, Vol. 74, pp. 209, 1981.
[3] Klein S.A., “Calculation of monthly average insolation on tilted
surfaces”, Solar Energy, Vol. 19, pp. 325, 1977.
[4] Gopinathan K. K., “A general formula for computing the coefficients of
the correlation connecting global solar radiation to sunshine duration”,
Solar Energy, Vol. 41, pp. 499, 1988.Solanki C.S., Solar Photovoltaics:
Fundamentals, Technologies and Applications, PHI Learning Private
Limited, Delhi, 2013.
[5] Yohannes Berhane Gebremedhen, “Determination of Optimum Fixed
and Adjustable Tilt Angles for Solar Collectors by Using Typical
Meteorological Year data for Turkey”, IJRER, Vol. 4, pp-924-928,
2014.
[6] M.Jamil ahmad and G.N.Tiwari, “Optimization of Tilt angle for solar
collector to receive maximum Radiation”, The Open Renewable Energy
Journal, Vol. 2, pp-19-24, 2009.
[7] Sukhatme S.P., Nayak
[8] Garg H. P. and Garg S. N., “Correlation of monthly-average daily
global, diffuse and beam radiation with bright sunshine hours”, Energy
Conversion and Management, Vol. 25, pp. 409, 1985.
[9] Kern J. and Harris J., “On the optimum tilt of a solar collector”, Solar
Energy, Vol. 17, pp. 97, 1975.
[10] Liu B.Y.H. and Jordan R. C., “Daily insolation on surfaces tilted
towards the equator”, ASHRAE Transactions , Vol. 67, pp.526, 1961.
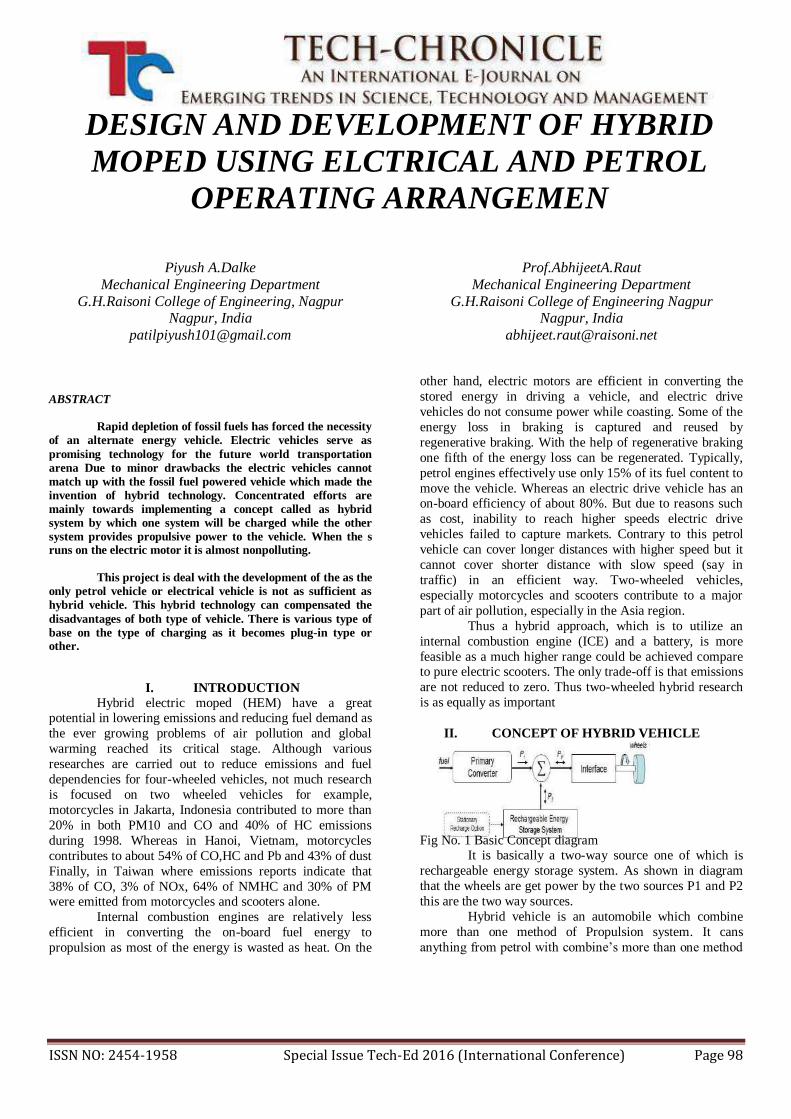
ISSN NO: 2454-1958 Special Issue Tech-Ed 2016 (International Conference) Page 98
DESIGN AND DEVELOPMENT OF HYBRID
MOPED USING ELCTRICAL AND PETROL
OPERATING ARRANGEMEN
Piyush A.Dalke
Mechanical Engineering Department
G.H.Raisoni College of Engineering, Nagpur Nagpur, India
Prof.AbhijeetA.Raut
Mechanical Engineering Department
G.H.Raisoni College of Engineering Nagpur Nagpur, India
ABSTRACT
Rapid depletion of fossil fuels has forced the necessity
of an alternate energy vehicle. Electric vehicles serve as
promising technology for the future world transportation
arena Due to minor drawbacks the electric vehicles cannot
match up with the fossil fuel powered vehicle which made the
invention of hybrid technology. Concentrated efforts are
mainly towards implementing a concept called as hybrid
system by which one system will be charged while the other
system provides propulsive power to the vehicle. When the s runs on the electric motor it is almost nonpolluting.
This project is deal with the development of the as the
only petrol vehicle or electrical vehicle is not as sufficient as
hybrid vehicle. This hybrid technology can compensated the
disadvantages of both type of vehicle. There is various type of
base on the type of charging as it becomes plug-in type or other.
I. INTRODUCTION
Hybrid electric moped (HEM) have a great potential in lowering emissions and reducing fuel demand as
the ever growing problems of air pollution and global
warming reached its critical stage. Although various
researches are carried out to reduce emissions and fuel
dependencies for four-wheeled vehicles, not much research
is focused on two wheeled vehicles for example,
motorcycles in Jakarta, Indonesia contributed to more than
20% in both PM10 and CO and 40% of HC emissions
during 1998. Whereas in Hanoi, Vietnam, motorcycles
contributes to about 54% of CO,HC and Pb and 43% of dust
Finally, in Taiwan where emissions reports indicate that
38% of CO, 3% of NOx, 64% of NMHC and 30% of PM were emitted from motorcycles and scooters alone.
Internal combustion engines are relatively less
efficient in converting the on-board fuel energy to
propulsion as most of the energy is wasted as heat. On the
other hand, electric motors are efficient in converting the
stored energy in driving a vehicle, and electric drive
vehicles do not consume power while coasting. Some of the
energy loss in braking is captured and reused by
regenerative braking. With the help of regenerative braking
one fifth of the energy loss can be regenerated. Typically,
petrol engines effectively use only 15% of its fuel content to
move the vehicle. Whereas an electric drive vehicle has an on-board efficiency of about 80%. But due to reasons such
as cost, inability to reach higher speeds electric drive
vehicles failed to capture markets. Contrary to this petrol
vehicle can cover longer distances with higher speed but it
cannot cover shorter distance with slow speed (say in
traffic) in an efficient way. Two-wheeled vehicles,
especially motorcycles and scooters contribute to a major
part of air pollution, especially in the Asia region.
Thus a hybrid approach, which is to utilize an
internal combustion engine (ICE) and a battery, is more
feasible as a much higher range could be achieved compare to pure electric scooters. The only trade-off is that emissions
are not reduced to zero. Thus two-wheeled hybrid research
is as equally as important
II. CONCEPT OF HYBRID VEHICLE
Fig No. 1 Basic Concept diagram It is basically a two-way source one of which is
rechargeable energy storage system. As shown in diagram
that the wheels are get power by the two sources P1 and P2
this are the two way sources.
Hybrid vehicle is an automobile which combine
more than one method of Propulsion system. It cans
anything from petrol with combine’s more than one method

ISSN NO: 2454-1958 Special Issue Tech-Ed 2016 (International Conference) Page 99
of propulsion system. It can be anything from petrol with a
hydraulic motor, diesel with electric or even solar power. In
fact, we already see around us so many hybrid cars and
motorcycles running on CNG with petrol with electric
motor, petrol with a hydraulic motor diesel with electric or
even solar power, In fact, we already see around us so many hybrid cars and motorcycles with LPG. They are nothing
but form of a parallel Hybrid system. Hybrid technology is
nothing but the solution to the problem of pollution by fuel
and limited availability of the storage. In future we have to
think out any alternative source so why not from now?
That’s why we are dealing with this concept.
TYPES OF HYBEID VEHICLE Hybrid vehicle is mainly classified in two main
types on the basis of power supplied to the vehicle. The
types are as below,
Parallel hybrid vehicle
Plug-in hybrid vehicle
A. Parallel hybrid vehicle
In parallel hybrid vehicle, the internal combustion
engine and the electric motor are connected to mechanical
transmission and can transmit power simultaneously to
drive the vehicle. The commercialized parallel hybrid
vehicles use a single small electric motor and a small battery
pack. Parallel hybrid vehicles are capable of regenerative
braking and the internal combustion engine present in it is
capable of supplemental charging of the battery.
B. Plug-in hybrid vehicle A Plug-in hybrid electric vehicle(PHEV), also
called as Plug-in hybrid, is a hybrid electric vehicle with
rechargeable batteries that can be restored to full charge just
by connecting to an external power source. A Plug-in hybrid
electric vehicle shares the characteristics of both
conventional hybrid electric vehicle having an electric
motor and an internal combustion Engine and of an all-
electric vehicle, having a plug to connect to an electric grid.
III. CONSTRUCTION DETAIL:
While converting the ordinary moped into hybrid moped. We required following components.
Electric motor preferably (Hub motor).
Batteries (Dry lead acid battery).
Moped (Kinetic kine).
This is main component of the . On the basis of
availability and low cost We select this component. The
various detail of the following component is as below
Electric motor:
The BLDC motor is widely used in applications
including appliances, automotive, aerospace, consumer,
medical, automated industrial equipment and
instrumentation. The BLDC motor is electrically commutated by
power switches instead of brushes. Compared with a
brushed DC motor or an induction motor, the BLDC motor
has many
Advantages:
Higher efficiency and reliability Lower acoustic noise Smaller and lighter Greater dynamic response Better
speed versus torque characteristics Higher speed range
Longer life Motor fundamental concepts:
1. General principle:
Motors convert electrical energy into mechanical
energy using electromagnetic principles. The energy
conversion method is fundamentally the same in all electric
motors.
2. Magnetic Force:
Magnetic poles generate invisible lines of magnetic
force flowing from the North Pole to the South Pole as
shown in Figure. When magnetic poles of opposite polarity
face each other, they generate an attractive force, while like
poles generate a repulsive force.
Fig No.2 Unlike-pole attraction & like-pole repulsion
3. Construction of BLDC motor:
I) Stator: There are three classifications of the
BLDC motor: single-phase, two-phase and three-phase, the
stator for each type has the same number of windings. The single-phase and three-phase motors are the most widely
used. Figure shows the simplified cross section of a single-
phase and a three-phase BLDC motor. The rotor has
permanent magnets to form 2 magnetic pole pairs, and
surrounds the stator, which has the windings.
Fig no. 3 (a) & (b) Construction diagram
There are two types of stator windings: trapezoidal
and sinusoidal, which refers to the shape of the back
electromotive force (BEMF) signal. The shape of the BEMF
is determined by different coil interconnections and the
distance of the air gap. In addition to the BEMF, the phase
current also follows a trapezoidal and sinusoidal shape. A
sinusoidal motor produces smoother electromagnetic

ISSN NO: 2454-1958 Special Issue Tech-Ed 2016 (International Conference) Page 100
torquethan a trapezoidal motor, though at a higher cost due
to their use of extra copper windings. A BLDC motor uses a
simplified structure with trapezoidal stator windings.
II) Rotor:
A rotor consists of a shaft and a hub with
permanent magnets arranged to form between two to eight
pole pairs that alternate between north and south poles.
There are multiple magnet materials, such as ferrous
mixtures and rare-earth alloys. Ferrite magnets are
traditional and relatively inexpensive, though rare-earth alloy magnets are becoming increasingly popular because of
their high magnetic density. The higher density helps to
shrink rotors while maintaining high relative torque when
compared to similar ferrite magnets.
IV. Working of motor:
Motor operation is based on the attraction or
repulsion between magnetic poles. Using the three-phase
motor shown in Figure, the process starts when current
flows through one of the three stator windings and generates
a magnetic pole that attracts the closest permanent magnet
of the opposite pole. The rotor will move if the current shifts
to an adjacent winding. Sequentially charging each winding
will cause the rotor to follow in a rotating field. The torque
in this example depends on the current amplitude and the
number of turns on the stator windings, the strength and the size of the permanent magnets, the air gap between the rotor
and the windings, and the length of the rotating arm.
ADVANTAGES OF BLDC MOTOR OVER OTHER
MOTOR:
• Higher efficiency (75% vs. 40% of an AC motor)
• Less heat generated
• Higher reliability (no brushes to wear out)
• Safer to operate in a dangerous environment (no brush
dust generated as is found with brushed motors).
Table No. 1
Fig. 4: controller for BLDC hub motor
The controller connects the power source to the
motor. It controls speed, direction of rotation, and optimizes
energy conversion. While batteries produce constant
voltages which decrease as theyare used up, some
controllers require a DC to- DC converter to step down this
changeable voltage to the motors expected constant operating voltage, but other controllers incorporate a DC-to-
DC converter and can accept a varying voltage. Converter
efficiencies are typically greater than 90% [4]. The voltage
control is achieved by “chopping” the source current - the
voltage is switched on and off, with the ratio of on to off
determining the average voltage. Chopping is performed by
power electronic circuitry such as diodes and thrusters and
silicon control rectifiers (SCR). Controllers also effect
regenerative braking, by which the motor is acted as a
generator to recharge the batteries.
The controller which we used has following
specification.
V. BATTERIES:
A lead-acid storage battery is an electrochemical
device that produces voltage and delivers electrical current.
The battery is the primary “source” of electrical energy used
in vehicles today. It’s important to remember that a battery
does not store electricity is produced. Basically, two
different types of lead in acid mixture react to produce an electrical pressure called voltage. This electrochemical
reaction changes chemical energy to electrical energy and is
the basis for all automotive batteries.
The purpose of the battery:
The battery supplies electricity to the BLDC motor
while the engine is off. That is our second alternative of
moped operation. The motor run the shaft of the rim through
the coupling. the battery can use to run the other accessories of the moped.
The other battery in arrangement is to use in self-
staring of the moped.
VI. TYPES OF BATTERIES:
Primary cell
Secondary cell
Wet charge
Dry charge
Primary cell:
This type of Batteries are such as flashlight battery
once used, throw it away because the chemical reaction
totally destroys one of the metals after a period of time,
primary cells cannot be recharge. Small batteries such as
flashlight and ratio batteries are primary cells.

ISSN NO: 2454-1958 Special Issue Tech-Ed 2016 (International Conference) Page 101
Secondary cell:
The metal plates and acid mixture change as the battery supplies voltage. As the battery drains the metal
plates become similar and the acid strength weakens. This
process is called discharging .by applying current to the
battery in the reverse direction.the battery materials can be
restored, thus recharging the battery. This process is called
charging. Automotive lead-acid batteries are secondary cells
and can be recharged.
Wet charged:
The lead –acid battery is filled with electrolyte and
charged when it is built. During storage, a slow chemical
reaction will cause self-discharge. periodic charging is
required. Most batteries sold today are wet charged.
Dry charged:
The battery is built, charged washed and dried,
sealed, and shipped without electrolyte. It can be stored for
up to 18 months. When put into use, electrolyte and
charging are required Batteries of this type have a long shelf
life. Motorcycle batteries are typically dry charged batteries
VII. BATTERY CONSTRUCTION: An automobile battery contains a diluted sulfuric
acid electrolyte and positive and negative electrodes in the
form of several plates. Since the plates are made of lead or
lead-derived materials, this type of battery is often called a lead acid battery. A battery is separated into several cells
(usually six in the case of automobile batteries), and in each
cell there are several battery elements, all bathed in the
electrolyte solution.
Fig No.5: Basic Construction
VIII. CELL OPERATION:
Two dissimilar metals placed in an acid bath
produce electrical potential across the poles. The cell produces voltage by a chemical reaction between the plates
and the electrolyte. The positive plate is made of reddish-
brown material such as Lead Dioxide (PBO2). While the
negative plate is made of grayish material called Sponge
Lead (PB) the acid bath is a mixture of sulfuric acid and the
water cell electrolyte. Together a cell element is formed.
CYCLING:
The battery stores electricity in form of chemical
energy. Through a chemical reaction process the battery
creates and releases electricity as needed by the electrical
system or devices. Since the battery losses its chemical
energy in this process, the battery must be recharged by the
alternator. By reversing electrical current flow through the
battery the chemical process is reversed, thus charging the
battery. The cycle of discharging and charging is repeated continuously and is called “battery”.
BATTERY CELL ELEMENT:
The key to the battery operation is the cell element. Positive
plates and negative plates are each connected together by separate plate straps. These groups of positive and negative
plates are then placed alternately, separated by micro-porous
separators. Assembled together, the plates and separators
form a battery cell element. Grouping the plates in this way
serves to enlarge the surface area between the active
materials and the electrolyte, thus allowing a greater amount
of electricity to be supplied. In other words, the battery
capacity is increased because of the increase in the surface
area. More plate surface area means the battery can deliver
more current.
PLATES:
Battery plates are constructed of a lead alloy
containing a percentage of either antimony or calcium. The
plates are designed as thin flat grid, grids crossing at right
angles {shown below} or grids crossing diagonally at different angles which reduce internal resistance. The grid
provides the necessary framework for active materials to be
pasted on the plate, making either a positive or negative
plate. The active material on a charge positive plate is a
reddish brown Lead Di Oxide [Pbo2] while the active
material on a charge negative plate is a grayish spongy lead.
Fig no 6:Battery Case
The battery case holds the electrolyte and the individual battery cell elements. It is divided into six
compartment or cells. The plates are raised up off the
bottom of the case with ribs to prevent them from shorting
out if any of the active materials (lead, etc) should happen to
fall from the plates. The case is made of polypropylene,
hard rubber, and plastic base materials. some battery
manufactures use translucent plastic cases which allow
checking electrolyte level without removing vent caps. These cases often have “upper” and “lower” electrolyte
level markers on the outside of the case.
VENT CAPS:

ISSN NO: 2454-1958 Special Issue Tech-Ed 2016 (International Conference) Page 102
Vent caps cover the holes that are used for adding electrolyte. They are also designed to separate the sulfuric
acid mist and the hydrogen gas that forms when the battery
charges. The caps are designed to the sulfuric acid mist to
condense and drop back into the battery and allow hydrogen
gas to escape through the vent holes to the atmosphere. Vent caps can cover each individual cell as shown below.
IX. SEVERAL BATTERY MATERIAL AND
THEIR ADVANTAGES: Several variations of the lead-acid battery are used
today. Variation to the battery plate material and electrolyte
solution provides different battery characteristics.
Construction is basically the same; however, the materials
used are slightly different.
1. Lead Antimony:(Most commonly used) Is commonly used in conventional lead acid battery which
uses lead antimony cell plates
ADVANTAGES
1. Longer service life than Calcium batteries.
2. Easier to recharge when completely discharged.
3. Lower cost.
2. Lead Calcium(AC Delco maintenance free batteries). Is a
maintenance free lead acid battery which uses lead calcium
cell plates.
ADVANTAGES
1. Larger electrolyte reserve area above the plates.
2. Higher Cold Cranking Amp ratings
3. Little or No maintenance
4. Recombination (Gel Cell)
Is a completely sealed lead acid battery which uses an electrolyte that in a gel (solid) rather than a liquid.
ADVANTAGES
1. No liquid electrolyte to spill or leak.
2. Can be Deep Cycled several time without damage.
3. Totally corrosion and maintenance free.
4. Three to four times longer battery life than regular
batteries.
5. More plate surface and closer plate spacing provides a compact case size.
X. FULL SPCIFICATION OF KINE:
1. ENGINE, POWER AND TORQUE Table 2
VARIABLS VALUE
Displacement 71.55cc
Maximum
power 4.2Bhp
Maximum
Torque 5.7Nm
Engine
Displacement
2 Stroke Single
cylinder
Cooling Air cooling
TRMISSION
Table 3
PART TYPE
Gearbox Automatic
3. BRKAES
Table 4
TYPE SIZE
Front Brake Drum 110 mm
Rear Brake Drum 110 mm
4. DIMENSION ,WEIGHT, CAPACITY
Table 5
PART SIZE
Overall Length 1740 mm
Overall Weight 640 mm
Overall Height 1076 mm

ISSN NO: 2454-1958 Special Issue Tech-Ed 2016 (International Conference) Page 103
Wheel Base 1235 mm
Kerb /wet
Weight 86 kg
Fuel Tank
Capacity 4 liters
Front Tyre 3.00×10 inches
Rear Tyre 3.00×10 inches
Head Light 12v 25w/25w
This data is available from the manual of this
product.
XI. DESIGN CRITERIA: Some part is necessary to design, on the basis of
the data available from the manual of the moped and
standard data book the value are taken and their
corresponding value is calculated.
Following part which are necessary to design.
(1) Design Procedure for shaft
Given Data
Torque on the Driving Shaft
=10N-m =10x103 N-mm
Total Load acting on the shaft
= 300 kg x 9.81 =2943 N
Total Length of driving shaft
= 0.125m = 125 mm
Design Procedure for Flange
: ˑ d = 10.66 mm
Method (II)
For Simply Supported Beam
=WL/4= 2943 x 0.125/4
M=91.96 N-mm
M=91. 96N.m = 91.96 x10³ N-mm
M=𝜋/32 × 6b × d3
91.96 × 10 3/32 =3.14 x42 x d3
d = 28.14 mm
Coupling
Given Data =
N = 5000 rpm motor
T = 10 N-m
Actual Diameter of Engine shaft,
d = 14mm (given) (a) P = 2 x N x T / 60 N-m
P = 5.235 KW
T = π/16 x s xτs x d3
10 x 103 = π /16
x=π
16τs x 143
τs=18.56 N/mm2
Outer diameter of Hub
D = 2d = 2 x 14 mm
= 28mm,30mm
But Actual outer diameter of hub
D = 122mm
So for given data our design is safe.
(b) Hub is hollow shaft for that shear stress
T = π
16x τs x [
𝐷4−𝑑4
𝐷 ]
10 x 103=π
16x τs x [
284−144
28 ]
τs =2.47 N/mm2
For actual diameter of engine shaft
d = 14 mm
Outer diameter of hub
d = 122 mm
Ts= 0.23 N/mm2
Form above given data design is safe. (c)Desing For Flange
Thickness of Flange = 0.5d
Tf= 0.5 x 14 = 7mm
T=3.14 ×𝐷
2 𝜏𝑐 × 𝑡𝑓
10x103 =3.14 ×28
2 𝜏𝑐 × 7
𝜏𝑐 = 1.16 𝑁/𝑚𝑚2
(c) Design for Bolt
Given Data
𝜏𝑏 = 20 𝑁/𝑚𝑚2 No. Of bolts n=4
d1=Normal diameter of bolt .
D1 = Pitch circle diameter D1= 3d= 3 x 14 = 42 mm
For stress
T= π
4x 𝑑2
1x τbx n x [𝐷1
2 ]
10x103=π
4x 𝑑2
1x 20x 4 x [42
2 ]
𝑑1=2.75mm Outer Diameter of Flange
D2 = 4d = 4 X 14 = 56mm
Thickness of the Protective Circumferential Flange ·׃
tp = 0.25 d
= 0.25 X 14 = 3.5mm = 5 mm
As our bolt actual diameter is 8 mm so our design is safe.
(3) (1) Design Specification of Coupling
d =Diameter of Shaft = 14mm
D= outside Diameter of flange = 44mm
Thickness of flange = 4 mm
Allowable shear stress for shaft
=18.58 N/mm2
(1) Design specification for Bearing
Bearing No. 202
Bore = 15mm

ISSN NO: 2454-1958 Special Issue Tech-Ed 2016 (International Conference) Page 104
Outer Diameter = 35mm
Width = 11mm
Bearing 203
Bore = 17mm
Outer Diameter = 40mm
Width = 12 mm
(4) Design Procedure for C- Clamp
Cross Section at X – X
A = b x t
40 x 5 = 200mm2
Consideration (I) =
Direct tensile stress at x-x · ׃
𝜎0= 𝑃
𝐴 =
2943
200
𝜎0 = 14.71 N/mm2
Behind moment at X-X due to the load P
M = P X e
= 2943 X 17.5
M = 51502.5 N-mm
Section Modulus
Z= 𝑡 ×𝑏2
6 =
5 ×402
6
Z= 1333.33mm3
Behind stress at X-X
σb= M = 51502.5
Z 1333.33
σb = 38.62 N/mm2
Maximum tensile stress
= σ0 + σb
= 14.17 + 38.62
= 53.33 N/mm2
Consideration (II)
Bending moment at X-X due to the load P
M= P X e
= 2943 X 77.5
M = 228.08 X 10³ N-mm
XII. CAD MODEL:
1) Motor:
2) Bearing:
3) Clamp:
4) Rim:
5) Rim disc:
Coupling: I) Main Coupling
II) Large Coupling:
Assembly: Explode View
XIII. ADVANTAGE’S:
The range of an Electric bike increased.
The city traffic air and noise pollution is decreased to a
greater extent.
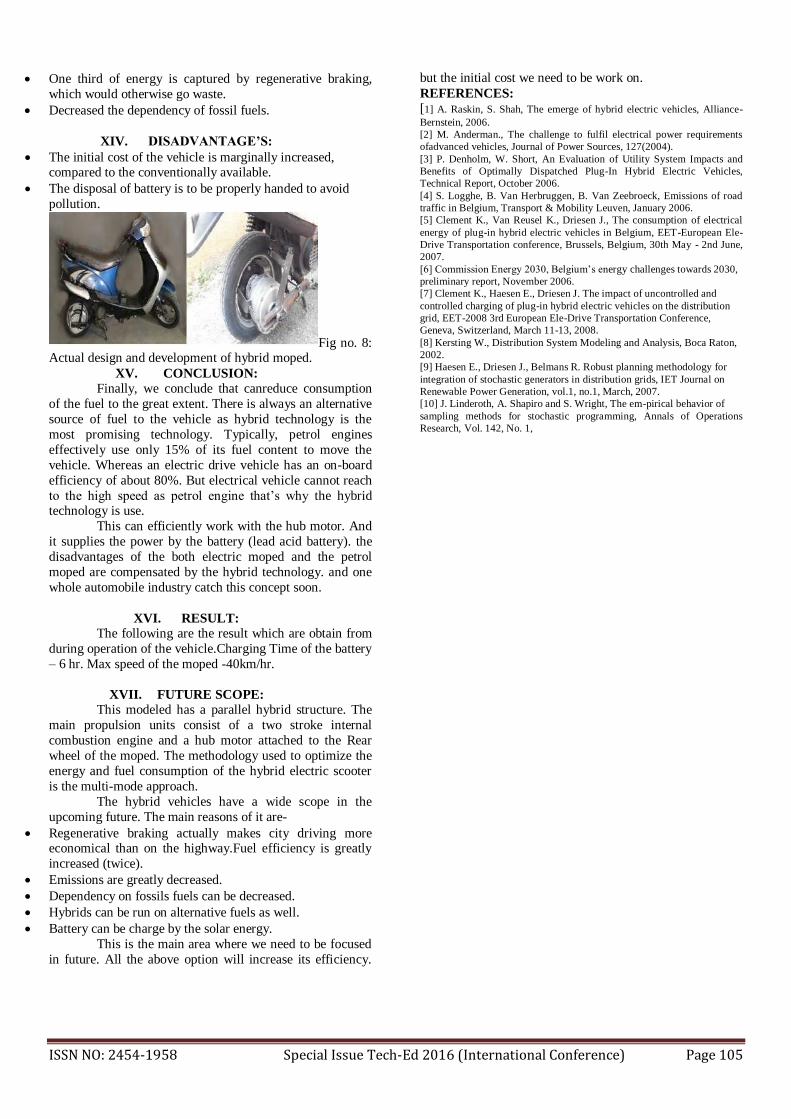
ISSN NO: 2454-1958 Special Issue Tech-Ed 2016 (International Conference) Page 105
One third of energy is captured by regenerative braking,
which would otherwise go waste.
Decreased the dependency of fossil fuels.
XIV. DISADVANTAGE’S:
The initial cost of the vehicle is marginally increased, compared to the conventionally available.
The disposal of battery is to be properly handed to avoid
pollution.
Fig no. 8: Actual design and development of hybrid moped.
XV. CONCLUSION:
Finally, we conclude that canreduce consumption
of the fuel to the great extent. There is always an alternative
source of fuel to the vehicle as hybrid technology is the
most promising technology. Typically, petrol engines
effectively use only 15% of its fuel content to move the
vehicle. Whereas an electric drive vehicle has an on-board
efficiency of about 80%. But electrical vehicle cannot reach
to the high speed as petrol engine that’s why the hybrid technology is use.
This can efficiently work with the hub motor. And
it supplies the power by the battery (lead acid battery). the
disadvantages of the both electric moped and the petrol
moped are compensated by the hybrid technology. and one
whole automobile industry catch this concept soon.
XVI. RESULT:
The following are the result which are obtain from
during operation of the vehicle.Charging Time of the battery
– 6 hr. Max speed of the moped -40km/hr.
XVII. FUTURE SCOPE:
This modeled has a parallel hybrid structure. The
main propulsion units consist of a two stroke internal
combustion engine and a hub motor attached to the Rear
wheel of the moped. The methodology used to optimize the
energy and fuel consumption of the hybrid electric scooter
is the multi-mode approach.
The hybrid vehicles have a wide scope in the
upcoming future. The main reasons of it are-
Regenerative braking actually makes city driving more economical than on the highway.Fuel efficiency is greatly
increased (twice).
Emissions are greatly decreased.
Dependency on fossils fuels can be decreased.
Hybrids can be run on alternative fuels as well.
Battery can be charge by the solar energy.
This is the main area where we need to be focused
in future. All the above option will increase its efficiency.
but the initial cost we need to be work on.
REFERENCES:
[1] A. Raskin, S. Shah, The emerge of hybrid electric vehicles, Alliance-
Bernstein, 2006.
[2] M. Anderman., The challenge to fulfil electrical power requirements
ofadvanced vehicles, Journal of Power Sources, 127(2004).
[3] P. Denholm, W. Short, An Evaluation of Utility System Impacts and
Benefits of Optimally Dispatched Plug-In Hybrid Electric Vehicles,
Technical Report, October 2006.
[4] S. Logghe, B. Van Herbruggen, B. Van Zeebroeck, Emissions of road
traffic in Belgium, Transport & Mobility Leuven, January 2006.
[5] Clement K., Van Reusel K., Driesen J., The consumption of electrical
energy of plug-in hybrid electric vehicles in Belgium, EET-European Ele-
Drive Transportation conference, Brussels, Belgium, 30th May - 2nd June,
2007.
[6] Commission Energy 2030, Belgium’s energy challenges towards 2030,
preliminary report, November 2006.
[7] Clement K., Haesen E., Driesen J. The impact of uncontrolled and
controlled charging of plug-in hybrid electric vehicles on the distribution
grid, EET-2008 3rd European Ele-Drive Transportation Conference,
Geneva, Switzerland, March 11-13, 2008.
[8] Kersting W., Distribution System Modeling and Analysis, Boca Raton,
2002.
[9] Haesen E., Driesen J., Belmans R. Robust planning methodology for
integration of stochastic generators in distribution grids, IET Journal on
Renewable Power Generation, vol.1, no.1, March, 2007.
[10] J. Linderoth, A. Shapiro and S. Wright, The em-pirical behavior of
sampling methods for stochastic programming, Annals of Operations
Research, Vol. 142, No. 1,
ISSN NO: 2454-1958 Special Issue Tech-Ed 2016 (International Conference) Page 106
POWERGENERATION FROM
BIOMASS BRIQUETTES
Prasanna Gaikwad
Department of Mechanical
Engineering,
Tulsiramji Gaikwad-Patil
College of Engineering
and Technology,
Nagpur, India
Mobile No: 8408808218
Aditya Nakat
Department of Mechanical
Engineering,
Tulsiramji Gaikwad-Patil
College of Engineering and
Technology,
Nagpur, India
Mobile No:9860931511
Vansh Devhare
Department of Mechanical
Engineering,
Tulsiramji Gaikwad-Patil
College of Engineering and
Technology,
Nagpur, India
Mobile No:8007224378
Jayesh Nandankar
Department of Mechanical
Engineering,
Tulsiramji Gaikwad-Patil
College of Engineering and
Technology, Nagpur, India
Mobile No:8605820090
ABSTRACT:
Today the energy is vital part of our life. Demand of energy is
everywhere Energy is the key factor in economic development of
any country. The demand of energy increases rapidly in all
sectors like domestic use, infrastructure, agriculture, automobile,
power etc. That’s why there is a huge requirement to find
alternative green energy sources to the coal, charcoal, oil, petrol
diesel and fossil fuels to prevent the environment from toxic gases
and harmful pollution. Also Deforestation is the global problem
and thus from the old days Biomass is use as a source of energy in
India and it shows great potential. Biomassbriquettes are a
renewable source of energy and avoid adding fossils carbon to the
atmosphere. Therefore this substitute energy medium is given
national priority as appears to be the only permanent solution
into restriction of the national laws and avoid pollutions.
‘Biomass Briquetting’ is the process of physical transformation of
loose raw bio waste material like rice husks, saw dust briquette,
ground nut shells, bark woods etc into high density fuel
briquettes through a compacting process. The resultant form
change increases the calorific value (combustion efficiency) of the
product as compared to lose material. As it increases the density
of the product.
KEYWORDS: Ingredients, Manufacturing, Types, Techniques,
Case study.
INTRODUCTION
BIOMASS BRIQUETTE INGREDIENTS
The carbon and oxygen content is important in
biomass energy analysis. As the high Oxygen content tends to
lower the calorific value while high carbon content tends to
form high-grade biomass fuel. The calorific value is one of the
most important characteristics which is the amount of energy per kg it gives off when burnt. Thus it be used to calculate the
competitiveness of a processed fuel in a given market situation
also the ease of handling, burning characteristics are also the
factors to be consider while selecting the raw material.
The table no.1 depicts some important characteristics of
mostly used biomass briquettes.
Fuel
name
C% H% S% N% O
%
ASH
%
GCV
in Kcal
HH
V in
MJ/
Kg
Coconut
shells
40.
23
2.4
8
0.0
1
0.8
8
56.
39
2.3 4524 11.0
7
Coffee
husk
53 5.3 0.0
1
1.0
5
39.
78
10 4045 20.7
Bagasse
45.
21
4.9
3
0.0
1
0.8
8
48.
96
3 4380 16.4
6
Cotton
stalks
38 3.4
4
0.0
2
1.7
5
56.
77
5 4252 11.3
2
Saw dust 46.
12
4.6
31
0.0
24
0.7
0
48.
524
5 3898 16.4
2
Groundn
ut shells
55.
41
4.1
47
0.0
1
3.5
0
36.
929
5 4524 20.2
5
Rice
husk
64.
5
3.7
82
0.0
1
2.1 29.
6
20 3200 23.4
5
Table No.1 Ingredient of Biomass Briquettes
The measured percentage H, N and S contents are
generally much lower to that of hydrocarbon fuels and
oxygencontent is high to that of hydrocarbon. The total nitrogen
varies in the range 0.88-3.50 (wt %) and the total sulfurrange
0.0106-0.1090 (wt %). Both nitrogen and sulfur content are not
important in biomass combustion. They tend
to increase the release of toxic gases that are either irritants (NOx, SO2, aldehydes and acrolein) or asphyxiants(HCN)
which may cause adverse effect to living organisms
MANUFACTURING PROCESS
Biomass briquetting project is simply a process of
densification of agro waste and forestry waste into biomass

ISSN NO: 2454-1958 Special Issue Tech-Ed 2016 (International Conference) Page 107
briquettes also called as white coal. All materials containing
lignite and cellulose are suitable for densification. Successful
test have been carried out with variety of materials from saw
dust, sander dust, etc. The bio residues can be briquetted
individually or in combination depending on their availability
and blending properties. Main concept of this process is to produce the material as a white-coal, which is made from the
wastages. We cannot destroy the wastage totally. But we can
use it with the help of briquetting plant and produce the
briquettes, which ultimately produce the energy. The use of
these cheap fertilizers gives low yield as compared to the
modern fertilizer. The briquette made from press mud after
drying and briquetting have calorific value 4000 Kcal. /Kg
Approximately. It can be illustrate step by step.
Sorting/sieving: All unwanted materials or largebiomass
waste are removed to ensure that all thefeedstock is of the
required size. For example, the rawsawdust you collect could
contain unwanted larger piecesof wood. These can be sieved
out with a wire mesh.
Shred biomass materials into small pieces: Thebiomass
materials are chopped into small pieces so asto enhance their workability and compactness. Theprocess is dependent on the
type of biomass feedstock.
For example, coffee husks and saw dust would notrequire
shredding but materials such as groundnutwaste, bagasse,
wheat straws, barley and maize strawsand cobs would need to
be chopped into small sizes. Inthe case of carbonized biomass,
the materials wouldneed to be grounded into small pieces after
they havebeen carbonized.
Mixing: This process is done in situations where youwant to
use a range of different feedstock to optimize the burning
characteristics of the final fuel. For example,biomass materials
with high ash content could be mixed with biomass material of
low ashcontent. Biomass with low energy content such
aspapers can be appropriately mixed with those of highenergy
content. This helps to attain the right quality(long burning
period, non-smoking and odor free) thatwill make briquettes competitive in the market.
Binder: In addition to biomass mixing, an appropriatebinder is
added and mixed with the biomass thoroughly.
This enhances the compactness of the biomassmaterials and prevents them from falling apart. An example of such binders
includes starch or clay rich inbiomass.
Adding water: Water is usually added to thefeedstock to
make them loose and easy to work on.Some biomass materials
require to be soaked in waterfor a number of days to ensure
that they are soft enoughto work on.
Compaction & Drying: Finally the feedstock is readyfor
compaction, either by machine or by hand. Thebriquettes will
need to be left to dry for up to a week.
The Production of Biomass Briquettes is as shown in fig no.1
Fig. No.1 Biomass Briquette Production
Fig No.2 Flow Diagram of Briquette Production Process
Screw Press and Piston Press Technologies:
High compaction technology or binder less technology
consists of the piston press and the screw press. Most of the
units currently installed in India are the reciprocating type
where the biomass is pressed in a die by a reciprocating ram at a very high pressure. In a screw extruder press, the biomass is
extruded continuously by a screw through a heated taper die.
In a piston press the wear of the contact parts e.g., the ram and
die is less compared to the wear of the screw and die in a
screw extruder press. The power consumption in the former is
less than that of the latter. But in terms of briquette quality and
production procedure screw press is definitely superior to the
piston press technology. The central hole incorporated into the
briquettes produced by a screw extruder helps to achieve
uniform and efficient combustion and, also, these briquettes
can be carbonized. The following table shows a comparison
between Piston press and Screw Extruder.
Parameters Piston press Screw Extruder
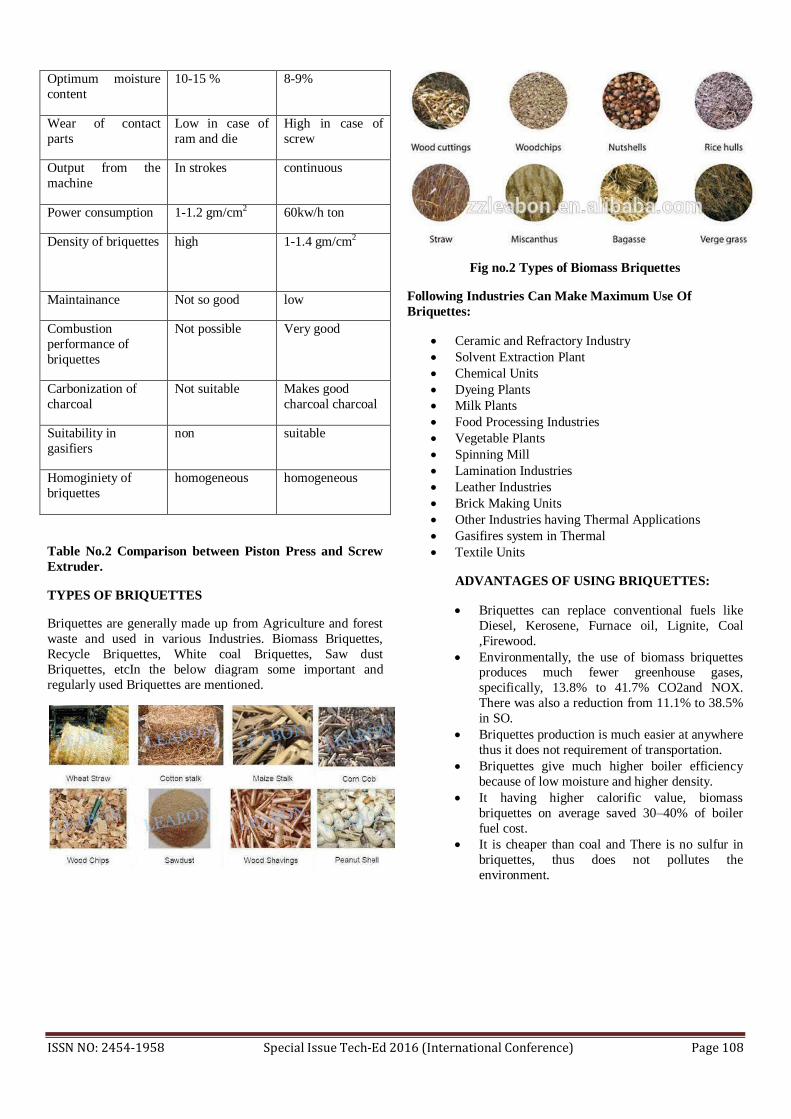
ISSN NO: 2454-1958 Special Issue Tech-Ed 2016 (International Conference) Page 108
Optimum moisture
content
10-15 % 8-9%
Wear of contact
parts
Low in case of
ram and die
High in case of
screw
Output from the
machine
In strokes continuous
Power consumption 1-1.2 gm/cm2 60kw/h ton
Density of briquettes
high 1-1.4 gm/cm2
Maintainance Not so good low
Combustion
performance of
briquettes
Not possible Very good
Carbonization of
charcoal
Not suitable Makes good
charcoal charcoal
Suitability in
gasifiers
non suitable
Homoginiety of
briquettes
homogeneous homogeneous
Table No.2 Comparison between Piston Press and Screw
Extruder.
TYPES OF BRIQUETTES
Briquettes are generally made up from Agriculture and forest
waste and used in various Industries. Biomass Briquettes,
Recycle Briquettes, White coal Briquettes, Saw dust
Briquettes, etcIn the below diagram some important and
regularly used Briquettes are mentioned.
Fig no.2 Types of Biomass Briquettes
Following Industries Can Make Maximum Use Of
Briquettes:
Ceramic and Refractory Industry
Solvent Extraction Plant
Chemical Units
Dyeing Plants
Milk Plants
Food Processing Industries
Vegetable Plants
Spinning Mill
Lamination Industries
Leather Industries
Brick Making Units
Other Industries having Thermal Applications
Gasifires system in Thermal
Textile Units
ADVANTAGES OF USING BRIQUETTES:
Briquettes can replace conventional fuels like
Diesel, Kerosene, Furnace oil, Lignite, Coal
,Firewood.
Environmentally, the use of biomass briquettes produces much fewer greenhouse gases,
specifically, 13.8% to 41.7% CO2and NOX.
There was also a reduction from 11.1% to 38.5%
in SO.
Briquettes production is much easier at anywhere
thus it does not requirement of transportation.
Briquettes give much higher boiler efficiency
because of low moisture and higher density.
It having higher calorific value, biomass
briquettes on average saved 30–40% of boiler
fuel cost.
It is cheaper than coal and There is no sulfur in
briquettes, thus does not pollutes the
environment.

ISSN NO: 2454-1958 Special Issue Tech-Ed 2016 (International Conference) Page 109
ADVANTAGES OF SETTING UP PLANT PROJECT
There is no fly ash when burning briquettes.
Briquettes have consistent quality BRIQUETTES,
have high burning efficiency, and are ideally sized for
complete combustion.
Compared to fire wood or loose biomass, briquettes give much higher boiler efficiency because of low
moisture and higher density.
Briquettes, are easy to store, pack and hygienic to
handle.
High sulfur content of oil and coal, when burnt,
pollutes the environment.
Combustion is more uniform compared to coal and
boiler response to changes in steam requirement is
faster due to higher quantity of volatile matter in
briquettes.
DISADVANTAGES OF USING BRIQUETTES:
Specific heat at constant volume of briquettes is
comparatively very small with coal.
ATF of biomass briquettes is also very very
small as compared coal.
It results in deaerating.
CASE STUDY:The Industry had two RFO fired
boilers: one of 10 TPH (smoke tube boiler) and
another of 8 TPH (water tube boiler). RFO is
atomized with air in the RFO burner and fired, which
produces hot flue gases that pass into the boiler tubes
to generate steam. Water tube boiler, which otherwise
kept as standby is retrofitted to facilitate briquette
firing.In future, it is also envisaged that the steam
generation might be shifted to the existing smoke tube boiler, which will be retrofitted to facilitate the
briquette firing. However in that case, total steam
generation from the boiler will be the same as that of
the briquette fired water tube boiler. Change in the
briquette consumption & efficiency of the boiler will
be get accounted in the monitoring table.
Details of Retrofit Technology:
In the project activity, water tube boiler has been retrofitted
with external furnace to facilitate briquette firing. The
technology involves a Retro-fitting operation(RFO) where a
burner and a RFO firing system are removed and replaced by a
hot duct, a biomass based fired furnace, and an induced
draught system. A well insulated extended furnace is
constructed near the boiler to facilitate manual briquette firing.
Briquettes burn over the grate and the hot flue gas resulting at a temperature of 1300-1400ºC is supplied to the shell side of
the boiler through a connecting duct of 6m long. Here the
water is passed through the tubes of the boiler. After going
through the boiler, heat from the flue gases is recovered in the
economizer. Since there is no sulphur in the fuel, heat can be
extracted at a much higher extent from hot flue gases. In this
project, two dust settling chambers are provided for burnt
gases treatment:
One at the exit of the furnace.
The other, at the economizer
This is where dust particles from the flue gases get settled and
are removed. GHG Emissions from the boiler after the retrofit
are better than that with RFO firing and also well within prevailing norms. The technology is safe and environmentally
sustainable. The ash generated during the project activity
because of briquette firing, is collected & drenched with water.
Wetted ash is then carried away with the help of trolleys &
used for land filling in the plant itself.
In the absence of the project activity, one of the existing RFO
fired boiler would have been used for steam generation. In this project activity, 8 TPH water tube boiler is retrofitted to
facilitate briquette firing and is used for steam generation.
Steam production of briquette-fired boiler is 3.81 TPH.
Through this conversion, the boiler efficiency goes down from
79.73% to 75.31% and increases electricity consumption by
1.12 KWh/MT of steam generated.
RESULT ANALYSIS
Switching from RFO to Briquette offers various advantages
with respect to emissions, safety, and leakage of fuel during
transportation and storage, which are as follows:
1. GHG(Green House Gases) emissions are reduced from
7,856 to 1,298 tonnes of CO2 equivalent per year. Thus the
project has the capacity to reduce GHG emissions by 6558
tonnes of CO2 equivalent per year. In addition to this, SOX&
NOX emissions are also reduced significantly. Thus the
briquette fuel is environment friendly.
2. During transportation of RFO, losses due to evaporation of
fuel are more. Chances of leakage during transportation are
also there. In case of Briquette, such losses are not there. Thus
the transportation losses are minimized.
3. During storage of RFO, if the fuel leaks then there is a
chance of fire hazard. During handling ofBriquette such
situation does not arise. Thus the handling of briquette as fuel is also comparatively safe.

ISSN NO: 2454-1958 Special Issue Tech-Ed 2016 (International Conference) Page 110
Fig. No.3 Arrangement of the Retrofit External Furnace
CONCLUSION:
Biomass briquette is the best alternative for the coal and
charcoal. Biomass briquettes it gives two advantages first is it reuses the agriculture waste which is abundant in agriculture
fields and another one that it is environment friendly. Also it is
used in lot of Industries. In case Study we seen that if we use
the retrofitting of Briquette to the RFO Boiler it produce
tremendous change in GHG, CO2, SOX&NOX emissions per
year. Therefore in India, the Indian Renewable Energy
Development Agency (IREDA) promoting the utilization of
Biomass Briquettes.
REFRENCES:
Clean development mechanism project design document form .
Version 03 - in effect as of: 22 December 2006
Ghosh, K.P (2002),Converting Biomass. The Statesman March 5th
2002.
http://search.proquest.com/docview/284145740?accountid=38885
retrieved on 29.09.11
Grover P. D. & Mishra S. K (1996), “Biomass briquetting:
Technology and Practices”, Food and Agriculture Organization of
the United Nations Bangkok, April 1996, Field Document No.4
"Biomass Briquetting: Technology and Practices - Introduction."
Centre for Ecological Sciences INDIAN INSTITUTE OF
SCIENCE BANGALORE. Web. 04 Dec. 2010.
PRABIR, B. and BUTLER, J. and LEON, M., "Biomass co-firing
options on the emission reduction and electricity generation costs
in coal-fired power plants", Renewable Energy, 36 (2011).
"Biomass Briquettes for Green Electricity Production."
Bionomicfuel.com. 4 May 2009. Web. 30 Nov. 2010. .
Mani, Sokhansanj, and L.G. Tabil. "Evaluation of compaction
equations applied to four biomass species." University of
Saskatchewan College of Engineering. Web. 30 Nov. 2010.
"Biomass Briquetting: Technology and Practices - Introduction."
Centre for Ecological Sciences INDIAN INSTITUTE OF
SCIENCE BANGALORE. Web. 04 Dec. 2010.
Ramesh Man Singh. "History of Bio-Briquetting." brgcnn.net.
2008. Web. 30 November 2010.
"Biomass Briquetting: Technology and Practices - Introduction."
Centre for Ecological Sciences INDIAN INSTITUTE OF
SCIENCE BANGALORE. Web. 04 Dec. 2010.
PRABIR, B. and BUTLER, J. and LEON, M., "Biomass co-firing
options on the emission reduction and electricity generation costs
in coal-fired power plants", Renewable Energy, 36 (2011).
PRABIR, B. and BUTLER, J. and LEON, M., "Biomass co-firing
options on the emission reduction and electricity generation costs
in coal-fired power plants", Renewable Energy, 36 (2011).
"Biomass Briquette." Www.gcmachines.com. Web. 30 Nov. 2010.
Yugo Isobe, Kimiko Yamada, Qingyue Wang, Kazuhiko
Sakamoto, Iwao Uchiyama, TsuguoMizoguchi and Yanrong Zhou.
"Measurement of Indoor Sulfur Dioxide Emission from Coal–Biomass Briquettes." springerlink.com. Web. 30 November 2010.

ISSN NO: 2454-1958 Special Issue Tech-Ed 2016 (International Conference) Page 111
DEVELOPMENT AND FABRICATION OF
MULTI-NOZZLE PESTICIDES SPRAYING
PUMP
Mr.Akshay Shende1
U.G. Student, T.G.P.C.E.T.
Nagpur, India
Mr.NitinGokhe,
U.G. Student, T.G.P.C.E.T.
Nagpur, India
Mr.AvinashRamteke
U.G. Student, T.G.P.C.E.T.
Nagpur, India
Prof.HarshwardhanMahawadiw
ar
Faculty, T.G.P.C.E.T. Nagpur,
India
ABSTRACT
India is a land of agriculture which comprises of small,
marginal, medium and rich farmers. Small scale farmers are
very interested in manually lever operated knapsack sprayer
because of its versatility, cost and design. But this sprayer has
certain limitations like it cannot maintain required pressure; it
lead to problem of back pain. However this equipment can also
lead to misapplication of chemicals and ineffective control of
target pest which leads to z cause environmental pollution and
imbalance in natural echo system. This paper suggests a model
of manually operated multi nozzle pesticides sprayer pump
which will perform spraying at maximum rate in minimum
time. Constant flow valves can be applied at nozzle to have
uniform nozzle pressure.
Key words: Mechanization, spraying time, pesticides sprayer
and organic fertilizer
INTRODUCTION
Agriculture plays a vital role in Indian economy.
Around 65% of population in the state is depending on
agriculture. Although its contribution to GDP is now around one sixth, it provides 56% of Indian work force [10]. Table
1 shows that share of marginal and small farmer is around
81% and land operated is 44 % in 1960-61. As far as Indian
scenario is concerned, more than 75 percent farmers are
belonging to small and marginal land carrying and cotton is
alone which provide about 80 % employment to Indian
workforce. So any improvement in the productivity related
task help to increase Indian farmer’s status and economy.
The current backpack sprayer has lot of limitation and it
required more energy to operate. The percentage distribution
of farm holding land for marginal farmers is 39.1
percentage, for small farmers 22.6 percentage, for small and marginal farmers 61.7 percentage, for semi-medium farmers
19.8 percentage, for medium farmers 14 percentage and for
large farmers 4.5 percentage in year 1960-61.Table 1 clearly
explain that the maximum percentage of farm distribution
belonged to small and marginal category..
In India about 73% of population is directly or
indirectly depends upon the farming. Hence it is said that
India is an agricultural based country. But till now our farmers are doing farming in same traditional ways. They
are doing seed sowing, fertilizers and pesticides spraying,
cultivating by conventional methods. There is need of
development in this sector and most commonly on fertilizers
pesticides spraying technique, because it requires more
efforts and time to spray by traditional way.
Most of Asian nations are at developing stage and they are
facing the problem of high population and as compared to
that agricultural productivity is much lower as compared to
developed nations. India is one of the nations who is facing
the same problem. This is caused due to low level farms,
insufficient power availability to farms and poor level of farm mechanization.
In order to meet the requirement of food of
growing population and rapid industrialization, there is a
need of the modernization of agriculture sector. On many
farms production suffers because, delay in sowing, improper
distribution suffer because delay in sowing, improper
distribution of pesticides and fertilizers, harvesting.
Mechanization solves all the problems which are
responsible for low production. It conserves the input and
precision in work and get better and equal distribution. It
reduces quantity needed for better response, prevent the losses and wastage of input applied. It get high productivity
so that cost of production will reduced.
To reach the requirement of production Agriculture
implement and machinery program of the government take

ISSN NO: 2454-1958 Special Issue Tech-Ed 2016 (International Conference) Page 112
steps to increase availability of implement, pumps, tractors,
power tillers, harvester and other power operated machines.
Special emphasis was laid on the later as more than65
LITERATUREREVIEWS
A. Spraying Methods:
One of the more common forms of pesticides application, especially in conventional agriculture is the use
of mechanical sprayers. Hydraulic sprayers consists of a
tank, a pump,lance(for single nozzle) or boom and a nozzle
(or multiple nozzles).sprayers convert a pesticides
formulation, often containing a mixture of water( or another
liquid chemical carrier, such as fertilizer) and chemical into
droplets, which can be large rain type drops or tiny almost invisible particles. The size of droplets can be altered
through the use of different nozzle sizes, or by altering the
pressure under which it is forced. Large droplets have
advantage of being less susceptible to spray drift, but
require more water per unit of land covered.
1) Backpack (Knapsack) Sprayer:
the main principle use in spraying with knapsack type of
sprayer is pressure difference created by hand operated
lever. It has usually single nozzle through which liquid
pesticides is forced to come out of the nozzle in fine droplet
form. Some sprayers can generate pressure of 7kg/ cm2. Capacity are usually less than 20 liter or less.
The main components of hydraulic sprayer are tank, pump,
lance, boon and a nozzle. Sprayers convert the pesticides
into small droplets which can vary according to pressure &
size of perforation of the nozzle.
Large size droplets are advantages in being less drift while
spraying but there is wastage of pesticides in this method.
The smaller size droplet is more evenly sprayed. The main
demerit of back pack sprayer is that the labour has to carry
nearly 5 gallon capacity on his back which cause severe
back pain and cause fatigue to labour.
2) Hydraulic Sprayer: Most of the world’s pesticides are mixed with water and
sprayed through hydraulic nozzle: of one short of another.
There are enormous variation in the scale, the way pumping
is achieved and the configuration of atomizer, this >100
year old technology is still considered the method of choice
by farmers and other spray operators.
3) Large –Scale Tractor Mounted & Self Propelled Equipment Or Lite-Trac:
In this the motorized technique of spraying the pesticides in
which “lite-tractor” is used. The lite- trac name comes from
“lite tractor” due to patented chassis design, facilitating the
naturally leaving machines manufactured by company to
have a light footprint for minimal soil compression. Lite-
Trac is currently the European largest manufacturer of four
wheeled.spraying tractor for crops. The stainless steel can
accommodate around 8000 liters of pesticides for spraying
so no need of frequent refilling. But main drawback is its
high cost which small or medium scale farmer in India can’t
bear. So we have designed a less expensive device for spraying of both organic pesticides and fertilizer for small
scale farmers.
DESIGN REQUIREMET
A. Shortcoming in Existing Sprayer Pumps: The normally used spraying pump by farmers in India
(small, marginal or medium) is the back pack sprayer. The
main limitation of using it is that of its small capacity and
carrying it on back cause back pain and continuous lever
movement for pressure generation can cause muscular
disorder. Developing adequate pressure is a laborious and
tedious and time consuming process. It takes longer time to spray the entire land due to frequent refilling it because it
has small capacity of 10-15 liter tank
Sr. no. Types of
sprayer
Area for
which
spraying
is used
Time
required
1 Bullock
driven
Larger
area
Less time and
effort
2 Hand
driven
Smaller
area
Larger time
and effort
Table1: Existing high features of sprayer
B. Providing Alternative to Small Farmers:
the backpack(Knap-sack) sprayer for spraying pesticides by
the farmer cost around Rs. 2000-4500 and for rich farmers
there are lite-Trac available ch are beneficial for larger land
a but it cost more which the small farmers can’t bear.
So, we have proposed an organic fertilizer cum pesticides
sprayer device for convenience of the farmer. Which can be
hand driven or bullock driven. The cost may be around Rs. 25000/- but it would be one time investment for the farmers
for higher productivity of crops.

ISSN NO: 2454-1958 Special Issue Tech-Ed 2016 (International Conference) Page 113
working of this manually operated organic fertilizers cum
pesticides sprayer is based on the principles of motion of
trolley which transmit its rotary motion from slider crank
mechanism arrangement and reciprocating piston into the
cylinder for pumping the pesticides. When the operator pushes the trolley forward, the wheel rotates in counter
clockwise direction hence slider move in counter clockwise
which is attached to crank shaft. This motion is transfer
through slider crank to disc, it rotates in counter clockwise
direction. Its motion rotates the disk on which there is a
linkpresentwhich move reciprocating motion.the piston or
plunger also move in reciprocating motion, hence spray the
pesticides through the nozzle.
CONCLUSION
1)The suggested model has removed the problem of back
pain, since there is no need to carry the tank (pesticides
tank) on the back.
2) as suggested model has more number of nozzles which
will cover maximum area of spraying in minimum time & at
maximum rate.
3) The c.f. valves can also be applied which help in reducing
the change of pressure fluctuation and c.f. Valves helps to
maintain pressure.
4) Proper adjustment facility in the model with respect to
crop helps to avoid excessive use of pesticides which result
into less pollution.
5) Imported hollow cone nozzles should be used in the field
for better performance.
6) Muscular problems are removed and there is no need to
operate the lever.
7) This alone pump can used for multiple crops
REFERENCES
[1] Application technology: Problems and opportunities with Knapsack
sprayer, Including the cf valves or Constant Flow Valves.-David McAuliffe
and Vanessa P. Gray
[2] Journal of arboriculture weed control in landscape plantings1 by J.F.
Ahrens April 1981 vol. 7, no. 4.
[3]I.Daut, N.Gomesh, M.Irwanto, Y.M. Irwan, “Energy Saving Suction
Hood” World Academy of Science, Engineeering and Technology 6 jan
2012, Pages 612-616.
[4] BhubaneswariParida, S. Iniyan, rankoGoic, “A review of solar
photovoltaic technlogies” Renewable and Sustainable Energy Reviews,
Volume 15, Issue 3, April 2011, Pages 1625-1636.
[5]Maharashtra progressive Agriculture –A new Horizon- confederation
of Indian Industry.
[6]Modification of a knapsack for more efficient use j. Founk.
[7]Eco-friendly Mechanically operated multipurpose spray pump,by- prof.SwapnilKolhe of NileshGajbhiye
Sr.
no.
Name of
crop
Distance
between(
mm)
Height of
crop(mm)
1 cotton 600-900 600-1500
2 groundnut 400-500 400-450
3 Pigeon pea 400-500 250-300
4 Sugarcane 400-500 1600-
2100
ISSN NO: 2454-1958 Special Issue Tech-Ed 2016 (International Conference) Page 114
DEVELOPMENT AND FABRICATION OF
MULTI-NOZZLE PESTICIDES SPRAYING
PUMP
Mr. Ajay Rathod
U.G. Student, Department
ofMechanical engineering
T.G.P.C.E.T. Nagpur, India
Mr.Arun Chavan
U.G. Student, Department of
Mechanical engineering
T.G.P.C.E.T. Nagpur, India
Mr.Dhiraj Bramhane
U.G. Student, 4Department of
Mechanical engineering
T.G.P.C.E.T. , Nagpur, India
prof. Harshwardhan
Mahawadiwar
4Assistant professor,
4Department of Mechanical engineering T.G.P.C.E.T
,Nagpur, India
ABSTRACT
As the world’s population increases and the diets of
the developing world continue to improve, demand for meat
and crops means food production could need to increase by up
to 70% by 2050. Fertilizers will undoubtedly play a major role
in this production uplift. The mechanization process may
helpful in yields of crop, small scale farmers are aiming for less
investment in form of backpack type sprayer’s but it may
causes mainly back pain and muscular disorder so to avoid all
these demerit we have propose sprayer of fertilizer and
pesticides which can simply be pulled by hand. This paper
suggest a model of manually operated multi-nozzle pesticide
sprayer. This will perform spraying at maximum rate in
minimum time and optimum utilization of organic pesticides
and evenly distributing it. In another tank there is of organic
fertilizer and two knob arrangement for flow of liquid fertilizer
which flows with gravity force, constant flow, valve can be provided at nozzle to have control the flow of fertilizer.
Keywords: Mechanization, spraying time, pesticides sprayer and organic fertilizer
INTRODUCTION
India is agricultural country, most of people in India are farmer and they lives in villages, so we have made suitable
pump for the farmer. Because they have used harmful and
expensive fertilizer and pesticides, there is need for
improvement in farming procedure and used of cheep and
beneficial equipment for effective spraying and weeding for
increase in productivity. Insects are largely responsible for
crop destruction and for curing we use chemical fertilizer
and pesticides which causes adverse effect on our health.
Insecticides preparation is used to kill insects otherwise we
can control their reproduction. These are sprayed on the
crops by devices known as sprayer. For small farmer one of
the reason in less yield of crops in improper seed bed, preparation and late sowing, harvesting and threshing.
Mechanization will improve the circumstance through
definiteness in metering ensuring more appropriate
distribution lessening quantity needed for better prevention
of wastage of fertilizer and pesticides.Mechanization helps
in giving higher productivity through less effort. Most
farmer are acapital thus, there is an apportunity to suggest
on inexpensive mechanical sprayer for organic pesticides
which can be easily mobile and carry large capacity tank so
no need of frequent refilling the traditional backpack.
LITERATUREREVIEW
A. Spraying Methods:
One of the more common forms of pesticides application,
especially in conventional agriculture is the use of
mechanical sprayers. Hydraulic sprayers consists of a tank, a
pump,lance(for single nozzle) or boom and a nozzle (or
multiple nozzles).sprayers convert a pesticides formulation,
often containing a mixture of water( or another liquid
chemical carrier, such as fertilizer) and chemical into
droplets, which can be large rain type drops or tiny almost
invisible particles. The size of droplets can be altered
through the use of different nozzle sizes, or by altering the
pressure under which it is forced. Large droplets have advantage of being less susceptible to spray drift, but
require more water per unit of land covered.
1. Hand driven sprayer:
Hand driven pumps consist of a flexible diaphragm made of synthetic rubber connected to the pump handle by a
crankshaft mechanism, a rigid diaphragm chamber and
either flat or ball-type inlet and outlet valves. The outlet

ISSN NO: 2454-1958 Special Issue Tech-Ed 2016 (International Conference) Page 115
valve is connected to a pressure chamber, which in many
hand driven pump sprayers has a variable pressure setting
valve. These pumps typically operate between pressures of 1
and 3 bar (15-44 psi) and it is suitable for
herbicideapplication where large droplets are required to
minimize spray-drift.
2) Hydraulic Sprayer:
Most of the world’s pesticides are mixed with water and
sprayed through hydraulic nozzle: of one short of another.
There are enormous variation in the scale, the way pumping is achieved and the configuration of atomizer, this >100
year old technology is still considered the method of choice
by farmers and other spray operator.
3. Fuel Operated Sprayer:
The power sprayer consists of an integrated or external
spray tank; a high pressure piston pump usually powered by
a petrol engine a pressure regulating valve and a hose of up
to 50 m of length. Spray tanks are too big to be carried as a
knapsack. The power sprayer is produced in a number of
versions. Most simple and common is an Engine driven
pump mounted on a frame.
DESIGN REQUIREMET
A. Shortcoming in Existing Sprayer Pumps:
The normally used spraying pump by farmers in India
(small, marginal or medium) is the back pack sprayer. The main limitation of using it is that of its small capacity and
carrying it on back cause back pain and continuous lever
movement for pressure generation can cause muscular
disorder. Developing adequate pressure is a laborious and
tedious and time consuming process. It takes longer time to
spray the entire land due to frequent refilling it because it
has small capacity of 10-15 liter tank.
B. Providing Alternative to Small Farmers:
the backpack(Knap-sack) sprayer for spraying pesticides by
the farmer cost around Rs. 2000-4500 and for rich farmers
there are lite-Trac available ch are beneficial for larger land
a but it cost more which the small farmers can’t bear. So, we
have proposed an organic fertilizer cum pesticides sprayer
device for the convenience of the farmer. Which can be
hand driven or bullock driven. The cost may be around Rs.
25000/- but it would be one time investment for the farmers for higher productivity of crops.
Sr. no. Types of
sprayer
Area for
which
spraying
is used
Time
required
1 Bullock driven
Larger area
Less time and effort
2 Hand
driven
Smaller
area
Larger time
and effort
Table1: Existing spraying methods
Table2: distance between and height of crops
WORKING
The working of this manually operated organic fertilizers
cum pesticides sprayer is based on the principles of motion
of trolley which transmit its rotary motion from slider crank
mechanism arrangement and reciprocating piston into the
cylinder for pumping the pesticides. When the operator
pushes the trolley forward, the wheel rotates in counter
clockwise direction hence slider move in counter clockwise which is attached to crank shaft. This motion is transfer
through slider crank to disc, it rotates in counter clockwise
direction. Its motion rotates the disk on which there is a
linkpresentwhich move reciprocating motion.the piston or
plunger also move in reciprocating motion, hence spray the
pesticides through the nozzle
CONCLUSION
1)The suggested model has removed the problem of back
pain, since there is no need to carry the tank (pesticides
tank) on the back.
Sr.
no.
Name of
crop
Distance
between(
mm)
Height of
crop(mm)
1 cotton 600-900 600-1500
2 groundnut 400-500 400-450
3 Pigeon pea 400-500 250-300
4 Sugarcane 400-500 1600-2100

ISSN NO: 2454-1958 Special Issue Tech-Ed 2016 (International Conference) Page 116
2) as suggested model has more number of nozzles which
will cover maximum area of spraying in minimum time & at
maximum rate.
3) The c.f. valves can also be applied which help in reducing
the change of pressure fluctuation and c.f. Valves helps to
maintain pressure.
4) Proper adjustment facility in the model with respect to
crop helps to avoid excessive use of pesticides which result
into less pollution.
5) Imported hollow cone nozzles should be used in the field
for better performance.
6) Muscular problems are removed and there is no need to
operate the lever.
7) This alone pump can used for multiple crops
REFERENCES
[1] Application technology: Problems and opportunities with Knapsack
sprayer, Including the cf valves or Constant Flow Valves.-David McAuliffe
and Vanessa P. Gray
[2] Journal of arboriculture weed control in landscape plantings1 by J.F. Ahrens April 1981 vol. 7, no. 4.
[3]I.Daut, N.Gomesh, M.Irwanto, Y.M. Irwan, “Energy Saving Suction
Hood” World Academy of Science, Engineeering and Technology 6 jan
2012, Pages 612-616.
[4] BhubaneswariParida, S. Iniyan, rankoGoic, “A review of solar
photovoltaic technlogies” Renewable and Sustainable Energy Reviews, Volume 15, Issue 3, April 2011, Pages 1625-1636.
[5]Maharashtra progressive Agriculture –A new Horizon- confederation
of Indian Industry.
[6]Modification of a knapsack for more efficient use j. Founk.
[7]Eco-friendly Mechanically operated multipurpose spray pump,by- prof.SwapnilKolhe,prof.NileshGajbhiye
Digital Human Modeling an Aid For Ergonomic
Evaluation
Mrs.Anjali Kadam Asst.Professor,Mechanical Engineering
Priyadarshini J.L.College of Engineering,
Nagpur,India [email protected]
Abstract— over the last few years there has been a massive
development and use of information technology. These
technologies are probably the only answer to success in a highly
globalized and turbulent market environment. The development
of computer and communication technology enables that the
methods of engineering work can be changed from scratch. This
trend in digitalization has an effect on ergonomics. Digital
Human Modeling is the state of the art technology for virtual
ergonomic evaluation of products and workstations. Ergonomic
evaluations using Digital Mock-up and Digital Human Models
which are computer generated two dimensional or three
dimensional structure of a human representing the complex
physical and cognitive aspects of human beings are economical in
the long run when compared with traditional ergonomic
evaluation process in a typical product or process development
sequences Traditional ergonomic evaluation methods for
studying human performance and productivity, involves physical
mock ups and trial with real human beings are found to be time
consuming and quite expensive. This paper reviews the literature
of Digital Human Modeling and provides overview of up-to-date
research in virtual ergonomics evaluation technology through
DHM. An Attempt has also been made to highlight future
research direction in many areas
Keywords—digital human modelingt; ergonomic
evaluation;simulation
I. Introduction
Ergonomics is according to IEA (International Ergonomics Association,2000) defined as a scientific discipline concerned with the understanding of interactions among human and other elements of a system, and the profession that applies theory, principles, data and methods to design in order to optimize human well-being and overall system performance[1]. Ergonomics promotes a holistic approach in which considerations of physical, cognitive, social, organizational, environmental and other relevant factors are taken into account. Physical ergonomics is concerned with human anatomical, anthropometric, physiological and biomechanical characteristics as they relate to physical activity. Applying a scientific, evidence-based approach to ergonomics process is important with the goal to identify ergonomic risk factors, quantify then, and then make measurable improvements to the workplace, ensuring that jobs and tasks are within workers’
Dr.G.K.Awari
Principal, Tulsiramji Gaikwad-Patil College of Engg & Tech.,
Nagpur,India
capabilities and limitations [2]. Traditional ergonomic evaluation methods for studying human performance and productivity, involves physical mock ups and trial with real human beings are found to be time consuming and quite expensive. As computer technology has become advanced and affordable, spreading its tentacles in each and every scientific discipline(s), ergonomics proved to be no exception [3].
II. IMPORTANCE OF DHM A. Ergonomics and musculoskeletal disorders (MSDs)
Ergonomics is the science of fitting jobs to people. The discipline encompasses a body of knowledge about physical
abilities and limitations as well as other human characteristics
that are relevant to job design. Essentially ergonomics is the
relationship between the worker and the job and focuses on
the design of work areas to enhance job performance.
Ergonomics can help prevent injuries and limit secondary
injuries as well as accommodate individuals with various
disabilities; including those with musculoskeletal disorders
(MSDs).Disorders Musculoskeletal of the system that is
caused precipitated or aggravated by repeated exertions or
movements of the body. MSDs are caused from wear and tear
on tendons, muscles, and sensitive nerve tissue caused by
continuous use or pressure over an extended period of time
[4]. Through ergonomic assessment and related interventions
not only the WMSDs risk factors will be explored but also
some practical ways for the prevention of awkward postures
are introduced. According to WHO (1985), there are some
factors that create or aggravate work-related disorders, such as
work demands, social and cultural factors, work place
characteristics, and environmental factors. In this respect, as
ergonomics covers all of the mentioned farms, it has an
important role in occupational health [5]. B. Digital human modeling
The development of computer and communication technology enables that the methods of engineering work can be changed from scratch. This trend in digitalization has an effect on ergonomics [6]. As computer technology has become advanced and affordable, spreading its tentacles in each and
ISSN NO: 2454-1958 Special Issue Tech-Ed 2016 (International Conference) Page 117
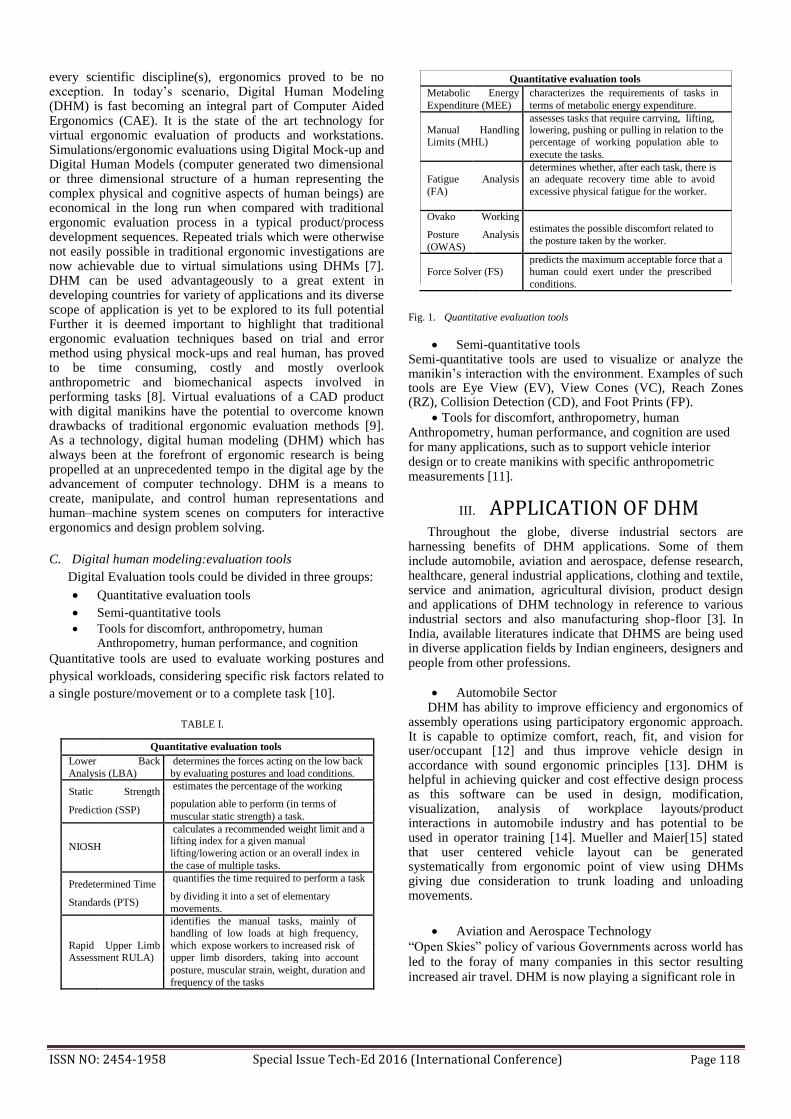
every scientific discipline(s), ergonomics proved to be no exception. In today’s scenario, Digital Human Modeling (DHM) is fast becoming an integral part of Computer Aided Ergonomics (CAE). It is the state of the art technology for virtual ergonomic evaluation of products and workstations. Simulations/ergonomic evaluations using Digital Mock-up and Digital Human Models (computer generated two dimensional or three dimensional structure of a human representing the complex physical and cognitive aspects of human beings) are economical in the long run when compared with traditional ergonomic evaluation process in a typical product/process development sequences. Repeated trials which were otherwise not easily possible in traditional ergonomic investigations are now achievable due to virtual simulations using DHMs [7]. DHM can be used advantageously to a great extent in developing countries for variety of applications and its diverse scope of application is yet to be explored to its full potential Further it is deemed important to highlight that traditional ergonomic evaluation techniques based on trial and error method using physical mock-ups and real human, has proved to be time consuming, costly and mostly overlook anthropometric and biomechanical aspects involved in performing tasks [8]. Virtual evaluations of a CAD product with digital manikins have the potential to overcome known drawbacks of traditional ergonomic evaluation methods [9]. As a technology, digital human modeling (DHM) which has always been at the forefront of ergonomic research is being propelled at an unprecedented tempo in the digital age by the advancement of computer technology. DHM is a means to create, manipulate, and control human representations and human–machine system scenes on computers for interactive ergonomics and design problem solving.
C. Digital human modeling:evaluation tools Digital Evaluation tools could be divided in three groups: Quantitative evaluation tools Semi-quantitative tools Tools for discomfort, anthropometry, human
Anthropometry, human performance, and cognition Quantitative tools are used to evaluate working postures and
physical workloads, considering specific risk factors related to
a single posture/movement or to a complete task [10].
TABLE I.
Quantitative evaluation tools
Lower Back determines the forces acting on the low back
Analysis (LBA) by evaluating postures and load conditions.
Static Strength estimates the percentage of the working
population able to perform (in terms of Prediction (SSP)
muscular static strength) a task.
calculates a recommended weight limit and a
NIOSH lifting index for a given manual
lifting/lowering action or an overall index in
the case of multiple tasks.
Predetermined Time quantifies the time required to perform a task
by dividing it into a set of elementary Standards (PTS)
movements.
identifies the manual tasks, mainly of handling of low loads at high frequency,
Rapid Upper Limb which expose workers to increased risk of Assessment RULA) upper limb disorders, taking into account
posture, muscular strain, weight, duration and frequency of the tasks
Quantitative evaluation tools
Metabolic Energy characterizes the requirements of tasks in
Expenditure (MEE) terms of metabolic energy expenditure.
assesses tasks that require carrying, lifting, Manual Handling lowering, pushing or pulling in relation to the Limits (MHL) percentage of working population able to
execute the tasks.
determines whether, after each task, there is Fatigue Analysis an adequate recovery time able to avoid
(FA) excessive physical fatigue for the worker.
Ovako Working estimates the possible discomfort related to
Posture Analysis the posture taken by the worker.
(OWAS)
predicts the maximum acceptable force that a Force Solver (FS) human could exert under the prescribed
conditions.
Fig. 1. Quantitative evaluation tools
Semi-quantitative toolsSemi-quantitative tools are used to visualize or analyze the manikin’s interaction with the environment. Examples of such tools are Eye View (EV), View Cones (VC), Reach Zones (RZ), Collision Detection (CD), and Foot Prints (FP).
Tools for discomfort, anthropometry, human Anthropometry, human performance, and cognition are used for many applications, such as to support vehicle interior design or to create manikins with specific anthropometric measurements [11].
III. APPLICATION OF DHM
Throughout the globe, diverse industrial sectors are harnessing benefits of DHM applications. Some of them include automobile, aviation and aerospace, defense research, healthcare, general industrial applications, clothing and textile, service and animation, agricultural division, product design and applications of DHM technology in reference to various industrial sectors and also manufacturing shop-floor [3]. In India, available literatures indicate that DHMS are being used in diverse application fields by Indian engineers, designers and people from other professions.
Automobile SectorDHM has ability to improve efficiency and ergonomics of
assembly operations using participatory ergonomic approach. It is capable to optimize comfort, reach, fit, and vision for user/occupant [12] and thus improve vehicle design in accordance with sound ergonomic principles [13]. DHM is helpful in achieving quicker and cost effective design process as this software can be used in design, modification, visualization, analysis of workplace layouts/product interactions in automobile industry and has potential to be used in operator training [14]. Mueller and Maier[15] stated that user centered vehicle layout can be generated systematically from ergonomic point of view using DHMs giving due consideration to trunk loading and unloading movements.
Aviation and Aerospace Technology “Open Skies” policy of various Governments across world has
led to the foray of many companies in this sector resulting increased air travel. DHM is now playing a significant role in
ISSN NO: 2454-1958 Special Issue Tech-Ed 2016 (International Conference) Page 118

this sector to improve passenger amenities and will be sought
after by aeronautic industries. These software are being used
in assessing comfort of airplane passenger seats from user’s
perspective [16]. Manikins can be accurately positioned for
accommodation related investigations in cockpit design [17].
Fighter aircraft pilots are required to make split second
decisions in real battlefield situations based on visual inputs
from cockpit displays/instrumentation. Presence of displays in
blind spot regions can prove to be fatal. DHM can be
productively used to perform vision analysis for pilots in a jet
aircraft as shown in a case study [18].
Defense Research Differently built human models representing diverse
anthropometry of army personnel are used to evaluate their
workstations easily [19]. Manikins can be accurately positioned
for accommodation related investigations in cockpit design [16].
Fighter aircraft pilots are required to make split second decisions
in real battlefield situations based on visual inputs from cockpit
displays/instrumentation. Presence of displays in blind spot
regions can prove to be fatal. DHM can be productively used to
perform vision analysis for pilots in a jet aircraft as shown in a
case study [18].
Healthcare Industry Simulation using DHM with respect to ladder climbing
scenario for an under-knee amputee was performed with an
aim to design comfortable limb prosthesis for complex
motions [20]. Surgeries can be performed effectively and
efficiently as [21] explains application of DHMs to identify
ergonomic problems while performing laparoscopic surgery in
an operation room.
General Industrial Applications DHMs are now being used in secondary manufacturing sectors
to develop ergonomically sound workplace [22]. evaluation of
manual material handling and user interface evaluation in shop
floor[23], biomechanical and vision analysis while using a
machine tool [24], and so on.
Clothing Sector, service and animation A survey on CAD methods in 3D garment design gives ample
insights in visualizing role of DHM in this sector [25]. In
addition to that hand loom industries have several ergonomic
problems which need to be evaluated by DHMs. People today
are short of time and seek convenience in their everyday life.
DHM has started to cater the needs of service sector too.
DHM –important tool for virtual ergonomics Computer-aided technology enables many novel approaches in
modeling, design and fabrication of farm tools and machines.
CAD is mainly used for detailed engineering of 3D models and/or 2D drawings of physical components under a wide
variety of representations. However, digital human
representations in various forms are now being incorporated
in computer-aided design of human- machine systems for
simulating man-machine interactions in virtual environment as
real-world conditions. Application of DHM is becoming
increasingly popular today among designers and manufactures
as it increases productivity, reduces design time-frame and
decreases associated costs. Core functionality of DHM
software is realistic display of anthropometric data and
efficient analysis of ergonomic questions concerning sight,
maximum force, reach ability and comfort. Designers can
subsequently utilize a human model in the creation,
modification, presentation and analysis to ensure enough
clearance and space to human for their ease and comfortable
movement within workplace [26].
IV. DISCUSSION aND conclusion
DHM software are now successfully being used in
various sectors including military research .automobile sector,
aerospace and aviation technology ,industrial applications ,
health care and occupational safety , service industry etc.
DHM tools provide complete digital humans to explore
infinite number of ergonomic scenarios including human size
scaling, evaluation of posture, motion, reach, and vision
within a computer-rendered environment. It is expected that
present review on DHM an aid for ergonomic evaluation
would deliver a concrete knowledge. Adoption of DHM looks
very promising in near future.
References
[1] Marek Bures, “Efficient education of ergonomics in industrial
engineering study program”, Procedia-Social and Behavioral Sciences, 174 (2015) 3204-3209
[2] International Ergonomics Association, Available:
http://www.iea.cc/whats/index.html [3] Sanjog J, Anirban Chowdhury and Sougata Karmakar, “Industry
Specific Applications of DHM”, Proceedings of the International Summit on Human Simulation 2012
[4] Beth L,Linda CB Ergonomicc a workplace,a resource
guide.Accommodation and compliance series.Job Accomodation Network(2010))
[5] Hassan Sadeghi Naeini, Karmegam Karuppiah, Shamsul Bahri Tamrin
and Koustuv Dalal “ Ergonomics in agriculture: An Approach in Prevention of Work-related Musculoskeletal Disorders (WMSDs), Journal of Agriculture and Environmental Sciences, June 2014, Vol. 3, No. 2, pp. 33-51 ISSN: 2334-2404 (Print), 2334-2412 (Online).
[6] .Patrik Polasek “Comparison of Digital Tools for Ergonomics in
Practice” 25th
DAAAM International Symposium on Intelligent Manufacturing and Automation,2014
[7] Sanjog J, Anirban Chowdhury and Sougata Karmakar* ”Industry Specific Applications of DHM” Proceedings of the International Summit on
Human Simulation 2012 [8] A,B Zhang Bing “Using ergonomic digital human modeling in evalution
of workplace design and prevention of occupational hazards onboard fishing Vessel”.
[9] Debkumar Chakrabarti,Manoj Deori, Sangeeta Pandit and Ravi T
“Virtual Ergonomics Laboratory :Human Body Dimension Relevance”,Advanced Engineering Forum Vol 10(2013) PP 22-27
[10] Bubb,H, “Future Applications of DHM in ergonomic
design”Springer,Heidelberg(2007)
ISSN NO: 2454-1958 Special Issue Tech-Ed 2016 (International Conference) Page 119

[11] Lämkull, D., Berlin, C., and Örtengren, R., 2009, Chapter 24 “Digital human modeling: evaluation tools” appears in Handbook of digital human modeling, Duffy, V.G. (ed), CRC Press, Boca Raton (FL), 24.1 - 24.22
[12] Chaffin, D.B. (2001), “Digital Human Modelling for Vehicle and
Workplace Design.” Warrendale, PA, Society of Automotive Engineers. ISBN 0-7680-0687-2
[13] Meulen, P.V.D. and Seidl, A. (2007), “Ramsis – The Leading CAD Tool
for Ergonomic Analysis of Vehicles.” In: V.G. Duffy, ed. Digital Human Modeling. HCII,
[14] Lämkull, D., Örtengren, R. and Malmslöld, L. (2009a), “Digital Human
Modeling Automotive Manufacturing Applications.” In: V.G. Duffy, ed. Handbook of DIGITAL HUMAN MODELING. USA: Taylor and Francis, 42.1 - 42.17.
[15] Mueller, A. and Maier, T., (2011), “Vehicle layout conception
considering trunk loading and unloading.” In: V.G. Duffy, ed. Advances in Applied Digital Human Modeling. USA: Taylor & Francis, 84-93.
[16] Green, R.F. and Hudson, J.A. (2011), “A Method for Positioning digital
Human Models in Airplane Passenger Seats,” In: V.G. Duffy, ed. Advances in Applied Digital Human Modeling, USA: Taylor & Francis, 1-8.
[17] Oudenchuijzen, A.J.K., Zehner, G.F., Hudson, J.A. and Choi, H.J. (2011), “On the Creation of 3D Libraries for F-16 Pilots in their Crew Station: Method Development,Library Creation and Validation,” In: V.G,Duffy, ed. Advances in Applied Digital Human Modeling, USA: Taylor & Francis, 9-18
[18] Karmakar, S., Pal, M.S., Majumdar, Deepti and Majumdar, D. (2012), “Application of digital human modeling and simulation for vision analysis of pilots in a jet aircraft: a case study,” Work, 41, 3412-3418
[19]
Karmakar, S., Majumdar, Deepti., Pal, M. S. and Majumdar, D. (2011), “Ergonomic Study of Ingress-Egress of an Army Vehicle in Simulated Environment.” In: Proceedings of International Conference on Trends in Product Lifecycle, Modeling, Simulation and Synthesis (PLMSS), Bangalore, India, 69-74
[20] Yan, F., Shiqi, L. and Yueqing, B. (2011), “Modeling and Simulation of
Under-Knee amputee Climbing Task.” In: V.G,Duffy, ed. Advances in Applied Digital Human Modeling, USA: Taylor & Francis, 94-101.
[21] Marcos, P., Seitz, T., Bubb, H., Wichert, A. and Feussner, H. (2006), “Computer Simulation for Ergonomic Improvements in Laparoscopic Surgery.” Applied Ergonomics, 37, 251-258.
[22] Sanjog, J., Chowdhury, A. and Karmakar, S. (2012), “Digital Human
Modeling Software in Secondary Manufacturing Sector: A review.” In: Proceedings of International Conference on Recent Trends in Computer Science and Engineering (ICRTCSE-2012), 3-4 May, 2012, Chennai, India.
[23] Santos, J., Sarriegi, J.M., Serrano, N. and Torres, J.M. (2007), “Using
ergonomic software in non-repetitive manufacturing processes: A case study,” International Journal of Industrial Ergonomics, 37, 267-275.
[24] Okimoto, M.L.L.R. (2011), “Digital Human Modeling in Product
Evaluation,” In: W. Karwowski, M.M. Soares, and N.A. Stanton, eds. Human Factors and Ergonomics in Consumer Product Design, New York: Taylor & Francis, 325-331.
[25] Liu, Y.J., Zhang, D.L. and Yuen, M.M.F. (2010), “A survey on CAD
methods in 3D garment design.” Computers in Industry, 61, 576-593. [26] Thaneswer Patel, Sanjog J., Anirban Chowdhury and Sougata Karmakar,
“Applications of DHM in Agricultural Engineering: A Review”
Advanced Engineering Forum Vol. 10 (2013) pp 16-21
ISSN NO: 2454-1958 Special Issue Tech-Ed 2016 (International Conference) Page 120
A
Review on Study of Saw Gin Stand for Improving
the Ginning Process
Nikhil H. Patil Department of Mechanical Engineering
YeshwantraoChavan College of
Egineering Nagpur, MH, India [email protected]
Abstract: Ginning is the first effective process of separating the
seeds from cotton.Harvested cotton is taken to ginning mills where
it is separated from seeds. Cotton fiber quality is mainly dependent
on ginning processes. In India, roller and saw ginning technologies
are used.Nowadays it is necessary to improve these technologies for
increasing the outturn and to preserve the quality of fiber as cotton sector in India is progressing with high speed.In India
comparatively very less research has been done in saw ginning.
This review paper includes the present scenario of ginning
technologies used in India. This article focuses more light on the
saw gin stand component and parameter study which should be
considered during investigation process. . This article suggests the
new possible developments in saw gin stand used in India.
Keywords– Cotton; Ginning; Ginning technologies; saw gin stand.
1. Introduction
Ginning is the first mechanical process involved in the cotton
processing. Ginning mill separates cotton fiber from seeds and
dust particles. The primary function of the ginning mill is to
separate fiber from seed. The main application of ginned
cotton is for spinning operations. The ginned cotton is also
called as lint and the lint is converted to yarn. As fibers are
attached to seed, the harvested cotton can be referred to as
seed cotton. Ginning process mainly removes seeds along
with cleaning of fiber.
According to Roy V. Baker,(ARS-USDA Lubbock Texas), “The principal function of a cotton gin is to convert the
farmers‟ harvested seed cotton into salable commodities, i.e.,
fiber and seed. Thus, ginning is the bridge between cotton
production and cotton textile manufacturing. To satisfactorily
convert today‟s mechanically harvested cotton into salable
commodities, gins have to dry and clean the seed cotton,
separate the fibers from the seed, further clean the fibers and
place the fibers into an acceptable package for commerce.
Sharad S. Chaudhari
Department of Mechanical Engineering YeshwantraoChavan College of
Engineering Nagpur, MH, India [email protected]
Cottonseed are sold to dairies for feed, to oil mills for
production of many valuable products, or saved for planting
next year‟s crop. The fibers are the more valuable product,
however, and the design and operation of cotton gins are
oriented toward fiber production. In essence, the modern
cotton gin enhances the value of the cotton by separating the
fibers from the seed and by removing objectionable non-fiber
matter, while preserving as nearly as possible the inherent
qualities of the fiber.
The earliest gin was probably invented in the days when price
of animal skin in market became so great that it was necessary
to look for a cheaper substitute for clothes. The „charkha‟ is
an early gin. It consists of two plain rollers mounted on a
frame & revolved in contact.
In northern and central region of India the saw gin which Eli
Whitney invented in 1794 is still used to gin cotton. This
cotton gin is a perfect machine invented by the inventor. Very
little evolution has been done to change its three essential
elements, the saws, ribs and brush. There is no any machine
invented till today which can excel saw gin in capacity. It was
found that fibers of cotton were injured by saw action then the
McCarthy roller gin was introduced.
2 Present Scenario:
2.1 Ginning technologies
In olden days, the charkha was used for cotton ginning
process. Then it was upgraded to single crank charkha
consisted of one serrated steel roller and one wooden roller
along with crank and flywheel. With the development of roller
and saw gin, history of cotton ginning changed completely.
Basically there are two methods employed for cotton ginning
process. In first the fibers are held firmly by external
mechanism and simultaneously seed itself is being hit to
separate fibers from seed. In second fibers are pulled from
ISSN NO: 2454-1958 Special Issue Tech-Ed 2016 (International Conference) Page 121
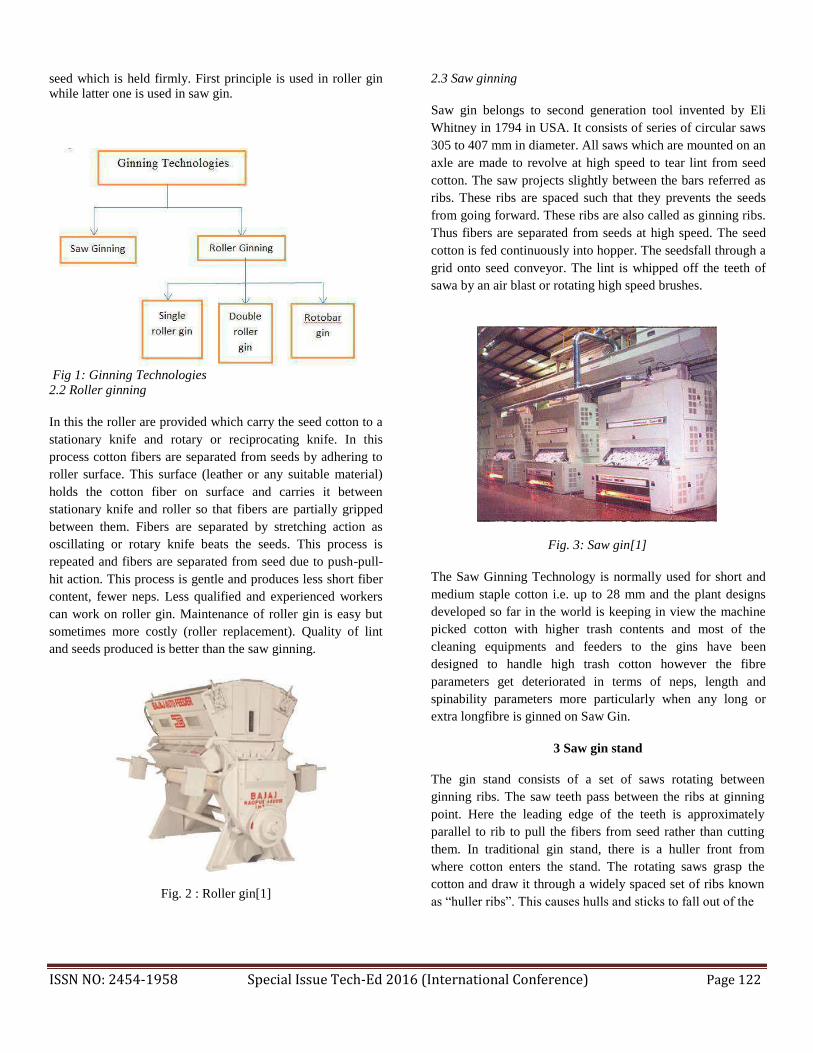
seed which is held firmly. First principle is used in roller gin while latter one is used in saw gin. Fig 1: Ginning Technologies
2.2 Roller ginning
In this the roller are provided which carry the seed cotton to a
stationary knife and rotary or reciprocating knife. In this
process cotton fibers are separated from seeds by adhering to
roller surface. This surface (leather or any suitable material)
holds the cotton fiber on surface and carries it between
stationary knife and roller so that fibers are partially gripped
between them. Fibers are separated by stretching action as
oscillating or rotary knife beats the seeds. This process is
repeated and fibers are separated from seed due to push-pull-
hit action. This process is gentle and produces less short fiber
content, fewer neps. Less qualified and experienced workers
can work on roller gin. Maintenance of roller gin is easy but
sometimes more costly (roller replacement). Quality of lint
and seeds produced is better than the saw ginning.
Fig. 2 : Roller gin[1]
2.3 Saw ginning
Saw gin belongs to second generation tool invented by Eli
Whitney in 1794 in USA. It consists of series of circular saws
305 to 407 mm in diameter. All saws which are mounted on an
axle are made to revolve at high speed to tear lint from seed
cotton. The saw projects slightly between the bars referred as
ribs. These ribs are spaced such that they prevents the seeds
from going forward. These ribs are also called as ginning ribs.
Thus fibers are separated from seeds at high speed. The seed
cotton is fed continuously into hopper. The seedsfall through a
grid onto seed conveyor. The lint is whipped off the teeth of
sawa by an air blast or rotating high speed brushes.
Fig. 3: Saw gin[1]
The Saw Ginning Technology is normally used for short and
medium staple cotton i.e. up to 28 mm and the plant designs
developed so far in the world is keeping in view the machine
picked cotton with higher trash contents and most of the
cleaning equipments and feeders to the gins have been
designed to handle high trash cotton however the fibre
parameters get deteriorated in terms of neps, length and
spinability parameters more particularly when any long or
extra longfibre is ginned on Saw Gin.
3 Saw gin stand
The gin stand consists of a set of saws rotating between
ginning ribs. The saw teeth pass between the ribs at ginning
point. Here the leading edge of the teeth is approximately
parallel to rib to pull the fibers from seed rather than cutting
them. In traditional gin stand, there is a huller front from
where cotton enters the stand. The rotating saws grasp the
cotton and draw it through a widely spaced set of ribs known
as “huller ribs”. This causes hulls and sticks to fall out of the
ISSN NO: 2454-1958 Special Issue Tech-Ed 2016 (International Conference) Page 122
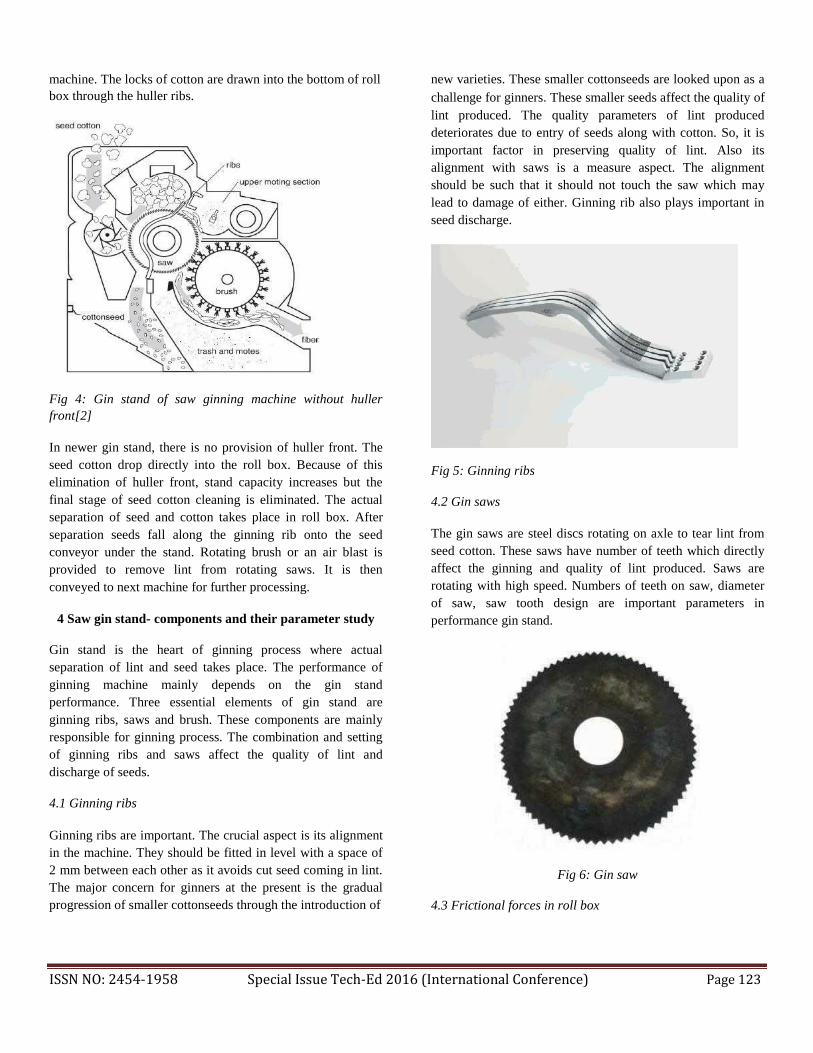
machine. The locks of cotton are drawn into the bottom of roll
box through the huller ribs.
new varieties. These smaller cottonseeds are looked upon as a
challenge for ginners. These smaller seeds affect the quality of
lint produced. The quality parameters of lint produced
deteriorates due to entry of seeds along with cotton. So, it is
important factor in preserving quality of lint. Also its
alignment with saws is a measure aspect. The alignment
should be such that it should not touch the saw which may
lead to damage of either. Ginning rib also plays important in
seed discharge.
Fig 4: Gin stand of saw ginning machine without huller
front[2]
In newer gin stand, there is no provision of huller front. The
seed cotton drop directly into the roll box. Because of this
elimination of huller front, stand capacity increases but the
final stage of seed cotton cleaning is eliminated. The actual
separation of seed and cotton takes place in roll box. After
separation seeds fall along the ginning rib onto the seed
conveyor under the stand. Rotating brush or an air blast is
provided to remove lint from rotating saws. It is then
conveyed to next machine for further processing.
4 Saw gin stand- components and their parameter study
Gin stand is the heart of ginning process where actual
separation of lint and seed takes place. The performance of
ginning machine mainly depends on the gin stand
performance. Three essential elements of gin stand are
ginning ribs, saws and brush. These components are mainly
responsible for ginning process. The combination and setting
of ginning ribs and saws affect the quality of lint and
discharge of seeds.
4.1 Ginning ribs
Ginning ribs are important. The crucial aspect is its alignment
in the machine. They should be fitted in level with a space of
2 mm between each other as it avoids cut seed coming in lint.
The major concern for ginners at the present is the gradual
progression of smaller cottonseeds through the introduction of
Fig 5: Ginning ribs
4.2 Gin saws
The gin saws are steel discs rotating on axle to tear lint from
seed cotton. These saws have number of teeth which directly
affect the ginning and quality of lint produced. Saws are
rotating with high speed. Numbers of teeth on saw, diameter
of saw, saw tooth design are important parameters in
performance gin stand.
Fig 6: Gin saw
4.3 Frictional forces in roll box
ISSN NO: 2454-1958 Special Issue Tech-Ed 2016 (International Conference) Page 123
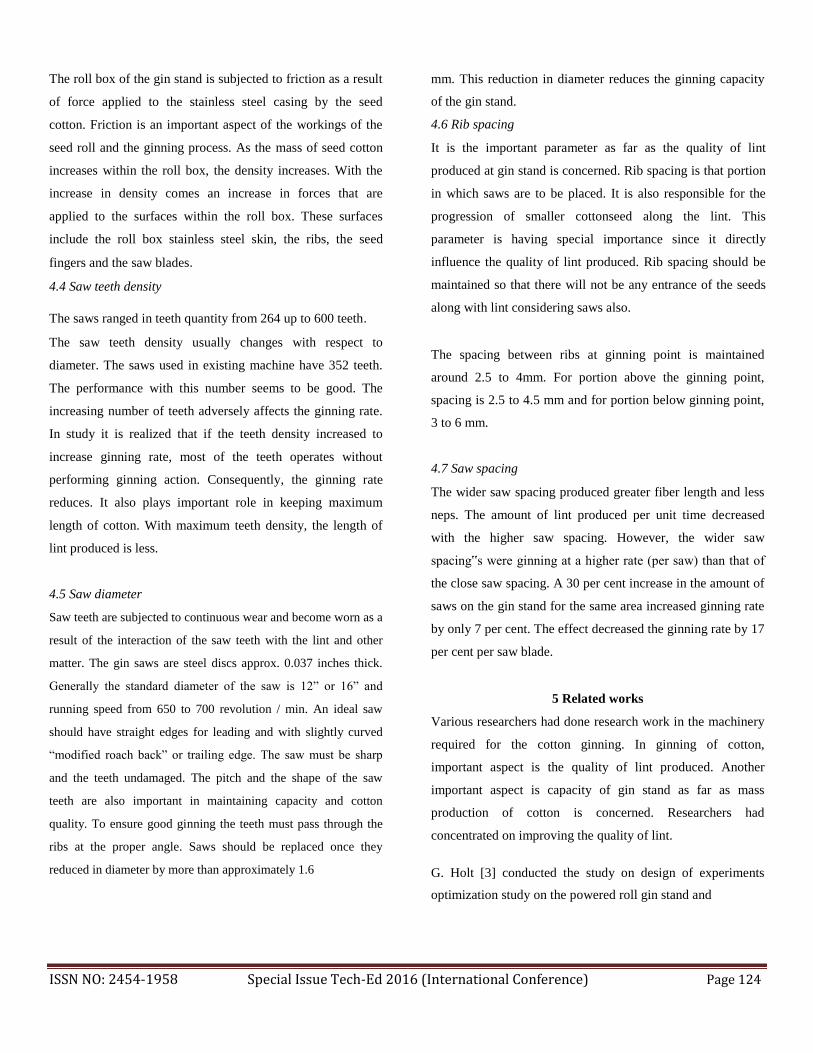
The roll box of the gin stand is subjected to friction as a result
of force applied to the stainless steel casing by the seed
cotton. Friction is an important aspect of the workings of the
seed roll and the ginning process. As the mass of seed cotton
increases within the roll box, the density increases. With the
increase in density comes an increase in forces that are
applied to the surfaces within the roll box. These surfaces
include the roll box stainless steel skin, the ribs, the seed
fingers and the saw blades. 4.4 Saw teeth density
The saws ranged in teeth quantity from 264 up to 600 teeth. The saw teeth density usually changes with respect to
diameter. The saws used in existing machine have 352 teeth.
The performance with this number seems to be good. The
increasing number of teeth adversely affects the ginning rate.
In study it is realized that if the teeth density increased to
increase ginning rate, most of the teeth operates without
performing ginning action. Consequently, the ginning rate
reduces. It also plays important role in keeping maximum
length of cotton. With maximum teeth density, the length of
lint produced is less.
4.5 Saw diameter Saw teeth are subjected to continuous wear and become worn as a
result of the interaction of the saw teeth with the lint and other
matter. The gin saws are steel discs approx. 0.037 inches thick.
Generally the standard diameter of the saw is 12” or 16” and
running speed from 650 to 700 revolution / min. An ideal saw
should have straight edges for leading and with slightly curved
“modified roach back” or trailing edge. The saw must be sharp
and the teeth undamaged. The pitch and the shape of the saw
teeth are also important in maintaining capacity and cotton
quality. To ensure good ginning the teeth must pass through the
ribs at the proper angle. Saws should be replaced once they
reduced in diameter by more than approximately 1.6
mm. This reduction in diameter reduces the ginning capacity
of the gin stand. 4.6 Rib spacing It is the important parameter as far as the quality of lint
produced at gin stand is concerned. Rib spacing is that portion
in which saws are to be placed. It is also responsible for the
progression of smaller cottonseed along the lint. This
parameter is having special importance since it directly
influence the quality of lint produced. Rib spacing should be
maintained so that there will not be any entrance of the seeds
along with lint considering saws also.
The spacing between ribs at ginning point is maintained
around 2.5 to 4mm. For portion above the ginning point,
spacing is 2.5 to 4.5 mm and for portion below ginning point,
3 to 6 mm.
4.7 Saw spacing The wider saw spacing produced greater fiber length and less
neps. The amount of lint produced per unit time decreased
with the higher saw spacing. However, the wider saw
spacing‟s were ginning at a higher rate (per saw) than that of
the close saw spacing. A 30 per cent increase in the amount of
saws on the gin stand for the same area increased ginning rate
by only 7 per cent. The effect decreased the ginning rate by 17
per cent per saw blade.
5 Related works Various researchers had done research work in the machinery
required for the cotton ginning. In ginning of cotton,
important aspect is the quality of lint produced. Another
important aspect is capacity of gin stand as far as mass
production of cotton is concerned. Researchers had
concentrated on improving the quality of lint.
G. Holt [3] conducted the study on design of experiments
optimization study on the powered roll gin stand and
ISSN NO: 2454-1958 Special Issue Tech-Ed 2016 (International Conference) Page 124

presented results of an optimization study concentrating three
main components of the power roll gin stand that is paddle
roll, seed finger roll, and gin saw.The results were based on
lint samples taken after the gin stand (before lint cleaning) and
after one stage of lint cleaning, seed samples, and
performance data. E. Koc [4] conducted theoretical study to investigate the
performance of a saw-gin ginning machine with special
reference to separator units. A theoretical model of separator
unit was developed by introducing the non-dimensional
parameters defining the mechanical operating conditions and
also designed the procedure to estimate cotton flow rate and
cotton loss. Flow rate estimation results were obtained. N. Soomro [5] examined that rough ginning is often caused by
dense seed rolls, also found that dense seed rolls come from
feeding cotton to the gins beyond the capacity which occur
damage to cotton at gins has incorrectly been credited to the
speed of the gin saws, rather than to the rate of feeding. AzizovShuhratMamatovich [6] carried out mathematical
simulation of brush drums in a dual saw cylinder chamber gin
for the purpose of increasing the quantity of captured cotton
fiber from saw. An analysis of the efficiency of the ginning of
cotton fibers with two saw cylinders carried out and it was
found that, in comparison to a one-cylinder machine, the 2
cylinder approach can help to preserve the natural
characteristics of cotton fiber and seeds.This technology
allowed economizing electricity and decreasing damage to
fiber and also increased the productivity of the machine. W. Stanley Anthony [7] reviewed and compiled most of the
significant developments and research conducted on saw gin
stands for cotton gins since about 1958. Also described the
design and operation of various types and models of saw gin
stands, and had given an appraisal of gin stand designs and
settings that may be most useful at current cotton gins. M. Pelletier [8] conducted research work to evaluate the
influence of grid bar cross sectional geometry on extractor
performance with regard to foreign matter removal, seed
cotton loss, and fiber quality preservation. The results
indicated that as open space between grid bars increased,
foreign matter removal and seed cotton loss increased. S. Azizov [9] carried out analysis of the strength of the saws
to the dynamic and static loads and found that saw wear-out
occurs due to the bending of the shaft under dynamic loads
and also observed that the high density of raw cotton leads
higher damage to fibers during ginning. Hughes [10] developed a simple plastic guide that was
attached to the gin ribs, yet wider than the gin ribs and
resultantly, much closer to the saw surface than a gin rib. The
guide restricts the gin saw gap from increasing as a result of
seeds flexing the saw blade to an extent that seed was able to
pass through the gap between the saw blade and the rib.
6 Objectives of study The study of gin stand of 161 saw gin is required to achieve
following objectives
• To improve overall performance of 161 saw gin
stand.
• To improve the quality of lint produced.
• To analyze all working parts.
• To make necessary modifications in existing
machine.
• To increase the capacity of gin stand.
• To achieve better seed discharge from gin stand.
7 Possible modifications to gin stand
As far as performance of gin stand is concerned, saws and
ginning ribs are two significant parts. These two parts
contributes more to the gin stand performance. Saws separate
the seed from cotton and ginning ribs prevent the entry of
seeds along with lint produced.
ISSN NO: 2454-1958 Special Issue Tech-Ed 2016 (International Conference) Page 125
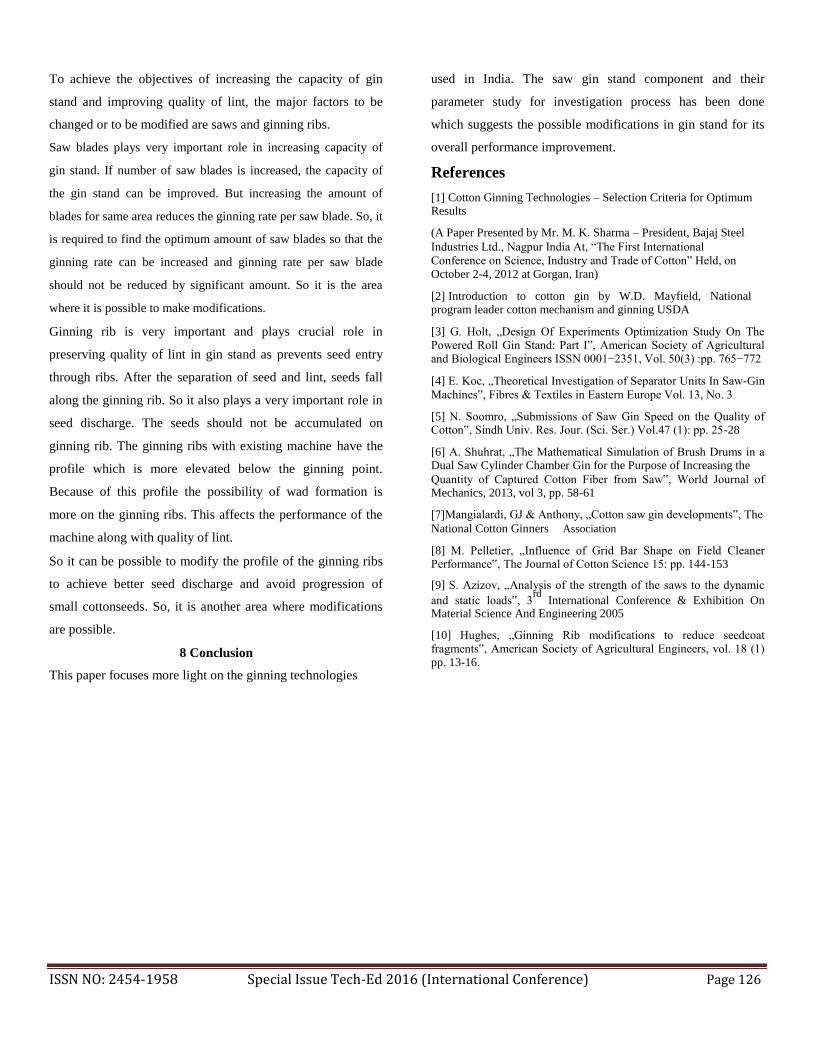
To achieve the objectives of increasing the capacity of gin
stand and improving quality of lint, the major factors to be
changed or to be modified are saws and ginning ribs. Saw blades plays very important role in increasing capacity of
gin stand. If number of saw blades is increased, the capacity of
the gin stand can be improved. But increasing the amount of
blades for same area reduces the ginning rate per saw blade. So, it
is required to find the optimum amount of saw blades so that the
ginning rate can be increased and ginning rate per saw blade
should not be reduced by significant amount. So it is the area
where it is possible to make modifications. Ginning rib is very important and plays crucial role in
preserving quality of lint in gin stand as prevents seed entry
through ribs. After the separation of seed and lint, seeds fall
along the ginning rib. So it also plays a very important role in
seed discharge. The seeds should not be accumulated on
ginning rib. The ginning ribs with existing machine have the
profile which is more elevated below the ginning point.
Because of this profile the possibility of wad formation is
more on the ginning ribs. This affects the performance of the
machine along with quality of lint. So it can be possible to modify the profile of the ginning ribs
to achieve better seed discharge and avoid progression of
small cottonseeds. So, it is another area where modifications
are possible.
8 Conclusion This paper focuses more light on the ginning technologies
used in India. The saw gin stand component and their
parameter study for investigation process has been done
which suggests the possible modifications in gin stand for its
overall performance improvement. References [1] Cotton Ginning Technologies – Selection Criteria for Optimum Results (A Paper Presented by Mr. M. K. Sharma – President, Bajaj Steel Industries Ltd., Nagpur India At, “The First International
Conference on Science, Industry and Trade of Cotton” Held, on October 2-4, 2012 at Gorgan, Iran) [2] Introduction to cotton gin by W.D. Mayfield, National program leader cotton mechanism and ginning USDA [3] G. Holt, „Design Of Experiments Optimization Study On The Powered Roll Gin Stand: Part I‟, American Society of Agricultural and Biological Engineers ISSN 0001−2351, Vol. 50(3) :pp. 765−772 [4] E. Koc, „Theoretical Investigation of Separator Units In Saw-Gin
Machines‟, Fibres & Textiles in Eastern Europe Vol. 13, No. 3 [5] N. Soomro, „Submissions of Saw Gin Speed on the Quality of Cotton‟, Sindh Univ. Res. Jour. (Sci. Ser.) Vol.47 (1): pp. 25-28 [6] A. Shuhrat, „The Mathematical Simulation of Brush Drums in a Dual Saw Cylinder Chamber Gin for the Purpose of Increasing the Quantity of Captured Cotton Fiber from Saw‟, World Journal of Mechanics, 2013, vol 3, pp. 58-61 [7]Mangialardi, GJ & Anthony, „Cotton saw gin developments‟, The National Cotton Ginners Association [8] M. Pelletier, „Influence of Grid Bar Shape on Field Cleaner Performance‟, The Journal of Cotton Science 15: pp. 144-153 [9] S. Azizov, „Analysis of the strength of the saws to the dynamic
and static loads‟, 3rd
International Conference & Exhibition On Material Science And Engineering 2005 [10] Hughes, „Ginning Rib modifications to reduce seedcoat fragments‟, American Society of Agricultural Engineers, vol. 18 (1) pp. 13-16.
ISSN NO: 2454-1958 Special Issue Tech-Ed 2016 (International Conference) Page 126
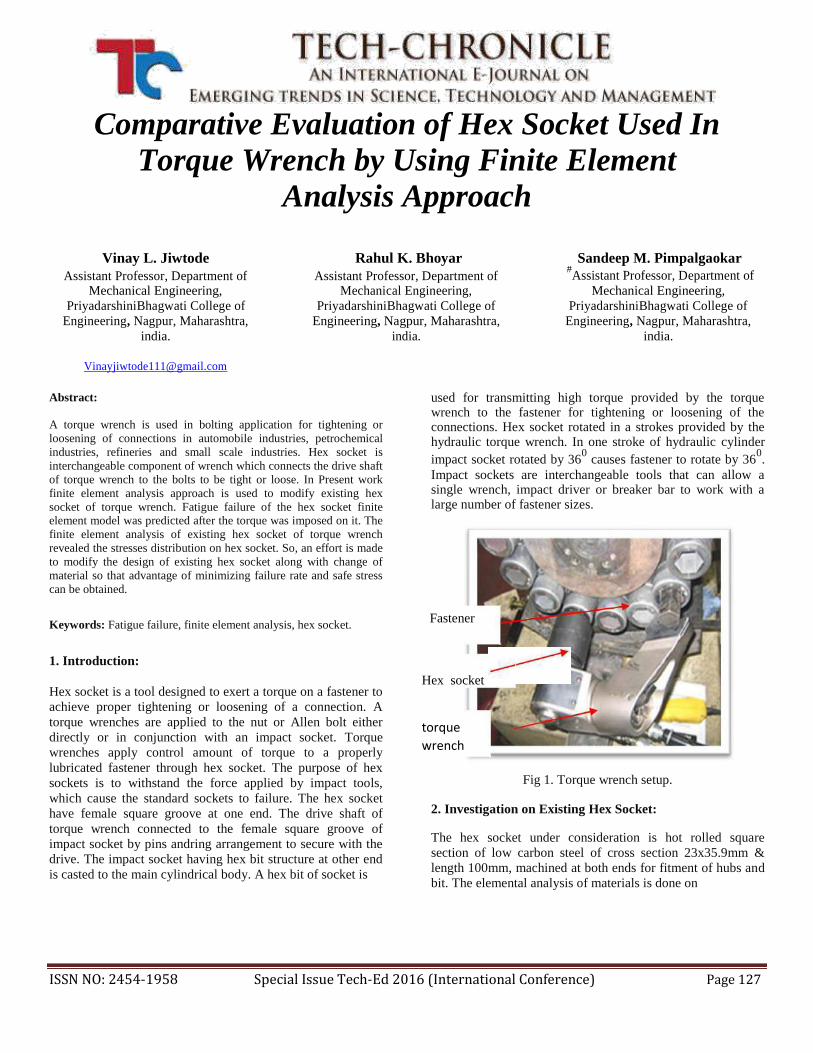
Comparative Evaluation of Hex Socket Used In
Torque Wrench by Using Finite Element
Analysis Approach
Vinay L. Jiwtode Rahul K. Bhoyar Sandeep M. Pimpalgaokar
Assistant Professor, Department of Assistant Professor, Department of #Assistant Professor, Department of
Mechanical Engineering, Mechanical Engineering, Mechanical Engineering,
PriyadarshiniBhagwati College of PriyadarshiniBhagwati College of PriyadarshiniBhagwati College of
Engineering, Nagpur, Maharashtra, Engineering, Nagpur, Maharashtra, Engineering, Nagpur, Maharashtra,
india. india. india.
[email protected] Abstract:
A torque wrench is used in bolting application for tightening or
loosening of connections in automobile industries, petrochemical
industries, refineries and small scale industries. Hex socket is
interchangeable component of wrench which connects the drive shaft
of torque wrench to the bolts to be tight or loose. In Present work
finite element analysis approach is used to modify existing hex
socket of torque wrench. Fatigue failure of the hex socket finite element model was predicted after the torque was imposed on it. The
finite element analysis of existing hex socket of torque wrench
revealed the stresses distribution on hex socket. So, an effort is made
to modify the design of existing hex socket along with change of
material so that advantage of minimizing failure rate and safe stress
can be obtained.
Keywords: Fatigue failure, finite element analysis, hex socket.
1. Introduction:
Hex socket is a tool designed to exert a torque on a fastener to
achieve proper tightening or loosening of a connection. A
torque wrenches are applied to the nut or Allen bolt either
directly or in conjunction with an impact socket. Torque
wrenches apply control amount of torque to a properly
lubricated fastener through hex socket. The purpose of hex
sockets is to withstand the force applied by impact tools,
which cause the standard sockets to failure. The hex socket
have female square groove at one end. The drive shaft of
torque wrench connected to the female square groove of
impact socket by pins andring arrangement to secure with the
drive. The impact socket having hex bit structure at other end
is casted to the main cylindrical body. A hex bit of socket is
used for transmitting high torque provided by the torque wrench to the fastener for tightening or loosening of the connections. Hex socket rotated in a strokes provided by the hydraulic torque wrench. In one stroke of hydraulic cylinder
impact socket rotated by 360 causes fastener to rotate by 36
0.
Impact sockets are interchangeable tools that can allow a single wrench, impact driver or breaker bar to work with a large number of fastener sizes.
Fastener
Hex socket torque
wrench
Fig 1. Torque wrench setup.
2. Investigation on Existing Hex Socket:
The hex socket under consideration is hot rolled square
section of low carbon steel of cross section 23x35.9mm &
length 100mm, machined at both ends for fitment of hubs and
bit. The elemental analysis of materials is done on
ISSN NO: 2454-1958 Special Issue Tech-Ed 2016 (International Conference) Page 127

spectrometer and as per the component wt % found; steel
belongs to SAE9840 standard of steel, as shown in Table 1,
having typical microstructure as shown in fig 2 with around
25% of pearlite (black) & 75% of ferrite matrix (white).
Table. No. 1 Chemical composition of the failed hex
socket and SAE 9840
Element Failed hex socket SAE 9840
C% 0.392 0.38-0.43
Si% 0.290 0.2-0.32
Mn% 0.690 0.7-0.9
Ni% 1.207 0.85-1.15
Cr% 0.856 0.7-0.9
Mo% 0.224 0.2-0.3
S% 0.018 0.04 MAX
P% 0.019 0.04 MAX
Fig 2. Typical microstructure of low carbon steel (SAE9840)
Visual examination of the failure hex socket revealed that the
fracture had been initiated close to the hex bit, at the bit from
where the corners starts for fitting of hub. This fracture
location is to be expected because fatigue failures start at the
most vulnerable point in a dynamically stressed area
particularly where there is a stress raiser, as in our case sharp
corners to facilitate proper sitting of bearing locking ring as
shown in fig 3. The highest stress concentration and high
residual stress would be anticipated to occur in this region.
The fracture surface of the failed hex socket exhibits stress
concentration regions as shown in fig3, where crack initiation
starts, progressive flat fatigue fracture regions, and the final
fracture region produced by overload as shown in fig 3. The fracture appeared to be typical of unidirectional bending
fatigue under conditions of a low stress with a high stress
concentration. From the above observations, it is clear that
fatigue cracks have initiated at stress concentration points
leading to fracturing of the axle shaft. When the local stress
exceeds the material yield strength, it is possible to form a
fatigue crack. Since the resistance of steel to fatigue initiation in proportional to its yield strength, the low properties of the
steel in this case left it open to fatigue initiation [2][7].
The area of final fracture due to overload is large, approximately 40% of total area, indicating that the material is also not adequate for the applied stresses.
Fig 3 Failure of Hex socket at the hex bit
2.1 Building Finite Element Model of Existing Hex socket:
For the FE Analysis, it is necessary to create a solid model of
hex socket and also to create a FE model. In the present work,
static analysis has been carried out for the hex socket
considering sudden load effects. As shown in figure 4, PRO-E
is used for modeling the Hex socket. The model has a solid
hex socket of square cross sectional area of 23mmX35.9mm,
machined at both ends with length 100 mm. using the
technical specification of impact socket the FE analysis has
been carried out in ANSYS 12.0. A higher order 3-D, 10-node
element having three degree of freedom at each node,
translations in the nodal x, y and z directions SOLID187 were
used. In this analysis, the moment of 4500 Nm is applied at
the end of impact socket and remote displacement is given in
y-direction. The boundary condition and FE results in Ansys
for moment and remote displacement at static and dynamic are
as below. Mesh model: Number of nodes- 22312
Number of element-12853
Type of element-Tetrahedral (SOLID187)
ISSN NO: 2454-1958 Special Issue Tech-Ed 2016 (International Conference) Page 128

Behavior of element-DOF-3
Fig. 4 Mesh model of impact socket and fastener assembly.
Fig. 5 Shear stress distribution in assembly.
Fig. 6 Shear stress distribution in impact socket
Fig. 7 Equivalent Von- Mises stress distribution on impact socket
2.2 Finite Element Analysis and Results:
Structural analysis revealed that the failed impact socket
material is SAE 9840 alloy steel. Stress analysis performed by
Ansys 12.0 software show that maximum stresses generated at
corner of male hex of impact socket. This indicates that wear
failure initiate at that area. The component to be preventing
wear failure, maximum shear stresses should be less than
allowable stress of material. In this case it is greater than the
allowable shear stress of material. For static loading maximum
shear stress 659.43 MPa is develop which exceeding the
allowable stress of 552.5 MPa. Equivalent (von-mises) stress
is 1142.8 MPa which is also exceeding the allowable
equivalent (von-mises) stress of 1105 MPa. This results in
shear failure of impact socket. The failure of the impact socket
is taking place at the corner of male hex.
3. Modifications Suggested In Existing Hex socket:
From the investigation of material & FE analysis it is seen that
tensile stress concentrated regions are at transition area of hex
bit in hub mountings due to sharp corner at the start of torque
to facilitate proper tightening causing slippage of joint due to
clearance results into stress concentration area.Modification of
existing hex socket is done aiming to avoid this stress
concentration region which is possible ifexisting rear axle is
manufactured with casting process with close tolerances and
subsequently finished by machining operations atboth ends for
fitment of hub, as it is done in this work. The design
flexibility offered by the casting process farexceeds that of
any other process used for the production of engineering
components. This flexibility enables thedesign engineer to
match the design of the component to its function. Metal can
be placed where it is required tooptimize the load carrying
capacity of the part. Changes in cross-section can be
streamlined to reduce stress concentrations.
3.1 Selection of Material:
EN 31 contains nodular graphite (black) in a matrix of ferrite
(white) with small amounts of pearlite(black). The ferritic
structure gives excellent machinability with good surface
finishes along with optimal impact strengths, fatigue
properties. Ferritic/Pearlitic matrix obtained as cast. Having
good machinability, excellent surface finish and very good
strength. They present ultimate tensile strength and yield
strength which is close to SAE 9840 steel grades. This grade
is good for applications such as machine components that
suffer impact and are crack-resistance. Table 2 showing the
typical chemical composition of class EN31.
Table No. 2chemical composition of EN31
Element EN 31
ISSN NO: 2454-1958 Special Issue Tech-Ed 2016 (International Conference) Page 129

C% 0.9-1.20
Si% 0.1-0.35
Mn% 0.3-0.75
Ni% 0.85-1.15
Cr% 0.1-1.6
Mo% 0.2-0.3
S% 0.04 MAX
P% 0.04 MAX
4. Finite Element Analysis of Modified Hex socket: EN31 material is used for the redesign purpose. The material
properties have been collected. The different materials of hex
socket have been selected and calculate the value of maximum
shear stress and equivalent stress. Analysis of different
materials has done with the help of ANSYS 12.0. EN31 is a
high carbon Alloy steel which achieves a high degree of
hardness with compressive strength and abrasion resistance.
The mechanical properties of material are as fallow:
Table No. 3 Mechanical properties of EN31
Properties Value Unit
Ultimate tensile strength 750 MPa
Ultimate yield strength 900 MPa
Poisson’s ration 0.28 -
Young’s modulus 215 GPa
Density 7810 kg/m3
Hardness 63 HRC
Fig 7 Maximum shear stress in EN31
Fig 8 Equivalent stress in EN31
5. Comparative Evaluation: Any comparison of material/process combinations must be justified with the results of the materials & process under consideration. Table 4 shows the comparison of result with both the cases.
Table No 4: Comparative Evaluation.
Stresses SAE 9840 EN 31
Maximum shear stress (MPa) 526.25 452.64
Allowable maximum shear stress 592.5 450
(MPa)
Equivalent stress (MPa) 911.75 784.04
Allowable equivalent stress (MPa) 1185 900
From table 4, it has been found that, maximum stress present
in existing hex socket is 526.25Mpa which is more than
thetensile yield strength of material. Whereas maximum stress
present in modified hex socket is452.64 which is much
lessthan the tensile yield strength of its material. We therefore
conclude that the torque wrench having modified hex socket
will defiantly work satisfactorily under this stress level
without fatigue initiation.
Conclusion: This study was conducted on a existing Hex socketused in
torque wrench. Spectrum analysis revealed that the failed hex
socket material is SAE 9840 steel. Fractographic features
indicated that fatigue was the main cause of failure of the hex
socket. It was observed that the fatigue cracks originated from
transition areas due to sharp corners. Modified hex socket
produced with casting process with the use of EN31
material.This ultimately solves the problem of initiation of
fatigue cracks in this area.An application including both
redesigning of the hex socket transition area and change of
material i.e. suitable for casting of hex socket which may be a
ISSN NO: 2454-1958 Special Issue Tech-Ed 2016 (International Conference) Page 130

good alternative to enhance the fatigue life and can satisfy minimum design criteria.
References:
1. I. Lopatukhin and A. Ber, “Accuracy and Strength of a Joint Loaded by Suddenly Applied Torque”, The International Journal of advance manufacturing technology, 13, pp 692-695, 1997.
2. James J. Scutti, Massachusetts Materials Research, Inc.; William J. McBrine, ALTRAN Corporation, “Introduction to Failure Analysis and Prevention”, ASM International. 3. Herng-Shuoh Jang, Sheng-Leh Liang, So-Ter Chen, “Development of Screwdriver Bit Steel with High Hardness and Torque Value”, China Steel Technical Report, No. 22, pp 1-6, 2009
4. Jonquil R. Flowers B.S., Matthew B. McCullough, “Comparison of StressDistribution Patterns Within Trigonal, Quadradle, And Hexagonal Screw Drive Designs of An Acl Interference Screw Using Finite Element Analysis”, North Carolina A&T State University,
Greensboro, NC, USA.
5. M.E. Stevenson, J.L. McDougall, K.G. Clin, “Metallurgical Failure Analysis of Titanium Wing Attachment Bolts”, Practical Failure Analysis, Volume 3(4), ASM International, August 2003.
6. Kenneth R. Milligan, Terry Taylor ,Wane Snyder, “Reinforced Impact socket”, US Patent 7,841,261 B2, OH (Us),2010.
7. Rolf Gunter Rosenhan, “Screwdriver, Screwdriver bit or the like”, Us Patent 5,953,969, Germany, 1999.
8. Bill Thomas Brazil, “Non-marring Tool”, US Patent 2005/0022631 A1, Pennington, NJ(Us), 2005.
9. M. Zamanzadeh, E. Larkin and D. Gibbon, “A Re-Examination of Failure Analysis and Root Cause Determination”, Gibbon Matco Associates, Pittsburgh, Pennsylvania, December 2004.
10. “Chemical Composition of Structural Steels”, Design of Steel Structures MIT Department of Civil and Environmental Engineering Spring Semester, 1999. 11. Avner Sidney H., Introduction to Physical metallurgy, New York, Tata
McGraw-Hill, 1997.
ISSN NO: 2454-1958 Special Issue Tech-Ed 2016 (International Conference) Page 131

DESIGN, ANALYSIS AND OPTIMIZATION OF
AUTOMOBILE TRAILER USING FEA
Salman Khan Third Sem, M.Tech./M.E (CAD/CAM)
Abstract The portable toilets are mounted on the trailer, this trailer is
manufactured by a company (ExcellFibrotech, MIDC Nagpur).
Many of new product designs are based on existing products and
years of experience. Therefore, the trailer is assumed to have
unexplored areas of potential improvements. Today the trailer is
a mainly welded design, which is both expensive and
unsatisfactory from a maintainability viewpoint. Welding is not
only expensive but introduces heat to the steel alloy, and thereby
changes the material properties, and also requires a high degree
of manual labor. A truck chassis has a more standardized
manufacturing method and application of some of the
manufacturing techniques from it to the trailer could perhaps
make the production of it more efficient. The current trailer have
robust designs, and there have been no actual calculations or
investigation to find out what dimensions are needed to
withstand the forces applied to a trailer during use. Instead, the
design is based on experience of what works, and what does not.
A more thorough investigation of the design parameters can
create better understanding of which parts of the trailer that are
most exposed to high stresses, and which parts that can have
reduced dimensions.
Keywords:trailer, truck chassis. I. INTRODUCTION Portable toilets, are simple portable enclosures containing a
chemical toilet (a toilet bowl filled with disinfectant instead of
water) which are typically used as a temporary toilet for
construction sites or large gatherings because of their
durability and convenience. Most portable toilets have black
open-front U-shaped toilet seats with a cover. They are often
constructed out of lightweight molded plastic. Mounted on purpose built trailers, these standard toilets
provide a convenient and cost effective option to satisfy all
requirements. The trailer gives the added benefit and cost
saving choice of being able to pick up the unit yourself, plus
you can maneuver between locations at your own
convenience. The efforts required where car is moving are comparatively
less with stationary car. The working strength of the tie rod is
that of the product of the allowable working stress and the
minimum cross-sectional area.
II. LITERATURE REVIEW L.A.W. Horn, HAN University of Applied Sciences[1] During
the previous HVTT conference in Melbourne, results have
been presented of a project FORWARD, including eleven
different trailer manufacturers, involving testing and modeling
activities to establish a practical basis for realistic fatigue
assessment as a step towards an improved light-weight trailer
design. The present paper describes the next step as part of the
follow-up project LIFE (Lifetime Fatigue Enhancement),
starting with the model-based assessment of a realistic loading
history for a semi-trailer. Representative loading conditions in
this history, being derived from three weeks of field testing,
are then used in Finite Element analyses to estimate fatigue
life at a critical high loaded welded connection in the
aluminum trailer chassis. Results are discussed with respect to
the order of different loading cycles (Palmgren-Miner
number, based on fatigue tests), 3D loading at the weld, the
varying weld quality, and the impact of bonded connections in
the trailer. These „lessons learned‟ are interpreted, to result in
improved general guidelines in light-weight. AslıSoytürk, HüseyinYıldırım, VolkanAkıncı[2]Semi–trailers are manufactured in long body design and aimed for heavy
ISSN NO: 2454-1958 Special Issue Tech-Ed 2016 (International Conference) Page 132

load transportations. As so, torsion stiffness in these vehicles
is the key element in a design which provides light chassis
weight, while obtaining high performance, high load carrying
capacity, driving securely and stable road holding. In this
study, torsional stiffness of semitrailer chassis was analyzed
by finite element method, fundamental static rules, also
experimental datas were used for calculations and all results
were compared with respect to each other. Fundamental static
calculations for torsional stiffness were performed per
guidelines of rigid body mechanics and vehicle dynamics
having some assumptions. In the finite element method, the
semi-trailer chassis was modelled in CATIA software and
stiffness was calculated in mesh form in ANSYS Workbench 14.5. In experimental studies, chassis frames‟ torsional
stiffness test method was used. Torsional stiffness was
calculated by obtaining applied force, strain and torsion angle.
These results show that both methods are convenient and
confident in calculations of torsion stiffness and can be used
in designs for succeeding light and robust trailer chassis goal. Mr. Venukumar R Bankapur1, Prof. Sanjeev. A. Janawade[3]
Tractor trailers are agricultural products transporting vehicle,
this vehicle used to transport agricultural products from one
place to other place. Therefore, it is essential to do static
fatigue analysis of trailer chassis. Based on analysis the life
estimation of trailer chassis can be done. In this project work,
the trailer chassis model has been designed using 3D
modeling software CATIA. The designed 3D model is
imported into FEA software Ansys. On imported 3D model
the pre-processed, postprocessed and solving are performed in
FEA software Ansys Meshing model with different element
size are performed in pre-processing on imported 3D model,
in next stage, the boundary condition on meshed model are
applied. In last stage, solving for different loading with varied
element size is performed. For 3 different fatigue theories,
those three different fatigue theories are Goodman, Gerber
and Soderberg, the analysis results are obtained for 3 different
load scenarios with varied element size. 3 different loads are
consider in this project are, 6Tonne, 12 Tonne and 18 Tonne.
Analysis results have demonstrated that the chassis has 106
cycles of life time for 12 Tonne of loading without fatigue
failure. It is observed that there is a fatigue failure for 18
Tonne loading. The convergence method is used to verify the
accuracy of analysis results for element size: 15 mm, 10mm
and 5 mm. The summary of this project work is analysis
results are approximate to convergence method and the
chassis has lifetime of 106 cycles for 12 Tonne load without
fatigue failure.
III. IDENTIFIED GAPS IN THE LITERATURE
The portable toilets are mounted on the trailer, this trailer is
manufactured by a company (ExcellFibrotech, MIDC
Nagpur). Many of new product designs are based on existing
products and years of experience. Therefore, the trailer is
assumed to have unexplored areas of potential improvements. IV. PROBLEM FORMULATION The portable toilets are mounted on the trailer; this trailer is
manufactured by a company (ExcellFibrotech, MIDC
Nagpur). Many of new product designs are based on existing
products and years of experience. Therefore, the trailer is
assumed to have unexplored areas of potential improvements.
Today the trailer is a mainly welded design, which is both
expensive and unsatisfactory from a maintainability
viewpoint. Welding is not only expensive but introduces heat
to the steel alloy, and thereby changes the material properties,
and also requires a high degree of manual labor. A truck
chassis has a more standardized manufacturing method and
application of some of the manufacturing techniques from it to
the trailer could perhaps make the production of it more
efficient. The current trailer have robust designs, and there
have been no actual calculations or investigation to find out
what dimensions are needed to withstand the forces applied to
a trailer during use. Instead, the design is based on experience
of what works, and what does not. A more thorough
investigation of the design parameters can create better
understanding of which parts of the trailer that are most
exposed to high stresses, and which parts that can have
reduced dimensions. V. CONCLUSIONS The current trailer has robust designs, and there have been no
actual calculations or investigation to find out what
dimensions are needed to withstand the forces applied to a
trailer during use. Instead, the design is based on experience
of what works, and what does not. A more thorough
investigation of the design parameters can create better
understanding of which parts of the trailer that are most
exposed to high stresses, and which parts that can have
reduced dimensions. REFERENCES [1] L.A.W. Horn, HAN University of Applied Sciences, “Semitrailer chassis design against fatigue on the basis of field test data” Heavy Vehicle Transport Technology symposium, Stockholm (2012). [2] AslıSoytürk, HüseyinYıldırım, VolkanAkıncı, “Methods to Determine Torsional Stiffness in a Semi-Trailer Chassis Frame” [3] Mr. Venukumar R Bankapur1, Prof. Sanjeev. A. Janawade, “Fatigue Analysis of Tractor Trailer Chassis”e-ISSN: 2395 -0056 ,Volume: 02 Issue: 03 , June-2015
ISSN NO: 2454-1958 Special Issue Tech-Ed 2016 (International Conference) Page 133
DESIGNING AND DEVELOPMENT OF DIE WITH
LEAN MANUFACTURING
Aswad A SagdeoStudent, Dept. of Mechanical Prof V.P. Kshrisagar, Professor,
Engineering, Wainganga College of Dept. of Mechanical Engineering, Wainganga College
Engineering & Management, Nagpur of Engineering & Management, Nagpur
Abstract:This paper gives the general introduction to the
arrangement, design and some basic concept of designing the
die. CAD plays an important role in this type of die design.
Some losses due to design parameters are also discussed. To
meet the requirements of low cost, good performance and
manufacturing feasibility. This paper will provide a design
overview of the die designing, main characteristics, key
subsystems and control strategies.This gives better
understanding about working principle of lean manufacturing
to avoid the un-necessary operation and minimise the waste
materials. Effect of design consideration can be further studied
during its application in various conditions. In the CAD model
actual designhas also been explained. The design approach is
in the way of improving the efficiency of manufacturing
efficiency. Lastly there is the solution given to the analysed
error. Advantages, disadvantages and various practical
applications are also discussed.
1. Introduction
1.1 Background
This paper also examines the drivers and barriers that influence
the implementation of lean manufacturing.The findings show
that most of the respondent firms are classified as in-transition
towards lean manufacturing practice.Service organisations are
now pursuing lean thinking and actively deploying lean
principles.Onepartis usingclipfunction andanotherpartis using
tick function. In thecomputer-aideddesign(CAD), two
plasticpartsweredrawnin 3dimension(3D) viewbyusingPro-
Engineer(Pro-E) parametricsoftware. These firms believe that
the factors that drive the implementation of lean manufacturing
are the desire to focus on customers and to achieve the
organisation’s continuous improvement.In the computer-
aidedmanufacturing(CAM), Pro-Manufacturingfrom Pro-
Eparametricsoftware wasused to develop
theMachiningprogram.
{Reference from Defining Lean Production: Some conceptual
and practical issues By: JosteinPettersen}
1.2 Literature Review
The concept of LM was pioneered by a Japanese automotive company, Toyota, during 1950’s which was famously known as Toyota Production System (TPS). The primary goal of TPS were
to reduce the cost and to improve productivity by eliminating
wastes or non-value added activities. During 1980’s there was an
intense interest on LM implementation among the western
manufacturers because of growing Japanese imports. It became a
serious concern to the western producers. After the oil crises in
the early of 1990’s, in a published book named Whereas,Operations strategy is the total pattern of decisions
which shape the long-term capabilities of any type operation and
their contribution to overall strategy, Slack and Lewis (2002).
Firms and companies which focus is on the production of goods
use to refer their operations as Manufacturing. Thus,
Manufacturing Strategy (MS) comprises a series of decisions
concerning process and infrastructure investments of a
production firm, i.e. what the manufacturing has and what it
does. { Reference from Lean in Product Developmentby Marc
Lind} It aims to provide the necessary support to develop strategic
competences, which will enable the company to develop a
sustainable competitive advantage in its markets. Competitive
advantages that might be considered as qualifiers(Q), those that
get and keep the company in the marketplace, or as order
winners(OW), those that let the company win orders in the
marketplace, Hill (2000).
ISSN NO: 2454-1958 Special Issue Tech-Ed 2016 (International Conference) Page 134

thermoplasticorbychemicalreactionforthermosetting.
Injection Moulding Machine
1.3 Materialsof DIE
Sr.no. Raw material Drying temp. Time
1 PE, PP 80 0c 2 hr
2 PS 82 0c 2 hr
3 Acrylic ABS,AS 82 0c 2 hr
4 Cellulose series 71 0c 3 hr
5 Poly carbonate 120 0c 3 hr
6 Hylon 82 0c 2.5 hr
7 PVC 71 0c 1.6 hr
1.4 Components of Injection mould Die
Cavity
Cavity back-up plate
Core
Core back-up plate
Stripper plate
Ejector plate
Ejector pins
Bottom plate
DIE CORE 2. Design optimisation
Nowadays,the technology ofthe tool anddiefabrication
in plasticinjection is oneofthe world'sfastest growing
industries. Plasticis nowusedin
almosteveryapplication,ranging from householdarticles
to space travel, from transportation to
packing,frommedicineto toys, from bridgebuildingto
sports. Generally,injectionmouldingis aprocessthat
forms the plasticinto adesiredshapebymeltingthe plastic
material landforcing the plastic
materialunderpressureinto the mouldcavity. Theshape
ofthePlasticthatis desiredis achievedbycoolingin
DIE CAVITY
LEAN WASTES
Different kinds of wastes in a process are categorized in
following categories.
1. Overproduction 2. Waiting 3. Unnecessary Transport 4. Over processing. 5. Excess Inventory 6. Unnecessary Motion 7. Defects 8. Unused Employee Creativity
{from Seven wastes elimination by lean manufacturing case study “gaza strip manufacturing firms’’ By: Khalil A. El-Namrouty, Mohammed S. AbuShaaban.}
Lean Thinking Five step approach:
• Find a change agent. • Find a sensei (to get the knowledge.) • Seize or create the crisis. • Map your value streams. • Get started on creating better value streams. But…how do lean leaders lead this process?
5. Result This study analyzed the existing state of manufacturing and
testing the medical devices in batches. An implementation plan
was developed to implement lean manufacturing principles to
support one-piece flow. The plan was implemented and the
results of the implementation resulted in improved productivity
and resulted in a reduction in work-in-process. 6. Conclusion
Manufacturers are under intense, remorseless pressure to find a
new ways to production cost, elimination of waste, enhance
high quality of product, increase the productivity, and better
customer satisfaction through the implementation of
ISSN NO: 2454-1958 Special Issue Tech-Ed 2016 (International Conference) Page 135

lean traditional manufacturing practices are indicated inadequate representation in lean Manufacturing. This project
manufacturing implementation in manufacturing industries. Hence, appropriate lean education, training, and research setup in association with manufacturing industries are to stimulate the lean awareness and technologic in all type of manufacturing industries. This helps to industries and
researchers create awareness about Lean Manufacturing opt suitable lean practices for implementation, continuous in
study. I also at the outset thank and express our profound
gratitude to ourguides for their inspiring assistance,
encouragement and useful guidance. We are also indebted to all the teaching Staff of the department of mechanical engineering for their cooperation and
suggestions, which is the spirit behind this report. Thanks to all our seniors who gave me the information and basic important knowledge about the topic. Our best regards go to all my colleagues for their pleasant
cooperation last but not the least, we wish to express our
sincere thanks to all our friends for their goodwill and
constructive ideas. . 9. References
the competitive environment of current scenarios. There is our 1.Seven wastes elimination targeted by lean manufacturing case final product is decided according to which we have calculated study “gaza strip manufacturing firms’’
only overall cost which will be up to 32000-35000 rupees.
By: Khalil A. El-Namrouty, Mohammed S. AbuShaaban.
6.1 Design in 3D 2.Defining Lean Production: Some conceptual and practical issues
By: JosteinPettersen
3.DesignandSimulationofPlasticInjectionMouldingProcess By:
Wong,C.T.,ShamsuddinSulaiman,NapsiahIsmail&AM.S.Hamoud
a
4.Fundamentals of Lean By: Professor Deborah Nightingale
5.Lean in Product Developmentby Marc Lind
6.Lean Management and the Role of Lean LeadershipBy: James
Conceptual Die Model in CRE-O P. Womack,John Shook
7.A Survey on Lean Manufacturing
7.Future work / scope Implementation in Malaysian Automotive
This is a general decision methodology, which can be adapted
Industry By: NoraniNordin, Baba MdDeros and and enriched with the information of a firm, and according to
DzuraidahAbdWahab
its specific needs. Also, as new alternatives and techniques 8.Lean: Concepts and Realities By: Andrew Aitken, COO,
come out, they can also be considered in this framework. There Lanner Group.
are some alternatives that can be adapted to combine 9.The principles of the lean business systemBy: Peter hines
differentproduction processes, e.g. using a focused facility it is
10.Implementin Lean Manufacturing Principles in a
possible to have separate production processes for different Manufacturing Environment By: Rodney S. Rogstad
11.Manufacturing Strategy Linkedto Product Life CycleBy: Edna products. But it wasn’t found any framework including
different alternatives, or any proposal for deciding which one Ferro García Luna
12.Reverse Engineering: Why and How to Reverse Engineer to use. As the existing theories and proposals do not seem to be Software
enough, it was necessary to propose a solution for the problem
By: Ren´e R. Klosch of deciding a manufacturing strategy for products with
different life cycles. A solution for this decision problem was
already proposed and explained in the present paper. Now the
question would be to apply the proposed methodology in real
cases, in several companies, and evaluate the results. 8. Acknowledgement First of all we thank the almighty for providing us with the strength and courage to do the research study. We avail this opportunity to express my sincere gratitude
towardsour guide Prof.V.P.Kshirsagar of mechanical
engineering department, for permitting me to do the research
ISSN NO: 2454-1958 Special Issue Tech-Ed 2016 (International Conference) Page 136
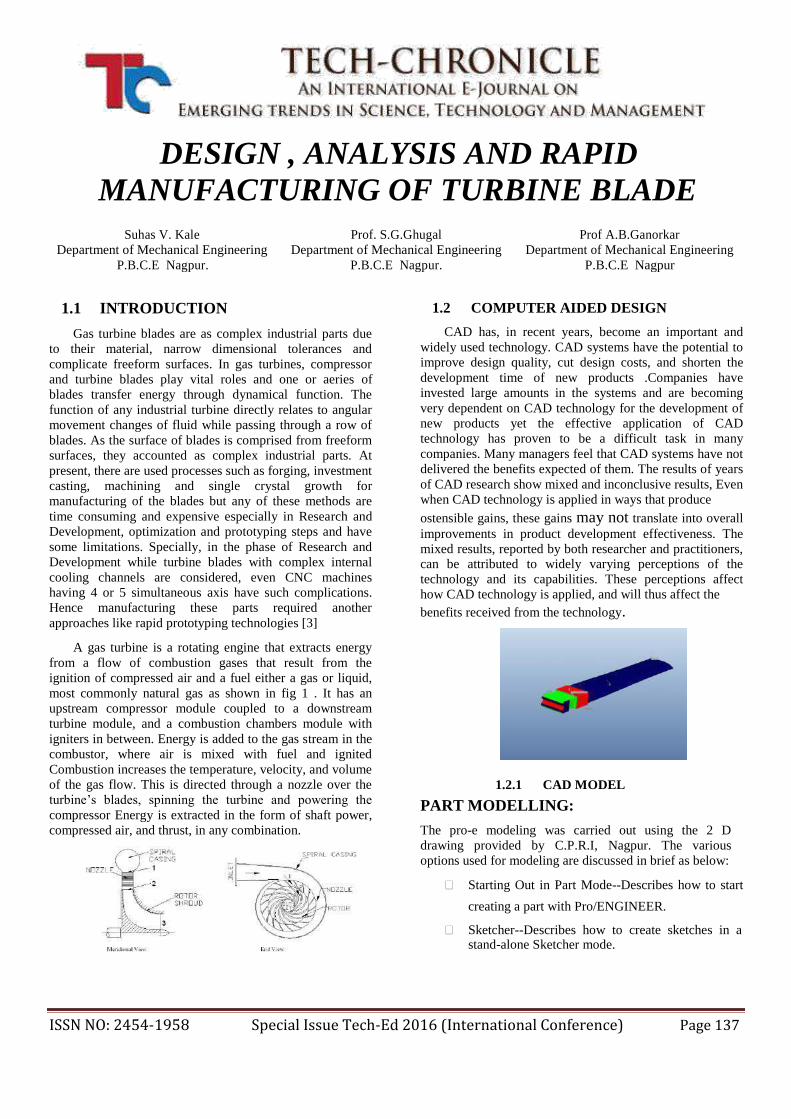
DESIGN , ANALYSIS AND RAPID
MANUFACTURING OF TURBINE BLADE
Suhas V. Kale Prof. S.G.Ghugal Prof A.B.Ganorkar
Department of Mechanical Engineering Department of Mechanical Engineering Department of Mechanical Engineering
P.B.C.E Nagpur. P.B.C.E Nagpur. P.B.C.E Nagpur
1.1 INTRODUCTION
Gas turbine blades are as complex industrial parts due
to their material, narrow dimensional tolerances and
complicate freeform surfaces. In gas turbines, compressor
and turbine blades play vital roles and one or aeries of
blades transfer energy through dynamical function. The
function of any industrial turbine directly relates to angular
movement changes of fluid while passing through a row of
blades. As the surface of blades is comprised from freeform
surfaces, they accounted as complex industrial parts. At
present, there are used processes such as forging, investment
casting, machining and single crystal growth for
manufacturing of the blades but any of these methods are
time consuming and expensive especially in Research and
Development, optimization and prototyping steps and have
some limitations. Specially, in the phase of Research and
Development while turbine blades with complex internal
cooling channels are considered, even CNC machines
having 4 or 5 simultaneous axis have such complications.
Hence manufacturing these parts required another
approaches like rapid prototyping technologies [3]
A gas turbine is a rotating engine that extracts energy
from a flow of combustion gases that result from the
ignition of compressed air and a fuel either a gas or liquid,
most commonly natural gas as shown in fig 1 . It has an
upstream compressor module coupled to a downstream
turbine module, and a combustion chambers module with
igniters in between. Energy is added to the gas stream in the
combustor, where air is mixed with fuel and ignited
Combustion increases the temperature, velocity, and volume
of the gas flow. This is directed through a nozzle over the
turbine’s blades, spinning the turbine and powering the
compressor Energy is extracted in the form of shaft power,
compressed air, and thrust, in any combination.
1.2 COMPUTER AIDED DESIGN
CAD has, in recent years, become an important and
widely used technology. CAD systems have the potential to
improve design quality, cut design costs, and shorten the
development time of new products .Companies have
invested large amounts in the systems and are becoming
very dependent on CAD technology for the development of
new products yet the effective application of CAD
technology has proven to be a difficult task in many
companies. Many managers feel that CAD systems have not
delivered the benefits expected of them. The results of years
of CAD research show mixed and inconclusive results, Even
when CAD technology is applied in ways that produce ostensible gains, these gains may not translate into overall
improvements in product development effectiveness. The
mixed results, reported by both researcher and practitioners, can be attributed to widely varying perceptions of the
technology and its capabilities. These perceptions affect
how CAD technology is applied, and will thus affect the benefits received from the technology.
1.2.1 CAD MODEL
PART MODELLING: The pro-e modeling was carried out using the 2 D
drawing provided by C.P.R.I, Nagpur. The various
options used for modeling are discussed in brief as below:
Starting Out in Part Mode--Describes how to start
creating a part with Pro/ENGINEER.
Sketcher--Describes how to create sketches in a stand-alone Sketcher mode.
ISSN NO: 2454-1958 Special Issue Tech-Ed 2016 (International Conference) Page 137

Datum’s--Describes how to create datum features:
datum planes, datum points, datum curves, datum
axes, coordinates features, graphs, evaluate
features.
Sketching on a Model--Describes how to create 3-
D sections in the process of feature creation.
Feature Creation Basics--Describes how to create
extruded and revolved protrusions.
Sweeps, Blends, and Advanced Features--
Describes how to create sweeps, blends,
and advanced features. Construction
Features--Describes how to create construction
of features such as holes, slots, and cuts.
Rounds--Describes how to add rounds to part geometry.
Tweak Features--Describes how to create tweak
features, such as draft, local push, and section
dome.
1.3 RAPID PROTOTYPING
Today, the competition of the industries in the overall
the world are provided to fabricate a new product with high
quality, low cost and low lead time of marketing, thereby,
using of CAD/CAM systems, rapid prototyping and rapid
tooling are not avoidable. At the present time, in most large
industries such as automotive, aerospace, house equipments
and medical facilities, rapid tooling is used. When solid
modeling system was introduced in 1970, many researchers
try to make physical model directly from geometric model
data without using traditional tooling. From 1970 to 1980,
companies had some achievement in manufacturing parts
layer by layer by photopolymer material. In 1986, 3D
System company was introduce SLA rapid prototyping
method and first rapid prototype machine was manufactured . In rapid prototyping against traditional machining method,
work piece is produce with additive method and layer by
layer, result in this method is faster than from the
subtraction of the material. This method hasn’t the
restriction of machining method and complex feature can
produce with high accuracy and high quality . Rapid tooling
is extension of rapid prototyping, in reality it is the
development of CAD/CAM and rapid prototype
technologies. It uses from rapid prototype technology
directly or indirectly and reduce the product cycle time.
Using of RP&RT allow the casting foundry to produce work
piece without using tooling in low volume production. That
helps to approve design, process condition and runner
parameters. Result in this method decreases time and cost
for production of sample parts with best quality, rapid and
low cost [3, 4]. While 20 or 50 casting parts are required, RP method isn’t economic, especially if it is required
surface roughness. For simple and small part, using of the
multiple cavity die is economical. This die can save 50% in
production cost due to the reduction of production cycle
time and elimination of connection runner to model. It is
also reduce probable failure of small part and brittle material
due to the reduction of displacement. The machining of
cavity can’t sure all models are the same, but the entire
models are the same by using RT [5]. Furthermore, RT is
allowing casting foundry to apply contraction parameter in
production .
1.4 OPERATIONAL DESCRIPTION
The existing commercial RP processes use a layered
fabrication method to create the physical prototype from a
3D CAD model. The CAD model to be prototyped is first
converted into a standard format known as STL file format.
In this format the surface of the CAD model is
approximated by triangular faces[7]. The STL file consists
of a list of the vertices of each of these triangles and a unit
normal to each triangle indicating which side of the triangle is solid The rapid prototyping device reads the STL file
and decomposes the 3D part into a series of 2D
cross sections or slices[7]. The machine then
constructs the physical prototype by sequentially
creating each cross sectional layer and bonding
each layer to the previous layer. Once all the
layers are created and registered, a solid object is
obtained. The accuracy of the object formed
depends on the slice thickness and material
dependent factors such as shrinkage, war page etc
1.4.1 Making SLA Model
Among RP methods, SLA has better feature definition and can create better surface roughness [7]. Turbine blade model is made by SLA method by the following procedure;
1. Convert CAD model in the STL format and send to 3DLightyear software.
2. Positioning workpiece on the SLA5000 platform
3. Positioning support
4. Slicing workpiece and support by thickness 0.15mm
5. Preparing SLA5000: content define recoat in any slice and Z-wait
6. Making workpiece
7. Remove SLA model from machine chamber and remove support The maximum error of SLA model is about 0.017 mm [3]
these deviation is measured by a CMM supplied PC-DMIS software to find the accuracy of SLA model.
ISSN NO: 2454-1958 Special Issue Tech-Ed 2016 (International Conference) Page 138

Gambar 1. Part Files are Converted to STL Files
1.4.2 Prototype Or
Production Parts
While many commercial rapid prototyping machines have made significant improvements with their fabrication techniques during the past five years, it is not yet possible to
go directly from the CAD model to the final production part as is done with Computer Numerical Control machining However, new alternative modeling materials are currently being tested by all commercially available rapid prototyping machines. Many of these new materials have already demonstrated they are acceptable for producing 3- D objects with limited function Current limitations result from size, surface finish, and tolerances RP is expanding its usefulness from prototyping parts into the manufacture of actual production parts An electronics manufacturer uses
Stereo lithography to fabricate final-use carrier components
for use in manufacturing integrated circuits In another
example, replacement of a cam follower was accomplished
overnight using Stereo lithography and high strength
photopolymer. Normally this cam follower would take two
to three weeks for delivery Likewise, 3-D printing, using a
colloidal silica binder and alumina-silica ceramic powder
has been used to fabricate ceramic cores for lost wax casting
models . Adding to that, Fused Deposition Modeling has
been used to produce wax patterns to fabricate moulds for
investment casting .
Gambar 2. Machine Control Flow Chart
1.4.3 Example: Prototype Wind Turbine Blade
A prototype wind generator turbine blade, based on a
NASA design referred to as the LS( 1)-417MOD, has been
produced using SM2. First, a computer solid model was
generated using a series of spline points to describe the foil
cross-section geometry at specific points along its
longitudinal axis Using these spline points and commercial
solid modeling software, a surface model and subsequent
solid model were generated. Next, the model file was
exported as an STL file and the airfoil was sliced into 1"
thick layers, to match the foam thickness. Each layer's slice
geometry was ported to Shape Maker II and the layer
geometry was cut from a sheet of extruded polystyrene
foam. Finally, a thin coat of adhesive was applied to each
layer, and the layers were manually registered and bonded
together The gross dimensions for this turbine blade design
are 46" x 7" cross-section and 7' long Fabrication time,
excluding CAD modeling was approximately 11 hours. The
accuracy for this first attempt at fabricating the airfoil is in
the range of 0.1-0.6% of cross-section dimensions.
Translating these values into useable dimensions, all
dimensions were within 0.135" of the desired value. The z-
axis accuracy is estimated to be 1% of the overall length or
approximately 0.7".
1.4.4 Abbreviations and Acronyms
Computer Numerical Control (CNC) ,
Computer-Aided Design (CAD) , Rapid Prototype
(RP) , Rapid Prototype Manufacturing (RPM) ,
Stereo lithography (SLA) , 3 Dimensional (3D) , 2
Dimensional (2D) , Reverse Engineering (RE) ,
Coordinate Measuring Machine - CMM
1.5 CONCLUSION
We came to the conclusion after the above discussion
that the rapid Prototyping is one of the best methods to manufacture turbine blades within the given tolerance level
Some important advantages achieved by using rapid prototyping as follows
1. Reduction in cost and time while for this blade observe in comparison with traditional method we save 50%
in time and 60% in cost
2. Develop machining technology in short time:
because for production of any blade, it required some test cut in order to solve machining problems
REFERENCES [1] S.Ramamurthy and S.Thennavarajan “Cost Effective
Method for Manufacturing Micro Gas Turbine Components
” Total Engineering, Analysis and Manufacturing
Technologies 22nd – 24th September 2008 .
ISSN NO: 2454-1958 Special Issue Tech-Ed 2016 (International Conference) Page 139

[2] David Robertson and Thomas J. Allen “CAD System Use and Engineering Performance ” IEEE Transactions on Engineering Management , Vol 40 No 3. [3] D. Safaeian, M. Vaezi “Investment Casting of Gas
Turbine Blade by Used of Rapid Technologies ” Australian
Journal of Basic and Applied Sciences , 3(3): 2979-2988,
2009 [4] Lal Gopal Das and Naresh Chandra Murmu “A Unified
Methodology for Micro Gas Turbine ” The 11th Asian
International Conference on Fluid Machinery November 21-
23, 2011, IIT Madras, Chennai, India [5] B.A. Weeden, A.P. Sanders, D.L. LaSalle, G.P. Trottier “Alternative Methods for Custom Implant Production
Utilizing a Combination of Rapid Prototyping Technology and Conventional Investment Casting” [7] Charles L. Thomas, Thomas M. Gaffney, Srinivas Kaza,
Cheol H. Lee “Rapid Prototyping of Large Scale Aerospace
Structures” [8] G Madhavulu , SVN Ani1 Sundar , Basheer Ahmed “CAD/CAM Solutions for efficient Machining of Turbo Machinery Components by Sturz Milling Method ” [9] Jürgen M. Anders and Jörg Haarmeyer BMW Rolls- Royce GmbH, Dahlewitz, Germany “A Parametric Blade Design System (Part I + II) ”
ISSN NO: 2454-1958 Special Issue Tech-Ed 2016 (International Conference) Page 140

The Perception and Methodology of Lean
Manufacturing
Sumit yadav Sumit Roy Sumit Yadav
Depament of Mechanical Department of Mechanical Department of Mechanical
Engineering, Tulsiramji Gaikwad- Engineering, Tulsiramji Gaikwad- Engineering, Tulsiramji Gaikwad-
Patil College of Engineering and Patil College of Engineering and Patil College of Engineering and
Technology, Mohgaon, Nagpur Technology, Mohgaon, Nagpur Technology, Mohgaon, Nagpur
Abstract— In the present global and competitive
environment all organizations needs to perform
efficiently with higher productivity. For performing
efficiently with higher productivity there are so many
tools and techniques. Lean is one of them it means using
only what is necessary lean manufacturing techniques
aim to significantly identify waste and eliminate it from
the manufacturing processes. Purpose of this paper is to
present Lean Manufacturing elements, benefits,
implementation strategy and obstacles in
implementation for small scale manufacturing units and
industry.
INTRODUCTION:
Lean is defined as a strategy for achieving significant
continuous improvement in performance thought the
elimination of all wastes of resources and time in the total
business process.. It evolved from Toyota after world war
2nd as a business strategy due to the limited resources
available in Japan, in contrast to the vast resources available
to manufactures in the US. Its principles apply to nearly all
business operations, from administration and product design
to hardware productions. Lean manufacturing is about
eliminating waste and non value added tasks. Examples of
waste in manufacturing include overproduction, over
processing, waiting, unnecessary part movement, excess
inventory and defects, as applied to hardware production
lean manufacturing focuses on eliminating all sources of
waste by applying the following strategies 1. One piece workflow
2. Take time 3. Pull system Lean identifies the bottlenecks in design and development
processes that add unnecessary delays and cost. It can help
create a more efficient system that reduces time to market
without compromising on quality. Lean has a key role to
play in new product development and the improvement of
existing products and the improvement of existing products,
including idea creation, design for manufacture, assembly
and test, rapid prototyping, product portfolio management,
market and competitor analysis, risk management, sales
forecasting, setting key performance indicators and value
analysis to reduce the cost of existing products.
Lean Manufacturing in India:
India is emerging as a new manufacturing destination and
many industries are seeking ways to excel their
manufacturing capabilities by elimination of wasteful
activities from their systems. Lean is one of the approach the
Indian industries are looking to become more competitive in
local as well as global market. Yadav indicated in their
study a keen interest on the part of Indian manufacturing
companies to adopt or learn new approaches and techniques
in order to improve their performance; but it was only the
beginning of a long journey for them. In recent study,
Panizzolo et al. (2012) investigated the adoption of lean
production in India. The Indian Automotive sector has the
very high level of lean implementation followed by
Mechanical / Engineering sector. Other sectors are seen on
medium to low level.
Industry sector in India Level of diffusion
Automotive Very high
Machine tool Medium to low
Electronics/ IT /engineering High
FMCG Medium to low
Process industries Medium to low
Aerospace Medium to low
Decision-making (MCDM) for lean assessment to assess lean performance holistically. The literature pointed toward
popularity of lean in India; but when it comes to success, its
only start of journey. Other than automobile and electronics industry, others are having medium to low diffusion of lean
in India.
ISSN NO: 2454-1958 Special Issue Tech-Ed 2016 (International Conference) Page 141

2. Principles and Practices of LeanManufacturing
Lean production is a multi-dimensional approach that
encompasses a wide variety of managementPractices,
including just-in-time, quality systems, Work teams, cellular
manufacturing, supplier Management, etc. in an integrated
system (Shah et al., 2003).Yadav et al. (2010) identified ten
fundamental Lean principles (Table 1) on the basis of
exhaustive Literature review and authors’ industrial
experience, Which further used for investigation of lean
Implementation. Lean manufacturing What it means? Enablers
Principles
Standardized work Standard work procedure to do procedures,Design
routine and repetitive blue
1.Standardization tasks to improve prints
efficiency and quality
Flow of work to the Kanban system, JIT right machine or
person in the rightform
at the right time at the
2. Simple and specified lowest cost with the
Pathways highest
Quality possible which reduces production
lead time.
Through continuous Scientific methods of effort of managers and problem supervisors solving
3. Teaching and Acting as enablers or
learning mentor in solving
problems.
An atmosphere of Consistency, trust, respect and consensus common purpose in and communication
which work is 4. Socialization performed to improve
efficiency and
Productivity.
Experimentation by Kaizen, TQM, Six the people at every Sigma,
5. Continuous level toward JIT etc.
Improvement Improving their own
work systems.
Supplier-customer Long term relationship specifies cooperative the form and Quantity relationship
of the goods and services to be
provided, the way
6.Supplier-customer Requests are made by
Relationship each customer, and the
expected time In
which the request will
be met.
Coordination through go-see, involvement
7. Coordination rich communication is of through required to suppliers early during
rich communication Develop the idea into PD
an innovation.
Every company Job rotation policy depends on highly
skilled engineers,
8. Functional expertise designers, and
and stability technicians to bring a
product to the market;
It is about developing
standard set of skills.
It is a common sense Sharing a common
of what the ideal goal
system would be,
and that shared goal
9. Pursuit for motivation to make perfection / improvements
striving for ideal goal beyond what would be
necessary to meet the current
Needs of their
customers.
10. Cultivating It shows the faith of knowledge sharing organizational organization that the practices
knowledge skills and
Knowledge generated
will pay off later.
MUDA, MURI, AND MURA
Muda, Muri, and Mura (1988) are Japanese words that were
regularly used by Toyota through their development of
Lean. Muda means waste, Muri means overburden, and
Mura means unevenness. Variation in the order arrival rate
and deviation in the capacity is unevenness (Mura).
Capacity is straight connected with overburden. Mura and Muri lead to Muda‖. According to Ohno Muda is categorized into seven wastes Figure: Wastes are
Seven Wastes: Overproduction/early production—producing what the
customer does not want. Waiting—idle time when no value is being added to the
product or service. Transportation—unnecessary moving or handling, delays in
moving material. Inventory—unnecessary stored materials, WIP, finished
products. Motion—movement of equipment, inventory, or people that
adds no value. Over processing—unnecessary processing and procedures
that add no value.
Defects—producing defective products.
Fig. 7 Wastes
BENEFITS RESULTING FROM LEAN MANUFACTURING:
ISSN NO: 2454-1958 Special Issue Tech-Ed 2016 (International Conference) Page 142

Lean manufacturing has a group of benefits for the growth
of organization. The establishment of lean manufacturing
will provide the following benefits for a particular
organization
1. Waste reduction by 75%-80%
2. Production cost reduction by 30%-40%
3. Manufacturing cycle time reduction by 60%-70%
4. Labour reduction by 55%-65%
5. Inventory reduction by 40%
6. Capacity increase by 40%-50%
7. Production of better quality
Barriers to implement lean:
Barriers to Small Medium Large sized Sourc
Implement Organizatio sized Organizatio es
Lean ns Organizatio ns
ns
Cost of the √ √ (1) investment
Insufficient √ √ (1) internal funding
Insufficient √ √ √ (1) supervisory
skills to
implement lean
Insufficient √ √ √ (1), (2) management
time
Employee √ √ √ (1), attitudes/resista (2),
nce to change (3)
Insufficient √ (1) external
funding
Insufficient √ √ √ (1) senior
management
skills to
implement lean
Insufficient √ √ √ (1) workforce skills
to implement
lean
Cultural issues √ √ (1), (4),
(5)
Insufficient √ √ (1), understanding (6)
of the potential
benefits
Lean Manufacturing Implementation strategies: Lean
manufacturing is a philosophy which cannot be implemented instantly so it requires tolerantly developing understanding within the organization about lean, starting with smaller projects of lean at tool level, taking guidelines of an expert, making and following the strategy with due
course correction in strategy while implementing lean
throughout the organization. Some of the steps are as follows:
Senior Management Involvement-For any major change, support and commitment from top management is vital. It is very much possible that problems will arise when lean implementation will progress and these issues must be understood and solved by top management without effecting lean implementation process.
Initiate with smaller projects - Initial project must be small
so that more resources are utilized and more chances are for better results with lesser risk moreover people working on project and around will learn while doing project. The results will motivate other to follow the same and people will start having faith in lean techniques. So
recommendation is to start with smaller project at tool level.
Start with limited execution – Lean implementation should be within limited area during start so that it can be
monitored, corrected and directed for further
implementation starting lean all-around the organization will
reduce control and mentoring of people involved in lean
implementation. Once movement is gained it should be
spread in other areas.
Employ a professional –Services of a professional mentor should be taken at least at the start. During conversion of a conventional organization to a lean organization lots ofIssue will arise and should be handled professionally they can be taken care with the use of expert.
Obstacles in Lean Manufacturing implementation:
Lack of management support: the reason can be pressure from customer side; competitor is following lean practices or others. In this case management just starts and does not propel further this results only superficial lean and neither lean is implemented nor does it get benefit.
Lack of training: Another reason is lack of clear understanding about lean throughout the organization. The organization where knowledge of lean lacks it cannot be implemented.
Communication – Lack of communication is one of the prime obstacles in lean manufacturing implementation.
Resistance to Change – Resistance to change is very
common phenomena as it increases fear of failure, initial
cost so many of routine liking people doesn’t want to change
and hence it stops the progress of lean implementation.
No direct financial advantage – Lean does not produces any direct financial benefits but it helps in identification and elimination of waste hence reduction of cost. Lean does not
ISSN NO: 2454-1958 Special Issue Tech-Ed 2016 (International Conference) Page 143

have any financial measure in terms of input and output so
sometimes lean idea is superseded by other organizational priorities.
Past failures – In case of poor launching of Lean is itself big obstacle. Lack of implementation strategy may lead to lack of faith in whole philosophy.
CONCLUSION:
This paper presents the review of lean thinking and its
concept through definitions from literature. The main focus
of lean manufacturing is to eliminate waste, doing things
better in half of the resources as mass production requires,
providing higher quality with lesser cost. More and more
facets of lean manufacturing will come forth as researchers
are keenly bringing through continual research. The good
understanding of lean principles and practices is required for
successful implementation of lean as lean practices without
knowing lean principles can give short term success but may
fail as long term strategy. The paper tried to present best
way for lean implementation available in literature along
with discussion that lean is applied successfully in different
sectors than automobile sector such as service sector,
discrete manufacturing, etc. The recent literature shows that
the trend in lean manufacturing for research now is focused
on lean assessment. Leanness attracts focus to answer
specific questions of managers responsible for lean
implementation to assess the lean implementation level and
to justify spending over lean implementation. In this paper,
presents the review of barriers of lean implementation from
literature review. Understanding the barriers is important for
managers to avoid failures and to sustain lean leap. The
future research may be to identify such barriers through
extensive literature review and interviews of working
professionals as very little work happened on this subject.
The way forward for research in this area may be multiple
criteria. The paper contributes by identifying enablers &
barriers in implementing the lean principles and practices,
methodologies used in leanness measurement of an
organization in the Indian manufacturing industry.
REFRENCE: 1. Abdulmalek, F. A. and Fajgopal, J. (2007), Analyzing the benefits of lean
manufacturing and value stream mapping via simulation: A process sector case study, Int. J. Production Economics, Vol. 107, pp. 223-236.
2. Bhasin, S. (2012), Performance of Lean in large organisations, Journal of Manufacturing Systems, Vol. 31, 349-357.
3. Doolen, T. L. and Hacker, M. E. (2005), A Review of Lean Assessment in Organizations: An Exploratory Study of Lean Practices by Electronics Manufacturers, Journal of Manufacturing Systems, 24, 1, pp. 55-67.
4. Gurumurthy, A. and Kodali, R. (2009), Application of benchmarking for assessing the lean manufacturing implementation, Benchmarking: An International Journal, Vol. 16, No. 2, pp. 274-308.
5. Hallgren, M. and Olhager, J. (2009), Lean and agile manufacturing: external and internal drivers and performance outcomes, International Journal of Operations & Production Management, Vol. 29 No. 10, pp. 976-999.
6. Herron, C. and Christian, H. (2008), The transfer of selected lean
manufacturing techniques from Japanese automotive manufacturing into general manufacturing (UK) through change agents, Robotics and Computer-Integrated Manufacturing, 24, pp. 524-531.
7. Hines, P., Holwe, M. and Rich, N. (2004), Learning to evolve: A
review of contemporary lean thinking, International Journal of Operations & Production Management, Vol. 24, No. 10, pp. 994-1011.
8. Lewis, M. A. (2000), Lean production and sustainable competitive advantage, International Journal of Operations & Production Management, Vol. 20 No. 8, pp. 959-978.
9. Meier, H. S. and Forrester, P. L. (2002), A model for evaluating the degree of leanness of manufacturing firms, Integrated Manufacturing Systems, 13, 2, pp. 104-109.
10. Melton, T. (2005), THE BENEFITS OF LEAN MANUFACTURING What Lean Thinking has to Offer the Process Industries, Chemical Engineering Research and Design, 83(A6), pp. 662–673.
11. Panizzolo, R., Garengo, P., Sharma, M. K. and Gore, A. (2012), Lean manufacturing in developing countries: evidence from Indian SMEs, Production
12. Planning & Control, Vol. 23, No. 10-11, pp. 769– 788. 13. Papadopoulos, T. C.and Ozbayrak, and M. (2005), Leanness:
experiences from the journey to date, Journal of Manufacturing Technology Management, Vol. 16 No. 7, pp. 784-807.
14. Piercy, N. and Rich, N. (2009), Lean transformation in the pure service environment: the case of the call service centre, International Journal of Operations & Production Management, Vol. 29, No. 1, pp. 54-75.
15. Shah, R. and Ward, P. T. (2003), Lean manufacturing: context, practice bundles, and performance, Journal of Operations Management, 21, pp. 129–149.
16. Shah, R. and Ward, P. T. (2007), Defining and developing measures of lean production, Journal of Operations Management, 25, pp. 785-805.
17. Shah, R., Chandrasekaran, A. and Linderman, K. (2008), In pursuit of implementation patterns: the context of Lean and Six Sigma, International Journal of Production Research, Vol. 46, No. 23, pp. 6679- 6699.
18. Singh, B., Garg, S. K. and Sharma, S. K. (2010), Development of index for measuring leanness: study of an Indian auto component industry, Measuring Business Excellence, Vol. 14, No. 2, pp. 46-53.
19. Sullivan, W. G., McDonald, T. N. and Van Aken, E. M. (2002), Equipment replacement decisions and lean manufacturing, Robotics and Computer Integrated Manufacturing, Vol. 18, pp. 255-265.
ISSN NO: 2454-1958 Special Issue Tech-Ed 2016 (International Conference) Page 144
MIST BASED HVAC PERFORMANCE
OPTIMISATION OF AIR CONDITIONER
Rahul Singh Anoop Chauhan Aditya Dhawale AkshayBalkhande
MechEngg, MechEngg, MechEngg, MechEngg,
TGPCET, Nagpur TGPCET, Nagpur TGPCET, Nagpur TGPCET, Nagpur
[email protected] [email protected] [email protected] [email protected]
ABSTRACT:
Air conditioning units are used for small and medium scale
residential buildings. With the ever increasing energy cost the
operations of the Air conditioners are further escalating the
allocated budgets. Our project aims at establishing easy,
practical and cost effective way to achieve the performance
optimization without compromising the output (comfort levels).
The project will investigate and identify various possible and
effective methods to improve thermal performance of existing
AC systems without retrofitting the cost centric components
(compressor, condenser, evaporator).
Our project concentrates at optimization of the vapor based compression cycle. The energy efficiency can be achieved by
below measures1,
23
a. Reducing compressor work/ power utilization
b. Increasing cooling effect c. Increasing temperature difference between condenser
and ambient air (since Q α ∆T )
d. By using a material having high thermal conductivity
( Q α K )
Considering the least amount of retrofitting is incurred for step a,b,c the project concentrates to achieve reduction in the condenser pressure. Thus basic theme for achieving the energy
efficiency is reduction of the condenser pressure. The reduction in the condenser pressure is proposed by increasing the rate of heat transfer; by increasing temperature difference between the
condenser tubing and surrounding. By spraying water around
condenser theoretically air (at DBT4) can be cooled upto WBT
5.
Practically we have planned to undertake experimentations on
the proposed experimental setup. Before undertaking experimentation the Assessment Team knows that water contains
1 HEAT AND MASS TRANSFER by R. K. RAJPUT
2 ENGINEERING THERMODYNAMICS by P. K. NAG
3 BEE Book 03
4 THERMAL ENGINEERING by R. K. RAJPUT
5 Dry bulb temperature
6 Wet bulb temperature
dissolved solids which will form scaling on the tubings thus
compromise on the heat transfer was upfront accommodated by
coating the tube by Teflon coating. The length of the condenser
tubes will be increased to compensate the reduction in heat
transfer.
A mist box arrangement has been provided to the condenser. The
mist box includes fine orifice through which a spray of water will
be discharged on the condenser coils. This arrangement has been
installed at the inlet of the condenser circulation fan. Due to this
evaporation of water takes place and it results in the cooling of
the incoming ambient air.
Due to continuous evaporation of water a residual of calcium
carbonate remain on the tubings which results in scale
formation. This can be eliminated by coating a Teflon PTFE of
0.4mil (1mil= 0.01 inch). This will greatly increase the
performance of air conditioner and will increase the life of
condenser. Keywords
Water mist, air cooled condenser, air conditioner, Thermal
performance. INTRODUCTION: Refrigeration system is used to provide cooling by the use of
mainly four components Compressor, Condenser, expansion
device and evaporator. These four components are operated
with a refrigerant which works as heat carrier in this system. It
extracts the heat from evaporator in the form of latent heat and
rejects that heat to atmosphere through the condenser.
Therefore heat rejection capacity depends on difference
between refrigerant temperature at condenser and atmospheric
temperature. Quantity of heat rejection also affects the
quantity of heat absorption through evaporator. It is clear that
more heat rejection will result more heat absorption. 6Atmospheric temperature varies according to Environmental
6 VCR is a closed loop system, the amount of heat extracted
from the system will be equal to the amount of heat gainedto
ISSN NO: 2454-1958 Special Issue Tech-Ed 2016 (International Conference) Page 145

condition i.e. during the summer atmospheric temperature
becomes higher which decreases the temperature difference
between refrigerant and atmosphere, results less heat rejection
which decreases the overall performance of refrigeration
system.
LITERATURE SURVEY: Condenser Misting System is a cost-effective, sensible
solution to capacity and energy usage issues that occur during
upper ambient temperatures. By injecting atomized water in
the inlet air of condenser the temperature is reduced and the
condenser is able to reject significantly more heat. This
reduces the head pressure and compression ratio, so electrical
demand (kW) and usage (kWh) are reduced and cooling
capacity is increased. Furthermore, these benefits are realized
exactly when the load on the system created by high ambient
temperatures exceeds the system’s cooling capability i.e. the
higher the ambient temperature, the better the performance of
the Condenser misting system. The Condenser Misting System is a simple, elegant,
measurable solution. With no moving parts to malfunction, it
is safe, dependable, and requires little maintenance.
Furthermore, the cost of the Condenser Misting System is
quickly recovered through reduced demand charges, energy
usage, water and sewerage usage. Eghtedari H. et al. investigated about the Application of
evaporative cooled air condenser instead of air cooled
condenser to solve the problem of maintaining higher COP in
hot weather conditions. He built an evaporative cooler and
coupled it to the existing air-cooled condenser of a split air
conditioner in order to measure its effect on the cycle
performance. . Experimental results showed that application
of evaporative cooled air condenser has significant effect on
the performance improvement of the cycle and the rate of
improvement increases as ambient air temperature increases.
HajidavallooEbrahim investigated incorporation of
evaporative cooling in the condenser of window-air-
conditioner. An air conditioner was used to test the innovation
by putting two cooling pads in both sides of the air
conditioner and injecting water on them in order to cool down
the air before passing it over the condenser. The experimental results show that thermodynamic
characteristics of new system are considerably improved. The
power consumption decreased by about 16% and the
coefficient of performance increased by about 55%.Chan et al.
described how direct evaporative coolers can be used to
improve the energy efficiency of air-cooled chillers in various
operating conditions and with different strategies for staging the refrigerant. So the refrigerant will dissipate heat through the condenser.
condenser fans. These coolers are installed in front of air-
cooled condensers to precool outdoor air before entering the
condensers. With the direct evaporative cooler, compressor
power dropped following the decrease in the condensing
temperature in most operating conditions, while the pressure
drop across the cooler caused additional condenser fan power.
The overall saving of chiller power varied from 1.4 to 14.4%
Hassan et al. studied an innovative condenser for residential
refrigerator. To allow for evaporative cooling, sheets of cloth
were wrapped around condenser to suck the water from a
water basin by capillary effect. The experimental results showed that the dry bulb temperature of entering condenser air with water mist pre-cooling could drop by up to 9.40 C from the ambient air temperature. COP
could be improved by up to 8.6%7his study showed that the
water mist system coupled to air-cooled chillers is an energy efficient and environment friendly technique. Kopko et al. investigated evaporative cooling and conventional cooling for a split heat pump system. The evaporative condenser was retrofitted onto an existing split heat pump system. For the purpose of this test heat pump only operated in cooling mode. Two separate sections maintained indoor & outdoor conditions for the respective units. In the evaporative condenser, as the disks rotate, their wetted
surfaces pull a film of water out of the bath into the air stream.
The passing air evaporates some of the water film, cooling the
water that remains on the disks. This cooled water is returned
to the bath as the disks rotates, cooling the bath and thus the
condenser tubes. The final results showed improved steady
state performance; a higher capacity of COP by 11.1 to 21.6%.
R. Boukhanouf et al presented a computer model and
experimental results of a sub-wet bulb temperature
evaporative cooling system for space cooling in buildings in
hot and dry climates. The cooler uses porous ceramic
materials as the wet media for water evaporation. The porous ceramic panels were placed between the dry and
wet air ducts to form small and narrow ducts with air flowing
at low velocity. The dry channel side of the porous ceramic
panel is sealed with a thin non-permeable membrane while the
wet channel side allows water to sip through its micro-pores
onto its surface forming a thin water film. This allows direct
contact with the airflow and hence causing water evaporation.
The air streams in the dry and wet channel flow in counter
flow arrangement and the supply air exchanges sensible heat
with the water in the porous ceramic panels that in turn are
cooled through water evaporation on the wet channel side.
This results in a drop in temperature of the air in the dry
channel without changing its moisture content while the air in
the wet channel is rejected at saturation state. Under selected
7= 1 − 2 =
−
ℎ 1
ISSN NO: 2454-1958 Special Issue Tech-Ed 2016 (International Conference) Page 146
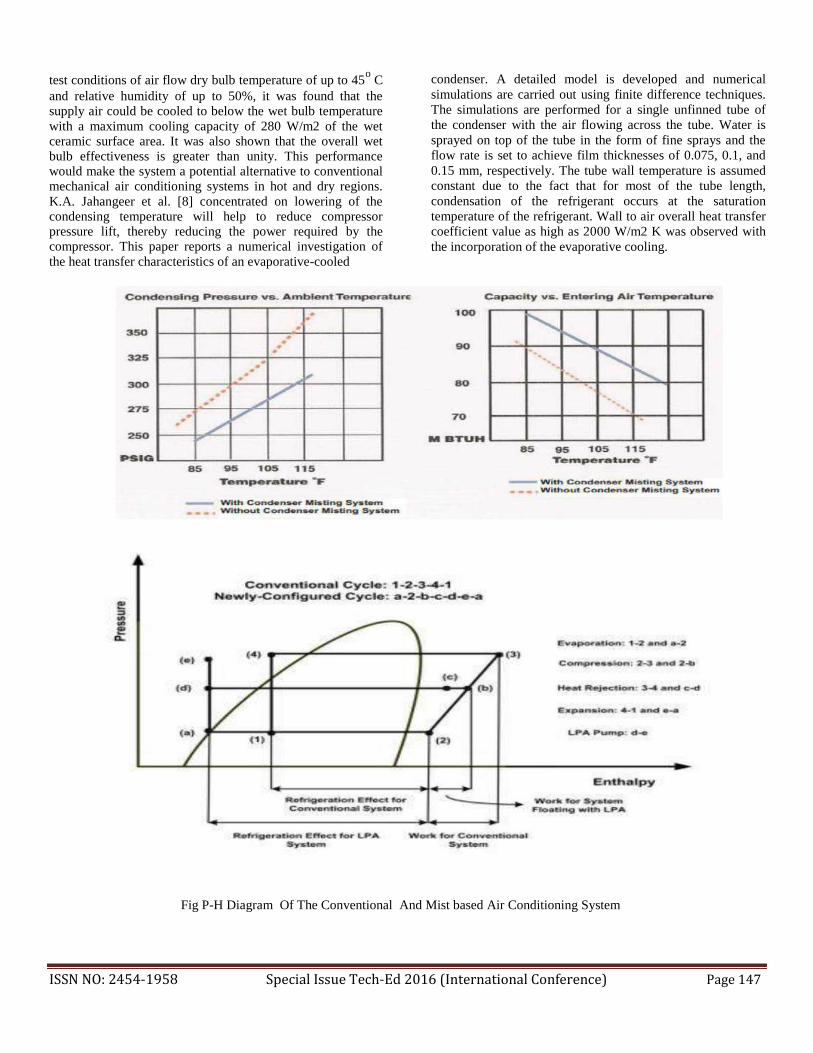
test conditions of air flow dry bulb temperature of up to 45o C
and relative humidity of up to 50%, it was found that the supply air could be cooled to below the wet bulb temperature
with a maximum cooling capacity of 280 W/m2 of the wet ceramic surface area. It was also shown that the overall wet bulb effectiveness is greater than unity. This performance would make the system a potential alternative to conventional mechanical air conditioning systems in hot and dry regions.
K.A. Jahangeer et al. [8] concentrated on lowering of the condensing temperature will help to reduce compressor pressure lift, thereby reducing the power required by the compressor. This paper reports a numerical investigation of
the heat transfer characteristics of an evaporative-cooled
condenser. A detailed model is developed and numerical
simulations are carried out using finite difference techniques.
The simulations are performed for a single unfinned tube of
the condenser with the air flowing across the tube. Water is
sprayed on top of the tube in the form of fine sprays and the
flow rate is set to achieve film thicknesses of 0.075, 0.1, and
0.15 mm, respectively. The tube wall temperature is assumed
constant due to the fact that for most of the tube length,
condensation of the refrigerant occurs at the saturation
temperature of the refrigerant. Wall to air overall heat transfer
coefficient value as high as 2000 W/m2 K was observed with
the incorporation of the evaporative cooling.
Fig P-H Diagram Of The Conventional And Mist based Air Conditioning System
ISSN NO: 2454-1958 Special Issue Tech-Ed 2016 (International Conference) Page 147
Many studies report that reduced compressor discharge
pressures and the corresponding reduction of compression
ratios in a refrigeration cycle are advantageous when it comes
to HVAC energy saving and increasing its service time. There
are, however, some solutions to significantly lower compressor discharge pressures whilst preventing
the flash vapour occurrence. For example, pre-cooling the ambient air before it reaches the air-cooled condenser of the vapour compression cooling systems can reduce the condensing temperatures to drop the condensing pressure.
Yu and Chen investigated how the coefficient of
performance (COP) of air-cooled chillers can be improved
by using mist pre-cooling. They estimated around 18% decrease in the annual electricity usage could be achieved with mist pre-cooling of air entering the air-cooled condenser of chiller, used to serve a hotel in a sub-tropical climate. The
application of LPA8 to air cooled air conditioning systems can
assist in achieving a considerable reduction in compressor discharge pressure. LPA can be realized with a hermetically-sealed, magnetically-driven liquid refrigerant pump installed in the liquid line between the condenser
and expansion valve. The LPA pump increases the pressure of the liquid refrigerant before it enters the expansion
valve. This method allows the condensing temperature to
fluctuate with ambient temperature changes, and hence,
reducing the condensing pressure and lowering overall energy
consumption.
METHODOLOGY: The Paper “MIST BASED HVAC PERFORMANCE
OPTIMISATION OF AIR CONDITIONING” relates to
highly efficient air conditioning units; and more specifically,
to a method of improving the efficiency of the air cooling
function in air conditioners by dispersing a Water or vapour
mist onto the condensers of air cooling units effectively and
efficiency thereby reducing the use of power by the condenser
and reducing the time the condenser must run. The proposed setup applies Water or mist to a condenser by
utilizing a mist dispersal system for dispersing Water or
vapour mists over a condenser unit. As described herein,
dispersing Water or vapor mist onto the condenser of an air
cooling unit, improves the efficiency of the air cooling
function in air conditioners. The setup provides a novel
project and method for increasing the efficiency of the air
conditioner. The heat transfer through the condenser can be increased by
spraying a fine mist of water on the condenser. This can be done with the help of a fine orifice nozzle attached to a supply
pipe of water. The condenser will be surrounded by a cage of
piping arrangement to which orifice will be connected. The
8 LPA – Liquid Pressure Amplification Pump
supply water will consists of condensate of air conditioner & make up water. The supply water contains sediments & suspended solid
particles which deposits as a hard layer on the condenser tubes
so compensation is made on the heat transfer rate for the
protection of condenser tubes which involves a coating of
Teflon FEP on the condenser tubes. This eliminates the risk of
hard deposited scaling layer over condenser. This arrangement facilitates the efficient utilization of energy
by reducing compressor work and increasing heat transfer rate.
CALCULATION: Based on the modifications of our project, we have stated the effect on heat transfer rate theoretically. The following are the
calculation which shows the percentage increase in the length of copper tubes. For Bare Copper tube:
= 1 { 1 + 1 ln 2 + 1 }
2
1
ℎ 1 ℎ
For coated Copper Tube with Teflon:
= 1 { 1 + 1 ln 2 + 1 ln( 3 ) + 1 }
2 ℎ
1 2
1 2 ℎ
Where:
K1 = 375 W/mK
K2 = 0.25 W/mK
ha= 10 0 w/m
2 r1 = 6.15*10
-3m
r2 = 6.35*10-3
m
r3 = 6.39*10-3
m
=
1 [
1 + 1
ln 6.35 ∗ 10−3
1 2 ∗ 1 10 ∗ 6.15 ∗ 10−3 375
6.15 ∗ 10−3
+
1
]
10 ∗ 6.35 ∗ 10−3 = 5.0942 1
= 1 { 1 + 1 ln 6.35 ∗ 10−3
2
2 ∗ 1 10 ∗ 6.15 ∗ 10−3
375
6.15 ∗ 10−3
1 6.39 ∗ 10−3 1
+
ln(
) +
}
. 25 6.35 ∗ 10
−3
−3
10 ∗ 6.39 ∗ 10
ISSN NO: 2454-1958 Special Issue Tech-Ed 2016 (International Conference) Page 148

2 = 5.0825 % of Increase Q = 1− 2
1
CONCLUSION: The dependency of air cooled condensers on the ambient air
temperature prevents it from giving a constant performance.
Here the water cooled condensers prove beneficial as their
performance is independent of the atmospheric temperature. A
golden mean has to be achieved. There are lot of
investigations carried out on the performance improvement of
air cooled condensers using evaporative cooling. The
evaporative cooling is generally achieved by evaporating
some portion of water which will cool the remaining water.
The evaporating cooling may be direct or indirect. Depending
upon the atmospheric conditions and system parameters either
may be more effective. From the papers reviewed here it can
be concluded that the performance of air cooled condensers
can be improved up to some extent. Many different methods
like using cooling media, water mist spraying etc. can be
used.There is scope for exploring different cooling media’s. Many other different innovative methods for evaporative cooling can still be developed. Based on the research, we have reached to a conclusion that by using a mist box arrangement, we can improve the
performance
Q = 5.0825 −5.0942 5.0942 Q = 2.2967*10−3
= 0.2296% REFERENCES:
1. Yu, F.W, Chan, K.T. 2005. Energy signatures for assessing the energy performance of chillers Energy
and Buildings. Vol. 37, pp 739-746. 2. Wen-jei yang and D. W. Clark Spray Cooling of Air
cooled compact heat exchanger. 3. A text book of Refrigeration and air conditioning by
R.S Khurmi and J.K Gupta, Edition 2006, Page 43 4. Engineering Thermodynamics, Fourth Edition by
P.K Nag, Page 583 5. Air conditioning and refrigeration by Rex Miller and
Mark R. Miller, Page 56 6. Refrigeration and air conditioning by G.F Hundy,
Page 16 7. Engineering Thermodynamics, Fourth Edition by
P.K Nag, Page 583 8. A text book of Refrigeration and air conditioning by
R.S Khurmi and J.K Gupta, Edition 2006, Page 44
ISSN NO: 2454-1958 Special Issue Tech-Ed 2016 (International Conference) Page 149

IMPORTANCE OF RENEWABLE ENERGY IN
AGRICULTURE Shubham Thakre Shrikant Kothari Mr.Vishwjeet.V.Ambade
Tulsiramji Gaikwad- Patil College Tulsiramji Gaikwad- Patil College Assistant Professor,Tulsiramji of Engineering, Buttibori of Engineering, Buttibori Gaikwad- Patil College of
Nagpur,441108(MS)India Nagpur,441108(MS)India Engineering, Buttibori
,Shubham Sarde Nitin Mirge Nagpur,441108(MS)India Tulsiramji Gaikwad- Patil College Tulsiramji Gaikwad- Patil College
of Engineering, Buttibori of Engineering, Buttibori
Nagpur,441108(MS)India Nagpur,441108(MS)India,
Abstract-
Energy is one of the major parameters for establishing growth
and progress of the country, rather the standard of living
depends directly upon the per capita energy consumption. Most
of energy on the earth is received from the sun. Solar energy
creates circulation of wind and ocean water, causes water
evaporation and consequent precipitation. Plants use solar
energy for photosynthesis and store carbohydrates, protein, fats, oils, alcohols, cellulose and lignin.. In agricultural systems, energy Keywords: Photosynthesis, Yard, Manure, Agrochemicals I. INTRODUCTION Use of renewable energy in farming systems can mean several
different things. For example, fossil fuels such as oil are non-
renewable, so finding alternative ways of fertilizing the land
and controlling pests that do not depend on chemicals, will
normally involve the use of renewable resources. Such
methods reduce farmers‟ vulnerability to the rising price of
oil. Renewable energy also includes generation of power to do
a number of farm tasks: pumping water for irrigation, for
livestock or for domestic use; lighting farm buildings;
powering processing operations and others. These forms of
renewable energy include solar energy, wind and water
power, oil from plants, wood from sustainable sources, other
forms of biomass (plant material), and biogas (gas produced
from fermentation of manure and crop residues). II. SOLAR ENERGY Widespread use of solar energy for domestic, agricultural and
agro-industrial activities has been practiced almost since the
development of civilization. Increasing threat of acute
shortage of the commercial sources of energy coupled with
serious environmental pollution problems has accelerated
interest in the scientific exploitation of renewable sources of
energy. Energy available from the sun is inexhaustible and
environment friendly. Therefore, the solar energy technologies are likely to play an
important role in the near future through a variety ofthermal applications and decentralized power generation and
is available from different sources as human, animal, sun, wind, biomass, coal, fertilizer, seed, agro-chemicals, petroleum products,
electricity etc. Energy sources that release availableenergy directly to the system are classified as direct energy sources. Renewable energy
and farming are a winning combination. Wind, solar, and biomass energy can be harvested forever, providing farmers with a long-term
source of income. This paper is an overview of renewable energy uses for farmers and ranchers on how they can help make renewable
a growing source of energy and rural income in India.
distribution systems. The power from the sun intercepted by
the earth is approximately 1.8 x l0ll MW. This makes it one of
the most promising unconventional energy sources. Solar energy is available in abundance in most part of our country throughout the year. In India,' the annual average daily solar radiation received over the whole of the country is around
1800 J/cm2/day. Drying of various agricultural produce in
open sunlight is an age-old practice. Development of various solar devices for thermal applications such as water heating and space heating, drying, cooking and power generation began during the most centuries.
Fig.1Solar PV panels providing green energy for agricultural growth 2.1. Solar cookers Two different types of solar cookers i.e. indirect and direct
focusing type have been developed in the country. The
indirect type solar cookers consisting of an insulated box with
transparent window through which sunlight enters into the box ISSN NO: 2454-1958 Special Issue Tech-Ed 2016 (International Conference) Page 150

have been satisfactorily developed and commercially
exploited for domestic cooking. Such solar cookers are being
marketed on commercial scale in most of the states through
State Energy Development Corporations or other nodal
agencies of the Ministry of Non-conventional Energy Sources
(MNES), Government of India.
2.2. Solar dryers Open sun drying of various agricultural produce is the most
common application of solar energy. With the objective of
increasing the drying rate and improving quality of the
produce, natural convection and forced convection type solar
dryers have been developed for various commodities. The
movement of air in the forced convection solar dryer is
through a power blower whereas in natural convection solar
dryer air moves through the produce due to natural thermal
gradient.
Fig.2 Rice grains dried using solar Dryer 2.3. Solar water heater Water heating is one of the most common applications of
solar energy for domestic and industrial applications. Similar
to solar dryers, water heating systems are also available in
natural convection and forced convection designs. Natural
convection water heating system is known as thermo syphon
water heating system.It consists of a flat plate solar collector,
insulated water storage tank and necessary insulated pipe
fittings.
. Fig3. Solar Water Heating system
2.4. Solar photovoltaic systems In solar photovoltaic (SPV) technology the solar radiation
falling on a device called solar cells and is converted directly
into electricity without any environmental pollution. Spy
pumping systems are ideal for lifting water for drinking and
irrigation without harming the environment. These pumps can
be installed in boreholes, tanks, cisterns or rivers. DC surface
pumps are designed for high flow rates at low heads. DC
floating pumps are suitable for wide range of flow and head
situations. III. HOW WIND ENERGY CAN HELP FARMERS Farmers and ranchers are in a unique position to benefit from
the growth in the wind industry. To tap this market, farmers
can lease land to wind developers, use the wind to generate
power for their farms, or become wind power producers
themselves. Farmers and ranchers can generate their own
power from the wind .Small wind generators, ranging from
400 watts to 40 kilowatts or more, can meet the needs of an
entire farm or can be targeted to specific applications. In
Texas and the West, for example, many ranchers use wind
generators to pump water for cattle. Electric wind generators
are much more efficient and reliable than the old water-
pumping fan-bladed windmills. They may also be cheaper
than extending power lines and are more convenient and
cheaper than diesel generators. "Net metering" enables farmers to get the most out of their
wind turbines. When a turbine produces more power than the
farm needs at that moment, the extra power flows back into the electricity system for others to use, turning the electric
meter backwards. When the turbine produces less than the farm is using, the meter spins forward, as it normally does. At the end of the month or year, the farmer pays for the net
consumption or the electric company pays for the net
production. Net metering rules and laws are in place in most
states.
ISSN NO: 2454-1958 Special Issue Tech-Ed 2016 (International Conference) Page 151
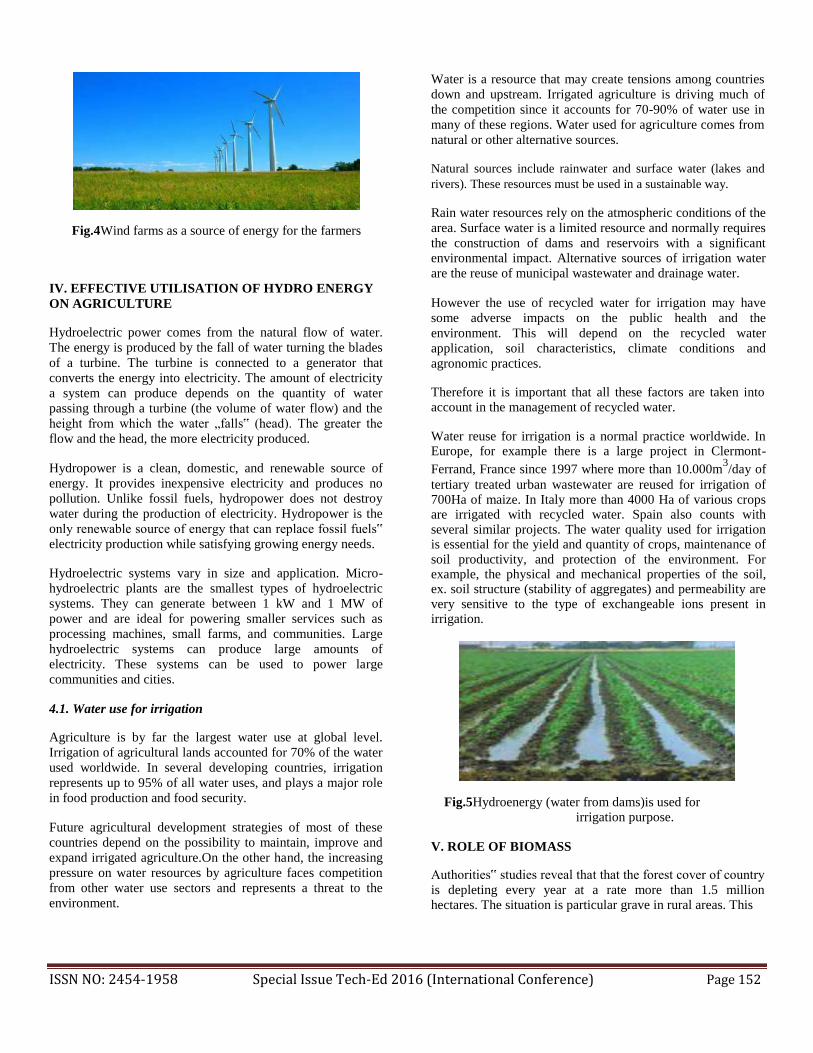
Fig.4Wind farms as a source of energy for the farmers
IV. EFFECTIVE UTILISATION OF HYDRO ENERGY ON AGRICULTURE Hydroelectric power comes from the natural flow of water.
The energy is produced by the fall of water turning the blades
of a turbine. The turbine is connected to a generator that
converts the energy into electricity. The amount of electricity
a system can produce depends on the quantity of water
passing through a turbine (the volume of water flow) and the
height from which the water „falls‟ (head). The greater the
flow and the head, the more electricity produced. Hydropower is a clean, domestic, and renewable source of
energy. It provides inexpensive electricity and produces no
pollution. Unlike fossil fuels, hydropower does not destroy
water during the production of electricity. Hydropower is the
only renewable source of energy that can replace fossil fuels‟
electricity production while satisfying growing energy needs. Hydroelectric systems vary in size and application. Micro-
hydroelectric plants are the smallest types of hydroelectric
systems. They can generate between 1 kW and 1 MW of
power and are ideal for powering smaller services such as
processing machines, small farms, and communities. Large
hydroelectric systems can produce large amounts of
electricity. These systems can be used to power large
communities and cities. 4.1. Water use for irrigation Agriculture is by far the largest water use at global level.
Irrigation of agricultural lands accounted for 70% of the water
used worldwide. In several developing countries, irrigation
represents up to 95% of all water uses, and plays a major role
in food production and food security. Future agricultural development strategies of most of these
countries depend on the possibility to maintain, improve and
expand irrigated agriculture.On the other hand, the increasing
pressure on water resources by agriculture faces competition
from other water use sectors and represents a threat to the
environment.
Water is a resource that may create tensions among countries
down and upstream. Irrigated agriculture is driving much of
the competition since it accounts for 70-90% of water use in
many of these regions. Water used for agriculture comes from
natural or other alternative sources. Natural sources include rainwater and surface water (lakes and
rivers). These resources must be used in a sustainable way.
Rain water resources rely on the atmospheric conditions of the
area. Surface water is a limited resource and normally requires
the construction of dams and reservoirs with a significant environmental impact. Alternative sources of irrigation water
are the reuse of municipal wastewater and drainage water. However the use of recycled water for irrigation may have
some adverse impacts on the public health and the
environment. This will depend on the recycled water
application, soil characteristics, climate conditions and
agronomic practices. Therefore it is important that all these factors are taken into account in the management of recycled water. Water reuse for irrigation is a normal practice worldwide. In Europe, for example there is a large project in Clermont-
Ferrand, France since 1997 where more than 10.000m3/day of
tertiary treated urban wastewater are reused for irrigation of 700Ha of maize. In Italy more than 4000 Ha of various crops are irrigated with recycled water. Spain also counts with several similar projects. The water quality used for irrigation is essential for the yield and quantity of crops, maintenance of soil productivity, and protection of the environment. For example, the physical and mechanical properties of the soil, ex. soil structure (stability of aggregates) and permeability are very sensitive to the type of exchangeable ions present in irrigation.
Fig.5Hydroenergy (water from dams)is used for irrigation purpose.
V. ROLE OF BIOMASS Authorities‟ studies reveal that that the forest cover of country
is depleting every year at a rate more than 1.5 million hectares. The situation is particular grave in rural areas. This
ISSN NO: 2454-1958 Special Issue Tech-Ed 2016 (International Conference) Page 152
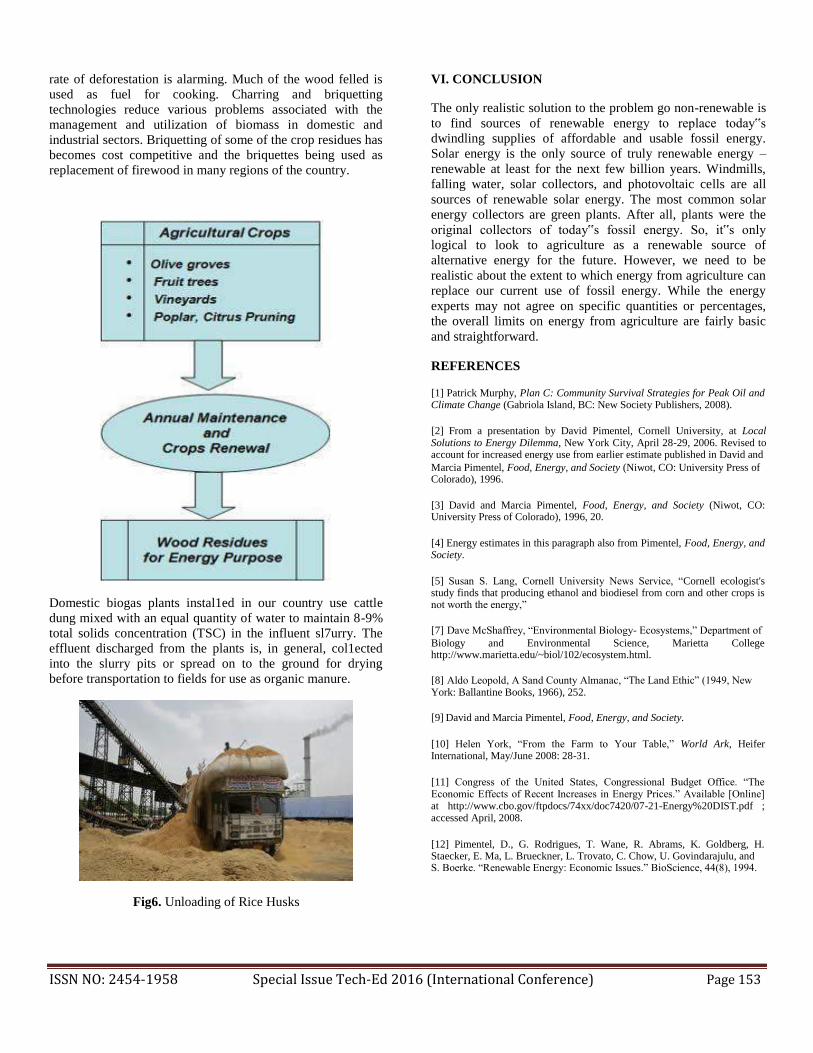
rate of deforestation is alarming. Much of the wood felled is
used as fuel for cooking. Charring and briquetting
technologies reduce various problems associated with the
management and utilization of biomass in domestic and
industrial sectors. Briquetting of some of the crop residues has
becomes cost competitive and the briquettes being used as
replacement of firewood in many regions of the country.
Domestic biogas plants instal1ed in our country use cattle
dung mixed with an equal quantity of water to maintain 8-9%
total solids concentration (TSC) in the influent sl7urry. The
effluent discharged from the plants is, in general, col1ected
into the slurry pits or spread on to the ground for drying
before transportation to fields for use as organic manure.
Fig6. Unloading of Rice Husks
VI. CONCLUSION The only realistic solution to the problem go non-renewable is
to find sources of renewable energy to replace today‟s
dwindling supplies of affordable and usable fossil energy.
Solar energy is the only source of truly renewable energy –
renewable at least for the next few billion years. Windmills,
falling water, solar collectors, and photovoltaic cells are all
sources of renewable solar energy. The most common solar
energy collectors are green plants. After all, plants were the
original collectors of today‟s fossil energy. So, it‟s only
logical to look to agriculture as a renewable source of
alternative energy for the future. However, we need to be
realistic about the extent to which energy from agriculture can
replace our current use of fossil energy. While the energy
experts may not agree on specific quantities or percentages,
the overall limits on energy from agriculture are fairly basic
and straightforward.
REFERENCES [1] Patrick Murphy, Plan C: Community Survival Strategies for Peak Oil and Climate Change (Gabriola Island, BC: New Society Publishers, 2008).
[2] From a presentation by David Pimentel, Cornell University, at Local Solutions to Energy Dilemma, New York City, April 28-29, 2006. Revised to account for increased energy use from earlier estimate published in David and Marcia Pimentel, Food, Energy, and Society (Niwot, CO: University Press of Colorado), 1996.
[3] David and Marcia Pimentel, Food, Energy, and Society (Niwot, CO: University Press of Colorado), 1996, 20.
[4] Energy estimates in this paragraph also from Pimentel, Food, Energy, and Society.
[5] Susan S. Lang, Cornell University News Service, “Cornell ecologist's study finds that producing ethanol and biodiesel from corn and other crops is not worth the energy,”
[7] Dave McShaffrey, “Environmental Biology- Ecosystems,” Department of Biology and Environmental Science, Marietta College http://www.marietta.edu/~biol/102/ecosystem.html.
[8] Aldo Leopold, A Sand County Almanac, “The Land Ethic” (1949, New York: Ballantine Books, 1966), 252.
[9] David and Marcia Pimentel, Food, Energy, and Society.
[10] Helen York, “From the Farm to Your Table,” World Ark, Heifer International, May/June 2008: 28-31.
[11] Congress of the United States, Congressional Budget Office. “The Economic Effects of Recent Increases in Energy Prices.” Available [Online] at http://www.cbo.gov/ftpdocs/74xx/doc7420/07-21-Energy%20DIST.pdf ; accessed April, 2008.
[12] Pimentel, D., G. Rodrigues, T. Wane, R. Abrams, K. Goldberg, H. Staecker, E. Ma, L. Brueckner, L. Trovato, C. Chow, U. Govindarajulu, and S. Boerke. “Renewable Energy: Economic Issues.” BioScience, 44(8), 1994.
ISSN NO: 2454-1958 Special Issue Tech-Ed 2016 (International Conference) Page 153

[13] Gieleck, Mark i, F. Mayes, and L. Prete. “Incentives, Mandates, and Government Programs for Promoting Renewable Energy.” Available [Online] at
http://www.eia.doe.gov/cneaf/solar.renewables/rea_issues/incent.html;
accessed April, 2008.
[14] Smith, J. R., W. Richards, D. Acker, B. Flinchbaugh, R. Hahn; R. Heck, B. Horan, G. Keppy, A. Rider, D. Villwock, S. Wyant, and E. Shea. “25 by 25 Agriculture‟s Role in Ensuring U.S. Energy Independence.” Available [Online] at http://www.bio.org/ind/25x25.pdf; accessed April, 2008.
[15] ERS/USDA Briefing Room. “Farm and Commodity Policy: Basics of U.S. Agricultural Policy.” Available [Online] at http://www.ers.usda.gov/Briefing/FarmPolicy/BasicsOfPolicy.htm; accessed April, 2008.
[16] Steve, J., A. Severn, B. Raum. “Renewable Portfolio Standard (RPS).” Available [Online] at http://www.awea.org/legislative/pdf/RPS%20factsheet%20Dec% 202007.pdf; accessed April, 2008.
[17] U.S. Department of Energy. “States with Renewable Portfolio Standards.” Available [Online] at http://www.eere.energy.gov/states/maps/renewable_portfolio_states.cfm; accessed April, 2008.
[18] Huang, M., J. Alavalapat, D. Carter and M. Langholtz. “Is the choice of renewable portfolio standards random?” Available [Online] at http://www.sciencedirect.com/science/article/B6V2W-4P8H8GV-3/2/a284935 444d89c72f9026d3ab21d445c; accessed April, 2008.
ISSN NO: 2454-1958 Special Issue Tech-Ed 2016 (International Conference) Page 154

“DESIGN AND FABRICATION OF REVERSE
GEAR MECHANISM IN HANDICAPPED PERSON
VEHICLE-
AN OVERVIEW”
A.S Puttewar Assistant Professor, Department of Mechanical
Engineering, Dr. Babasaheb Ambedkar College of Engineering and Research,Wanadongri, NAGPUR –
441110,
Krishna Yadav
Undergraduate Students, Department of Mechanical Engineering, Dr. Babasaheb Ambedkar College of
Engineering and Research,Wanadongri, NAGPUR – 441110
Ketan Warjurkar
Undergraduate Students, Department of Mechanical Engineering, Dr. Babasaheb Ambedkar College of
Engineering and Research,Wanadongri, NAGPUR –
441110
ABSTRACT Mobility of physically disabled persons is a concerning
social issue nowadays.In case of the handicapped people,
who drive two wheelers with extra support wheels face
much problem to take the vehicle out of the parking by
pushing the vehicle with legs. In order to take the vehicle
out of the parking, they need to seek others help or they
should push it out of the parking. As a help to them this
research paper aims at designing and fabrication a reverse
gear mechanism, which will be fitting to the vehicle with
little modifications of the existing mechanism. Keywords: Mobility, Handicapped person, reverse
gear mechanism.
Latikesh Khedkar
Undergraduate Students, Department of Mechanical Engineering, Dr. Babasaheb Ambedkar College of
Engineering and Research,Wanadongri, NAGPUR – 441110
Ashwin Gajbhiye
Undergraduate Students, Department of Mechanical Engineering, Dr. Babasaheb Ambedkar College of
Engineering and Research,Wanadongri, NAGPUR – 441110
Bhimrao Devtale
Undergraduate Students, Department of Mechanical Engineering, Dr. Babasaheb Ambedkar College of
Engineering and Research,Wanadongri, NAGPUR – 441110
I. INTRODUCTION Nowadays, the intensity of traffic on Indian roads is increasing
at high pace.As in this date there are many options for
transportation available for physically challenged persons like,
Motorized wheel chair, Hand powered tri-cycle, Scooters..etc.
The problem associated with motorized wheel chair is that it
way too costly and is not suitable for commuting. Hand
powered tri-cycle requires heavy human effort. So, disable
people, now days prefer two wheelers as better mode of
transportation.Since it is comfortable and cost efficient.The
major problem associated with the two wheelers that are
available in India is that they don‟t have provision for
reversing the scooter which is very much necessary for a
disable person. In order to overcome this drawback, we‟ve
designed and fabricated a vehicle with reverse mode. ISSN NO: 2454-1958 Special Issue Tech-Ed 2016 (International Conference) Page 155

II. LITERATURE REVIEW G.Satish Kumar, et al. [1] This research paper gives
the detail about designed a gear box which will be fit to the
rear side of vehicle without altering the existing gear
box.Vinod K. Banthia, et. al [2] This research work deals with
feasible design solution in form of a user friendly three
wheeler vehicle, which allows physically challenged people to
commute on their own and perform their activities without
anyone‟s assistance, has been proposed.Sandesh G.Ughade, et
al. [3] This paper gives the details about the solar power
tricycle project and includes the methods and considerations
regarding the proper working of the tricycle.Ajit A. Mohekar,
et al. [4] This paper discusses an attempt to design and
fabricate a retrofitted tricycle for disabled people. This
tricycle is specifically designed to suit wheelchair
occupants.Arpit Mehra, et al. [5] In this paper, an attractive
modern electric car also called Electro Handy has been
designed for handicapped people. Electro Handy is a powerful
car for disabled people powered by rechargeable battery.
After going through the exhaustive literature survey, we
very well understood that it is very difficult for handicapped
person to drive the vehicle on the road due to heavy intensity
and as well as for parking and un parking vehicle. III. METHODOLOGY The following methodology is adopted for the designing and fabrication of the reverse gear mechanism:
Design Calculations.
Identification of components.
Fabrication and assembly of mechanism.
Inspection and Testing.
Result and Conclusion.
IV. PROPOSED SKETCH
Gearbox Conceptual Sketch
V.DESIGN CALCULATION
Design of gear box: Concept: The engine drives provides the power to the gear box and the gear gives out the power to the rear wheel in two direction .when output in clockwise direction the vehicle move forward
and when the output is in counter clockwise direction vehicle
moves backward. Thus reversing of the vehicle can be
achieved. The following calculations are to be performing for the designing and fabrication of the reverse gear mechanism.
(1) Design of gear box.
Input Gear.
Intermediate Gear.
Output Gear.
Gear ratio calculation.(2) Design of Shaft.
Input Shaft.
Intermediate Shaft.
Output Shaft.
(3)Design and selection of bearing.
(4)Design of frame.
(5)Selection of Suspension system.
VI. IDENTIFICATION OF COMPONENTS
Moped vehicle.
Two wheels with tyre.
Axel shaft.
Suspension system.
Gear box of autorikshaw‟s.
Frame.
Hand lever for shifting gear.
Vehicle
ISSN NO: 2454-1958 Special Issue Tech-Ed 2016 (International Conference) Page 156

[3]Sandesh G.Ughade, „„Literature Review on Solar Powered Tricycle for Handicapped Person”, International Journal for Innovative Research in Science & Technology, Volume 1, Issue 10, March 2015. [4]AjitA.Mohekar, „„DesignOfAn Innovative Retrofitted Tricycle For A Disabled Person”ISSSN, Volume No 4, Issue 07, July 2015. [5]Arpit Mehra, Arindam Ghosal, „„A 3- Wheels Electric Car For Physically Disabled People”, International Journal Of Innovative Technology And Exploring Engineering, ISSN: 2278-3075, Volume-3, Issue-11, April 2014. [6] V.Subrahmanyam, „„Fabrication of Tri-wheeled Electric Vehicle to Aid Disabled”, International Journal of Technology Enhancements and merging Engineering Research, Volume 3, Issue 04, ISSN 2347-4289,feb 2012. [7] R.S.Khurmi, Gupta - “Design of Machine Elements”, 14TH revisededition, 2013.
Tyre Axle shafts
Gearbox
Suspension system Frame
VII.CONCLUSION
Thus, by adopting the methodology as discussed above the
design and fabrication of vehicle will be carried out. The
designed vehicle will prove to be of great importance for the
handicapped persons and aid them in driving on the heavy
traffic intensity roads. Also it will provide a lot of comfort and
safety while driving. So, implementing our project will
surelyprovide mobility to all disabled people without any help
from others.
VIII. REFERENCES
[1]G.Satish Kumar, “Development and Implementation of Reverse Drive Mechanism in Bikes”, International Journal of scientific research, To fabricate the designed gear mechanism,volume3,Issue 11,ISSN No-2277-8179,nov 2014. [2]Vinod K. Banthia, “Design of Three Wheeler Vehicles for Physically Challenged People”, SAS Tech Journal, Volume 12, Issue 1, April 2013.
ISSN NO: 2454-1958 Special Issue Tech-Ed 2016 (International Conference) Page 157
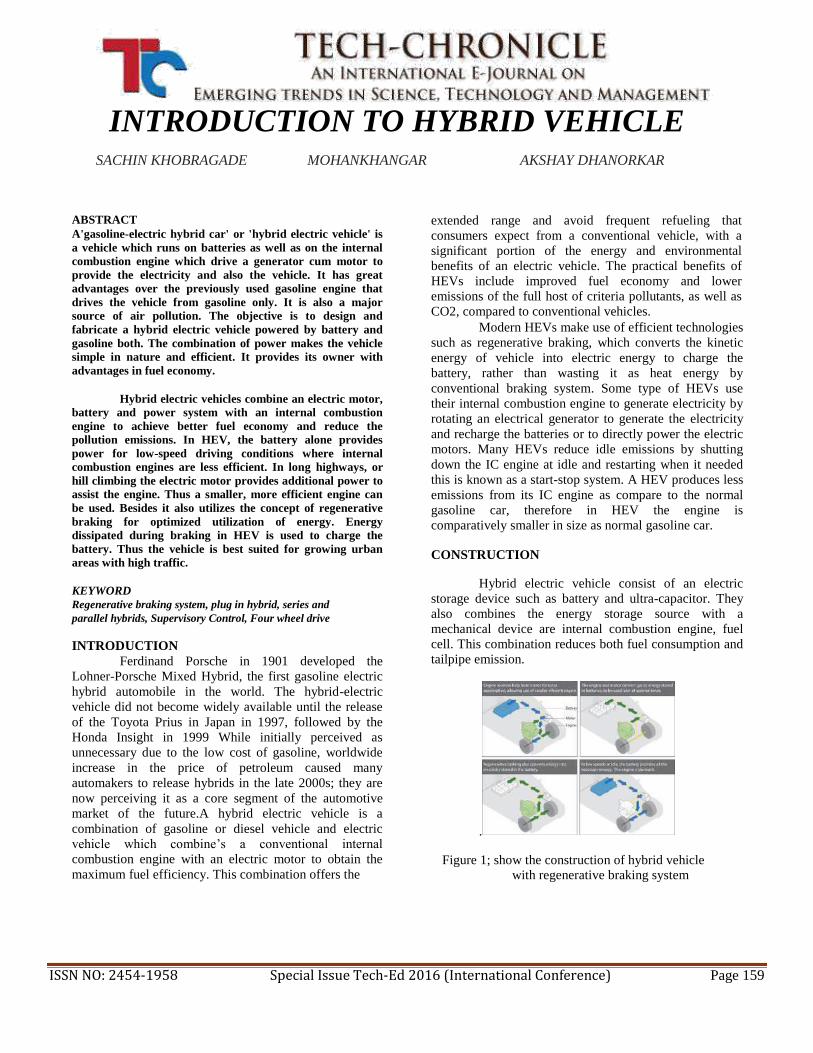
INTRODUCTION TO HYBRID VEHICLE SACHIN KHOBRAGADE MOHANKHANGAR AKSHAY DHANORKAR
ABSTRACT A'gasoline-electric hybrid car' or 'hybrid electric vehicle' is
a vehicle which runs on batteries as well as on the internal
combustion engine which drive a generator cum motor to
provide the electricity and also the vehicle. It has great
advantages over the previously used gasoline engine that
drives the vehicle from gasoline only. It is also a major
source of air pollution. The objective is to design and
fabricate a hybrid electric vehicle powered by battery and
gasoline both. The combination of power makes the vehicle
simple in nature and efficient. It provides its owner with
advantages in fuel economy.
Hybrid electric vehicles combine an electric motor,
battery and power system with an internal combustion
engine to achieve better fuel economy and reduce the
pollution emissions. In HEV, the battery alone provides
power for low-speed driving conditions where internal
combustion engines are less efficient. In long highways, or
hill climbing the electric motor provides additional power to
assist the engine. Thus a smaller, more efficient engine can
be used. Besides it also utilizes the concept of regenerative
braking for optimized utilization of energy. Energy
dissipated during braking in HEV is used to charge the
battery. Thus the vehicle is best suited for growing urban
areas with high traffic.
KEYWORD Regenerative braking system, plug in hybrid, series and
parallel hybrids, Supervisory Control, Four wheel drive
INTRODUCTION
Ferdinand Porsche in 1901 developed the
Lohner-Porsche Mixed Hybrid, the first gasoline electric
hybrid automobile in the world. The hybrid-electric
vehicle did not become widely available until the release
of the Toyota Prius in Japan in 1997, followed by the
Honda Insight in 1999 While initially perceived as
unnecessary due to the low cost of gasoline, worldwide
increase in the price of petroleum caused many
automakers to release hybrids in the late 2000s; they are
now perceiving it as a core segment of the automotive
market of the future.A hybrid electric vehicle is a
combination of gasoline or diesel vehicle and electric
vehicle which combine’s a conventional internal
combustion engine with an electric motor to obtain the
maximum fuel efficiency. This combination offers the
extended range and avoid frequent refueling that
consumers expect from a conventional vehicle, with a
significant portion of the energy and environmental
benefits of an electric vehicle. The practical benefits of
HEVs include improved fuel economy and lower
emissions of the full host of criteria pollutants, as well as
CO2, compared to conventional vehicles. Modern HEVs make use of efficient technologies
such as regenerative braking, which converts the kinetic
energy of vehicle into electric energy to charge the
battery, rather than wasting it as heat energy by
conventional braking system. Some type of HEVs use
their internal combustion engine to generate electricity by
rotating an electrical generator to generate the electricity
and recharge the batteries or to directly power the electric
motors. Many HEVs reduce idle emissions by shutting
down the IC engine at idle and restarting when it needed
this is known as a start-stop system. A HEV produces less
emissions from its IC engine as compare to the normal
gasoline car, therefore in HEV the engine is
comparatively smaller in size as normal gasoline car. CONSTRUCTION
Hybrid electric vehicle consist of an electric
storage device such as battery and ultra-capacitor. They
also combines the energy storage source with a
mechanical device are internal combustion engine, fuel
cell. This combination reduces both fuel consumption and
tailpipe emission.
.
Figure 1; show the construction of hybrid vehicle
with regenerative braking system ISSN NO: 2454-1958 Special Issue Tech-Ed 2016 (International Conference) Page 159
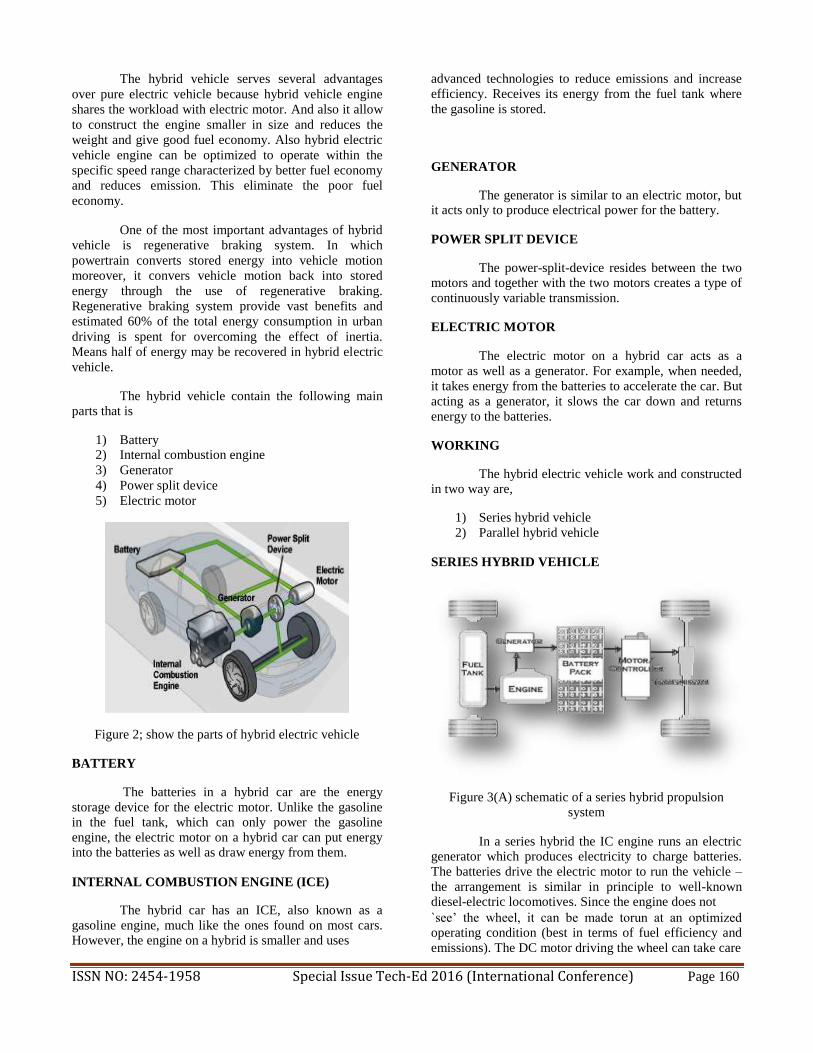
The hybrid vehicle serves several advantages
over pure electric vehicle because hybrid vehicle engine
shares the workload with electric motor. And also it allow
to construct the engine smaller in size and reduces the
weight and give good fuel economy. Also hybrid electric
vehicle engine can be optimized to operate within the
specific speed range characterized by better fuel economy
and reduces emission. This eliminate the poor fuel
economy.
One of the most important advantages of hybrid
vehicle is regenerative braking system. In which
powertrain converts stored energy into vehicle motion
moreover, it convers vehicle motion back into stored
energy through the use of regenerative braking.
Regenerative braking system provide vast benefits and
estimated 60% of the total energy consumption in urban
driving is spent for overcoming the effect of inertia.
Means half of energy may be recovered in hybrid electric
vehicle.
The hybrid vehicle contain the following main parts that is
1) Battery 2) Internal combustion engine
3) Generator 4) Power split device 5) Electric motor
Figure 2; show the parts of hybrid electric vehicle BATTERY
The batteries in a hybrid car are the energy
storage device for the electric motor. Unlike the gasoline in the fuel tank, which can only power the gasoline
engine, the electric motor on a hybrid car can put energy into the batteries as well as draw energy from them.
INTERNAL COMBUSTION ENGINE (ICE)
The hybrid car has an ICE, also known as a
gasoline engine, much like the ones found on most cars. However, the engine on a hybrid is smaller and uses
advanced technologies to reduce emissions and increase
efficiency. Receives its energy from the fuel tank where
the gasoline is stored.
GENERATOR
The generator is similar to an electric motor, but it acts only to produce electrical power for the battery.
POWER SPLIT DEVICE
The power-split-device resides between the two motors and together with the two motors creates a type of
continuously variable transmission.
ELECTRIC MOTOR
The electric motor on a hybrid car acts as a
motor as well as a generator. For example, when needed,
it takes energy from the batteries to accelerate the car. But
acting as a generator, it slows the car down and returns
energy to the batteries. WORKING
The hybrid electric vehicle work and constructed in two way are,
1) Series hybrid vehicle 2) Parallel hybrid vehicle
SERIES HYBRID VEHICLE
Figure 3(A) schematic of a series hybrid propulsion system
In a series hybrid the IC engine runs an electric
generator which produces electricity to charge batteries.
The batteries drive the electric motor to run the vehicle –
the arrangement is similar in principle to well-known diesel-electric locomotives. Since the engine does not `see’ the wheel, it can be made torun at an optimized operating condition (best in terms of fuel efficiency and
emissions). The DC motor driving the wheel can take care
ISSN NO: 2454-1958 Special Issue Tech-Ed 2016 (International Conference) Page 160
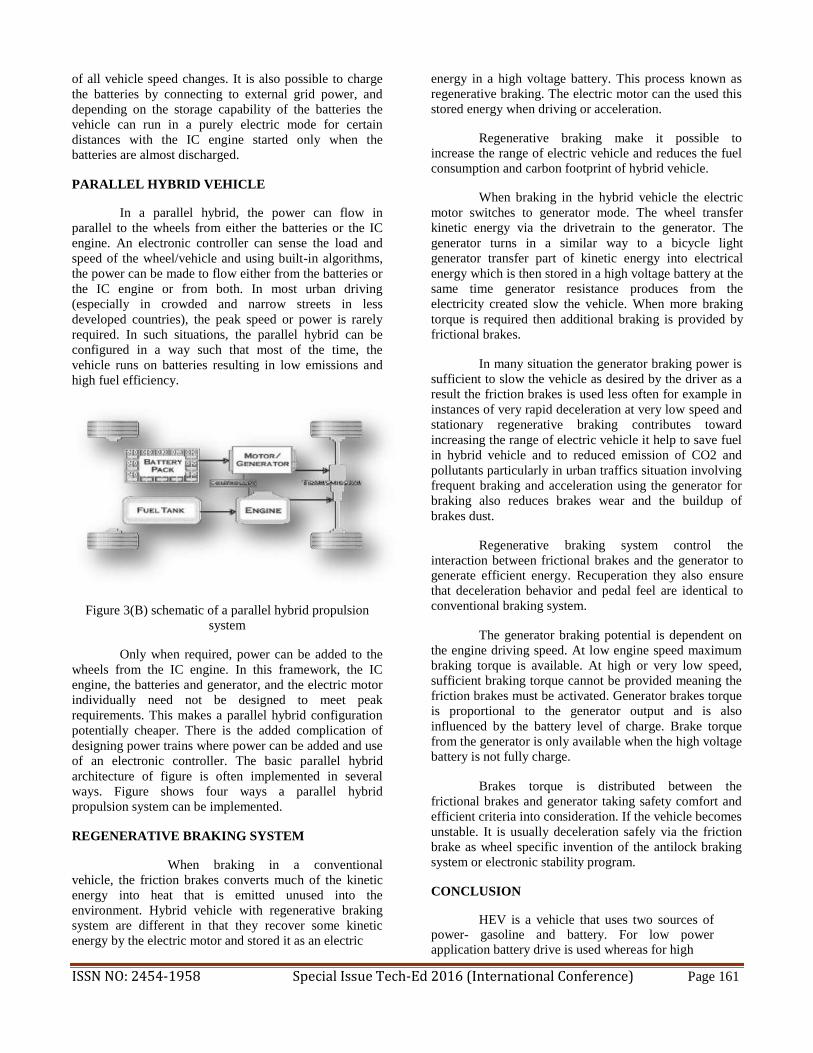
of all vehicle speed changes. It is also possible to charge
the batteries by connecting to external grid power, and
depending on the storage capability of the batteries the
vehicle can run in a purely electric mode for certain
distances with the IC engine started only when the
batteries are almost discharged. PARALLEL HYBRID VEHICLE
In a parallel hybrid, the power can flow in
parallel to the wheels from either the batteries or the IC
engine. An electronic controller can sense the load and
speed of the wheel/vehicle and using built-in algorithms,
the power can be made to flow either from the batteries or
the IC engine or from both. In most urban driving
(especially in crowded and narrow streets in less
developed countries), the peak speed or power is rarely
required. In such situations, the parallel hybrid can be
configured in a way such that most of the time, the
vehicle runs on batteries resulting in low emissions and
high fuel efficiency.
Figure 3(B) schematic of a parallel hybrid propulsion
system
Only when required, power can be added to the
wheels from the IC engine. In this framework, the IC
engine, the batteries and generator, and the electric motor
individually need not be designed to meet peak
requirements. This makes a parallel hybrid configuration
potentially cheaper. There is the added complication of
designing power trains where power can be added and use
of an electronic controller. The basic parallel hybrid
architecture of figure is often implemented in several
ways. Figure shows four ways a parallel hybrid
propulsion system can be implemented. REGENERATIVE BRAKING SYSTEM
When braking in a conventional
vehicle, the friction brakes converts much of the kinetic
energy into heat that is emitted unused into the
environment. Hybrid vehicle with regenerative braking
system are different in that they recover some kinetic
energy by the electric motor and stored it as an electric
energy in a high voltage battery. This process known as
regenerative braking. The electric motor can the used this
stored energy when driving or acceleration.
Regenerative braking make it possible to
increase the range of electric vehicle and reduces the fuel
consumption and carbon footprint of hybrid vehicle.
When braking in the hybrid vehicle the electric
motor switches to generator mode. The wheel transfer
kinetic energy via the drivetrain to the generator. The
generator turns in a similar way to a bicycle light
generator transfer part of kinetic energy into electrical
energy which is then stored in a high voltage battery at the
same time generator resistance produces from the
electricity created slow the vehicle. When more braking
torque is required then additional braking is provided by
frictional brakes.
In many situation the generator braking power is
sufficient to slow the vehicle as desired by the driver as a
result the friction brakes is used less often for example in
instances of very rapid deceleration at very low speed and
stationary regenerative braking contributes toward
increasing the range of electric vehicle it help to save fuel
in hybrid vehicle and to reduced emission of CO2 and
pollutants particularly in urban traffics situation involving
frequent braking and acceleration using the generator for
braking also reduces brakes wear and the buildup of
brakes dust.
Regenerative braking system control the
interaction between frictional brakes and the generator to generate efficient energy. Recuperation they also ensure
that deceleration behavior and pedal feel are identical to
conventional braking system.
The generator braking potential is dependent on
the engine driving speed. At low engine speed maximum
braking torque is available. At high or very low speed,
sufficient braking torque cannot be provided meaning the
friction brakes must be activated. Generator brakes torque
is proportional to the generator output and is also
influenced by the battery level of charge. Brake torque
from the generator is only available when the high voltage
battery is not fully charge.
Brakes torque is distributed between the
frictional brakes and generator taking safety comfort and
efficient criteria into consideration. If the vehicle becomes
unstable. It is usually deceleration safely via the friction
brake as wheel specific invention of the antilock braking
system or electronic stability program. CONCLUSION
HEV is a vehicle that uses two sources of power- gasoline and battery. For low power application battery drive is used whereas for high
ISSN NO: 2454-1958 Special Issue Tech-Ed 2016 (International Conference) Page 161
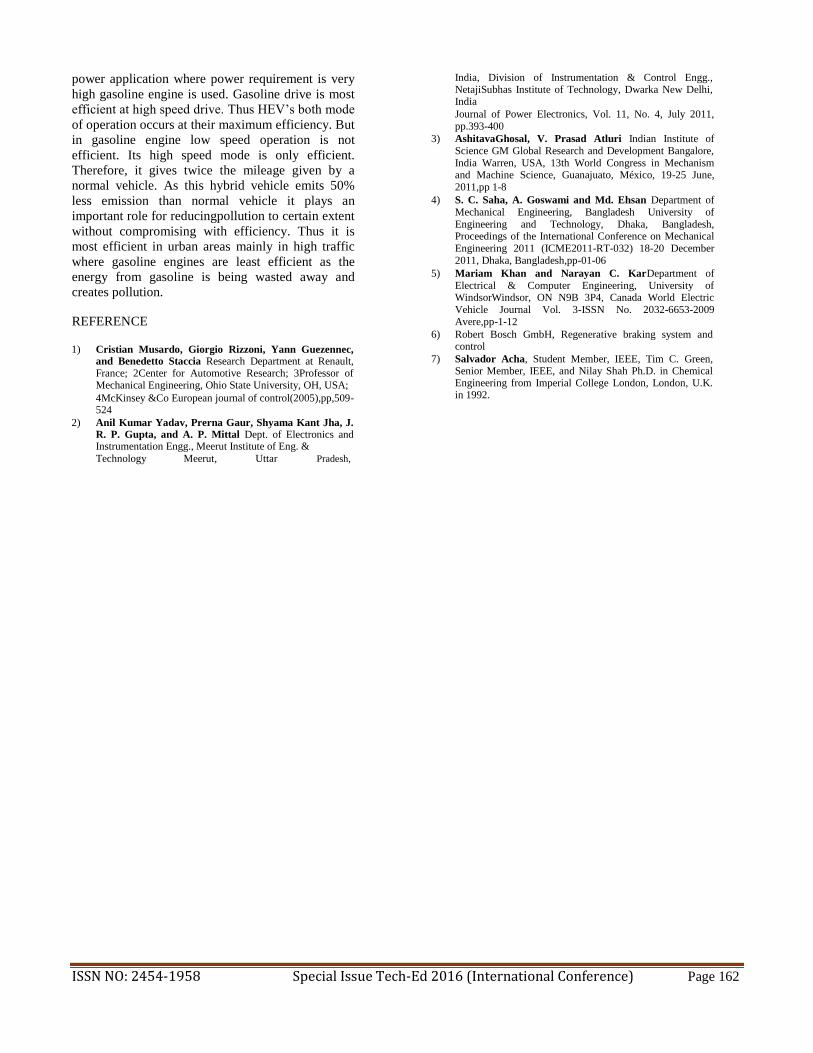
power application where power requirement is very
high gasoline engine is used. Gasoline drive is most
efficient at high speed drive. Thus HEV’s both mode
of operation occurs at their maximum efficiency. But
in gasoline engine low speed operation is not
efficient. Its high speed mode is only efficient.
Therefore, it gives twice the mileage given by a
normal vehicle. As this hybrid vehicle emits 50%
less emission than normal vehicle it plays an
important role for reducingpollution to certain extent
without compromising with efficiency. Thus it is
most efficient in urban areas mainly in high traffic
where gasoline engines are least efficient as the
energy from gasoline is being wasted away and
creates pollution. REFERENCE 1) Cristian Musardo, Giorgio Rizzoni, Yann Guezennec,
and Benedetto Staccia Research Department at Renault, France; 2Center for Automotive Research; 3Professor of Mechanical Engineering, Ohio State University, OH, USA; 4McKinsey &Co European journal of control(2005),pp,509-524
2) Anil Kumar Yadav, Prerna Gaur, Shyama Kant Jha, J. R. P. Gupta, and A. P. Mittal Dept. of Electronics and Instrumentation Engg., Meerut Institute of Eng. &
Technology Meerut, Uttar Pradesh,
India, Division of Instrumentation & Control Engg., NetajiSubhas Institute of Technology, Dwarka New Delhi, India Journal of Power Electronics, Vol. 11, No. 4, July 2011, pp.393-400
3) AshitavaGhosal, V. Prasad Atluri Indian Institute of Science GM Global Research and Development Bangalore, India Warren, USA, 13th World Congress in Mechanism and Machine Science, Guanajuato, México, 19-25 June, 2011,pp 1-8
4) S. C. Saha, A. Goswami and Md. Ehsan Department of Mechanical Engineering, Bangladesh University of Engineering and Technology, Dhaka, Bangladesh, Proceedings of the International Conference on Mechanical Engineering 2011 (ICME2011-RT-032) 18-20 December 2011, Dhaka, Bangladesh,pp-01-06
5) Mariam Khan and Narayan C. KarDepartment of Electrical & Computer Engineering, University of WindsorWindsor, ON N9B 3P4, Canada World Electric Vehicle Journal Vol. 3-ISSN No. 2032-6653-2009 Avere,pp-1-12
6) Robert Bosch GmbH, Regenerative braking system and control
7) Salvador Acha, Student Member, IEEE, Tim C. Green, Senior Member, IEEE, and Nilay Shah Ph.D. in Chemical Engineering from Imperial College London, London, U.K. in 1992.
ISSN NO: 2454-1958 Special Issue Tech-Ed 2016 (International Conference) Page 162

FINITE ELEMENT ANALYSIS OF
RECIPROCATING SCREW FOR MINIMIZING
THE WEAR OF SCREW IN INJECTION
MOULDING MACHINE
Anil H. Ingle
Associate Prof & Head,
Department of Mechanical Engineering,
SRPCE, Nagpur, India.
Email:[email protected]
+91 9923279424 Abstract
Injection moulding machine is used in the industries
for manufacturing or fabrication of the plastic parts. The
screw issubjected to different temperature zones. It is the most
critical components of the injection moulding machine. The
raw granules of plastic is melted in the injection moulding
machine and injected into the mould .The material is feed into
the hopper in the granules form. The barrel contains
reciprocating screw for infusing the material into the mould
and material is additionally liquefied into the barrel. The issue
happen in the screw of machine which is wearing of screw
because of influence of mould temperature and utilizing 30%
glass field material i. e. Nylon, low thickness polypropylene,
polystyrene ,PVC etc. The industries are having temporary
solutions but it is not so effective in improving life of the screw,
because the stresses will be more in machined screw on lathe
machine as compared to normal screw. Hence, the modeling
and analysis technique is used to solve the problem.This
project deals with, the solution of problem occurred for
reciprocating screw of Injection molding machine. It identifies
andsolves the problem by using the modeling and analysis
techniques. The problem occurred in the reciprocating screw
of machine which is wearing of threads due to effect of
temperature of mold materials (flow materials). Keywords— reciprocating screw, Barrel, and mould, wear,
Plastic Injection moldingmachine.Pro-E 5.0 and Ansys R15
INTRODUCTION
Injection moulding is the most commonly used
manufacturing process for the fabrication of plastic parts. A
wide variety of products are manufactured using injection
moulding machine, such as plastics housings, consumer
electronics , medical devices including valves and syringes
which vary greatly in their size, complexity and application.
The plastic is melted in the injection moulding machine and
then injected into the mould, where it cools and solidifies
into the final part. The injection moulding process
Krunali R. Charpe
Asst. Professor
Department of Mechanical Engineering,
SRPCE, Nagpur, India.
Email:[email protected]
+91 9503404491
requiresthe use of raw plastic material, and a mould. The
barrel contains the mechanism for heating and injecting the
material into the mould. The reciprocating screw advance
the material forwarded by either a hydraulic or electric
motor. During this process material is melted by heat and
pressure. The material enters the grooves of the screw. The
screw completes the shot volume and retunes to reverse
position. Due to the effect of high melting temperature and
pressure of mold material the problem is occurred in the
reciprocating screw. To make repair of threads on the lathe
machine industries are having this temporary solution. This
reduces weight and strength of screw resulting misalignment
in assembly. The screw is the crucial part of the screw. The
material for the screw is Latrobe LSS 01 Tool steel (ASTM
01) OHNS, and other alternate materials areAISI Type 06
Tool Steel , HSS 142 Tool steel. Fig 1.Injection molding machine arrangement Description of machine a) Injection system
ISSN NO: 2454-1958 Special Issue Tech-Ed 2016 (International Conference) Page 163

This system transports the plastic. The injection system are
having hopper, barrel, reciprocating screw and injection nozzle assembly. It progress through melting compressing, degassing, injection, feeding and packing stages.
b) The hopper
In the form of small pellets the thermoplastic material is
supplied to molders. The hopper hold the pellets. The barrel
and screw assembly pellets are gravity –fed from hopper
through the hopper throat.
c) The barrel The reciprocating plastering screws are supported by barrel in the injection moulding machine. The electric heater bands
are used for the heating purpose.
d) The rotating screw
For compress, melt, and convey the material the rotating screw is used. There are three zones in rotating screw
(illustrated below):
the feeding zone
the metering zone
the compressing (or transition) zone
e) The nozzle
It is forms seal between barrel and the mold because the
nozzle is connects the barrel to spur bushing of the mold.
The temperature of the nozzle should be set to the material's
melt temperature or just below it, depending on the
recommendation of the material supplier.
Fig 2. Reciprocating screw arrangement
Objective
The problem occurred in the reciprocating screw of
injection moulding machine was wearing of threads. The
objective of project is to find out the causes of wearing and
provide the solution. The industries are having temporary
solution to make repair of threads on the lathe machine
industries are having this temporary solution. This reduces
weight and strength of screw resulting misalignment in
assembly. The objectives involved are:-
a) To model all the components using modeling
software Pro-E 5.0 b) To assemble all the components in the software. c) Analysis of screw using ANSYS software. d) To identify the wearing of threads and to provide
the possible Solutions. Problem Statement
The problem identified in the operation condition
of injection moulding machine of reciprocating screw is the
wear of screw takes place after 3 to 4 months due to the use
of glass filled material (i.e., nylon66, low density
polyethylene, PVC, polystyrene) in plastic injection
moulding machine. The cost of the reciprocating screw is
about 4 to 5 laces.
Wearing of
threads
Fig 3:Wearing of threads of reciprocating screw Materials AndMethods
This are describes the details of injection molding
process, design of reciprocating screw with different two
material is used with having their properties they are LSS 01
Tool steel (ASTM 01) OHNS (existing material of screw).
Then change or replace the material of the screw by using
this two new materials AISI Type 06 Tool ,HSS 142 Tool
Steel and compare the results of this two material with the
existing material of the screw. We used the different mold
materials such as nylon 66,(LDP), polypropylene in this two
new material of the screw and analyze the results compare
their results with existing one and find out which material is
better for the replacement of the screw material. Various
mold materials can be used in this process like linear low
density polyethylene, Nylon, polystyrene, PVC etc.
Input Parameters For Finite Element Analysis Of Screw
Using ANSYS R15
Materials for Reciprocating Screw (Physical Properties)
Latrobe HSS 142
Materials LSS 01 Tool Tool
steel steel
Young's
200Gpa 215Gpa
modules(PA)
Poisons ratio 0.3 0.3
Density (kg/m³) 7800 7850
ISSN NO: 2454-1958 Special Issue Tech-Ed 2016 (International Conference) Page 164
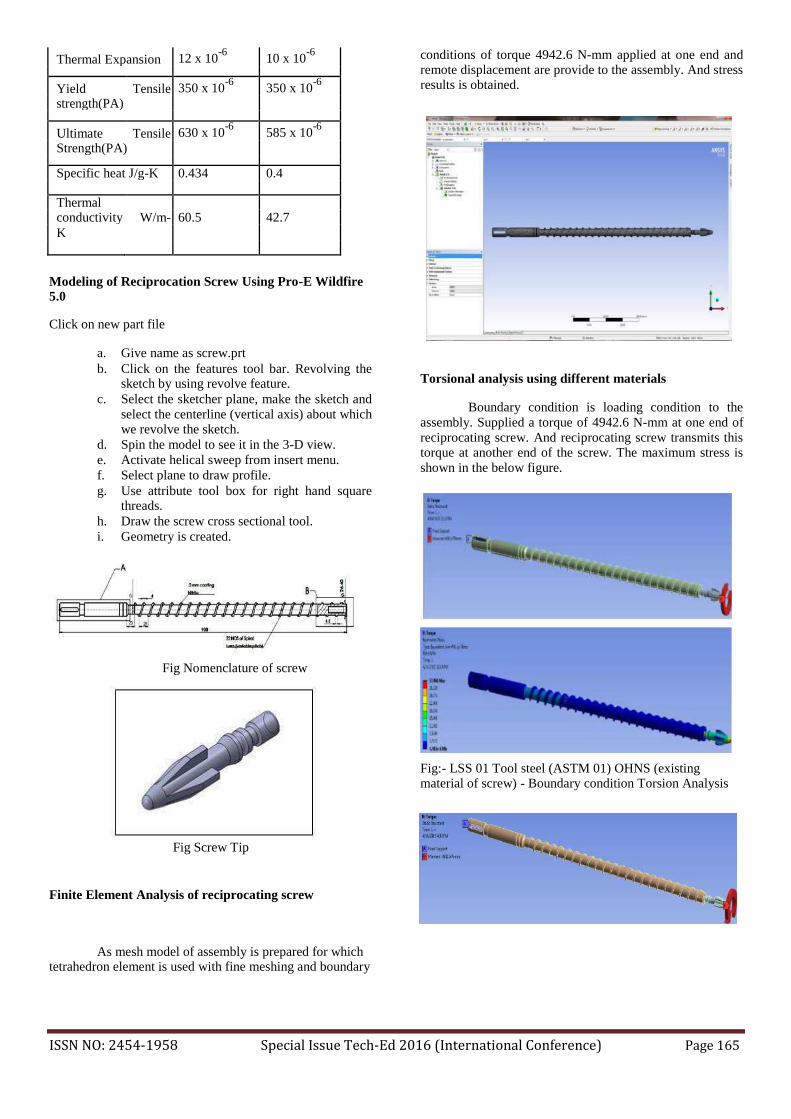
Thermal Expansion 12 x 10-6
10 x 10-6
Yield Tensile 350 x 10-6
350 x 10-6
strength(PA)
Ultimate Tensile 630 x 10-6
585 x 10-6
Strength(PA)
Specific heat J/g-K 0.434 0.4
Thermal
conductivity W/m- 60.5 42.7
K
Modeling of Reciprocation Screw Using Pro-E Wildfire
5.0 Click on new part file
a. Give name as screw.prt b. Click on the features tool bar. Revolving the
sketch by using revolve feature. c. Select the sketcher plane, make the sketch and
select the centerline (vertical axis) about which we revolve the sketch.
d. Spin the model to see it in the 3-D view.
e. Activate helical sweep from insert menu. f. Select plane to draw profile. g. Use attribute tool box for right hand square
threads. h. Draw the screw cross sectional tool. i. Geometry is created.
Fig Nomenclature of screw
conditions of torque 4942.6 N-mm applied at one end and remote displacement are provide to the assembly. And stress results is obtained.
Torsional analysis using different materials
Boundary condition is loading condition to the
assembly. Supplied a torque of 4942.6 N-mm at one end of
reciprocating screw. And reciprocating screw transmits this torque at another end of the screw. The maximum stress is
shown in the below figure.
Fig:- LSS 01 Tool steel (ASTM 01) OHNS (existing material of screw) - Boundary condition Torsion Analysis
Fig Screw Tip
Finite Element Analysis of reciprocating screw
As mesh model of assembly is prepared for which
tetrahedron element is used with fine meshing and boundary
ISSN NO: 2454-1958 Special Issue Tech-Ed 2016 (International Conference) Page 165

Fig: - HSS 142 Tool steel (material) Boundary condition
Torsion Analysis
Analysis of Existing Reciprocating Screw
Analysis of existing reciprocating screw is done by
using software ANSYS R15 by providing properties of
reciprocating screw material and CATIA model. Then it is
feed into the ANSYS R15 and static and thermal analysis
has been done. We have madeanalysis by using properties
of three different materials. First of all we have made
analysis by using material Latrobe LSS 01 Tool steel
(ASTM 01), it could not avoid that much failure of
reciprocating screw. Here, main material of screw is used i.eLSS 01 Tool Steel
(ASTM01) OHNS where various different temperatures are
applied in different zones. Further, using different mold
materials such as nylon 66, total heat flux, directional heat
flux and maximum temperature is analyzed.
Thermal Analysis Analysis results for material LSS 01 Tool steel
(ASTM01) Temperature for mould materials applied at various zones
of screw
Fig LSS 01 Tool steel (ASTM 01) OHNS (screw
material) - Boundary condition Thermal Analysis (Nylon
66 mold material)
Here, main material of screw is used i.e. .LSS 01
Tool Steel (ASTM01) OHNS where various different
temperatures are applied in different zones. Further, using different mold materials such as (LDP), total heat flux,
directional heat flux and is analyzed.
Fig :- Boundary condition Thermal Analysis of screw
using mould material (low density polyethylene) Analysis results for material HSS 142 Tool Steel
Here, main material of screw is used i.e. HSS 142
Tool Steel where various different temperatures are applied in different zones. Further, using different mold materials
such as nylon 66, total heat flux, directional heat flux and is
analyzed. Temperature for mold materials applied at various zones
of screw
ISSN NO: 2454-1958 Special Issue Tech-Ed 2016 (International Conference) Page 166
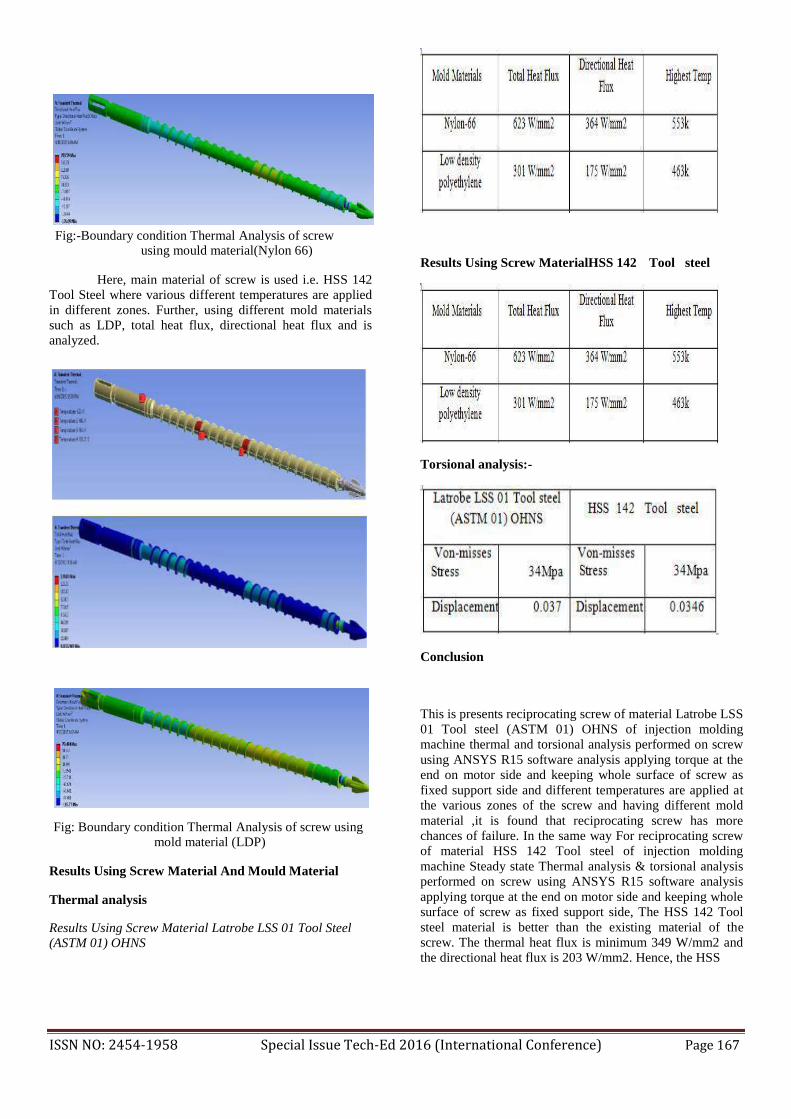
Fig:-Boundary condition Thermal Analysis of screw
using mould material(Nylon 66)
Here, main material of screw is used i.e. HSS 142
Tool Steel where various different temperatures are applied
in different zones. Further, using different mold materials
such as LDP, total heat flux, directional heat flux and is
analyzed.
Fig: Boundary condition Thermal Analysis of screw using mold material (LDP)
Results Using Screw Material And Mould Material Thermal analysis Results Using Screw Material Latrobe LSS 01 Tool Steel (ASTM 01) OHNS
Results Using Screw MaterialHSS 142 Tool steel Torsional analysis:-
Conclusion
This is presents reciprocating screw of material Latrobe LSS
01 Tool steel (ASTM 01) OHNS of injection molding
machine thermal and torsional analysis performed on screw
using ANSYS R15 software analysis applying torque at the
end on motor side and keeping whole surface of screw as
fixed support side and different temperatures are applied at
the various zones of the screw and having different mold
material ,it is found that reciprocating screw has more
chances of failure. In the same way For reciprocating screw
of material HSS 142 Tool steel of injection molding
machine Steady state Thermal analysis & torsional analysis
performed on screw using ANSYS R15 software analysis
applying torque at the end on motor side and keeping whole
surface of screw as fixed support side, The HSS 142 Tool
steel material is better than the existing material of the
screw. The thermal heat flux is minimum 349 W/mm2 and
the directional heat flux is 203 W/mm2. Hence, the HSS
ISSN NO: 2454-1958 Special Issue Tech-Ed 2016 (International Conference) Page 167

142Toolis better material for minimizing the wear of screw and increase the life of screw. FUTURESCOPE a) For analyzing load condition, analysis results of
reciprocating screw to be carried out with the help of ANSYS software.
b) New fabrication Methodology workout for fabrication of
reciprocating screw which can be replaced with current
system. c) Various heat treatment processes will be applied so that
we can improve material properties of reciprocating
screw. REFERENCES 1 Barrel temperature control during operation transition in injection
molding. - Ke Yao , FurongGao , Frank Allgower ,The Hong Kong university of science and technology.
2 A simulation test for wear in injection moulding machines S.J. Bull
a, Qiusha Zhou, University of Newcastle, Chongqing.
3 Self-optimizing MPC of melt temperature in injection moulding -R.
Dubay. The University of New Brunswick.
4 Ke Yao , FurongGao , Frank Allgower .Barrel temperature control during operation transition in injection molding ,The Hong Kong university of science and technology, Control Engineering Practice 16 (2008) p1259– 1264
5 Vikas.R.Rajoria, Prof.P.K.Jadhao, ―Finite Element Analysis
of Reciprocating Screw for Injection Molding Machine‖,
InternationalJournal of Innovative Research in Science, Engineering and Technology Vol. 2, Issue 7, July 2013
6 Akinci,I.DYilmaz and M. Canakci, 2005. Failure of a rotary tiller
spur gear. J. Eng. Failure Anal.,12:400-404
7 Nanaware, G K. and M.J. Pable, 2003 Failure of rear axle shafts of 575 DT tractor.J.Eng Failure Anal., 10:719-724
8 Rahman, M.M., A.K. Arffin, N. Jamaludin, S. Abdullah and M.M. Noor, 2008. Finite element based fatigue life prediction of a new free piston engine mounting. J. Applied Sci.,
ISSN NO: 2454-1958 Special Issue Tech-Ed 2016 (International Conference) Page 168

LEAN MANUFACTURING: ELEMENTS AND
ITS BENEFITS FOR MANUFACTURING
INDUSTRY GauravPuri LankeshJadhav MilindPalandurkar
Department of Mechanical Engineering, Department of Mechanical Engineering, Department of Mechanical Engineering,
TulsiramjiGaikwad-Patil College of TulsiramjiGaikwad-Patil College of TulsiramjiGaikwad-Patil College of
Engineering and Technology, Mohgaon, Engineering and Technology, Mohgaon, Engineering and Technology, Mohgaon,
Nagpur Nagpur Nagpur Abstract In today’s competitive environment organizations
needs to leverage the strength it has and must work
to improve upon its weakness. Lean manufacturing
has been recognized as a key to improve aspect
competitiveness for manufacturing organizations
throughout the world. Lean manufacturing offers a
basket full of tools and techniques which can help in
waste identification, reduction or elimination, to
enables manufacture of product with superior
quality, lower cost and on time with lesser efforts.
Considering its potential of improving operational
performance lean manufacturing is gaining
popularity among manufacturing industries. Purpose of this paper is to present Lean
Manufacturing elements, benefits, implementation
strategy and obstacles in implementation for
manufacturing industry.
Keywords:-Productivity, lean, waste, quality,
technique.
Lean identifies the bottlenecks in design and
development processes that add unnecessary delays and
cost. It can help create a more efficient system that
reduces time to market without compromising on
quality.
Lean has a key role to play in new product development
and the improvement of existing products and the
improvement of existing products, including idea
creation, design for manufacture, assembly and test,
rapid prototyping, product portfolio management,
market and competitor analysis, risk management, sales
forecasting, setting key performance indicators and
value analysis to reduce the cost of existing products.
Lean manufacturing is “A systematic approach for
identifying and eliminating waste through continuous
improvement by flowing the product at the pull of
customer in pursuit of perfection”. Various techniques such as Six Sigma,5S, Total Quality Management (TQM), Theory of constraints(TOC), Total Productive Maintenance
I. INTRODUCTION:(TPM), Business Process Management (BPM), Lean is defined as a strategy for achieving significant
continuous improvement in performance through the
elimination of all wastes of resources and time in the
total business process. Its principles apply to nearly all
business operations, from administration and product
design to hardware productions. Lean manufacturing is
about eliminating waste and non-value added tasks.
Examples of waste in manufacturing include
overproduction, over processing, waiting,Unnecessary
part movement, excess inventory and defects, as applied
to hardware production lean manufacturing focuses on
eliminating all sources of waste by applying the
following strategies. 1. One piece workflow 2. Take time 3. Pull system
Visual Management, etc. supports the lean
transformation in order to remove waste, variability
and overburden and deliver improvements in specific
areas. Every tool has its own way of eliminating
waste; SMED reduces waiting and overproduction by
creating shorter machine setup times. Value Stream
Mapping draws the actual product flow through the
manufacturing resources and can uncover important
areas for improvement.
II. Literature review: The works on the lean manufacturing are abundant; those
that concern lean manufacturing in India are rather limited.
Approaches towards lean manufacturing practice have been identified by various researchers. A case was described
where lean principles were adapted for the process sector
ISSN NO: 2454-1958 Special Issue Tech-Ed 2016 (International Conference) Page 169
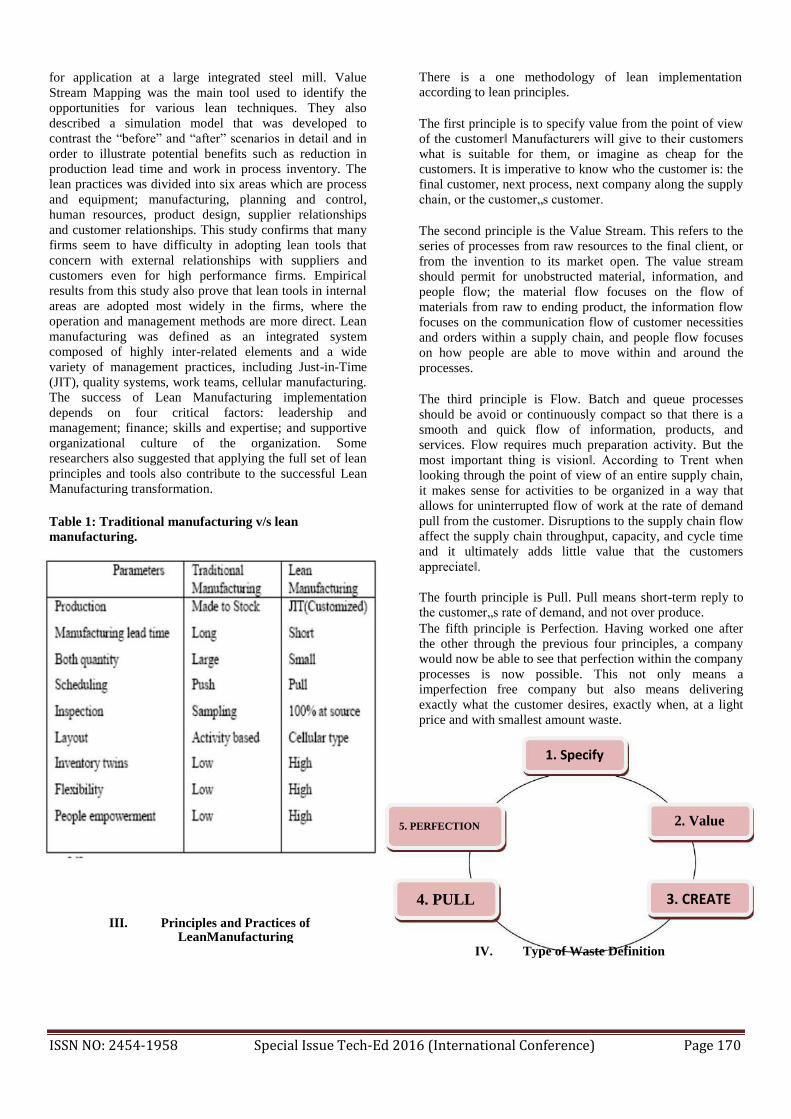
for application at a large integrated steel mill. Value
Stream Mapping was the main tool used to identify the
opportunities for various lean techniques. They also
described a simulation model that was developed to
contrast the “before” and “after” scenarios in detail and in
order to illustrate potential benefits such as reduction in
production lead time and work in process inventory. The
lean practices was divided into six areas which are process
and equipment; manufacturing, planning and control,
human resources, product design, supplier relationships
and customer relationships. This study confirms that many
firms seem to have difficulty in adopting lean tools that
concern with external relationships with suppliers and
customers even for high performance firms. Empirical
results from this study also prove that lean tools in internal
areas are adopted most widely in the firms, where the
operation and management methods are more direct. Lean
manufacturing was defined as an integrated system
composed of highly inter-related elements and a wide
variety of management practices, including Just-in-Time
(JIT), quality systems, work teams, cellular manufacturing.
The success of Lean Manufacturing implementation
depends on four critical factors: leadership and
management; finance; skills and expertise; and supportive
organizational culture of the organization. Some
researchers also suggested that applying the full set of lean
principles and tools also contribute to the successful Lean
Manufacturing transformation.
Table 1: Traditional manufacturing v/s lean
manufacturing.
There is a one methodology of lean implementation according to lean principles.
The first principle is to specify value from the point of view
of the customer‖ Manufacturers will give to their customers
what is suitable for them, or imagine as cheap for the
customers. It is imperative to know who the customer is: the
final customer, next process, next company along the supply
chain, or the customer„s customer.
The second principle is the Value Stream. This refers to the
series of processes from raw resources to the final client, or
from the invention to its market open. The value stream
should permit for unobstructed material, information, and
people flow; the material flow focuses on the flow of
materials from raw to ending product, the information flow
focuses on the communication flow of customer necessities
and orders within a supply chain, and people flow focuses
on how people are able to move within and around the
processes.
The third principle is Flow. Batch and queue processes
should be avoid or continuously compact so that there is a
smooth and quick flow of information, products, and
services. Flow requires much preparation activity. But the
most important thing is vision‖. According to Trent when
looking through the point of view of an entire supply chain,
it makes sense for activities to be organized in a way that
allows for uninterrupted flow of work at the rate of demand
pull from the customer. Disruptions to the supply chain flow
affect the supply chain throughput, capacity, and cycle time
and it ultimately adds little value that the customers
appreciate‖.
The fourth principle is Pull. Pull means short-term reply to the customer„s rate of demand, and not over produce. The fifth principle is Perfection. Having worked one after
the other through the previous four principles, a company
would now be able to see that perfection within the company
processes is now possible. This not only means a
imperfection free company but also means delivering
exactly what the customer desires, exactly when, at a light
price and with smallest amount waste.
1. Specify
5. PERFECTION 2. Value
4. PULL 3. CREATE
III. Principles and Practices of LeanManufacturing
IV. Type of Waste Definition
ISSN NO: 2454-1958 Special Issue Tech-Ed 2016 (International Conference) Page 170
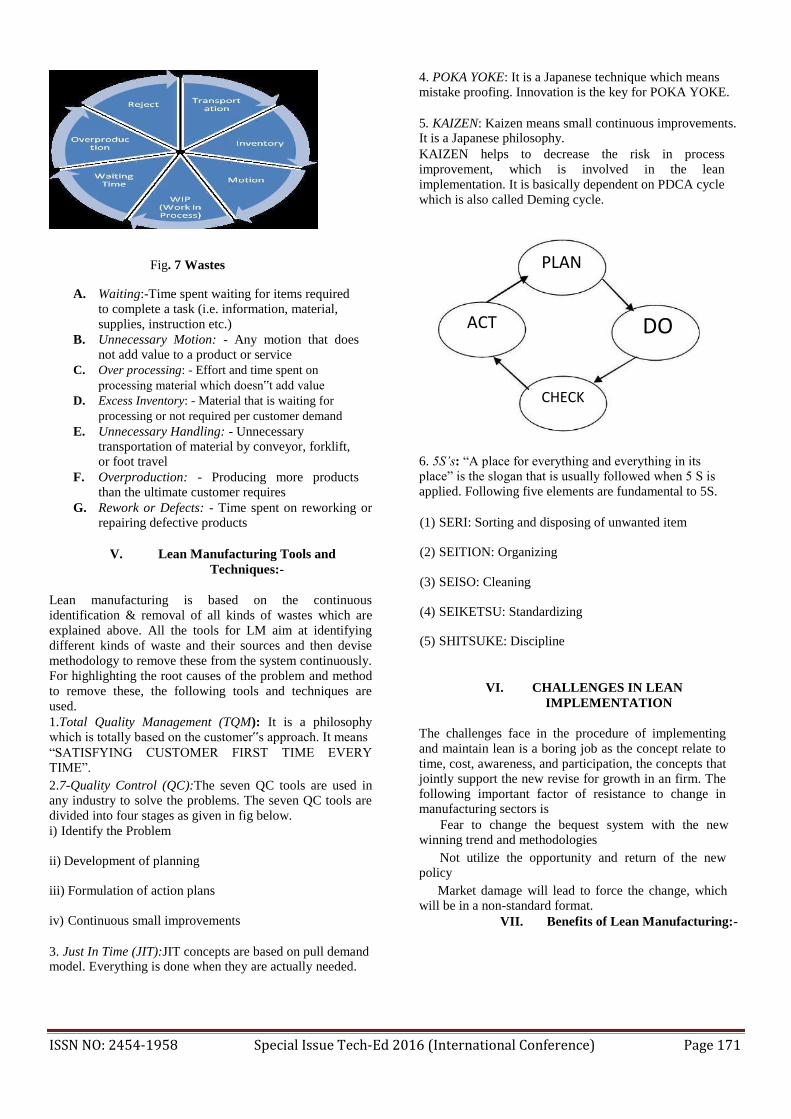
Fig. 7 Wastes
A. Waiting:-Time spent waiting for items required to complete a task (i.e. information, material,
supplies, instruction etc.) B. Unnecessary Motion: - Any motion that does
not add value to a product or service C. Over processing: - Effort and time spent on
processing material which doesn‟t add value
D. Excess Inventory: - Material that is waiting for
processing or not required per customer demand
E. Unnecessary Handling: - Unnecessary transportation of material by conveyor, forklift, or foot travel
F. Overproduction: - Producing more products than the ultimate customer requires
G. Rework or Defects: - Time spent on reworking or repairing defective products
V. Lean Manufacturing Tools and Techniques:-
Lean manufacturing is based on the continuous
identification & removal of all kinds of wastes which are
explained above. All the tools for LM aim at identifying
different kinds of waste and their sources and then devise
methodology to remove these from the system continuously.
For highlighting the root causes of the problem and method
to remove these, the following tools and techniques are
used. 1.Total Quality Management (TQM): It is a philosophy which is totally based on the customer‟s approach. It means “SATISFYING CUSTOMER FIRST TIME EVERY TIME”. 2.7-Quality Control (QC):The seven QC tools are used in any industry to solve the problems. The seven QC tools are
divided into four stages as given in fig below. i) Identify the Problem
ii) Development of planning iii) Formulation of action plans iv) Continuous small improvements
3. Just In Time (JIT):JIT concepts are based on pull demand model. Everything is done when they are actually needed.
4. POKA YOKE: It is a Japanese technique which means mistake proofing. Innovation is the key for POKA YOKE.
5. KAIZEN: Kaizen means small continuous improvements. It is a Japanese philosophy. KAIZEN helps to decrease the risk in process
improvement, which is involved in the lean
implementation. It is basically dependent on PDCA cycle
which is also called Deming cycle.
PLAN
ACT DO
CHECK
6. 5S’s: “A place for everything and everything in its place” is the slogan that is usually followed when 5 S is
applied. Following five elements are fundamental to 5S.
(1) SERI: Sorting and disposing of unwanted item (2) SEITION: Organizing
(3) SEISO: Cleaning (4) SEIKETSU: Standardizing (5) SHITSUKE: Discipline
VI. CHALLENGES IN LEAN IMPLEMENTATION
The challenges face in the procedure of implementing
and maintain lean is a boring job as the concept relate to
time, cost, awareness, and participation, the concepts that jointly support the new revise for growth in an firm. The
following important factor of resistance to change in manufacturing sectors is
Fear to change the bequest system with the new winning trend and methodologies
Not utilize the opportunity and return of the new policy
Market damage will lead to force the change, which will be in a non-standard format.
VII. Benefits of Lean Manufacturing:-
ISSN NO: 2454-1958 Special Issue Tech-Ed 2016 (International Conference) Page 171

1. Reduced cost: By implementation of Lean
Manufacturing organizations can achieve reduced
cycle times, increased labour productivity and
elimination of bottlenecks and reduced machine
downtime can be achieved, and companies can
generally significantly increased output with
reduced cost from their existing facilities. 2. Reduced lead time: With the effect of reduced cycle
time and work in progress inventory lead time to
manufacture and deliver the product is drastically
reduces. 3. Waste reduction: Waste identification and reduction
is one of the main functions of Lean Manufacturing
implementation plan. All the form of waste i.e.
overproduction, defect, transportation, work in
progress inventory, over processing, waiting and
motion are reduced with Lean manufacturing
implementation. 4. Improved productivity - Improve labour
productivity, both by reducing the idle time of
workers and ensuring that when workers are
working, they are using their effort as productively
as possible (including not doing unnecessary tasks
or unnecessary motions). 5. Reduced work in progress (WIP) Inventory -
Minimize inventory levels at all stages of
production, particularly works-in-progress between
production stages. Lower inventories also mean
lower working capital requirements. 6. Lower Cycle Times - Reduce manufacturing lead
times and production cycle times by reducing
waiting times between processing stages, as well as
process preparation times and product/model conversion times.
7. Improved Flexibility - Have the ability to produce
a more flexible range of products with minimum
changeover costs and changeover time. 8. Multi skill worker – Involvement of worker in
various Lean tools i.e. quality circles, kaizen circle,
layout improvement; value stream mapping, set up
time reduction etc. creates better understanding of
processes, machines, material flow among the team
and improves core competencies of worker. 9. Better Utilization of equipment and space - Use
equipment and manufacturing space more
efficiently by eliminating bottlenecks and maximizing the rate of production though existing
equipment, while minimizing machine downtime
10. Reduced Defects - Reduce defects and unnecessary
physical wastage, including excess use of raw
material inputs, preventable defects, costs
associated with reprocessing defective items, and
unnecessary product characteristics which are not
required by customers.
VIII. Obstacles in Lean Manufacturing implementation:
The following may be some obstacles in Lean manufacturing implementation:
1. Lack of management support: the reason can
be pressure from customer side; competitor is
following lean practices or others. In this case
management just starts and does not propel further this
results only superficial lean and neither lean is
implemented nor does it get benefit. 2. Lack of training: Another reason is lack of
clear understanding about lean throughout the
organization. The organization where knowledge of
lean lacks it cannot be implemented. 3. Communication – Lack of communication is one of the prime obstacles in lean manufacturing implementation. 4. Resistance to Change – Resistance to change is
very common phenomena as it increases fear of
failure, initial cost so many of routine liking people
doesn‟t want to change and hence it stops the progress
of lean implementation. 5. No direct financial advantage – Lean does not
produces any direct financial benefits but it helps in
identification and elimination of waste hence reduction
of cost. Lean does not have any financial measure in
terms of input and output so sometimes lean idea is
superseded by other organizational priorities. 6. Past failures – In case of poor launching of
Lean is itself big obstacle. Lack of implementation strategy may lead to lack of faith in whole philosophy.
IX. Conclusion:
This paper presents the review of lean thinking and
its concept through definitions from literature. The main
focus of lean manufacturing is to eliminate waste, doing
things better in half of the resources as mass production
requires, providing higher quality with lesser cost. More
and more facets of lean manufacturing will come forth
as researchers are keenly bringing through continual
research. The good understanding of lean principles and
practices is required for successful implementation of
lean as lean practices without knowing lean principles
can give short term success but may fail as long term
strategy. Lack of Planning, Lack of top management
commitment, Lack of Methodology, Unwillingness to
learn and see and Human Aspects are the main barriers
or problems which can be faced while implementing
the Lean Manufacturing. These have already been
discussed in the previous section. This paper shows
that one the major difficulties companies encounter in
attempting to apply lean is not knowledge of particular
tools and techniques, perhaps lack of comprehensive
and suitable lean knowledge related to probable
problems within the companies by the managers,
direction, gap and a lack of recognition of lean culture
in whole of the organization and planning cause the
fails within the implementations. Additionally, some
managers try to enhance the implementation by some
of the lean tools and mostly try to only implement the
"continuous improvement" and explicitly forget
ISSN NO: 2454-1958 Special Issue Tech-Ed 2016 (International Conference) Page 172

another basic lean principle, "respect for people". The
managers should know that lean thinking won't derive
during a short time, and they should prepare the
context of implementations before every decision
making. The paper tried to present best way for lean
implementation available in literature along with
discussion that lean is applied successfully in different
sectors than automobile sector such as service sector,
discrete manufacturing, etc. The recent literature shows
that the trend in lean manufacturing for research now is
focused on lean assessment. Leanness attracts focus to
answer specific questions of managers responsible for
lean implementation to assess the lean implementation
level and to justify spending over lean implementation.
In this paper, presents the review of barriers of lean
implementation from literature review. Understanding
the barriers is important for managers to avoid failures
and to sustain lean leap. The future research may be to
identify such barriers through extensive literature
review and interviews of working professionals as very
little work happened on this subject. The way forward
for research in this area may be multiple criteria. The
paper contributes by identifying enablers & barriers in
implementing the lean principles and practices,
methodologies used in leanness measurement of an
organization in the Indian manufacturing industry.
REFRENCE: 1) Abdulmalek, F. A. and Fajgopal, J. (2007), Analyzing the benefits of lean manufacturing and value stream mapping via simulation: A process sector case study, Int. J. Production Economics, Vol. 107, pp. 223-236. 2) Bhasin, S. (2012), Performance of Lean in large organisations, Journal of Manufacturing Systems, Vol. 31, 349-357. 3) Doolen, T. L. and Hacker, M. E. (2005), A Review of Lean Assessment in Organizations: An Exploratory Study of Lean Practices by Electronics Manufacturers, Journal of Manufacturing Systems, 24, 1, pp. 55-67. 4) Gurumurthy, A. and Kodali, R. (2009), Application of benchmarking for assessing the lean manufacturing implementation, Benchmarking: An International Journal, Vol. 16, No. 2, pp. 274-308. 5) Hallgren, M. and Olhager, J. (2009), Lean and agile manufacturing:
external and internal drivers and performance outcomes, International
Journal of Operations & Production Management, Vol. 29 No. 10, pp.
976-999.
6) Herron, C. and Christian, H. (2008), The transfer of selected lean manufacturing techniques from Japanese automotive manufacturing into general manufacturing (UK) through change agents, Robotics and Computer-Integrated Manufacturing, 24, pp. 524-531. 7) Hines, P., Holwe, M. and Rich, N. (2004), Learning to evolve: A review of contemporary lean thinking, International Journal of Operations & Production Management, Vol. 24, No. 10, pp. 994- 1011. 8) Lewis, M. A. (2000), Lean production and sustainable competitive advantage, International Journal of Operations & Production Management, Vol. 20 No. 8, pp. 959-978. 9) Meier, H. S. and Forrester, P. L. (2002), A model for evaluating the degree of leanness of manufacturing firms, Integrated Manufacturing Systems, 13, 2, pp. 104-109. 10) Melton, T. (2005), THE BENEFITS OF LEAN MANUFACTURING What Lean Thinking has to Offer the Process Industries, Chemical Engineering Research and Design, 83(A6), pp. 662–673. 11) Panizzolo, R., Garengo, P., Sharma, M. K. and Gore, A. (2012), Lean manufacturing in developing countries: evidence from Indian SMEs, Production Planning & Control, Vol. 23, No. 10-11, pp. 769– 788. 12) Papadopoulos, T. C.andOzbayrak, and M. (2005), Leanness: experiences from the journey to date, Journal of Manufacturing Technology Management, Vol. 16 No. 7, pp. 784-807. 13) Piercy, N. and Rich, N. (2009), Lean transformation in the pure service environment: the case of the call service centre, International Journal of Operations & Production Management, Vol. 29, No. 1, pp. 54-75. 14) Shah, R. and Ward, P. T. (2003), Lean manufacturing: context, practice bundles, and performance, Journal of Operations Management, 21, pp. 129–149. 15) Shah, R. and Ward, P. T. (2007), Defining and developing measures of lean production, Journal of Operations Management, 25, pp. 785-805. 16) Shah, R., Chandrasekaran, A. and Linderman, K. (2008), In
pursuit of implementation patterns: the context of Lean and Six Sigma, International Journal of Production Research, Vol. 46, No. 23, pp. 6679- 6699. 17) Singh, B., Garg, S. K. and Sharma, S. K. (2010), Development of index for measuring leanness: study of an Indian auto component industry, Measuring Business Excellence, Vol. 14, No. 2, pp. 46-53. 18) Sullivan, W. G., McDonald, T. N. and Van Aken, E. M. (2002), Equipment replacement decisions and lean manufacturing, Robotics and Computer Integrated Manufacturing, Vol. 18, pp. 255-265. 19) Vimal, K. E. K. and Vinodh, S. (2012), Leanness evaluation using IF–THEN rules, International Journal of Advanced Manufacturing Technology, Vol. 63, Iss. 1-4, pp. 407-413. 20) Wan, H. and Chen, F. F. (2008), A leanness measure of manufacturing systems for quantifying impacts of lean initiatives, International Journal of Production Research, Vol. 46, No. 23, pp. 6567– 6584. 21) Yadav, O. P., Nepal, B., Goel, P. S., Jain, R. and Mohanty, R. P. (2010), Insights and learnings from lean manufacturing implementation practices, Int. J. Services and Operation.
ISSN NO: 2454-1958 Special Issue Tech-Ed 2016 (International Conference) Page 173

DESIGN AND ANALYSIS OF DISC BRAKE
Prof.S.V.Borkar Mr.KunalI Mahajan PriyadarshiniBhagwati College Priyadarshini Institute Of
Of Engineering Nagpur Engineering And Technology Nagpur
ABSTRACT Each single system has been studied and developed inorder to
meet safety requirement. Instead of having air bag,
goodsuspension systems, good handling and safe cornering, there
isone most critical system in the vehicle which is brake
systems.Without brake system in the vehicle will put a passenger
inunsafe position. Therefore, it is must for all vehicles to
haveproper brake system. In this paper carbon ceramic matrix
disc Brake material use for calculating normal force, shear force
andpiston force. And also calculating the brake distance of
discbrake. The standard disc brake two wheelers model using
inAnsys and done the Thermal analysis and Modal analysis
alsocalculate the deflection and Heat flux, Temperature of disc
brakemodel. This is important to understand action force and
frictionforce on the disc brake new material, how disc brake
works moreefficiently, which can help to reduce the accident that
mayhappen in each day. KEYWORDS— Disc Brake, Thermal Analysis, Modal Analysis,Heat flux
I. INTRODUCTION The disc brake is used to stop or slow down the
vehicleeffectively. The brake disc or rotor is usually made of
cast iron, but may insome cases be made of composites such
as reinforced carbon-Carbon or ceramic matrix composites.
This is connected to theWheel and/or the axle. To stop the
wheel, friction material inthe form of brake pads, mounted on
a device called a brakeCaliper, is forced mechanically,
hydraulically, pneumaticallyor electromagnetically against
both sides of the disc. FrictionCauses the disc and attached
wheel to slow or stop. A brake disk rotor forms pan of a
foundation brake and rotates with the wheel hub assembly.
The mainFunction of a foundation brake is to generate
aRetarding torque by converting mechanical energy
toThermal energy by virtue of the frictional work donein
relative sliding at the rotor-pad interface. Disc-style brakes
development and use began in Englandin the 1890s. The first
caliper-type automobile disc brake waspatented by Frederick
William Lanchester in his Birmingham,UK factory in 1902
and used successfully on Lanchestercars. Recently,Disk
brakes have been widely used in light vehicles.Long repetitive
braking leads toTemperature rise of various brake components
of theVehicle that reduces the performance of the
Mr.Sanket V Bure Mr.PrashantN Khadatkar PriyadarshiniBhagwati College PriyadarshiniBhagwati College
Of Engineering Nagpur Of Engineering Nagpur
brakeSystem. Long repetitive braking, such as one
whichOccurs during a mountain descent, will result in aBrake
fluid temperature rise and may cause brakeFluid vaporization.
This may be a concern particularlyfor passenger cars equipped
with aluminum calipersand with a limited airflow to the wheel
brake Systems. A schematic diagram is shown in the fig
Fig1DiskBrake.
1 CALLIPER
Foundation of any disc brake is the caliper body: the U-shaped
casting thatwraps around the rotor (like a hydraulic C-clamp) is
usually made of NodularCast iron but some are aluminum for
lighter weight. Single piston calipers are usually one piece, and
multi pistoncalipers that have pistons on both sides of the rotor
are madein two pieces that are bolted together with high strength
bridgebolts. Most calipers have an inspection hole in the bridge
where the padthickness can be quickly checked.
1.1 Fixed Caliper: Body usually manufactured in two halves;
has two, three or fourpistonsGets its name from the fact that it
is rigidly mounted to theknuckle; no part of the caliper body
moves when the brakesare applied.
ISSN NO: 2454-1958 Special Issue Tech-Ed 2016 (International Conference) Page 174
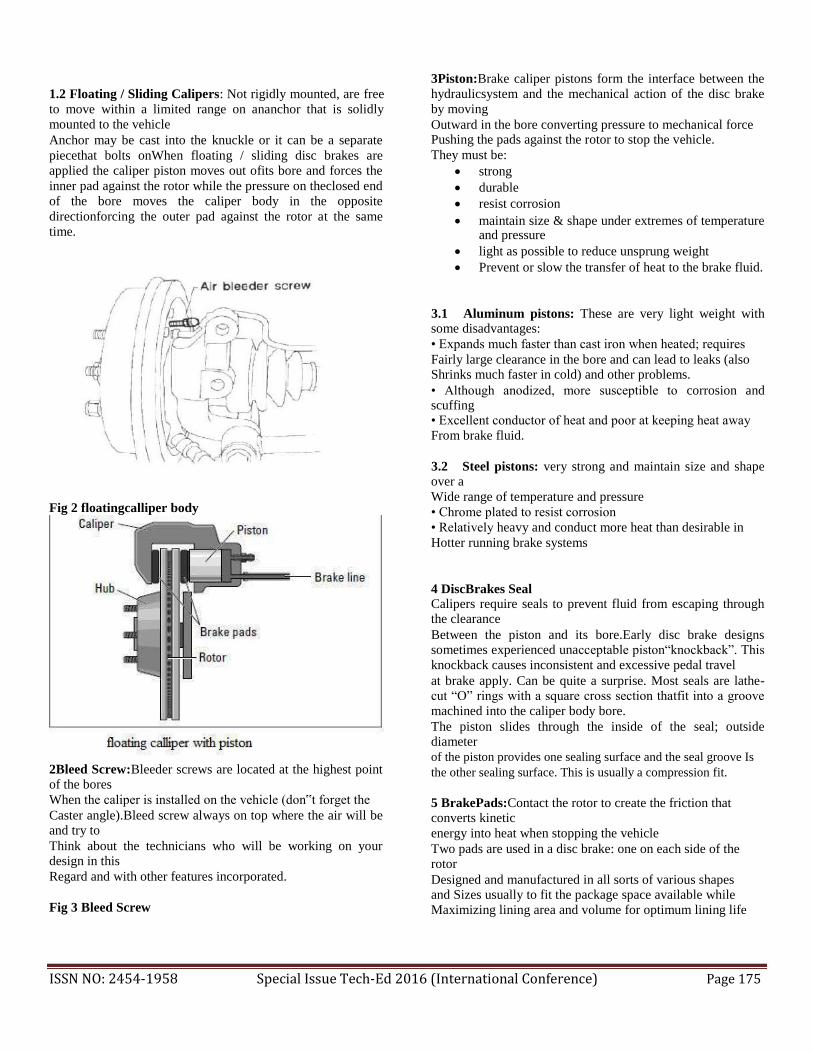
1.2 Floating / Sliding Calipers: Not rigidly mounted, are free
to move within a limited range on ananchor that is solidly
mounted to the vehicle Anchor may be cast into the knuckle or it can be a separate
piecethat bolts onWhen floating / sliding disc brakes are
applied the caliper piston moves out ofits bore and forces the
inner pad against the rotor while the pressure on theclosed end
of the bore moves the caliper body in the opposite
directionforcing the outer pad against the rotor at the same
time.
Fig 2 floatingcalliper body
2Bleed Screw:Bleeder screws are located at the highest point of the bores When the caliper is installed on the vehicle (don‟t forget the Caster angle).Bleed screw always on top where the air will be and try to Think about the technicians who will be working on your design in this Regard and with other features incorporated.
Fig 3 Bleed Screw
3Piston:Brake caliper pistons form the interface between the
hydraulicsystem and the mechanical action of the disc brake
by moving Outward in the bore converting pressure to mechanical force Pushing the pads against the rotor to stop the vehicle. They must be:
strong
durable
resist corrosion maintain size & shape under extremes of temperature
and pressure light as possible to reduce unsprung weight
Prevent or slow the transfer of heat to the brake fluid.
3.1 Aluminum pistons: These are very light weight with
some disadvantages: • Expands much faster than cast iron when heated; requires Fairly large clearance in the bore and can lead to leaks (also Shrinks much faster in cold) and other problems. • Although anodized, more susceptible to corrosion and scuffing • Excellent conductor of heat and poor at keeping heat away From brake fluid.
3.2 Steel pistons: very strong and maintain size and shape
over a Wide range of temperature and pressure • Chrome plated to resist corrosion • Relatively heavy and conduct more heat than desirable in Hotter running brake systems
4 DiscBrakes Seal Calipers require seals to prevent fluid from escaping through the clearance Between the piston and its bore.Early disc brake designs sometimes experienced unacceptable piston“knockback”. This
knockback causes inconsistent and excessive pedal travel at brake apply. Can be quite a surprise. Most seals are lathe-cut “O” rings with a square cross section thatfit into a groove
machined into the caliper body bore. The piston slides through the inside of the seal; outside diameter of the piston provides one sealing surface and the seal groove Is
the other sealing surface. This is usually a compression fit.
5 BrakePads:Contact the rotor to create the friction that converts kinetic energy into heat when stopping the vehicle Two pads are used in a disc brake: one on each side of the rotor Designed and manufactured in all sorts of various shapes and Sizes usually to fit the package space available while
Maximizing lining area and volume for optimum lining life
ISSN NO: 2454-1958 Special Issue Tech-Ed 2016 (International Conference) Page 175

All have a metal backing plate (usually steel) to which lining is Molded or riveted
6 DiskRotor Rotors are the largest and heaviest parts of the disc brake Assembly.They provide friction surfaces for the linings to rub
against and Together these parts create the “friction couple” that converts Kinetic energy into heat and stops the vehicle. They absorb and dissipate most of the heat generated in braking. Made of cast iron because of its relative: low cost, good wear andfriction properties and ease of machining
II. DISK BRAKE CALUCALTION
Disc Brake Standard Rotor disc dimension = 240 mm. (240×10-3
m) Rotor disc material = Carbon Ceramic
Matrix Pad brake area = 2000 mm2 (2000×10-
6 m) Pad brake material = Asbestos Coefficient of friction (Wet) = 0.07-0.13
Coefficient of friction (Dry) = 0.3-0.5
Maximum temperature = 350 ºC
Maximum pressure = 1MPa (106 Pa)
3.1 Tangential force between pad and rotor (Inner face) FTRI = μ1.FRI Where, FTRI = Normal force between pad brakeAnd Rotor (Inner) μ1 = Coefficient of friction = 0.5 FRI = P max / 2 × A pad brake area So, FTRI = μ1.FRI FTRI = (0.5)(0.5)(1×10⁶ N/m2) (2000×106 m2) FTRI = 500 N. Tangential force between pad and rotor (outer face) , FTRO.
In this FTRO equal FTRI because same normal force and same material
3.2 Brake Torque (TB) – With the assumption of equal coefficients of friction and Normal forces FR on the inner and outer faces: TB = FT.R Where TB = Brake torque μ = Coefficient of friction FT = Total normal forces on disc brake, = FTRI + FTRO FT = 1000 N. R = Radius of rotor disc. So, TB = (1000) (120×10-3)
TB = 120 N.m
3.3 Brake Distance (x) –
We know that tangential braking force acting at the point of contact of the brake, and Work done = FT. x ..................(Equation A) Where FT = FTRI + FTRO X = Distance travelled (in meter) by the vehicle before it come to rest. We know kinetic energy of the vehicle. Kinetic energy = (mv2) / 2 ................(Equation B) Where m = Mass of vehicle v = Velocity of vehicle In order to bring the vehicle to rest, the work done against
friction must be equal to kinetic energy of the vehicle.
Therefore equating (Equation A) and (Equation B)
FT. x = (mv2) / 2 Assumption v = 100 kg/h = 27.77 m/s M = 132 kg. (Dry weight of Vehicle) So we get x = (mv2) / 2 FT x = (132×27.772) / (2×1000) m. x = 50.89 m Heat Generated (Q) = M .Cр. ΔT J/S Flux (q) = Q/A W/m² Thermal Gradient (K) = q / k K / m Carbon Ceramic Matrix – Heat generated Q= m*cp*ΔT Mass of disc = 0.5 kg Specific Heat Capacity = 800 J/kg 0 c
Time taken Stopping the Vehicle = 5sec
Developed Temperature difference = 15 0 c
Q = 0.5 * 800 * 15= 6000 J Area of Disc = Π * ( R2 – r2 ) = Π * (0.120 2 – 0.055 2 ) = 0.03573 m 2 Heat Flux = Heat Generated /Second /area = 6000 /5 / 0.0357 = 33.585 kw/m 2 Thermal Gradient = Heat Flux / Thermal Conductivity = 33.582*10 3 / 40 = 839.63 k/m
Fig 4 How Disk Brake Works
ISSN NO: 2454-1958 Special Issue Tech-Ed 2016 (International Conference) Page 176

III. PROBLEMS IN DISK BRAKE
Braking performance of a vehicle can be
significantlyaffectedby the temperature rise in the brake
Components. High temperature during braking mayCause
brake fade, premature wear, brake fluid Vaporization, bearing
failure, thermal cracks, andthermallyexcited vibration.
Therefore, it is importanttopredict the temperature rise of a
given brakeSystem and assess its thermal performance in
theearlydesign stage. Recently, brake fluid
vaporizationhasbeen suspected as a possible cause of
someCollisions and a proper inspection procedure has
beenrecommended. Disk brakes are exposed to large thermal
stresses During routine braking and extraordinary thermalStresses
during hard braking. High decelerationsTypical of passenger
vehicles are known to generateHigh temperatures in a fraction
of a second. TheseLarge temperature excursions have two REFERENCES [1] dr. Ramesha, santhoshkumar and bharathshekar, “temperature
Distribution analysis of aluminum composite and cast iron brake Drum using ansys”, „international journal of emerging trends in Engineering and development‟, 2012, vol. 3, issn 2249-6149, pp 281-292. [2]ameershaik and lakshmisrinivas,“structural and thermal analysis Of disc brake without cross-drilled rotor of race car”, „international journal of advanced engineering research and studies‟,
2012 , vol. I, issn 2249-8974, pp 39-43
possibleOutcomes: thermal shock that generates surfaceCracks; and/or large amounts of plastic deformation In the brake rotor. In the absence of thermal shock,
arelativelysmall number of high braking cycles arefoundto
generate macroscopic cracks runningthroughthe rotor
thickness and along the radius of The disk brake. Heat generation due to friction in theSliding contact of two bodies influences friction andWear
characteristics of brake systems
IV. ACKNOWLEDGMENT The authors are thankful to all friends and Professors
tohelpthis paper and would like to thank the
anonymousReviewers for their comments which were very
helpful inImproving the quality and presentation of this paper.
[3]chogducho and sooickahn, “thermo-elastic analysis for chattering
Phenomenon of automotive disk brake”, „ksme international Journal‟, 2001,vol-15, pp 569-579. [4] gurumurthynathi, k. Gowtham and satishreddy, “coupled
Structual / thermal analysis of disc brake”, ijret 2012, vol.1,
Pp.539-553. [5] v. M. Thilak , r. Krishnaradeepan&r.palani ,“transient thermal And structural analysis of the rotor disc of disc brake”, international Journal of scientific & engineering research volume 2, issue 8, August-2011 issn 2229-551..
ISSN NO: 2454-1958 Special Issue Tech-Ed 2016 (International Conference) Page 177
BAMBOO: AN ECOFRIENDLY MATERIAL
FOR SUSTAINABLE DEVELOPMENT
SHUBHANGI GONDANE Dr.P. N. BELKHODE MANISHA JOSHI Tulsiramji Gaikwad-Patil College of Lakshminarayan Institute of Priyadarshini College
Engg.& Tech.Nagpur Technology,Nagpur of Engineering,Nagpur
Abstract: Widely used in Asian, Pacific Islander and Central and Southern
American cultures, bamboo is a sustainable and sturdy building
material.. Bamboo is a naturally occurring composite material
which grows abundantly in most of the part of the world. It is treated as a composite material because it has cellulose fibers
imbedded in a lignin matrix. Using bamboo rather than metal also
holds several advantages for producers — and for the environment.
As a cheap and fast-grown resource, with superior physical and
mechanical properties, bamboo offers great potential as an
alternative to wood. Using bamboo rather than metal also holds
several advantages for producers — and for the environment.
Bamboo based industry has vast potential for generating income
and employment, especially in the rural areas. The paper brings out the taxonomy, chemical composition, physical and mechanical
properties of bamboo with a focus on sustainable development.
Keywords: Sustainable Development, bamboo, mechanical properties
Introduction Unlike wood, bamboo (a member of the grass family)
regenerates very quickly. It is, in-fact, one of the fastest
growing plants in the world, with the fastest growth rate
reaching 100cm in a 24-hr period (Farrelly, David (1984).
The Book of Bamboo. Sierra Club Books.). Sustainable
development (Carlos J. Castro, 2004) is widely
acknowledged as a key concept for humanities future.
Sustainability calls for balancing short term business
interest and long term development of both the society and
company itself. It involves the simultaneous pursuit of
economic, social and environmental objectives (Markus
will, 2005). After more than 200 years of industrialization in
the Western world and more than 50 years of 'development'
in the Third World, the benefits delivered by the grand
design of progress and modernity are, at best, ambiguous.
Despite phenomenal advances in science, technology,
medicine and agricultural production, the promise that
'development' would eradicate world poverty remains
unfulfilled in several parts of the globe, especially in the
Third World (Subhabrata Bobby Banerjee, 2003). Even the
biggest economies shiver with small up and down in the
industry. Reason behind this ambiguity is that the
sustainability aspect is not being addressed properly in fast
moving development efforts (Brian Kermath, 2007).
Sustainable development refers to the equity, in particular
concerning the todays's and future generations as defined by
Brundtland Commission (WCED, 1987).This true for the
resources as well as for any business. If we consider the
sustainability of wood resource around the globe,
availability of industrial wood from natural forests has been
on decline for many years. This has raised a growing
concern to save forests. Consequently the wood based
industry as well as the opportunities in this area have also
affected to a large extent. Wood is largely being replaced by
plastics, wherever possible. However the environmental
hazards of the plastics always keep a hanging sword. On the
other hand the strength properties of the plastics can never
be compared with the industrial wood. Even the timbers
available from fast growing plantation species generally
have lower strength properties, dimensional stability and
service life. Bamboo is renewable, abundantly available,
low cost and environment friendly (Azmy H.J. Mohamed et
al., 2007) wood resource that creates an eye of hope for the
struggling wood based industry with its excellent strength
(A.C. Sekhar et al, 1962; Limaye, V.D., 1952). It has
tremendous economic potential with its significant
applications and innovative products. Since the bamboo is
widely available across the different parts of India, it offers
great opportunities to the micro, small and medium scale
enterprises (Markus Will, 2008). Since the bamboo resource
is widely available across the rural domains and industrial
effort requires a lot of labour, bamboo has a great potential
to offer job opportunity and income source to the rural
masses. This can ultimately lead to the sustainable
development of rural folks (V. Sorna Gowri, 2003;
Suresh Moktan, 2007) and hence contributing significantly to the economy.
Mechanical and Physio-chemical Properties of Bamboos
Bamboo offers a vast variety of commercial and domestic
products due to its excellent mechanical, physical and
chemical properties (Li Xiaobo, 2004). Bamboo is a natural
lingo-cellulosic composite in which cellulose fibers are
ISSN NO: 2454-1958 Special Issue Tech-Ed 2016 (International Conference) Page 178
embedded in the lignin and hemi cellulose matrix. Bamboo
contains 44.5% cellulose, .5% lignin, 32% soluble matter,
0.3% nitrogen and 2% ash. Average length is 2 mm and
average diameter is between 10-20m (Adamson, W.C,
1978). The geometry of bamboo's longitudinal profile has
macroscopically functionally graded structure, which can
withstand extreme wind loads. Fiber distribution is
transverse cross-section at any particular height of bamboo,
is dense in outer periphery and sparse in inner periphery.
Bamboos mainly consist of the roots, culm and leaves. The
culms are the most useful part in a bamboo. They are hollow
and vary in sizes, diameters, colors and textures. The culm
consists of the strands of cellulose fibers and the lignin
matrix. Spaces between adjacent strands of fibers are filled
with lignin, a type of resin. The number of fibrous strands
increases toward the outer surface of the culm. Cellulose
fiber is stronger than the lignin matrix. Also the cross-
sectional area of the culm changes from location to location.
Hence, the cellulose strand distribution would be different at
different sections plant species. Bamboo has different
mechanical properties in the three dimensions: axial, radial
and tangential. However, bamboo is a biological material
and it is subjected to great variability and complexity due to
various conditions such as years of growth, soil and
environmental conditions and the location of bamboo culm
within the bamboo. Hence, it is observed that the
mechanical properties of bamboos vary enormously (A. K.
Ray et al., 2005). Bamboos are available in the form of
different species and the mechanical and physio-chemical
properties vary from one species to other species.
Throughout the world there are about 500 different species
of bamboo. Mechanical and chemical properties are not
fixed for all the species. It depends on type of species,
length (from top to bottom), horizontal layer (from inner
side to outer periphery), age of the tree (in years). N. K Naik
(2005) characterized seven species of bamboos: Bambusa
Balcooa, Bambusa Bambos, Bambusa Nutans, Bambusa
Tulda, Dendrocalamus Giganteus, Dendrocalamus Strictus,
and Melocanna Bambusoides. He found great variation in
mechanical properties for these seven species. Aging of a
bamboo culm affects physical, chemical, and mechanical
properties. The physical and mechanical properties of
bamboo vary with the age of the bamboo and the height of
the culm (Chauhan, 2000) bamboo. The increase in weight
is cumulative and directly related with age. Strength
properties are reported to decrease in older culms (Zhou,
1981). Limaye (1948,1952) found that older culms of
Dendrocalamus strictus became 40-50 percent stronger and
stiffer than young ones. Sekhar et al. (1962) found highest
values in 3-4 year old culms of Bambusa nutans.
Except one year old bamboo, alcohol-toluene and hot water
extractive contents increased from the bottom to the top
portion. Alcohol-toluene extractive content showed a
continuous increase from one year old to five year old
bamboo. Hot water extractives showed an increase from one
year old to three year old bamboo and then decreased from
three year old to five year old bamboo. Li Xiaobo (2004)
found that the fiber distribution has the highest
concentration in the outer layer of bamboo. The moisture
content of three year old bamboo in the green condition
decreased from the bottom to the top portion. Specific
gravity and bending properties of bamboo vary with age ,
height location as well as horizontal layer. They all increase
from one year old to five year old culms. The outer layer
had significantly higher specific gravity and bending
properties than the inner layer. The top portion had a
consistently higher specific gravity than the bottom portion.
The outer layer had a more decisive role in supporting
bamboo than the inner layer. Bending strength had a strong
positive correlation with specific gravity. In order to
industrially use bamboo strips efficiently, it is advisable to
retain outer surface material to produce high strength
bamboo composites. Compression properties parallel to the
longitudinal direction were significantly higher than
perpendicular to the longitudinal direction. The variability
of compression perpendicular to the longitudinal direction
was significantly higher than parallel to the longitudinal
direction. Bamboo grows in different climates from plane to
high mountain side. The mechanical and physico-chemical
properties of the bamboo as well as bamboo composites are
also influenced by the climatic and ecological factors,
cultivation techniques and harvesting details. Thus the
origin of the bamboo must be considered, whenever finding
specific applications.
Bamboo Products
Bamboos is most suitable for structural products due to its
good mechanical and physical properties. Bamboo
composites (Seema Jain et al., 1992) are normally used for
structural products rather than the raw bamboos. This is
because of possible variability of properties along the
longitudinal and radial directions as well as physical
dimensions of the products required. For load carrying
structural composite products, mechanical properties such as
tensile strength, compressive strength, shear strength,
flexural strength and bending elasticity modulus are
important. For flooring tiles and veneers, through-the-
thickness compressive strength, hardness, abrasion
resistance and slip resistance are important. For structural
assemblies, nail withdrawal strength is important.
Applications of bamboo products have been increasing. The
main application areas are: flooring, veneer, handicrafts,
decorative boards, sports equipment and other building
materials. Bamboo is used as raw material for pulp, paper
and panel board industries. They are also common in many
traditional applications such as: for fencing, water pipes,
fishing rods, umbrella handles, musical instruments and
decorative handicrafts. The applications of bamboo, which
can really push the small and medium scale enterprises, are
discussed in the following section.
Bamboo Based Panels
Bamboo based panels are products made from raw bamboo through a series of mechanical and chemical procedures,
ISSN NO: 2454-1958 Special Issue Tech-Ed 2016 (International Conference) Page 179
such as spraying glue, laying up, and hot pressing. The
bamboo-based panels have advantages of large size, high
strength, stabilization in shape and size, and its parallel and
perpendicular strength and property that can be adjusted
according to different demands (Zhang et al, 1995). Bamboo
based panels are relatively ideal engineering materials. At
present, the main sorts of bamboo based panels which can
be developed in the construction field are: Mat Plybamboo,
Curtain Plybamboo, Laminated Bamboo of Strips,
Plybamboo, Bamboo Particleboard, Bamboo Composite
Board. At present, bamboo based panels have been widely
used to the manufacture the bottom boards of vehicles,
moulding boards of construction, scaffoldings, and has
partly taken the place of wood, steel, plastic etc as raw
materials of furniture and decorating materials. Bamboo-
based composite may also be the suitable alternative as the
materials of prefabrication in terms of the various
advantages they contain. However, the application of
bamboo based panels for this utilization is still very limited.
Development of panel products based on bamboo strip are
gaining importance as these panel products reassemble
wood when used in a particular fashion as in parallel
laminates. These laminates will have superior physical
mechanical properties and are suitable for structural and
specialized application. More over requirement of resin
adhesives is expected to be lower compared to bamboo mat
based composites and therefore making the products cost
effective which are considered to be ideal for alternates to
wood and plywood for several end use applications.
Bamboo laminates could replace timber in many
applications such as doors and windows, frames, partitions,
furniture, flooring and some structural applications. IPIRTI
has already developed a technology for bamboo laminates
that is ready for commercialization.'
Paper, Textiles and Board
Bamboo fibers are relatively long (1.5-3.2 mm) and thus
ideal for paper production (El Bassam, 1998). In India, 2.2
million tonnes of bamboo per year are processed into pulp,
making up about two-thirds of total pulp production
(Adamson et al., 1978; IFAR/INBAR, 1991). At least eight
North American suppliers are importing and marketing
tongue-and-groove flooring made from laminated bamboo,
which is said to be as hard, durable and dimensionally stable
as oak or other hardwood flooring (e.g. Plyboo America
Inc., Kirkville, NY). Bamboo culms are sliced into strips,
which are boiled to remove starch, dried, and laminated into
solid boards using urea-formaldehyde adhesives. The boards
may be treated with preservatives such as boric acid, before
or after laminating, or both, and a darker amber color may
be produced by pressure-steaming the bamboo to carbonize
it. Although the adhesive tends to emit formaldehyde for a
long time after production, the amount of ureaformaldehyde
resin in a laminated product is much less than in a panel
board product (Environmental Building News, 1999).
Bamboo textiles are much softer than the softest cotton,
bamboo fabrics have a natural sheen to the surface and they
really do feel similar to silk textiles or cashmere fabrics.
Bamboo fiber based fabrics are naturally anti-microbial and
requires no harmful chemicals. Bamboo textiles contain an
agent, called 'bamboo kunh', this agent prevents bacteria
from cultivating. Bamboo clothing not only feels cooler in
the summer but it is significantly warmer in the winter.
Bamboo fabrics make a lighter garment that is more
comfortable.
Bamboo Food
Bamboo finds a new fashion in food with wonderful recipes
of Bamboo shoots. These bamboo shoots are young, new
canes that are harvested for food before they are two weeks
old or one-foot tall. Bamboo shoots are crisp and tender.
Bamboo shoots are low in fat and calories. The shoots are a
good source of fiber. Fiber helps keep cholesterol levels in
check and plays a role in preventing colon cancer. Bamboo
shoots are also a good source of potassium. It helps to
maintain normal blood pressure and a steady heart beat.
When it comes to phytochemicals, natural substances found
in plants, bamboo shoots hold promise. They contain
lignans and phenolic acids. Lignans, a component of fiber,
exhibit a number of important properties that are undergoing
research. Lignans appear to have anticancer, antibacterial,
antifungal and antiviral activity. Phenolic acids have mild
anti-inflammatory properties and are potent antioxidants.
Antioxidants help prevent cancer and the blood vessel injury
that can start atherosclerosis. About 200 species of bamboo
can provide edible and palatable bamboo shoots, including:
monopodial bamboos: Acidosasa edulis, Chimonobambusa
quadrangularis, Phyllostachys heterocycla var. pubescens, P.
praecox, P. dulcis, P. iridescens, P. makinoi, P. nuda, P.
prominens, P. sulphurea cv. viridis, P. vivax, Pleioblastus
amarus and Qiongzhuea tumidinoda; and 2. sympodial
bamboos: Bambusa rigida, B. pervariabilis, Dendrocalamus
latiflorus, D. asper, D. brandisii, D. hamiltonii,
Dendrocalamopsis oldhami, D .beecheyana, D. beecheyana
var. pubescens, D. stenoaurita, D. variostriata and
Schizostachyum funghomii. Fresh bamboo shoots are
delicious and healthy, with a high fibre content. Bamboo
vegetables can be found in Chinese grocery stores and
restaurants worldwide. After cooking the shoots are still
crisp, because cooking does not destroy their texture.
Cooked bamboo shoots can be stored in containers and
shipped worldwide. bamboo shoots of a number of species
are a well-known feature of Chinese and other Asian
cuisine, generally imported into the USA in canned form
(one estimate suggests 30,000 t/year in the early 1990s).
Exports from Taiwan are worth $50 million annually, and
those from Thailand $30 million, with much of this going to
meet Japanese demand (Scurlock et al., 2000).
Combustion and other Bio-energy Applications
Molini and Irizarry (1983) proposed the use of bamboo as a
fuel for power generation in Puerto Rico in preference to
sugar cane, since its lower moisture content at harvest obviates the need for drying, but they provide few data in
support of their case. Limited experience has been gained
ISSN NO: 2454-1958 Special Issue Tech-Ed 2016 (International Conference) Page 180

using de-lignified bamboo pulp as a substrate for ethanolic
fermentation (Ram and Seenayya, 1991). Early work on
preparing a diesel-like fuel from bamboo culms (Piatti,
1947) is cited by Tewari (1992); the process appears to have
been the pyrolysis of "black liquor" from bamboo pulping,
but does not seem to have progressed beyond the laboratory
scale (Piatti, 1947). The review by Scurlock et al. (2000)
evaluates bamboo as a potential bio energy feedstock, and
tackles some of the myths and facts surrounding it--its
"prodigious" productivity, its "disastrous" flowering, its
multiple uses, etc.
Bamboo Charcoal and Activated Carbon Bamboo charcoal is traditionally used as a substitute for
wood charcoal or mineral coal. Bamboo charcoal is a good
air purifier as it has the property of absorbing odor, moisture
and harmful gases. It is also a good water purifier as it filters
and absorbs pollutants, chlorine, pesticides and poisonous
materials. It has an extremely porous structure and is a
better and eco-friendly option to wood charcoal. The
domestic applications include charcoal pillows, mattresses
and to preserve freshness in refrigerators, deodorizer in
moist places. This charcoal has a number of potential
applications in the agriculture activities, such as to change
the soil structure, eliminate negative effects of pesticides on
plants, increase soil temperature and amount of water
content. The industrial applications are health-care, gas
masks, absorbing radioactive xenon and krypton, safe
disposal of water and waste gases. The calorific value of
bamboo charcoal is almost half that of oil of the same
weight. Activated bamboo charcoal can be used for cleaning
the environment, absorbing excess moisture and producing
medicines. China is a leader in its production. At present,
Japan, the Republic of Korea and Taiwan Province of China
are the main consumers, but its importation is rapidly
expanding in Europe and North America. Production of
bamboo charcoal does not require a very high level of
infrastructural and machinery investment. Thus, the
opportunity is open to micro, small as well as medium
enterprises. Not only the export has a lot of scope, but the
local marketplace also has a plenty of consumers for this
product.
Similar to the Bamboo Charcoal, Activated Carbon (S.
Bakshi et al., 2003) throws other vistas of opportunities. It is
a black solid substance resembling granular or powdered
charcoal. It is extremely porous with a large surface area,
and typically produced from organic precursors such as
bamboo, coconut shells, palm-kernel shells, wood chips,
sawdust, corncob and seeds. The raw material is first heated
in an inert environment to obtain the carbonaceous material,
which is activated further to derive a highly porous final
product. Activated carbon has several important uses
including solution purification, removal of tastes and odours
from domestic and industrial water supplies, vegetable and
animal fats and oils, alcoholic beverages, chemicals and
pharmaceuticals and in the waste water treatment. It also
finds use in purification of gases, liquid phase recovery,
separation processes and as catalyst and catalyst supports.
The opportunity is particular of concern to bamboo as the
wastage of bamboo industry can be efficiently utilized. The
process of conversion of bamboo into mat boards, laminated
boards, flooring tiles etc. generates a lot of waste material in
dust & chip forms. Also about 30% of the culm length (top
portion for reduced diameter & wall thickness and bottom
part for semi-rigid construction with too many knots) cannot
be converted into the aforesaid products. These bamboo
wastes are thus best converted into activated carbon for a
high value-addition. With a view to exploring the potential
of bamboo based activated carbon on a commercial scale,
the National Mission on Bamboo Applications
(www.tifac.org.in) prepared a complete 'business
opportunity' report altogether with the techno-economic
evaluation, assessment of market demand and necessary
investment for entrepreneurial actions. The report provides a
road map for a viable project for producing activated carbon
on a commercial scale. The Mission supports such projects
in partnership with the industries.
Bamboo Housing The bamboo species are widespread through the tropical,
subtropical and temperate climates around the globe. The
fibers of bamboo poles posses' high strength both in tension
and compression. Its compressive strength is roughly twice
the compressive strength of concrete and bamboo has
roughly the same tensile strength to weight ratio as steel has.
The hollow cross section and solid diaphragms at regular
intervals contribute to the strength of the bamboo pole. It is
a renewable plant with a very short rotation period. Bamboo
grows to its full size for about a year. Another two or three
years are required for the plant to gain its high strength.
Bamboo production doesn't involve much energy
consumption and therefore adoption of bamboo housing
helps to preserve the environment. There are three main
types of bamboo housing: (i) traditional houses, which use
bamboo culms as a primary building material; (ii) traditional
bahareque bamboo houses, in which a bamboo frame is
plastered with cement or clay; and (iii) modern
prefabricated houses made of bamboo laminated boards,
veneers and panels. Experts estimate that over one billion
people live in traditional bamboo houses. These buildings
are usually cheaper than wooden houses, light, strong and
earthquake resistant, unlike brick or cement constructions.
New types of prefabricated houses made of engineered
bamboo have certain advantages. They can be packed flat
and transported long distances at a reasonable cost. They are
better designed and environmentally friendly. Bamboo
housing is being successful used around the globe and even
in India, this is very popular in the north eastern states
(Ramachandra Laha, 2000). Bamboo is being widely used in
these states for the supporting posts, flooring, frames,
partitions, ceilings, walls, thatching, doors, windows and
tying.
Bamboo Flooring Bamboo flooring is a quality product that can be used widely and has a large, global consumer market. It has
certain advantages over wooden floors due to its
ISSN NO: 2454-1958 Special Issue Tech-Ed 2016 (International Conference) Page 181
smoothness, brightness, stability, high resistance, insulation
qualities and flexibility. Bamboo flooring has a soft natural
luster and maintains the natural gloss and elegance of
bamboo fibre. This flooring is attractive to the demanding
markets in Europe, Japan and North America. The estimated
annual production of bamboo flooring in China was 17.5
million m2 in 2004. Exports account for some 65 percent of
total production (Customs General Administration of China,
2004).
Bamboo weaving products and crafts Bamboo crafts and woven mats are traditional products in
China, India, Malaysia, the Philippines and Thailand. The
technique has been known for several thousand years. These
diverse products have become an indispensable part of daily
life, literature and art. There are nearly 20 categories of
woven bamboo products in Asia, including fruit baskets,
trays, bottles, jars, boxes, cases, bowls, fans, screens,
curtains, cushions, lampshades and lanterns. Bamboo Furniture Traditional bamboo furniture uses natural round or split
bamboo. A new type of 'pack-flat,' 'knockdown' furniture
uses glue-laminated bamboo panels. Unlike the traditional
design, this furniture may be shipped in compact flat packs,
to be assembled on the spot. The new design overcomes
many of the problems of traditional bamboo furniture, such
as high labour and transportation costs, low productivity,
instability, varying quality and susceptibility to insects and
fungi. At the same time, it retains the distinct physical,
mechanical, chemical, environmental and aesthetic features
of bamboo. The bamboo furniture offers excellent durability
and light weight characteristics at a much cheaper price. It is
becoming popular, even in hotels and resorts. A number of
micro and small scale industries are producing bamboo
furniture in the north-east India and this is being supplied in
the different parts of India. Export of laminated bamboo
furniture is growing rapidly. However, trade statistics
currently do not capture the value, owing to the absence of a
special code for bamboo furniture. It is usually classified as
wooden furniture.
Government of India Initiatives In India, recently a re-discovery of the potential of bamboo
for developing it as one of the sunrise industries resulted in
launching of an integrated bamboo development programme
by the Prime Minister on 05 June 1999 with a view to focus
on the development of bamboo sector. Subsequently, the
Planning Commission, Government of India prepared an
Action Plan to give maximum emphasis for promotion and
development of bamboo during the Tenth Plan. The Action
Plan proposed creation of 8.6 million jobs in the bamboo
based development programmes to enable 5.01 million
families to escape poverty on a sustainable basis,
upgradation of skills of crafts person, food and nutritional
security through consumption of bamboo shoots, etc. for
livelihood and nutritional security. The Action Plan also
envisaged laying down a foundation of a modern bamboo
economy with input from science and technology, people's
participation, industrial application and strong linkage with
market capable of meeting global competition. In addition to
the paper pulp industries, the potential of bamboo on other
large-scale industries like bamboo shoot processing, bamboo
based boards, flooring boards, furniture, new uses in building
and road construction, etc. was also emphasized. Following the
Planning Commission's effort on bamboo sector development,
the Minister of Science and Technology on Technology Day,
2002 established a National Mission on Bamboo Application
(NMBA) under Technology, Information, Forecasting and
Assessment Council (TIFAC), Department of Science and
Technology to focus on the commercialisation of value added
applications in the bamboo sector. Different State Governments
have also taken initiative to develop bamboo sector on a
commercial basis.
Bamboo is a versatile and useful group of plants, capable of
providing ecological, economic and livelihood security to
people. As per estimates, 8.96 million ha forest area of the
country contains bamboo amounting to 12.8 percent of the
forest cover. India has the largest bamboo forests in the
world. Two-third of the growing stock of the bamboo in
India is available in the North-Eastern States. India ranks
second in the world in bamboo diversity with 136 species,
while China with 300 species is leading in genetic diversity
of bamboo. Out of this, 58 species belonging to 10 genera
are found in the North-Eastern region. In Asia, Bamboo is
known as the poor man's timber/poor man's gold/green gold
because growing, harvesting and processing are essential
subsistence activities. It is mainly used for domestic
consumption as a raw material for useful utensil and farm
tools, as a building material for shelter, fences, bridges and
even water pipes. There has been a growing awareness in
recent years about the importance of bamboo being an
important means of economic growth and of improving the
socio-economic conditions of the rural poor. Bamboo as an
industrial material can substitute wood and that too at low
cost. Bamboo has been traditionally harvested from forest
lands in India and the homesteads which may have a few
clumps of one of the many species of bamboo for household
use but very little intervention in terms of purposive
planting has been done in the past. The demand for bamboo
has increased, in recent years, within the country and abroad
as a raw material for furniture making, as panel boards
substituting wood, as agricultural implements,
house/construction related uses and as a vegetable. China's
focused intervention to harness bamboo's potential has led
to increase in its productivity by more than 10 times since
1970 when it was 2-3 tonnes/ha/annum and today China's
total export value of bamboo products is more than $ 550
million per annum. With a view to harness the potential of
bamboo crop in the country through a multi-disciplinary
approach, the Planning Commission brought out a report
titled "National Mission on Bamboo Technology and Trade
Development" (NMBTTD) in 2001-02. The report clearly
brings out the country's future potential in bamboo for the
next two decades.
ISSN NO: 2454-1958 Special Issue Tech-Ed 2016 (International Conference) Page 182

Conclusion Bamboo is a kind of fast- growing and renewable resource,
which is cheap and widely available. It has unique
characteristics and advantages in bringing ecological and
social benefits. Bamboo based panels have similar
properties to wood based panels. Since the utilization of
bamboo will be well consistent with the sustainable
development, bamboo based panels will become very
competitive construction materials when an extensive
factors are taken account of. At present, there is a large gap
in the supply of pre-fabricated construction materials, and it
is a very good opportunity for bamboo based panels to
occupy the market, since they have so many merits
compared with other building materials. However, a wide
popularization of the utilization of bamboo needs to be done
to make bamboo based panels better accepted by people
around the world. If bamboo based panels can be well
utilized in the construction industry, they will contribute a
lot to the sustainable development of the prefabrication
industry and the protection of environment. On the other
hand, Bamboo has multiple applications in social growth
and it has been utilized by the people for their cultural
growth from ancient times. Most of the bamboo plantation
in India are in Kerala and North-East states. In fact, the
bamboo has a potential of sustainable development along
with the cultural and social growth. Central government and
state government have taken good initiatives for bamboo
plantations and pushing the bamboo industry. The initiatives
will certainly go a long way in truly evolving value-added
application avenues for bamboo for catering to domestic and
overseas markets through an indigenous technology route as
well as entrepreneurial actions in MSMEs. Carlos J.
Castro(2004), Sustainable Development: Mainstream and
Critical Perspectives, Organization & Environment, Vol. 17
(2), pp. 195-225
References
A.K. Ray, S. Mondal, S.K. Das and P. Ramachandrarao (2005), Bamboo-A functionally graded composite--
correlataion between microstructure and mechanical strength, Journal of Material Science, Vol. 40, pp. 5249-
5253
A.C. Sekhar, B.S Rawat, and R. K Bhartari (1962), Strength
of bamboo (Bambusanutans). Indian Forester, Vol. 88(1), pp. 67-73.
Adamson, W.C., G.A. White, H.T. Derigo and W.O.
Hawley (1978) Bamboo Production Research at 12. Savannah, Georgia, 1956-77. USDA-ARS-S-176. U.S.
Department of Agriculture, Agricultural Research Service,
Savannah, Georgia., pp. 17
Azmy H.J. Mohamed, J.B. Hall, Othman Sulaiman, Razak Wahab, Wan Rashidah Wan A.B. Kadir (2007) ,Quality
management of the bamboo resource and its contribution to
environmental conservation in Malaysia, Management of
Environmental Quality: An International Journal ,Vol.
18(6), pp. 643-656
Brian Kermath (2007), Why go native? Landscaping for
biodiversity and sustainability education, International
Journal of Sustainability in Higher Education, Vol. 8 (2),
pp. 210-223 Chauhan, L., S. Dhawan, and S. Gupta. (2000), "Effect of age on anatomical and physicomechanical properties of three Indian bamboo species", Journal of the T.D.A., Vol.
46, pp. 11-17.
El Bassam, N. (1998), Energy Plant Species: their use and
impact on environment and development, James and James Science Publishers, London
IFAR/INBAR (1991), Research Needs for Bamboo and
Rattan to the Year 2000, Tropical Tree Crops Program,
International Fund for Agricultural Research/ International
Network for Bamboo and Rattan, Singapore. Jim Bowyer,
Jeff Howe, Phil Guillery (2005), Bamboo Flooring:
Environmental Silver bullet for Faux Savior,
http://www.dovetailinc.org/documents/DovetailBamboo030
5.pdf, [Last Accessed Aug. 25, 2008]
J. M. O. Scurlock, D. C. Dayton and B. Hames(2000) ,
Bamboo: an overlooked biomass resource?, Environmental
Sciences Division Publication No. 4963, Oak Ridge
National Laboratory, Tennessee
Kai Zheng and Chen Xuhe (2005), Potential of
Bamboobased Panels Serving as Prefabricated Construction
Materials, www.inbar.int/Econo_devep/proceeding/Pr-Zheng-Potential %20of%20Bamboo-based%
20Panels(11.20).pdf [Last Accessed August 20, 2008]
K.K. Adarkwa and R.A. Oppong (2007), Poverty reduction
through the creation of a live able housing environment: A
case study of Habitat for Humanity International housing
units in rural Ghana, Property Management, Vol. 25, No. 1,
pp. 7-26
Li Xiaobo (2004), Physical, chemical, and Mechanical
properties of Bamboo and its utilization potential for
Fiberboard manufacturing, Master of Science Thesis,
Louisiana State University, Available at
http://etd.lsu.edu/docs/available/etd-04022004-
144548/unrestricted/ Li_thesis.pdf [Last Accessed Sep. 15,
2008]
Limaye, V.D. (1948), "Effect of age and season of felling on the strength properties of bamboo, Indian Forester, Vol.
74(1), pp. 17-18.
Limaye, V.D. (1952), Strength of bamboo (Dendrocalamus strictus), Indian Forester, Vol. 78 (11), 558-575.
ISSN NO: 2454-1958 Special Issue Tech-Ed 2016 (International Conference) Page 183

Markus Will (2008), Talking about the future within an
SME? Corporate foresight and the potential contributions to
sustainable development, Management of Environmental
Quality: An International Journal, Vol. 19, No. 2, pp. 234-
242
Molini, A.E. and J.G. Irizarry (1983), Bamboo as a
renewable energy resource, In: Proceedings of the First Pan
American Congress on Energy and Second National
Conference on Renewable Energy Technologies, 1-7
August, 1982, San Juan, Puerto Rico. Report No. CONF-
8308231, Center for Energy and Environment Research, San
Juan.
National Bamboo Mission,
http://dacnet.nic.in/nbm/agenda.html, Last Accessed Sep. 15, 2008
Naik, N.K.(2005), Mechanical and Physico-Chemical
Properties of Bamboos carried out by Aerospace
Engineering Department, Indian Institute of Technology--
Bombay,
http://www.bambootech.org/files/mechanicaltesting%20rep
ort.pdf [Last Accessed Aug. 25, 2008]
Oluf Langhelle (1999), Sustainable Development: Exploring
the Ethics of Our Common Future, International Political Science Review, Vol. 20 (2), 129-149
Piatti, L. (1947) Flussige brennstoff aus bambus (liquid fuel
from bamboo). Schweizer Archiv fur Angewandte
Wissenschaft und Technik, Vol. 13, pp. 370-376
Ram, M,S, and G. Seenayya (1991) Production of ethanol
from straw and bamboo pulp by primary isolates of
Clostridium thermocellum. World Journal of Microbiology
and Biotechnology 7, 372-378.
Ramachandra Laha (2000), Bamboo uses for housing by
different tribes of Northeast India, Bamboo Science and Culture, Vol. 14(1), pp. 10-14
Seema Jain, Rakesh Kumar and U. C. Jindal (1992),
Mechanical Behaviour of Bamboo and Bamboo Composites, Journal of Material Science, vol. 27, pp. 4598-4604
S. Amada and R.S. Lakes (1997), Viscoelastic properties of bamboo, Journal of Material Science, Vol. 32, pp. 2693-
2697
S Baksi, Soumitra Biswas & S Mahajan (2003), Activated
Carbon from Bamboo--Technology Development towards
Commercialisation, BAMTECH-2003, March 12-13,
Guwahati, India
Shigeyasu Amada, Yoshinobu Ichikawa, tomotsu Munekata,
Yukito Nagase and Hiroyuki Shimizu (1997), Fiber Texture
and Mechanical Graded Structure of Bamboo, Composites
Part B (28B), pp. 13-20
Suresh Moktan (2007), Development of Small and Medium Enterprises In Bhutan: Analysing Constraints To Growth, South Asian Survey, Vol. 14 (2), pp. 251-282
Tewari, D.N. (1992) A Monograph on Bamboo. International Book Distributors, Dehra Dun, India. pp 498
Tulay Esin, Izzet Yuksek (2008), A study on ecological
properties of building materials used in traditional buildings (in Turkey), Facilities, Vol. 26 (5/6), pp. 229-241
Vivienne Collinson (2008), Leading by learning: new directions in the twenty-first century", USA Journal of Educational Administration, Vol. 46, No. 4, pp. 443-460
V. Sorna Gowri and Mohini Saxena (2003), "Bamboo
Composites--for sustainable rural development", Journal of
Rural Technology, Vol. 1(1), pp. 6-10
Subhabrata Bobby Banerjee (2003), Who Sustains Whose
Development? Sustainable Development and the
Reinvention of Nature, Organization Studies, Vol. 24(1), pp.
143-180
Wolday Amha, Gebrehiwot Ageba (2006), Business development services
(BDS) in Ethiopia .Status, prospects and challenges in the micro and small enterprise sector, International Journal of
Emerging Markets, Vol. 1(4), pp. 305-328
World commission on environment and Development (WCED) (1987), Our Common Future, Oxford University
Press, New York
Zhou, F.C.. (1981),"Studies on physical and mechanical properties of bamboo woods", Journal of Nanjing
Technology College of Forest Products, Vol. 2, pp. 1-32.
ISSN NO: 2454-1958 Special Issue Tech-Ed 2016 (International Conference) Page 184
ISSN NO: 2454-1958 Special Issue Tech-Ed 2016 (International Conference) Page 185
Production of Enriched Compost from Water hyacinth
(Eichorina crassipes)
Mrs Arti Mathur, Sanjeev K Mathur Dr A.B.Singh Dr A subbarao Phd Scholar Phd Scholar Principal Scientist Ex Director
Barkatullah University Bhopal S.A.T.I. Polytechnic College Indian Institute of Soil Science Indian Institute of Soil Science
Vidisha Nabi bag Bairasia Road Bhopal Nabi bag Bairasia Road Bhopal
Abstract - Water hyacinth, an aquatic weed is known for
causing a series of problems for aquatic life. It also has a few
advantages to its recognition. If targeted properly, it can act
as an extremely important alternative for meeting some of
the most urgent needs of agriculture community. This study
proposes and signifies that water hyacinth has remarkable
nutritive properties that can be used for the production of
nutrient enriched compost which not only result in healthy
aquatic system but also add as a advantages on agriculture
lands. The proximate analysis of different types of water
hyacinth composts is observed. The results shown that
various compost formed by using different amendments, an
indicator for enriched water hyacinth composts.
Key words – water hyacinth, compost, amendments.
Introduction - Water hyacinth is one of the most
productive plants on earth and considered as one of the
world’s worst invasive aquatic plants (Gopal, 1984;
Malik, 2006). Water hyacinth is one of the worst weed in
the world aquatic or terrestrial environment (Holm et al.,
1977). Compost is defined as the product resulting from
the controlled biological decomposition of organic
materials. Compost can be derived from a number of feed
stocks including yard trimmings, bio solids (sewage
sludge), wood by-products, animal manures, crop
residues, biodegradable packing, and food scraps. Mature
compost has little resemblance in physical form to the
original biodegradable from which it is made. Compost is
valued for its organic matter content, and it typically used
as a soil amendment to enhance the chemical, physical
and biological properties of soil. Compost is typically not
a fertilizer, although when used at normal rates it can
reduce the amount of required fertilizer. Compost can
increase the water holding capacity of sandy textured
soils, and can improve structure and water movement
through heavier textured soils that are high in silt and clay
content. Compost has been considered as a valuable soil
amendment for centuries. Most people are aware that
using composts is an effective way to increase healthy
plant production. It helps save money, reduces the use of
chemical fertilizers, and conserves natural resources.
Compost provides a stable organic matter that improves
the physical, chemical, and biological properties of soils,
thereby enhancing soil quality and crop production. When
correctly applied, compost has the beneficial effects on
soil properties, thus creating suitable conditions for root
development and consequently promoting higher yield
and higher quality of crops.
(www.agritech.tnau.ac.in/org_farm/orgfarm_compos
ting.html).
Composting process refers to the conversion of green
waste into organic fertilizer with compost as an end
product. Composting is the biological decomposition and
stabilization of organic substance under condition that
allows development of the thermophilic temperature as a
result of biologically produced heat, with a final product
sufficiently stable for storage and application to land
without any adverse environmental effect (Haug, 1980).
Composting is a biooxidative process in which the
microorganism transform the more easily biodegradable
organic matter into carbon dioxide, water, vapours, and
other minerals (mineralisation process) or, with time, into
more stable organic matter (humiliation process) called
humic substances which are physically very similar to
those present in soil. Composting is not a new idea. In the
natural world, composting is what happens as leaves pile
up on the forest floor and begin to decay. Eventually,
nutrients from the rotting leaves are reclaimed by living
roots. This completes nature’s recycling process. As
defined by Diaz et al. (1993). The project will be beneficial for those cities where the
problems of aquatic weeds are much that can be over
come through removal of such weeds. Composting (S
Ajay et al. 2011) as an alternative treatment has the
advantage of producing a product that is easy to work into
the soil compared with dried water hyacinth, because of
the decomposed structure.
Much work has been carried out in different parts of
the world to develop environmentally sound and
appropriate methods for the management and control of
water hyacinth. It recapitulated that the only means of
utilization of water hyacinth which has proved
economically viable across the world (Gajalakshmi et al
2001). In this background authors studied the utilization
of water hyacinth as substituting bean straw with water
hyacinth as animal feed (Tag El-Din et al 1992) feed for
solid-phase fermentation raw material for making pulp,
paper and paper board and the vermicomposting of water
hyacinth (Gupta et al 2007) However, a novel technology
with ecological sound and economically viable is urgently
required to solve the problem of aquatic weed disposal
and management. So this has been decided to prepare
water hyacinth compost by using different amendment. In
Bhopal there are many numbers of pond and small

ISSN NO: 2454-1958 Special Issue Tech-Ed 2016 (International Conference) Page 186
lakes,river like Kaliasot. All are suffered by aquatic
weeds like water hyacinth. Every year cities expenses big
amount of money and use of machinery to remove water
hyacinth from these ponds and lakes. There is no use of
this removed weed, so this was the great ideacomes in
mind that this can be utilized in best way by converting it
into water hyacinth composting.
Hopefully this compost could be solving problems and
utilized in our agriculture based country significantly.
With an aim to solve the problems associated with water
hyacinth the project has been proposed to prepare
compost by using water hyacinth to improve nutritional
contents by incorporation of different amendments.
Materials and methods - This experiment was
conducted at the form of Indian Institute of Soil Science
Bhopal (geographical location 230
18”
N latitude, 770
24” E longitude, altitude 485 m amsl). Water hyacinth as
a source of waste material collected from Kaliasot river
passing by Danish Kunj Bhopal.and Cow dung as a raw
material collected from Lamba Kheda village near IISS
Bhopal. Rock phosphate, lime, urea, microbial enriched
compound and epigeic earth warm are the amendments
arranged from Soil Biology Division ICAR, IISS Bhopal.
Water hyacinth was chopped manually at IISS Bhopal
The details of experiment set up are given below:
a. Experimental setup: There were seven pits for
composting, dimension of each compost pits
were length 6 to 7 feet. Width 3 feet and depth
2.5 feet. Fresh water hyacinth was chopped in
small pieces and filled in each of those pits along
with cow dung in the ratio of 2:1 as shown in fig
1
Fig. 1: Order of different layers of materials
constituted for carrying out composting in pit
The bottom of the pit filled with compost about
1 inch thick containing about 10 kgs of farm
yard manure.
The second layer above the manure compost’s
layer was of chopped fresh water hyacinth which
was about 5 inch thick containing about 15.7 kgs
of water hyacinth.
The third layer above second layer was of fresh
cow dung which was about 2 inch thick
containing approx 13.33 kgs of cow dung.
The fourth layer above the cow dung layer was
of chopped fresh water hyacinth (~15.7 kgs) of 5
inch thickness.
The fifth layer above fourth layer was of fresh
cow dung (~13.33 kgs) of 2 inch thickness.
The sixth layer above the fifth layer was of
chopped fresh water hyacinth (~15.7 kgs) of 5
inch thickness.
The seventh layer above sixth layer was of fresh
cow dung (~13.33 kgs) of 2 inch thick Each pit
remained empty by about 8 inch for turning and
watering operation.
Fig 2: A&B. Filling of pits for composting, C. Pits were
covered to facilitate composting, D. Turning for aeration
In each pit, different materials were used for composting
fresh water hyacinth with cow dung. It was observed that
after 21 days material in each pit was partially
decomposed, and then in each pit various treatments were
imposed as mentioned in table 1.0 Earthworms and
microbial culture were inoculated after 32 days.
Following treatments were applied in each of those
prepared pits:
Table 1: Composition of different materials used for
composting from water hyacinth
S.No. Material Quantity in Kg
Material
%
1 Water hyacinth + Cow
dung
77+40 15.7+13
.3
2 Rock phosphate 2.925 2.5
3 Lime 2.34 2
4 Urea 0.06 0.5
5 Gypsum 11.7 10
6 Earth warm 2 -
7 Microbial culture 0.0585 -
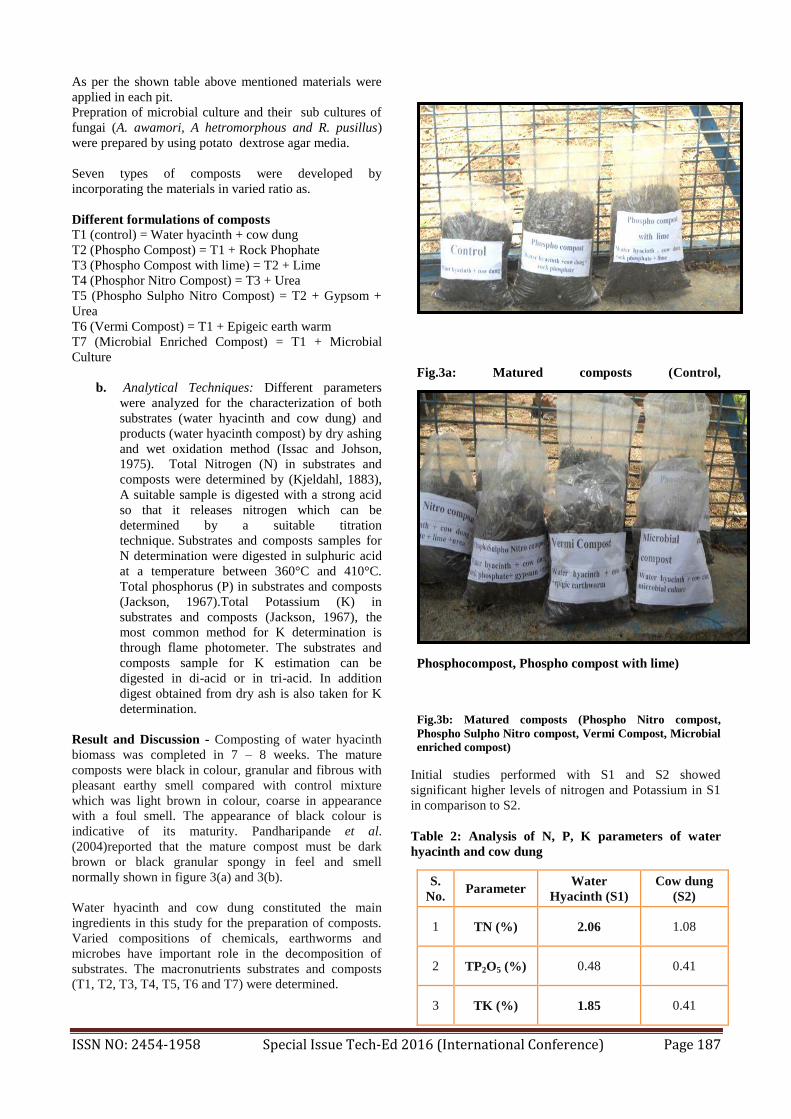
ISSN NO: 2454-1958 Special Issue Tech-Ed 2016 (International Conference) Page 187
As per the shown table above mentioned materials were
applied in each pit.
Prepration of microbial culture and their sub cultures of
fungai (A. awamori, A hetromorphous and R. pusillus)
were prepared by using potato dextrose agar media.
Seven types of composts were developed by
incorporating the materials in varied ratio as.
Different formulations of composts
T1 (control) = Water hyacinth + cow dung
T2 (Phospho Compost) = T1 + Rock Phophate
T3 (Phospho Compost with lime) = T2 + Lime
T4 (Phosphor Nitro Compost) = T3 + Urea
T5 (Phospho Sulpho Nitro Compost) = T2 + Gypsom +
Urea
T6 (Vermi Compost) = T1 + Epigeic earth warm
T7 (Microbial Enriched Compost) = T1 + Microbial
Culture
b. Analytical Techniques: Different parameters
were analyzed for the characterization of both
substrates (water hyacinth and cow dung) and
products (water hyacinth compost) by dry ashing
and wet oxidation method (Issac and Johson,
1975). Total Nitrogen (N) in substrates and
composts were determined by (Kjeldahl, 1883),
A suitable sample is digested with a strong acid
so that it releases nitrogen which can be
determined by a suitable titration
technique. Substrates and composts samples for
N determination were digested in sulphuric acid
at a temperature between 360°C and 410°C.
Total phosphorus (P) in substrates and composts
(Jackson, 1967).Total Potassium (K) in
substrates and composts (Jackson, 1967), the
most common method for K determination is
through flame photometer. The substrates and
composts sample for K estimation can be
digested in di-acid or in tri-acid. In addition
digest obtained from dry ash is also taken for K
determination.
Result and Discussion - Composting of water hyacinth
biomass was completed in 7 – 8 weeks. The mature
composts were black in colour, granular and fibrous with
pleasant earthy smell compared with control mixture
which was light brown in colour, coarse in appearance
with a foul smell. The appearance of black colour is
indicative of its maturity. Pandharipande et al.
(2004)reported that the mature compost must be dark
brown or black granular spongy in feel and smell
normally shown in figure 3(a) and 3(b).
Water hyacinth and cow dung constituted the main
ingredients in this study for the preparation of composts.
Varied compositions of chemicals, earthworms and
microbes have important role in the decomposition of
substrates. The macronutrients substrates and composts
(T1, T2, T3, T4, T5, T6 and T7) were determined.
Fig.3a: Matured composts (Control,
Phosphocompost, Phospho compost with lime)
Fig.3b: Matured composts (Phospho Nitro compost,
Phospho Sulpho Nitro compost, Vermi Compost, Microbial
enriched compost)
Initial studies performed with S1 and S2 showed
significant higher levels of nitrogen and Potassium in S1
in comparison to S2.
Table 2: Analysis of N, P, K parameters of water
hyacinth and cow dung
S.
No. Parameter
Water
Hyacinth (S1)
Cow dung
(S2)
1 TN (%) 2.06 1.08
2 TP2O5 (%) 0.48 0.41
3 TK (%) 1.85 0.41

ISSN NO: 2454-1958 Special Issue Tech-Ed 2016 (International Conference) Page 188
Table 3: Analysis of N, P, K parameters of Water hyacinth composts
S.
No.
Parameters
Control Phospho
compost
Phospho
compost
(Lime)
Phospho
Nitro
compost
Phospho
Sulpho
Nitro
compost
Vermi
Compost
Microbial
enriched
compost
T1 T2 T3 T4 T5 T6 T7
1 TN (%) 1.14 1.2 1.27 1.32 1.16 1.16 1.23
2 TP (%) 0.56 0.86 0.87 0.88 0.89 0.59 0.58
3 TK (%) 1.02 1.03 1.03 1.036 1.04 1.03 1.03
Table 3: provides the data on analysis of water hyacinth compost made with incorporation of different organic, mineral
and microbial cultures. The general properties of composts and the nutrient compositions of composts varied depending
on the amendments applied to the organic manure. With the addition of P through rock phosphate the phosphorous
concentration increased in the compost.The N contents and K contents have also exceeded 1.00%.
According to above mentioned table 2 and 3 there are various comparisons between different contents of parameters of
substrates and prepared composts
Fig.4: Physio-chemical parameters of water hyacinth and
cow dung.
Total N: Total N content of compost depends on the
initial N content present in the feed material and the
degree of decomposition (Crawford, 1983). Presence of N
rich weeds having lesser toxicity proved to be favourable
for microbial mineralization of raw material. Decrease in
pH, mineralization of proteinous organic material and
conversion of ammonium nitrogen into nitrate may be
responsible for addition of N in compost (Yadav and
Garg, 2011). Total nitrogen (TN) content in the prepared
composts was approximately equal to initial substrate
(S2). The initial TN content of the substrates was 2.06
and 1.08 g kg-1 for S1 and S2, respectively. Whereas, TN
content of treated composts was in the range of 1.16 to
1.23 g kg-1 after composting. Plaza et al. (2007) have
reported that the nitrogen content of vermicomposts
increase due to mineralization of C-rich materials and,
nitrogen retention by compost which otherwise may be
lost as ammonia at higher pH values. The difference in
TN content of composts was different from each other.
Fig. 5: Graphical comparison of Total Nitrogen content in
different studies
Total Phosphorous: Phosphorous is also an essential
element for plant growth which also increased on
composting. This may be due to transformation of
unavailable forms of phosphorus to easily available forms
by microbial enzymes like alkaline and acid phosphatases
etc. On composting, phosphorous content were enhanced

ISSN NO: 2454-1958 Special Issue Tech-Ed 2016 (International Conference) Page 189
in all composts. Maximal increase was found in compost
(T5) approx 58.90% followed by T4 (57.1%) and T3
(55.4%) composts. Acid phosphatases and alkaline
phosphatases may be responsible for this transformation
(Ghosh et al., 1999).
Fig6: Graphical comparison of total phosphorous
content in different studies
After vermicomposting phosphorus content was
highest in T4 and T5, and minimum in T1, CD + WH
mixture Le Bayon and Binet (2006) have reported that
some amount of phosphorus is converted to more
available forms partly by earthworm gut enzymes, i.e.,
acid phosphatases and alkaline phosphatases. Actions of
phosphorus-solubilizing microorganisms present in
earthworm’s casts may also be responsible for the release
of phosphorus in vermicomposting (Prakash and
Karmegam, 2010).
Total Potassium: The potassium (K) content was greater
in all the composts than initial waste (S2) (Table3). The
increase in potassium content was 1–2% in the composts
as compared with K content in control. The differences in
the results can be attributed to the differences in the
chemical nature of the initial raw materials. Suthar (2008)
has reported 104 - 160% increase in potassium content
during vermicomposting. Sangwan et al. (2010) have
also reported an increase in K in vermi composts after
bioconversion of sugar industry waste.
Fig.7: Graphical comparison of total potassium content in
different studies
Conclusion - This study signifies that water hyacinth has
remarkable nutritive properties that can be used for the
production of nutrient enriched compost which not only
result in healthy aquatic system but also add as an
advantage on agricultural lands as soil amendments.
The result of the studies have shown that the water
hyacinth composts prepared by combining different
amendments such as rock phosphate, lime, urea, gypsum
microbial cultures and earthworm inoculation and
prepared different composts.. These are control, phospho
compost, phospho compost with lime, phospho nitro
compost, phospho sulpho nitro compost, vermicompost
and microbial enriched compost. Among composts, the
highest percentage of N was evaluated in phospho nitro
compost and in phospho compost . The highest
percentage of P and K were also recorded in phospho
sulpho nitro compost ( P 0.89and K 1.04) and the lowest
percentage of P and K in control compost (P 0.56 and K
1.02).
Ackowledgment : It is a great pleasure to express my
sincere thanks to my research guide The Director, of
prestigious research Institute, ICAR, Indian Institute Of
Soil Science (IISS), Bhopal Dr. A Subba Roa, Principal
Scientist Dr.A.B.Singh and Dr.M.C.Manna Soil biology
Division of IISS and also thankful to Department of Soil
Chemistry and Environmental chemistry ,technical officer
V.B. Paul and Choudhery sir his valuable guidance,
helpful attitude, valuable scientific discussions during the
course of this work and the freedom to perform
experiments in my own way. On a personal level, I
would like to thank for all their direct and indirect
support in times of difficulty.
References
[1] Abdurrahman Hanay Fatih Biiyiiksonmez, Fatih M. Kiziloglu
and Mustafa Y. Canbolat. (2004). Reclamation of Saline-Sodic
Soils with Gypsum and MSW Compost, Compost Science &
Utilization, Vol. 12, pp. 175-179. [2] Aderibigbe, A.O., Johnson, C.O.L.E., Makkar, H.P.S., Becker,
K., Foidl, N. (1997). Chemical composition and effect of heat
on organic matter- and nitrogen-degradability and some
antinutritional components of Jatropha meal Animal. Feed
Science and. Technology. 67, 223-243.
0
0.5
10.56
0.86 0.87 0.88 0.89
0.59 0.58
TP (
%)
Water hyacinth composts
TP (%)
TP (%)
1
1.02
1.04
1.02
1.03 1.031.036
1.04
1.03 1.03
TK (
%)
Water hyacinth composts
TK (%)
TK (%)

ISSN NO: 2454-1958 Special Issue Tech-Ed 2016 (International Conference) Page 190
[3] Afzal, Aslam, Saadia Irfan. (2004). Enhancement of
germination of seed by different priming technique. Journal of
Santa Cruz Vol.16 pp. 19-34.
[4] Ajay S. Kalamdhad, W. Roshan Singh, Ganesh Chandra Dhal,
(2011). Agitated Pile Composting of Water Hyacinth, 2nd
International Conference on Environmental Science and
Development Vol.4 pp. 79-84.
[5 ]Alexander, M. (1977). Introduction to soil microbiology, 2nd
ed., John Willy and San Newyork.
[6] Anderson, J.P.E. (1982). Soil respiration. In: Page, A.L.,
Miller, R.H., Keeney, D.R. (Eds.), Methods of Soil Analysis,
Part 2. Chemical and Biological Properties. American Society
of Agronomy and Soil Science Society of America, Madison,
WI, pp. 841–845.
[7] AOAC. (1990). Official Methods of Analysis: Association of
Analytical Chemists. 14th Ed., Washington, USA, 22209.
[8] AOAC Method. (1992). Total, soluble, and insoluble dietary
fibre in foods. Enzymatic-gravimetric method, MES-TRIS
buffer. Official Methods of Analysis of the Association of
Official Analytical Chemists, 15th ed., 3rd suppl.Association:
Arlington, VA, 991.43.
[9] Ayesha Praveen, A.C.K. Padmoj (2010). Bioconversion of
Municipal Solid Waste (MSW) and Water Hyacinth into
organic manure by Fungal Consortium; Journal of sustainable
Development Vol.3, pp. 91-97.
[10] Boltz, D.F., ed. (1978). Colorimetric Determination of
Nonmetals. Interscience Publishers, New York, N.Y.
Bouyoucos, H.J. and Mick, A.H. (1940): An electrical
resistance method for the continuous measurement of soil
moisture under field condition. Tech.bull.172, pp.1-38.
[11] Bray R.H. and Kurtz, L.T. (1945). Determination of total,
organic and available forms of phosphorus in soil science
59:39-45.
[12] Canet, R., Pomares, F. (1985). Changes in physical, chemical
and physicochemical parameters during the composting of
municipal solid wastes in two plants in Valencia. Biores.
Technol., Vol, 51: pp. 259-261.
[13 ]Das Ayan and Kalamdhad Ajay S, (2011): Evaluation of
Water Hyacinth Compost Stability Using Respirometric
Techniques, Vol. (1), pp 109-113.
[14] Ekelemu J.K. (1998). Malacostraca species inhabiting water
hyacinth in River, Southern Nigeria, Nigerian Field. 63: pp.
149.
[15] G. J. Jann, D. H. Howard, and A. J. Salle. (1959). Method for
the Determination of Completion of Composting, Vol 7: pp.
271-275.
[16] Gillman G.P., Sin chair D.F., Beech T.A. (1986). Recovery of
organic carbon by the Wellesley and Black procedure in highly
weathered soils. Communes soil Sci. PlantAnaly. Vol 17(8): pp.
885-89.
[17] Hasan, M.R.; Chakrabarti, R. (2009). Use of algae and aquatic
macrophytes as feed in small-scale aquaculture: a review. FAO
Fisheries and Aquaculture Technical Paper. No. 531. Rome,
FAO.pp .123.
[18] http://www.aoac.org/vmeth/newsmtd.htm (Accession date:10
may2012).
[19]hhttp://www.norweco.com/html/lab/test_methods/4500norgbfp.
htm(Accession date: 10 may2012).
[20]hhttp://www.fao.org/docrep/ARTICLE/AGRIPPA/551_E
(Accession date: 3may 2012).
[21] www.agritech.tnau.ac.in/org_farm/orgfarm_composting.html.
(Accession date: March 11, 2012).
[22] Issac, R.A. and Johnson, W.C. (1975). Collaborative study of
wet and dry techniques for the elemental analysis of plant
tissue by atomic absorption spectrophotometer. J. AOAC 58,
436.
[23] J.A. Galbiatti, A.G. Cavalcante. (2007). Nitrate and Sodium
contents on lettuce and drained water as function of fertilizing
and irrigation water quality in Brazil. International Journal of
Plant Production Vol 2; pp. 205-214.
[24] Kjeldahl, J. (1883). A new method for the determination of
nitrogen in organic matter. Z. Anal. Chem. 22:366.
[25]mM. Basu. B. S. Bhadoria and S. C. Mahapatra, (2011).
Influence of Soil Ameliorants, Manures and Fertilizers on
Bacterial Populations, Enzyme Activities, N Fixation and P
Solubilization in Peanut Rhizosphere under Lateritic Soil.
British Microbiology Research Vol 1(1); pp. 11-25.
[26]mMalik A.( 2007). Environmental challenge vis a vis
opportunity: The case of water hyacinth. Environment
International;33(1): 122-38.

ISSN NO: 2454-1958 Special Issue Tech-Ed 2016 (International Conference) Page 191
RESEARCH ON IN-
VITRO CLONAL MULTIPLICATION PROTOCOL IN VARIOUS CULTIVARS O
F CHLOROPHYTUM.
Aditi Pandey*
*Priyadarshini Institute of Engineering & Technology, Hingna Road, CRPF Gate, Nagpur,
Maharashtra. E-mail- [email protected].
Corrosponding Author: Dr. (Mrs.) Aditi Pandey, Assitt. Prof., Department of Chemistry
Priyadarshini Institute of Engineering & Technology, Mouza Shivangaon, Khasara Number
1/IA, 1909/12C, Hingna Road, Near CRPF Gate, Nagpur, Maharashtra. E-mail-

ISSN NO: 2454-1958 Special Issue Tech-Ed 2016 (International Conference) Page 192
Abstract:
Chlorophytum commonly known as ‘Safed Musli’ has become an endangered species due t
o its over exploitation, used as tonic and aphrodisiac. Root of the plant contains steroidal sa
ponin as secondary metabolite. It has a worldwide demand in ayurvedic and allopathic syst
ems of medicine to cure general debility, fatigue, weakness and male sterility. Although thi
s species has been brought under commercial cultivation but the systematic research on coll
ection and evaluation of germplasm still in demands.A tissue culture method has been deve
loped for its large scale multiplication and conservation. Micropropagation using stem disc
as explant has been achieved on Murashige and Skoog (MS) medium containing 5.0 mg.L-
1 BAP. Survival rate of these rooted plantlet in soil is about 80 %. A comparative studies h
ave been carried out to compare the protocol in different cultivars of Chlorophytum.
Keywords- Safed Musli, saponin, Micro propagation, Murashige and Skoog medium
Introduction:
‘Safed musli’ is an endangered medicinal plant of Liliaceae family belonging to genus
Chlorophytum. The tuberous roots of the plant are used in ayurvedic tonic and has
aphrodisiac property due to the presence of saponin. Safed musli has wide distribution in
India, mainly in the southern Rajasthan, Western MP and North Gujarat (Borodia
et.al.).More than 175 species of Chlorophytum have been reported in world, about 13
species of genus are found in India out of which roots of species C. borivillianum and C.
tuberosum only are used as safed musli in many ayurvedic preparations. It has a worldwide
demand in ayurvedic and allopathic systems of medicine to cure general debility, fatigue,
weakness and male sterility (Bhagat. et.al). In view of its day-to-day increasing demand not
only by the user of our country but of abroad too, it may be a dollar-earning crop.
ISSN NO: 2454-1958 Special Issue Tech-Ed 2016 (International Conference) Page 193
Population of the plant is dwindling at an alarming rate. In nature the plant is propagated by
seeds and has become an endangered species due to low seed set, viability and germination,
associated with over exploitation from the wild strands. The planting material/ tubers as
well as seeds have dormancy for a certain period.
Owing to its enormous uses, its worldwide demand is estimated to be 35000 tons annually
as compared to current annual production of 5000 tons. The immediate task is to conserve
and multiply the plant in bulk amount required for its domestication to meet the present
demand. In recent years a large-scale propagation of plant has been developed by use of the
tissue culture technique and the number of plant species being enabled to multiply by this
technique annually. Plant tissue culture has been successfully used to micro-propagate
medicinal plants. Plantlet regeneration has been reported through apical meristem in C.
Comosum. Plantlet regeneration and bulbil formation has been reported through leaf and
stem explant in Curculigo orchiodes (Suri et al.1999).
In the present study, an efficient and rapid In-vitro micro propagation method of Safed
musli (Chlorophytum borivillianum) has been established through optimization of medium
and cytokinin and auxin ratio for shoot proliferation and root formation.
Material & Methods:
Leaf segment, root segment and stem disc of two different collection of Chlorophytum
borivillianum ( Fig-A, Fig.-B) were collected from mature plants as explants from the field
and brought to the laboratory. The source tissues were kept under running tap water (5
mints) and washed with a 5 % laboline detergent for 5-10 mints. Different concentration
and combination of sterilent tried for the surface sterilization of explants. After washing
with detergent surface sterilization was done with 1 % bleaching powder solution with

ISSN NO: 2454-1958 Special Issue Tech-Ed 2016 (International Conference) Page 194
0.1% amplicillin for 20 mints. After removing few scales and waste part, explants were
washed three times with sterile water. After washing explants immersed in 0.2% mercuric
chloride solution with few drops of tween 20 for 15 min. in laminar flow. Last treatment
given by 70% ethanol for 60 seconds. Explants were inoculated after washing with sterile
water and drying with sterile blotting paper.
The materials were cut into appropriate sizes (leaf- 1cm., root segment 1 cm, stem disc)
and cultured on MS medium (Murashige and Skoog, 1962). The medium was used at
different strengths. The medium was supplemented with 3 % sucrose and gelled with 0.8%
agar. Basal medium was supplemented with different concentration of growth regulators
(2,4-D, Kin, 2iP,NAA,BAP) either alone or in combination for shoot initiation as well as
shoot multiplication. The pH of the medium was adjusted to 5.8 before autoclaving at a
pressure of 15 lbs for 15 mints. The cultures were incubated at 25 +- 20C with 16/18 hours
photoperiod under white fluorescent tubes. Experiments were set up in a completely
randomized design. Minimum 6 explants were used for each treatment and all treatments
were repeated twice. Data were presented in mean number of shoot. Plantlets were
transferred to small pots containing soil and sand (1: 1) and subsequently to the field.
Result:
In this experiment most of the explants were contaminated with fungi and thus explants
were sterilized with different concentration and combination of sterilent. Strong treatment
has been given to explants to protect them for contamination. Shoot initiation was observed
only in stem disc explant. No response has been seen in leaf as well as root segment.
Growth regulators NAA, 2,4-D,BAP, 2iP and Kin. either alone or in combination tested in
the present study (Table 1). Callus development has been seen on MS medium enriched
ISSN NO: 2454-1958 Special Issue Tech-Ed 2016 (International Conference) Page 195
with 2,4-D(1-2.5mgL-1
) ( Fig.-C). Cream coloured callus was not found suitable for shoot
initiation as well as multiplication. Good response has been seen by Stem disc (crown) on
the medium containing different concentration of BAP. BAP in higher amount is the best
for shoot initiation in comparison to 2,4-D, Kin, 2iP. MS medium supplemented with 5.0
mgL-1
BAP was best for shoot initiation. Mean number of shoot initiated in MS medium
supplemented with 5.0mgL-1
BAP is 7.8 in sample 1 and 6.6 in sample 2, which is highest
among others (Fig.D, ). More than 80% response has been seen in 5.0 mgL-1
BAP
treatments. These cultured shoots were used for sub culturing. MS medium supplemented
with 5.0 mgL-1
BAP used as a parent media. Different concentration and combination of
growth regulators tried for multiple shoot formation. Auxin and Cytokinin ratio has given
average response of 75% with 6-8 mean numbers of shoots. When sub culturing has been
done on to the medium of same composition (5.0 mgL-1
BAP) resulted in an increase in
size and extra ordinary response has been seen. 100% response with more than 15 mean
number of shoots in sample 1 and 17 in sample 2 generated from the MS medium
supplemented with 5.0 mgL-1
BAP (Fig.-E). 75 % response reported when BAP
concentration increased after 5.0 mgL-1
BAP. (Table 2).
Healthy roots were found when shoots transferred to half strength MS medium
supplemented with 500mgL-1
charcoal (Fig.-F.1,2). Plantlets developed through tissue
culture were successfully transferred in soil and sand (1: 1) with high rate of survivability
(80%) (Fig.-G).
Tissue culture has been used to accelerate plantation development, to shorten breeding
cycle and to rapid multiplication. The best use of micro propagation technique is to

ISSN NO: 2454-1958 Special Issue Tech-Ed 2016 (International Conference) Page 196
overcome dormancy problem. The plantlets obtained by this technique are expected to be
pathogen free.
Discussion:
Due to large scale and indiscriminate collection of the wild material and insufficient
attempts either to allow its replenishment or its cultivation Chlorophytum is rapidly
disappearing from nature Growth regulators NAA, 2,4-D, BAP, 2iP and KIN either alone
or in combination tested in the present study. Response has been recorded by Stem disc
(crown) on the medium containing different concentrations of BAP. BAP in higher amount
was found best for shoot initiation in comparison to 2,4-D, KIN, 2iP. MS medium
supplemented with 5.0 mgL-1
BAP was best for shoot initiation. Mean number of shoot
initiated in MS medium supplemented with 5.0 mgL-1
BAP is 7.8 in sample1 and 6.6 in
sample 2. More than 80% response has been found in 5.0 mgL-1
BAP treatments. These
cultured shoots were used for sub culturing. MS medium supplemented with 5.0mgL-1
BAP
used as a parent media. Different concentrations and combinations of growth regulators
tried for multiple shoot formation. Average response of 75% with 6-8 mean numbers of
shoots was found in auxin and cytokinin ratio. When sub culturing was done on to the
medium of same composition (5.0mgL-1
BAP) resulted in an increase in size and extra
ordinary response was found. 100% response with more than 15 mean numbers of shoots in
sample 1 and 17 in sample 2 generated from the MS medium supplemented with 5.0 mgL-1
BAP. 75 % response reported when BAP concentration increased more than 5.0 mgL-1
BAP. Healthy roots were found when shoots transferred to half strength MS medium
supplemented with 500 mgL-1
charcoal. Plantlets developed through tissue culture were
successfully transferred in soil and sand (1: 1) with high rate of survivability (80%) Arora

ISSN NO: 2454-1958 Special Issue Tech-Ed 2016 (International Conference) Page 197
et al., (1999) developed an improved method for large-scale rapid multiplication of C.
borivillianum through somatic embryogenesis. Somatic embryos were obtained on MS
medium containing 2.25 micro molar 2,4-D and 1.5 micro molar kinetin. The technique
developed is highly efficient to get miniature plantlets for field transfer in 2 months,
starting from callus.
Tissue culture has been used to accelerate plantation development, to shorten
breeding cycle and to rapid multiplication. The best use of micro propagation technique is
to overcome dormancy problem. Plant tissue culture has been successfully used to micro-
propagate medicinal plants. Plantlet regeneration has been reported through apical
meristem in C. comosum. Plantlet regeneration and bulbil formation has been reported
through leaf and stem explant in Curculigo orchiodes (Suri et al., 1999).

ISSN NO: 2454-1958 Special Issue Tech-Ed 2016 (International Conference) Page 198
(Table 1)- Effect of different concentrations and combinations of phytohormones on shoot
initiation
(Table 2 ) Effect of subculture media on multiple shoot formation.
Hormone
Concentration
(mg/1)
Sample 1 Sample 2
Mean no. of
shoots initiated
% Response Mean no. of
shoots initiated
% Response
NAA+BAP 1.0+0.5
1.5+1.0
1.0+2.0
1.0+2.5
6.66
3.33
4.00
3.33
75
75
50
75
6.0
6.0
3.5
3.5
50
33.3
66.6
66.6 NAA+KIN
Hormone
Concentration
(mg/1)
Sample 1 Sample 2
% response Mean no. of
Shoots initiated
% response Mean no. of
shoots initiated 2,4 D
0.5
1.0
1.5
2.0
2.5
25
20
50
25
25
2.0
2.0
3.5
2.0
1.0
25
20
50
25
25
1
1.5
4
2.5
1 2,4 D + KIN
1.0+1.0
1.0+1.5
1.0+2.0
1.0+2.5
20
50
25
40
1.0
2.5
2.0
2.5
20
50
25
40
1
1
2.0
2.0 2iP
0.5
1.0
1.5
2.0
20
33.3
40
40
4.0
5.5
2.0
1.0
20
33.3
40
40
0
1
0
2 KIN
0.5
1.0
1.5
2.0
2.5
25
33.3
40
40
50
1.0
2.0
1.0
2.5
2.0
25
33.3
40
40
50
3
0
0
0
2.0 NAA+KIN
1.0+1.0
1.0+1.5
1.0+2.0
1.0+2.5
40
20
25
40
1.5
1.0
2.0
2.5
40
20
25
40
1.5
3.5
2.5
2.5
BAP
1.0
1.5
2.0
2.5
3.0
4.0
5.0
6.0
8.0
10.0
50
50
80
75
83.3
80
83.3 75
75
50
3.5
3.33
2.25
5.0
6.6
5.0
7.8 5.0
4.3
2.5
66.6
50
50
60
60
75
83.3 75
75
75
3.0
2.5
3.0
3.33
3.66
4.3
6.6 5.5
3.0
3.33

ISSN NO: 2454-1958 Special Issue Tech-Ed 2016 (International Conference) Page 199
1.0+0.5
1.0+1.0
1.5+1.5
1.0+2.0
1.0+2.5
3.5
3.00
2.33
2.00
2.00
66.6
75
75
75
50
3.0
1.5
2.0
3.0
3.0
75
50
33.3
50
50 BAP 0.5
1.0
1.5
2.0
2.5
3.0
4.0
5.0
6.0
7.0
8.0
10.0
6.66
8.00
7.5
6.00
6.0
6.5
6.6
14.75 8.6
8.33
9.00
5.00
75
75
66
75
66
50
75
100 75
75
75
75
2.0
3.5
3.0
2.0
2.5
7.0
7.6
17.0 9.0
9.3
6.6
9.3
25
66.6
66.6
66.6
33.3
75
75
100 75
75
75
75
Protocol for Multiplication of Chlorophytum borivillianum.
Explant (Stem disc)
Surface sterilization
Culture initiation (MS medium + 5.0 mg./l. BAP, 7.8 mean no. of shoots)
Shoot Multiplication (MS medium + 5.0 mg./l. BAP, 15 mean no. of shoots)
Rooted plantlets
Field establishment
In-vitro regeneration potential of different Chlorophytum genotypes
To study the in-vitro regeneration potential of different Chlorophytum genotypes, all the
collected genotypes were cultured on the standardized medium. Among the three only two
responded on the same standardized medium (Table 4.16). 50.0-percentage response with
2.55 mean numbers of shoots was recorded for M4 and 60.00 percent response with 3.33
mean numbers of shoots were recorded for M5. Genotype M3 not responded in the
standardized medium (5.0 mg/l BAP). It has been concluded that in-vitro regeneration
technology can be successfully employed for Chlorophytum plantlets, if careful selection of
proper combination and concentrations of phytohormones for explants is made for specific
genotype.

ISSN NO: 2454-1958 Special Issue Tech-Ed 2016 (International Conference) Page 200
References
Arora, D. K, Suri S. S., Ramawat, K. G. and Meerillon, J. (1999) Factors Affecting Somatic
Embrygenesis in Long Term Callus Culture of Safed musli (Chlorophytum borivillianum):
An Endangered Wonder Herb. A Journal of Experimental Biology. 75-82.
Bordia ,P.C., Joshi A. and Simlot MM. (1995) Safed Moosli. In: Advances in Horticulture
Vol. 11- Medicinal and Aromatic Plants. Eds:Chandha and Rajendra Gupta. Pbl.
Malhotra Publishing House, New Delhi: 429-451.
Bhagat,C. and Jadeja ,G.C. (2003) Variation and correlation in root yield and biochemical
traits of Safed musli. ( Chlorophytum borivillianum). Journal of Medicinal and
Aromatic Plant Sciences 25: 33-36.
Murashige, T. and Skoog, F. (1962) A Revised Medium for Rapid Growth and Bioassays
with Tobacco Tissue Culture. Physiol. Plant 15: 473-497
Suri, S., jain,S., Ramawat, k.G. (1999) Plantlet regeneration and bulbil formation in-vitro
from leaf and stem explants of curculigo orchioides, an endangered medicinal plant.
Scientia horticulturae 79: 127-134.
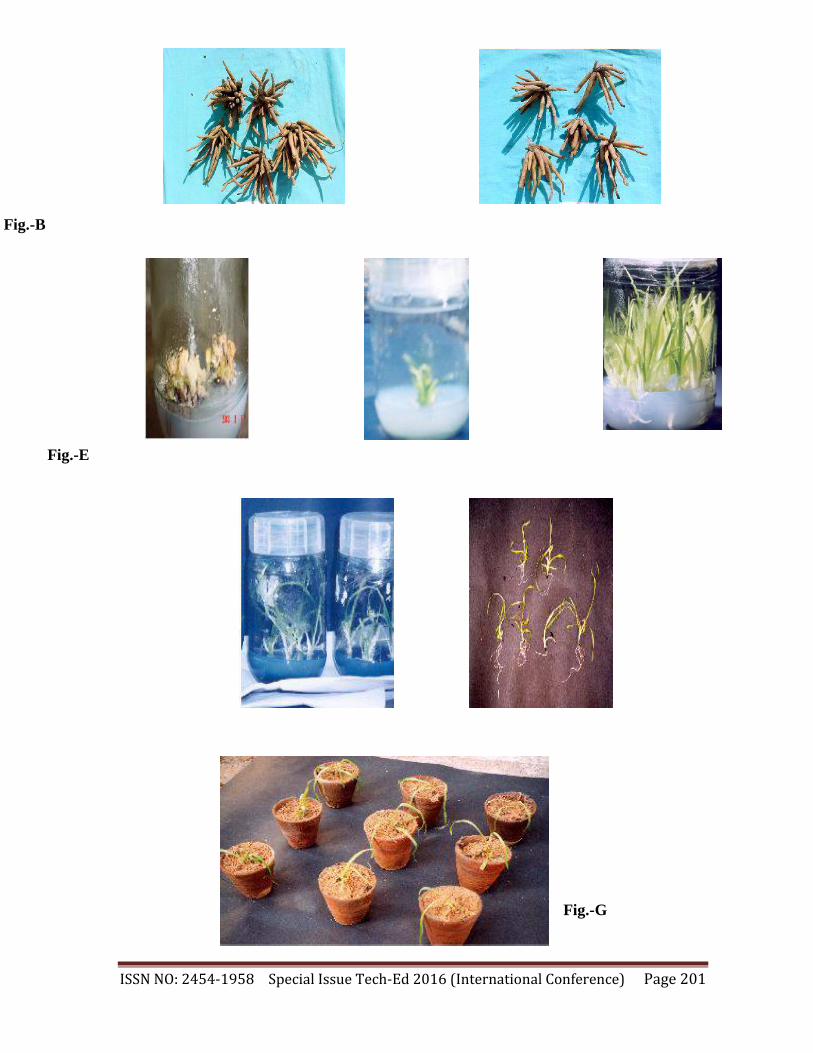
ISSN NO: 2454-1958 Special Issue Tech-Ed 2016 (International Conference) Page 201
Fig.-C Fig.-D
Fig.-A Fig.-B
Fig.-E
Fig.F.1 Fig.F !.2
Fig.-G