Quickie QM-710/715HD/720 Quickie QM-710/715HD/720 Quickie ...
Upload
hoangthienCategory
view
214download
0
SR 710 North StudyTechnical Advisory Committee Meeting No. 12 – September 11, 2013
Stakeholder Outreach Advisory Committee Meeting No. 8– September 12, 2013
1
11 1
AgendaAgenda
Public Outreach UpdateUpdate on Parts 2 and 3 – Project Report p j p
and Environmental Studies DocumentationRecap of TAC No. 11 and SOAC No. 7pUpdate on Preliminary EngineeringUpdate on Environmental Technical StudiesUpdate on Environmental Technical StudiesNext Steps
2

Ground RulesGround Rules
Q&A f h i f hQ&A after each section of the presentationFocus questions on information
presentedGeneral comments and Q&A at the end
3
Public Outreach UpdatePublic Outreach Update
4

Summary of Outreach Activities –
C ti t t d t h ti iti t
July – September 2013Continue structured outreach activities to engage stakeholders throughout the study area
El t d Offi i l• Elected Officials• City Councils • One-on-One Briefings• Roundtable Discussions• Community-Specific Information Sessions• Community EventsCommunity Events• Interviews with Media• Social Media Engagement
Ed ti l I tit ti ( t d t t h) CSULA
5
• Educational Institutions (student outreach) - CSULA, ELAC, PCC and CalTech

July 2013 All Communities Convening Information Sessions Recap
• El Sereno
• Pasadena
• Monterey Park
• Estimated 400 Participants
• Meeting format allowed for Q & A
6

Feedback Received During July ACCInformation Sessions
TSM/TDMTSM/TDM• Need for additional bicycle lanes• Include TSM/TDM with LRT alternative• Ensure pedestrian friendly street
improvements
7

Feedback Received (cont )Feedback Received (cont.)
B R id T iBus Rapid Transit• Concern regarding potential parking
impacts• Encourage use of electric vehicles• Will not address regional congestion• Greater frequency of service required• Ridership vs. Metro Rapid 762 bus service • Include exclusive bus lanes with BRT
8
• Combine with LRT alternative

Feedback Received (cont )Feedback Received (cont.)
Li h R il T iLight Rail Transit• Concerns regarding elevated configuration
in East Los Angeles• Explore P3 options for LRT alternative• Tunnel safety• Tunnel ventilation• Construction impacts
• Excavated materialValley Fever
9
• Valley Fever

Feedback Received (cont )Feedback Received (cont.)
F T lFreeway Tunnel• Lack of intermediate exits/entrances
Safety• Safety• Tolls/Public Private Partnerships• Truck trafficTruck traffic• Construction impacts
• Excavated material• Valley Fever
• Air Quality • Ventilation locations
10
• Ventilation locations• Exhaust treatment

Update on Parts 2 and 3 -Project Report and EnvironmentalProject Report and Environmental
Studies Documentation
11

Recap of TAC No 11 and SOAC No 7Recap of TAC No. 11 and SOAC No. 7
P bli O h U dPublic Outreach UpdateRecap of TAC No. 10 and SOAC No. 6Update on Parts 2 and 3 – Project
Report and Environmental Studies pDocumentationUpdate on each build alternativeUpdate on each build alternative
Next Steps
12

Feedback Received DuringTAC No. 11/ SOAC No. 7
H ill l i l i M t P k ff t How will exclusive lanes in Monterey Park affect businesses in that area?
Details on which TSM elements were removed for Details on which TSM elements were removed for excessive impacts
Consider right-of-way impacts on a case by case basis Evaluate BRT performance, if exclusive lanes are provided
throughout Evaluate air quality and health risk assessment for the Evaluate air quality and health risk assessment for the
study area Will the trucks carrying hazardous material be screened at
13
portals?
Feedback Received DuringTAC No. 11/ SOAC No. 7 (cont.) Traffic impacts for no build scenario should be Traffic impacts for no build scenario should be
highlighted Minimize number of transfers required to encourage
transit usagetransit usage Pasadena did not want connections to St. John
Avenue and Pasadena Avenue to and from tunnel Explain proposed reversible lane on Fair Oaks Will Explain proposed reversible lane on Fair Oaks. Will
this design remove median? Would single bore tunnel include traffic and air quality
analyses?analyses? Would you be performing cumulative analysis for air
quality and other factors? Discuss Value Analysis Study findings
14
Discuss Value Analysis Study findings

Fact ChecksFact Checks
15

Freeway Tunnel and LRT Alternatives
Cl i C t ti f t l ld lClaim – Construction of a tunnel would expose people to Valley Fever.
Fact – Exposure to Valley Fever is shown to be aFact Exposure to Valley Fever is shown to be a low risk in the South Coast Air Basin*, but any construction project in the Basin could result in some increase in the risk for Valley Fever as asome increase in the risk for Valley Fever, as a result of any fugitive dust emissions due to grading in the upper 20 cm of native soils. This risk is reduced by implementing standard measures to reduce fugitive dust in compliance with Caltrans and South Coast Air Quality Management District
16
and South Coast Air Quality Management District requirements.* See maps on Center for Disease Control website, http://www.cdc.gov/features/valleyfever

Where are the vehicles coming from for the Freeway Tunnel Alternative?
Percentage f T l
AM Peak P i d (SB)
Percentage f T l
PM Peak P i d (NB)
Percentage f T lSegment ADT of Total Period (SB) of Total Period (NB) of Total
SR 710 Tunnel (8 lanes, no toll) 173,800 100% 16,300 100% 23,900 100%
SR 2 36 500 21% 3 100 19% 5 300 22%SR 2 36,500 21% 3,100 19% 5,300 22%
I‐5 24,600 14% 1,500 9% 3,500 15%
I‐605 8,900 5% 700 4% 1,600 7%
SR 110 15,700 9% 1,800 11% 1,900 8%
I‐405 1000 1% 90 1% 70 0%
US 101 400 0% 10 0% 100 0%
All Freeways 87,100 50% 7,200 44% 12,470 52%
Fremont/Fair Oaks Avenue 25,900 15% 1,800 11% 3,200 13%
Huntington Drive 8,700 5% 710 4% 1,400 6%
San Gabriel Boulevard 8,300 5% 730 4% 1,000 4%
Rosemead Boulevard 8,100 5% 640 4% 1,200 5%
Los Robles Ave 6,400 4% 540 3% 990 4%
17
Eagle Rock Boulevard 2,000 1% 240 1% 220 1%
Other Arterials and Local Streets 27,400 16% 4,500 28% 3,400 14%
All Surface Streets 86,800 50% 9,160 56% 11,410 48%

Update on Parts 2 and 3 –Project Report and Environmental StudiesProject Report and Environmental Studies
DocumentationS d P li iStatus update on Preliminary
EngineeringStatus update on Environmental Studies
Documentation
18

Continue Refinements to Build Alternatives
T i S MTransportation System Management (TSM)/Transportation Demand M t (TDM)Management (TDM)Bus Rapid Transit (BRT) with TSM/TDMLight Rail Transit (LRT) with TSM/TDMFreeway Tunnel with TSM/TDMFreeway Tunnel with TSM/TDM
19

Alternatives Design RefinementsAlternatives Design Refinements
Continue to optimize performanceCoordinate with Environmental Study team Reduce potential right-of-way and
environmental impactse o e a pac s
20

TSM - Local Street and Intersection ImprovementsImprovements
7
21
7
27
3

Refinements to Light Rail Transit (LRT) Alternative
Continue coordination with fire marshal first responders Continue coordination with fire marshal, first responders, and CHP for tunnel fire, life, safety and ventilation design elements
Refinements to crossing at Valley Boulevard Considering refinements in the southerly portion of the
alignmentalignment
22

Update to LRT Alternative at Valley Boulevard
23
Revised maintenance yard for better operations by providing a larger bridge over Valley Boulevard

LRT – Fillmore Station (Typical)
2424

BRT Alternative RefinementsBRT Alternative Refinements
C ti d fi t f b l t li itContinued refinements for bus lanes to limit effects on parking
Beginning to develop stormwater managementBeginning to develop stormwater management, and landscaping concepts
Developed 3 typical station conceptsDeveloped 3 typical station conceptsConducted comparison of bus lane concepts
25

Prototype BRT Station ConceptsStation Concepts
3 Station concepts developed to CASE A CASE A 3 Station concepts developed to
fit demand levels or available sidewalk widths
Item No. Amenities Item
No. Amenities
1 Warning Strip/Truncated Domes 10 Bench Only
2 8' x 5' Min Front Door Loading 11 Route MapCASE B
2 8 x 5 Min. Front Door Loading 11 Route Map
3 Bus Stop Sign (BRT Only) with Braille Sign 12 Canopy
4 Bus Stop Sign with Braille Sign & Information Locator 13 Wind Screen
5 Bus Waiting Signal With Braille sign 14 Lighting
6 Brand Sign 15 Station ID
Variable Message Sign
26 CASE C
7 (Next Bus Arrival) With Public Address System
16 Way Finding Sign
8 Trash Receptacle 17 Advertising Panel
9 Leaning Rail 18 Solar Power Panels

Questions from TAC No. 11 on BRT Alternative
Q ti Wh t th b fit d ff t fQuestion: What are the benefits and effects of continuous two-way bus lanes along the entire route?
BRT Alternative Concept for 710 North Study Proposed peak-period-only bus lanesy
Route Length: brown 2-way; red 1-way; orange mixed traffic
10 miles along trunk/spine from Whittier Boulevard to Del Mar Boulevard.
12 miles total length including half of north loop length
27
Percent of trunk/spine route with either 1-way or 2-way bus lanes: 75%

Evaluation of Benefits and Effects of Continuous BRT Lanes
Th BRT ti i t di dThree BRT operations scenarios were studied:Scenario Description Study
YearYear
1 BRT – Alternative (Base Case) 2035
2 BRT – Continuous Right Side Bus Lanes 2035
3 BRT – Continuous Median Bus Lanes on Trunk Line, 2035Continuous Right Side Bus Lanes along North Loop
28

Questions from TAC No. 11 regarding BRT Alternative
Typical CrossExisting
R/WExisting
R/WR/W = 82’ - 90’
Sidewalk Sidewalk Typical Cross Sections: Existing Condition
6’-10’ 8’ 11’ 11’ 11’ 11’ 8’ 6’-10’R/W Sidewalk
Parking Parking
Sidewalk
Lane Lane LaneLane10’
Median
(82-90 feet R/W) Continuous Right
Side Bus Lanes 14’ 11’ 11’ 10’ 11’ 11’ 14’
Proposed R/W
Proposed R/WSidewalk Sidewalk
Bus Lane Bus LaneMedian
R/W = 94’ - 98’
EXISTING
Lane Lane LaneLane
(94-98 feet R/W) Median Bus Lanes
with Station
6’-8’6’-8’
Proposed ProposedCONTINUOUS RIGHT SIDE BUS LANES(104-110 feet R/W) Proposed
R/WProposed
R/WR/W = 104’ - 110’
14’ 12’ 10’ - 12’ 14’ 14’ 12’ 14’
6’-8’6’-8’
Sidewalk Sidewalk
BRT Station Bus Lane Bus Lane
* R/W Right of Way
2’ Island
LaneLane Lane Lane
29
R/W - Right of Way
CONTINUOUS MEDIAN BUS LANES

Las Vegas, NV Boulder Highway BRT
Las Vegas, NV SDX BRT
Los Angeles, CA Wilshire Metro Rapid 720
Cleveland, OH Healthline BRT
Everett, WA S ift BRTSwift BRT
30Continuous Right Side BRT Bus Lanes CASE CContinuous Median BRT Bus Lanes
San Jose, CA Valley Rapid
San Jose, CA Valley Rapid BRT

BRT Operations PerformanceBRT Operations Performance
Route Components Include: Bus Stop Acceleration/Deceleration Time Bus Stop Dwell Timep Intersection Bus Acceleration/ Deceleration Time Intersection Bus Stop Time Segment Bus Running Time Segment Bus Running Time
Component Performance Based On: Actual Route 762 operation 3-door bus boarding/departing time Future traffic forecast
31
Transit Signal Priority (TSP) Performance from Crenshaw Boulevard TSP Before/After Study

One-Way Peak Hour Bus Travel Time Results for Each BRT Scenario
60.00 56*57
5348
50.00
Minutes)*
Bus Stop Accel/Decel Time
5653*
46*48
30.00
40.00
vel Tim
es (M Bus Stop Dwell Time
Segment Bus Running Time
20.00
ay Bus Trav
Intersection Bus Accel/Decel Time
Intersection Bus Stop Time
0 00
10.00
One
‐Wa
* Values represent average times
32
0.002035 BRT Base Case
with TSP2035 BRT Continuous
Lane with TSP2035 BRT Median Lane
with TSP
BRT Scenarios
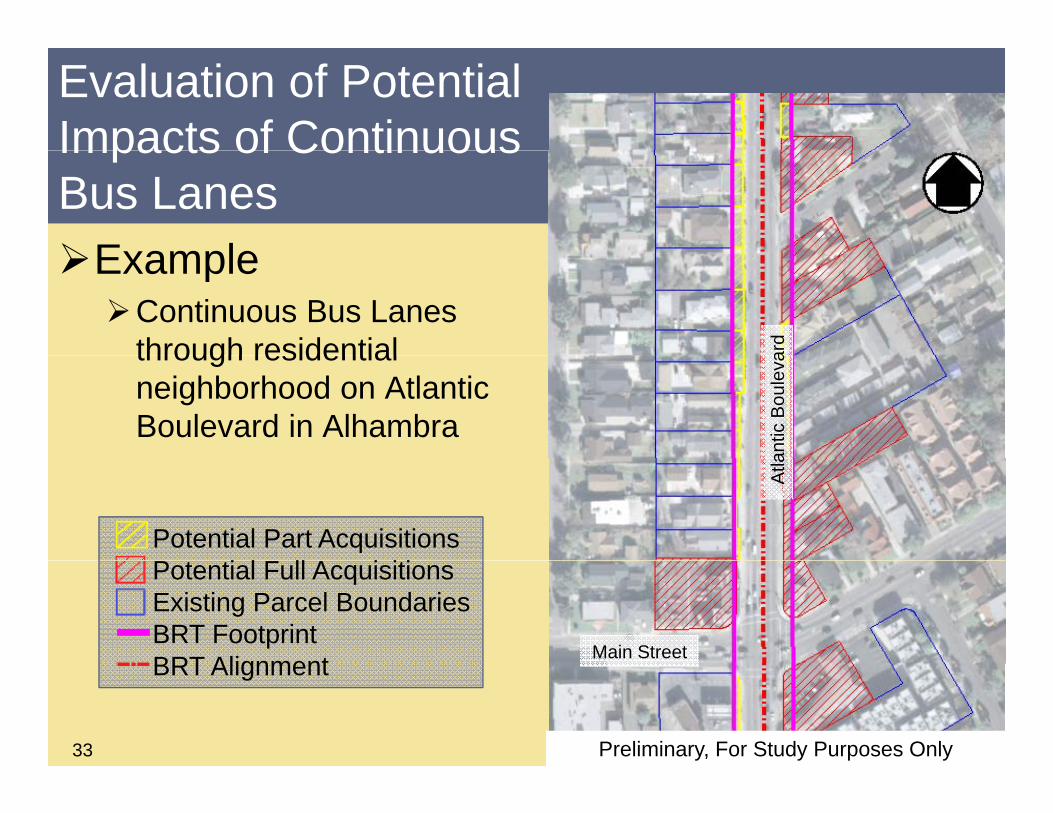
Evaluation of Potential Impacts of ContinuousImpacts of Continuous Bus LanesExampleExample Continuous Bus Lanes
through residential ardthrough residential
neighborhood on Atlantic Boulevard in Alhambra
antic
Bou
leva
Atla
Potential Part Acquisitions P i l F ll A i i i
Main Street
Potential Full AcquisitionsExisting Parcel Boundaries BRT FootprintBRT Alignment
33
BRT Alignment
Preliminary, For Study Purposes Only

Summary of Preliminary Findings f BRT C ti B Lfor BRT Continuous Bus Lanes
No. of No. of P k H
Scenario DescriptionStudy Year
No. of AM/PM Parking Spaces
Potentially Aff t d
No. ofPermanent
Parking Spaces
Potentially Aff t d
No. of Properties Potentially Affected
Potential Property
Acquisition (Acres)
Peak Hour Bus Travel Time One-
Way (Minutes)*Affected Affected ( )
1 BRT –Base Case 2035 1,000 - 1,100 60 - 70 30-35 < 0.5 56
2
BRT –ContinuousRight Side Bus Lanes
2035 1,800 - 2,000 90-110 550-600 75-85 53
3
BRT –Median Bus Lanes on Trunk Line & 2035 0 1 900 2 100 650 700 80 90 46
34
3 Continuous Right Side Bus Lanes on North Loop
2035 0 1,900 - 2,100 650-700 80-90 46
* Values represent average times

Conclusions Regarding Benefits and Effects of Continuous Bus Lanes
C ti Ri ht Sid B LContinuous Right Side Bus Lanes:5% travel time savings compared to BRT Base CaseSubstantially more impacts to properties & parkingSubstantially more impacts to properties & parking
Median Bus Lanes:18% travel time savings compared to BRT Base CaseWith even greater impacts to properties & parking
Recommend for EIR/EIS - BRT Base Case as l d ith ti f d di t d b lplanned with portions of dedicated bus lanes:Bus travel time is almost as goodSubstantially less property and parking impacts
35
Substantially less property and parking impactsNo impacts to historic resource - SR110 Bridge
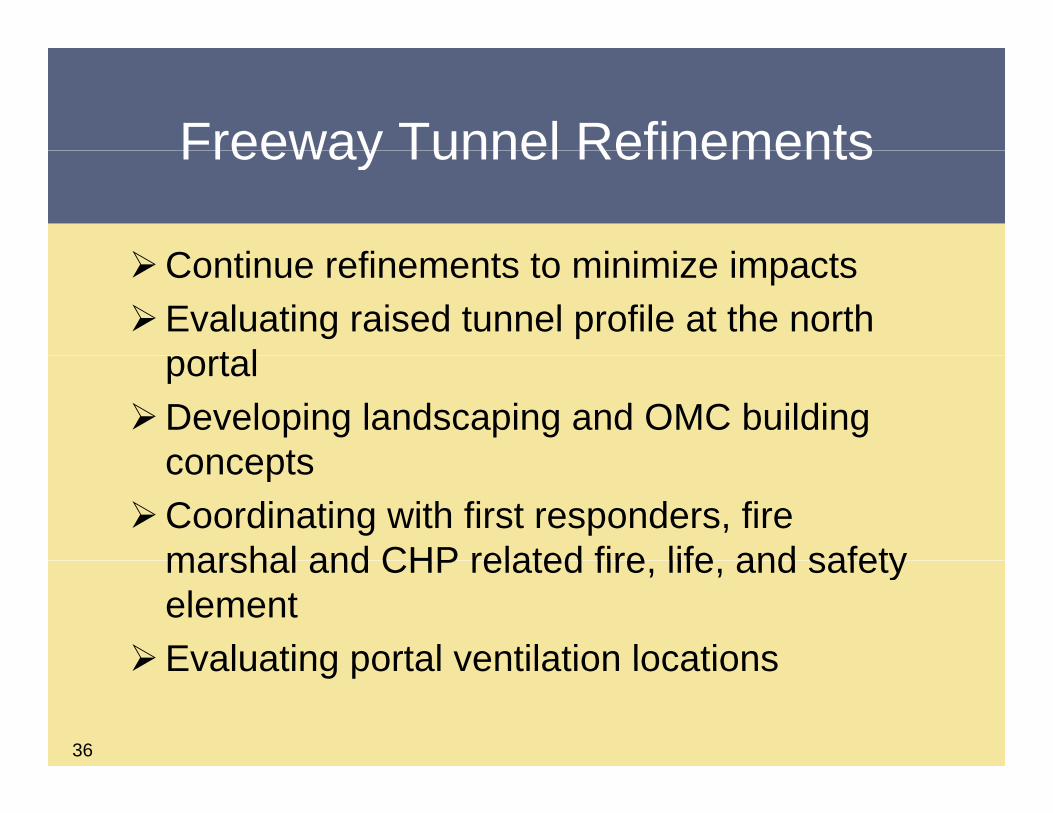
Freeway Tunnel RefinementsFreeway Tunnel Refinements
C ti fi t t i i i i tContinue refinements to minimize impactsEvaluating raised tunnel profile at the north
t lportalDeveloping landscaping and OMC building
conceptsconceptsCoordinating with first responders, fire
marshal and CHP related fire life and safetymarshal and CHP related fire, life, and safety element
Evaluating portal ventilation locations
36
Evaluating portal ventilation locations

South Portal Ventilation Locations
V til ti L ti AVentilation Location A
Ventilation Location BOperations and Maintenance
Control (OMC) Building
37
Control (OMC) Building

Preliminary South Portal Landscape Concept
Valley Boulevard
38

Preliminary South OMC Building Landscape Concept
39Valley Boulevard

Preliminary Operations and Maintenance Control (OMC) Building Concept
40

North Portal Ventilation Locations
Operations and Maintenance Ventilation Location A
pControl (OMC) Building
Ventilation Location B Colorado BoulevardVentilation Location B Colorado Boulevard
41
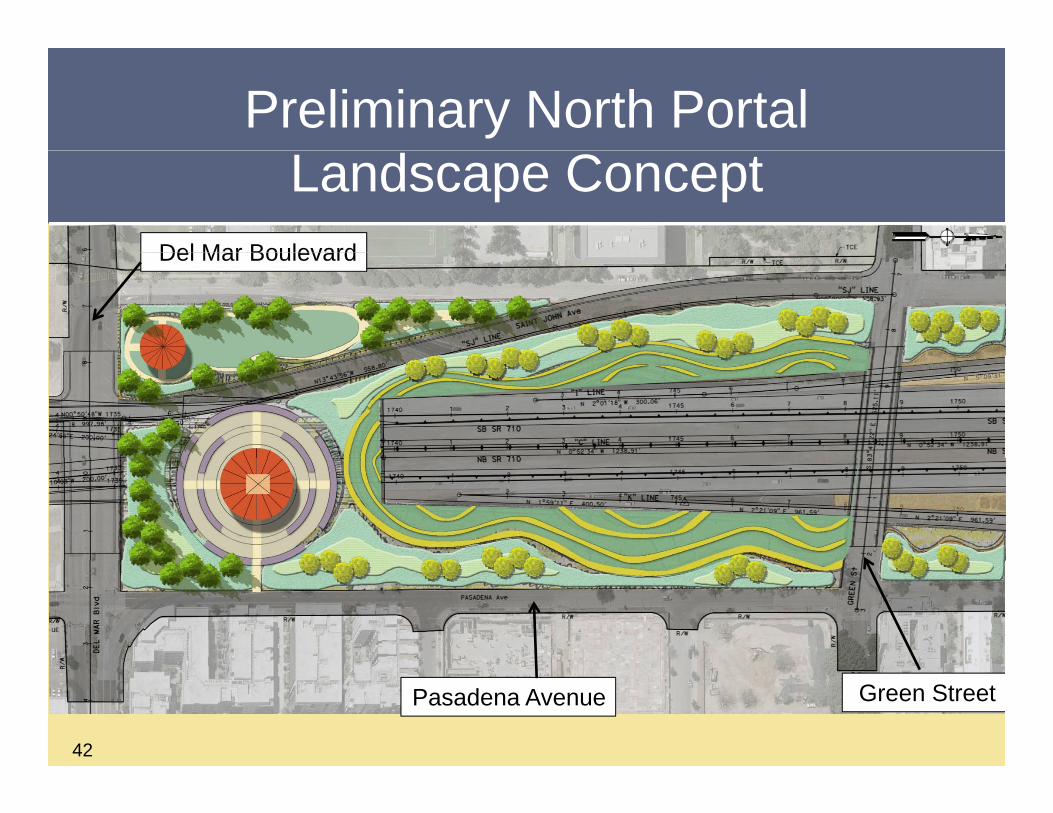
Preliminary North Portal Landscape Concept
Del Mar BoulevardDel Mar Boulevard
42
Green StreetPasadena Avenue
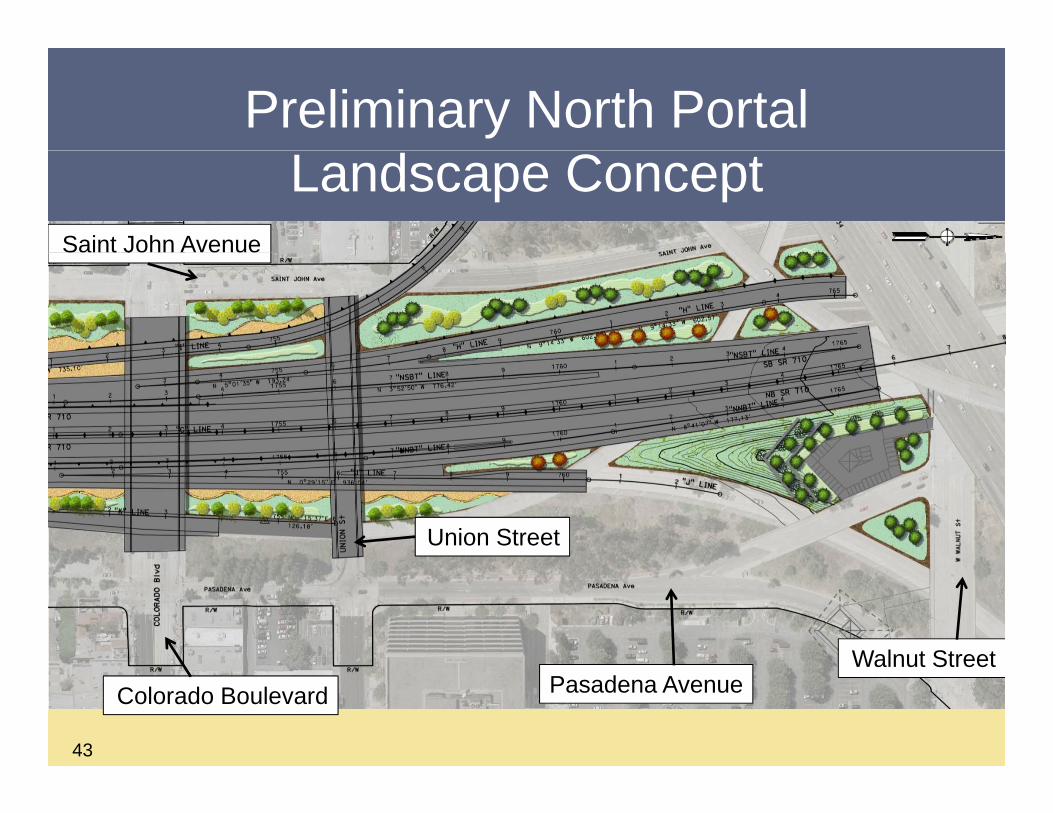
Preliminary North Portal Landscape Concept
Saint John Avenue
Union Street
Walnut Street
43
Pasadena AvenueColorado BoulevardWalnut Street

Preliminary North OMC Building Landscape Concept
Del Mar BoulevardCalifornia Boulevard
44
Del Mar BoulevardCalifornia Boulevard

Status Update on Environmental Studies Documentation
45

Environmental Studies Support the EIR/EISEIR/EIS
46

Environmental Technical StudiesEnvironmental Technical Studies
B li d h i (i l di fi ldBaseline data gathering (including field surveys) is ongoingTechnical study teams are currently
reviewing plans of the build alternatives for analysisWorking with engineering team to verify g g g y
construction assumptions for each build alternative
47

Environmental Technical StudiesEnvironmental Technical Studies
N i d d iNoise measurements were conducted in Alhambra, Pasadena, South Pasadena, L C ñ d Fli t id d LLa Cañada Flintridge and Los Angeles/East Los Angeles in late July, A t d S t bAugust and SeptemberTeam met with SCAQMD to discuss
emission requirements
48

Status Update on Traffic AnalysisStatus Update on Traffic Analysis
49

Traffic Analysis StatusTraffic Analysis Status
E i i C di i (2012) T lExisting Conditions (2012) Travel Demand Model Validation CompleteExisting Conditions Operations Models
(for Level of Service) Nearing CompletionExtensive Model Runs with Alternatives
(No Build and Build) UnderwayPreliminary Results for 2035 Assessed
50
Preliminary Results for 2035 Assessed

Upcoming Traffic Analysis StepsUpcoming Traffic Analysis Steps
C l 2035 M d l R (IComplete 2035 Model Runs (Input to Environmental Analysis)Conduct Traffic Analysis (LOS) for
Freeway and Surface StreetsTransit, Parking, Bike/Ped Assessments
51

Updated No Build Projects MapUpdated No Build Projects Map
5252

No Build Vs Existing – DailyNo Build Vs. Existing Daily
5353

Traffic Analysis Impact Area D ilDaily
5454

Daily Vehicle Miles Traveled (VMT) in the Region
55 BRT model runs and variations to other alternatives still in progress

Build Alternatives Daily VMT in the Region
56 BRT model runs and variations to other alternatives still in progress

Daily Vehicle Hours Traveled (VHT) in the Region
57 BRT model runs and variations to other alternatives still in progress

Build Alternatives Daily VHT in the Region
58 BRT model runs and variations to other alternatives still in progress

Number of Jobs Accessible within 25 3 Minutes25.3 Minutes
(National Average Journey to Work)
59 BRT model runs and variations to other alternatives still in progress
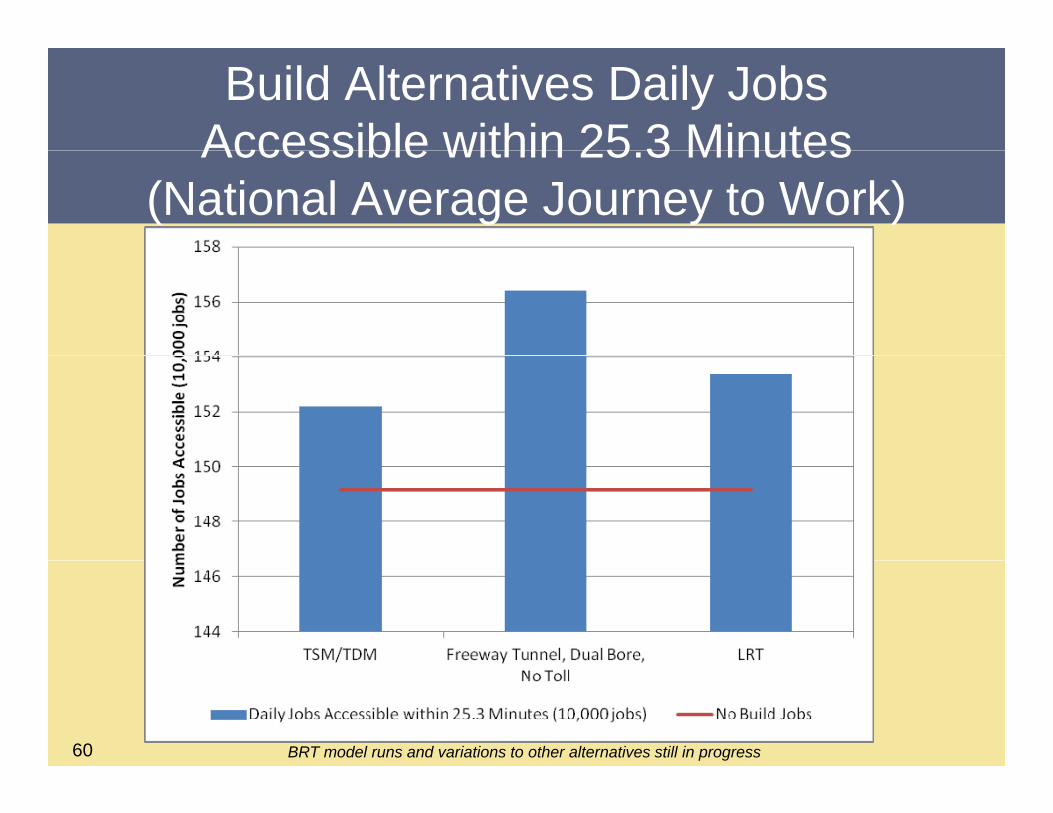
Build Alternatives Daily Jobs Accessible within 25 3 MinutesAccessible within 25.3 Minutes
(National Average Journey to Work)
60 BRT model runs and variations to other alternatives still in progress

Daily Volume on Arterials (Non-Freeways) Crossing(Non Freeways) Crossing
East-West Screenline
61

Daily Volume on Arterials (Non-Freeways) Crossing(Non Freeways) Crossing
East-West Screenline
62 BRT model runs and variations to other alternatives still in progress

Build Alternatives Daily Volume on Arterials (Non-Freeways) CrossingArterials (Non Freeways) Crossing
East-West Screenline
63 BRT model runs and variations to other alternatives still in progress

Freeway Miles with LOS F in the Study Area (Greatest Between AMStudy Area (Greatest Between AM
and PM Peak)
64 BRT model runs and variations to other alternatives still in progress
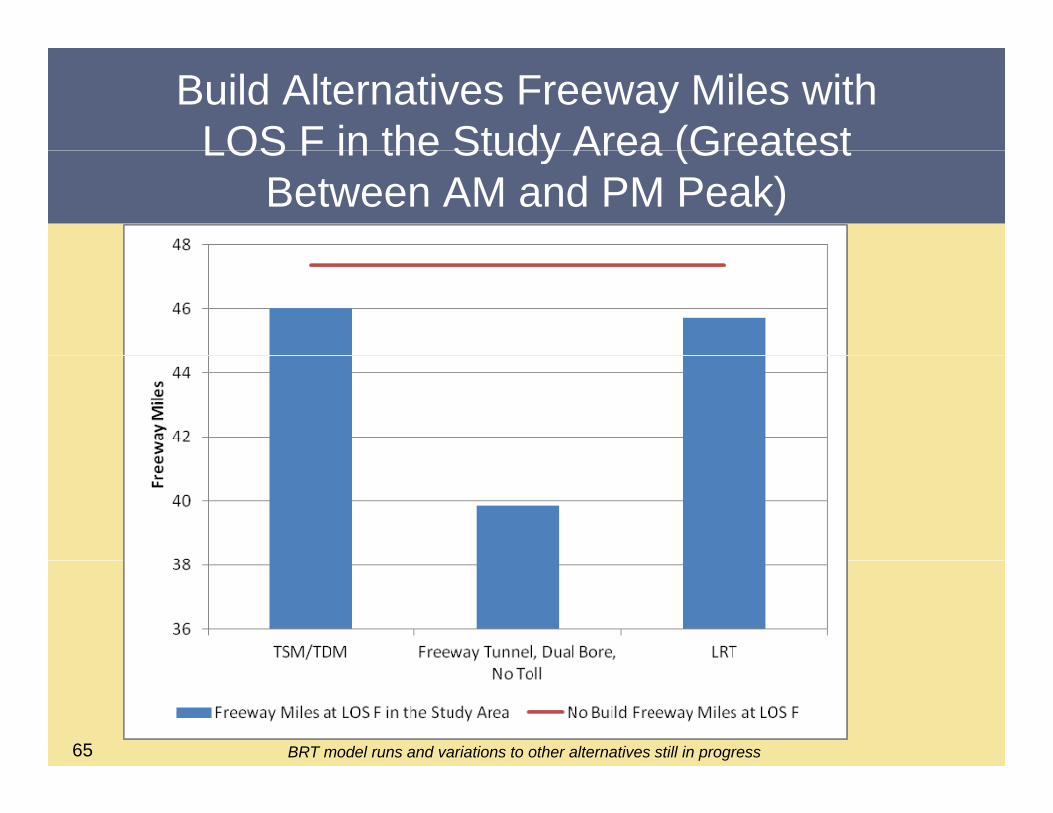
Build Alternatives Freeway Miles with LOS F in the Study Area (GreatestLOS F in the Study Area (Greatest
Between AM and PM Peak)
65 BRT model runs and variations to other alternatives still in progress

Next StepsNext Steps
66

Study ScheduleStudy Schedule
67

Next StepsNext Steps
VA St d d ti ill b t dVA Study recommendations will be presented at the next meeting
E l t f f b ild lt tiEvaluate performance of build alternativesContinue with Technical StudiesC ti ith P li i E i iContinue with Preliminary EngineeringBegin preparation of the Draft Environmental
D tDocument
68

Tentative Meeting Dates for TAC/SOAC
2013 TAC/SOAC M i S h d l2013 TAC/SOAC Meeting ScheduleNovember 13/14
69

Open DiscussionOpen Discussion
70