SR 19/20 Corridor Plan - WSDOT (PDF) · The SR 19/SR 20 Corridor Plan study area begins in...
102
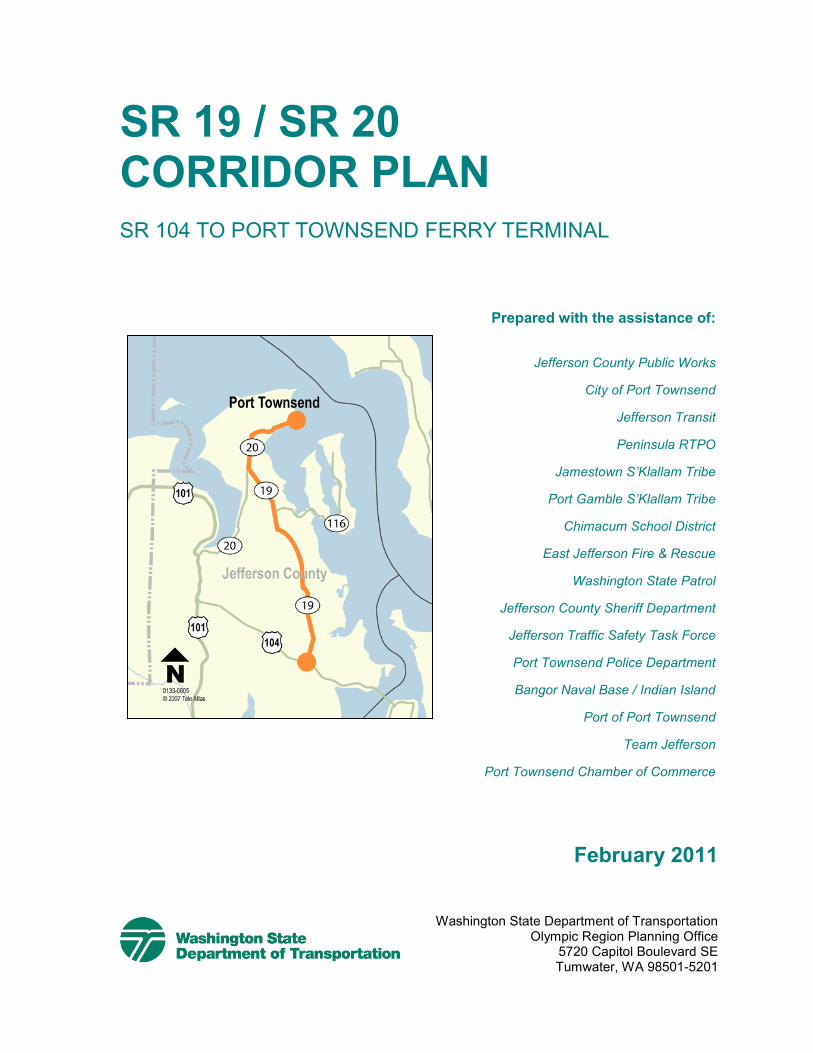
Prepared with the assistance of: Jefferson County Public Works City of Port Townsend Jefferson Transit Peninsula RTPO Jamestown S’Klallam Tribe Port Gamble S’Klallam Tribe Chimacum School District East Jefferson Fire & Rescue Washington State Patrol Jefferson County Sheriff Department Jefferson Traffic Safety Task Force Port Townsend Police Department Bangor Naval Base / Indian Island Port of Port Townsend Team Jefferson Port Townsend Chamber of Commerce SR 19 / SR 20 CORRIDOR PLAN SR 104 TO PORT TOWNSEND FERRY TERMINAL February 2011 Washington State Department of Transportation Olympic Region Planning Office 5720 Capitol Boulevard SE Tumwater, WA 98501-5201
Transcript of SR 19/20 Corridor Plan - WSDOT (PDF) · The SR 19/SR 20 Corridor Plan study area begins in...
Prepared with the assistance of:
Jefferson County Public Works
City of Port Townsend
Jefferson Transit
Peninsula RTPO
Jamestown S’Klallam Tribe
Port Gamble S’Klallam Tribe
Chimacum School District
East Jefferson Fire & Rescue
Washington State Patrol
Jefferson County Sheriff Department
Jefferson Traffic Safety Task Force
Port Townsend Police Department
Bangor Naval Base / Indian Island
Port of Port Townsend
Team Jefferson
Port Townsend Chamber of Commerce
SR 19 / SR 20 CORRIDOR PLAN SR 104 TO PORT TOWNSEND FERRY TERMINAL
February 2011
Washington State Department of Transportation
Olympic Region Planning Office 5720 Capitol Boulevard SE Tumwater, WA 98501-5201
WASHINGTON STATE DEPARTMENT OF TRANSPORTATION OLYMPIC REGION
TUMWATER, WASHINGTON
SR 19 / SR 20 CORRIDOR PLAN
Project Limits: SR 19 / SR 104 Intersection to the
Port Townsend Ferry Terminal SR 19: Mile Post 0.00-14.09 SR 20: Mile Post 7.79-12.56
FEBRUARY 2011
KEVIN J. DAYTON, P.E. REGION ADMINISTRATOR
RON M. LANDON, P.E. PLANNING AND PROGRAM MANAGER

Americans with Disabilities Act (ADA) Information
Materials can be provided in alternative formats: large print, Braille, cassette tape, or on computer disk for people with disabilities by calling the ADA/504 Compliance Manager, Shawn Murinko at (360) 705-7097. Persons who are deaf or hard of hearing may contact OEO through the Washington Relay Service at 7-1-1.
Title VI Notice to Public
It is the Washington State Department of Transportation's (WSDOT) policy to assure that no person shall, on the grounds of race, color, national origin or sex, as provided by Title VI of the Civil Rights Act of 1964, be excluded from participation in, be denied the benefits of, or be otherwise discriminated against under any of its federally funded programs and activities. Any person who believes his/her Title VI protection has been violated, may file a complaint with WSDOT's Office of Equal Opportunity (OEO). For Title VI complaint forms and advice, please contact OEO's Title VI Coordinator, George Laue at (509) 324-6018.

TABLE OF CONTENTS
EXECUTIVE SUMMARY ................................................................................ 1
CHAPTER 1 THE PURPOSE OF CORRIDOR PLANNING ......................... 9 1.1 How to Use this Corridor Plan ................................................... 11 1.1.1 WSDOT Highway System Plan ................................................. 12 1.1.2 WSDOT Improvement Subprograms ......................................... 12
CHAPTER 2 EXISTING ROUTE CHARACTERISTICS ............................... 15 2.1 Functional Characteristics of the Route ..................................... 17 2.1.1 SR 19/ SR 20 and the Transportation Network ......................... 18 2.1.2 Route Classifications ................................................................. 20 2.1.3 Access Classification ................................................................. 22 2.1.4 Terrain and Roadside Classifications ........................................ 26 2.2 Physical Characteristics ............................................................ 27 2.2.1 Geometric Elements .................................................................. 27 2.2.2 Passing Lanes ........................................................................... 28 2.2.3 Bridges and Structures .............................................................. 28 2.2.4 Intersection Controls ................................................................. 29 2.2.5 Right of Way .............................................................................. 29 2.2.6 Environmental Resources ......................................................... 29 2.2.7 Environmental Mitigation ........................................................... 35 2.3 Commercial Services ................................................................. 36 2.3.1 Transit ....................................................................................... 36 2.3.2 Utilities ....................................................................................... 36 2.4 Land Use Characteristics .......................................................... 36 2.5 Operating Conditions ................................................................. 37 2.5.1 Traffic Volume Estimates ........................................................... 37 2.5.2 Present and Future Traffic Conditions ....................................... 38 2.5.3 Highway Segment Identification ................................................ 39 2.5.4 Highway Segment Level of Service ........................................... 40 2.5.5 Intersection Level of Service ..................................................... 41 2.5.6 Intersection Inventory and Traffic Channelization ...................... 44 2.5.7 Intersection Inventory and Intersection Improvements .............. 50 2.6 Safety ........................................................................................ 55 2.6.1 Collision History ......................................................................... 55 2.6.2 Congestion Factor ..................................................................... 56 2.6.3 Traffic Speed ............................................................................. 56

TABLE OF CONTENTS
CHAPTER 3 THE STUDY PROCESS .......................................................... 59 3.1 Stakeholder Involvement ........................................................... 61 3.1.1 Corridor Working Group Membership ........................................ 62 3.1.2 Corridor Working Group Meetings ............................................. 62 3.2 Scheduled Public Involvement .................................................. 68 3.3 Community Meeting ................................................................... 71 3.4 Consistency with Transportation & Local Comprehensive Plans ...................................................... 71 3.5 Consistency with WTP and HSP 72
CHAPTER 4 STAKEHOLDER RECOMMENDATIONS ............................... 73 4.1 The Alternatives Considered ..................................................... 75 4.2 Alternatives Evaluation and Scoring .......................................... 76 4.3 Recommendations..................................................................... 77 4.3.1 Projects of Special Interest ........................................................ 80 4.3.2 Tier I Solutions .......................................................................... 82 4.3.3 Tier II Solutions ......................................................................... 84 4.3.4 Tier III Solutions 86 4.3.5 Transportation Demand Management (TDM) Strategies ........... 88
CHAPTER 5 PLAN IMPLEMENTATION ..................................................... 91 5.1 Plan Implementation ................................................................. 93 5.2 Highway System Plan ............................................................... 103 5.3 Developer Participation ............................................................. 103 5.4 Grants ........................................................................................ 103 5.5 Legislature/Legislative Funding ................................................. 104 5.6 Next Steps ................................................................................ 104
APPENDICES ................................................................................................ 105 Appendix A Route Classifications ...................................................... 109 Appendix B Physical Characteristics .................................................. 111 Appendix C Utility Locations ............................................................... 123 Appendix D Traffic Analysis ............................................................... 127 Appendix E Stakeholder Meetings ..................................................... 141 Appendix F Corridor Working Group Recommendations ................... 183 Appendix G Comprehensive Program to Encourage Alternative Transportation Choices ................................. 189 Appendix H Evaluation Methodology ................................................. 191 Appendix I Evaluation Scoring Matrix ............................................... 193
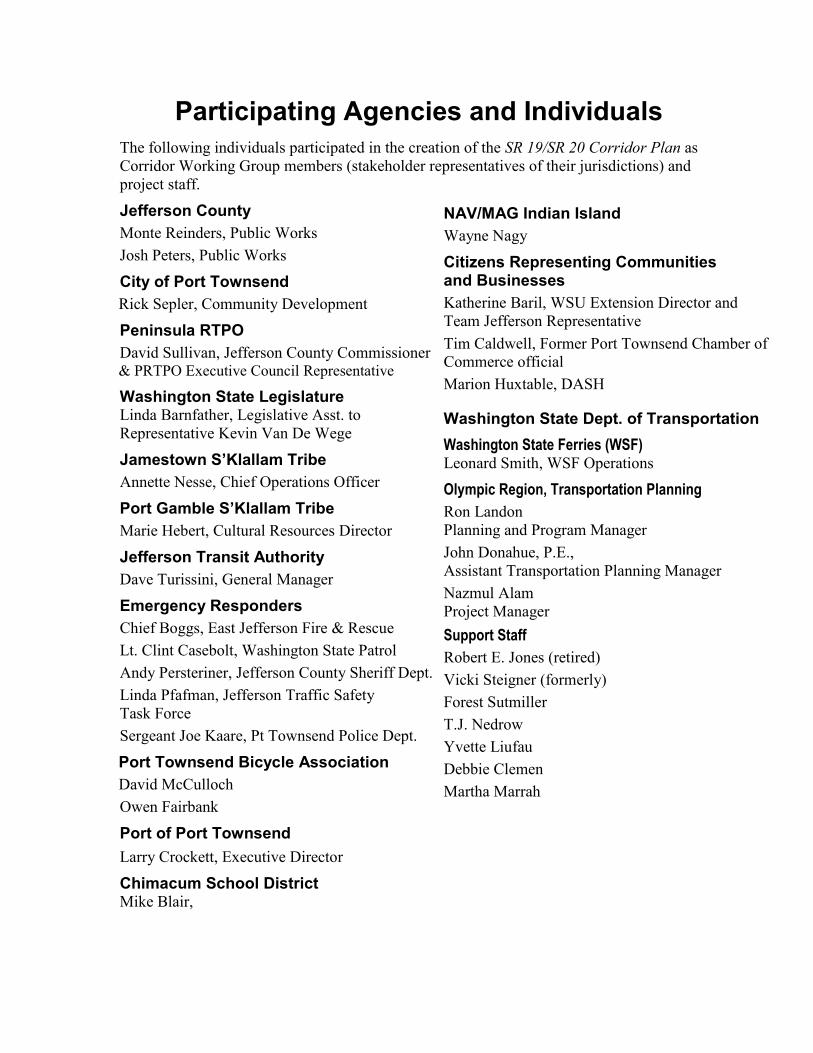
Participating Agencies and Individuals The following individuals participated in the creation of the SR 19/SR 20 Corridor Plan as Corridor Working Group members (stakeholder representatives of their jurisdictions) and project staff.
Jefferson County Monte Reinders, Public Works Josh Peters, Public Works
City of Port Townsend Rick Sepler, Community Development
Peninsula RTPO David Sullivan, Jefferson County Commissioner & PRTPO Executive Council Representative
Washington State Legislature Linda Barnfather, Legislative Asst. to Representative Kevin Van De Wege
Jamestown S’Klallam Tribe Annette Nesse, Chief Operations Officer
Port Gamble S’Klallam Tribe Marie Hebert, Cultural Resources Director
Jefferson Transit Authority Dave Turissini, General Manager
Emergency Responders Chief Boggs, East Jefferson Fire & Rescue Lt. Clint Casebolt, Washington State Patrol Andy Persteriner, Jefferson County Sheriff Dept. Linda Pfafman, Jefferson Traffic Safety Task Force Sergeant Joe Kaare, Pt Townsend Police Dept.
Port Townsend Bicycle Association David McCulloch Owen Fairbank
Port of Port Townsend Larry Crockett, Executive Director
Chimacum School District Mike Blair,
NAV/MAG Indian Island Wayne Nagy
Citizens Representing Communities and Businesses Katherine Baril, WSU Extension Director and Team Jefferson Representative Tim Caldwell, Former Port Townsend Chamber of Commerce official Marion Huxtable, DASH
Washington State Dept. of Transportation Washington State Ferries (WSF) Leonard Smith, WSF Operations
Olympic Region, Transportation Planning
Ron Landon Planning and Program Manager John Donahue, P.E., Assistant Transportation Planning Manager Nazmul Alam Project Manager Support Staff
Robert E. Jones (retired) Vicki Steigner (formerly) Forest Sutmiller T.J. Nedrow Yvette Liufau Debbie Clemen Martha Marrah

SR 19/ SR 20 Corridor Plan Page 1 February 2011
EXECUTIVE SUMMARY
The Vision In July 2008, a Corridor Working Group consisting of transportation stakeholders representing a variety of interests convened to build the vision for the development of SR 19 and SR 20 corridor from the SR 19/SR104 intersection to the Port Townsend ferry terminal. Together they developed a vision statement for the corridor through the year 2031. Their vision, upon which they reached consensus, is:
SR 19/ SR 20 Corridor Vision A sustainable multi-modal corridor that integrates the movement of people and goods safely and efficiently, enhances regional connections, and contributes to economic vitality and improves quality of life, with minimum environmental impacts.
Over the course of the study, the corridor working group met four times (July 17 and November 7, 2008; July 29 and October 28, 2009). The vision was maintained through direct involvement of the Corridor Working Group in the development and approval of the alternatives evaluation criteria and, ultimately, the corridor plan recommendations. The evaluation criteria were grouped under safety, congestion/mobility, feasibility/constructability, and environmental impact.
The working group‟s efforts were supported by information gathered about the study area during four public meetings/open houses, and by technical reports prepared and presented by the Washington State Department of Transportation (WSDOT), Olympic Region Planning Office staff. The public meetings occurred on August 28 and December 4, 2008; and August 27 and November 19, 2009 in Chimacum and Port Hadlock. The working group‟s decisions were made in direct consultation with these WSDOT representatives.
The Study The SR 19/SR 20 Corridor Plan study area begins in Jefferson County at the intersection of SR 104/19 and follows SR 19 (Beaver Valley Road) through the communities of Beaver Valley, Chimacum, Port Hadlock, Irondale, and Kala Point to the intersection with SR 20. The study area then continues for nearly five miles along SR 20 (Sims Way) through the community of Glen Cove towards Port Townsend concluding at the Port Townsend ferry terminal.
WSDOT has studied this corridor in collaboration with Jefferson County Public Works, the City of Port Townsend and other users of the route to identify ways to reduce congestion and increase safety. These routes are identified as Highways of Statewide Significance and provide a regional connection between the Olympic
Page 2 SR 19/ SR 20 Corridor Plan February 2011
Peninsula and Island County via the Port Townsend ferry. State Route 20 is part of the National Highway System (NHS).
A corridor plan identifies transportation safety and mobility improvement opportunities and guides WSDOT‟s investments in the corridor over a 20-year period. The plan targets many of the congestion, safety and roadside issues that travelers often face.
The study process involved review and analysis of technical information such as current and forecast traffic conditions and the collision history on the corridor. Public involvement outreach efforts consisted of four corridor working group meetings and four public meetings/open houses that generated great interest in the community and facilitated public participation. Using the technical analysis provided by WSDOT and the information gathered through the public meeting process, the working group endorsed recommendations to address the forecast deficiencies on the corridor. This corridor plan provides WSDOT with a strategy for improving the corridor through the year 2031, while taking into consideration the plans and preferences of the affected jurisdictions and route users. The end result is a prioritized list of short-, mid-, and long-term projects that can compete for state, regional, and local transportation funds.
The study corridor was divided into six segments, each having its own characteristics and needs. Segment 1, from SR 104 to Chimacum-Center is the rural segment; segments 5 and 6 are the more urbanized city segments; and in between are the urbanizing segments 2, 3, and 4. The “urbanizing” of Segments 2, 3, and 4 relates to the land use becoming more urban rather than rural. Note: that this is not specifically a highway designation of urban over rural. The urban growth Tri-Area of Chimacum, Irondale, and Port Hadlock in Segment 3 contributes to the future urbanization in Segments 2, 3 and 4 because it‟s centrally located. The 2000 Census data information identifies an urban cluster as a densely settled territory that has a population of at least 2,500 but less than 50,000.
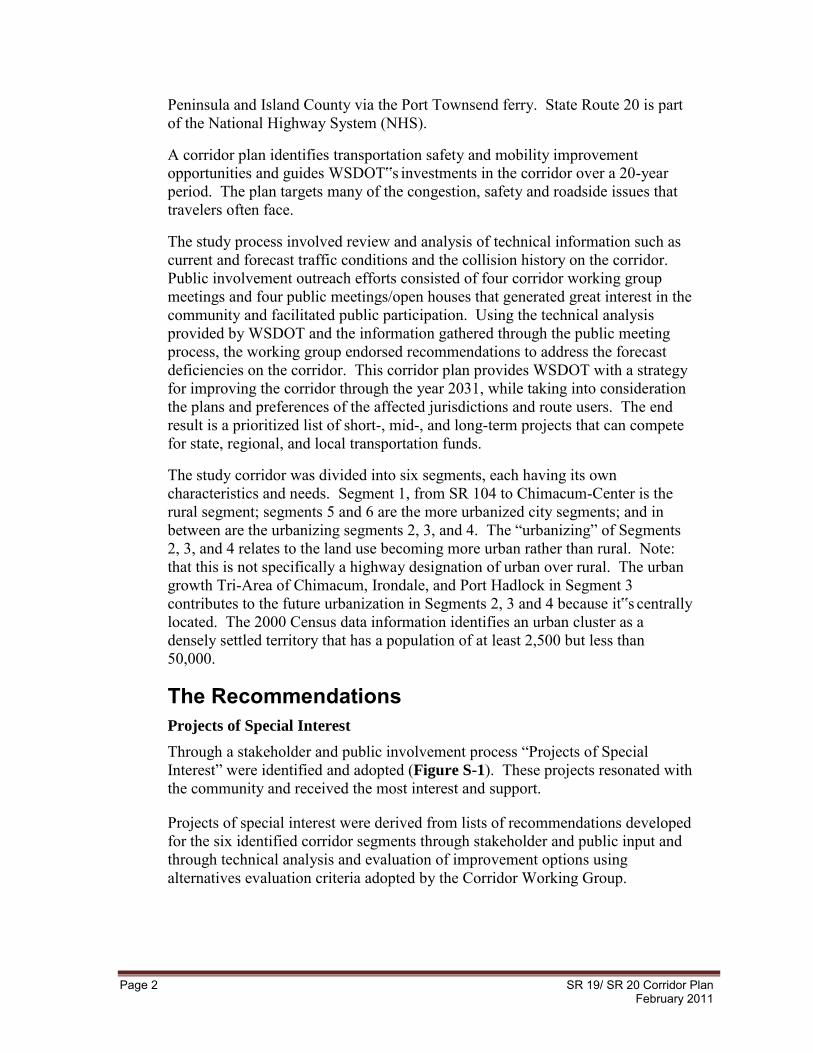
The Recommendations Projects of Special Interest
Through a stakeholder and public involvement process “Projects of Special Interest” were identified and adopted (Figure S-1). These projects resonated with the community and received the most interest and support.
Projects of special interest were derived from lists of recommendations developed for the six identified corridor segments through stakeholder and public input and through technical analysis and evaluation of improvement options using alternatives evaluation criteria adopted by the Corridor Working Group.
SR 19/ SR 20 Corridor Plan Page 3 February 2011
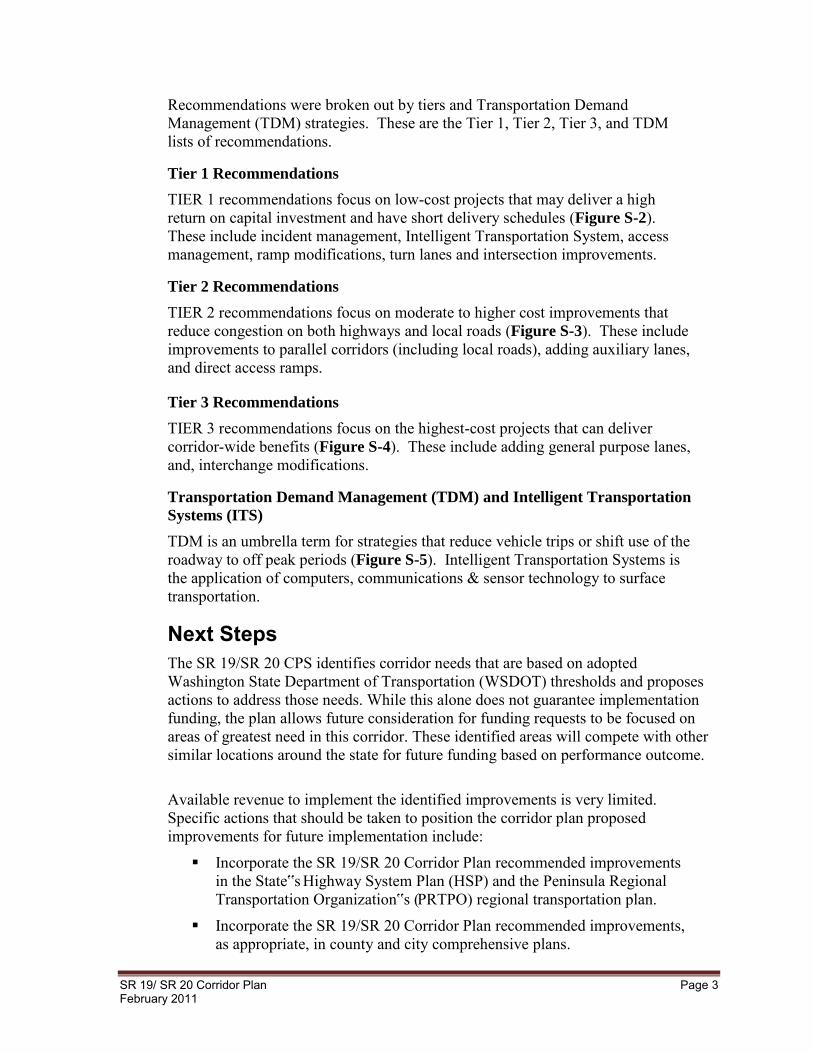
Recommendations were broken out by tiers and Transportation Demand Management (TDM) strategies. These are the Tier 1, Tier 2, Tier 3, and TDM lists of recommendations.
Tier 1 Recommendations
TIER 1 recommendations focus on low-cost projects that may deliver a high return on capital investment and have short delivery schedules (Figure S-2). These include incident management, Intelligent Transportation System, access management, ramp modifications, turn lanes and intersection improvements.
Tier 2 Recommendations
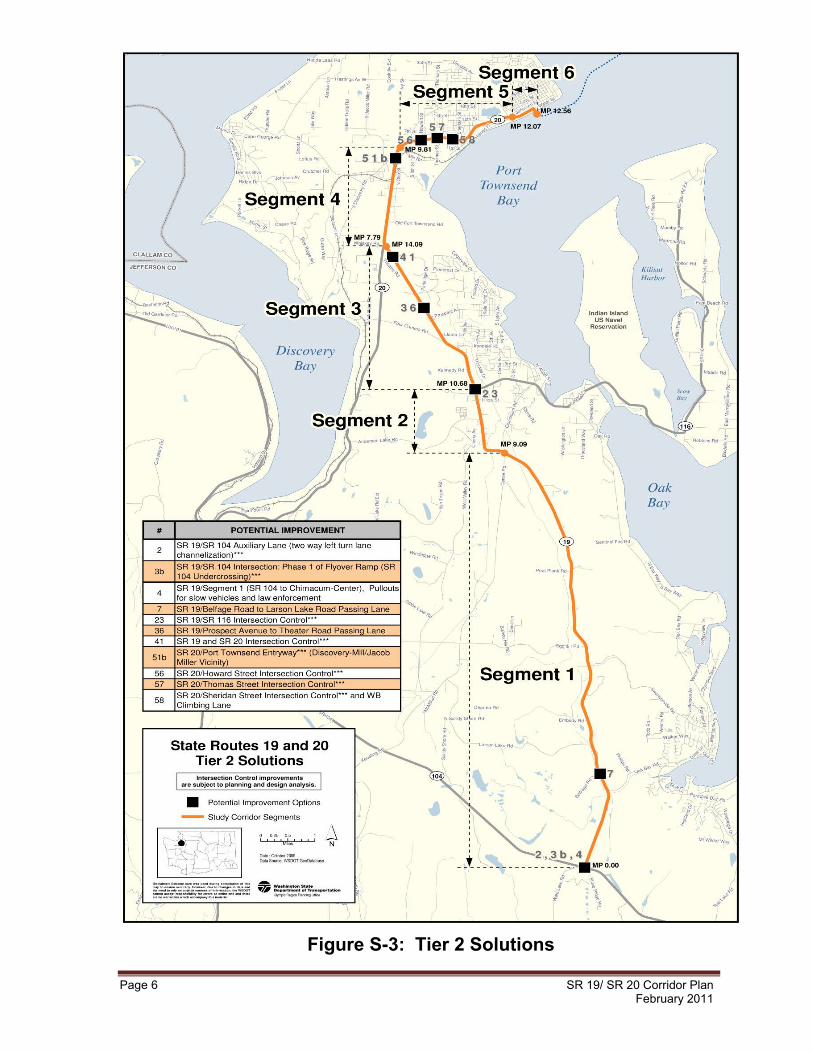
TIER 2 recommendations focus on moderate to higher cost improvements that reduce congestion on both highways and local roads (Figure S-3). These include improvements to parallel corridors (including local roads), adding auxiliary lanes, and direct access ramps.
Tier 3 Recommendations
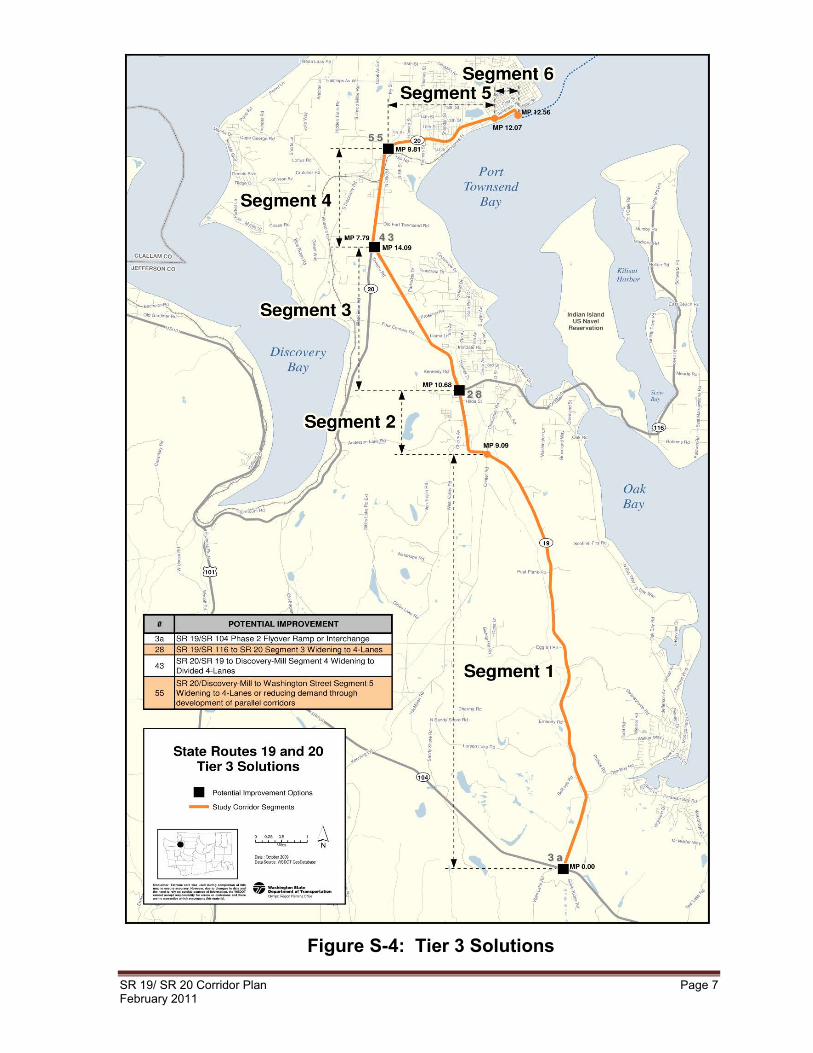
TIER 3 recommendations focus on the highest-cost projects that can deliver corridor-wide benefits (Figure S-4). These include adding general purpose lanes, and, interchange modifications.
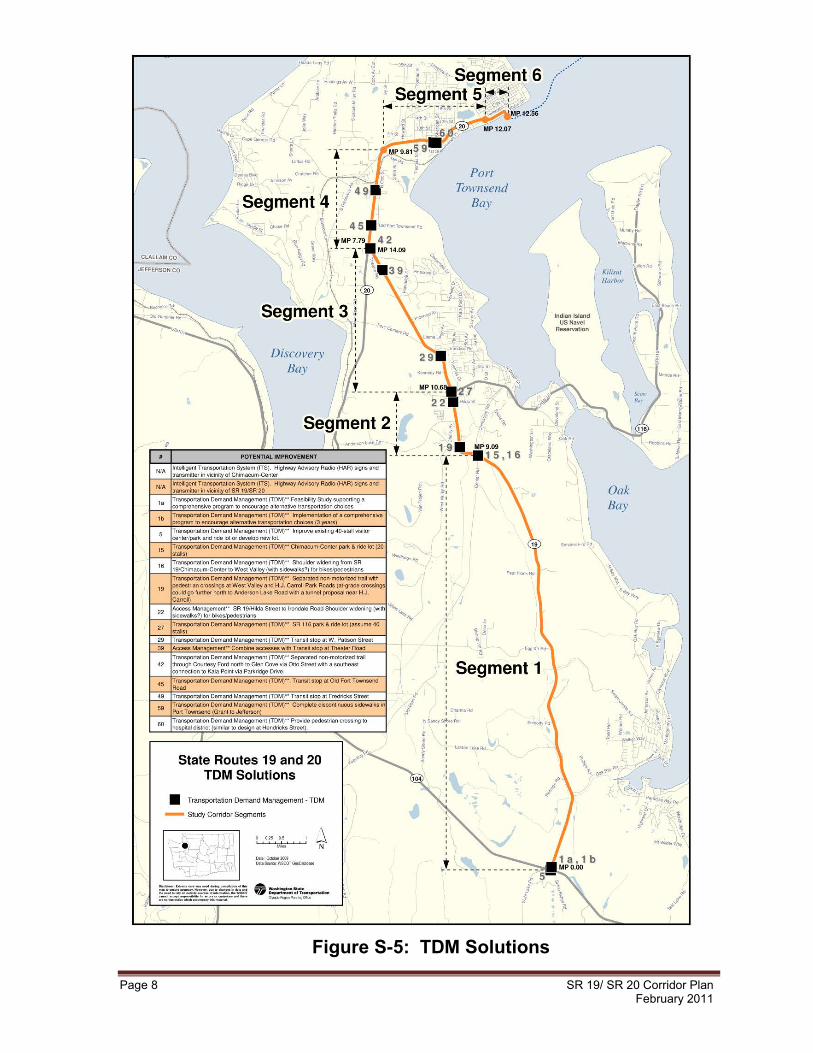
Transportation Demand Management (TDM) and Intelligent Transportation
Systems (ITS)
TDM is an umbrella term for strategies that reduce vehicle trips or shift use of the roadway to off peak periods (Figure S-5). Intelligent Transportation Systems is the application of computers, communications & sensor technology to surface transportation.
Next Steps The SR 19/SR 20 CPS identifies corridor needs that are based on adopted Washington State Department of Transportation (WSDOT) thresholds and proposes actions to address those needs. While this alone does not guarantee implementation funding, the plan allows future consideration for funding requests to be focused on areas of greatest need in this corridor. These identified areas will compete with other similar locations around the state for future funding based on performance outcome.
Available revenue to implement the identified improvements is very limited. Specific actions that should be taken to position the corridor plan proposed improvements for future implementation include:
Incorporate the SR 19/SR 20 Corridor Plan recommended improvements in the State‟s Highway System Plan (HSP) and the Peninsula Regional Transportation Organization‟s (PRTPO) regional transportation plan.
Incorporate the SR 19/SR 20 Corridor Plan recommended improvements, as appropriate, in county and city comprehensive plans.
Page 4 SR 19/ SR 20 Corridor Plan February 2011
Figure S-1: Projects of Special Interest
SR 19/ SR 20 Corridor Plan Page 5 February 2011
Figure S-2: Tier 1 Solutions
Page 6 SR 19/ SR 20 Corridor Plan February 2011
Figure S-3: Tier 2 Solutions
SR 19/ SR 20 Corridor Plan Page 7 February 2011
Figure S-4: Tier 3 Solutions
Page 8 SR 19/ SR 20 Corridor Plan February 2011
Figure S-5: TDM Solutions
SR 19/ SR 20 Corridor Plan Page 9 February 2011
CHAPTER 1
The Purpose of Corridor Planning

SR 19/ SR 20 Corridor Plan Page 11 February 2011
Chapter 1 The Purpose of Corridor Planning Corridor plans are a tool for addressing the long-range vision of how a highway should look and function in the future. A corridor plan takes a 20 plus year look into the future at highway and travel conditions. It involves collecting and analyzing facts and data about the study area and the communities that are served by the route. Information considered and analyzed during the study includes such things as operating conditions, environmental concerns, population and land use, right of way and other elements that affect the highway‟s development. It is important to the Washington State Department of Transportation (WSDOT) and its funding partners, such as the federal government, to know that any projects that are built as a result of the corridor planning effort will function well into the future to serve the increasing demands on our transportation system.
To ensure that the study recommendations are consistent with the vision and needs of local jurisdictions and communities located along the route, the corridor plan includes a public participation process. This process seeks public involvement on two levels; the creation of a corridor working group, and the hosting of meetings specifically designed to engage public participation.
The corridor working group committee‟s role is to inform WSDOT of community interests and concerns, create a vision for the route, determine decision criteria, and endorse route recommendations. During the public meeting process, community members can share their thoughts and ideas on the information presented.
The end result of a corridor plan effort is the corridor plan document. The document examines existing and forecasted deficiencies within the study area and proposes appropriate solutions.
1.1 How to Use this Corridor Plan A corridor plan serves as a comprehensive plan for a state route(s). For WSDOT, the corridor plan provides detailed information for use in the Highway System Plan. It can also be used by transportation stakeholders such as local agencies, Regional Transportation Planning Organizations (RTPOs) and others in their own planning process. The information provided in the corridor plan can be used to ensure that the local projects and programs are consistent with, and complementary to, the efforts of WSDOT within their jurisdictions.
Page 12 SR 19/ SR 20 Corridor Plan February 2011
The SR 19/SR 20 Corridor Plan is organized into five chapters:
Chapter One is an introduction to the corridor plan and document, and includes a discussion about how the study findings are used by WSDOT and others.
Chapter Two provides information about the existing highway facility and the surrounding area. This chapter includes information about the route, including the functional characteristics and the existing and forecasted traffic operations.
Chapter Three is a review of the process used to determine the route deficiencies and recommended solutions. This chapter includes a description of the stakeholder and public processes.
Chapter Four provides a focused discussion about the alternatives considered for the SR 19/SR 20 corridor/routes and specific study recommendations for future development.
Chapter Five provides a discussion on plan implementation.
1.1.1 WSDOT Highway System Plan The SR 19/SR 20 Corridor Plan advances and refines the vision and strategies contained in the WSDOT Highway System Plan (HSP) by providing a more in-depth analysis of current and future deficiencies along the corridor/routes. The HSP provides service objectives and strategies for maintaining, operating, preserving and improving state highways. It is the fundamental vehicle for prioritizing and funding highway improvements statewide, serving as the basis for the two-year state transportation budget, as well as the ten-year Capital Improvement and Preservation Program.
The funding process at WSDOT includes four major programs: Maintenance, Operations, Preservation, and Improvement. Corridor plans focus heavily on solutions associated with the Improvement program. This category of funding includes projects that contribute to congestion relief, as well as those that enhance traffic safety. Operational, Maintenance and Preservation solutions are not discussed in detail. These programs are prioritized by WSDOT using a different process, as they do not require the kind of public consensus used in developing corridor plans.
1.1.2 WSDOT Improvement Subprograms The Improvement funding program at WSDOT has five subprograms: Highway Mobility, Highway Safety, Environmental Retrofit, Economic Initiatives, and Public/Private Partnerships. Projects requiring funding within the programs are identified and included in the HSP.
SR 19/ SR 20 Corridor Plan Page 13 February 2011
Mobility Subprogram
The Mobility Subprogram of the Highway System Improvement Program is intended to relieve congestion and improve operational efficiency. The focus is on moving people and improving intermodal connections. Typical strategies include access management, adding general purpose or high-occupancy vehicle lanes, and providing bicycle facilities and park and ride lots. Another series of operational strategies found in this subprogram seeks to optimize the existing facility capacity by influencing the patterns of usage on a route. Typical operational strategies include ramp metering (limited access highways), timely traveler information, incident response and signal synchronization.
Highway Safety Subprogram The Highway Safety Subprogram is intended to increase highway safety. Every two years, the Collision Analysis Locations (CAL) and Collision Analysis Corridors (CAC) in each WSDOT region are addressed with the funds available for that purpose. Because of the primary role of this programming effort, the safety recommendations described in corridor plans are limited to more minor situations. The focus is on solutions that can be funded using operational dollars. Projects identified and funded through the Safety Subprogram may be discussed during the course of a study, but are not included in the corridor plan recommendations.
There is also an Intersection Analysis Location List (IALL). This list ranks intersections statewide using average societal cost per each target intersection, depending on the type of collision for the last five years. There is only one IALL location in the study area. The IALL location is at the intersection of State Route (SR) 104 and SR 19 (Beaver Valley Road).
Economic Initiatives Subprogram The Economic Initiatives Subprogram targets those improvements to state highways that contribute specifically to economic development. Objectives include creation and retention of jobs, especially in rural areas. Tourism is of particular interest in this subprogram, where typical projects include safety rest areas and traveler support services.
Environmental Retrofit Subprogram
The Environmental Retrofit Subprogram addresses situations where existing conditions on a route do not meet current environmental requirements for highways. Typical projects address stormwater treatment, fish passage, noise reduction and air quality.
Deficiencies identified in the Economic Initiatives and Environmental Retrofit Subprograms are typically identified, prioritized and addressed by their own program managers. Therefore, these issues are not a major consideration of the Corridor Plan.
SR 19/ SR 20 Corridor Plan Page 15 February 2011
CHAPTER 2
Existing Route Characteristics
SR 19/ SR 20 Corridor Plan Page 17 February 2011
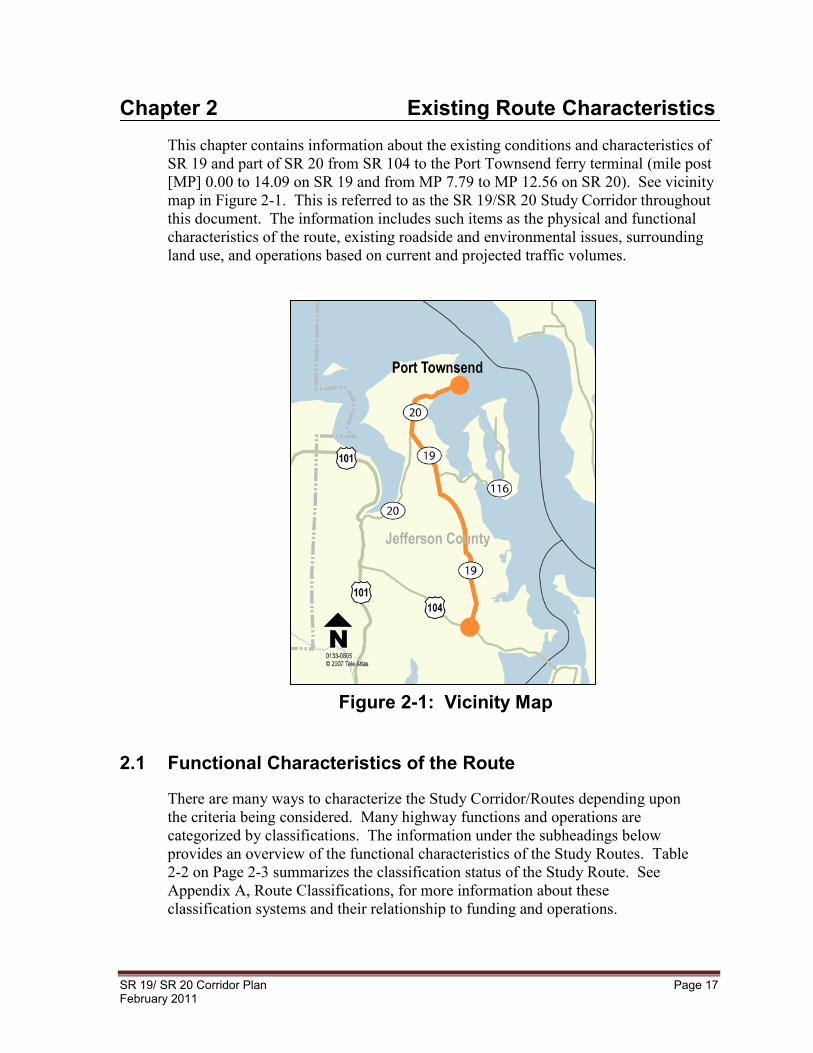
Chapter 2 Existing Route Characteristics This chapter contains information about the existing conditions and characteristics of SR 19 and part of SR 20 from SR 104 to the Port Townsend ferry terminal (mile post [MP] 0.00 to 14.09 on SR 19 and from MP 7.79 to MP 12.56 on SR 20). See vicinity map in Figure 2-1. This is referred to as the SR 19/SR 20 Study Corridor throughout this document. The information includes such items as the physical and functional characteristics of the route, existing roadside and environmental issues, surrounding land use, and operations based on current and projected traffic volumes.
2.1 Functional Characteristics of the Route
There are many ways to characterize the Study Corridor/Routes depending upon the criteria being considered. Many highway functions and operations are categorized by classifications. The information under the subheadings below provides an overview of the functional characteristics of the Study Routes. Table 2-2 on Page 2-3 summarizes the classification status of the Study Route. See Appendix A, Route Classifications, for more information about these classification systems and their relationship to funding and operations.
Figure 2-1: Vicinity Map

Page 18 SR 19/ SR 20 Corridor Plan February 2011
2.1.1 SR 19/SR 20 and the Transportation Network SR 19 and part of SR 20 in Jefferson County are important north-south arterials that begin at the intersection of SR 104/SR 19 and end at the Port Townsend ferry terminal. The immediate area served by the Study Corridor is bounded to the west by a large expanse of valley farmland; to the east by the communities of Port Ludlow, and Port Hadlock; to the north by the city of Port Townsend; and to the south by SR 104. SR 104 is primarily an east-west route that begins at US 101 in Jefferson County on the Olympic Peninsula, crosses Hood Canal by floating bridge, and continues north and east to the community of Kingston. The study corridor serves commuter, commercial, recreational, freight, and other traffic.
Parts of SR 20 outside the study corridor, connects with US 101 to the west along Discovery Bay; while another continues north and east into Whidbey Island and beyond. Another state route, SR 116 provides a connection from SR 19 through Port Hadlock to the naval ordinance facility on Indian Island and Fort Flagler State Park on Marrowstone Island.
Jefferson County‟s collector roads in the vicinity of the study corridor include Center Road, Oak Bay Road, West Valley Road, Four Corners Road, Irondale Road, Chimacum Road, South Jacob Miller Road, South Discovery, and others.
Port Townsend has one major arterial, Sims Way which is also SR 20, and a network of minor arterials, collectors, and local access streets. Mill Road, Washington Street, Water Street (SR 20) near the ferry terminal, are just a few of the local access streets.
Jefferson Transit provides commuter bus service throughout eastern Jefferson County from Port Townsend south to Port Hadlock, Port Ludlow, Quilcene, and Brinnon, west to Sequim, and across the Hood Canal Bridge to Poulsbo. Jefferson Transit also provides Paratransit Services, and other programs to commuters and major employers.
State highways, county roads, and city streets are also an important component in non-motorized transportation system links and facilities. Jefferson County‟s Non-Motorized Transportation and Recreational Trails Plan, and the City of Port Townsend‟s Non-Motorized Transportation Plan details the non-motorized system that includes trails, bicycle routes, and walking paths.
Highway Ferry Connections The Washington State Ferries provides vehicle and passenger ferry service between Port Townsend and Whidbey Island. The SR 19 /SR 20 Corridor Plan is consistent with the Washington State Ferries (WSF) Division‟s Final Long-Range Plan: 2009-2030. The final plan presents a vision for the future of the WSF system. It maintains current levels of service with limited improvements (The Port Townsend – Coupville service route added a new ferry in 2010 named Chetzemoka in the Kwa-di Tabil [64- car] vessel class).
SR 19/ SR 20 Corridor Plan Page 19 February 2011
No major terminal projects are proposed for this route. Adopting operational and pricing strategies will allow WSF to provide the best service at the lowest possible cost, minimize fare increases, and fill under-used non-peak capacity. The plan is built on the following key strategies that are designed to either spread vehicle demand to non-peak periods and/or increase walk-on use:
Vehicle Reservation System: A well-designed reservation system would allow WSF to operate with the smallest possible terminal facilities while maintaining a high level-of-service. The system would be tailored to specific route-level demand and market conditions.
Transit Enhancements:
WSF would have the ability to accommodate significant growth in ridership with existing facilities if more customers elected to travel as walk-ons. The single biggest impediment to walking on is the lack of sufficient transit supportive facilities and services.
Pricing Strategies:
The Plan makes two significant pricing strategy proposals. One is focused on demand management by not charging an extra fee for reservations to encourage customer use of the system. The second is targeted at mitigating fuel price risk and proposes implementing a fuel surcharge mechanism that will automatically adjust fares up and down for fluctuations in fuel prices.
Marketing:
The 2009 Legislature provided funding for a new marketing program for WSF to increase non-peak ridership. The legislature required that WSF submit a marketing plan for approval. The 2009-2015 “Turning the Tide: Transforming the Brand & Rebuilding Ridership” marketing plan goals and objectives are:
1. Transform the Brand: Marketing should transform and broaden the appeal of WSF‟s brand through more targeted messages, images, and services that will appeal to new markets and customer groups.
2. Grow New Market Segments and Off-peak Ridership
Marketing will target ridership growth in off-peak periods, which usually serve infrequent, recreational, and commercial customers, as well as targeting opportunities to grow passenger and walk-on ridership.
3. Maintain and Grow the Commuter Customer Base:
The marketing strategy will target the commuter customer segment to first slow recent decreases in commuter trips and eventually grow ridership in this important customer base.
Page 20 SR 19/ SR 20 Corridor Plan February 2011
4. Increase Customer Satisfaction:
WSF is in the customer service business and strives to provide excellent service at a value that allows customers to choose travel times that support and enhance their lifestyle. Marketing addresses this through operational improvements, modernization of services, and raising awareness about improvements in products and customer service.
In the 2007-2026 Highway System Plan Technical Update in Appendix M: Highway/Ferry Linked Solutions, both WSDOT and the City of Port Townsend agree the existing signal system at Kearney St. and the nearby five-leg intersection at Washington St. functions poorly. The SR 19/ SR 20 Corridor Plan identifies improvements in the vicinity of the Kearney St./SR 20 intersection.
The ferry dock improvements that are anticipated to be completed in the fall/winter of 2011 include the replacement of a floating dolphin in Slip 1 with a fixed pile dolphin (Port Townsend) and replacing wingwalls in the operating slip (Coupville).
2.1.2 Route Classifications
Route classifications play an important role in determining the design standards required for route improvements, and affect the funding mechanisms controlling the improvements that can take place on the highway. Table 2-2 summarizes the classification status of the Study Route. See Appendix A, Route Classifications, for more information about these classification systems and their relationship to funding and operations.
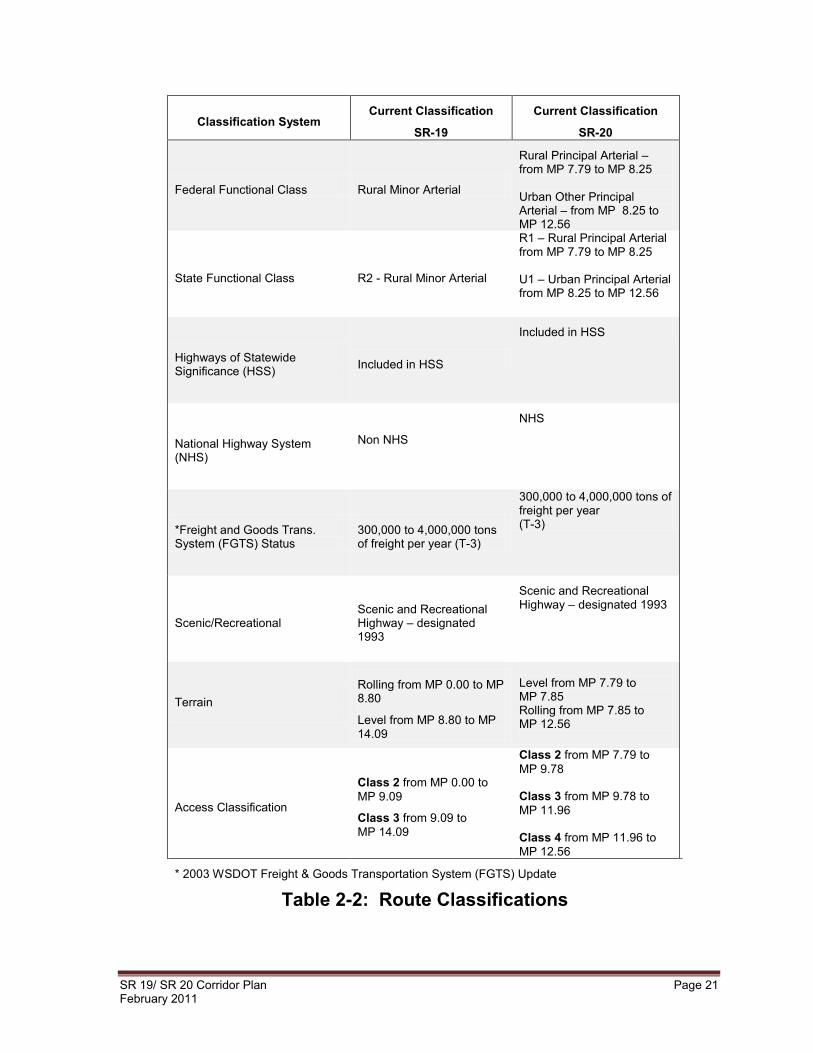
SR 19/ SR 20 Corridor Plan Page 21 February 2011
Classification System Current Classification
SR-19
Current Classification
SR-20
Federal Functional Class Rural Minor Arterial
Rural Principal Arterial – from MP 7.79 to MP 8.25 Urban Other Principal Arterial – from MP 8.25 to MP 12.56
State Functional Class R2 - Rural Minor Arterial
R1 – Rural Principal Arterial from MP 7.79 to MP 8.25 U1 – Urban Principal Arterial from MP 8.25 to MP 12.56
Highways of Statewide Significance (HSS) Included in HSS
Included in HSS
National Highway System (NHS)
Non NHS
NHS
*Freight and Goods Trans. System (FGTS) Status
300,000 to 4,000,000 tons of freight per year (T-3)
300,000 to 4,000,000 tons of freight per year (T-3)
Scenic/Recreational Scenic and Recreational Highway – designated 1993
Scenic and Recreational Highway – designated 1993
Terrain
Rolling from MP 0.00 to MP 8.80
Level from MP 8.80 to MP 14.09
Level from MP 7.79 to MP 7.85 Rolling from MP 7.85 to MP 12.56
Access Classification
Class 2 from MP 0.00 to MP 9.09
Class 3 from 9.09 to MP 14.09
Class 2 from MP 7.79 to MP 9.78 Class 3 from MP 9.78 to MP 11.96 Class 4 from MP 11.96 to MP 12.56
* 2003 WSDOT Freight & Goods Transportation System (FGTS) Update
Table 2-2: Route Classifications
Page 22 SR 19/ SR 20 Corridor Plan February 2011
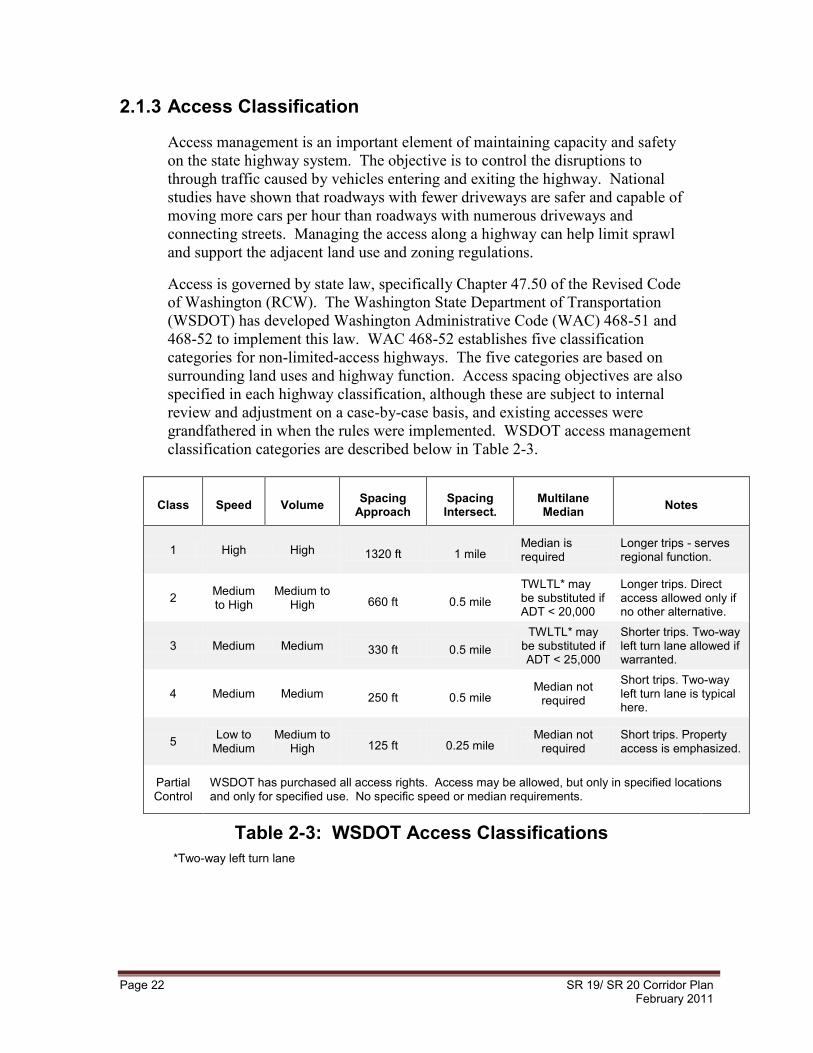
2.1.3 Access Classification
Access management is an important element of maintaining capacity and safety on the state highway system. The objective is to control the disruptions to through traffic caused by vehicles entering and exiting the highway. National studies have shown that roadways with fewer driveways are safer and capable of moving more cars per hour than roadways with numerous driveways and connecting streets. Managing the access along a highway can help limit sprawl and support the adjacent land use and zoning regulations.
Access is governed by state law, specifically Chapter 47.50 of the Revised Code of Washington (RCW). The Washington State Department of Transportation (WSDOT) has developed Washington Administrative Code (WAC) 468-51 and 468-52 to implement this law. WAC 468-52 establishes five classification categories for non-limited-access highways. The five categories are based on surrounding land uses and highway function. Access spacing objectives are also specified in each highway classification, although these are subject to internal review and adjustment on a case-by-case basis, and existing accesses were grandfathered in when the rules were implemented. WSDOT access management classification categories are described below in Table 2-3.
Class Speed Volume Spacing Approach
Spacing Intersect.
Multilane Median Notes
1 High High 1320 ft 1 mile Median is required
Longer trips - serves regional function.
2 Medium to High
Medium to High 660 ft 0.5 mile
TWLTL* may be substituted if ADT < 20,000
Longer trips. Direct access allowed only if no other alternative.
3 Medium Medium 330 ft 0.5 mile TWLTL* may
be substituted if ADT < 25,000
Shorter trips. Two-way left turn lane allowed if warranted.
4 Medium Medium 250 ft 0.5 mile Median not
required
Short trips. Two-way left turn lane is typical here.
5 Low to Medium
Medium to High 125 ft 0.25 mile
Median not required
Short trips. Property access is emphasized.
Partial Control
WSDOT has purchased all access rights. Access may be allowed, but only in specified locations and only for specified use. No specific speed or median requirements.
Table 2-3: WSDOT Access Classifications *Two-way left turn lane
SR 19/ SR 20 Corridor Plan Page 23 February 2011
There are two basic types of state highways with respect to access control. They are Limited Access Highways and Managed Access Highways. Limited Access Highways are highways in which the abutting property owner‟s right of access to the state highway has been purchased, with the result being that the abutting property owner may or may not have access to the state highway. Limited Access Highways are further defined as Full, Partial, or Modified limited access control.
Managed Access Highways are all of the remaining state highways that are not already limited access highways. Managed Access Highways are highways in which access is regulated by the governmental entity having jurisdiction over the facility. Managed Access Highways are further classified from Class 1, the most restrictive, to Class 5, the least restrictive. The WSDOT has access-permitting jurisdiction over all state highways outside incorporated towns and cities including Urban Growth Areas (UGA), while incorporated towns and cities have access-permitting jurisdiction for those Managed Access State Highways within their boundaries.
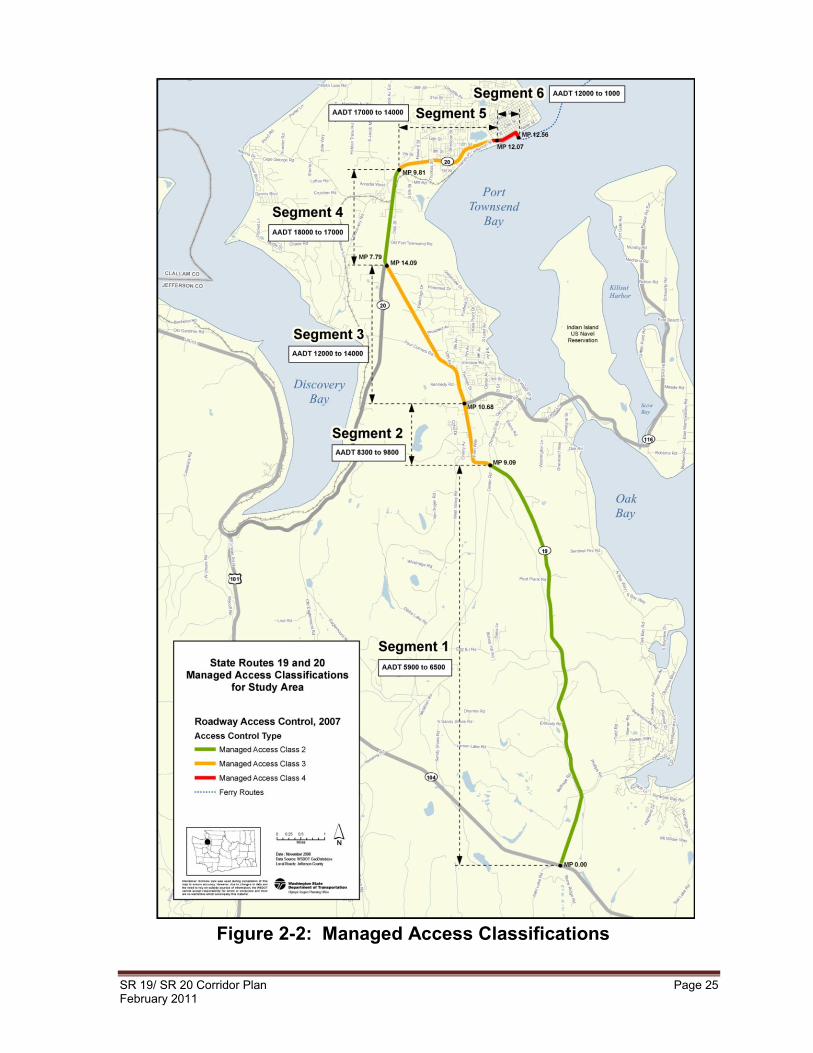
Both SR 19 and SR 20 are designated Managed Access Highways. WAC 468-52-070 provides for review and modification of access classifications. This study is not recommending any changes to the access classification on SR 19 and SR 20 within the study corridor.
SR 19 is considered a Class 2 access classification from SR 104 to Chimacum and a Class 3 from Chimacum to SR 20 (see Figure 2-2). This is consistent with Jefferson County‟s proposed land use designation of the Tri-Area UGA.
SR 20 is Class 2 from its intersection with SR 19 to the city limits (Discovery-Mill Road Vicinity); Class 3 from the city limits to Decatur St. Class 4 from Decatur to Washington Street and Class 4 from Washington Street to the Ferry Terminal. This is consistent with the intensity of the urban development in those areas.
The tables below and shown on the next page depict how the access classifications relate to the study segments.
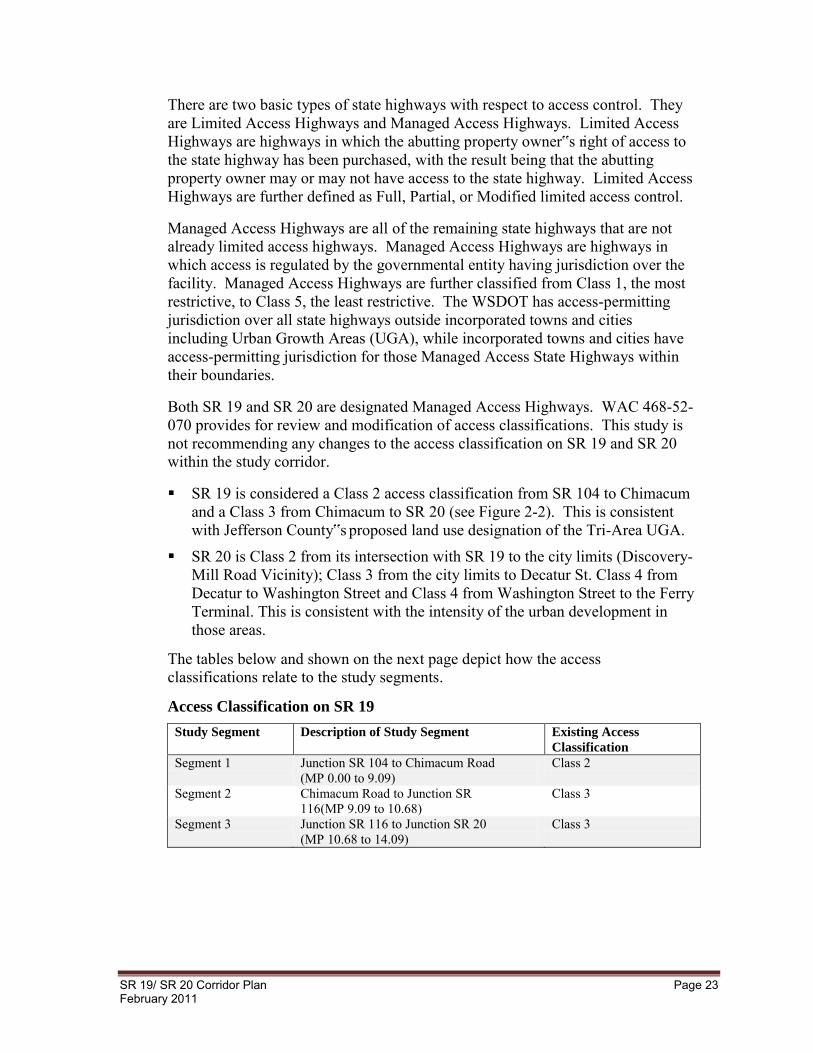
Access Classification on SR 19
Study Segment Description of Study Segment Existing Access
Classification
Segment 1 Junction SR 104 to Chimacum Road (MP 0.00 to 9.09)
Class 2
Segment 2 Chimacum Road to Junction SR 116(MP 9.09 to 10.68)
Class 3
Segment 3 Junction SR 116 to Junction SR 20 (MP 10.68 to 14.09)
Class 3
Page 24 SR 19/ SR 20 Corridor Plan February 2011
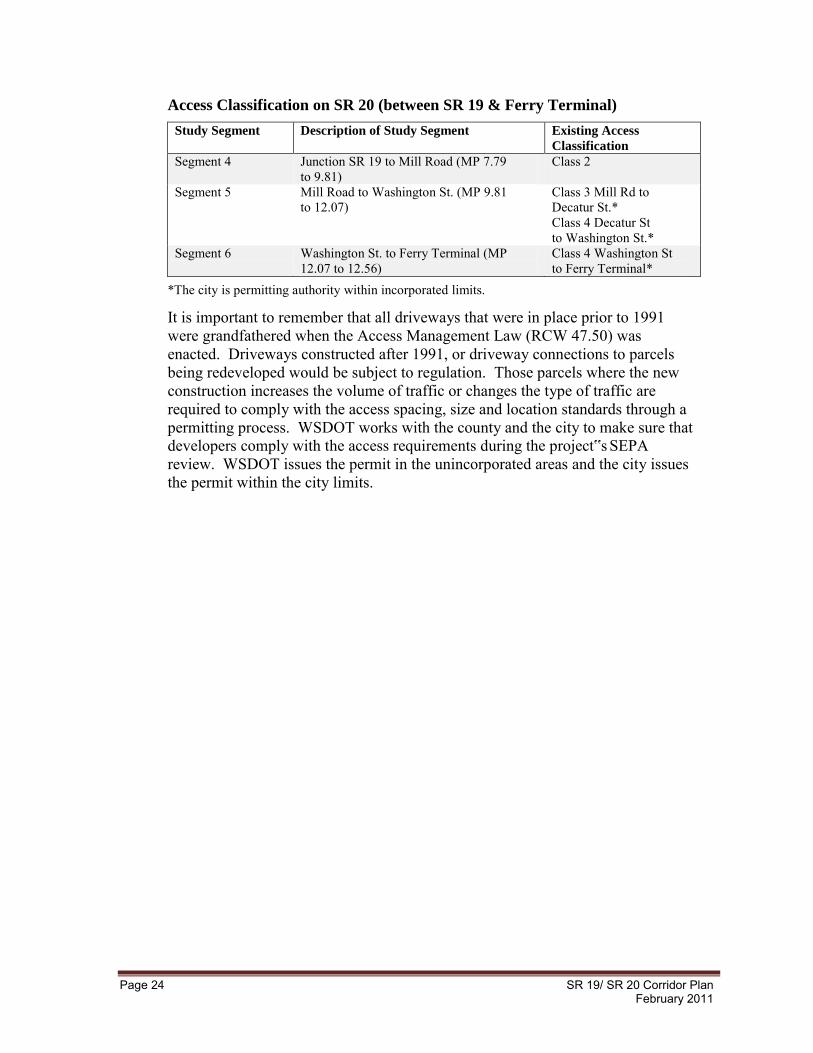
Access Classification on SR 20 (between SR 19 & Ferry Terminal)
Study Segment Description of Study Segment Existing Access
Classification
Segment 4 Junction SR 19 to Mill Road (MP 7.79 to 9.81)
Class 2
Segment 5 Mill Road to Washington St. (MP 9.81 to 12.07)
Class 3 Mill Rd to Decatur St.* Class 4 Decatur St to Washington St.*
Segment 6 Washington St. to Ferry Terminal (MP 12.07 to 12.56)
Class 4 Washington St to Ferry Terminal*
*The city is permitting authority within incorporated limits.
It is important to remember that all driveways that were in place prior to 1991 were grandfathered when the Access Management Law (RCW 47.50) was enacted. Driveways constructed after 1991, or driveway connections to parcels being redeveloped would be subject to regulation. Those parcels where the new construction increases the volume of traffic or changes the type of traffic are required to comply with the access spacing, size and location standards through a permitting process. WSDOT works with the county and the city to make sure that developers comply with the access requirements during the project‟s SEPA review. WSDOT issues the permit in the unincorporated areas and the city issues the permit within the city limits.
SR 19/ SR 20 Corridor Plan Page 25 February 2011
Figure 2-2: Managed Access Classifications
Page 26 SR 19/ SR 20 Corridor Plan February 2011
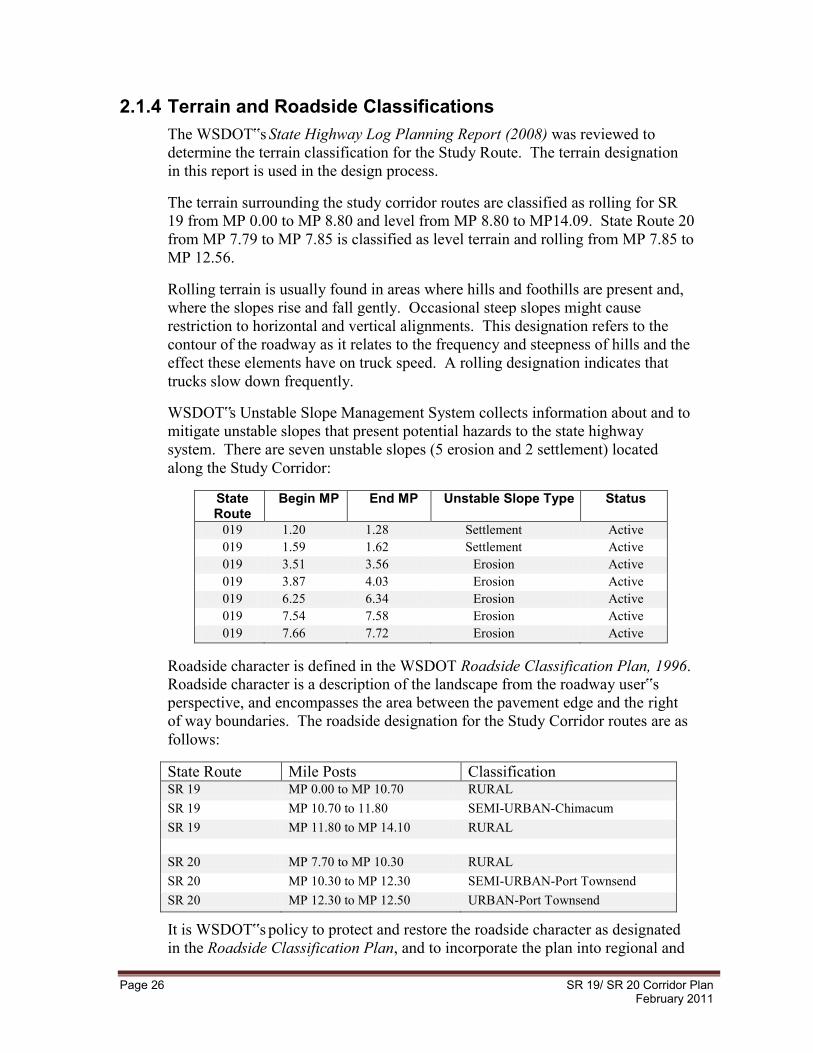
2.1.4 Terrain and Roadside Classifications The WSDOT‟s State Highway Log Planning Report (2008) was reviewed to determine the terrain classification for the Study Route. The terrain designation in this report is used in the design process.
The terrain surrounding the study corridor routes are classified as rolling for SR 19 from MP 0.00 to MP 8.80 and level from MP 8.80 to MP14.09. State Route 20 from MP 7.79 to MP 7.85 is classified as level terrain and rolling from MP 7.85 to MP 12.56.
Rolling terrain is usually found in areas where hills and foothills are present and, where the slopes rise and fall gently. Occasional steep slopes might cause restriction to horizontal and vertical alignments. This designation refers to the contour of the roadway as it relates to the frequency and steepness of hills and the effect these elements have on truck speed. A rolling designation indicates that trucks slow down frequently.
WSDOT‟s Unstable Slope Management System collects information about and to mitigate unstable slopes that present potential hazards to the state highway system. There are seven unstable slopes (5 erosion and 2 settlement) located along the Study Corridor:
State Route
Begin MP End MP Unstable Slope Type Status
019 1.20 1.28 Settlement Active 019 1.59 1.62 Settlement Active 019 3.51 3.56 Erosion Active 019 3.87 4.03 Erosion Active 019 6.25 6.34 Erosion Active 019 7.54 7.58 Erosion Active 019 7.66 7.72 Erosion Active
Roadside character is defined in the WSDOT Roadside Classification Plan, 1996. Roadside character is a description of the landscape from the roadway user‟s perspective, and encompasses the area between the pavement edge and the right of way boundaries. The roadside designation for the Study Corridor routes are as follows:
State Route Mile Posts Classification SR 19 MP 0.00 to MP 10.70 RURAL SR 19 MP 10.70 to 11.80 SEMI-URBAN-Chimacum SR 19 MP 11.80 to MP 14.10 RURAL SR 20 MP 7.70 to MP 10.30 RURAL SR 20 MP 10.30 to MP 12.30 SEMI-URBAN-Port Townsend SR 20 MP 12.30 to MP 12.50 URBAN-Port Townsend
It is WSDOT‟s policy to protect and restore the roadside character as designated in the Roadside Classification Plan, and to incorporate the plan into regional and
SR 19/ SR 20 Corridor Plan Page 27 February 2011
route specific planning. All improvement and safety projects that result in disturbance to the roadside require complete restoration to the requirements specified by the roadside classification within the project limits. The roadside restoration of proposed safety and improvement projects fall under Treatment Level 2, which is the basic level of treatment to restore the operational, environmental and visual functions of the roadside. The plan promotes aesthetic harmony and continuity, and advocates the use of native species.
Areas of work falling within wetlands or wetland buffer areas may require additional revegetation or habitat management plans as required by the critical areas ordinance of the local jurisdiction in which the work occurs. As specific impacts are calculated during the design phase of individual projects recommended by this study, the local agencies will be consulted regarding the degree and character of revegetation required in these areas.
2.2 Physical Characteristics The physical characteristics of a highway and the corridor it occupies can provide valuable insight into the types of transportation problems experienced on the route and to developing the best solutions to those problems. These characteristics relate not only to the roadway itself – geometry, roadway section, horizontal and vertical alignments – but also to the surrounding area considering such elements as right of way and environmental resources.
2.2.1 Geometric Elements It is important to understand roadway alignment, profile and section when determining how a route functions and how it might be improved. For this purpose, the latest information from the WSDOT Transportation Data Office (TDO) has been analyzed as part of this study. The most current information about roadway geometry can be obtained from the WSDOT‟s State Highway Log Planning Report (2008), as well as other TDO data sources. Other WSDOT records and resources, such as as-built highway plans, are also used in this analysis.
Existing Roadway Section The roadway section refers to the widths of the lanes and shoulders that make up the roadway. In general, the lanes and shoulders that make up the Study Corridor routes currently meet WSDOT standards for these elements, based on current traffic volumes. Details about roadway section, including types of materials used in the construction of the roadways and shoulders, and existing channelization can be found in Appendix B.
Existing Vertical/Horizontal Alignment Roadway grades on the Study Corridor routes range between 0% and 6% (near SR 20/Sheridan). Additional information can be found in Appendix B, Physical Characteristics.

Page 28 SR 19/ SR 20 Corridor Plan February 2011
2.2.2 Passing Lanes There are no passing lanes on the Study Corridor routes. However, passing zones do exist, and their locations are documented in Appendix B, Table B-1: Passing Zone Locations, beginning on Page 113.
2.2.3 Bridges and Structures There are two bridges along the study corridor. One is the Chimacum Creek Bridge located 9.4 miles north of Jct. 104 on SR 19 (MP 9.37) intersecting Chimacum Creek and consisting of a Concrete Arch (bridge number 19/5). The other is the Old CMSTP& P RR bridge located 1.25 miles east of Jct. SR 19 on SR 20 (MP 9.16 to MP 9.20) over a non-motorized trail and consisting of a concrete slab (bridge number 20/15).
Looking West: SR 19/Chimacum Creek Bridge Looking North: SR 20/Old CMSTP& P RR bridge
See Table 2-4 for bridge locations. It may be noted that neither structure adequately accommodates bicyclists or pedestrians.
The following bridge information is based on WSDOT‟s Highway Road Log and the WSDOT Bridge Office:
Table 2-4: Bridge Locations
State Route
Milepost Stream/Feature Name Nearest Cross Street Sufficiency Ratinga
19 9.37 to 9.38 E Chimacum Creek (Bridge) West Valley Road 55.08 20 9.16 to 9.20 Old CMSTP&PRR (Bridge) Frederick Street 65.51
a - If the value in this column is < 50, the structure needs repair or replacement.
SR 19/ SR 20 Corridor Plan Page 29 February 2011
2.2.4 Intersection Controls There are currently five traffic signals along the study corridor routes. These are at SR 19/SR 20 junction, SR 20/Discovery-Mill, SR 20/Haines Pl, SR 20/ Kearney, and SR 20/Water St. The City of Port Townsend recently installed two single-lane roundabouts at SR 20/Howard St. and SR 20/Thomas St. There are two stop controlled locations on the corridor mainline, one at the intersection of SR 104 and another at Chimacum Road. Several intersections have been upgraded over time to include refuge areas for turning vehicles. These upgrades typically provide an increase in safety, and some reduction in vehicle delay. Locations of traffic signals and channelization/refuge areas are in Appendix B, Physical Characteristics.
2.2.5 Right of Way Existing right of way widths vary along the study corridor routes, from 55 feet to over 520 feet. The area of the Study Corridor with the greatest width of right of way is along SR 19 in the vicinity of SR 104/SR 19. The right of way width is an important consideration when contemplating improvements that require additional space. Right of way purchase can be a significant cost item. More details about right of way widths and specific locations are given in Appendix B, Physical Characteristics.
2.2.6 Environmental Resources Environmental elements described in this corridor plan consist of general information collected to identify and document potential issues as part of the transportation study process. Specific impacts to environmental elements would be determined, and associated permits obtained, when a project has been funded for design and construction.
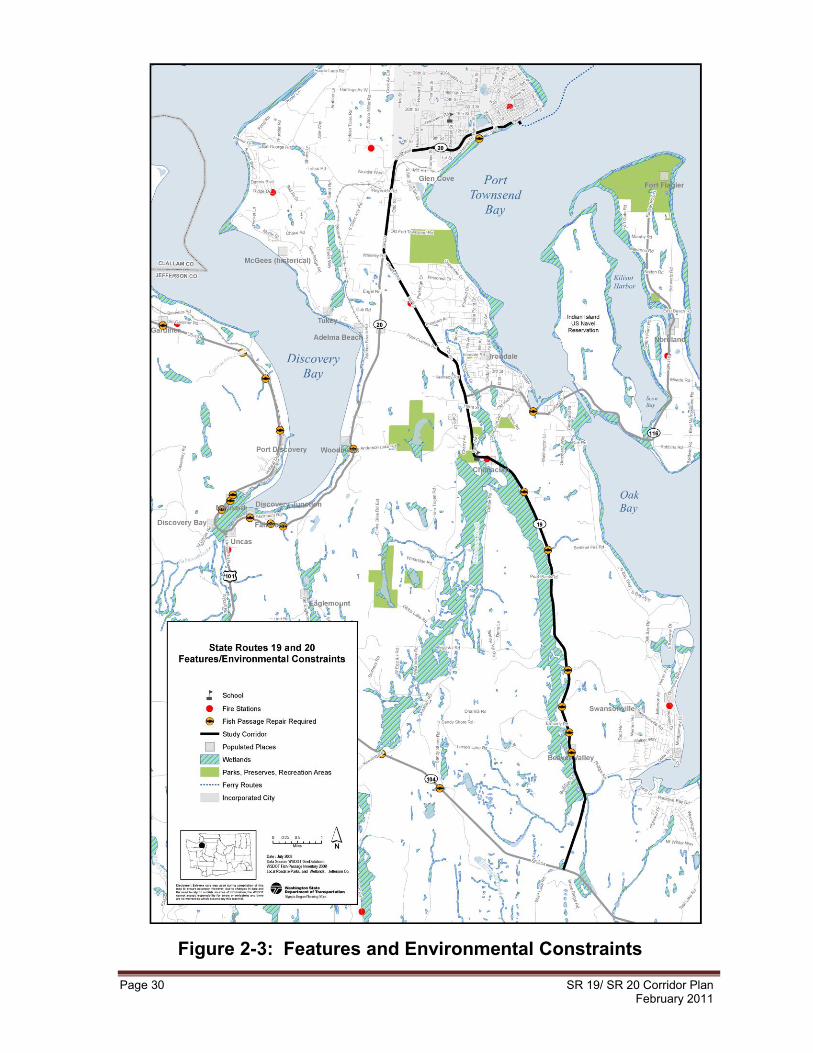
Wetlands Jefferson County Wetland Inventory- a composite of Department of Natural Resources (DNR), National Wetlands Inventory (NWI), etc. was used to determine if wetlands exist in the vicinity of proposed construction (Figure 2-3).
Wetlands flank much of the western side of SR 19 from Oak Bay Road to Chimacum-Center Rd. There are also areas of wetlands east of SR 19 and north of Chimacum-Center Rd. Kah-Tai Lagoon west of SR 20 in Port Townsend may also be considered a wetland. As individual projects are developed from the study recommendations, wetland delineation should be completed to determine the full extent of recorded wetlands. The area should also be examined to identify other wetlands that may not have been included on the maps. Wetlands should be avoided if possible when designing roadway improvements. If construction impacts are unavoidable, they should be minimized to the degree practicable, and any unavoidable impacts mitigated according to WSDOT‟s “no net loss” policy regarding wetland functions and values. Wetland filling along the study segment is regulated by Jefferson County, the US Army Corps of Engineers, and the Washington State Department of Ecology through Section 401 of the Clean Water Act.
Page 30 SR 19/ SR 20 Corridor Plan February 2011
Figure 2-3: Features and Environmental Constraints
SR 19/ SR 20 Corridor Plan Page 31 February 2011
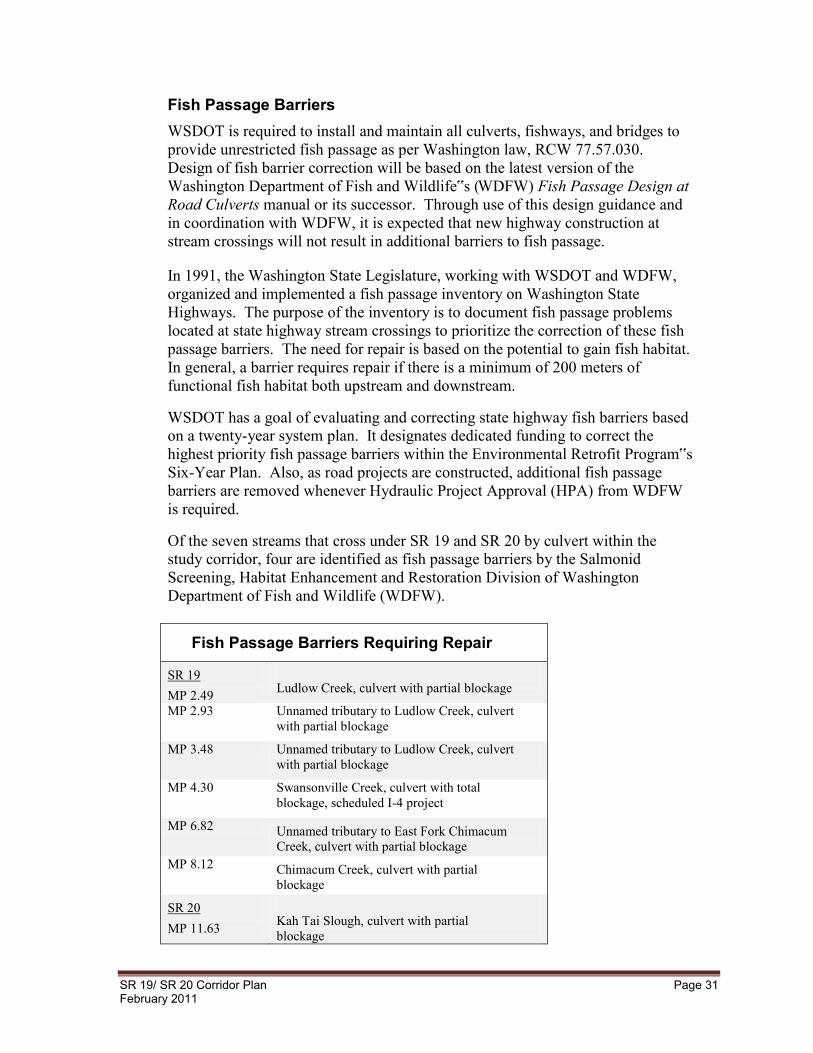
Fish Passage Barriers WSDOT is required to install and maintain all culverts, fishways, and bridges to provide unrestricted fish passage as per Washington law, RCW 77.57.030. Design of fish barrier correction will be based on the latest version of the Washington Department of Fish and Wildlife‟s (WDFW) Fish Passage Design at Road Culverts manual or its successor. Through use of this design guidance and in coordination with WDFW, it is expected that new highway construction at stream crossings will not result in additional barriers to fish passage.
In 1991, the Washington State Legislature, working with WSDOT and WDFW, organized and implemented a fish passage inventory on Washington State Highways. The purpose of the inventory is to document fish passage problems located at state highway stream crossings to prioritize the correction of these fish passage barriers. The need for repair is based on the potential to gain fish habitat. In general, a barrier requires repair if there is a minimum of 200 meters of functional fish habitat both upstream and downstream.
WSDOT has a goal of evaluating and correcting state highway fish barriers based on a twenty-year system plan. It designates dedicated funding to correct the highest priority fish passage barriers within the Environmental Retrofit Program‟s Six-Year Plan. Also, as road projects are constructed, additional fish passage barriers are removed whenever Hydraulic Project Approval (HPA) from WDFW is required.
Of the seven streams that cross under SR 19 and SR 20 by culvert within the study corridor, four are identified as fish passage barriers by the Salmonid Screening, Habitat Enhancement and Restoration Division of Washington Department of Fish and Wildlife (WDFW).
Fish Passage Barriers Requiring Repair
SR 19 MP 2.49
Ludlow Creek, culvert with partial blockage
MP 2.93 Unnamed tributary to Ludlow Creek, culvert with partial blockage
MP 3.48 Unnamed tributary to Ludlow Creek, culvert with partial blockage
MP 4.30 Swansonville Creek, culvert with total blockage, scheduled I-4 project
MP 6.82 Unnamed tributary to East Fork Chimacum Creek, culvert with partial blockage
MP 8.12 Chimacum Creek, culvert with partial blockage
SR 20 MP 11.63
Kah Tai Slough, culvert with partial blockage

Page 32 SR 19/ SR 20 Corridor Plan February 2011
Historical and Cultural Resources The Washington Heritage Register and the National Register of Historic Places were researched to identify important historical properties along the Study Corridor.
Chimacum Post Office built circa 1899 is also on the National Historic Register and is located in southeast quadrant of the Chimacum-Center Road intersection. It features a vernacular style. House and office of Senator William Bishop built circa 1900 is on the National Register of Historic Buildings. It is also known as the Brown House in the vicinity of Chimacum-Center Road. It features Colonial-Colonial Revival architecture.
During the design phase of projects recommended by this plan, a cultural resources survey should be conducted in the area of potential effect.
A cultural resources survey may include a literature search to determine if previously documented sites or resources exist in the vicinity, as well as a ground survey to determine the potential for encountering artifacts of an historic or archaeological nature during construction. Consultation will be initiated with the Port Gamble S‟Klallam, Jamestown S‟Klallam, Suquamish and Lower Elwha Tribes, upon whose usual and accustomed areas construction would take place, when projects recommended by this corridor plan are funded and design begins. These Tribes should be invited to participate in identifying resources of importance to them. Results of the survey, and the determination of effects of the construction projects, should be presented for the State Historic Preservation Officer‟s concurrence.
During the course of this corridor study City of Port Townsend and Jefferson County were consulted regarding historic or cultural sites. Port Townsend Historic District is on the northern side of SR 20 within City of Port Townsend although it is outside of the right of way of SR 20. The Department of Archeological and Historic Preservation (DAHP) was also consulted.
DAHP staff suggested that they would not expect to find any significant issues or major archeological sites that would impact the proposed solutions on the route. Staff further stated that if projects do develop from the plan and federal money is used, a Section 106 review would be required. Also if state funds are used, a 0505 Executive Order level review would also be required.
The four Tribes mentioned above were sent a preliminary list of recommendations for their review and comment. Port Gamble S‟Klallam and Jamestown S‟Klallam, who were part of the Corridor Working Group membership, were offered by e-mail, interviews to discuss any possible comments or concerns.
SR 19/Chimacum-Center Rd.
N
SR 19/ SR 20 Corridor Plan Page 33 February 2011
Lower Elwha Tribe responded by letter expressing an interest in consultation during the time of project design and implementation.
Environmental Justice Environmental justice refers to the adverse effect of transportation projects on social, economic and health status of minority and low-income populations in a community. One of the goals of WSDOT is to avoid, minimize or mitigate any disproportionate impact to these populations resulting from WSDOT activities in the area. To accomplish this, full and fair participation of potentially affected communities is sought throughout the transportation decision-making process. In preparation for the public involvement phase of this study, information about potential environmental justice communities was gathered using the 2005-2009 American Community Survey 5-Year Estimates for Jefferson County and the Office of Superintendent of Public Instruction‟s Washington State Report Card.
The census data indicated that Jefferson County has a total population of 29,000 and the median age of the population is 52 years old. Twenty-three percent of the population is 65 years and older. The data also indicated that Jefferson County reported that ninety-two percent of the population is White; 1 percent is African American; 2 percent is American Indian or an Alaska Native; 1 percent is Asian; and less than one percent of the population indicated Native Hawaiian or Other Pacific Islander.
Three percent of Jefferson County‟s population indicated that they are Hispanic. Jefferson County staff also reported that there was a group of non-English speaking Hispanic population living within the project area. To accommodate the possibility of having non-English speaking individuals attend the meetings and open houses, a Spanish speaking interpreter was available at each of the events.
In addition, for those individuals who wanted to attend the meetings and open houses but didn‟t have transportation, free public bus service was offered courtesy of Jefferson Transit. Middle schools located within the project area reported that between 40-47% of their student body qualified for the Federal free or reduced price meals program.
Noise Noise was not a major problem for the residents although a few mentioned concerns about noise from large trucks on SR 19.
Federal aid projects that construct a highway at a new location, or projects that significantly change the horizontal or vertical alignment of an existing highway or increase the number of through traffic lanes, require evaluation as to whether it is reasonable and feasible to provide mitigation for noise impacts. The long term recommendation of this study includes additional general purpose lanes on SR 19 north of SR 116 and on SR 20 from SR 19 to Washington Street or reducing demand through development of parallel corridors.
Page 34 SR 19/ SR 20 Corridor Plan February 2011
During the design phase, this project should be evaluated for potential noise impacts and modeled to predict traffic noise levels if necessary. Although the federal government participates in the majority of costs associated with noise barriers along interstate highways, those that are constructed along rural state routes like SR 19 are paid for entirely by the state. WSDOT has a cost-benefit criterion, which is applied to determine if a noise barrier is reasonable and feasible.
Air Quality WSDOT‟s GIS layer for air quality, information provided by Washington Department of Ecology, was consulted to determine if there are air quality issues in the vicinity of the study corridor. The study corridor routes are not located in particulate, ozone or carbon monoxide non-attainment areas or maintenance area. Currently the air quality meets state and federal standards.
Climate Change
WSDOT is exploring more sustainable ways to plan, build, operate and maintain the state's transportation infrastructure. This reflects the Agency's commitment to build a more sustainable transportation system and lessen the transportation sector's effect on the environment.
WSDOT is pursuing multiple strategies to reduce greenhouse gas emissions from the transportation sector. These include:
Increasing travel options to reduce vehicle miles traveled per capita. Supporting improved vehicle technology. Lowering the carbon content of fuels. Improving the efficiency of the transportation system.
In response to the Governor‟s Executive Order 09-05: Washington‟s Leadership on Climate Change, WSDOT; in consultation with the Departments of Ecology and Commerce; and in collaboration with local governments, business, and environmental representatives; is working to estimate current and future state-wide levels of vehicle miles traveled, evaluate potential changes to the vehicle miles traveled benchmarks established in RCW 47.01.440 as appropriate to address low- or no-emission vehicles, and develop additional strategies to reduce emissions from the transportation sector. Findings and recommendations from this work were reported to the Governor in December 2010.
Hazardous Materials The Hazardous Sites List, toxics cleanup program, and the Leaking Underground Storage Tank databases maintained by Washington Department of Ecology were used to determine if there is known potential for encountering hazardous materials during the construction of the proposed improvements to the Study Route. The Hazardous Sites List contains Chevron Bulk Plant #1323 in Port Townsend. This is located north of Water St. (SR 20) and the ferry terminal. The location of two
SR 19/ SR 20 Corridor Plan Page 35 February 2011
to three more sites could not be ascertained whether they were on the study corridor, while several others were clearly outside of the study corridor.
The Leaking Underground Storage Tank database lists three properties on the Study Corridor routes. They are Dis N Dat Store on Sims Way (SR 20), Jefferson Transit Authority on Sims Way, and Hilltop Texaco also on Sims Way.
Dis N Dat Store 3059 Sims Way Pt Townsend, WA 98368 Site ID 11293
Hilltop Texaco 1531 West Sims Way Pt Townsend, WA 98368 Site ID 4928
Jefferson Transit Authority Port Townsend Transit 1615 Sims Way Pt Townsend, WA 98368 Site ID 3082
During the design phase of specific projects, these databases should be reviewed for updated information, and site assessments performed if warranted.
Aquifer The Study Corridor is not located in a Sole Source Aquifer or an area identified by the Jefferson County Critical Areas Ordinance as an Aquifer Recharge Area of Concern. Standard WSDOT water quality/water quantity treatment practices should be adequate. In Jefferson County, stormwater infiltration best management practices are encouraged to the maximum extent possible as the first priority in stormwater management. There are two impaired and threatened watercourses near SR 19 MP 8, MP 82 and MP 9.36 which are Water Quality Assessment for Impaired Waters (303d) candidates.
2.2.7 Environmental Mitigation Locating suitable mitigation sites is a high priority for projects that will displace existing wetlands or increase the impervious area represented by the highway. It is generally undesirable to construct mitigation for wetland impacts within highway right of way. Many highway activities, such as guardrail installation, slope flattening, excavation or fill that alters the water table or flow to a wetland, and noise and air impacts on wetland wildlife, could adversely affect an adjacent mitigation site.
During the design phase of a project, engineering staff should work closely with the staff of the Olympic Region Environmental Services office to determine the extent of unavoidable wetland impacts and to locate an appropriate mitigation site.
Mitigation, for increased stormwater runoff resulting from the addition of impervious surfacing, such as construction of swales and ponds, can often take place within highway right of way if sufficient area exists. If an alternative alignment is utilized, the potential exists to use the old alignment location to
Page 36 SR 19/ SR 20 Corridor Plan February 2011
construct stormwater treatment facilities. The appropriate level of stormwater treatment can be determined using the WSDOT Highway Runoff Manual.
The cost of the construction of wetland mitigation sites and stormwater treatment facilities can be considerable, and should be considered when estimating overall project construction costs.
2.3 Commercial Services WSDOT maintains partnerships with commercial transportation and communication services that have long-term investments and related investments in how state routes develop over time. Their input is essential in the ongoing effort to ensure excellent comprehensive service to the communities along the corridor routes.
2.3.1 Transit The Study Corridor routes are within the current Jefferson Transit service area. Jefferson Transit provides bus service throughout eastern Jefferson County from Port Townsend south to Port Hadlock, Port Ludlow, Quilcene, and Brinnon, west to Sequim, and across the Hood Canal Bridge to Poulsbo. Jefferson Transit also provides Paratransit Services and other programs to commuters and major employers.
There are two existing official park and ride lots on the study corridor. A county owned Park and Ride lot is on SR 19 at MP 0.08 to MP 0.10 with approximately 40 unmarked parking spaces. This lot includes dual use as the Olympic Peninsula Gateway Visitor Center and Museum. A Jefferson Transit owned Park & Ride lot and Transit Center is located on Haines Place near SR 20 (MP 11.51) with 267 parking spaces. While not considered an official Park and Ride lot, the project team did note frequent collections of what suggests commuter carpool parking in the Chimacum Four Corners area and the SR 19 and Oak Bay Road intersection.
2.3.2 Utilities Approximately forty unique franchise agreements have been identified along the Study Corridor, involving as many as nine separate companies. A table of franchises is found in Appendix C, Utility Locations. Current listings are maintained at the WSDOT Olympic Region Utilities Office.
2.4 Land Use Characteristics State Route 19 is bordered by Commercial and Rural Forested land, Prime and Local Agricultural land, Rural Residential land, a Convenience Crossroads, and a Rural Village Center. State Route 20 is bordered by General Crossroads, Rural Residential land, Light Industrial/Commercial land, Industrial land, and is within the Port Townsend Urban Growth Area.
SR 19/ SR 20 Corridor Plan Page 37 February 2011
SR 19 and SR 20 travel though the traditional areas of interest (usual and accustomed areas) for the Lower Elwha Tribe and a portion of SR 19 in Suquamish Tribe area. East Jefferson County is a traditional area of interest (usual and accustomed area) for the Non-Federally recognized Snohomish Tribe whose office is located in Port Hadlock.
The Jefferson County International Airport is located off SR 19 at MP 12.95, left. Port Townsend is a major tourist destination and is served by a WSDOT ferry that runs between Port Townsend and Coupeville. Port Townsend is the county seat of Jefferson County.
The Washington State Growth Management Act (RCW 36.60A) is in effect in Jefferson County. It stipulates 14 goals that will serve as the guiding principles for planning land use. The comprehensive plan is a tool used to help communities resolve how to balance the competing interests represented by these goals. Jefferson County is guided by its comprehensive plan, which was adopted in 1998 and was amended in 2004. See Chapter 3 for more information about the comprehensive plan and how the results of the SR 19/SR 20 Corridor Plan support the goals of that plan.
2.5 Operating Conditions Determining the operating conditions for purposes of a corridor plan requires reasonable estimates of current and future traffic volumes. Growth rates were calculated from the Jefferson County travel demand forecasting model. The traffic data are applied to procedures described in the Highway Capacity Manual (HCM) (Transportation Research Board, 2000). These procedures analyze congestion based on the expected traffic volumes, as well as the relevant, physical characteristics of the facility. The HCM approach provides independent analyses for highway segments and intersections. Results are stated in terms of level of service (LOS) measurements (see section 2.5.4 and section 2.5.5).
2.5.1 Traffic Volume Estimates Traffic Data Collection and Analysis
In January 2008, PM period traffic counts were taken at various locations along SR 19 and SR 20 by the Transpo Group, a consulting firm working for Jefferson County. These counts were supplemented with WSDOT signal counts taken in March, April, and May of 2008. Other WSDOT traffic volume counts taken within the past three years were also used to compile data and information regarding vehicle traffic demand.
The Highway Capacity Manual (HCM 2000) and associated software were utilized to analyze the 30th highest design hour for mainline highway segments and intersections (unsignalized and signalized). Existing and projected future level-of-service ratings were computed using growth rates from Jefferson County‟s Draft Quimper Peninsula travel demand forecast model. Individual intersection growth factors applied to each approach leg were factored from Year
Page 38 SR 19/ SR 20 Corridor Plan February 2011
2007 PM design hour volumes (mainline) to approximate Year 2031 design hour volumes by Olympic Region Planning.
See Appendix D, Traffic Analysis, for more information.
Design hourly volumes (DHV) are computed by taking the annual average daily traffic times a factor known as the K30 hourly volume factor. The K30 factor is a percentage of annual average daily traffic used to calculate a 1-hour design peak volume (a peak hour percentage). The K30 hour volume percentage which WSDOT uses for design is based upon the book entitled “A Policy on Geometric Design of Highways and Streets” published by the American Association of State Highway and Transportation Officials. The policy conclusion from this “Green Book” is that the hourly traffic used in design should typically be the 30th highest hourly volume of the year (Hence the term K30 HV). Ideally, K30 hour volume source data should be from a permanent traffic recorder located within corridor study limits.
For the SR 19 and SR 20 Corridor mainline design hour volumes the K30 hourly volume percentage is based upon the permanent recorder located immediately west of the Hood Canal Bridge on SR 104 (2007 K30 HV percentage). This source of K30 HV percentage was selected for existing year and future year design analysis after reviewing other nearby permanent recorders (Discovery Bay near US 101/SR 20 and SR 20 in Island County), reviewing 2007 Average Design Hour Factors as a percent of the Annual Average Daily Traffic (AADT), and percentages on other statewide routes with similar annual average daily traffic volumes. The K30 HV percentage was 10.84% for that recorder with a directional (D) factor of 56.57% in year 2007.
Daily Traffic The AADT estimates for existing (2007/2008) conditions are based on the routine traffic counts taken by the WSDOT Transportation Data Office (WSDOT Annual Traffic Report, 2007). The AADT estimates for the forecast year (2031) are based on calibrated values derived from the Jefferson County‟s Quimper Peninsula Travel Demand Model.
Peak Hour Traffic Actual counts were used to provide an indication of the existing average traffic conditions. Forecast AADT estimates were converted to the DHV values required for traffic analysis and roadway design purposes. The forecast DHV values are based on AADT and k30 estimates and derived from the WSDOT Peak Hour Report (WSDOT Transportation Data Office, 2007).
2.5.2 Present and Future Traffic Conditions Highway capacity segment analysis and intersection analysis were performed to determine design level of service PM peak for existing and future no build traffic conditions (Figure 2-5.1 and Figure 2-5.2).
SR 19/ SR 20 Corridor Plan Page 39 February 2011
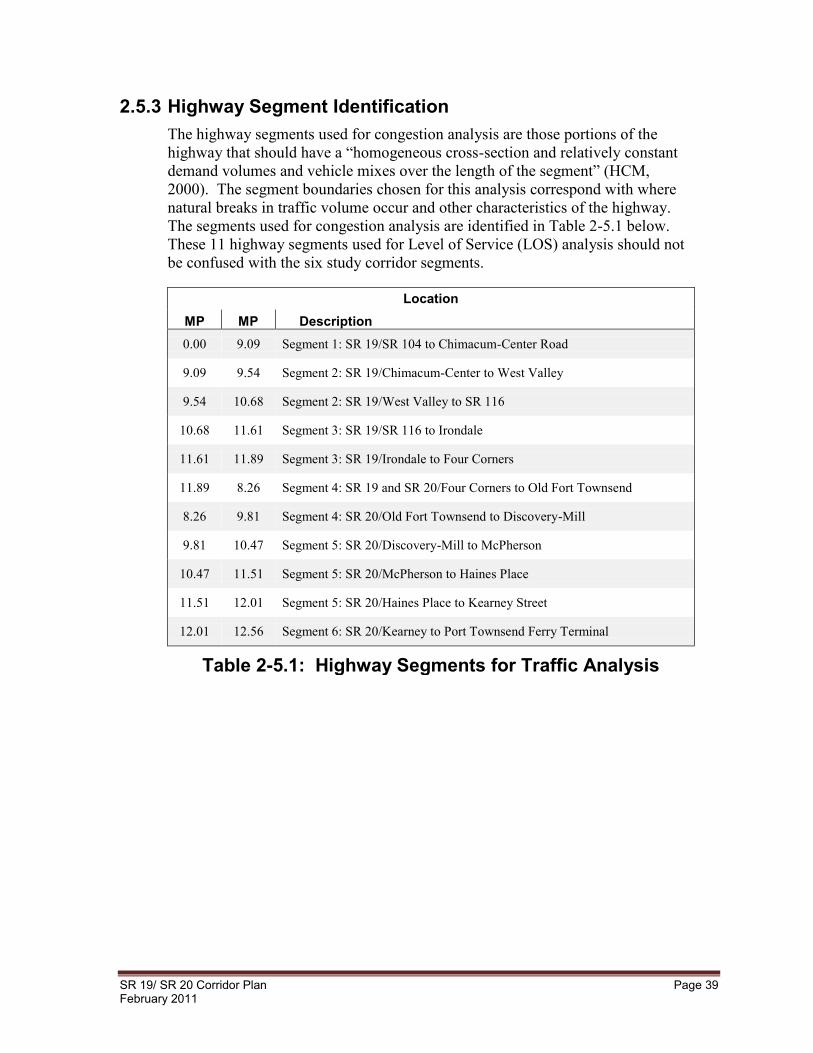
2.5.3 Highway Segment Identification The highway segments used for congestion analysis are those portions of the highway that should have a “homogeneous cross-section and relatively constant demand volumes and vehicle mixes over the length of the segment” (HCM, 2000). The segment boundaries chosen for this analysis correspond with where natural breaks in traffic volume occur and other characteristics of the highway. The segments used for congestion analysis are identified in Table 2-5.1 below. These 11 highway segments used for Level of Service (LOS) analysis should not be confused with the six study corridor segments.
Location MP MP Description 0.00 9.09 Segment 1: SR 19/SR 104 to Chimacum-Center Road
9.09 9.54 Segment 2: SR 19/Chimacum-Center to West Valley
9.54 10.68 Segment 2: SR 19/West Valley to SR 116
10.68 11.61 Segment 3: SR 19/SR 116 to Irondale
11.61 11.89 Segment 3: SR 19/Irondale to Four Corners
11.89 8.26 Segment 4: SR 19 and SR 20/Four Corners to Old Fort Townsend
8.26 9.81 Segment 4: SR 20/Old Fort Townsend to Discovery-Mill
9.81 10.47 Segment 5: SR 20/Discovery-Mill to McPherson
10.47 11.51 Segment 5: SR 20/McPherson to Haines Place
11.51 12.01 Segment 5: SR 20/Haines Place to Kearney Street
12.01 12.56 Segment 6: SR 20/Kearney to Port Townsend Ferry Terminal
Table 2-5.1: Highway Segments for Traffic Analysis
Page 40 SR 19/ SR 20 Corridor Plan February 2011
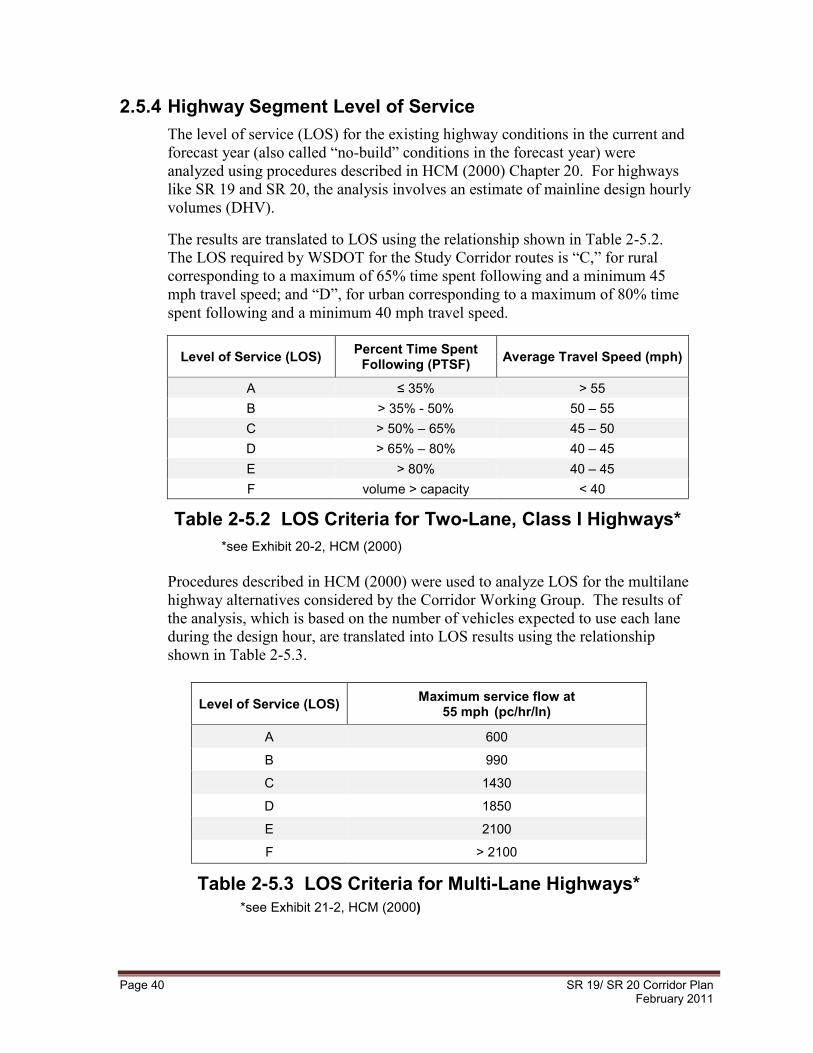
2.5.4 Highway Segment Level of Service The level of service (LOS) for the existing highway conditions in the current and forecast year (also called “no-build” conditions in the forecast year) were analyzed using procedures described in HCM (2000) Chapter 20. For highways like SR 19 and SR 20, the analysis involves an estimate of mainline design hourly volumes (DHV).
The results are translated to LOS using the relationship shown in Table 2-5.2. The LOS required by WSDOT for the Study Corridor routes is “C,” for rural corresponding to a maximum of 65% time spent following and a minimum 45 mph travel speed; and “D”, for urban corresponding to a maximum of 80% time spent following and a minimum 40 mph travel speed.
Level of Service (LOS) Percent Time Spent Following (PTSF) Average Travel Speed (mph)
A ≤ 35% > 55 B > 35% - 50% 50 – 55 C > 50% – 65% 45 – 50 D > 65% – 80% 40 – 45 E > 80% 40 – 45 F volume > capacity < 40
Table 2-5.2 LOS Criteria for Two-Lane, Class I Highways* *see Exhibit 20-2, HCM (2000)
Procedures described in HCM (2000) were used to analyze LOS for the multilane highway alternatives considered by the Corridor Working Group. The results of the analysis, which is based on the number of vehicles expected to use each lane during the design hour, are translated into LOS results using the relationship shown in Table 2-5.3.
Level of Service (LOS) Maximum service flow at 55 mph (pc/hr/ln)
A 600
B 990
C 1430
D 1850
E 2100
F > 2100
Table 2-5.3 LOS Criteria for Multi-Lane Highways* *see Exhibit 21-2, HCM (2000)

SR 19/ SR 20 Corridor Plan Page 41 February 2011
2.5.5 Intersection Level of Service Traffic at selected intersections along the Study Corridor was analyzed using Synchro, a commercially available software package that analyzes the characteristics of traffic flow in intersections, using procedures described in HCM (2000). This analysis provides information about average vehicle delay expected at an intersection, as well as information about specific delays associated with particular vehicle movements. The average and specific movement delay estimates obtained are compared to standards published in HCM (2000) to determine the LOS condition (see Table 2-5.4).
Level of Service (LOS) Average Control Delay (s/veh) Signalized Unsignalized
A ≤ 10 ≤ 10 B > 10 – 55 > 10 – 15 C > 20 – 70 > 15 – 25 D > 35 – 85 > 25 – 35 E > 55 – 80 > 35 – 50 F > 80 > 50
Table 2-5.4: LOS Criteria for Intersections *see Exhibit 16-2 and 17-2, HCM (2000)
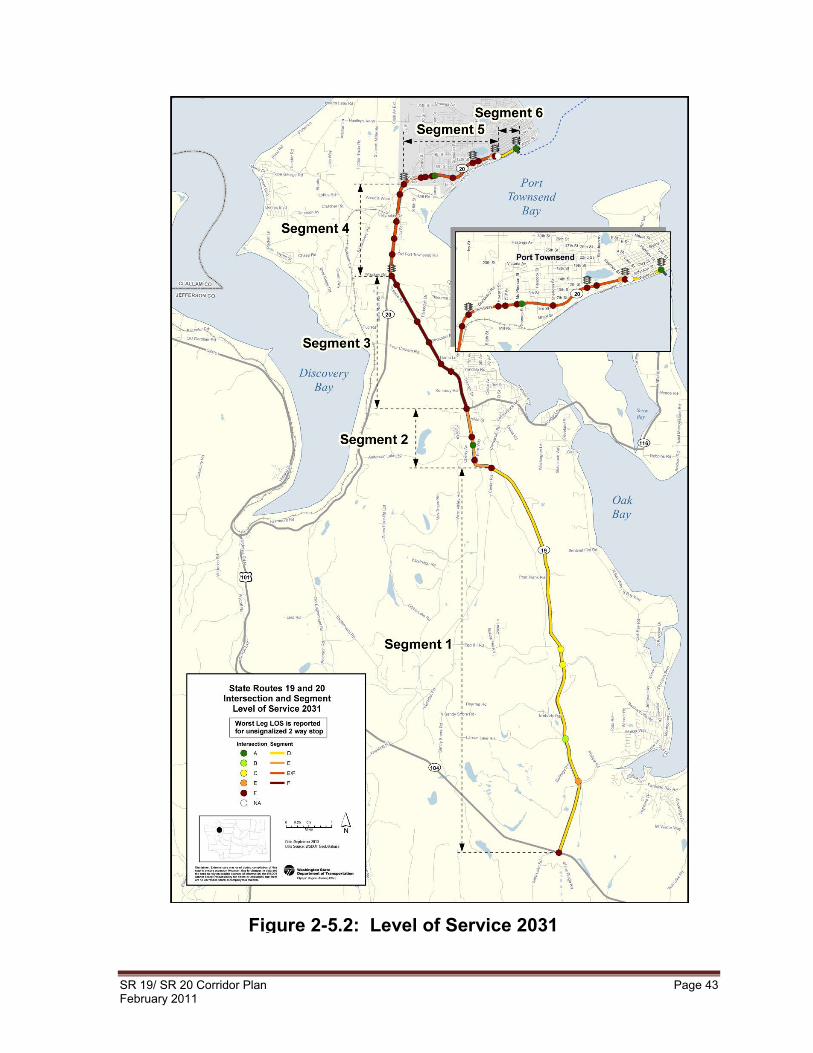
LOS results for both highway segments and intersections for the year 2007 and 2031 are mapped in Figure 2-5.1 and Figure 2-5.2.

Page 42 SR 19/ SR 20 Corridor Plan February 2011
Figure 2-5.1: Level of Service 2007
SR 19/ SR 20 Corridor Plan Page 43 February 2011
Figure 2-5.2: Level of Service 2031
Page 44 SR 19/ SR 20 Corridor Plan February 2011
Highway Capacity – Forecast Conditions/Build Provided the forecast design hour conditions exist, and the mobility improvements endorsed by the Corridor Working Group (as outlined in Chapter 4) are implemented, the study corridor would operate at LOS C for Rural and LOS D for urban in the forecast year. This is because the increased number of lanes can accommodate the expected increase in traffic. State Route 19 from Chimacum-Center Road to SR 116 is the exception. This segment would operate at LOS D/E in 2031 (LOS D in summer peak hour volume analysis). It is seen as an assessment area, where growth and development should be monitored as it is located at the vicinity of Urban Growth Area of Port Hadlock and since the Chimacum School complex is a major part of this segment. It doesn‟t trigger the 70% posted speed threshold (LOS E/F equivalent) that reflects the state‟s policy of adding capacity strategically. See Appendix D for more detailed results.
2.5.6 Intersection Inventory and Traffic Channelization
Year 2007 & Year 2031 PM Peak Hour Channelization
The Study Corridor has approximately sixty-two public intersection and traffic channelization locations. The channelization tables located in Appendix B: are based upon the SR 19 and SR 20 Corridor being a 2-lane facility. The tables provides the following information for each traffic channelization location: street name, turning direction, state route mile post, intersection type and current access, channelization status, if it‟s an existing year 2007 candidate locations for channelization, or a future year 2031 candidate location for channelization.
The proposed left and right turn channelization along mainline is based upon the WSDOT Design Manual Chapter 1310 guidelines.
The proposed left and right turn channelization for the minor approach leg(s) were based upon the worst level-of-service turning movement not meeting a LOS "C" rural or LOS "D” urban threshold. During the public meetings there were also channelization locations proposed by the attendees. For example, acceleration lanes that could also be used jointly for transit stops (far-side) were proposed. It should be noted that minor street improvements are typically the responsibility of the local agency and that major street improvements (State Route 19 and 20 Mainline) are typically WSDOT's. WSDOT will consider channelization locations proposed by the public.
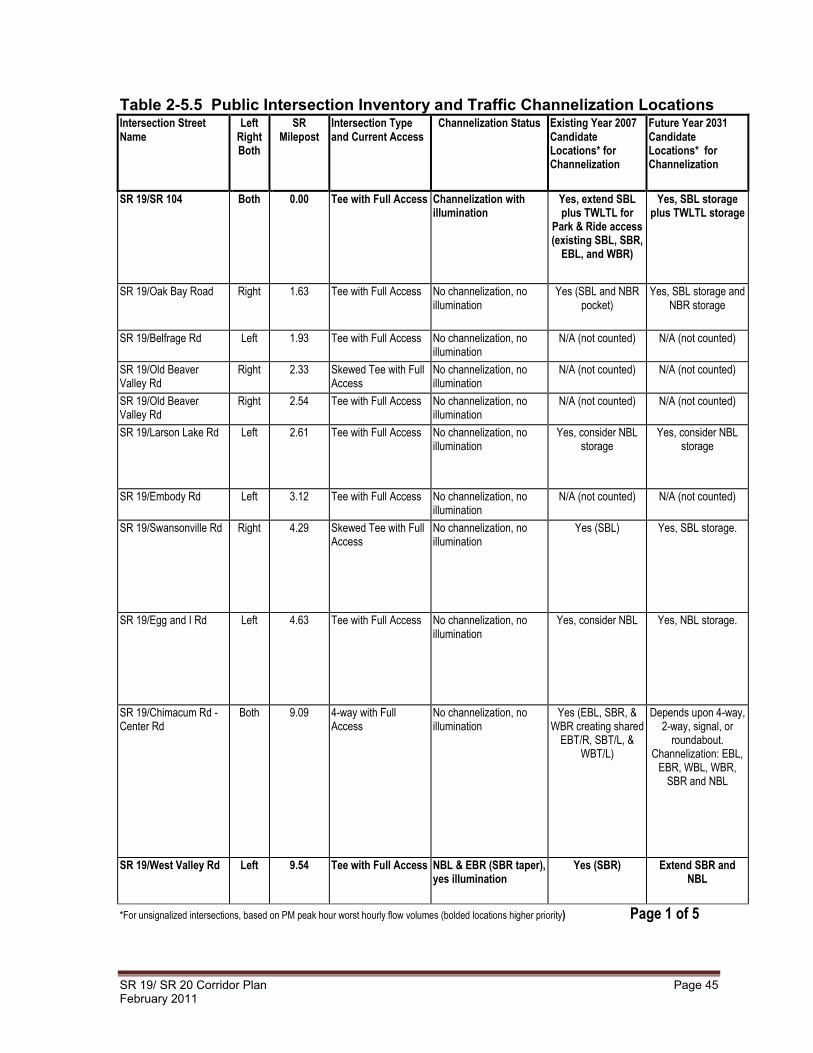
SR 19/ SR 20 Corridor Plan Page 45 February 2011
Table 2-5.5 Public Intersection Inventory and Traffic Channelization Locations Intersection Street Name
Left Right Both
SR Milepost
Intersection Type and Current Access
Channelization Status Existing Year 2007 Candidate Locations* for Channelization
Future Year 2031 Candidate Locations* for Channelization
SR 19/SR 104 Both 0.00 Tee with Full Access Channelization with illumination
Yes, extend SBL plus TWLTL for
Park & Ride access (existing SBL, SBR,
EBL, and WBR)
Yes, SBL storage plus TWLTL storage
SR 19/Oak Bay Road Right 1.63 Tee with Full Access No channelization, no illumination
Yes (SBL and NBR pocket)
Yes, SBL storage and NBR storage
SR 19/Belfrage Rd Left 1.93 Tee with Full Access No channelization, no illumination
N/A (not counted) N/A (not counted)
SR 19/Old Beaver Valley Rd
Right 2.33 Skewed Tee with Full Access
No channelization, no illumination
N/A (not counted) N/A (not counted)
SR 19/Old Beaver Valley Rd
Right 2.54 Tee with Full Access No channelization, no illumination
N/A (not counted) N/A (not counted)
SR 19/Larson Lake Rd Left 2.61 Tee with Full Access No channelization, no illumination
Yes, consider NBL storage
Yes, consider NBL storage
SR 19/Embody Rd Left 3.12 Tee with Full Access No channelization, no illumination
N/A (not counted) N/A (not counted)
SR 19/Swansonville Rd Right 4.29 Skewed Tee with Full Access
No channelization, no illumination
Yes (SBL) Yes, SBL storage.
SR 19/Egg and I Rd Left 4.63 Tee with Full Access No channelization, no illumination
Yes, consider NBL Yes, NBL storage.
SR 19/Chimacum Rd - Center Rd
Both 9.09 4-way with Full Access
No channelization, no illumination
Yes (EBL, SBR, & WBR creating shared
EBT/R, SBT/L, & WBT/L)
Depends upon 4-way, 2-way, signal, or
roundabout. Channelization: EBL,
EBR, WBL, WBR, SBR and NBL
SR 19/West Valley Rd Left 9.54 Tee with Full Access NBL & EBR (SBR taper), yes illumination
Yes (SBR) Extend SBR and NBL
*For unsignalized intersections, based on PM peak hour worst hourly flow volumes (bolded locations higher priority) Page 1 of 5
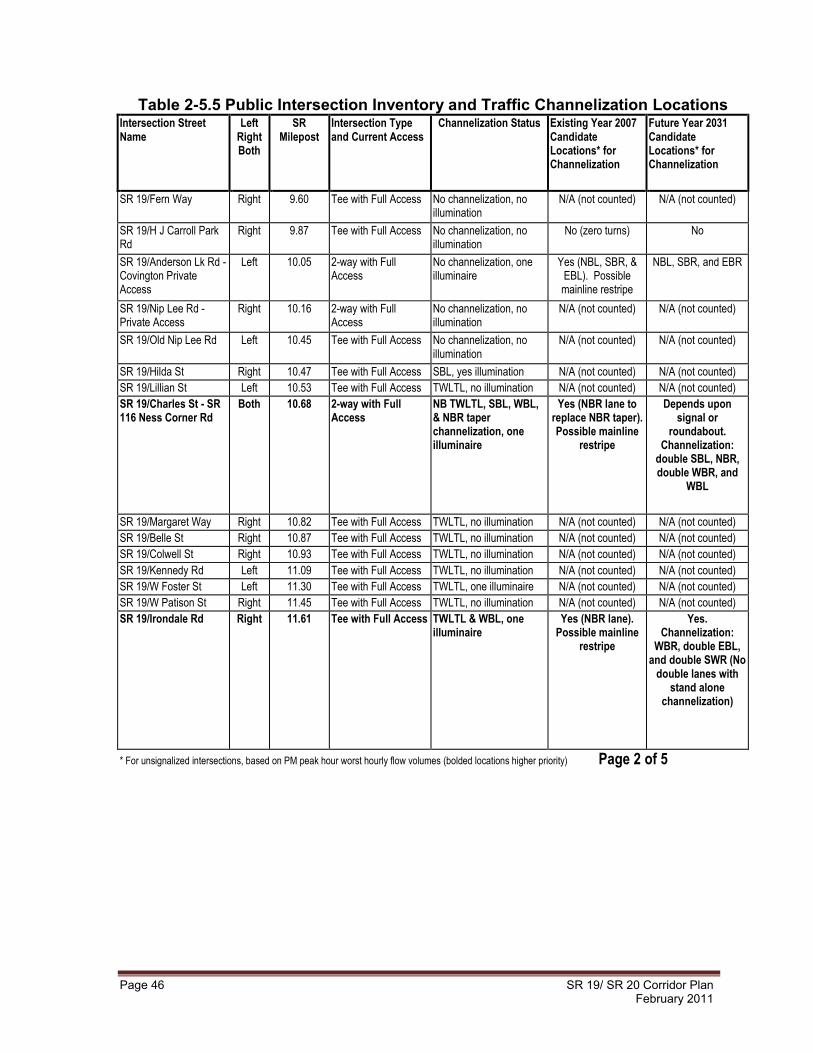
Page 46 SR 19/ SR 20 Corridor Plan February 2011
Table 2-5.5 Public Intersection Inventory and Traffic Channelization Locations Intersection Street Name
Left Right Both
SR Milepost
Intersection Type and Current Access
Channelization Status Existing Year 2007 Candidate Locations* for Channelization
Future Year 2031 Candidate Locations* for Channelization
SR 19/Fern Way Right 9.60 Tee with Full Access No channelization, no illumination
N/A (not counted) N/A (not counted)
SR 19/H J Carroll Park Rd
Right 9.87 Tee with Full Access No channelization, no illumination
No (zero turns) No
SR 19/Anderson Lk Rd - Covington Private Access
Left 10.05 2-way with Full Access
No channelization, one illuminaire
Yes (NBL, SBR, & EBL). Possible mainline restripe
NBL, SBR, and EBR
SR 19/Nip Lee Rd - Private Access
Right 10.16 2-way with Full Access
No channelization, no illumination
N/A (not counted) N/A (not counted)
SR 19/Old Nip Lee Rd Left 10.45 Tee with Full Access No channelization, no illumination
N/A (not counted) N/A (not counted)
SR 19/Hilda St Right 10.47 Tee with Full Access SBL, yes illumination N/A (not counted) N/A (not counted)
SR 19/Lillian St Left 10.53 Tee with Full Access TWLTL, no illumination N/A (not counted) N/A (not counted)
SR 19/Charles St - SR 116 Ness Corner Rd
Both 10.68 2-way with Full Access
NB TWLTL, SBL, WBL, & NBR taper channelization, one illuminaire
Yes (NBR lane to replace NBR taper). Possible mainline
restripe
Depends upon signal or
roundabout. Channelization:
double SBL, NBR, double WBR, and
WBL
SR 19/Margaret Way Right 10.82 Tee with Full Access TWLTL, no illumination N/A (not counted) N/A (not counted)
SR 19/Belle St Right 10.87 Tee with Full Access TWLTL, no illumination N/A (not counted) N/A (not counted)
SR 19/Colwell St Right 10.93 Tee with Full Access TWLTL, no illumination N/A (not counted) N/A (not counted)
SR 19/Kennedy Rd Left 11.09 Tee with Full Access TWLTL, no illumination N/A (not counted) N/A (not counted)
SR 19/W Foster St Left 11.30 Tee with Full Access TWLTL, one illuminaire N/A (not counted) N/A (not counted)
SR 19/W Patison St Right 11.45 Tee with Full Access TWLTL, no illumination N/A (not counted) N/A (not counted)
SR 19/Irondale Rd Right 11.61 Tee with Full Access TWLTL & WBL, one illuminaire
Yes (NBR lane). Possible mainline
restripe
Yes. Channelization:
WBR, double EBL, and double SWR (No
double lanes with stand alone
channelization)
* For unsignalized intersections, based on PM peak hour worst hourly flow volumes (bolded locations higher priority) Page 2 of 5

SR 19/ SR 20 Corridor Plan Page 47 February 2011
Table 2-5.5 Public Intersection Inventory and Traffic Channelization Locations Intersection Street Name
Left Right Both
SR Milepost
Intersection Type and Current Access
Channelization Status Existing Year 2007 Candidate Locations* for Channelization
Future Year 2031 Candidate Locations* for Channelization
SR 19/4 Corners Rd Left 11.89 Tee with Full Access NBL, EBL, & SBR taper channelization, three illuminaires
Maybe (SBR pocket). Possible mainline
restripe of taper into pocket
Yes, SBR pocket
SR 19/Prospect Ave Right 12.43 Tee with Full Access SBL & WBL channelization, one illuminaire
Yes (NBR). Possible mainline
restripe
Yes, NBR storage
SR 19/Airport Rd - Woodland Dr
Both 12.95 2-way with Full Access
No channelization, one illuminaire
Yes (NBR pocket/taper). Any new development
with > 20 veh turning left in PM peak will need NBL or SBL. SBR pocket/taper
also triggered with 20 new right turns
Yes, NBR storage, NBL, SBL, WBL, and EBL due to high traffic volumes and queuing
SR 19/Theater Rd Left 13.60 Skewed Tee with Full Access
No channelization, no illumination
N/A (not counted) N/A (not counted)
SR 19/Parkridge Dr Right 13.87 Tee with Full Access No channelization, no illumination
Yes (WBL to improve LOS). NBR with >14
turns.
SBL and WBL due to high traffic volumes
and queuing
SR 19/Theater Rd Left 14.03 Skewed Tee with Full Access
No channelization, one illuminaire
N/A (not counted) N/A (not counted)
SR 19 - Airport Cutoff Rd/SR 20
Both & Right
14.09 & 7.79
4-way signal with Full Access
NBL, EBR, & SBL, and SBR channelization, yes illumination
No Yes, add southbound SBR to
create two SBT lanes by restriping
the existing SBR (or create double SBR)
SR 20/Old Fort Townsend Rd
Right 8.26 Tee with Full Access SBL & NBR taper, two illuminaires
Yes (WBL to improve LOS)
Yes, NBR pocket and WBL storage
SR 20/Seton Rd Right 8.60 Tee with Full Access SBL, two illuminaires N/A (not counted) N/A (not counted)
* For unsignalized intersections, based on PM peak hour worst hourly flow volumes (bolded locations higher priority) Page 3 of 5

Page 48 SR 19/ SR 20 Corridor Plan February 2011
Table 2-5.5 Public Intersection Inventory and Traffic Channelization Locations Intersection Street Name
Left Right Both
SR Milepost
Intersection Type and Current Access
Channelization Status Existing Year 2007 Candidate Locations* for Channelization
Future Year 2031 Candidate Locations* for Channelization
SR 20/Frederick St - Private Access
Right 8.97 2-way with Full Access
SBL & NBL channelization with SBR & NBR tapers, two illuminaires
Yes (EBL & WBL to improve LOS)
Yes, NB acceleration storage/far side transit
pullout and WBL storage
SR 20/Glen Cove Rd - Trail Access
Right 9.05 Trail access with one bollard
No channelization, no illumination
N/A (trail access) N/A (trail access)
SR 20/Jacob Miller Rd Left 9.57 Tee with Full Access NBL channelization, two illuminaires
Yes (EBL to improve LOS &
SBR)
Yes, SBR storage and EBL storage
SR 20/Discovery Rd - Mill Rd
Both 9.81 4-way signal with Full Access
SBL & NBL channelization, 2 illuminaires
Yes (SBR & NBR) Channelization: SWR storage, NBR
pocket, SEL storage and NWL storage
SR 20/Howard St Left 10.23 Tee with Full Access TWLTL & SBR channelization, one illuminaire
N/A (roundabout project)
N/A (roundabout project)
SR 20/Cliff St and Alder St
Right 10.32 Tee with Full Access TWLTL, one illuminaire N/A (left-in, right-in, right-out project with
breaks in raised median for left turn
storage)
N/A (left-in, right-in, right-out project with
breaks in raised median for left turn
storage)
SR 20/McPherson St - Private Access
Left 10.47 2-way with Full Access
TWLTL, one illuminaire N/A (right-in, right-out project)
N/A (right-in, right-out project)
SR 20/Thomas St - Private Access
Right 10.53 2-way with Full Access
WBL & EBL channelization, one illuminaire
N/A (roundabout project)
N/A (roundabout project)
SR 20/Logan St - Private Access
Both 10.58 2-way with Full Access
No channelization, no illumination
N/A (not counted) N/A (not counted)
SR 20/Hancock St Both 10.73 2-way with Full Access
TWLTL, no illumination N/A (not counted) N/A (not counted)
SR 20/Sherman St Right 10.78 Tee with Full Access TWLTL, no illumination N/A (not counted) N/A (not counted)
SR 20/Hendricks St - Private Access
Left 10.82 2-way with Full Access
TWLTL, two illuminaires N/A (not counted) N/A (not counted)
SR 20/Grant St Right 10.87 Tee with Full Access TWLTL, no illumination N/A (not counted) N/A (not counted)
* For unsignalized intersections, based on PM peak hour worst hourly flow volumes (bolded locations higher priority) Page 4 of 5

SR 19/ SR 20 Corridor Plan Page 49 February 2011
Table 2-5.5 Public Intersection Inventory and Traffic Channelization Locations Intersection Street Name
Left Right Both
SR Milepost
Intersection Type and Current Access
Channelization Status Existing Year 2007 Candidate Locations* for Channelization
Future Year 2031 Candidate Locations* for Channelization
SR 20/Sheridan St Both 10.93 2-way with Full Access
WBL, EBL, & SBR channelization, one illuminaire
Yes (WBR pocket/taper)
Yes, WBR pocket or WB climbing lane creating a shared
WBT/R
SR 20/Cleveland St Right 10.98 Tee with Full Access No channelization, no illumination
N/A (not counted) N/A (not counted)
SR 20/Wilson St Right 11.03 Tee with Full Access No channelization, no illumination
N/A (not counted) N/A (not counted)
SR 20/Hill St Left 11.35 Tee with Full Access No channelization, no illumination
N/A (not counted) N/A (not counted)
SR 20/10th St Left 11.40 Tee with Full Access No channelization, no illumination
N/A (not counted) N/A (not counted)
SR 20/Haines Pl - Shopping Center
Both 11.51 4-way signal with Full Access
EBL, EBR, WBL, & SBL channelization, two illuminaires
Yes (WBR, but spacing may only
support taper)
Yes, WBR storage and extend EBR
storage, NBL storage
SR 20/12th Ave (private)
Left 11.65 Tee with Full Access No channelization, no illumination
Yes (WBR & SBL). Possible restripe for WBR, but will impact shoulder
Yes, WBR storage with option of raised median for right-in,
right-out only
SR 20/Benedict St Right 11.79 Tee with Full Access WBL channelization, no illumination
N/A (not counted) N/A (not counted)
SR 20/Jefferson St Right 11.91 Tee with Full Access No channelization, no illumination
N/A (not counted) N/A (not counted)
SR 20/Decatur St - Jefferson St
Both 11.96 2-way with Full Access
WBL channelization, no illumination
N/A (not counted) Yes, WB acceleration storage with taper,
remove stop sign for free SBR movements
SR 20/Kearney St Both 12.01 5-way signal with Full Access
WBL, EBL, & WBR channelization, yes illumination
No Yes, NBL storage and SBL storage
SR 20/Washington St Both 12.07 Skewed 2-way with Full Access
WBL & EBL channelization, yes illumination
N/A (not counted) Additional WBT lane through Kearney (thru/right) and
remove stop sign for free SBR movements
SR 20/Water St Right 12.19 Skewed Tee with Partial Access
NB holding lane storage, no channelization, yes illumination
N/A (not counted) N/A (not counted)
SR 20/Water St Left 12.51 Tee with Full Access EBR, NBL, and NBL/R channelization at Ferry Terminal Entrance/Exit
No No
* For unsignalized intersections, based on PM peak hour worst hourly flow volumes (bolded locations higher priority) Page 5 of 5
Page 50 SR 19/ SR 20 Corridor Plan February 2011
2.5.7 Intersection Inventory and Intersection Improvements
Candidate Locations for Intersection Improvements
The following table (Table 2-5.6) presents a "vision" for intersection improvements for a 2-lane facility. It identifies intersections along the SR 19 and SR 20 Corridor that should or should not be considered for intersection improvements in the future. This "vision" for intersection improvement locations was developed with assistance from the WSDOT Olympic Region Traffic Engineer, and our Headquarter Traffic and Design Offices. Where a particular intersection is identified in the table as a possible location for improvement, it is important to realize that the "candidate" intersection will have to meet warrants, rank high, and prioritize well on a regional list to become eligible for improvements in the future. Intersection improvement needs created by private developments are generally handled as part of the development review process with the WSDOT Developer Services section.

SR 19/ SR 20 Corridor Plan Page 51 February 2011
Table 2-5.6 Public Intersection Inventory and Intersection Improvement Locations
Intersection Street Name
Left Right Both
SR Milepost
Intersection Type and Current Access
Intersection Improvement
Existing Signal Yes/No
Possible Future (2031) Candidate Locations for Intersection Improvement? Yes/No
SR 19/SR 104 Both 0.00 Tee with Full Access No No (steep vertical curve, remote location, and high
speeds)
SR 19/Oak Bay Drive Right 1.63 Tee with Full Access No No
SR 19/Belfrage Rd Left 1.93 Tee with Full Access No No
SR 19/Old Beaver Valley Rd Right 2.33 Skewed Tee with Full Access No No
SR 19/Old Beaver Valley Rd Right 2.54 Tee with Full Access No No
SR 19/Larson Lake Rd Left 2.61 Tee with Full Access No No
SR 19/Embody Rd Left 3.12 Tee with Full Access No No
SR 19/Swansonville Rd Right 4.29 Skewed Tee with Full Access No No
SR 19/Egg and I Rd Left 4.63 Tee with Full Access No No
SR 19/Chimacum Rd - Center Rd Both 9.09 4-way with Full Access Yes,
Flashing Yes for Intersection
Improvement
SR 19/West Valley Rd Left 9.54 Tee with Full Access Yes,
Flashing Yes for Intersection
Improvement
SR 19/Fern Way Right 9.60 Tee with Full Access No No
SR 19/H J Carroll Park Rd Right 9.87 Tee with Full Access No No
SR 19/Anderson Lk Rd - Covington Private Access
Left 10.05 2-way with Full Access No Yes for Intersection
Improvement
SR 19/Nip Lee Rd - Private Access Right 10.16 2-way with Full Access No No
SR 19/Old Nip Lee Rd Left 10.45 Tee with Full Access No No
SR 19/Hilda St Right 10.47 Tee with Full Access No No
SR 19/Lillian St Left 10.53 Tee with Full Access No No
SR 19/Charles St - SR 116 Ness Corner Rd
Both 10.68 2-way with Full Access No Yes for Intersection
Improvement
SR 19/Margaret Way Right 10.82 Tee with Full Access No No
Note: shading is for possible future signal or roundabout improvements (bolded locations higher priority) Page 1 of 4
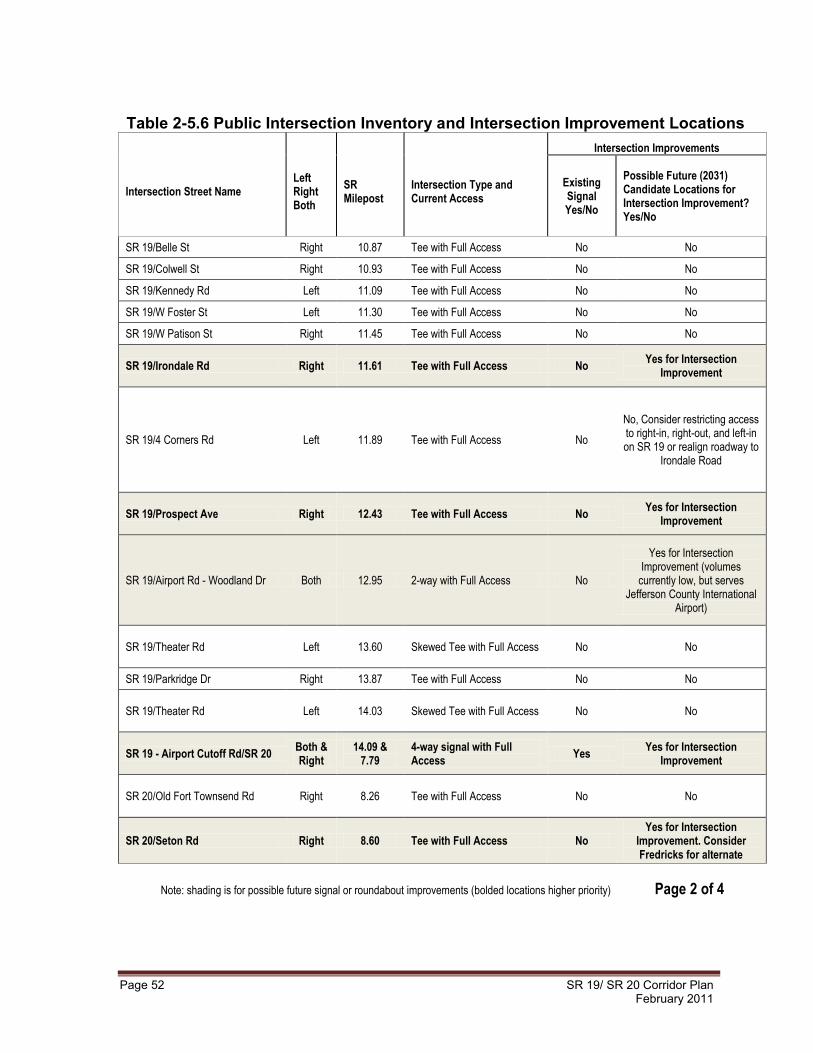
Page 52 SR 19/ SR 20 Corridor Plan February 2011
Table 2-5.6 Public Intersection Inventory and Intersection Improvement Locations
Intersection Street Name
Left Right Both
SR Milepost
Intersection Type and Current Access
Intersection Improvements
Existing Signal Yes/No
Possible Future (2031) Candidate Locations for Intersection Improvement? Yes/No
SR 19/Belle St Right 10.87 Tee with Full Access No No
SR 19/Colwell St Right 10.93 Tee with Full Access No No
SR 19/Kennedy Rd Left 11.09 Tee with Full Access No No
SR 19/W Foster St Left 11.30 Tee with Full Access No No
SR 19/W Patison St Right 11.45 Tee with Full Access No No
SR 19/Irondale Rd Right 11.61 Tee with Full Access No Yes for Intersection
Improvement
SR 19/4 Corners Rd Left 11.89 Tee with Full Access No
No, Consider restricting access to right-in, right-out, and left-in on SR 19 or realign roadway to
Irondale Road
SR 19/Prospect Ave Right 12.43 Tee with Full Access No Yes for Intersection
Improvement
SR 19/Airport Rd - Woodland Dr Both 12.95 2-way with Full Access No
Yes for Intersection Improvement (volumes
currently low, but serves Jefferson County International
Airport)
SR 19/Theater Rd Left 13.60 Skewed Tee with Full Access No No
SR 19/Parkridge Dr Right 13.87 Tee with Full Access No No
SR 19/Theater Rd Left 14.03 Skewed Tee with Full Access No No
SR 19 - Airport Cutoff Rd/SR 20 Both & Right
14.09 & 7.79
4-way signal with Full Access
Yes Yes for Intersection
Improvement
SR 20/Old Fort Townsend Rd Right 8.26 Tee with Full Access No No
SR 20/Seton Rd Right 8.60 Tee with Full Access No Yes for Intersection
Improvement. Consider Fredricks for alternate
Note: shading is for possible future signal or roundabout improvements (bolded locations higher priority) Page 2 of 4
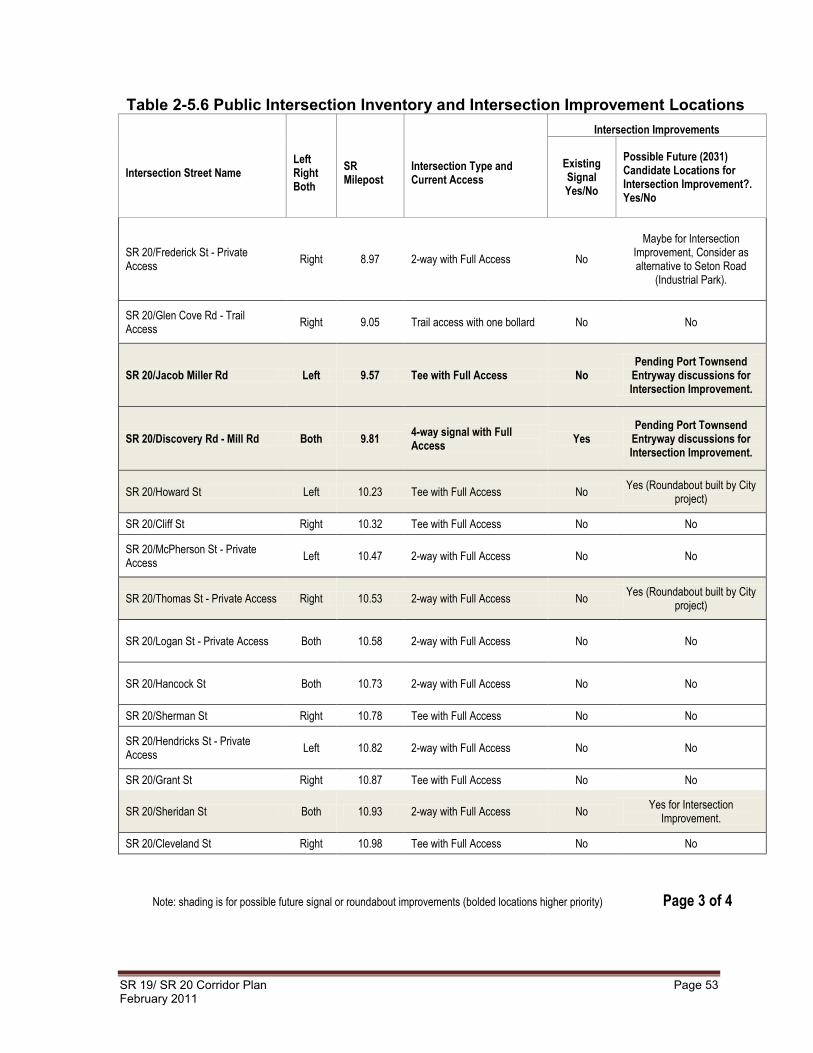
SR 19/ SR 20 Corridor Plan Page 53 February 2011
Table 2-5.6 Public Intersection Inventory and Intersection Improvement Locations
Intersection Street Name
Left Right Both
SR Milepost
Intersection Type and Current Access
Intersection Improvements
Existing Signal Yes/No
Possible Future (2031) Candidate Locations for Intersection Improvement?. Yes/No
SR 20/Frederick St - Private Access
Right 8.97 2-way with Full Access No
Maybe for Intersection Improvement, Consider as alternative to Seton Road
(Industrial Park).
SR 20/Glen Cove Rd - Trail Access
Right 9.05 Trail access with one bollard No No
SR 20/Jacob Miller Rd Left 9.57 Tee with Full Access No Pending Port Townsend
Entryway discussions for Intersection Improvement.
SR 20/Discovery Rd - Mill Rd Both 9.81 4-way signal with Full Access
Yes Pending Port Townsend
Entryway discussions for Intersection Improvement.
SR 20/Howard St Left 10.23 Tee with Full Access No Yes (Roundabout built by City
project)
SR 20/Cliff St Right 10.32 Tee with Full Access No No
SR 20/McPherson St - Private Access
Left 10.47 2-way with Full Access No No
SR 20/Thomas St - Private Access Right 10.53 2-way with Full Access No Yes (Roundabout built by City
project)
SR 20/Logan St - Private Access Both 10.58 2-way with Full Access No No
SR 20/Hancock St Both 10.73 2-way with Full Access No No
SR 20/Sherman St Right 10.78 Tee with Full Access No No
SR 20/Hendricks St - Private Access
Left 10.82 2-way with Full Access No No
SR 20/Grant St Right 10.87 Tee with Full Access No No
SR 20/Sheridan St Both 10.93 2-way with Full Access No Yes for Intersection
Improvement.
SR 20/Cleveland St Right 10.98 Tee with Full Access No No
Note: shading is for possible future signal or roundabout improvements (bolded locations higher priority) Page 3 of 4
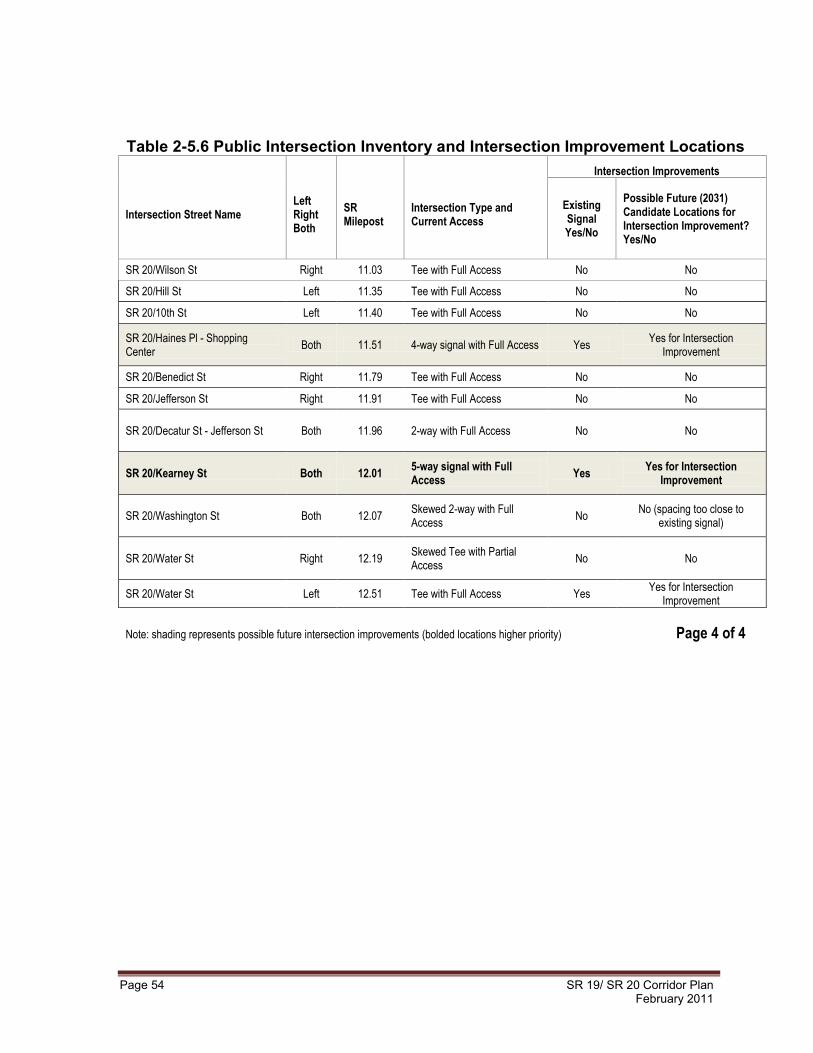
Page 54 SR 19/ SR 20 Corridor Plan February 2011
Table 2-5.6 Public Intersection Inventory and Intersection Improvement Locations
Intersection Street Name
Left Right Both
SR Milepost
Intersection Type and Current Access
Intersection Improvements
Existing Signal Yes/No
Possible Future (2031) Candidate Locations for Intersection Improvement? Yes/No
SR 20/Wilson St Right 11.03 Tee with Full Access No No
SR 20/Hill St Left 11.35 Tee with Full Access No No
SR 20/10th St Left 11.40 Tee with Full Access No No
SR 20/Haines Pl - Shopping Center
Both 11.51 4-way signal with Full Access Yes Yes for Intersection
Improvement
SR 20/Benedict St Right 11.79 Tee with Full Access No No
SR 20/Jefferson St Right 11.91 Tee with Full Access No No
SR 20/Decatur St - Jefferson St Both 11.96 2-way with Full Access No No
SR 20/Kearney St Both 12.01 5-way signal with Full Access
Yes Yes for Intersection
Improvement
SR 20/Washington St Both 12.07 Skewed 2-way with Full Access
No No (spacing too close to
existing signal)
SR 20/Water St Right 12.19 Skewed Tee with Partial Access
No No
SR 20/Water St Left 12.51 Tee with Full Access Yes Yes for Intersection
Improvement
Note: shading represents possible future intersection improvements (bolded locations higher priority) Page 4 of 4
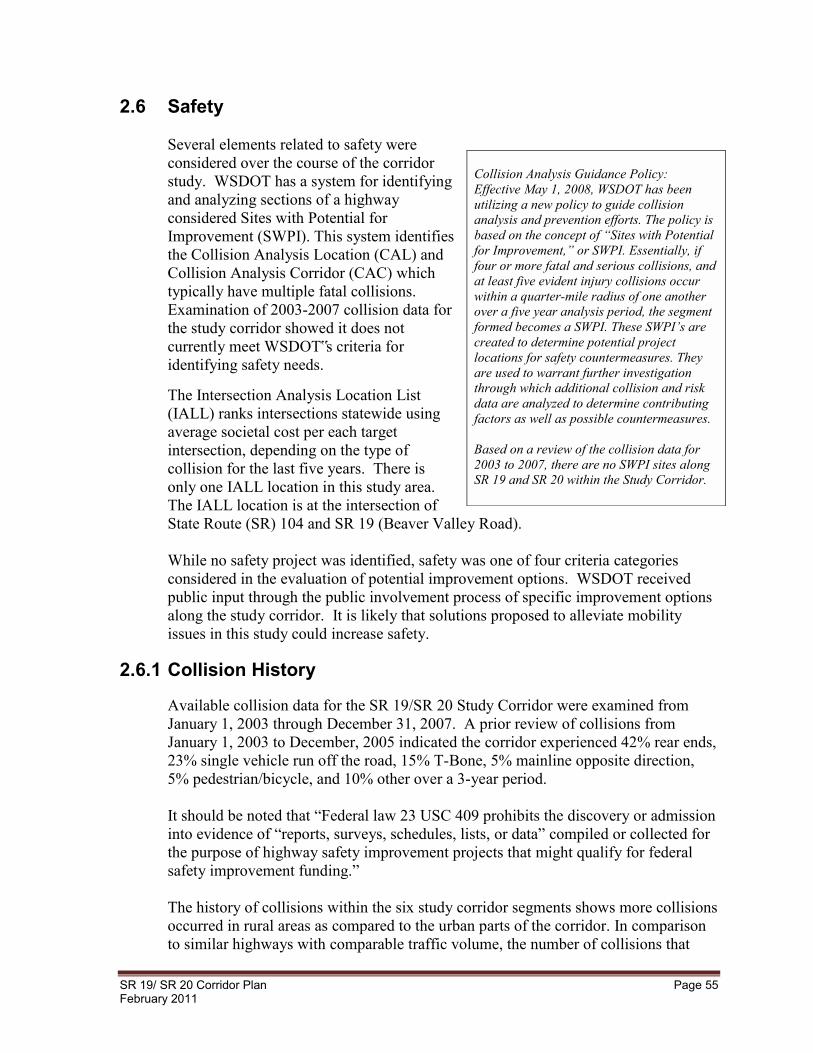
SR 19/ SR 20 Corridor Plan Page 55 February 2011
2.6 Safety Several elements related to safety were considered over the course of the corridor study. WSDOT has a system for identifying and analyzing sections of a highway considered Sites with Potential for Improvement (SWPI). This system identifies the Collision Analysis Location (CAL) and Collision Analysis Corridor (CAC) which typically have multiple fatal collisions. Examination of 2003-2007 collision data for the study corridor showed it does not currently meet WSDOT‟s criteria for identifying safety needs.
The Intersection Analysis Location List (IALL) ranks intersections statewide using average societal cost per each target intersection, depending on the type of collision for the last five years. There is only one IALL location in this study area. The IALL location is at the intersection of State Route (SR) 104 and SR 19 (Beaver Valley Road). While no safety project was identified, safety was one of four criteria categories considered in the evaluation of potential improvement options. WSDOT received public input through the public involvement process of specific improvement options along the study corridor. It is likely that solutions proposed to alleviate mobility issues in this study could increase safety.
2.6.1 Collision History
Available collision data for the SR 19/SR 20 Study Corridor were examined from January 1, 2003 through December 31, 2007. A prior review of collisions from January 1, 2003 to December, 2005 indicated the corridor experienced 42% rear ends, 23% single vehicle run off the road, 15% T-Bone, 5% mainline opposite direction, 5% pedestrian/bicycle, and 10% other over a 3-year period. It should be noted that “Federal law 23 USC 409 prohibits the discovery or admission into evidence of “reports, surveys, schedules, lists, or data” compiled or collected for the purpose of highway safety improvement projects that might qualify for federal safety improvement funding.” The history of collisions within the six study corridor segments shows more collisions occurred in rural areas as compared to the urban parts of the corridor. In comparison to similar highways with comparable traffic volume, the number of collisions that
Collision Analysis Guidance Policy: Effective May 1, 2008, WSDOT has been utilizing a new policy to guide collision analysis and prevention efforts. The policy is based on the concept of “Sites with Potential for Improvement,” or SWPI. Essentially, if four or more fatal and serious collisions, and at least five evident injury collisions occur within a quarter-mile radius of one another over a five year analysis period, the segment formed becomes a SWPI. These SWPI’s are created to determine potential project locations for safety countermeasures. They are used to warrant further investigation through which additional collision and risk data are analyzed to determine contributing factors as well as possible countermeasures. Based on a review of the collision data for 2003 to 2007, there are no SWPI sites along SR 19 and SR 20 within the Study Corridor.
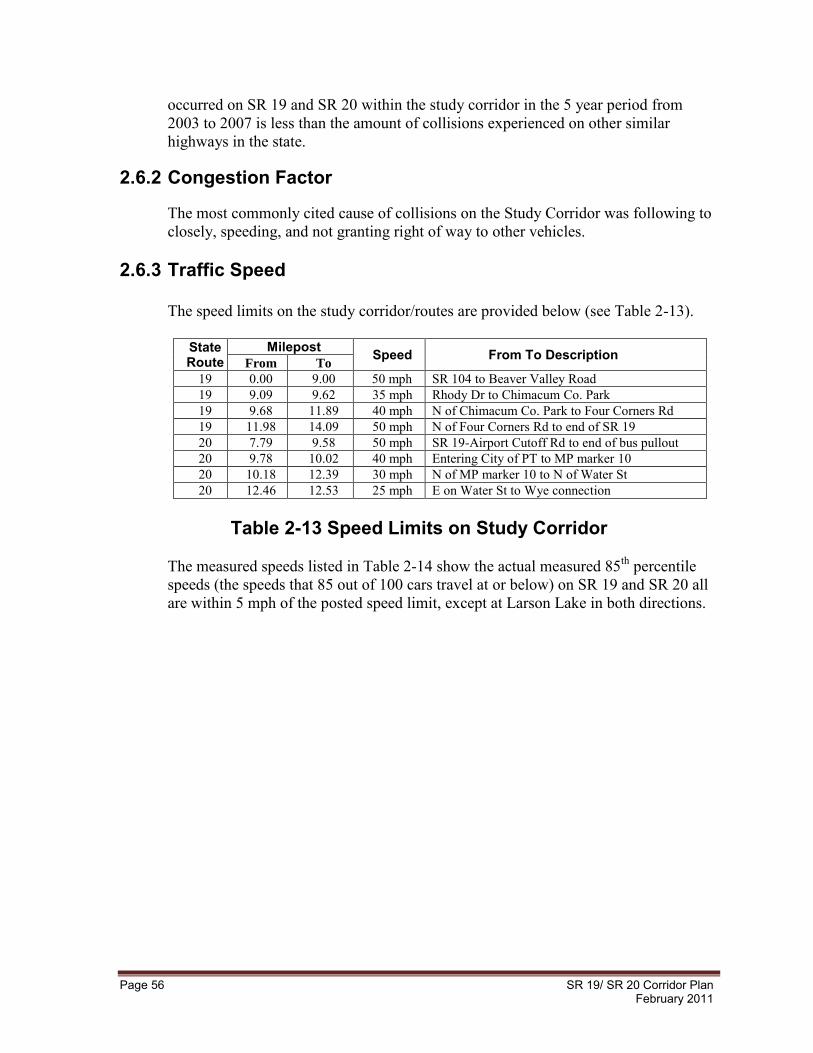
Page 56 SR 19/ SR 20 Corridor Plan February 2011
occurred on SR 19 and SR 20 within the study corridor in the 5 year period from 2003 to 2007 is less than the amount of collisions experienced on other similar highways in the state.
2.6.2 Congestion Factor
The most commonly cited cause of collisions on the Study Corridor was following to closely, speeding, and not granting right of way to other vehicles.
2.6.3 Traffic Speed The speed limits on the study corridor/routes are provided below (see Table 2-13).
State Route
Milepost Speed From To Description From To
19 0.00 9.00 50 mph SR 104 to Beaver Valley Road 19 9.09 9.62 35 mph Rhody Dr to Chimacum Co. Park 19 9.68 11.89 40 mph N of Chimacum Co. Park to Four Corners Rd 19 11.98 14.09 50 mph N of Four Corners Rd to end of SR 19 20 7.79 9.58 50 mph SR 19-Airport Cutoff Rd to end of bus pullout 20 9.78 10.02 40 mph Entering City of PT to MP marker 10 20 10.18 12.39 30 mph N of MP marker 10 to N of Water St 20 12.46 12.53 25 mph E on Water St to Wye connection
Table 2-13 Speed Limits on Study Corridor
The measured speeds listed in Table 2-14 show the actual measured 85th percentile speeds (the speeds that 85 out of 100 cars travel at or below) on SR 19 and SR 20 all are within 5 mph of the posted speed limit, except at Larson Lake in both directions.
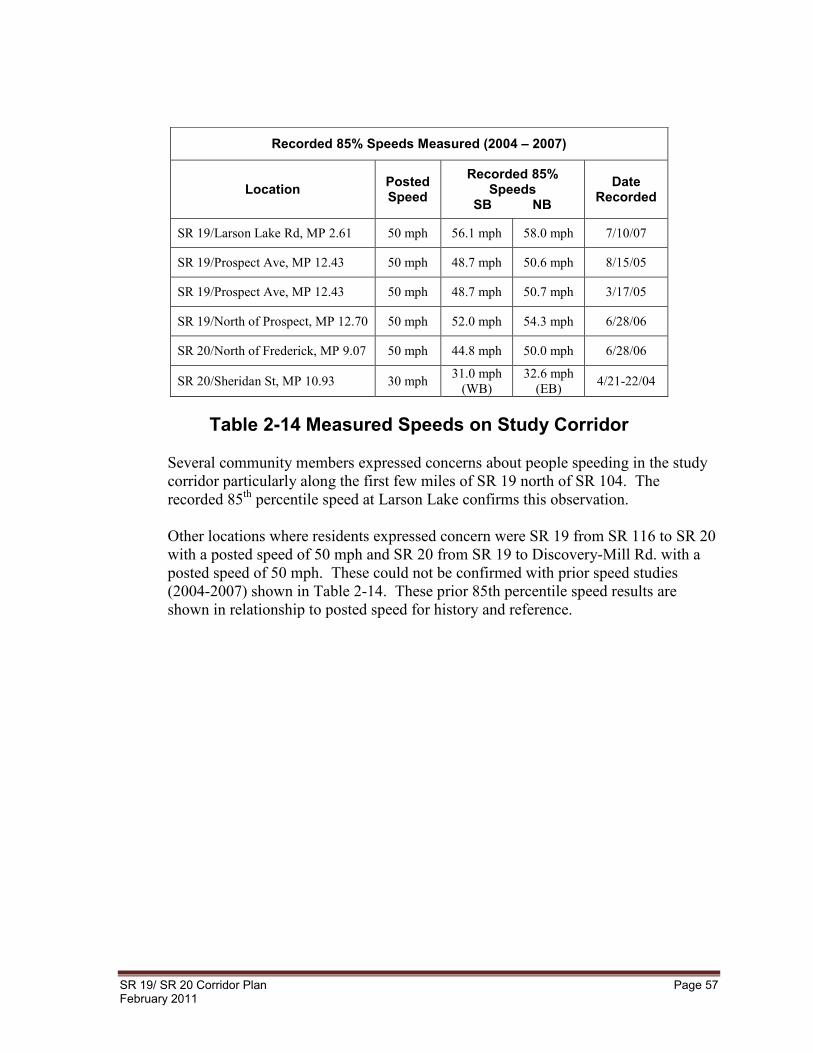
SR 19/ SR 20 Corridor Plan Page 57 February 2011
Table 2-14 Measured Speeds on Study Corridor Several community members expressed concerns about people speeding in the study corridor particularly along the first few miles of SR 19 north of SR 104. The recorded 85th percentile speed at Larson Lake confirms this observation. Other locations where residents expressed concern were SR 19 from SR 116 to SR 20 with a posted speed of 50 mph and SR 20 from SR 19 to Discovery-Mill Rd. with a posted speed of 50 mph. These could not be confirmed with prior speed studies (2004-2007) shown in Table 2-14. These prior 85th percentile speed results are shown in relationship to posted speed for history and reference.
Recorded 85% Speeds Measured (2004 – 2007)
Location Posted Speed
Recorded 85% Speeds
SB NB Date
Recorded
SR 19/Larson Lake Rd, MP 2.61 50 mph 56.1 mph 58.0 mph 7/10/07
SR 19/Prospect Ave, MP 12.43 50 mph 48.7 mph 50.6 mph 8/15/05
SR 19/Prospect Ave, MP 12.43 50 mph 48.7 mph 50.7 mph 3/17/05
SR 19/North of Prospect, MP 12.70 50 mph 52.0 mph 54.3 mph 6/28/06
SR 20/North of Frederick, MP 9.07 50 mph 44.8 mph 50.0 mph 6/28/06
SR 20/Sheridan St, MP 10.93 30 mph 31.0 mph (WB)
32.6 mph (EB) 4/21-22/04
SR 19/ SR 20 Corridor Plan Page 59 February 2011
CHAPTER 3
The Study Process

SR 19/ SR 20 Corridor Plan Page 61 February 2011
Chapter 3 The Study Process The public process used in developing the SR 19/SR 20 Corridor Plan consisted of two elements: a Corridor Working Group comprised of interested stakeholders, and community-based public open houses. Communication with the public was accomplished using many different tools – open houses, mailings, paid newspaper advertisements, a website and the telephone. The study also received attention in the Peninsula Daily News and The Port Townsend and Jefferson County Leader, newspapers serving Jefferson County. The SR 19/ SR 20 corridor study was the topic of articles in these two newspapers.
3.1 Stakeholder Involvement
Early in the corridor planning process, Washington State Department of Transportation (WSDOT) staff met with or contacted key stakeholders to inform them of the up-coming study. Stakeholders included Jefferson County Commissioners and staff, City of Port Townsend Mayor, Deputy Mayor and staff, Jefferson Transit official, school district official, emergency responders (sheriff, police, fire department, Washington State Patrol), tribes, bicycle association, businesses, elected representatives, Indian Island/ Navy representative and others. Staff also provided information to others. These efforts were to publicize the study and recruit individuals with a strong interest in transportation issues to represent their organizations on the Corridor Working Group. The role of the Corridor Working Group (Figure 3-1) was to help build the vision for the corridor, and generate solutions for corridor improvements, consider community input gathered at the public open houses, and endorse the final
Figure 3-1 Decision Making Process s

Page 62 SR 19/ SR 20 Corridor Plan February 2011
recommendations to be included in the plan. They act as a focus group that brings community concerns and ideas in to build mutually acceptable recommendations. The Corridor Working Group members‟ understanding and appreciation of the transportation issues regarding their particular areas of interest are important component in informing WSDOT staff and developing solutions inclusive of their diverse interests.
3.1.1 Corridor Working Group Membership
The Corridor Working Group represented a wide variety of transportation interests in the community near the corridor/routes. The consistent attendance and commitment on the part of the working group members was a crucial factor in the success of the study. The committee met four times between July 2008 and October 2009. Figure 3-1 shows the Corridor Working Group membership.
Jefferson County
City of Port Townsend Peninsula Regional Transportation Planning Organization (PRTPO)
Jefferson Transit Port of Port Townsend
Bangor Naval Base / Indian Island Jamestown S'Klallam Tribe
Port Gamble S'Klallam Tribe "Team Jefferson" WSU Extension Jefferson County
Port Hadlock Chamber of Commerce Port Townsend Chamber
Chimacum School District Port Townsend School District
Washington State Patrol Port Townsend Police Department
Jefferson County Sheriff Office Jefferson County Traffic Safety Task Force
East Jefferson Fire-Rescue Port Ludlow Fire and Rescue
Port Townsend Bicycle Association Washington State Representative Kevin Van De Wege
Figure 3-1: Corridor Working Group
3.1.2 Corridor Working Group Meetings
The main topic of each Corridor Working Group meeting was designed to work in sequence to build on information analyzed and presented by WSDOT staff, based on technical, public or stakeholder generated data. The schedule of study events (Figure 3-2) shows how the parallel public involvement processes – Corridor Working Group meetings and public meetings – worked together for gathering and sharing information pertinent to the study.

SR 19/ SR 20 Corridor Plan Page 63 February 2011
page was intentionally left blank.
Figu
re 3
-2 S
tudy
Sch
edul
e
Page 64 SR 19/ SR 20 Corridor Plan February 2011
The agenda and detailed meeting summary from each of the Corridor Working Group meetings can be found in Appendix E. General information about the Corridor Working Group meetings and public meetings is presented in the following sections. Stakeholder and Public Outreach Meetings
Corridor Working Group Meeting #1 (July 17, 2008) At this first corridor working group meeting, WSDOT staff shared information about the study purpose, schedule, process, and assumptions. The staff also reviewed existing corridor/routes conditions, described corridor segments, and presented collision history information. The focus of the second part of the meeting was to develop a vision for SR 19/ SR 20 corridor and to establish a set of criteria against which to measure the alternatives that would be developed for the future of the corridor. Staff facilitated the discussion as the Corridor Working Group drafted the vision statement for the corridor and the alternatives evaluation criteria. Vision, goals, and objectives from the city, county, and WSDOT long range plans provided the starting point for a comprehensive discussion, which resulted in a vision statement and a set of criteria being developed.
Corridor Working Group Meeting #2 (November 7, 2008) The project team relayed the range of ideas and suggestions heard from the public at the open house regarding potential improvement options. It was mentioned by the project team that the vision and criteria drafted by the working group at their first meeting was shared with the public at the open house. No changes were suggested to the vision statement. The vision statement was adopted by the Corridor Working Group as follows:
Vision Statement for the SR 19/ SR 20 Corridor
A sustainable multi-modal corridor that integrates the movement of people and goods safely and efficiently, enhances regional connections, and contributes to economic vitality and improves quality of life, with minimum environmental impacts.
Alternatives evaluation criteria was also shared with the public and addition of the word “people” was suggested. The group approved the change and adopted the criteria with a thumbs-up vote. The evaluation criteria were grouped under safety, congestion/mobility, feasibility/constructability, and environmental impact. The group was informed that Jefferson County recently developed their Quimper Peninsula travel demand forecasting model from which growth rates are used in this study. Jefferson County staff presented information on the model and on future traffic conditions based on the model forecasts.
August/September
SR 19/ SR 20 Corridor Plan Page 65 February 2011
Corridor Working Group Meeting #2 (November 7, 2008) Continued The project team provided information on Whatcom County‟s Smart Trips program as an example of promoting alternative transportation choices and encouraging other than single occupancy vehicle trips that could potentially augment other strategies to reduce vehicle miles of travel (VMT) and green house gas (GHG) emissions, and help the environment. The group showed interest and decided to explore further the feasibility of such a program in Jefferson County. A presentation on Access Management was provided and it was noted that no change in the access classifications for SR 19 and SR 20 within the study corridor were being suggested. What could potentially be considered through an Access Management project is how driveway access can be consolidated or certain movements can possibly be restricted to provided right-in, right-out type movements, and through other measures like installing sidewalks, to improve the traffic flow. Finally a list of potential improvement options was reviewed by the group. Some options were dropped due to fatal flaws, while other solutions were brainstormed by the committee.
Corridor Working Group Meeting #3 (July 29, 2009) Study corridor segment characteristics were reviewed as well as what the study team heard from the public during outreach efforts. The group was reminded that the study was utilizing Jefferson County‟s travel demand forecasting model, and model results were shared to illustrate existing and future traffic conditions. Collision history was also reviewed by each corridor segment. The group was given a handout titled „Evaluation Methodology‟. This document summarizes the scoring method for each of the 18 specific criteria used. The alternatives evaluation criteria endorsed by the group was used in the evaluation process. The evaluation methodology for the corridor plan is designed to provide an unbiased rating for each potential improvement option to assist in prioritizing and recommending improvements for implementation as funds become available. The Project Team evaluated and scored the potential improvement options using the criteria adopted by the corridor working group and presented the results and preliminary tiered recommendations to the group for discussion and input. Two examples were provided to explain the scoring process. The project team conducted traffic, safety and other technical analyses to generate measures of effectiveness, and to assist in the evaluation of each option during this process.
The preliminary tiered recommendations and top priorities were then presented to the group including Transportation Demand Management (TDM) strategies and „Projects of Special Interest‟. These were discussed and the group provided input.

Page 66 SR 19/ SR 20 Corridor Plan February 2011
Corridor Working Group Meeting #3 (July 29, 2009) Continued The study team completed a scoring matrix for over 70 potential improvement options. The improvement options were prioritized based on their total scores and listed by tiers. Tier system and TDM was explained. Tier 1 projects are typically low cost high return projects, such as Intelligent Transportation System (ITS), turn lanes, and intersection improvements; Tier 2 are the moderate to higher cost projects that further reduces congestion on both highways and local roads, examples are auxiliary lanes and parallel corridors; Tier 3 projects are the highest cost and long range projects such as adding general purpose lanes and interchange improvements. Transportation Demand Management (TDM) is an umbrella term for strategies that reduce vehicle trips or shift use of the roadway to off-peak periods. It was noted that demand management is one of WSDOT‟s important strategies to fight congestion. TDM options include low-cost and least amount of environmental impacts. Included in the TDM strategies was a working draft of a proposal developed by the Port Townsend Transportation Lab, and reviewed by Jefferson County, City of Port Townsend, and Jefferson Transit staff. This was distributed to the project team and the group for consideration.
The project team highlighted three „Projects of Special Interest‟ that resonated with the community and received the most interest and support. The Project team requested the group‟s input. It was decided the corridor working group should pick a list to present to the public. The group decided more projects should be on the projects of special interest list and five more projects were added. It was suggested this will help in seeking grant and other funding.
Corridor Working Group Meeting #4 (October 28, 2009) Project team relayed the highlights of the August 27 open house to the group. Attendees at the open house were given 3 star-shaped stickers each to affix next to projects of special interest to them. Results of the star-vote were as follows:
PROJECTS OF SPECIAL INTEREST* (listed by location from north to south)
Project Number Description of Potential Improvement Option Star-Vote
65 SR 20/Kearney Street Intersection Control*** 3 51a SR 20/Port Townsend Entryway Study
(Discovery-Mill/Jacob Miller Vicinity) 12
41 SR 19 and SR 20 Intersection Control*** 1 35 SR 19/Prospect Avenue Intersection Control*** 17 31 SR 19/Irondale Intersection Control*** 3 23 SR 19/SR 116 Intersection Control*** 10 18 SR 19/West Valley Intersection Control*** 2 3b SR 19/SR 104 Intersection Control*** 8
*Corridor Working Group Recommendations ***Signal or Roundabout
SR 19/ SR 20 Corridor Plan Page 67 February 2011
Corridor Working Group Meeting #4 (October 28, 2009) Continued The top voted locations also ranked high in the criteria-based alternatives evaluation conducted by the project team. This information indicates that the right solutions are being targeted. No changes to the „Projects of Special Interest‟ were proposed. It was decided to move forward with these. The project team summarized some 30 plus written comments that were received at the open house. Types of intersection traffic control were suggested- some preferred signals while others supported roundabouts. Specific support for other intersection locations were expressed like SR 20/Sheridan, SR 20/Discovery-Mill, SR 19/Prospect Ave, SR 19/Airport-Woodland Dr, SR 19/SR116, SR 19/Oak Bay Rd, and SR 19/SR 104. Left turn lanes at a number of locations were also supported. Participants expressed support for TDM strategies and non-motorized options, as well as maintenance of scenic and cultural values, farming valley, and historic character of the community. The project team reminded the group it was important to note that all of the study recommendations are unfunded at this time. Funding and implementation of the study recommendations were discussed. The project team reviewed the study recommendation and priorities with the group. There were no changes in the Tier 1 list; Tier 2 list had two changes- #3b and #2 (Table 4-3). Initially, for project #3b an at-grade cheaper option was analyzed but that didn‟t pan out. This resulted in phasing out the ultimate long term solution which is 3a. Project #2 was added by the project team as a more cost effective option to help with the left and right turn movements. In the Tier 3 list, there were two changes. Long-term solution #3a phasing has already been mentioned. The other change was to project #55 – text was added to reflect City of Port Townsend‟s interest in looking at drawing demand off of SR 20 through development of parallel corridors. The Transportation Demand Management (TDM) list had minor changes for project #39 and #22. The previous description didn't have "access management" wording. This was captured in the revised description for these two projects. Another change was in project #1 (Smart Trips). It is replaced by project #1a and #1b. Project #1a is a feasibility study supporting a „comprehensive program to encourage alternative transportation choices‟, and 1b is its implementation. This change was made after discussions with WSDOT Public Transportation office, WSDOT HQ Planning, and representatives of Transportation Lab and local agencies. A draft Jefferson Smart Trips document developed by the Transportation Lab was reviewed and discussed. It was determined a higher level approach would be appropriate keeping goals and visions intact (Appendix G, comprehensive Program to Encourage Alternative Transportation Choices).
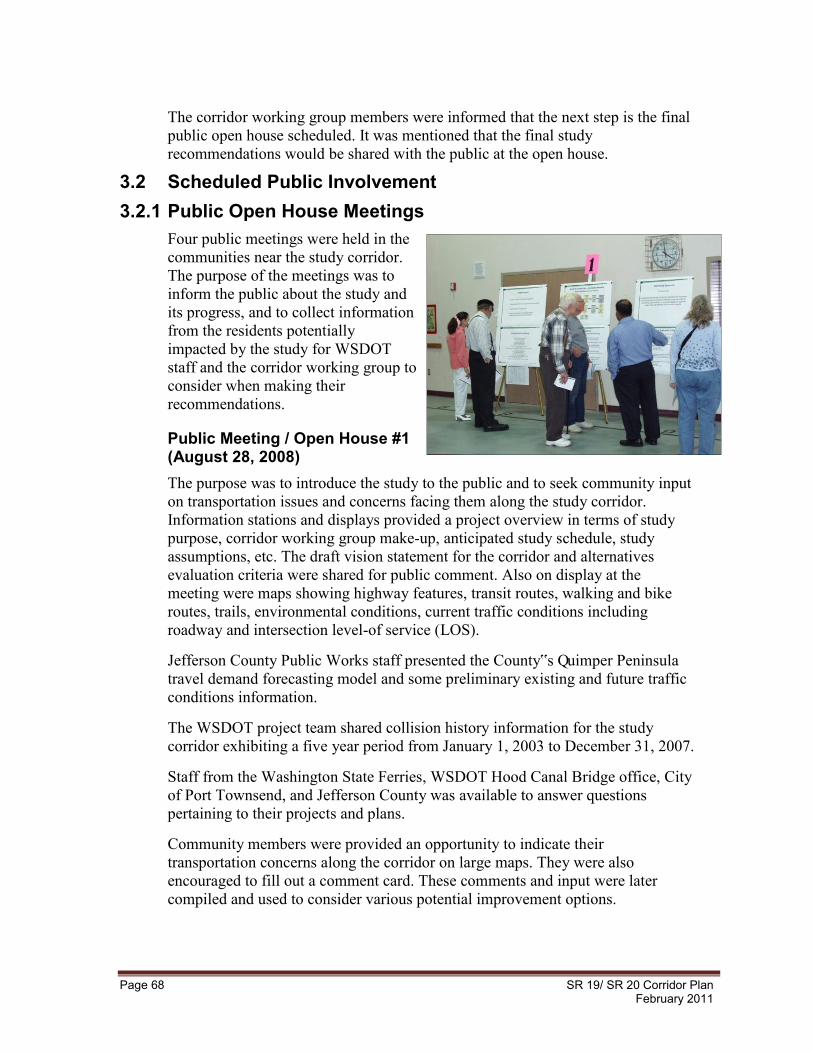
Page 68 SR 19/ SR 20 Corridor Plan February 2011
The corridor working group members were informed that the next step is the final public open house scheduled. It was mentioned that the final study recommendations would be shared with the public at the open house.
3.2 Scheduled Public Involvement 3.2.1 Public Open House Meetings
Four public meetings were held in the communities near the study corridor. The purpose of the meetings was to inform the public about the study and its progress, and to collect information from the residents potentially impacted by the study for WSDOT staff and the corridor working group to consider when making their recommendations.
Public Meeting / Open House #1 (August 28, 2008) The purpose was to introduce the study to the public and to seek community input on transportation issues and concerns facing them along the study corridor. Information stations and displays provided a project overview in terms of study purpose, corridor working group make-up, anticipated study schedule, study assumptions, etc. The draft vision statement for the corridor and alternatives evaluation criteria were shared for public comment. Also on display at the meeting were maps showing highway features, transit routes, walking and bike routes, trails, environmental conditions, current traffic conditions including roadway and intersection level-of service (LOS). Jefferson County Public Works staff presented the County‟s Quimper Peninsula travel demand forecasting model and some preliminary existing and future traffic conditions information. The WSDOT project team shared collision history information for the study corridor exhibiting a five year period from January 1, 2003 to December 31, 2007. Staff from the Washington State Ferries, WSDOT Hood Canal Bridge office, City of Port Townsend, and Jefferson County was available to answer questions pertaining to their projects and plans. Community members were provided an opportunity to indicate their transportation concerns along the corridor on large maps. They were also encouraged to fill out a comment card. These comments and input were later compiled and used to consider various potential improvement options.
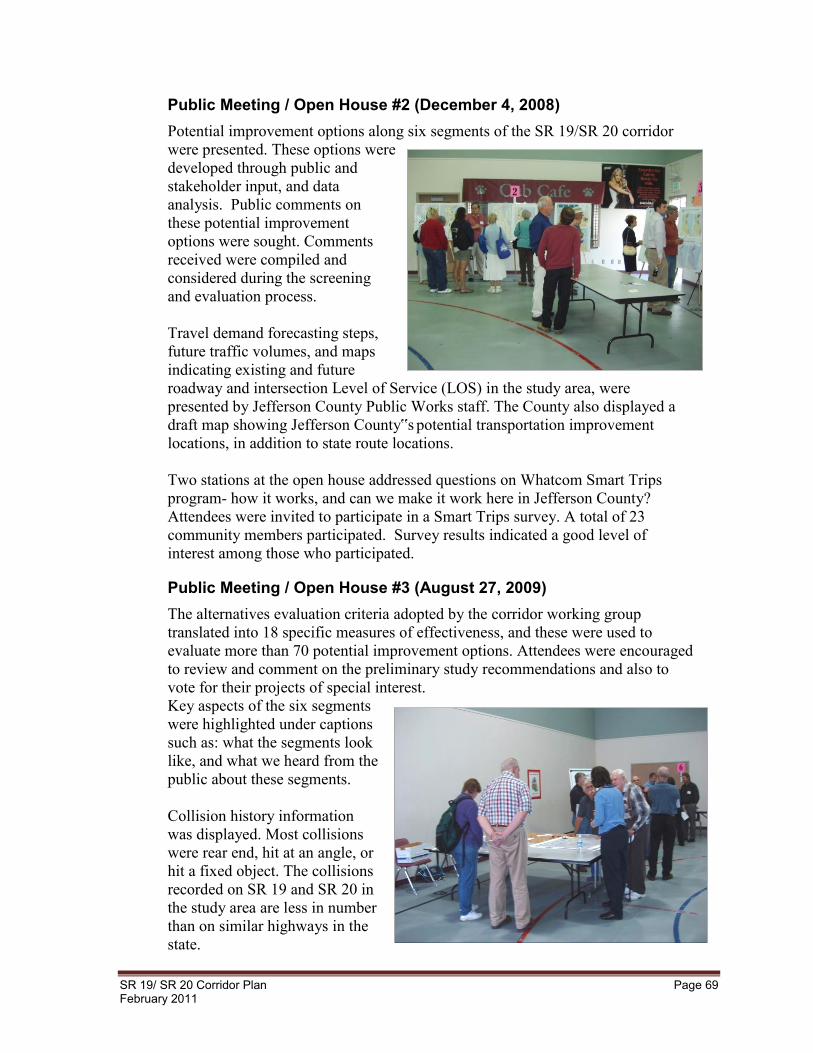
SR 19/ SR 20 Corridor Plan Page 69 February 2011
Public Meeting / Open House #2 (December 4, 2008) Potential improvement options along six segments of the SR 19/SR 20 corridor were presented. These options were developed through public and stakeholder input, and data analysis. Public comments on these potential improvement options were sought. Comments received were compiled and considered during the screening and evaluation process. Travel demand forecasting steps, future traffic volumes, and maps indicating existing and future roadway and intersection Level of Service (LOS) in the study area, were presented by Jefferson County Public Works staff. The County also displayed a draft map showing Jefferson County‟s potential transportation improvement locations, in addition to state route locations. Two stations at the open house addressed questions on Whatcom Smart Trips program- how it works, and can we make it work here in Jefferson County? Attendees were invited to participate in a Smart Trips survey. A total of 23 community members participated. Survey results indicated a good level of interest among those who participated.
Public Meeting / Open House #3 (August 27, 2009) The alternatives evaluation criteria adopted by the corridor working group translated into 18 specific measures of effectiveness, and these were used to evaluate more than 70 potential improvement options. Attendees were encouraged to review and comment on the preliminary study recommendations and also to vote for their projects of special interest. Key aspects of the six segments were highlighted under captions such as: what the segments look like, and what we heard from the public about these segments. Collision history information was displayed. Most collisions were rear end, hit at an angle, or hit a fixed object. The collisions recorded on SR 19 and SR 20 in the study area are less in number than on similar highways in the state.

Page 70 SR 19/ SR 20 Corridor Plan February 2011
Public Meeting / Open House #3 (August 27, 2009) Continued Exhibits showing the existing and future traffic conditions based on Jefferson County‟s travel demand forecast model were on display with staff available to answer questions. Public comments were solicited on preliminary tiered recommendations and priorities. The project staff explained that „intersection control‟ could be a traffic signal or a roundabout, and are subject to further planning and design analysis. Projects of special interest are those that resonated with most people and carried the most public interest and support. Attendees were given an opportunity to vote on a set of eight initial corridor working group recommendations. Projects that received the most votes also ranked high in the technical evaluation. A draft outline of a Jefferson Smart Trips program developed by Local 20/20 Transportation Lab in collaboration with Jefferson County, the City of Port Townsend, and Jefferson Transit was presented at the open house. This is a program that provides incentives to change the mode of travel to reduce single occupancy vehicle (SOV) trips.
Public Meeting / Open House #4 (November 19, 2009) This was the fourth and final open house. A continuous loop slideshow presentation provided project overview. It covered a range of information provided during the course of the study. It included information on corridor segments, study purpose, vision statement, evaluation criteria, corridor working group membership and a recap of the last open house meeting. The star-voting results from that meeting on the „Projects of Special Interest‟ were displayed, along with a summary of public comments. It also provided information on the study recommendations and priorities with a focus on the final changes. The slideshow provided next steps information which was writing of the report. It was
emphasized that all study recommendations were unfunded at this time. Plan implementation process and possible sources of funding were noted. Display boards with lists and maps of study recommendations and priorities included „Projects of Special Interest‟, Tier 1, Tier 2, Tier 3 solutions, and Transportation Demand Management (TDM) strategies. WSDOT project team and local agency partners were on hand to assist attendees with their questions. A feasibility study supporting a comprehensive program to encourage alternative transportation choices is one of the recommendations of the study under the TDM list of strategies. Display boards outlining the vision, purpose, and goals of this feasibility study were presented at the open house. After review of 'Jefferson Smart Trips' draft proposal, and based on consultation with WSDOT Public Transportation and with the local group, the study team prepared a working copy describing this feasibility study. It provides an approach that ensures the necessary groundwork to identify a program configuration that builds on existing successes in the community, and is likely to augment other efforts to reduce congestion and green house gas emissions.
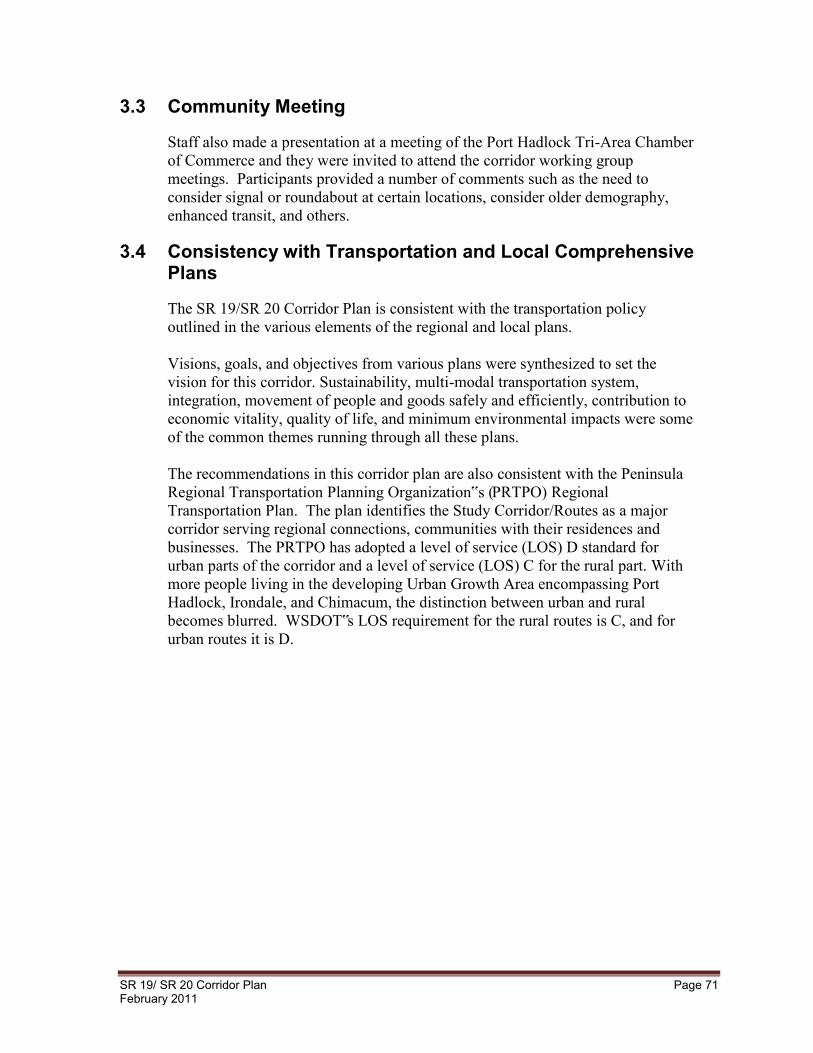
SR 19/ SR 20 Corridor Plan Page 71 February 2011
3.3 Community Meeting
Staff also made a presentation at a meeting of the Port Hadlock Tri-Area Chamber of Commerce and they were invited to attend the corridor working group meetings. Participants provided a number of comments such as the need to consider signal or roundabout at certain locations, consider older demography, enhanced transit, and others.
3.4 Consistency with Transportation and Local Comprehensive Plans
The SR 19/SR 20 Corridor Plan is consistent with the transportation policy outlined in the various elements of the regional and local plans. Visions, goals, and objectives from various plans were synthesized to set the vision for this corridor. Sustainability, multi-modal transportation system, integration, movement of people and goods safely and efficiently, contribution to economic vitality, quality of life, and minimum environmental impacts were some of the common themes running through all these plans. The recommendations in this corridor plan are also consistent with the Peninsula Regional Transportation Planning Organization‟s (PRTPO) Regional Transportation Plan. The plan identifies the Study Corridor/Routes as a major corridor serving regional connections, communities with their residences and businesses. The PRTPO has adopted a level of service (LOS) D standard for urban parts of the corridor and a level of service (LOS) C for the rural part. With more people living in the developing Urban Growth Area encompassing Port Hadlock, Irondale, and Chimacum, the distinction between urban and rural becomes blurred. WSDOT‟s LOS requirement for the rural routes is C, and for urban routes it is D.

Page 72 SR 19/ SR 20 Corridor Plan February 2011
3.5 Consistency with Washington Transportation Plan (WTP) and Highway System Plan (HSP)
The SR 19/SR 20 Corridor Plan is consistent with the goals established in the Washington Transportation Plan and supports the state‟s transportation policy goals:
Economic Vitality: to promote and develop transportation systems that
stimulate, support, and enhance the movement of people and goods to ensure a prosperous economy.
Preservation: to maintain, preserve and extend the life and utility of prior
investments in transportation systems and services;
Safety: to provide for and improve the safety and security of transportation customers and the transportation system;
Mobility: to improve the predictable movement of goods and people
throughout Washington state;
Environment: to enhance Washington‟s quality of life through transportation investments that promote energy conservation, enhance healthy communities, and protect the environment; and
Stewardship: to continuously improve the quality, effectiveness, and
efficiency of the transportation system. The recommended solutions set forth in this corridor plan are consistent with the action strategies and service objectives of the WTP and HSP. Specific recommendations from this corridor plan will be used to update the HSP.
SR 19/ SR 20 Corridor Plan Page 73 February 2011
CHAPTER 4
Stakeholder Recommendations
SR 19/ SR 20 Corridor Plan Page 75 February 2011
Chapter 4 Stakeholder Recommendations The vision for the SR 19/SR 20 corridor was adopted by the Corridor Working Group early in the study process. The vision calls for a sustainable multi-modal corridor that integrates the movement of people and goods safely and efficiently, enhances regional connections, and contributes to economic vitality and improves quality of life, with minimum environmental impacts. The stakeholders also established a set of criteria to evaluate and prioritize transportation improvement alternatives for the study corridor.
The WSDOT project team gathered data and conducted the required technical analyses. At each stage of the study, the project team presented data and analysis for the working group‟s review and input. This information was also shared with the public and input was collected. The project team presented information on collision history, environmental features, existing and future traffic conditions; reviewed access management; discussed potential programs to reduce single occupancy vehicles and reduce green house gas emissions; and presented other topics during the course of the study.
4.1 The Alternatives Considered Washington State Department of Transportation (WSDOT) staff divided the study corridor into six segments for the purposes of analysis and development of segment-specific recommendations. Each corridor segment has its own unique characteristics.
Public input was actively solicited at open houses. Comments, suggestions, and concerns received on comments card, by email, postal mail, and phone were collected and compiled. Stakeholder interviews and meetings also provided a good amount of information to the project team and the corridor working group. In addition, data analysis provided information on system performance issues and deficiencies. A review of collision history, traffic analysis to assess existing and future traffic conditions, inventory of environmental features, and other information were used to identify potential improvement options. Previous plans and studies also assisted in this effort.
Potential improvement options thus identified were mapped and listed by each segment and shared with the corridor working group and the public for further input. A few options were screened out by the working group as fatally flawed. Refinements to this list were made based on stakeholder and public input, and technical analyses.

Page 76 SR 19/ SR 20 Corridor Plan February 2011
4.2 Alternatives Evaluation and Scoring The Corridor Working Group (CWG) deliberated upon and adopted a Vision Statement for the corridor and an Alternatives Evaluation Criteria. These were based on goals and policies found in state, regional, and local plans and policies. The Vision Statement and Criteria were shared at two public meetings for public input. Public comments were incorporated into the final adopted version.
The Project Team evaluated and scored the potential improvement options by applying the criteria. The results and preliminary tiered recommendations were presented to the Corridor Working Group for discussion and input.
Alternative Evaluation Criteria
Safety Does the alternative address an identified or envisioned safety problem for
both the number and severity of collisions for people, motorcycles, cars, buses & trucks?
Does the alternative address an identified or envisioned safety problem for non-motorized travelers? How well does the alternative address ADA issues and support all transportation users?
Mobility Does the alternative address a capacity problem and meet LOS standards? Does the alternative reduce delay at intersections? Does the alternative improve movement of freight? Does the alternative improve non-motorized travel? Does the alternative balance mobility with access needs?
Feasibility What is the estimated cost of the alternative? How well does the community
favor the alternative? Does the alternative support development of an integrated system? Does the alternative impact, or have the potential to impact historic or
cultural resources?
Environmental Impact How will the alternative impact wetlands, steep slopes and other critical areas? Does the alternative reduce vehicle emissions? Will the alternative impact residential areas? Does the alternative impact business or affect access?
SR 19/ SR 20 Corridor Plan Page 77 February 2011
In order to apply the adopted evaluation criteria, the project team used the following measures of effectiveness (MOE). Technical analysis was conducted to measure and evaluate performance of over 70 potential improvement options by each of the 18 criteria. These were used in the evaluation scoring matrix.
Safety Safety (Societal Cost of Collisions) Safety for Non-Motorized Safety for ADA and all users
Congestion/Mobility Capacity (Maximum Sum of Critical Movements) Level of Service Delay Reduction (Vehicle-Hours in HCM- 10 min. max. ave wait) Delay Reduction (Vehicle-Hours in SimTraffic) Freight Movement (Truck) Mobility for Non-Motorized Mobility Access Balance
Feasibility/Constructability Estimated Cost (Planning Level Cost Estimate) Community Support Mode Integration Historic or Cultural Impacts
Environmental Impact Wetlands, steep slopes, other Vehicle Emission Reduction: Fuel Usage Residential Impacts (acres or square foot) Business Impacts (acres or square foot)
The evaluation methodology, together with evaluation criteria and scoring summary, are provided in Appendix H, Evaluation methodology.
The project team entered the evaluation and scoring results in an „Evaluation Scoring Matrix‟ (Appendix I). This matrix consists of information such as total scores, priority with all scores, description of the improvement options, tiered solution number, corridor segment number, location, existing configuration, and project issues.
The alternatives were given a priority ranking based on the total scores. The solutions were categorized by the Highway System Plan‟s tier concept. These tiers are described in the next section.
4.3 Recommendations The alternatives evaluation priority ranking results were presented before the Corridor Working Group at the third committee meeting on July 29, 2009. The project team
Page 78 SR 19/ SR 20 Corridor Plan February 2011
presented three projects that received the most public interest and also ranked high in the priority list of projects. The Corridor Working Group recommended adding others to the Projects of Special Interest list. Upon further consideration of stakeholder and public comments, the Corridor Working Group adopted the study recommendations at the final committee meeting on October 28, 2009. The recommendations were shared with the public for their input at the August 27, 2009 and November 19, 2009 Open Houses.
Projects of Special Interest
Through a stakeholder and public involvement process „Projects of Special Interest‟ were identified and adopted (Table 4-1 and Figure 4-1)). These projects resonated with the community and received the most interest and support.
The list of Projects of Special Interest were derived from recommendations developed for the six identified corridor segments through stakeholder and public input and through technical analysis and evaluation of improvement options using alternatives evaluation criteria adopted by the Corridor Working Group.
The recommendations were broken out by tiers and Transportation Demand Management (TDM) strategies. These are the Tier 1, Tier 2, Tier 3, and TDM lists of recommendations.
Tier 1 Recommendations
TIER 1 recommendations focus on low-cost projects that may deliver a high return on capital investment and have short delivery schedules (Table 4-2 and Figure 4-2). These include incident management, Intelligent Transportation System, access management, ramp modifications, turn lanes and intersection improvements.
Tier 2 Recommendations
TIER 2 recommendations focuses on moderate to higher cost improvements that reduce congestion on both highways and local roads (Table 4-3 and Figure 4-3). These include improvements to parallel corridors (including local roads), adding auxiliary lanes, and direct access ramps.
Tier 3 Recommendations
TIER 3 recommendations focuses on the highest-cost projects that can deliver corridor-wide benefits (Table 4-4 and Figure 4-4). These include adding general purpose lanes and interchange modifications. Transportation Demand Management (TDM) and Intelligent Transportation
Systems (ITS)
TDM is an umbrella term for strategies that reduce vehicle trips or shift use of the roadway to off peak periods (Table 4-5 and Figure 4-5). Intelligent Transportation Systems is the application of computers, communications & sensor technology to surface transportation.
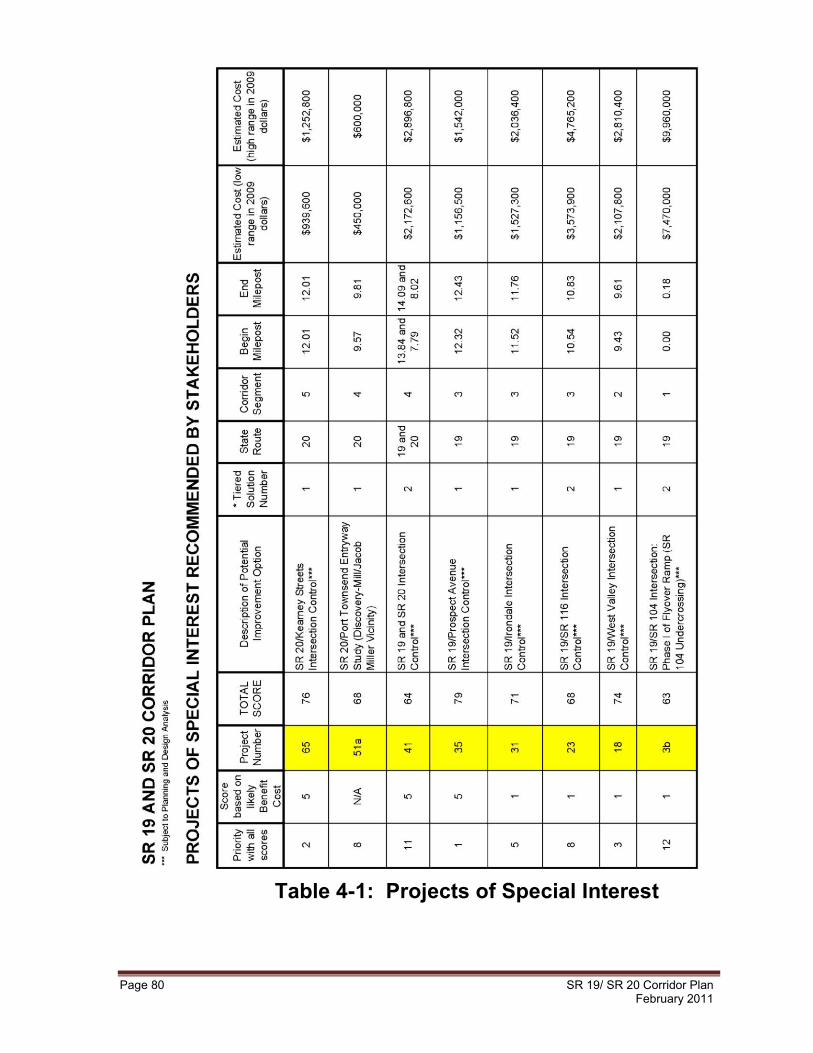
Page 80 SR 19/ SR 20 Corridor Plan February 2011
Table 4-1: Projects of Special Interest
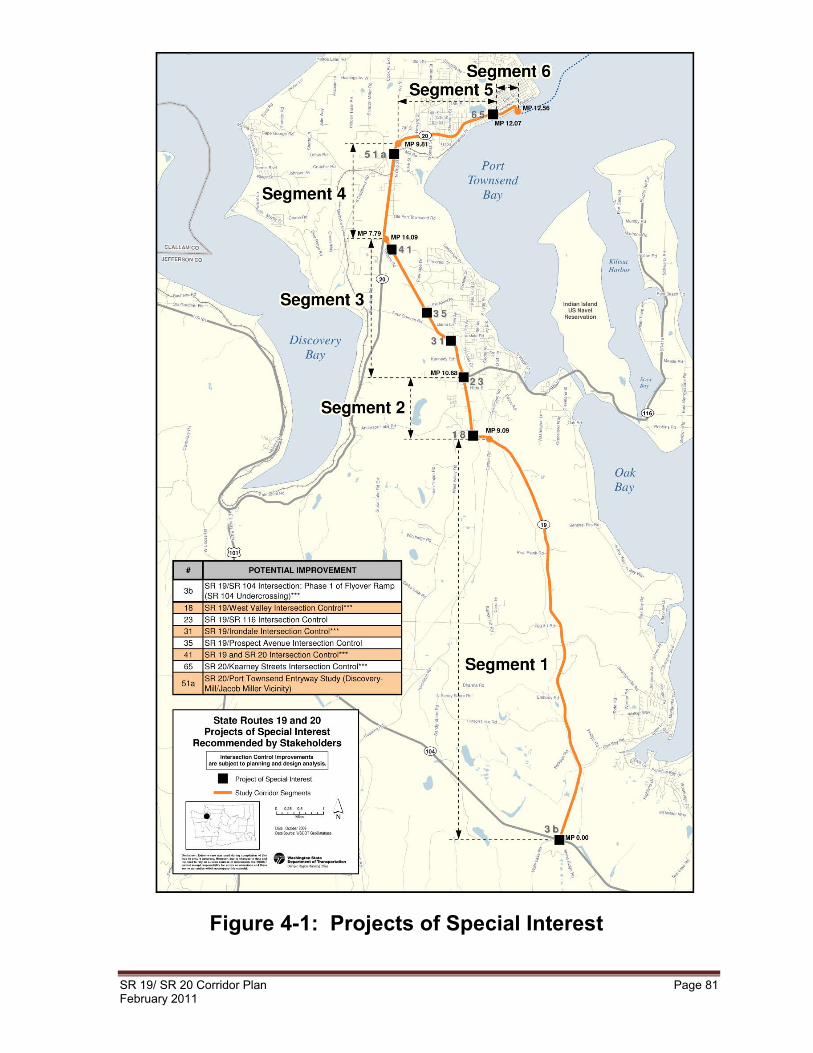
SR 19/ SR 20 Corridor Plan Page 81 February 2011
Figure 4-1: Projects of Special Interest
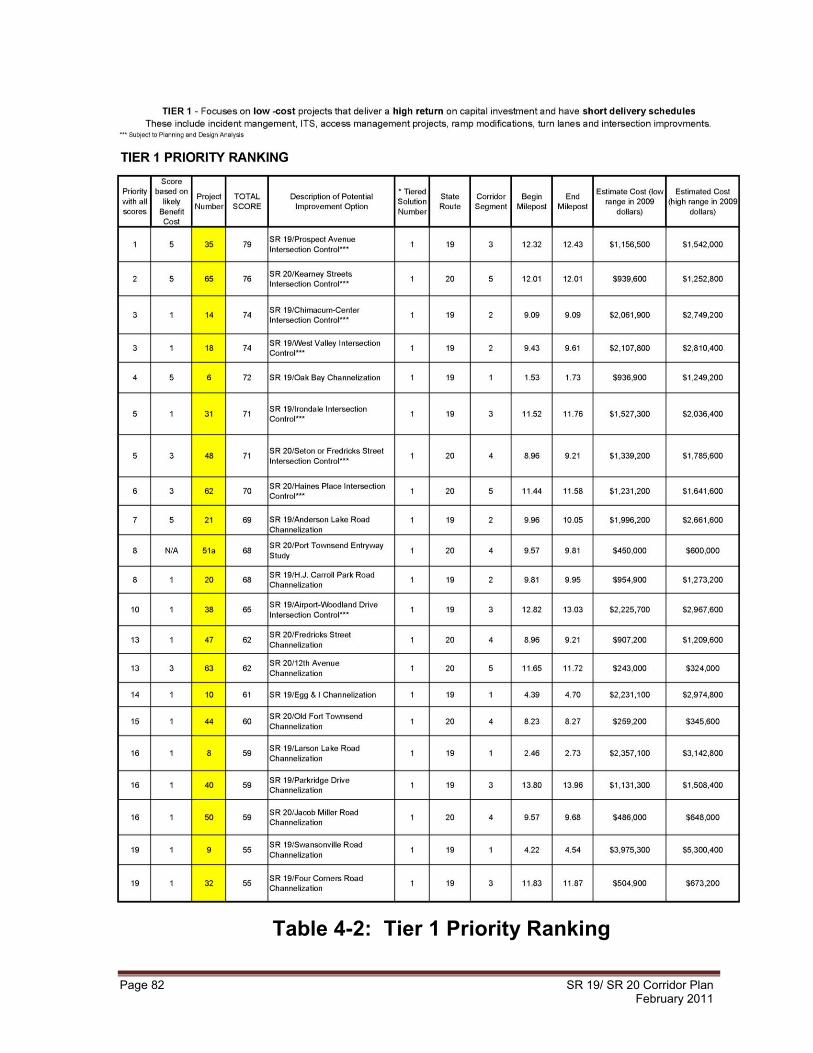
Page 82 SR 19/ SR 20 Corridor Plan February 2011
Table 4-2: Tier 1 Priority Ranking
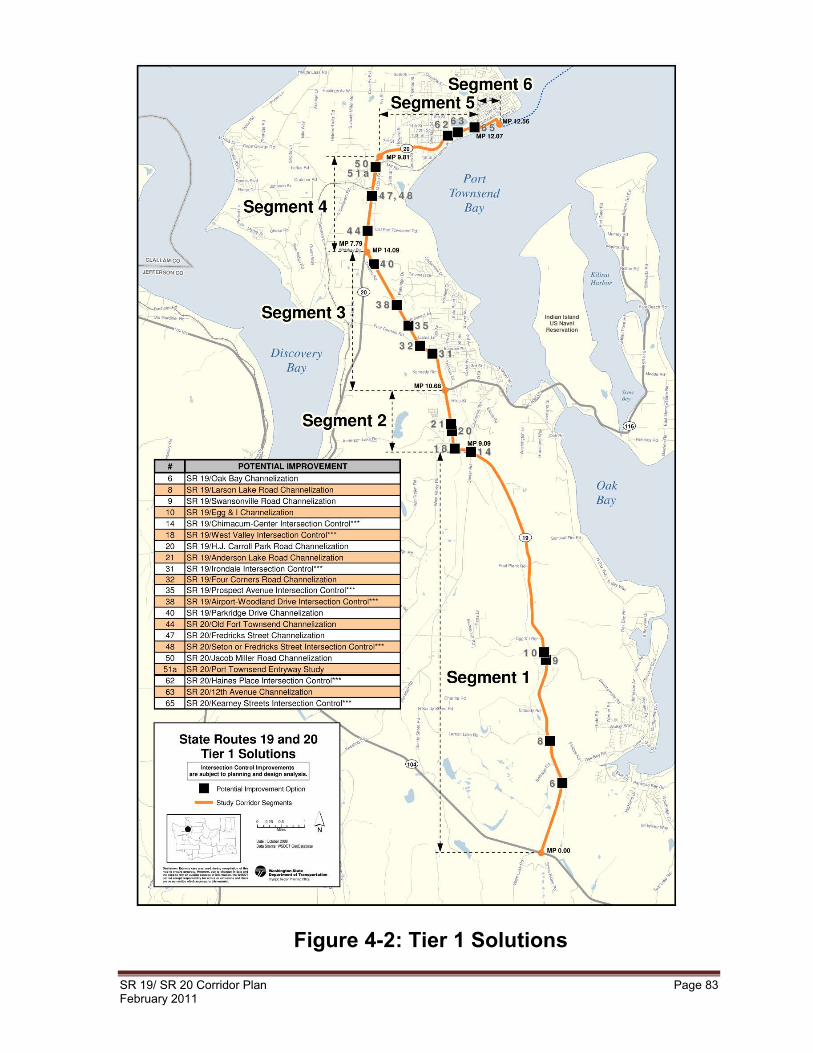
SR 19/ SR 20 Corridor Plan Page 83 February 2011
Figure 4-2: Tier 1 Solutions
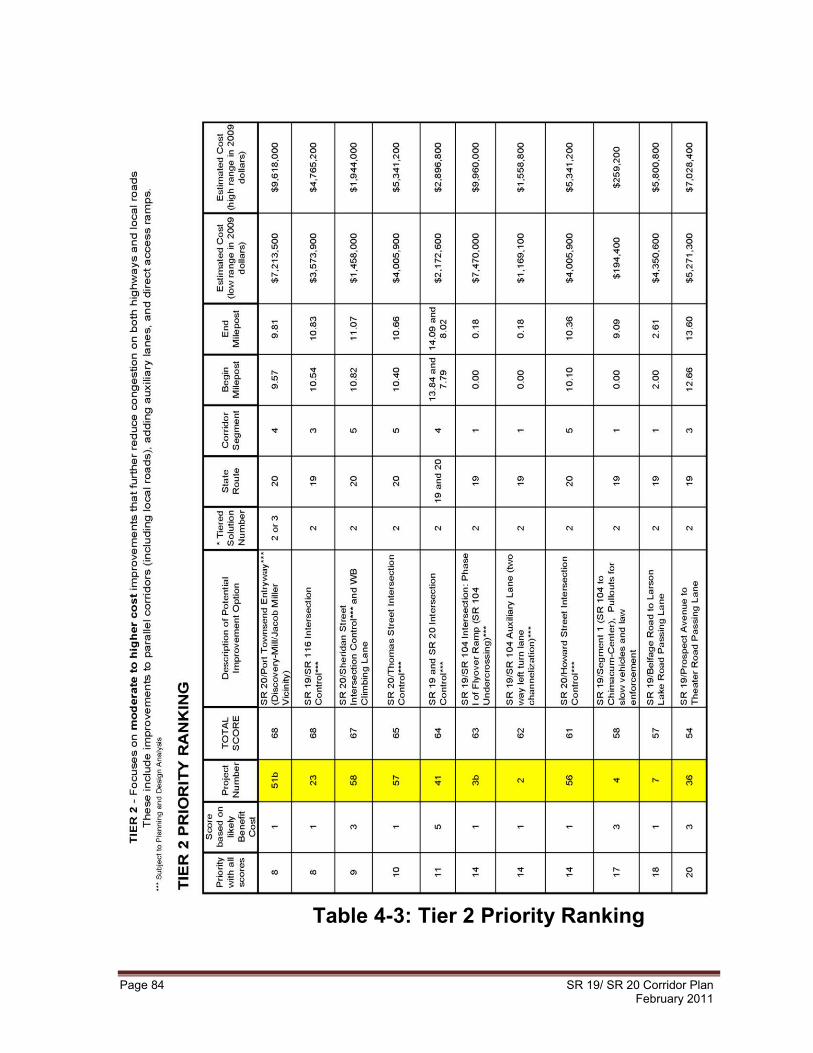
Page 84 SR 19/ SR 20 Corridor Plan February 2011
Table 4-3: Tier 2 Priority Ranking
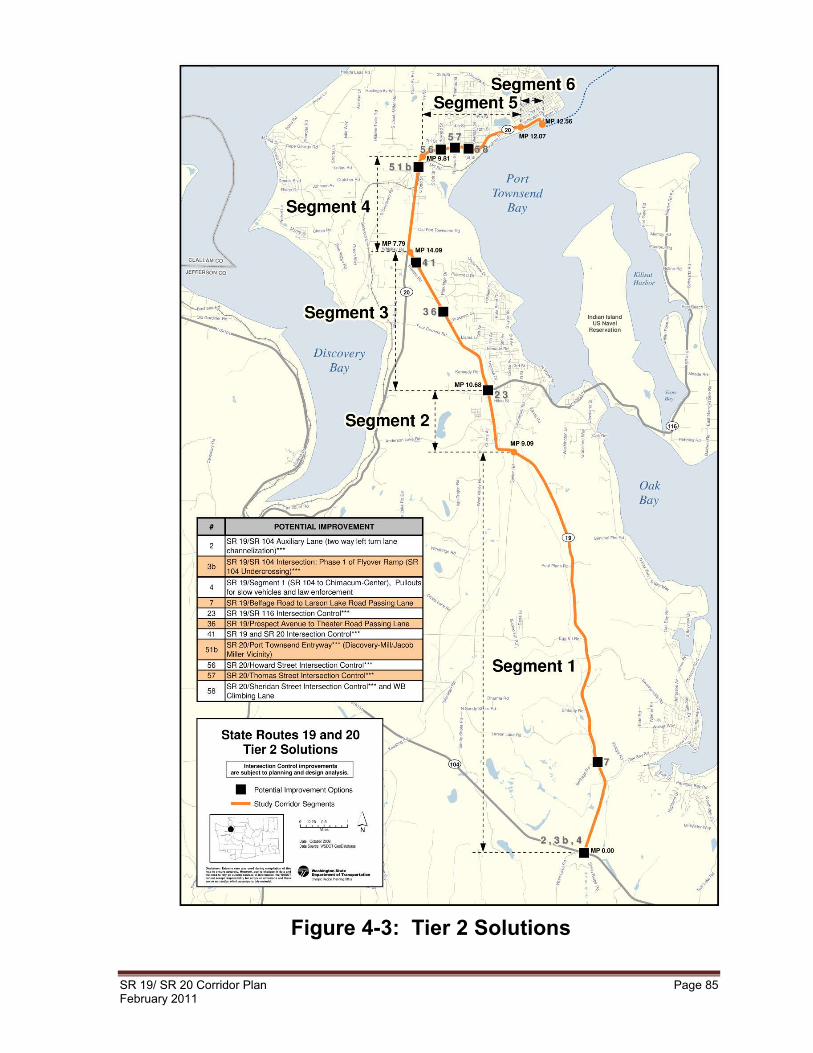
SR 19/ SR 20 Corridor Plan Page 85 February 2011
Figure 4-3: Tier 2 Solutions
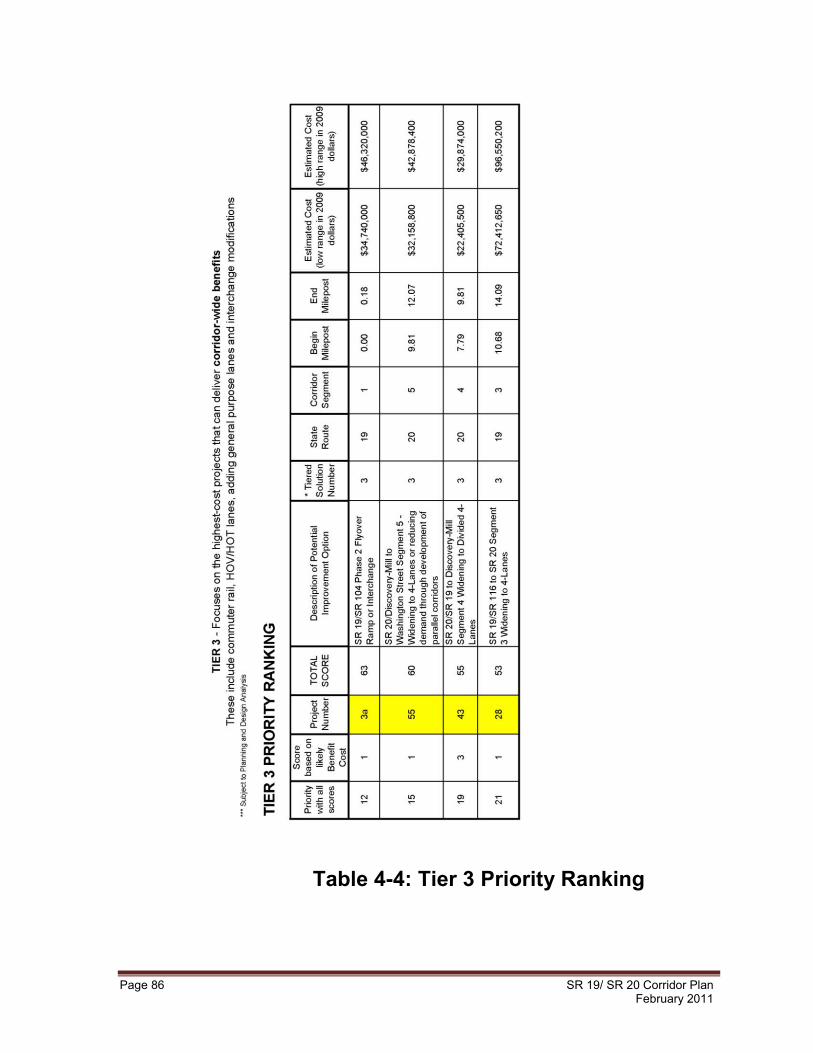
Page 86 SR 19/ SR 20 Corridor Plan February 2011
Table 4-4: Tier 3 Priority Ranking
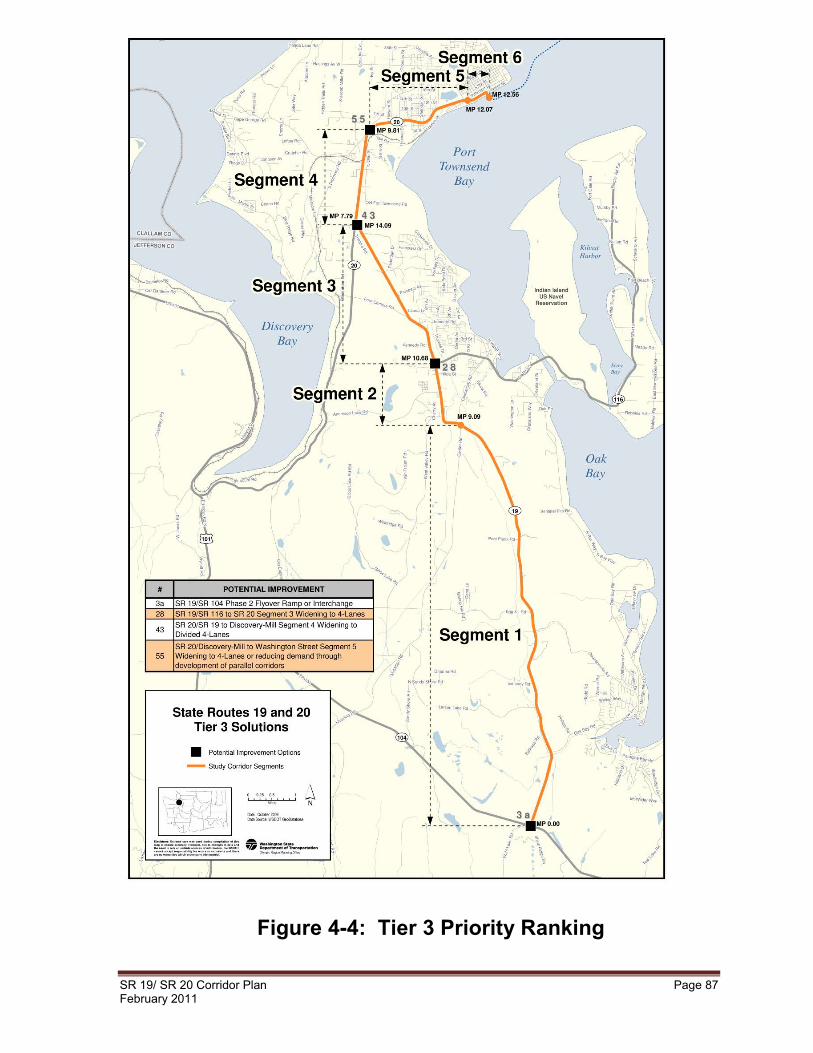
SR 19/ SR 20 Corridor Plan Page 87 February 2011
Figure 4-4: Tier 3 Priority Ranking
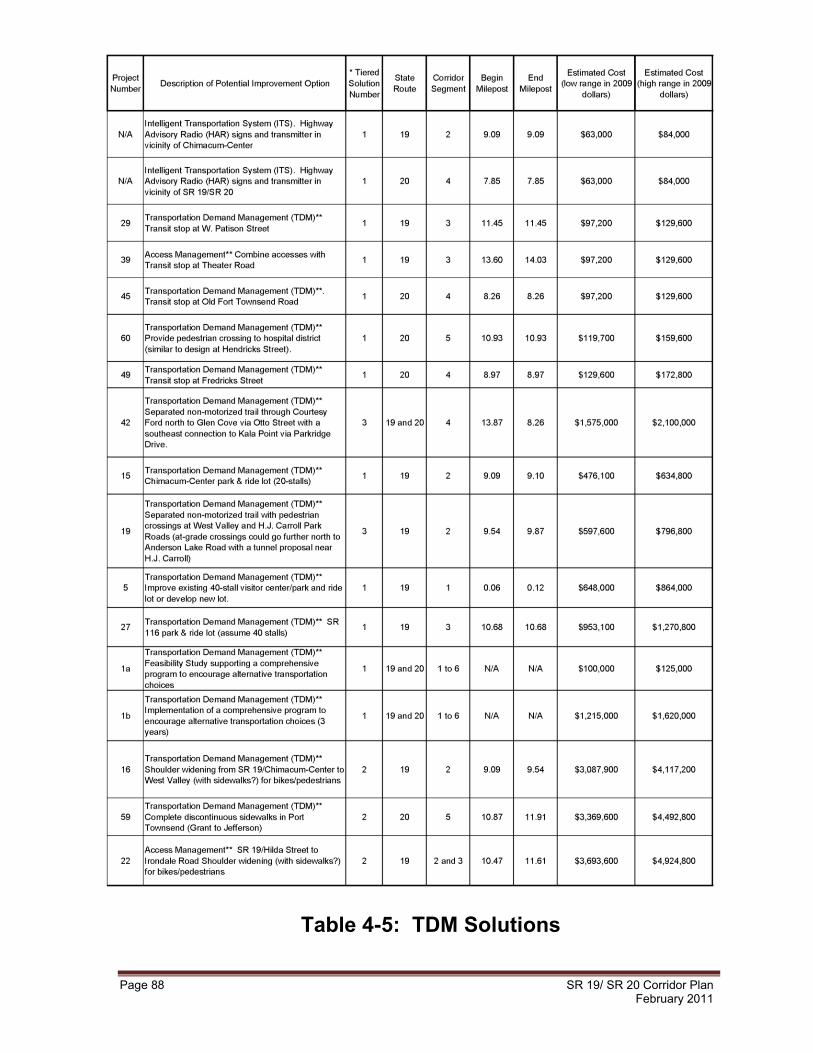
Page 88 SR 19/ SR 20 Corridor Plan February 2011
Figure 4-4: Tier 3 Solutions
Table 4-5: TDM Solutions
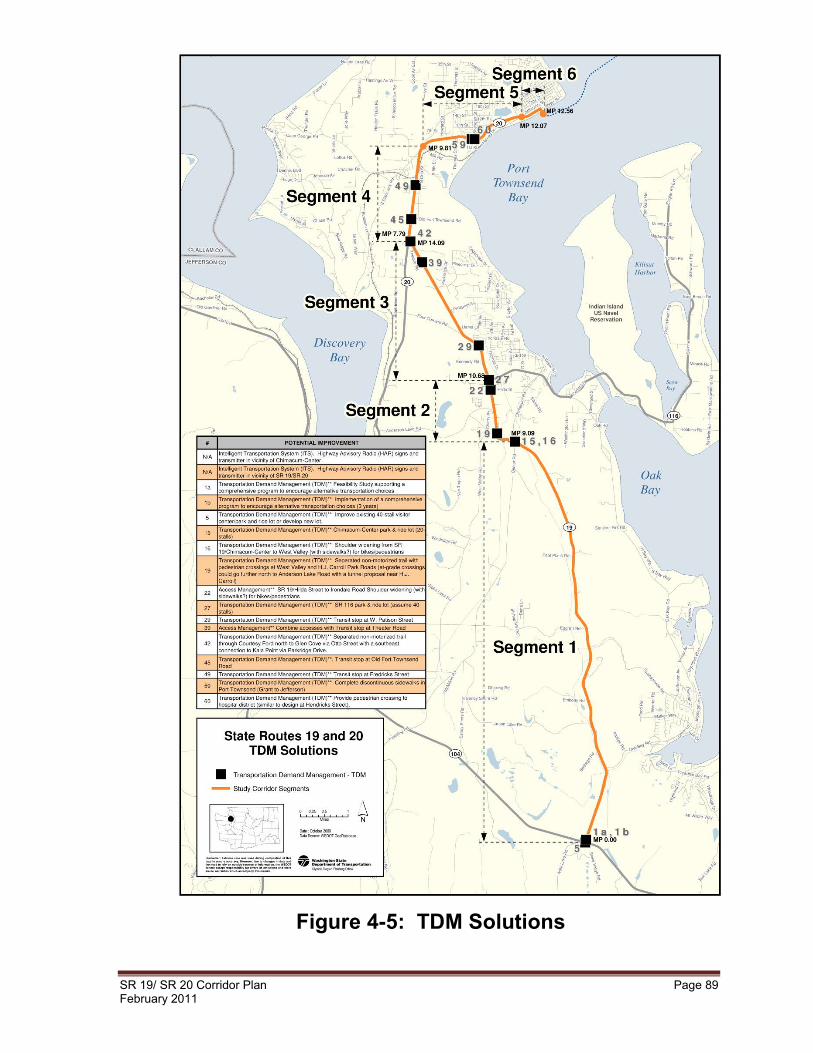
SR 19/ SR 20 Corridor Plan Page 89 February 2011
Figure 4-5: TDM Solutions
SR 19/ SR 20 Corridor Plan Page 91 February 2011
CHAPTER 5
Plan Implementation
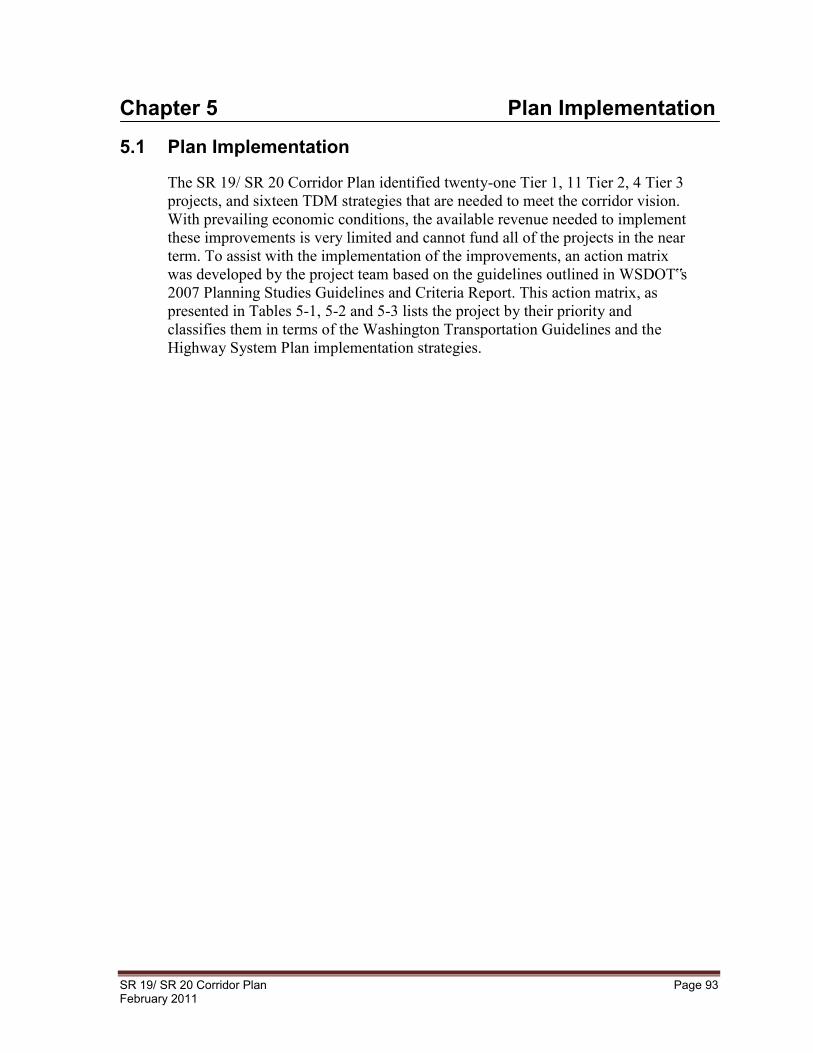
SR 19/ SR 20 Corridor Plan Page 93 February 2011
Chapter 5 Plan Implementation
5.1 Plan Implementation
The SR 19/ SR 20 Corridor Plan identified twenty-one Tier 1, 11 Tier 2, 4 Tier 3 projects, and sixteen TDM strategies that are needed to meet the corridor vision. With prevailing economic conditions, the available revenue needed to implement these improvements is very limited and cannot fund all of the projects in the near term. To assist with the implementation of the improvements, an action matrix was developed by the project team based on the guidelines outlined in WSDOT‟s 2007 Planning Studies Guidelines and Criteria Report. This action matrix, as presented in Tables 5-1, 5-2 and 5-3 lists the project by their priority and classifies them in terms of the Washington Transportation Guidelines and the Highway System Plan implementation strategies.
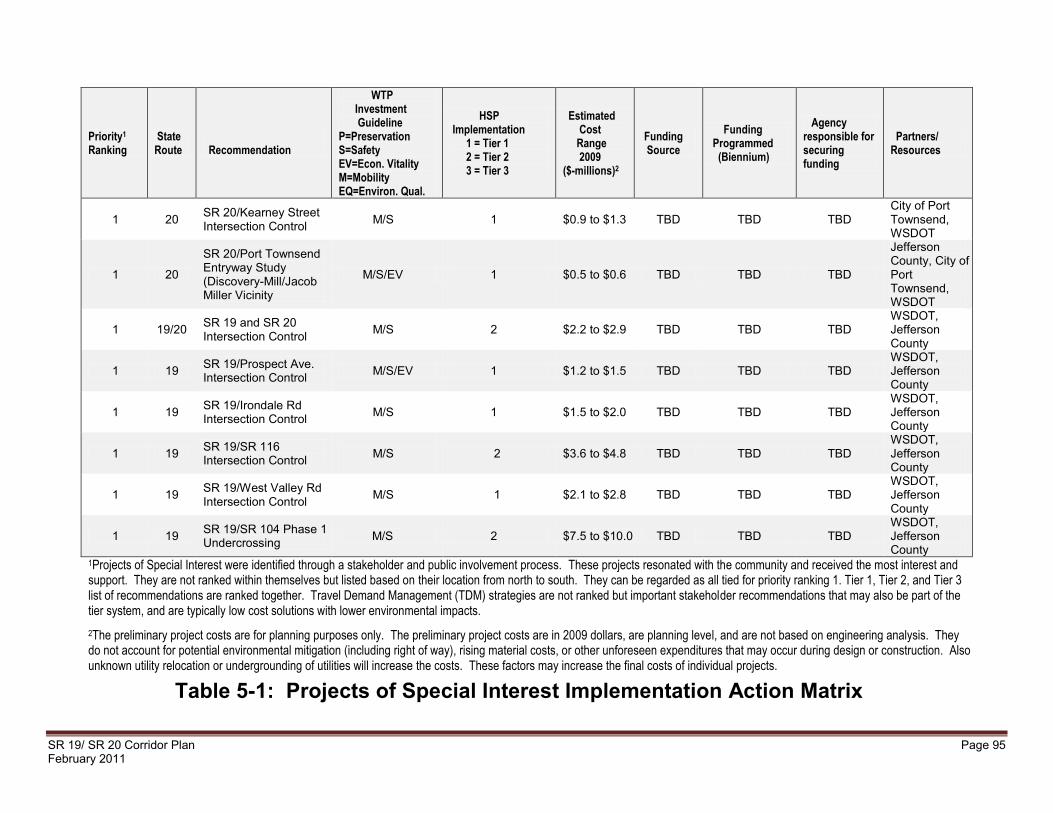
SR 19/ SR 20 Corridor Plan Page 95 February 2011
Table 5-1: Projects of Special Interest Implementation Action Matrix
Priority1 Ranking
State Route
Recommendation
WTP Investment Guideline P=Preservation S=Safety EV=Econ. Vitality M=Mobility EQ=Environ. Qual.
HSP Implementation 1 = Tier 1 2 = Tier 2 3 = Tier 3
Estimated Cost Range 2009 ($-millions)2
Funding Source
Funding Programmed (Biennium)
Agency responsible for securing funding
Partners/ Resources
1 20 SR 20/Kearney Street Intersection Control M/S 1 $0.9 to $1.3 TBD TBD TBD
City of Port Townsend, WSDOT
1 20
SR 20/Port Townsend Entryway Study (Discovery-Mill/Jacob Miller Vicinity
M/S/EV 1 $0.5 to $0.6 TBD TBD TBD
Jefferson County, City of Port Townsend, WSDOT
1 19/20 SR 19 and SR 20 Intersection Control M/S 2 $2.2 to $2.9 TBD TBD TBD
WSDOT, Jefferson County
1 19 SR 19/Prospect Ave. Intersection Control M/S/EV 1 $1.2 to $1.5 TBD TBD TBD
WSDOT, Jefferson County
1 19 SR 19/Irondale Rd Intersection Control M/S 1 $1.5 to $2.0 TBD TBD TBD
WSDOT, Jefferson County
1 19 SR 19/SR 116 Intersection Control
M/S
2 $3.6 to $4.8 TBD TBD TBD WSDOT, Jefferson County
1 19 SR 19/West Valley Rd Intersection Control M/S 1 $2.1 to $2.8 TBD TBD TBD
WSDOT, Jefferson County
1 19 SR 19/SR 104 Phase 1 Undercrossing M/S 2 $7.5 to $10.0 TBD TBD TBD
WSDOT, Jefferson County
1Projects of Special Interest were identified through a stakeholder and public involvement process. These projects resonated with the community and received the most interest and support. They are not ranked within themselves but listed based on their location from north to south. They can be regarded as all tied for priority ranking 1. Tier 1, Tier 2, and Tier 3 list of recommendations are ranked together. Travel Demand Management (TDM) strategies are not ranked but important stakeholder recommendations that may also be part of the tier system, and are typically low cost solutions with lower environmental impacts.
2The preliminary project costs are for planning purposes only. The preliminary project costs are in 2009 dollars, are planning level, and are not based on engineering analysis. They do not account for potential environmental mitigation (including right of way), rising material costs, or other unforeseen expenditures that may occur during design or construction. Also unknown utility relocation or undergrounding of utilities will increase the costs. These factors may increase the final costs of individual projects.

Page 96 SR 19/ SR 20 Corridor Plan February 2011
Table 5-2: Tier 1, 2, & 3 Implementation Action Matrix Page 1 of 4
Priority1 Ranking for Tier 1, 2, & 3 (Priority with all scores)
State Route
Recommendation
WTP Investment Guideline P=Preservation S=Safety EV=Econ. Vitality M=Mobility EQ=Environ. Qual.
HSP Implementation 1 = Tier 1 2 = Tier 2 3 = Tier 3
Estimated Cost Range 2009 ($-millions)2
Funding Source
Funding Programmed (Biennium)
Agency responsible for securing funding
Partners/ Resources
1 (1) 19 SR 19/Prospect Ave Intersection Control M/S/EV 1 $1.2 to $1.5 TBD TBD TBD
WSDOT, Jefferson County
2 (2) 20 SR 20/Kearney Streets Intersection Control M/S 1 $0.9 to $1.3 TBD TBD TBD
WSDOT, City of Port Townsend
3 (3) 19 SR 19/Chimacum-Center Intersection Control
M/S 1 $2.1 to $2.7 TBD TBD TBD WSDOT, Jefferson County
4 (3) 19 SR 19/West Valley Rd Intersection Control M/S 1 $2.1 to $2.8 TBD TBD TBD
WSDOT, Jefferson County
5 (4) 19 SR 19/Oak Bay Road Channelization M/S 1 $0.9 to $1.2 TBD TBD TBD
WSDOT, Jefferson County
6 (5) 19 SR 19/Irondale Road Intersection Control
M/S
1 $1.5 to $2.0 TBD TBD TBD WSDOT, Jefferson County
7 (5) 20 SR 20/Seton or Fredricks Street Intersection Control
M/S/EV 1 $1.3 to $1.8 TBD TBD TBD WSDOT, Jefferson County
8 (6) 20 SR 20/Haines Place Intersection Control M/S 1 $1.2 to $1.6 TBD TBD TBD
WSDOT, City of Port Townsend
9 (7)
19 SR 19/Anderson Lake
Channelization M/S 1 $2.0 to $2.7 TBD TBD TBD
WSDOT, Jefferson County
10 (8) 20 SR 20/Port Townsend Entryway Study M/S/EV 1 $0.4 to $0.6 TBD TBD TBD
WSDOT, City of Port Townsend, Jefferson County
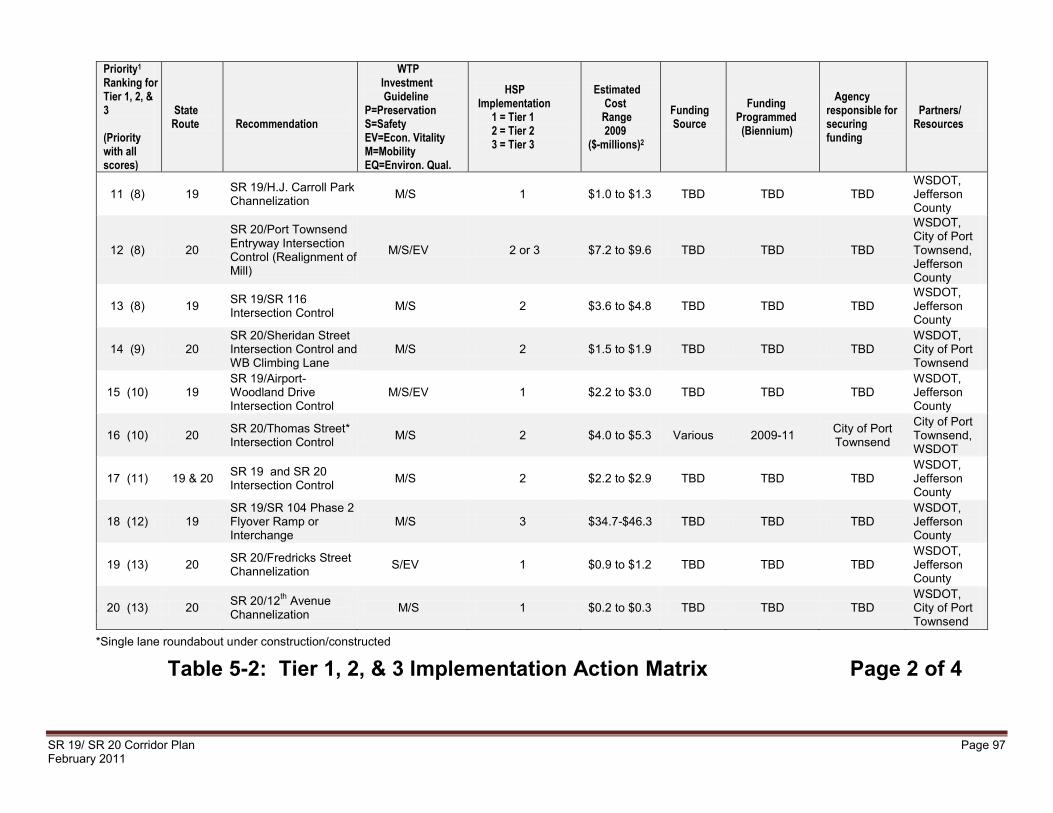
SR 19/ SR 20 Corridor Plan Page 97 February 2011
***Single lane roundabout under construction/constructed
Table 5-2: Tier 1, 2, & 3 Implementation Action Matrix Page 2 of 4
Priority1 Ranking for Tier 1, 2, & 3 (Priority with all scores)
State Route
Recommendation
WTP Investment Guideline P=Preservation S=Safety EV=Econ. Vitality M=Mobility EQ=Environ. Qual.
HSP Implementation 1 = Tier 1 2 = Tier 2 3 = Tier 3
Estimated Cost Range 2009 ($-millions)2
Funding Source
Funding Programmed (Biennium)
Agency responsible for securing funding
Partners/ Resources
11 (8) 19 SR 19/H.J. Carroll Park Channelization M/S 1 $1.0 to $1.3 TBD TBD TBD
WSDOT, Jefferson County
12 (8) 20
SR 20/Port Townsend Entryway Intersection Control (Realignment of Mill)
M/S/EV 2 or 3 $7.2 to $9.6 TBD TBD TBD
WSDOT, City of Port Townsend, Jefferson County
13 (8) 19 SR 19/SR 116 Intersection Control M/S 2 $3.6 to $4.8 TBD TBD TBD
WSDOT, Jefferson County
14 (9) 20 SR 20/Sheridan Street Intersection Control and WB Climbing Lane
M/S 2 $1.5 to $1.9 TBD TBD TBD WSDOT, City of Port Townsend
15 (10) 19 SR 19/Airport-Woodland Drive Intersection Control
M/S/EV 1 $2.2 to $3.0 TBD TBD TBD WSDOT, Jefferson County
16 (10) 20 SR 20/Thomas Street* Intersection Control M/S 2 $4.0 to $5.3 Various 2009-11 City of Port
Townsend
City of Port Townsend, WSDOT
17 (11) 19 & 20 SR 19 and SR 20 Intersection Control M/S 2 $2.2 to $2.9 TBD TBD TBD
WSDOT, Jefferson County
18 (12) 19 SR 19/SR 104 Phase 2 Flyover Ramp or Interchange
M/S 3 $34.7-$46.3 TBD TBD TBD WSDOT, Jefferson County
19 (13) 20 SR 20/Fredricks Street Channelization S/EV 1 $0.9 to $1.2 TBD TBD TBD
WSDOT, Jefferson County
20 (13) 20 SR 20/12th Avenue Channelization M/S 1 $0.2 to $0.3 TBD TBD TBD
WSDOT, City of Port Townsend
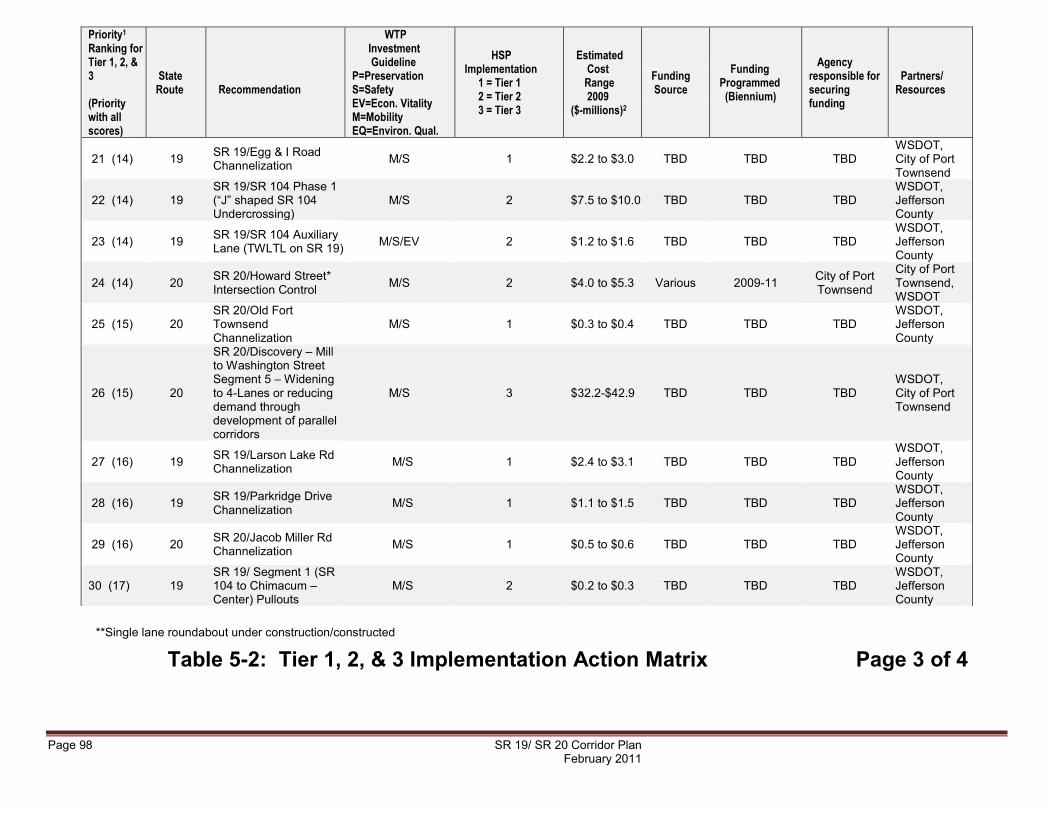
Page 98 SR 19/ SR 20 Corridor Plan February 2011
**Single lane roundabout under construction/constructed
Table 5-2: Tier 1, 2, & 3 Implementation Action Matrix Page 3 of 4
Priority1 Ranking for Tier 1, 2, & 3 (Priority with all scores)
State Route
Recommendation
WTP Investment Guideline P=Preservation S=Safety EV=Econ. Vitality M=Mobility EQ=Environ. Qual.
HSP Implementation 1 = Tier 1 2 = Tier 2 3 = Tier 3
Estimated Cost Range 2009 ($-millions)2
Funding Source
Funding Programmed (Biennium)
Agency responsible for securing funding
Partners/ Resources
21 (14) 19 SR 19/Egg & I Road Channelization M/S 1 $2.2 to $3.0 TBD TBD TBD
WSDOT, City of Port Townsend
22 (14) 19 SR 19/SR 104 Phase 1 (“J” shaped SR 104 Undercrossing)
M/S 2 $7.5 to $10.0 TBD TBD TBD WSDOT, Jefferson County
23 (14) 19 SR 19/SR 104 Auxiliary Lane (TWLTL on SR 19) M/S/EV 2 $1.2 to $1.6 TBD TBD TBD
WSDOT, Jefferson County
24 (14) 20 SR 20/Howard Street* Intersection Control M/S 2 $4.0 to $5.3 Various 2009-11 City of Port
Townsend
City of Port Townsend, WSDOT
25 (15) 20 SR 20/Old Fort Townsend Channelization
M/S 1 $0.3 to $0.4 TBD TBD TBD WSDOT, Jefferson County
26 (15) 20
SR 20/Discovery – Mill to Washington Street Segment 5 – Widening to 4-Lanes or reducing demand through development of parallel corridors
M/S 3 $32.2-$42.9 TBD TBD TBD WSDOT, City of Port Townsend
27 (16) 19 SR 19/Larson Lake Rd Channelization M/S 1 $2.4 to $3.1 TBD TBD TBD
WSDOT, Jefferson County
28 (16) 19 SR 19/Parkridge Drive Channelization M/S 1 $1.1 to $1.5 TBD TBD TBD
WSDOT, Jefferson County
29 (16) 20 SR 20/Jacob Miller Rd Channelization M/S 1 $0.5 to $0.6 TBD TBD TBD
WSDOT, Jefferson County
30 (17) 19 SR 19/ Segment 1 (SR 104 to Chimacum – Center) Pullouts
M/S 2 $0.2 to $0.3 TBD TBD TBD WSDOT, Jefferson County

SR 19/ SR 20 Corridor Plan Page 99 February 2011
Table 5-2: Tier 1, 2, & 3 Implementation Action Matrix Page 4 of 4
Priority1 Ranking for Tier 1, 2, & 3 (Priority with all scores)
State Route
Recommendation
WTP Investment Guideline P=Preservation S=Safety EV=Econ. Vitality M=Mobility EQ=Environ. Qual.
HSP Implementation 1 = Tier 1 2 = Tier 2 3 = Tier 3
Estimated Cost Range 2009 ($-millions)2
Funding Source
Funding Programmed (Biennium)
Agency responsible for securing funding
Partners/ Resources
0.45 19
SR 19/Belfage Road to Larson Lake Road Passing Lane
M/S 2 $4.4 to $5.8 TBD TBD TBD WSDOT, Jefferson County
32 (19) 19 SR 19/Swansonville Rd Channelization M/S 1 $4.0 to $5.3 TBD TBD TBD
WSDOT, Jefferson County
33 (19) 19 SR 19/Four Corners Rd Channelization M/S 1 $0.5 to $0.7 TBD TBD TBD
WSDOT, Jefferson County
34 (19) 20
SR 20/SR 19 to Discovery – Mill Segment 4 Widening to Divided 4-Lanes
M/S 3 $22.4-$29.9 TBD TBD TBD WSDOT, Jefferson County
35 (20) 19 SR 19/Prospect Avenue to Theater Road Passing Lane
M/S 2 $5.3 to $7.0 TBD TBD TBD WSDOT, Jefferson County
36 (21) 19 SR 19/SR 116 to SR 20 Segment 3 Widening to 4-Lanes
M/S 3 $72.4-$96.6 TBD TBD TBD WSDOT, Jefferson County
1Tiered recommendations are also ranked separately. Thus Tier 1 has a priority ranking 1 project, Tier 2 has a priority ranking 1 project, and so too for Tier 3. Travel Demand Management (TDM) projects are not ranked but important stakeholder recommendations that may also be part of the tier system, and are typically low cost solutions with lower environmental projects.
2The preliminary project costs are for planning purposes only. The preliminary project costs are in 2009 dollars, are planning level, and are not based on engineering analysis. They do not account for potential environmental mitigation (including right of way), rising material costs, or other unforeseen expenditures that may occur during design or construction. Also unknown utility relocation or undergrounding of utilities will increase the costs. These factors may increase the final costs of individual projects.
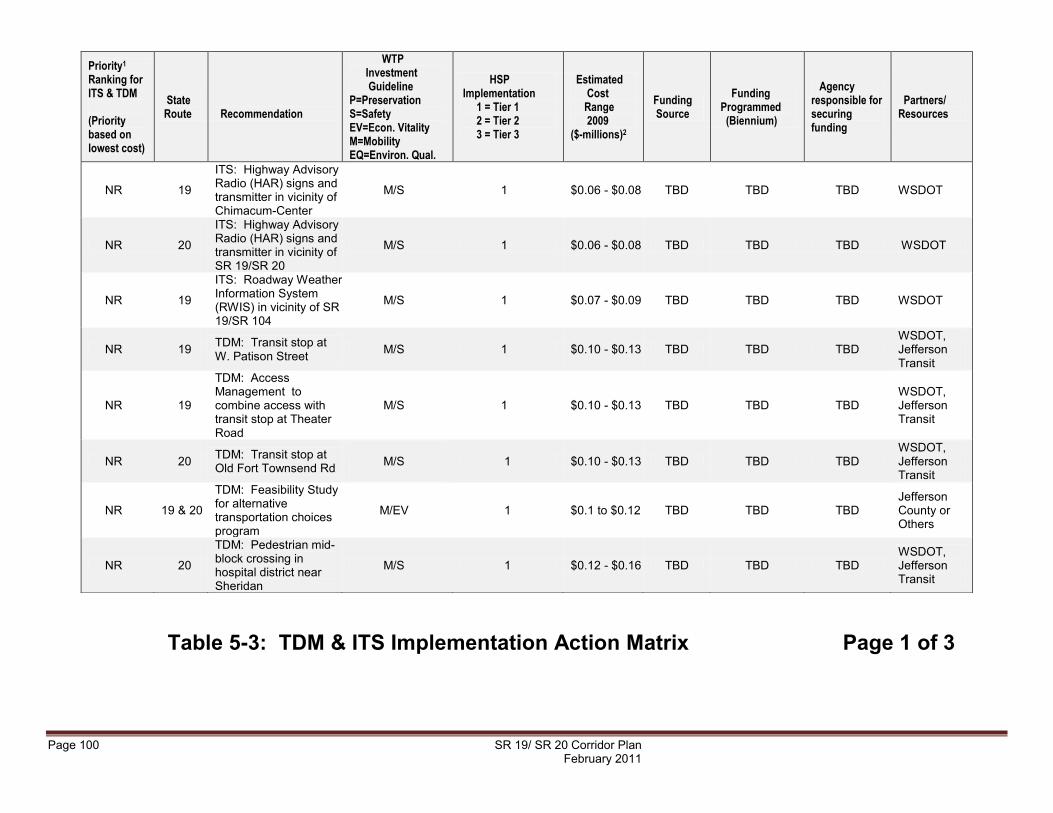
Page 100 SR 19/ SR 20 Corridor Plan February 2011
Table 5-3: TDM & ITS Implementation Action Matrix Page 1 of 3
Priority1 Ranking for ITS & TDM (Priority based on lowest cost)
State Route
Recommendation
WTP Investment Guideline P=Preservation S=Safety EV=Econ. Vitality M=Mobility EQ=Environ. Qual.
HSP Implementation 1 = Tier 1 2 = Tier 2 3 = Tier 3
Estimated Cost Range 2009 ($-millions)2
Funding Source
Funding Programmed (Biennium)
Agency responsible for securing funding
Partners/ Resources
NR 19
ITS: Highway Advisory Radio (HAR) signs and transmitter in vicinity of Chimacum-Center
M/S 1 $0.06 - $0.08 TBD TBD TBD WSDOT
NR 20
ITS: Highway Advisory Radio (HAR) signs and transmitter in vicinity of SR 19/SR 20
M/S 1 $0.06 - $0.08 TBD TBD TBD WSDOT
NR 19
ITS: Roadway Weather Information System (RWIS) in vicinity of SR 19/SR 104
M/S 1 $0.07 - $0.09 TBD TBD TBD WSDOT
NR 19 TDM: Transit stop at W. Patison Street M/S 1 $0.10 - $0.13 TBD TBD TBD
WSDOT, Jefferson Transit
NR 19
TDM: Access Management to combine access with transit stop at Theater Road
M/S 1 $0.10 - $0.13 TBD TBD TBD WSDOT, Jefferson Transit
NR 20 TDM: Transit stop at Old Fort Townsend Rd
M/S
1 $0.10 - $0.13 TBD TBD TBD WSDOT, Jefferson Transit
NR 19 & 20
TDM: Feasibility Study for alternative transportation choices program
M/EV 1 $0.1 to $0.12 TBD TBD TBD Jefferson County or Others
NR 20
TDM: Pedestrian mid-block crossing in hospital district near Sheridan
M/S 1 $0.12 - $0.16 TBD TBD TBD WSDOT, Jefferson Transit
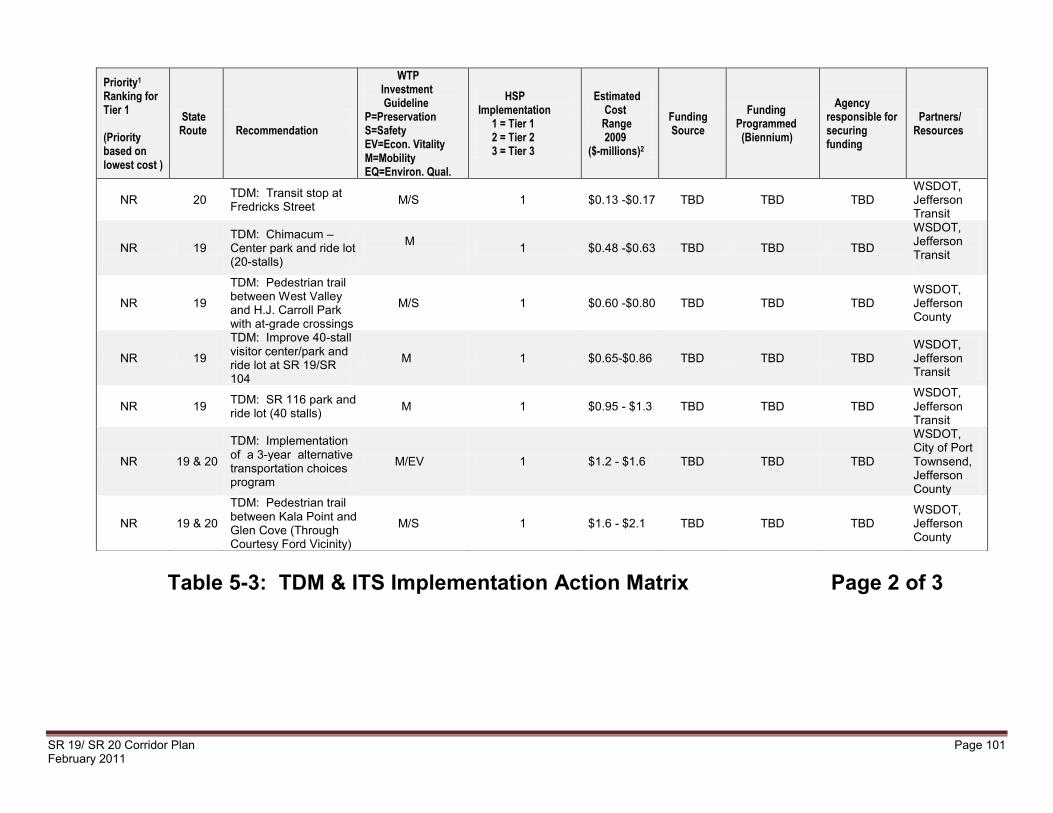
SR 19/ SR 20 Corridor Plan Page 101 February 2011
Table 5-3: TDM & ITS Implementation Action Matrix Page 2 of 3
Priority1 Ranking for Tier 1 (Priority based on lowest cost )
State Route
Recommendation
WTP Investment Guideline P=Preservation S=Safety EV=Econ. Vitality M=Mobility EQ=Environ. Qual.
HSP Implementation 1 = Tier 1 2 = Tier 2 3 = Tier 3
Estimated Cost Range 2009 ($-millions)2
Funding Source
Funding Programmed (Biennium)
Agency responsible for securing funding
Partners/ Resources
NR 20 TDM: Transit stop at Fredricks Street M/S 1 $0.13 -$0.17 TBD TBD TBD
WSDOT, Jefferson Transit
NR
19
TDM: Chimacum – Center park and ride lot (20-stalls)
M 1 $0.48 -$0.63 TBD TBD TBD
WSDOT, Jefferson Transit
NR 19
TDM: Pedestrian trail between West Valley and H.J. Carroll Park with at-grade crossings
M/S 1 $0.60 -$0.80 TBD TBD TBD WSDOT, Jefferson County
NR 19
TDM: Improve 40-stall visitor center/park and ride lot at SR 19/SR 104
M 1 $0.65-$0.86 TBD TBD TBD WSDOT, Jefferson Transit
NR 19 TDM: SR 116 park and ride lot (40 stalls) M 1 $0.95 - $1.3 TBD TBD TBD
WSDOT, Jefferson Transit
NR 19 & 20
TDM: Implementation of a 3-year alternative transportation choices program
M/EV 1 $1.2 - $1.6 TBD TBD TBD
WSDOT, City of Port Townsend, Jefferson County
NR 19 & 20
TDM: Pedestrian trail between Kala Point and Glen Cove (Through Courtesy Ford Vicinity)
M/S 1 $1.6 - $2.1 TBD TBD TBD WSDOT, Jefferson County
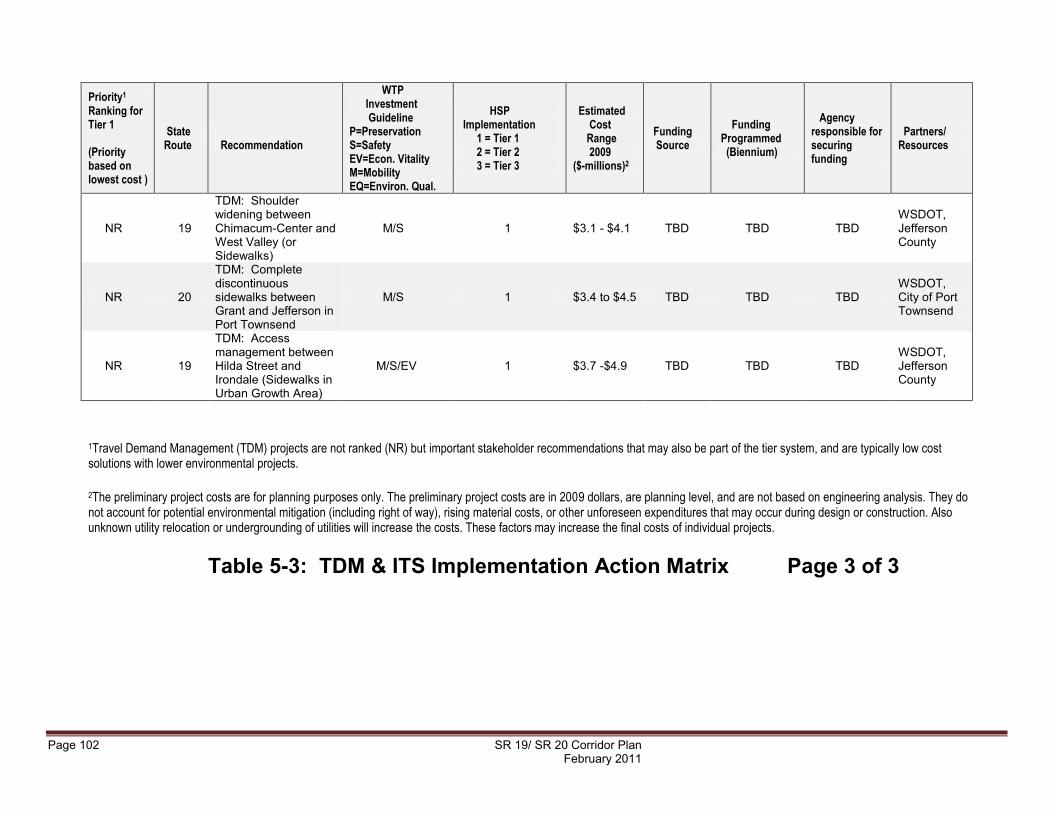
Page 102 SR 19/ SR 20 Corridor Plan February 2011
Priority1 Ranking for Tier 1 (Priority based on lowest cost )
State Route
Recommendation
WTP Investment Guideline P=Preservation S=Safety EV=Econ. Vitality M=Mobility EQ=Environ. Qual.
HSP Implementation 1 = Tier 1 2 = Tier 2 3 = Tier 3
Estimated Cost Range 2009 ($-millions)2
Funding Source
Funding Programmed (Biennium)
Agency responsible for securing funding
Partners/ Resources
NR 19
TDM: Shoulder widening between Chimacum-Center and West Valley (or Sidewalks)
M/S 1 $3.1 - $4.1 TBD TBD TBD WSDOT, Jefferson County
NR 20
TDM: Complete discontinuous sidewalks between Grant and Jefferson in Port Townsend
M/S 1 $3.4 to $4.5 TBD TBD TBD WSDOT, City of Port Townsend
NR 19
TDM: Access management between Hilda Street and Irondale (Sidewalks in Urban Growth Area)
M/S/EV 1 $3.7 -$4.9 TBD TBD TBD WSDOT, Jefferson County
1Travel Demand Management (TDM) projects are not ranked (NR) but important stakeholder recommendations that may also be part of the tier system, and are typically low cost solutions with lower environmental projects.
2The preliminary project costs are for planning purposes only. The preliminary project costs are in 2009 dollars, are planning level, and are not based on engineering analysis. They do not account for potential environmental mitigation (including right of way), rising material costs, or other unforeseen expenditures that may occur during design or construction. Also unknown utility relocation or undergrounding of utilities will increase the costs. These factors may increase the final costs of individual projects.
Table 5-3: TDM & ITS Implementation Action Matrix Page 3 of 3
SR 19/ SR 20 Corridor Plan Page 103 February 2011
5.2 Highway System Plan
The Washington State Highway System Plan (HSP) is the state highway component of the Washington State Multimodal Transportation Plan (SMTP). The SMTP is the state's overall transportation plan that will include an analysis of facilities the state owns and those in which the state has an interest. The HSP is updated every two years and serves as the basis for the six-year highway program and the two-year biennial budget request to the State Legislature. WSDOT is dedicated to delivering an HSP that implements the Legislature's goals. This is accomplished through the coordination and integration of specific components from many statewide modal and program plans. The HSP is also aligned to the Washington Transportation Plan (WTP), which outlines the policies adopted by the Washington State Transportation Commission. This corridor plan is meant to update, support and help refine the highway system plan.
5.3 Developer Participation
Developers can participate in improvements to mitigate impacts on a pro-rata share basis (rough proportion based upon new traffic added) if there is a project programmed within 6-years. When a development would degrade a facility‟s LOS below an applicable threshold, the facility would be considered deficient to support the development, and WSDOT and its partners would seek mitigation of traffic impacts. Mitigation can take the form of development constraints (for example, the appropriate placement of highway access points), developer constructed transportation improvements, or developer financial contribution to transportation improvements constructed by others. The plan recommendations provide possible improvements along the corridor. For example, channelization could be funded as development occurs and traffic mitigation is obtained through the State Environmental Protection Act (SEPA).
5.4 Grants
City, county, transit, and others may choose to apply for grants to implement projects recommended in this corridor study. Citation of study recommendations in the grant application could strengthen the application.
Page 104 SR 19/ SR 20 Corridor Plan February 2011
5.5 Legislature/ Legislative Funding
Another means of funding and implementing corridor plan recommendations is through legislative funding. Congressional delegates could choose to line-item a project that provides safety, congestion, economic, or other benefits that meet community needs. Study findings and recommendations in support of projects help to demonstrate the need and endorse the solution. Moreover, since the plan is developed through a public process, stakeholder and community support is behind the recommendations.
5.6 Next Steps
The SR 19/SR 20 Corridor Planning Study identifies corridor needs that are based on adopted Washington State Department of Transportation (WSDOT) thresholds and proposes actions to address those needs. While this alone does not guarantee implementation funding, the plan allows future consideration for funding requests to be focused on areas of greatest need in this corridor. These identified areas will compete with other similar locations around the state for future funding based on performance outcome.
Available revenue to implement the identified improvements is very limited. Specific actions that should be taken to position the corridor plan proposed improvements for future implementation include:
Incorporate the SR 19/SR 20 Corridor Plan recommended improvements in the State‟s Highway System Plan (HSP) and the Peninsula Regional Transportation Organization‟s (PRTPO) regional transportation plan.
Incorporate the SR 19/SR 20 Corridor Plan recommended improvements, as appropriate, in county and city comprehensive plans.