Sqm corp pres q3_final
19
December 2014
-
Upload
sociedadquimicaminiera -
Category
Automotive
-
view
1.664 -
download
4
Transcript of Sqm corp pres q3_final

December 2014

Statements in this presentation concerning the Company’s business outlook or future economic performances, anticipated profitability, revenues, expenses, or other financial items, anticipated cost synergies and product or service line growth, together with other statements that are not historical facts, are “forward-looking statements” as that term is defined under Federal Securities Laws.
Any forward-looking statements are estimates, reflecting the best judgment of SQM based on currently available information and involve a number of risks, uncertainties and other factors that could cause actual results to differ materially from those stated in such statements.
Risks, uncertainties, and factors that could affect the accuracy of such forward-looking statements are identified in the public filing made with the Securities and Exchange Commission, and forward-looking statements should be considered in light of those factors.
Important Notice
2

3
Agenda
SQM AT A GLANCE

SQM at a Glance
World Leader in Specialty Businesses: Potassium Nitrate, Iodine, Lithium & Solar Salts
Global Company: Based in Santiago, Chile with sales in more than 115 countries and offices in 20 countries.
Financial Profile Revenue LTM: US$ 2.0 Billion EBITDA(1) LTM: US$ 731 Million EBITDA Margin LTM: ~ 36%
Healthy Credit Metrics Debt/Equity Ratio: 1.00 NFD/EBITDA 1.02 Current Ratio 3.79
Highly Liquid Shares Listed on the Santiago Stock Exchange, and the NYSE since
1993 (Ticker: SQM) Most liquid Chilean ADR on the NYSE in 2013
Financially Stable: Credit Ratings Standard & Poor’s: BBB Moody’s: Baa1
Experienced Management Management team has average of 24+ years with Company
Responsible Growth Within Core Business Lines
4 (1) EBITDA: gross profit – SGA + depreciation & amortization (2) LTM correspond to twelve months ended September 30, 2014

Fertilizers Specialty Chemicals
48% of world KNO3 market share(1)
Volumes(2): 841k MT
Revenues(3): 34% of total (US$688mm)
Contribution to Total Gross Profit(3): 25% (US$144mm)
Specialty Plant Nutrients
Potassium
Strategically located in South America
Volumes(2): 1,591k MT
Revenues(3): 28% of total (US$569mm)
Contribution to Total Gross Profit(3): 23% (US$138mm)
Iodine & Derivatives
Lithium & Derivatives
Industrial Chemicals
28% of world market share(1)
Volumes(2): 8.8k MT
Revenues(3): 18% of total (US$366mm)
Contribution to Total Gross Profit(3): 28% (US$165mm)
27% of world market share(1)
Volumes(2): 39k MT
Revenues(3): 10% of total (US$203mm)
Contribution to Total Gross Profit(3): 15% (US$92mm)
50% of world industrial sodium nitrate market share(1)
Volumes(2): 127k MT
Revenues(3): 5% of total (US$108mm)
Contribution to Total Gross Profit(3): 7% (US$39mm)
(1) Market share is measured by volume, and corresponds to SQM estimates from 2013. (2) SQM volumes, correspond to the twelve months ended June 30, 2014. (3) SQM revenues, and total contribution to gross profit, correspond to the twelve months ended September 30, 2014
SQM at a Glance
5

6
Agenda
INVESTMENT HIGHLIGHTS

Sodium nitrate + Potassium chloride = Potassium nitrate + Sodium chloride
Caliche ore is only found in Chile
The world’s largest deposits of nitrate and iodine
We hold proprietary mineral rights pursuant to exploitation concessions
Low processing costs due to its high concentrations of potassium and lithium
Higher evaporation rates
Production rights are pursuant to a lease agreement with CORFO until 2030
Abundant natural resources enable long term planning
High-quality reserves, which allow low-cost and highly productive operations
Operations under high environmental and social standards
Caliche Ore
Salar Brines
Highlights
1. Unique and Abundant Natural Resources
7
NaNO3 + KCl = KNO3 + NaCl (salt)

8
LatAm 25%
North Am. 27%
Europe 24%
Asia & Other regions 24%
Headquarters
SQM commercial office
Joint venture
Production facilities
Products are sold in more than 115 countries through our worldwide distribution network
Local presence in 20 countries to diversify operations, to satisfy local customers, and to access local raw materials
Products are used in diverse industries such as agriculture, human and animal nutrition, pharmaceutical, medical, construction and electronics, among others, sold to diverse customers
No customer represents more than 3% of sales
2. Sales in Diverse Industries, Sold Globally
Note: Figures represent SQM’s Revenues breakdown for the twelve months ended June 30, 2014
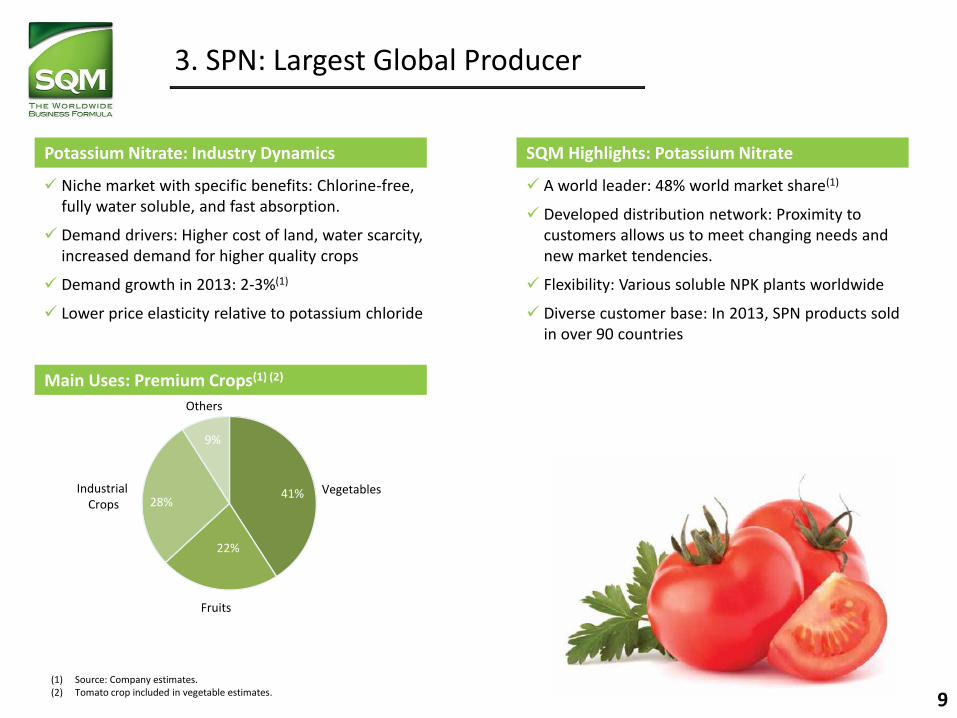
SQM Highlights: Potassium Nitrate
A world leader: 48% world market share(1)
Developed distribution network: Proximity to customers allows us to meet changing needs and new market tendencies.
Flexibility: Various soluble NPK plants worldwide
Diverse customer base: In 2013, SPN products sold in over 90 countries
Potassium Nitrate: Industry Dynamics
41%
22%
28%
9%
(1) Source: Company estimates. (2) Tomato crop included in vegetable estimates.
Vegetables
Others
Industrial Crops
Fruits
Niche market with specific benefits: Chlorine-free, fully water soluble, and fast absorption.
Demand drivers: Higher cost of land, water scarcity, increased demand for higher quality crops
Demand growth in 2013: 2-3%(1)
Lower price elasticity relative to potassium chloride
3. SPN: Largest Global Producer
Main Uses: Premium Crops(1) (2)
9

SQM Highlights Potassium Chloride: Industry Dynamics
9%
4. Potassium: Uniquely Located To Supply Major Markets
Potassium chloride (KCL) is the most commonly used potassium-based fertilizer. Sold all over the world
Growing market: ~56-58 million metric tons in 2014(1)
Strategically located in Southern Hemisphere
Some price recovery has been seen in recent months
Expansion of potassium-based products:
2014 effective capacity expected to be 2.3 million metric tons
Low-cost producer of KCL, very competitive in lower priced market
Approximately 1/3 of MOP sales to Brazil
Flexibility to produce KCL, SOP(2), KNO3 depending on market needs
Small producer, less than 3% market share
SQM Production Volumes (KCL and SOP(2))
(1) Based on SQM sales volumes as of June 30, 2014 (2) Potassium sulfate
SQM Potassium Chloride Sales(1)
10
0
400
800
1200
1600
2000
2006 2007 2008 2009 2010 2011 2012 2013 2014
Th. M
T
Year
Central & South
America 44%
North America 17%
Europe 16%
Asia & Others 23%

28%
28%
19%
17%
5%
3%
SQM Highlights
(1) Source: Company estimates
5. Iodine: Leading Player in Strong Market
Iodine is mainly used in human & animal health and nutrition. Major uses include X-ray contrast media, LCD, pharmaceuticals and sanitizers
Global demand: CAGR of over 3% for the period 2003-20131
Global demand expected 2014: ~32,000 MT(1)
Limited cost-effective substitutes available
Limited sources of iodine worldwide
Industry Dynamics
Recycling
Others Chile
Others 3%
Japan
Strong position as long-term market supplier
A world leader: 28% market share in 2013(1); current production capacity 12,500 metric tons per year
We are looking to recapture our market share to levels of around one third. Prices have been decreasing, and we expect this downward trend to continue during the fourth quarter of 2014.
Developed distribution and sales network: Can quickly meet demands of market. Largest producer, reliable supplier
Globally diversified customer base Key Players1
USA
SQM Average Prices for Iodine and Derivatives
0
10
20
30
40
50
60
2008 2009 2010 2011 2012 2013 1H2014
US$
/kg
Year
11

27%
40%
19%
11%
SQM Highlights
6. Lithium: Lowest-Cost Producer
Industry Dynamics
Global demand: CAGR of 7% for the 2003-2013 period.
Demand driver: batteries. Future potential related to e-cars using lithium-ion batteries (LIB)
Other uses for lithium include lubricant, glass, pharmaceuticals
Global lithium projects announced. Expect new supply from Argentina in 2015.
Leading chemical lithium producer in the world and the lowest cost producer globally
Produce lithium carbonate, lithium hydroxide, and lithium chloride.
Current lithium carbonate plant capacity stands at 48,000 metric tons per year
China
Rockwood
Argentina Others
Key Competitors(1)
12 (1) Source: Company estimates

SQM Highlights
7. Industrial Chemicals: Dominant Player in a Niche Market
Various traditional uses for industrial nitrates related to detergents, glass, metal treatment, water treatment, and explosives
Solar Salts:
IEA expects installed capacity of concentrated Solar Power (CSP) to double by 2020, and supply 20% of the world electricity by 2050.
50 MW → approximately 30,000 MT of solar salts
Projects being developed globally
Industry Dynamics
Operational flexibility with certain industrial sodium and potassium nitrate products
Solar Salts:
Leading Producer with almost 70% market share
Volumes reached ~65,000 MT in 2013. 2014 will result in lower volumes, but expect to supply four new projects in Africa and Latin America in 2015-2017.
SQM produces both potassium nitrate and sodium nitrate, the two raw materials in solar salt production
13
0
2
4
6
8
10
12
2013 2014 2015 2016 2017 2018 2019 2020
Capacity of Concentrated Solar Power (CSP)*
(1) Source: IEA analysts; 2013 data are IEA estaimates based on Crespo, L. (2014), Overview of current market trends for solar thermal electricity plants.
* Solana Project , Arizona

14
Agenda
OTHER INFORMATION

Potassium nitrate plant in Coya Sur (300,000 MT/year)
Increase potassium production in the Salar de Atacama to 2.3 million MT from 800,000 MT, including the construction of potassium chloride and granulated potassium chloride facilities in the Salar de Atacama
Increase capacity of iodine to 12,500 MT
Various investments related to distribution and infrastructure
Capital Expenditure Program
Capital Expenditures 2009 - 2013: US$2.0 Billion Capital Expenditure 2014 and 2015: ~US$300M
After intense investment during the past 5 years, investment is expected to decrease in 2014
Optimization of our potassium facility at the Salar de Atacama
Various projects designed to maintain production capacity, increased yields and reduce costs.
Photo: Evaporation ponds and silvinite stock pile, Salar de Atacama
Metallic Exploration
Between 2011 - 2013 SQM has invested approximately US$29 million in metallic exploration, and has identified over 50 areas of interest. Eleven agreements in place with various third parties, three of which were signed in 2014.
In 2013 SQM sold royalties it had on Antucoya mining project for US$84 million
Recently completed sale of mining rights for US$13 million (to be reflected in Q4 financial statements)
15

Restructuring
Implementation of lean operations
US$130 million in production costs savings during last 15 months
Approximately US$40 million in savings was related to the depreciation of the peso.
Cost-Savings Program
Cost-Savings Plan 2013-2015 EBITDA margins
16
0%
10%
20%
30%
40%
50%
1Q13 2Q13 3Q13 4Q13 1Q14 2Q14 3Q14
60
70
80
90
100
110
1Q13 2Q13 3Q13 4Q13 1Q14 2Q14 3Q14
Production Costs(1)
(1) Base 100 = average costs 2013 and 2014, respectively

Other Relevant Topics
Tax reform in Chile
Currency exposure Arbitration with CORFO
Market conditions / pricing in iodine
Ownership Structure(1) Considerations
Dividend Payments
Dividend policy: 50% of net income, approved by shareholders in April 2014
Payment of “eventual” dividend in July 2014,
approved by shareholders in July 2014
SQM Business Opportunities
Use of SQM´s nitrates in the solar energy power generation known as “thermal storage material”. Increased sales volumes 2016 and beyond
Recent price increases seen in potassium chloride
Increased SPN volumes
Metallic exploration
Cost reductions company-wide
17 (1) As of September 30, 2014
Pampa Group 32%
Potash Corp 32%
Bank of New York (ADRs)
23%
Others Chile 13%

Financial Performance
(1) EBITDA: Gross Profit – administrative expenses + depreciation & amortization. (2) Net Financial Debt: interest bearing debt net of cash and cash equivalents, considering the effects of derivatives
18
41% 38%
45% 46%
38% 37%
2009 2010 2011 2012 2013 LTMSep-14
1.438 1.830
2.145 2.429
2.203 2.015
0
500
1.000
1.500
2.000
2.500
3.000
2009 2010 2011 2012 2013 LTMSep-14
US$
Mill
ion
Revenues Net Income
EBITDA(1)/Revenues NFD(2)/EBITDA
340 382
546 649
467
287
0
200
400
600
800
2009 2010 2011 2012 2013 LTMSep-14
US$
Mill
ion
1,16x
0,85x 0,79x 0,83x
1,06x 1,02x
2009 2010 2011 2012 2013 LTMSep-14

Investment Highlights
Unique and abundant natural resources 1.
Sales in diverse industries, sold globally 2.
SPN: Largest global producer 3.
Industrial Chemicals: Dominant player in a niche market 7.
Potassium: Uniquely located to supply major markets 4.
Lithium: Lowest-cost producer 6.
Iodine: Leading player in strong market with diverse uses 5.
Metallic Exploration: Exploration with low risk 8.
Solid financial position and financial management 9.
19
Contact Information: Gerardo Illanes: VP of Finance and IR, [email protected] Kelly O’Brien: Head of Investor Relations, [email protected] Carolyn McKenzie: Investor Relations, [email protected]